Embed Size (px)
Citation preview
May 2014 EB 2014-04
Agriculture-Based Economic Development in New York State: The
Contribution of Agriculture to the New York Economy
Todd M. Schmit
Dyson School of Applied Economics and Management College of Agriculture and Life Sciences
Cornell University Ithaca, New York 14853-7801

It is the Policy of Cornell University actively to support equality of
educational and employment opportunity. No person shall be denied
admission to any educational program or activity or be denied employment
on the basis of any legally prohibited discrimination involving, but not limited
to, such factors as race, color, creed, religion, national or ethnic origin, sex,
age or handicap. The University is committed to the maintenance of
affirmative action programs which will assure the continuation of such
equality of opportunity.
Agriculture-Based Economic Development in New York State: The Contribution of Agriculture to the New York Economy
Todd M. Schmit
May 16, 2014
Abstract In 2011, agricultural industries, including agricultural production, support services, and manufacturing, directly contributed $37.6 billion in output, 115.0 thousand jobs, and $9.8 billion in gross domestic product to the New York State economy. When backward-linked supply chain effects (indirect effects) and spending out of labor income (induced effects) are considered, these values grow to $53.7 billion, 206.6 thousand, and $19.6 billion, respectively. This implies relatively strong multiplier or ripple effects in agriculture, whereby every additional $1 in output in agriculture generates an additional $0.43 in backward linked non-agricultural industries, every additional job in agriculture generates an additional 0.80 non-agricultural jobs, and every additional $1 in gross domestic product generates an addition $1.13 in non-agricultural contributions to gross domestic product.
This publication was supported by funds provided by the New York Farm Viability Institute, Inc. and the Cornell University Agricultural Experiment Station federal formula funds, National Institute of Food and Agriculture, U.S. Department of Agriculture. Any opinions, findings, conclusions, or recommendations expressed in this publication are the authors’ and do not necessarily reflect the views of Cornell University, the U.S. Department of Agriculture, or the New York Farm Viability Institute, Inc.
Agriculture-Based Economic Development in New York State: The Contribution of Agriculture to the New York Economy
Introduction Structural changes in New York’s farm and food industry continue as agricultural producers and agribusiness firms adapt to changing economic conditions and consumer preferences, and to technological advancements. To retain or grow their share of the consumer food dollar, agricultural producers and agribusinesses continually seek innovative methods to expand existing markets and to develop new markets for their commodities and products. These initiatives underscore the importance of expanding farm-to-food activities on the farm, as well as fostering greater interaction with the agribusiness industry. In order to define appropriate firm, industry, and public policy strategies to strengthen opportunities for economic development and improve the competitiveness of New York State's agribusiness industry, we must identify and understand the industry linkages associated with agricultural-based economic activity in the economy, and through that assess agriculture’s impact (or contribution) to the economy This report is part of a larger effort to update and document the importance of New York’s major agricultural industries to the State’s economy. The first report in this series provides updated baseline economic information on the current status and trends in the economic activity of New York State’s agricultural and food system (Schmit and Bills 2012). The second report focuses on a closer inspection of inter-industry transactions to obtain a clearer picture of the structure of the NYS economy, with particular emphasis on sectors within the agricultural and food system (Schmit and Boisvert 2014). This final report in this series provides an assessment of the overall contribution of agriculture to the New York State (NYS) economy. Such an assessment will aid in the understanding agriculture’s total contribution in terms of its direct and backward-linked industry exchanges, but also its contribution relative to other industries. Methodological Approach One approach to assessing agriculture’s impacts in the New York State (NYS) economy is through an economic contribution analysis. This type of analysis for an industry (like dairy farming) or collection of industries (like food processing) describes that portion of an economy that can be attributed to the existing industry (or industries) by using data internal to the underlying input-output (IO) model to identify all backward linkages in the study area; i.e., it identifies the total direct, indirect, and induced effects (see Box 1). In a contribution analysis, existing total output, not just final demand1, provides the initial (direct) effects of the analysis and, when compared to the entire economy, the results provide insight into the relative extent of the industry in the economy and the strength of its backward
1 The value of goods and services produced and sold to final users (institutions) during the calendar year. Final use means that the good or service will be consumed and not incorporated into another product (IMPLAN, 2014).
1
linkages. In our particular application, IO analysis is used to assess how the value of agriculturally-related production, support services, and processing (i.e., the industries we define to represent agriculture in the state) permeate throughout the state’s economy. There are several metrics in which to measure the size of an economy; here, we consider industry sales (output), labor income, total value added, and employment (see Box 2). In particular, we look at the contribution of: (i) all on-farm agricultural production, (ii) all agricultural support services (including forestry support services), (iii) all agricultural processing, and (iv) all agricultural production, support services, and processing combined. We also examine more closely several individual agricultural production and processing sectors in the state, along with some combined production and processing contributions where in-state farm production constitutes a relatively sizable portion of processing inputs. Finally, we highlight the backward-linked industries most affected by agriculture’s direct impacts; i.e., we highlight the distribution of industry indirect and induced effects.
Box 2. Metrics Considered in our Analysis Output The value of annual industry production, expressed in producer prices. For manufacturers this would
be sales plus/minus change in inventory. For service sectors production = sales. For retail and wholesale trade, output = gross margin and not gross sales.
Labor Income
All forms of employment income, including Employee Compensation (total payroll costs of the employee paid by the employer; i.e., wages and benefits) and Proprietor Income (payments received by self-employed individuals and unincorporated business owners).
Value Added The difference between an industry’s total output and the cost of its intermediate inputs. It equals gross output (sales or receipts and other operating income, plus inventory change) minus intermediate inputs (consumption of goods and services purchased from other industries or imported). Value added consists of compensation of employees, taxes on production and imports less subsidies, and gross operating surplus.
Employment A job in IMPLAN equals the annual average of monthly jobs in that industry. Thus, 1 job lasting 12 months = 2 jobs lasting 6 months each = 3 jobs lasting 4 months each. A job can be either full-time or part-time.
Source: IMPLAN (2014)
Box 1. What are direct, indirect and induced effects? Direct effects
The set of expenditures applied to the predictive model (i.e., I/O multipliers) for impact analysis. It is a series (or single) of production changes or expenditures made by producers/consumers as a result of an activity or policy. These initial changes are determined by an analyst to be a result of this activity or policy.
Indirect Effects
The impact of local industries buying goods and services from other local industries. The cycle of spending works its way backward through the supply chain until all money leaks from the local economy, either through imports or by payments to value added.
Induced Effects
The response by an economy to an initial change (direct effect) that occurs through re-spending of income received by a component of value added. IMPLAN's default multiplier recognizes that labor income (employee compensation and proprietor income components of value added) is not a leakage to the regional economy. This money is recirculated through the household spending patterns causing further local economic activity.
Source: IMPLAN (2014)
2
The analysis is conducted using 2011 IMPLAN data and software. Following IMPLAN’s recommended procedure for an economic contribution analysis, two preliminary steps are required before estimating the indirect and induced effects.2 First, commodity production for each industry of interest is modified so that each industry produces only its primary commodity; i.e., no by-products. This is necessary since trade flows within IMPLAN (which are modified next) apply to commodities, not industries.3 Second, within the trade flows data, the Regional Supply Coefficient (RSC) for each commodity contained in the contribution analysis is set to zero. The RSC indicates the proportion of local net supply of a commodity that goes to meet local demands. Editing the by-products and changing the RSC implies that all specified industry sectors will have sales only to exports (domestic or foreign), with zero intermediate output. This ensures that no one will purchase from these industries beyond the industry’s total output. It forces the model to not be able to create any additional local impact for any of the sectors included in the contribution analysis, and effectively eliminates double counting of backward linkages. Furthermore, since all intermediate sales have been changed to final sales, the direct and indirect effects reported by IMPLAN have slightly different interpretations. Specifically, the direct effects (with respect to output) represent all sales by the industries of interest (in our case, agricultural industries as defined above). Total gross output is used as the direct effect, including final demand and the indirect and induced agricultural effects associated with that final demand. The indirect effects represent all sales by the backward-linked supply chain industries. In other words, all indirect purchases in upstream sectors or, in our case, all sales in the agricultural supply chain. The induced effects (by consumers) have their common interpretation; i.e., additional industry sales due to consumption out of increased income. The contribution concept is illustrated in Figure 1. Direct Impacts of Agriculture Before discussing the results of the agriculture contribution analysis, it is useful to provide an overview of the NYS economy and to highlight agriculture’s direct and relative contributions. A snapshot of the economy for 2011 is presented in Table 1. Using the IMPLAN data bases, it is possible to examine transactions among 440 industrial sectors of an economy as defined by the North American Industry Classification System (NAICS), the standard used by Federal statistical agencies to classify business establishments for the purpose of collecting, analyzing, and publishing statistical data related to the U.S. business economy. To gain a better understanding of the structure of industries within New York’s agricultural system, we construct an I-O model
2 A full description and detailed procedure for conducting a contribution analysis in IMPLAN is available at https://implan.com/v4/index.php?option=com_multicategories&view=article&id=660:660&Itemid=14. 3 An industry may produce more than one commodity. For example, the industry “dairy cattle and milk production” produces three commodities: “dairy cattle and milk products”, “agriculture and forestry support services”, and “other amusements and recreation”; the proportional values are 0.98, 0.01, and 0.01, respectively. This likely reflects the dairy farming industry producing such things as technical farm services and agri-tourism, albeit in very small amounts.
3
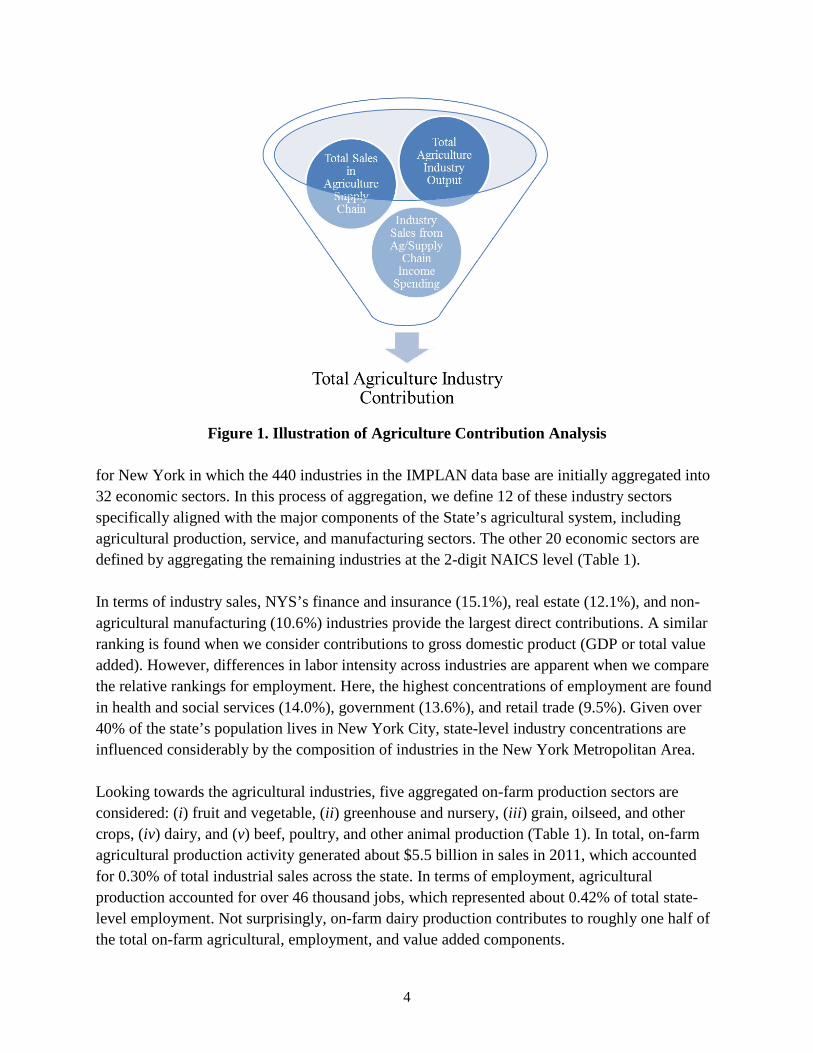
Figure 1. Illustration of Agriculture Contribution Analysis
for New York in which the 440 industries in the IMPLAN data base are initially aggregated into 32 economic sectors. In this process of aggregation, we define 12 of these industry sectors specifically aligned with the major components of the State’s agricultural system, including agricultural production, service, and manufacturing sectors. The other 20 economic sectors are defined by aggregating the remaining industries at the 2-digit NAICS level (Table 1). In terms of industry sales, NYS’s finance and insurance (15.1%), real estate (12.1%), and non-agricultural manufacturing (10.6%) industries provide the largest direct contributions. A similar ranking is found when we consider contributions to gross domestic product (GDP or total value added). However, differences in labor intensity across industries are apparent when we compare the relative rankings for employment. Here, the highest concentrations of employment are found in health and social services (14.0%), government (13.6%), and retail trade (9.5%). Given over 40% of the state’s population lives in New York City, state-level industry concentrations are influenced considerably by the composition of industries in the New York Metropolitan Area. Looking towards the agricultural industries, five aggregated on-farm production sectors are considered: (i) fruit and vegetable, (ii) greenhouse and nursery, (iii) grain, oilseed, and other crops, (iv) dairy, and (v) beef, poultry, and other animal production (Table 1). In total, on-farm agricultural production activity generated about $5.5 billion in sales in 2011, which accounted for 0.30% of total industrial sales across the state. In terms of employment, agricultural production accounted for over 46 thousand jobs, which represented about 0.42% of total state-level employment. Not surprisingly, on-farm dairy production contributes to roughly one half of the total on-farm agricultural, employment, and value added components.
4

Table 1. Direct Economic Activity, New York State, 2011.
Industry Sales Employment Labor Income Total Value Added
Industry ($ million) (%) (jobs) (%) ($ million) (%) ($ million) (%) Ag production - fruit & vegetable $ 886 0.05% 4,978 0.04% $ 589 0.08% $ 473 0.04% Ag production - greenhouse & nursery $ 399 0.02% 3,099 0.03% $ 392 0.05% $ 262 0.02% Ag production - grain, oilseed, & other crops $ 941 0.05% 12,545 0.11% $ 249 0.03% $ 297 0.03% Ag production - dairy $ 2,804 0.16% 20,874 0.19% $ 215 0.03% $ 1,018 0.09% Ag production - beef, poultry, & other animal $ 470 0.03% 4,685 0.04% $ 74 0.01% $ 113 0.01% Support activities for agriculture & forestry $ 212 0.01% 8,877 0.08% $ 188 0.02% $ 152 0.01% Forestry & commercial logging, fishing, & hunting $ 271 0.02% 4,617 0.04% $ 51 0.01% $ 75 0.01% Mining $ 3,564 0.20% 13,252 0.12% $ 447 0.06% $ 1,257 0.11% Utilities $ 36,030 2.02% 38,355 0.35% $ 5,575 0.74% $ 20,812 1.78% Construction $ 61,708 3.45% 491,718 4.44% $ 32,221 4.28% $ 36,637 3.13% Ag manufacturing - dairy $ 7,618 0.43% 8,504 0.08% $ 518 0.07% $ 998 0.09% Ag manufacturing - fruit & vegetable $ 2,972 0.17% 6,957 0.06% $ 361 0.05% $ 593 0.05% Ag manufacturing - meat & animal products $ 1,202 0.07% 3,770 0.03% $ 172 0.02% $ 146 0.01% Ag manufacturing - alcoholic beverages $ 3,861 0.22% 4,192 0.04% $ 356 0.05% $ 1,920 0.16% Ag manufacturing - other $ 14,835 0.83% 34,932 0.32% $ 1,601 0.21% $ 2,886 0.25% Ag manufacturing – fert., chemicals, machinery $ 1,411 0.08% 1,591 0.01% $ 109 0.01% $ 265 0.02% Non-food/ag manufacturing $ 189,614 10.61% 418,914 3.78% $ 33,500 4.45% $ 63,086 5.39% Wholesale trade $ 70,075 3.92% 357,825 3.23% $ 30,356 4.03% $ 52,884 4.52% Retail trade $ 81,955 4.59% 1,053,289 9.50% $ 37,988 5.04% $ 60,845 5.20% Transportation & warehousing $ 40,008 2.24% 339,654 3.06% $ 15,478 2.05% $ 21,257 1.82% Information $ 110,117 6.16% 289,663 2.61% $ 41,872 5.56% $ 64,845 5.54% Finance & insurance $ 269,925 15.11% 822,349 7.42% $ 125,291 16.63% $ 184,446 15.75% Real estate & rental $ 216,015 12.09% 531,005 4.79% $ 14,309 1.90% $ 166,229 14.19% Professional- scientific & technical services $ 161,027 9.01% 888,194 8.01% $ 92,529 12.28% $ 127,706 10.91% Management of companies $ 36,205 2.03% 144,061 1.30% $ 21,641 2.87% $ 24,953 2.13% Administrative & waste services $ 41,365 2.32% 557,177 5.03% $ 24,127 3.20% $ 28,818 2.46% Educational services $ 29,008 1.62% 401,844 3.63% $ 17,096 2.27% $ 18,822 1.61% Health & social services $ 139,415 7.80% 1,547,462 13.96% $ 82,296 10.92% $ 90,919 7.76% Arts- entertainment & recreation $ 21,873 1.22% 299,704 2.70% $ 10,512 1.40% $ 14,557 1.24% Accommodation & food services $ 50,121 2.81% 700,788 6.32% $ 20,692 2.75% $ 30,505 2.60% Other services $ 48,265 2.70% 560,921 5.06% $ 23,948 3.18% $ 30,152 2.57% Government $ 142,493 7.98% 1,508,307 13.61% $ 118,688 15.75% $ 123,136 10.51% Total $1,786,666 11,084,101 $ 753,443 $1,171,065 Source: IMPLAN (2014)
5
The agricultural and forestry support services sector is included within our broad definition of agriculture to encompass its key linkages with the farm production sectors. While the overall sales contributions are relatively small ($212 million, Table 1), the relatively labor-intensive nature of the sector implies relatively strong contributions to overall agricultural employment; i.e., nearly 9,000 jobs in 2011. Food (including beverages) and agricultural-based (including fertilizers, chemicals, and machinery) product manufacturers are represented by nearly 40 distinct sectors in IMPLAN. For ease of exposition and to highlight key agriculturally-based manufacturing contributions, we aggregated the individual sectors into six composite sectors, namely: (i) dairy, (ii) fruits and vegetables, (iii) meat and animal products, (iv) alcoholic beverages, (v) other food and beverages, and (vi) fertilizer, chemicals, and machinery manufacturing (Table 1). In total, agriculturally-based manufacturing industries in the state contributed nearly $32 billion in sales, representing about 1.8% of all sales in the state, and employment of nearly 60 thousand workers representing slightly more than 0.5% of all state-wide employment. Over $6.8 billion in value added contributed to about 0.6% of state totals. Dairy manufacturing accounts about one-quarter of all agricultural manufacturing sales and nearly 15% of all employment, and relies heavily on within-state milk production from the farming sector. Other processing sectors with relatively strong reliance on in-state farm production and with strong output contributions are from fruit and vegetable, meat processing, and alcoholic beverage sectors. In addition, nearly one-half of all sales are from ‘other’ food and beverage manufacturing sectors. This includes relatively strong contributions from bread and bakery product operations ($2.8 billion in sales), flavoring and concentrates ($1.4 billion in output), and soft drink and ice manufacturers ($1.8 billion in output), but generally rely less on raw product inputs produced in the state. The diversity of the composition of agricultural manufacturing is a reflection of both a diverse agricultural production sector and a large population base. Economic Contribution Results The economic contribution of agriculture, as we have defined it, on total industrial sales in 2011 was $53.7 billion; about 3.0% of NYS’s total sales (see Industry Output, All Agriculture, Table 2). The $37.6 billion of direct contributions (total gross output) support an additional $10.1 billion and $6.0 billion in indirect and induced industry sales, respectively, through agriculture’s inter-industry linkages. Individual agricultural component contributions (i.e., for farm production, service, and manufacturing separately) are also shown in Table 2. Note, that while the direct contributions across agriculture’s segments are additive (i.e., for the direct effects, agricultural production + agricultural support services + agricultural manufacturing = all agriculture), the same is not true for the indirect and induced impacts. For example, when
6
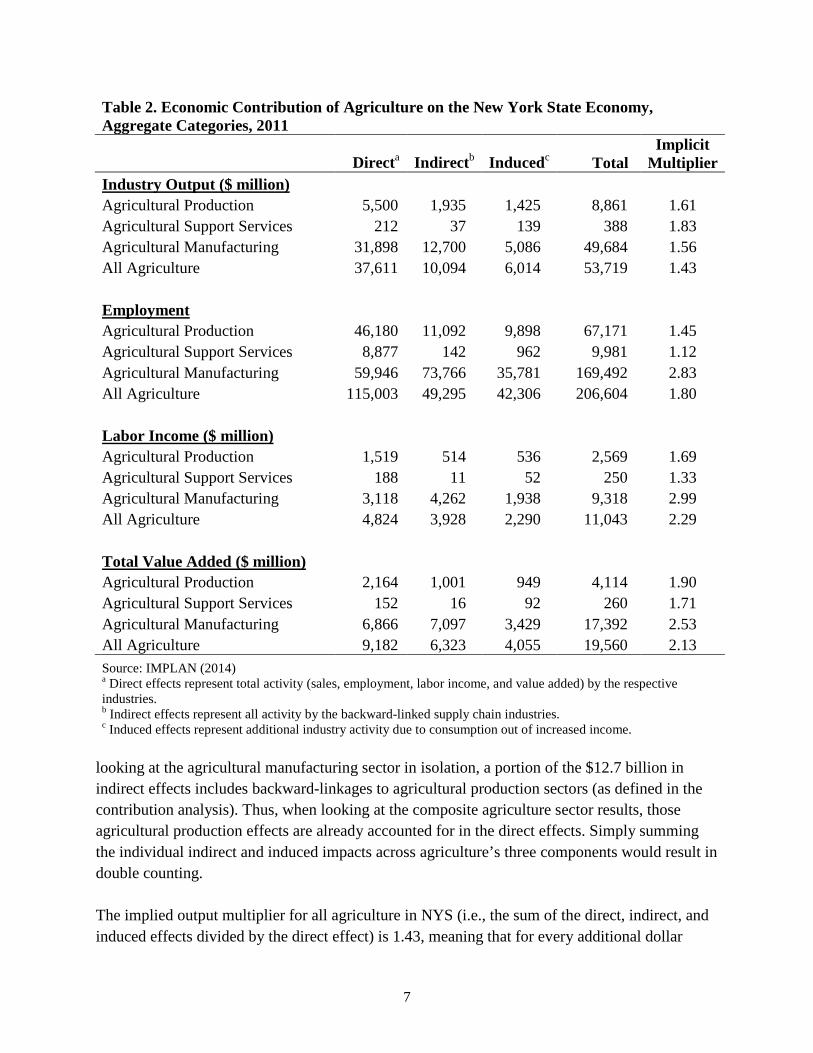
Table 2. Economic Contribution of Agriculture on the New York State Economy, Aggregate Categories, 2011
Directa Indirectb Inducedc Total Implicit
Multiplier Industry Output ($ million) Agricultural Production 5,500 1,935 1,425 8,861 1.61 Agricultural Support Services 212 37 139 388 1.83 Agricultural Manufacturing 31,898 12,700 5,086 49,684 1.56 All Agriculture 37,611 10,094 6,014 53,719 1.43 Employment Agricultural Production 46,180 11,092 9,898 67,171 1.45 Agricultural Support Services 8,877 142 962 9,981 1.12 Agricultural Manufacturing 59,946 73,766 35,781 169,492 2.83 All Agriculture 115,003 49,295 42,306 206,604 1.80 Labor Income ($ million) Agricultural Production 1,519 514 536 2,569 1.69 Agricultural Support Services 188 11 52 250 1.33 Agricultural Manufacturing 3,118 4,262 1,938 9,318 2.99 All Agriculture 4,824 3,928 2,290 11,043 2.29 Total Value Added ($ million) Agricultural Production 2,164 1,001 949 4,114 1.90 Agricultural Support Services 152 16 92 260 1.71 Agricultural Manufacturing 6,866 7,097 3,429 17,392 2.53 All Agriculture 9,182 6,323 4,055 19,560 2.13 Source: IMPLAN (2014) a Direct effects represent total activity (sales, employment, labor income, and value added) by the respective industries. b Indirect effects represent all activity by the backward-linked supply chain industries. c Induced effects represent additional industry activity due to consumption out of increased income.
looking at the agricultural manufacturing sector in isolation, a portion of the $12.7 billion in indirect effects includes backward-linkages to agricultural production sectors (as defined in the contribution analysis). Thus, when looking at the composite agriculture sector results, those agricultural production effects are already accounted for in the direct effects. Simply summing the individual indirect and induced impacts across agriculture’s three components would result in double counting. The implied output multiplier for all agriculture in NYS (i.e., the sum of the direct, indirect, and induced effects divided by the direct effect) is 1.43, meaning that for every additional dollar
7

generated in agriculture, $0.43 is generated in backward linked (nonagricultural) industries (Table 2). If we decompose the multiplier effect into its indirect and induced components, the indirect effect is 0.27 (from business-to-business activity) and the induced effect is 0.16 (from labor income spending). Individual component contributions and output multipliers are also shown in the top section of Table 2. Total employment contributions in 2011 by New York agriculture was 206,604 jobs, 115,003 through its direct employment, and an additional 91,601 through its indirect and induced industry effects (Table 2). This represents approximately 1.9% of total NYS employment. As with industry output, the majority of the jobs are generated by agricultural manufacturing activity. Indeed, the agricultural manufacturing employment multiplier (2.83) is well above either the agricultural production (1.45) or support services (1.12) sectors and, in part, reflects strong linkages to agricultural production. In total, an additional job generated in agriculture supports another 0.80 jobs in backward-linked non-agricultural industry sectors. Now consider labor income, which includes employee compensation (wages and benefits) and proprietor (self-employment) income. All of agriculture supports $11.0 billion in labor income, which is 1.5% of all labor income generated in NYS. The overall labor income multiplier is 2.29, which indicates that for every additional dollar of labor income generated in agriculture, $1.29 is generated elsewhere in the NYS economy. As with output and employment, the bulk of the impact comes from agricultural manufacturing. Finally, consider total value added. Here, agriculture contributes $19.6 billion to the state’s total GDP (1.7% of the total), through direct contributions of $9.2 billion, and indirect and induced contributions of $6.3 billion and $4.1 billion, respectively. Economic contribution analyses were also conducted for each of the five defined on-farm agricultural production sectors (Table 3) and a subset of agricultural manufacturing sectors (Table 4). The results allow a more detailed comparison of the relative size of contributions across industries, and their related indirect and induced contributions. In addition, the relative contributions within industries can provide insight into the input-based nature of their production processes. For ease of exposition, we leave a detailed examination of each of the sector’s results to the interested reader. However, note that for the on-farm production sectors (Table 3), the induced effects for the fruit and vegetable and greenhouse and nursery sectors are consistently larger than the indirect effects highlighting more intensive labor inputs required per unit of output (i.e., higher payments to labor) for these sectors. In contrast, the indirect effects are relatively larger for the grain, oilseed, and other crop, dairy, and beef, poultry, and other animal sectors, reflecting relatively stronger business-to-business transactions. In addition, the indirect contributions are consistently larger than the induced contributions for each of the agricultural manufacturing sectors examined (Table 4) due, in part, to their relatively strong inter-industry linkages to their respective on-farm production sectors in NYS.
8
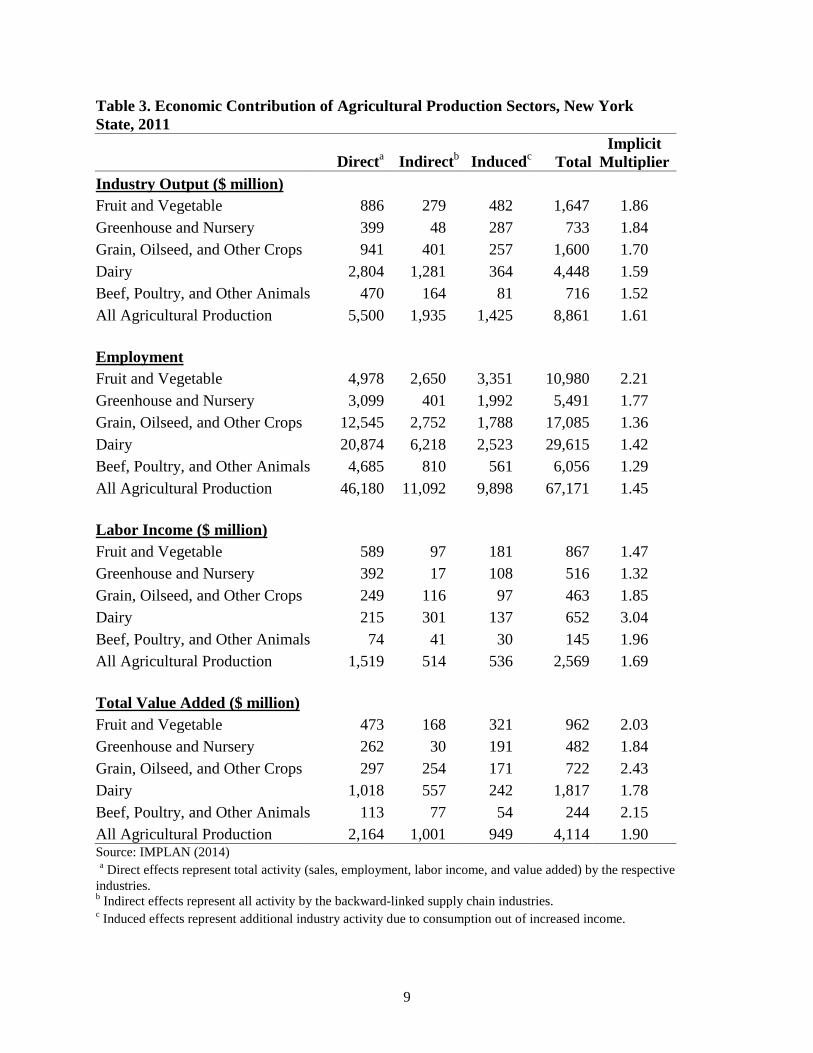
Table 3. Economic Contribution of Agricultural Production Sectors, New York State, 2011
Directa Indirectb Inducedc Total Implicit
Multiplier Industry Output ($ million) Fruit and Vegetable 886 279 482 1,647 1.86 Greenhouse and Nursery 399 48 287 733 1.84 Grain, Oilseed, and Other Crops 941 401 257 1,600 1.70 Dairy 2,804 1,281 364 4,448 1.59 Beef, Poultry, and Other Animals 470 164 81 716 1.52 All Agricultural Production 5,500 1,935 1,425 8,861 1.61 Employment Fruit and Vegetable 4,978 2,650 3,351 10,980 2.21 Greenhouse and Nursery 3,099 401 1,992 5,491 1.77 Grain, Oilseed, and Other Crops 12,545 2,752 1,788 17,085 1.36 Dairy 20,874 6,218 2,523 29,615 1.42 Beef, Poultry, and Other Animals 4,685 810 561 6,056 1.29 All Agricultural Production 46,180 11,092 9,898 67,171 1.45 Labor Income ($ million) Fruit and Vegetable 589 97 181 867 1.47 Greenhouse and Nursery 392 17 108 516 1.32 Grain, Oilseed, and Other Crops 249 116 97 463 1.85 Dairy 215 301 137 652 3.04 Beef, Poultry, and Other Animals 74 41 30 145 1.96 All Agricultural Production 1,519 514 536 2,569 1.69 Total Value Added ($ million) Fruit and Vegetable 473 168 321 962 2.03 Greenhouse and Nursery 262 30 191 482 1.84 Grain, Oilseed, and Other Crops 297 254 171 722 2.43 Dairy 1,018 557 242 1,817 1.78 Beef, Poultry, and Other Animals 113 77 54 244 2.15 All Agricultural Production 2,164 1,001 949 4,114 1.90 Source: IMPLAN (2014) a Direct effects represent total activity (sales, employment, labor income, and value added) by the respective industries. b Indirect effects represent all activity by the backward-linked supply chain industries. c Induced effects represent additional industry activity due to consumption out of increased income.
9

Table 4. Economic Contribution of Selected Agricultural Manufacturing Sectors, New York State, 2011
Directa Indirectb Inducedc Total Implicit
Multiplier Industry Output ($ million) Fruit and Vegetable Manufacturing 2,972 1,246 578 4,795 1.61 Dairy Manufacturing 7,618 5,175 1,162 13,954 1.83 Meat/Animal Manufacturing 1,202 504 220 1,926 1.60 Breweries, Wineries, and Distilleries 3,861 1,011 518 5,390 1.40 All Agricultural Manufacturing 31,898 12,700 5,086 49,684 1.56 Employment Fruit and Vegetable Manufacturing 6,957 5,781 4,013 16,751 2.41 Dairy Manufacturing 8,504 31,022 8,091 47,618 5.60 Meat/Animal Manufacturing 3,770 3,385 1,527 8,682 2.30 Breweries, Wineries, and Distilleries 4,192 4,575 3,604 12,371 2.95 All Agricultural Manufacturing 59,946 76,766 35,781 169,492 2.83 Labor Income ($ million) Fruit and Vegetable Manufacturing 361 464 217 1,042 2.89 Dairy Manufacturing 518 1,148 439 2,104 4.06 Meat/Animal Manufacturing 172 142 83 398 2.31 Breweries, Wineries, and Distilleries 356 371 195 922 2.59 All Agricultural Manufacturing 3,118 4,262 1,938 9,318 2.99 Total Value Added ($ million) Fruit and Vegetable Manufacturing 593 694 385 1,672 2.82 Dairy Manufacturing 998 2,425 776 4,199 4.21 Meat/Animal Manufacturing 146 229 147 522 3.57 Breweries, Wineries, and Distilleries 1,920 552 345 2,817 1.47 All Agricultural Manufacturing 6,866 7,097 3,429 17,392 2.53 Source: IMPLAN (2014) a Direct effects represent total activity (sales, employment, labor income, and value added) by the respective industries. b Indirect effects represent all activity by the backward-linked supply chain industries. c Induced effects represent additional industry activity due to consumption out of increased income.
10
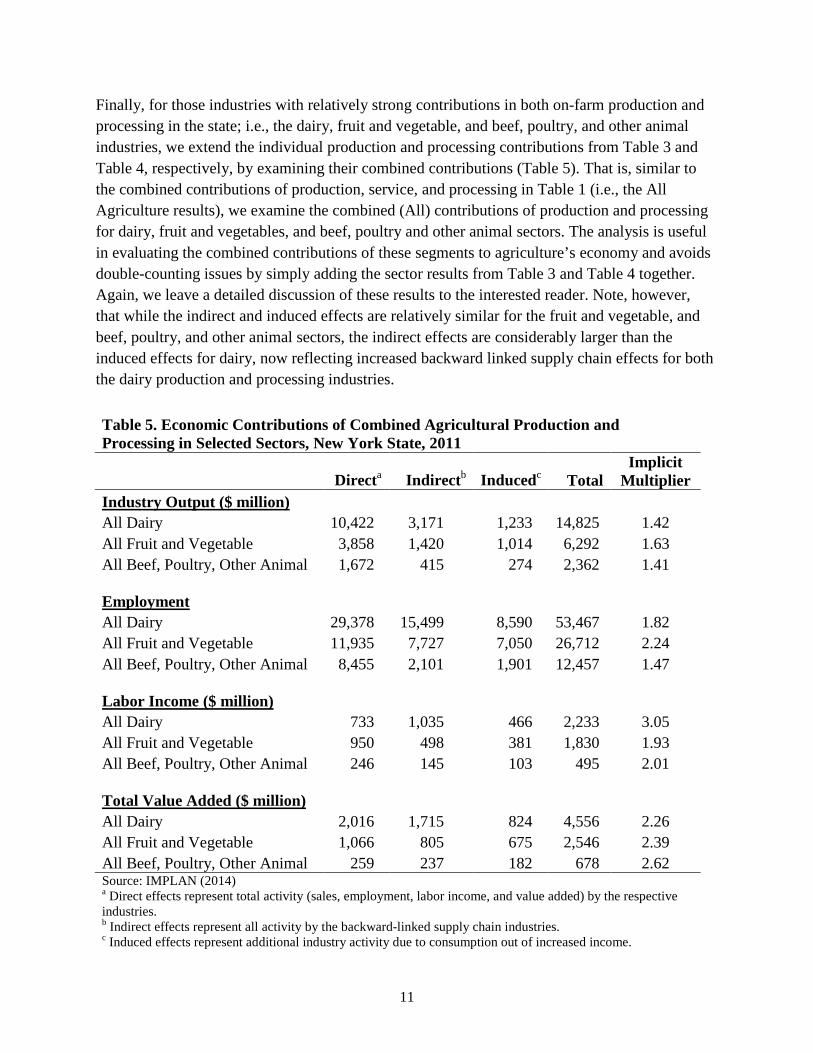
Finally, for those industries with relatively strong contributions in both on-farm production and processing in the state; i.e., the dairy, fruit and vegetable, and beef, poultry, and other animal industries, we extend the individual production and processing contributions from Table 3 and Table 4, respectively, by examining their combined contributions (Table 5). That is, similar to the combined contributions of production, service, and processing in Table 1 (i.e., the All Agriculture results), we examine the combined (All) contributions of production and processing for dairy, fruit and vegetables, and beef, poultry and other animal sectors. The analysis is useful in evaluating the combined contributions of these segments to agriculture’s economy and avoids double-counting issues by simply adding the sector results from Table 3 and Table 4 together. Again, we leave a detailed discussion of these results to the interested reader. Note, however, that while the indirect and induced effects are relatively similar for the fruit and vegetable, and beef, poultry, and other animal sectors, the indirect effects are considerably larger than the induced effects for dairy, now reflecting increased backward linked supply chain effects for both the dairy production and processing industries. Table 5. Economic Contributions of Combined Agricultural Production and Processing in Selected Sectors, New York State, 2011
Directa Indirectb Inducedc Total Implicit
Multiplier Industry Output ($ million) All Dairy 10,422 3,171 1,233 14,825 1.42 All Fruit and Vegetable 3,858 1,420 1,014 6,292 1.63 All Beef, Poultry, Other Animal 1,672 415 274 2,362 1.41 Employment All Dairy 29,378 15,499 8,590 53,467 1.82 All Fruit and Vegetable 11,935 7,727 7,050 26,712 2.24 All Beef, Poultry, Other Animal 8,455 2,101 1,901 12,457 1.47 Labor Income ($ million) All Dairy 733 1,035 466 2,233 3.05 All Fruit and Vegetable 950 498 381 1,830 1.93 All Beef, Poultry, Other Animal 246 145 103 495 2.01 Total Value Added ($ million) All Dairy 2,016 1,715 824 4,556 2.26 All Fruit and Vegetable 1,066 805 675 2,546 2.39 All Beef, Poultry, Other Animal 259 237 182 678 2.62 Source: IMPLAN (2014) a Direct effects represent total activity (sales, employment, labor income, and value added) by the respective industries. b Indirect effects represent all activity by the backward-linked supply chain industries. c Induced effects represent additional industry activity due to consumption out of increased income.
11
Distributional Implications of Inter-Industry Linkages Table 2 provides the total contributions from indirect and induced effects as a result of agriculture’s direct contributions. While these results are useful in assessing total contributions to the NYS economy, it is additionally useful to examine what industry sectors contribute to the total indirect and induced effects. In other words, we examine the relative sizes of the backward linkages across sectors. Agricultural Production Linkages Table 6 ranks the industry linkages, in terms of combined indirect and induced output effects from on-farm agricultural production activity in NYS (i.e., the direct effect), following the sector aggregation scheme illustrated in Table 1. The sizes of the individual indirect and induced effects are also shown. While all sector effects are shown, note that the top 10 industries represent over 82% of all indirect sector contributions and over 71% of all induced sector contributions. Major household consumption expenditure categories are clearly articulated in the top induced effects; i.e., housing, finance and insurance, health care, and retail trade (including food purchases). The primary indirect effects highlight important supply chain industries for agriculture in NYS; i.e., real estate, ag (feed and chemical) manufacturing, finance, wholesale trade, utilities, and agricultural support activities. Given the large land base necessary to support agricultural production, along with home purchase and rental contributions from consumers, it is not surprising to see strong backward linkages to real estate and rental establishments, representing nearly 16% of all indirect and induced effects, and relatively evenly split between the indirect and induced components. The total indirect and induced effect is over $535 million. Other agricultural manufacturing sectors show relatively strong backward linkages, almost exclusively through indirect (business-to-business) exchanges. In fact, nearly one-quarter of all indirect effects are from this aggregate sector. These strong linkages largely represent purchases by agricultural production sectors to backward-linked industries involved in the production of animal feed products. This makes sense given the large animal production industries in New York, primarily dairy farming, that purchase feed products made from grain, oilseed, and meat byproducts. Backward-linked transactions with the financial and insurance sector establishments rank third, with relatively strong contributions from both indirect and induced transactions. Individual sectors here include monetary authorities, depository credit intermediation firms, and insurance carriers. Rounding out the top five backward linked industries include wholesale trade and utilities with 6.1% and 4.8% of total contributions, respectively, mostly from indirects. Finally, professional services (evenly split between indirect and induced effects), retail trade (mostly induced), agricultural chemical and machinery manufacturing (nearly all indirect), and support activities for agriculture (all indirect) finish off the top 10.
12
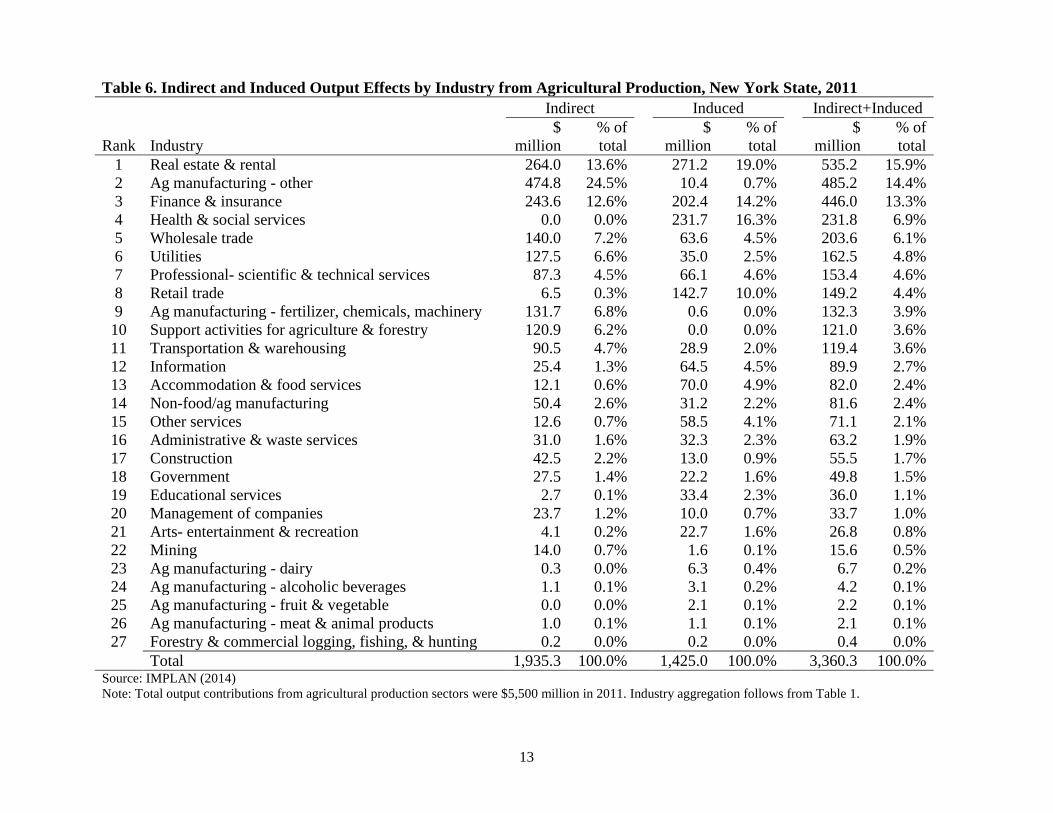
Table 6. Indirect and Induced Output Effects by Industry from Agricultural Production, New York State, 2011
Indirect
Induced
Indirect+Induced
Rank Industry $
million % of total
$ million
% of total
$ million
% of total
1 Real estate & rental 264.0 13.6%
271.2 19.0%
535.2 15.9% 2 Ag manufacturing - other 474.8 24.5%
10.4 0.7%
485.2 14.4%
3 Finance & insurance 243.6 12.6%
202.4 14.2%
446.0 13.3% 4 Health & social services 0.0 0.0%
231.7 16.3%
231.8 6.9%
5 Wholesale trade 140.0 7.2%
63.6 4.5%
203.6 6.1% 6 Utilities 127.5 6.6%
35.0 2.5%
162.5 4.8%
7 Professional- scientific & technical services 87.3 4.5%
66.1 4.6%
153.4 4.6% 8 Retail trade 6.5 0.3%
142.7 10.0%
149.2 4.4%
9 Ag manufacturing - fertilizer, chemicals, machinery 131.7 6.8%
0.6 0.0%
132.3 3.9% 10 Support activities for agriculture & forestry 120.9 6.2%
0.0 0.0%
121.0 3.6%
11 Transportation & warehousing 90.5 4.7%
28.9 2.0%
119.4 3.6% 12 Information 25.4 1.3%
64.5 4.5%
89.9 2.7%
13 Accommodation & food services 12.1 0.6%
70.0 4.9%
82.0 2.4% 14 Non-food/ag manufacturing 50.4 2.6%
31.2 2.2%
81.6 2.4%
15 Other services 12.6 0.7%
58.5 4.1%
71.1 2.1% 16 Administrative & waste services 31.0 1.6%
32.3 2.3%
63.2 1.9%
17 Construction 42.5 2.2%
13.0 0.9%
55.5 1.7% 18 Government 27.5 1.4%
22.2 1.6%
49.8 1.5%
19 Educational services 2.7 0.1%
33.4 2.3%
36.0 1.1% 20 Management of companies 23.7 1.2%
10.0 0.7%
33.7 1.0%
21 Arts- entertainment & recreation 4.1 0.2%
22.7 1.6%
26.8 0.8% 22 Mining 14.0 0.7%
1.6 0.1%
15.6 0.5%
23 Ag manufacturing - dairy 0.3 0.0%
6.3 0.4%
6.7 0.2% 24 Ag manufacturing - alcoholic beverages 1.1 0.1%
3.1 0.2%
4.2 0.1%
25 Ag manufacturing - fruit & vegetable 0.0 0.0%
2.1 0.1%
2.2 0.1% 26 Ag manufacturing - meat & animal products 1.0 0.1%
1.1 0.1%
2.1 0.1%
27 Forestry & commercial logging, fishing, & hunting 0.2 0.0% 0.2 0.0% 0.4 0.0% Total 1,935.3 100.0% 1,425.0 100.0% 3,360.3 100.0% Source: IMPLAN (2014) Note: Total output contributions from agricultural production sectors were $5,500 million in 2011. Industry aggregation follows from Table 1.
13
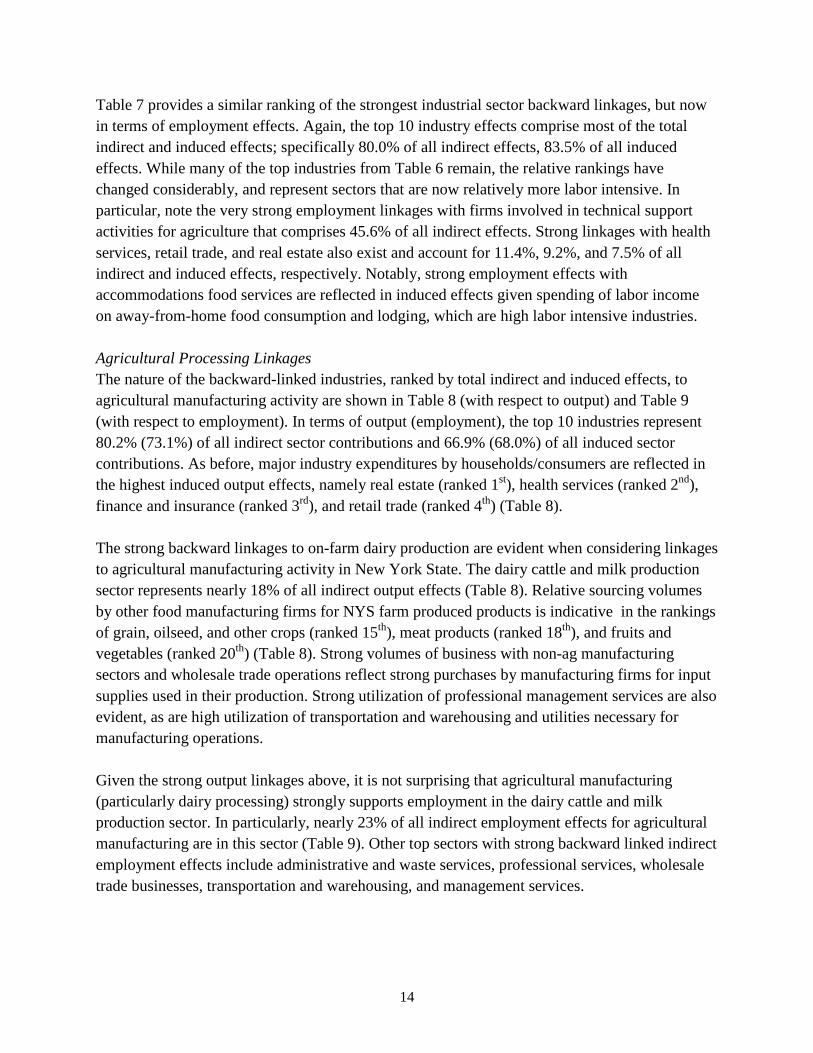
Table 7 provides a similar ranking of the strongest industrial sector backward linkages, but now in terms of employment effects. Again, the top 10 industry effects comprise most of the total indirect and induced effects; specifically 80.0% of all indirect effects, 83.5% of all induced effects. While many of the top industries from Table 6 remain, the relative rankings have changed considerably, and represent sectors that are now relatively more labor intensive. In particular, note the very strong employment linkages with firms involved in technical support activities for agriculture that comprises 45.6% of all indirect effects. Strong linkages with health services, retail trade, and real estate also exist and account for 11.4%, 9.2%, and 7.5% of all indirect and induced effects, respectively. Notably, strong employment effects with accommodations food services are reflected in induced effects given spending of labor income on away-from-home food consumption and lodging, which are high labor intensive industries. Agricultural Processing Linkages The nature of the backward-linked industries, ranked by total indirect and induced effects, to agricultural manufacturing activity are shown in Table 8 (with respect to output) and Table 9 (with respect to employment). In terms of output (employment), the top 10 industries represent 80.2% (73.1%) of all indirect sector contributions and 66.9% (68.0%) of all induced sector contributions. As before, major industry expenditures by households/consumers are reflected in the highest induced output effects, namely real estate (ranked 1st), health services (ranked 2nd), finance and insurance (ranked 3rd), and retail trade (ranked 4th) (Table 8). The strong backward linkages to on-farm dairy production are evident when considering linkages to agricultural manufacturing activity in New York State. The dairy cattle and milk production sector represents nearly 18% of all indirect output effects (Table 8). Relative sourcing volumes by other food manufacturing firms for NYS farm produced products is indicative in the rankings of grain, oilseed, and other crops (ranked 15th), meat products (ranked 18th), and fruits and vegetables (ranked 20th) (Table 8). Strong volumes of business with non-ag manufacturing sectors and wholesale trade operations reflect strong purchases by manufacturing firms for input supplies used in their production. Strong utilization of professional management services are also evident, as are high utilization of transportation and warehousing and utilities necessary for manufacturing operations. Given the strong output linkages above, it is not surprising that agricultural manufacturing (particularly dairy processing) strongly supports employment in the dairy cattle and milk production sector. In particularly, nearly 23% of all indirect employment effects for agricultural manufacturing are in this sector (Table 9). Other top sectors with strong backward linked indirect employment effects include administrative and waste services, professional services, wholesale trade businesses, transportation and warehousing, and management services.
14
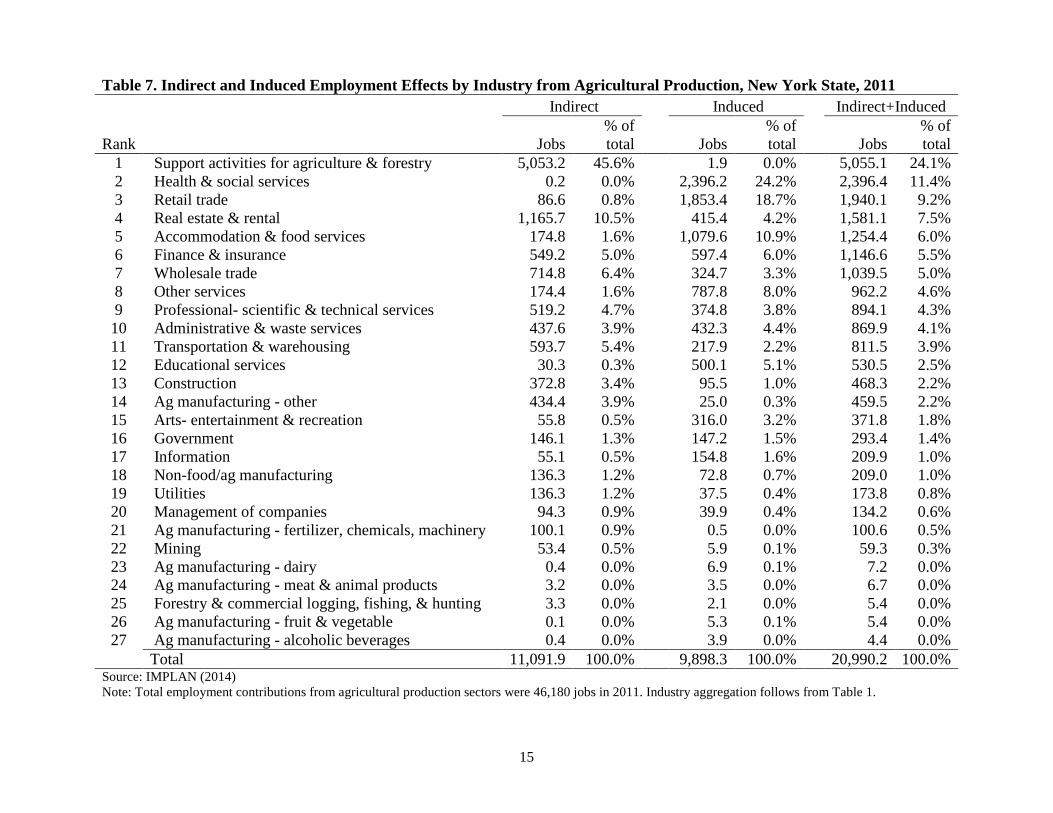
Table 7. Indirect and Induced Employment Effects by Industry from Agricultural Production, New York State, 2011
Indirect
Induced
Indirect+Induced
Rank Jobs % of total Jobs
% of total Jobs
% of total
1 Support activities for agriculture & forestry 5,053.2 45.6%
1.9 0.0%
5,055.1 24.1% 2 Health & social services 0.2 0.0%
2,396.2 24.2%
2,396.4 11.4%
3 Retail trade 86.6 0.8%
1,853.4 18.7%
1,940.1 9.2% 4 Real estate & rental 1,165.7 10.5%
415.4 4.2%
1,581.1 7.5%
5 Accommodation & food services 174.8 1.6%
1,079.6 10.9%
1,254.4 6.0% 6 Finance & insurance 549.2 5.0%
597.4 6.0%
1,146.6 5.5%
7 Wholesale trade 714.8 6.4%
324.7 3.3%
1,039.5 5.0% 8 Other services 174.4 1.6%
787.8 8.0%
962.2 4.6%
9 Professional- scientific & technical services 519.2 4.7%
374.8 3.8%
894.1 4.3% 10 Administrative & waste services 437.6 3.9%
432.3 4.4%
869.9 4.1%
11 Transportation & warehousing 593.7 5.4%
217.9 2.2%
811.5 3.9% 12 Educational services 30.3 0.3%
500.1 5.1%
530.5 2.5%
13 Construction 372.8 3.4%
95.5 1.0%
468.3 2.2% 14 Ag manufacturing - other 434.4 3.9%
25.0 0.3%
459.5 2.2%
15 Arts- entertainment & recreation 55.8 0.5%
316.0 3.2%
371.8 1.8% 16 Government 146.1 1.3%
147.2 1.5%
293.4 1.4%
17 Information 55.1 0.5%
154.8 1.6%
209.9 1.0% 18 Non-food/ag manufacturing 136.3 1.2%
72.8 0.7%
209.0 1.0%
19 Utilities 136.3 1.2%
37.5 0.4%
173.8 0.8% 20 Management of companies 94.3 0.9%
39.9 0.4%
134.2 0.6%
21 Ag manufacturing - fertilizer, chemicals, machinery 100.1 0.9%
0.5 0.0%
100.6 0.5% 22 Mining 53.4 0.5%
5.9 0.1%
59.3 0.3%
23 Ag manufacturing - dairy 0.4 0.0%
6.9 0.1%
7.2 0.0% 24 Ag manufacturing - meat & animal products 3.2 0.0%
3.5 0.0%
6.7 0.0%
25 Forestry & commercial logging, fishing, & hunting 3.3 0.0%
2.1 0.0%
5.4 0.0% 26 Ag manufacturing - fruit & vegetable 0.1 0.0%
5.3 0.1%
5.4 0.0%
27 Ag manufacturing - alcoholic beverages 0.4 0.0% 3.9 0.0% 4.4 0.0% Total 11,091.9 100.0% 9,898.3 100.0% 20,990.2 100.0%
Source: IMPLAN (2014) Note: Total employment contributions from agricultural production sectors were 46,180 jobs in 2011. Industry aggregation follows from Table 1.
15
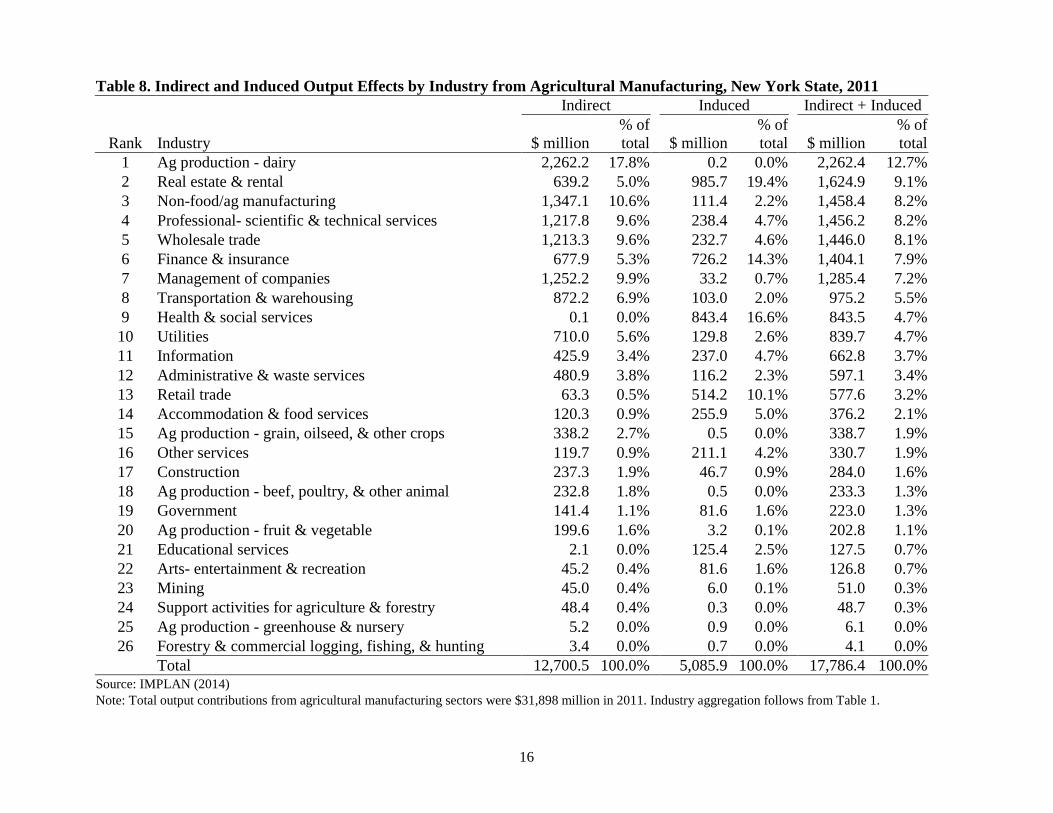
Table 8. Indirect and Induced Output Effects by Industry from Agricultural Manufacturing, New York State, 2011
Indirect
Induced
Indirect + Induced
Rank Industry $ million % of total $ million
% of total $ million
% of total
1 Ag production - dairy 2,262.2 17.8%
0.2 0.0%
2,262.4 12.7% 2 Real estate & rental 639.2 5.0%
985.7 19.4%
1,624.9 9.1%
3 Non-food/ag manufacturing 1,347.1 10.6%
111.4 2.2%
1,458.4 8.2% 4 Professional- scientific & technical services 1,217.8 9.6%
238.4 4.7%
1,456.2 8.2%
5 Wholesale trade 1,213.3 9.6%
232.7 4.6%
1,446.0 8.1% 6 Finance & insurance 677.9 5.3%
726.2 14.3%
1,404.1 7.9%
7 Management of companies 1,252.2 9.9%
33.2 0.7%
1,285.4 7.2% 8 Transportation & warehousing 872.2 6.9%
103.0 2.0%
975.2 5.5%
9 Health & social services 0.1 0.0%
843.4 16.6%
843.5 4.7% 10 Utilities 710.0 5.6%
129.8 2.6%
839.7 4.7%
11 Information 425.9 3.4%
237.0 4.7%
662.8 3.7% 12 Administrative & waste services 480.9 3.8%
116.2 2.3%
597.1 3.4%
13 Retail trade 63.3 0.5%
514.2 10.1%
577.6 3.2% 14 Accommodation & food services 120.3 0.9%
255.9 5.0%
376.2 2.1%
15 Ag production - grain, oilseed, & other crops 338.2 2.7%
0.5 0.0%
338.7 1.9% 16 Other services 119.7 0.9%
211.1 4.2%
330.7 1.9%
17 Construction 237.3 1.9%
46.7 0.9%
284.0 1.6% 18 Ag production - beef, poultry, & other animal 232.8 1.8%
0.5 0.0%
233.3 1.3%
19 Government 141.4 1.1%
81.6 1.6%
223.0 1.3% 20 Ag production - fruit & vegetable 199.6 1.6%
3.2 0.1%
202.8 1.1%
21 Educational services 2.1 0.0%
125.4 2.5%
127.5 0.7% 22 Arts- entertainment & recreation 45.2 0.4%
81.6 1.6%
126.8 0.7%
23 Mining 45.0 0.4%
6.0 0.1%
51.0 0.3% 24 Support activities for agriculture & forestry 48.4 0.4%
0.3 0.0%
48.7 0.3%
25 Ag production - greenhouse & nursery 5.2 0.0%
0.9 0.0%
6.1 0.0% 26 Forestry & commercial logging, fishing, & hunting 3.4 0.0% 0.7 0.0% 4.1 0.0% Total 12,700.5 100.0% 5,085.9 100.0% 17,786.4 100.0%
Source: IMPLAN (2014) Note: Total output contributions from agricultural manufacturing sectors were $31,898 million in 2011. Industry aggregation follows from Table 1.
16
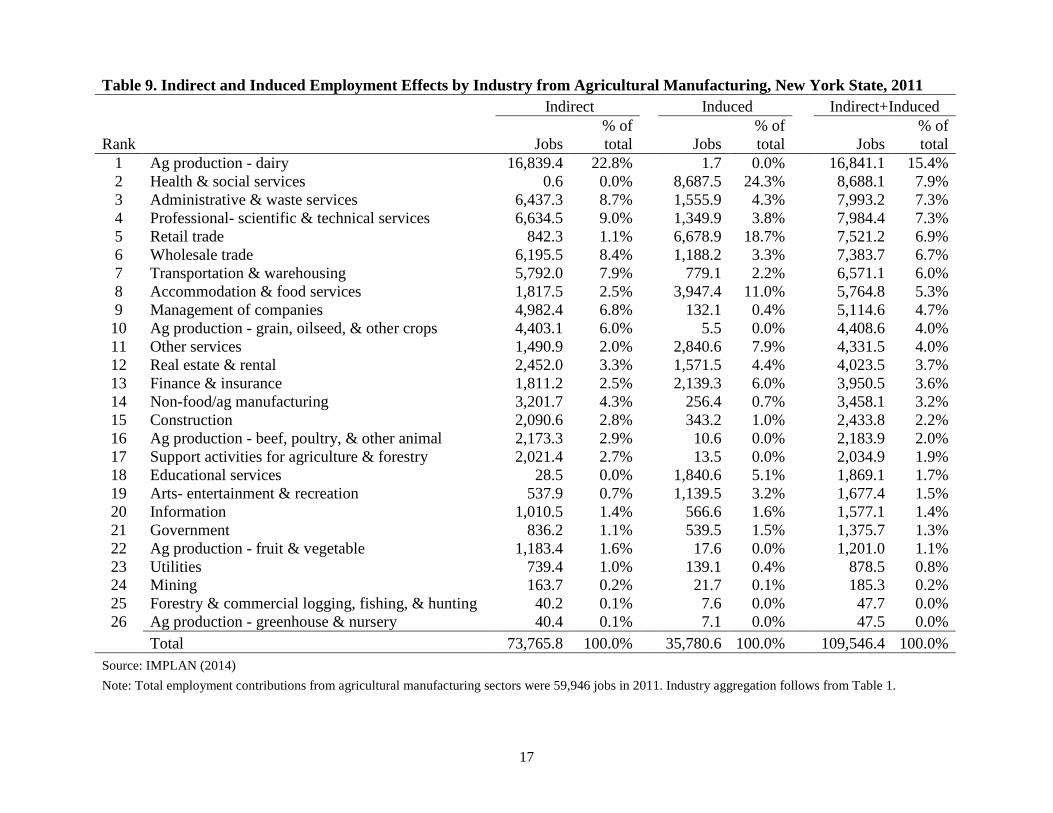
Table 9. Indirect and Induced Employment Effects by Industry from Agricultural Manufacturing, New York State, 2011
Indirect
Induced
Indirect+Induced
Rank Jobs % of total Jobs
% of total Jobs
% of total
1 Ag production - dairy 16,839.4 22.8%
1.7 0.0%
16,841.1 15.4% 2 Health & social services 0.6 0.0%
8,687.5 24.3%
8,688.1 7.9%
3 Administrative & waste services 6,437.3 8.7%
1,555.9 4.3%
7,993.2 7.3% 4 Professional- scientific & technical services 6,634.5 9.0%
1,349.9 3.8%
7,984.4 7.3%
5 Retail trade 842.3 1.1%
6,678.9 18.7%
7,521.2 6.9% 6 Wholesale trade 6,195.5 8.4%
1,188.2 3.3%
7,383.7 6.7%
7 Transportation & warehousing 5,792.0 7.9%
779.1 2.2%
6,571.1 6.0% 8 Accommodation & food services 1,817.5 2.5%
3,947.4 11.0%
5,764.8 5.3%
9 Management of companies 4,982.4 6.8%
132.1 0.4%
5,114.6 4.7% 10 Ag production - grain, oilseed, & other crops 4,403.1 6.0%
5.5 0.0%
4,408.6 4.0%
11 Other services 1,490.9 2.0%
2,840.6 7.9%
4,331.5 4.0% 12 Real estate & rental 2,452.0 3.3%
1,571.5 4.4%
4,023.5 3.7%
13 Finance & insurance 1,811.2 2.5%
2,139.3 6.0%
3,950.5 3.6% 14 Non-food/ag manufacturing 3,201.7 4.3%
256.4 0.7%
3,458.1 3.2%
15 Construction 2,090.6 2.8%
343.2 1.0%
2,433.8 2.2% 16 Ag production - beef, poultry, & other animal 2,173.3 2.9%
10.6 0.0%
2,183.9 2.0%
17 Support activities for agriculture & forestry 2,021.4 2.7%
13.5 0.0%
2,034.9 1.9% 18 Educational services 28.5 0.0%
1,840.6 5.1%
1,869.1 1.7%
19 Arts- entertainment & recreation 537.9 0.7%
1,139.5 3.2%
1,677.4 1.5% 20 Information 1,010.5 1.4%
566.6 1.6%
1,577.1 1.4%
21 Government 836.2 1.1%
539.5 1.5%
1,375.7 1.3% 22 Ag production - fruit & vegetable 1,183.4 1.6%
17.6 0.0%
1,201.0 1.1%
23 Utilities 739.4 1.0%
139.1 0.4%
878.5 0.8% 24 Mining 163.7 0.2%
21.7 0.1%
185.3 0.2%
25 Forestry & commercial logging, fishing, & hunting 40.2 0.1%
7.6 0.0%
47.7 0.0% 26 Ag production - greenhouse & nursery 40.4 0.1%
7.1 0.0%
47.5 0.0%
Total 73,765.8 100.0% 35,780.6 100.0% 109,546.4 100.0% Source: IMPLAN (2014) Note: Total employment contributions from agricultural manufacturing sectors were 59,946 jobs in 2011. Industry aggregation follows from Table 1.
17
Summary Economic contribution analyses identify the portion of a region’s economy that can be attributed to an existing industry or combination of industries through its direct, indirect and induced effects. Agriculture, incorporating agricultural production, support services, and manufacturing, represents a $53.7 billion industry in NYS, with over 200,000 jobs when the value of inter-industry linkages is considered. While total agriculturally-related industry activity represents a relatively small proportion of total state output (3.0%), employment (1.9%), and contributions to GDP (1.7%), relative contributions for smaller area rural economies will vary. The general points of this exercise were to better understand agricultures’ total contribution to the NYS economy and to demonstrate the strong ripple (multiplier) effects agriculture has given its strong backward-linked supply chain effects and related industry spending out of labor income generated in agriculture. In addition, a closer examination of the distribution of the indirect and induced effects promotes a better understanding with what sectors these ripple effects arise from. References IMPLAN Group LLC. 2014. 2011 New York State IMPLAN data and IMPLAN modeling software. More information available at: http://implan.com.
18