Embed Size (px)
Citation preview
1 SUPPLEMENTARY INFORMATION
Secretome identification of immune cell factors mediating metastatic cell homing
Brian A. Aguado, Jia J. Wu, Dhaval Nanavati, Samira M. Azarin, Shreyas S. Rao, Grace G. Bushnell, Chaitanya B. Medicherla, and Lonnie D. Shea
Inventory of Supplementary Information Supplementary Figure 1 Supplementary Table 1 Supplementary Figure 2 Supplementary Figure 3 Supplementary Table 2 Supplementary Table 3 Supplementary Figure 4 Supplementary Figure 5 Supplementary Figure 6 Supplementary Figure 7
2
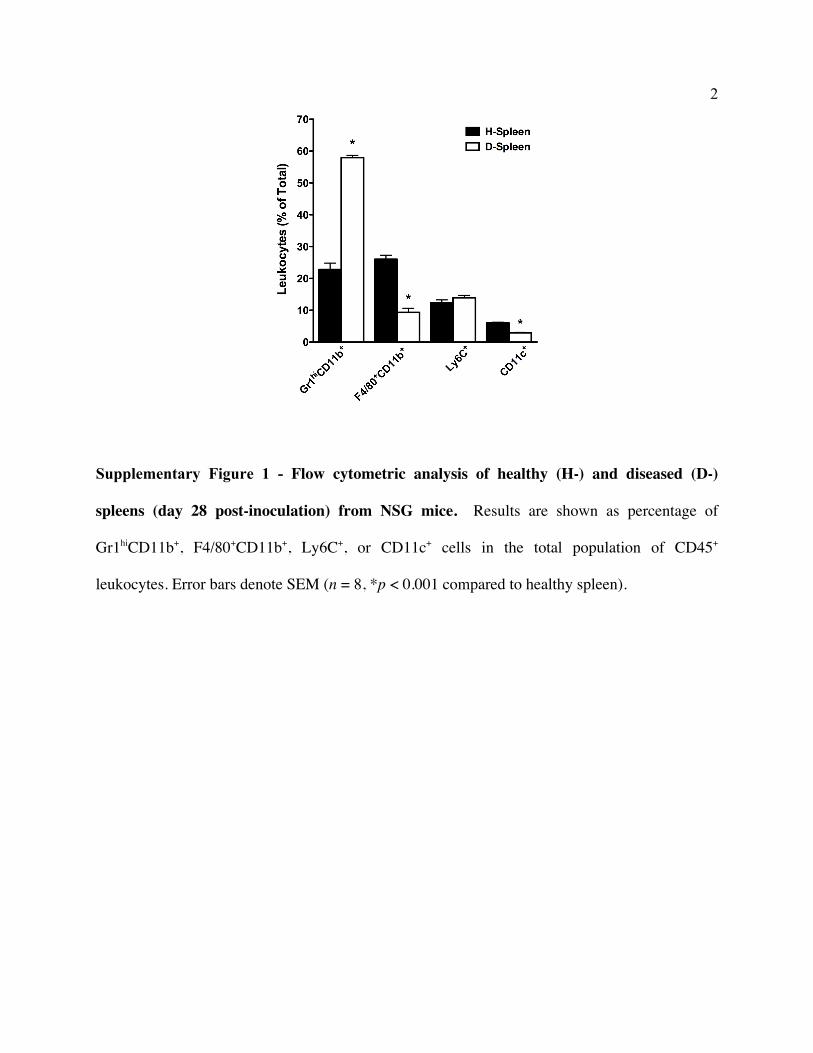
Supplementary Figure 1 - Flow cytometric analysis of healthy (H-) and diseased (D-)
spleens (day 28 post-inoculation) from NSG mice. Results are shown as percentage of
Gr1hiCD11b+, F4/80+CD11b+, Ly6C+, or CD11c+ cells in the total population of CD45+
leukocytes. Error bars denote SEM (n = 8, *p < 0.001 compared to healthy spleen).
3
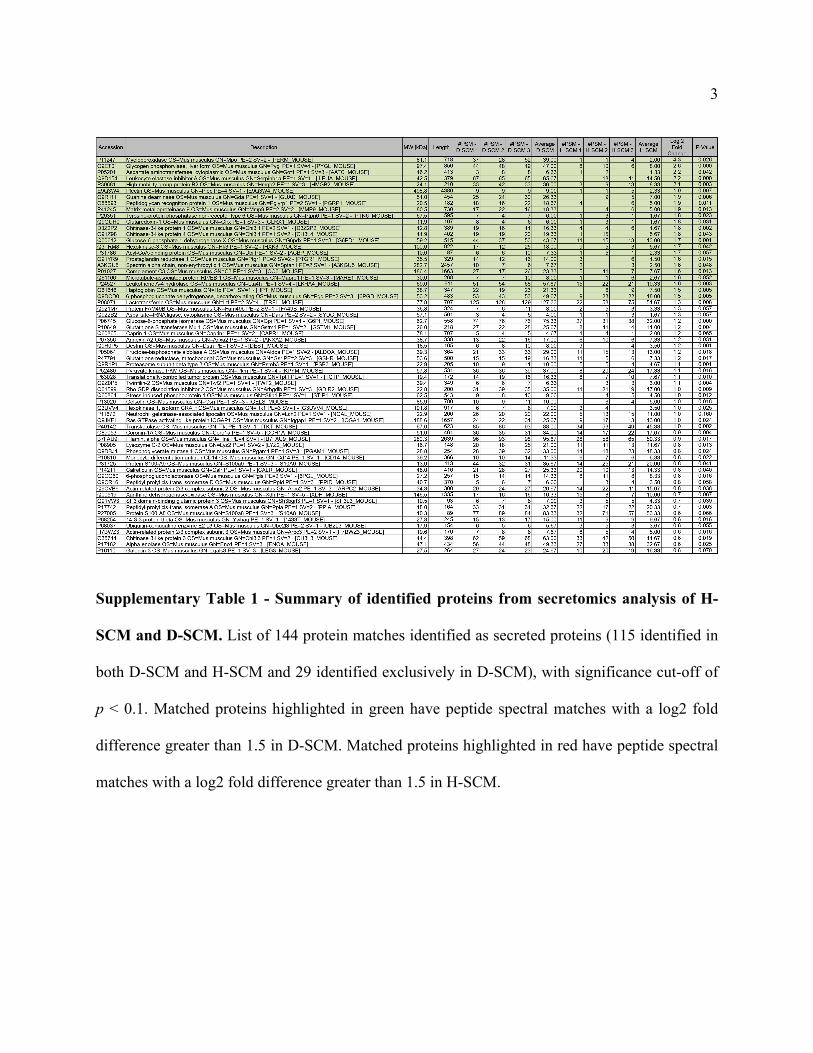
Supplementary Table 1 - Summary of identified proteins from secretomics analysis of H-
SCM and D-SCM. List of 144 protein matches identified as secreted proteins (115 identified in
both D-SCM and H-SCM and 29 identified exclusively in D-SCM), with significance cut-off of
p < 0.1. Matched proteins highlighted in green have peptide spectral matches with a log2 fold
difference greater than 1.5 in D-SCM. Matched proteins highlighted in red have peptide spectral
matches with a log2 fold difference greater than 1.5 in H-SCM.
4
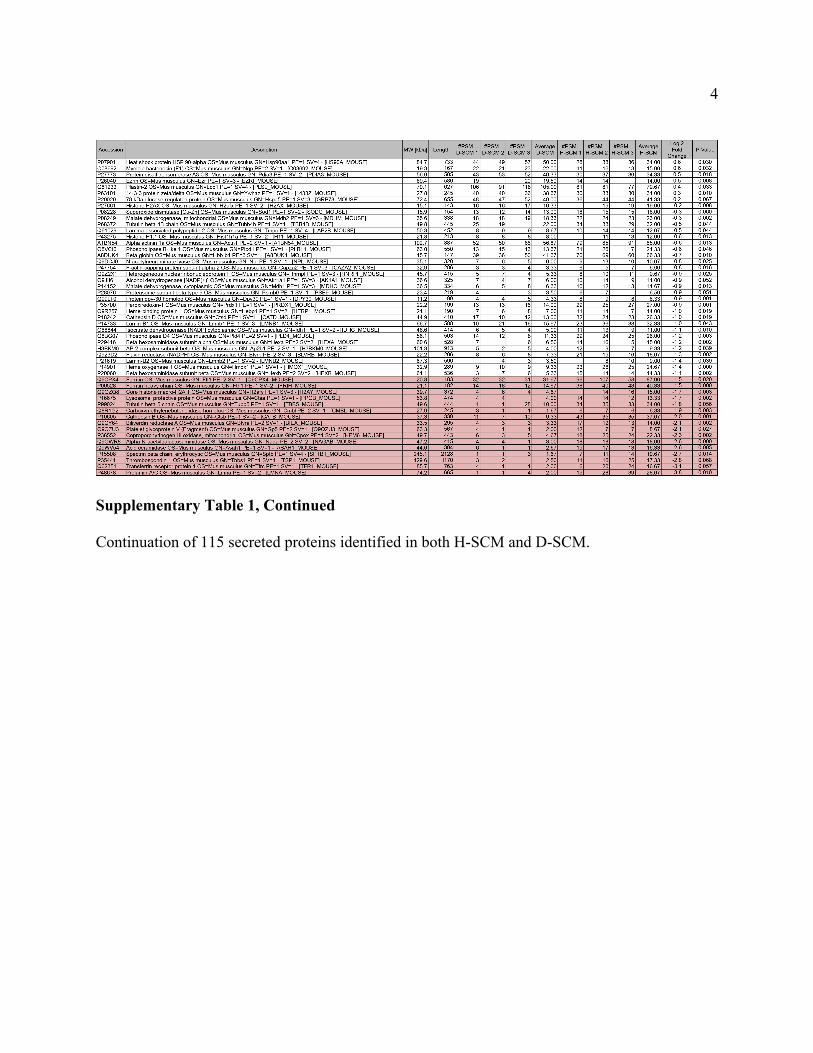
Supplementary Table 1, Continued
Continuation of 115 secreted proteins identified in both H-SCM and D-SCM.
5
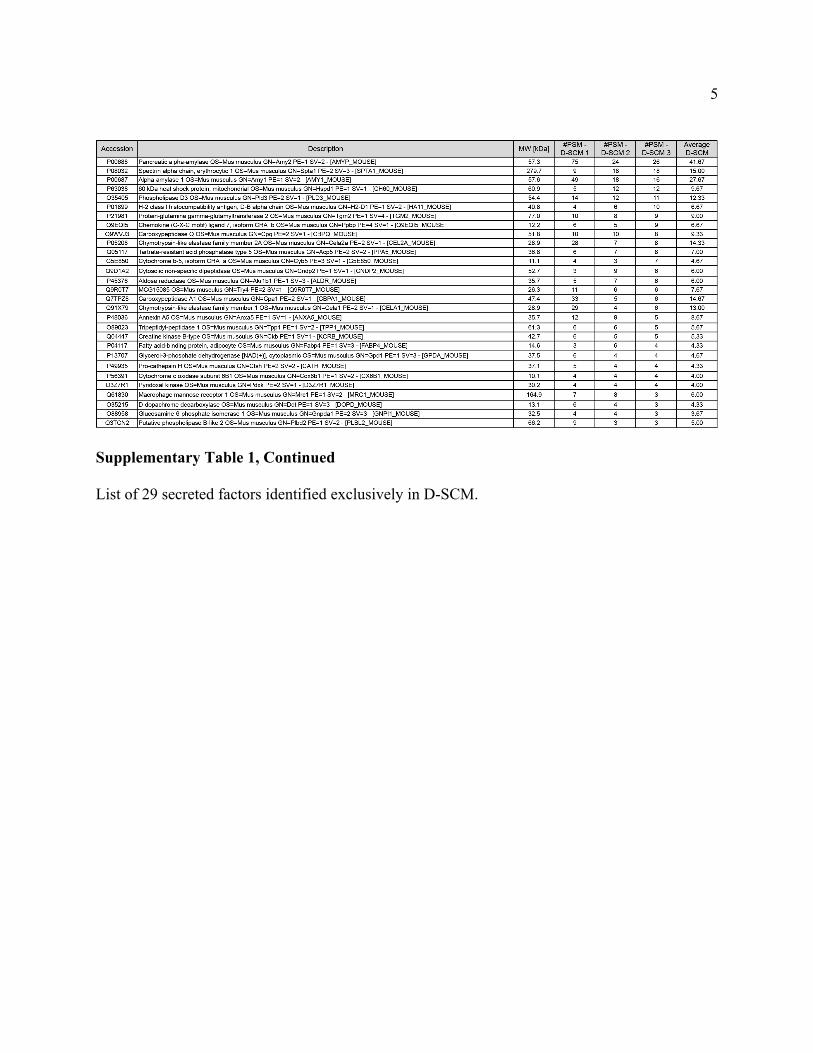
Supplementary Table 1, Continued
List of 29 secreted factors identified exclusively in D-SCM.
6
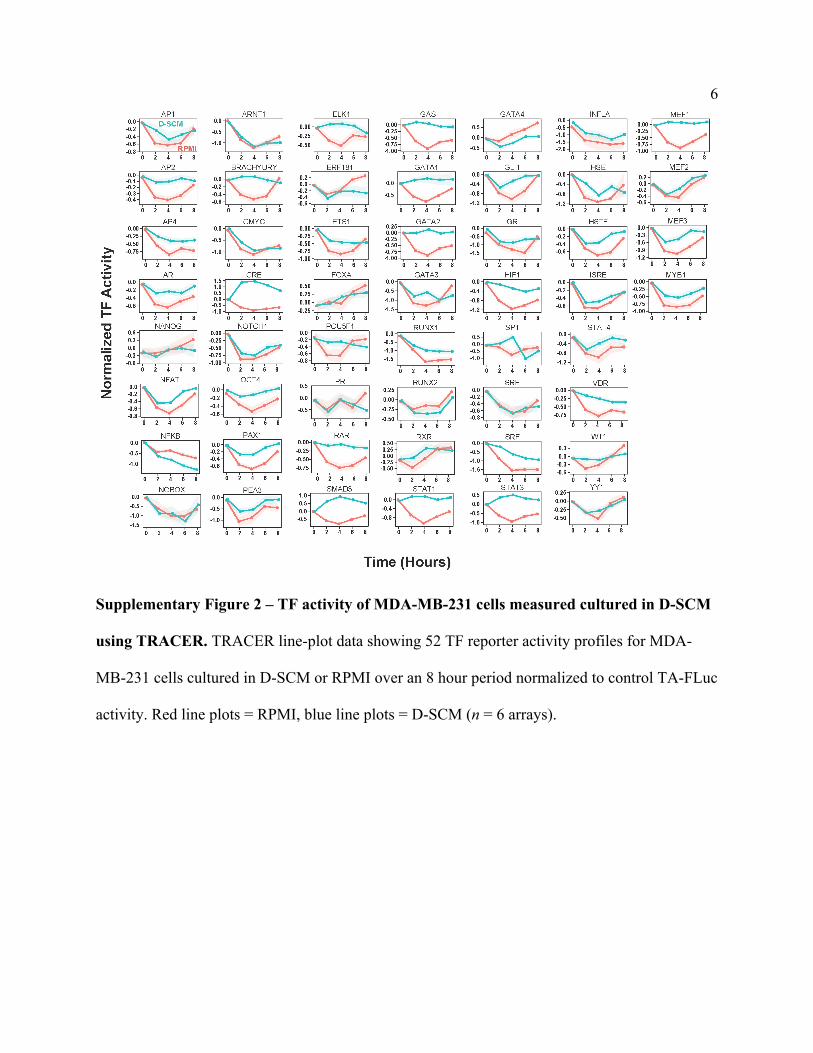
Supplementary Figure 2 – TF activity of MDA-MB-231 cells measured cultured in D-SCM
using TRACER. TRACER line-plot data showing 52 TF reporter activity profiles for MDA-
MB-231 cells cultured in D-SCM or RPMI over an 8 hour period normalized to control TA-FLuc
activity. Red line plots = RPMI, blue line plots = D-SCM (n = 6 arrays).
7
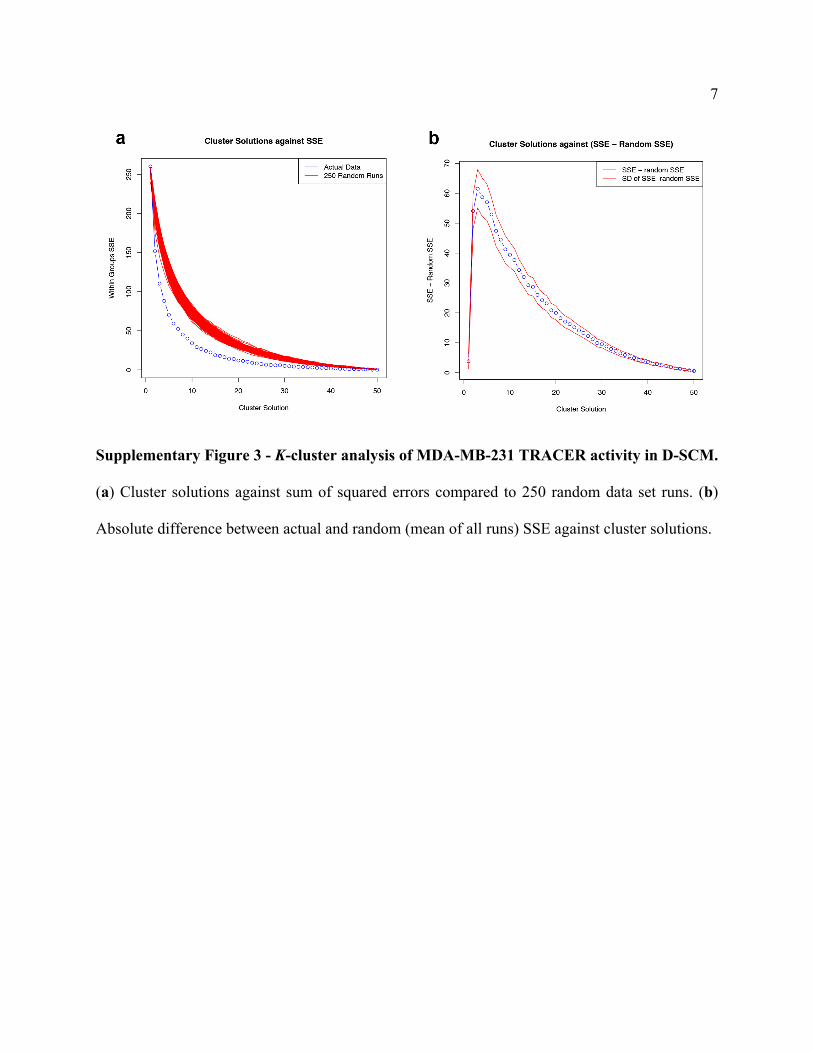
Supplementary Figure 3 - K-cluster analysis of MDA-MB-231 TRACER activity in D-SCM.
(a) Cluster solutions against sum of squared errors compared to 250 random data set runs. (b)
Absolute difference between actual and random (mean of all runs) SSE against cluster solutions.
8
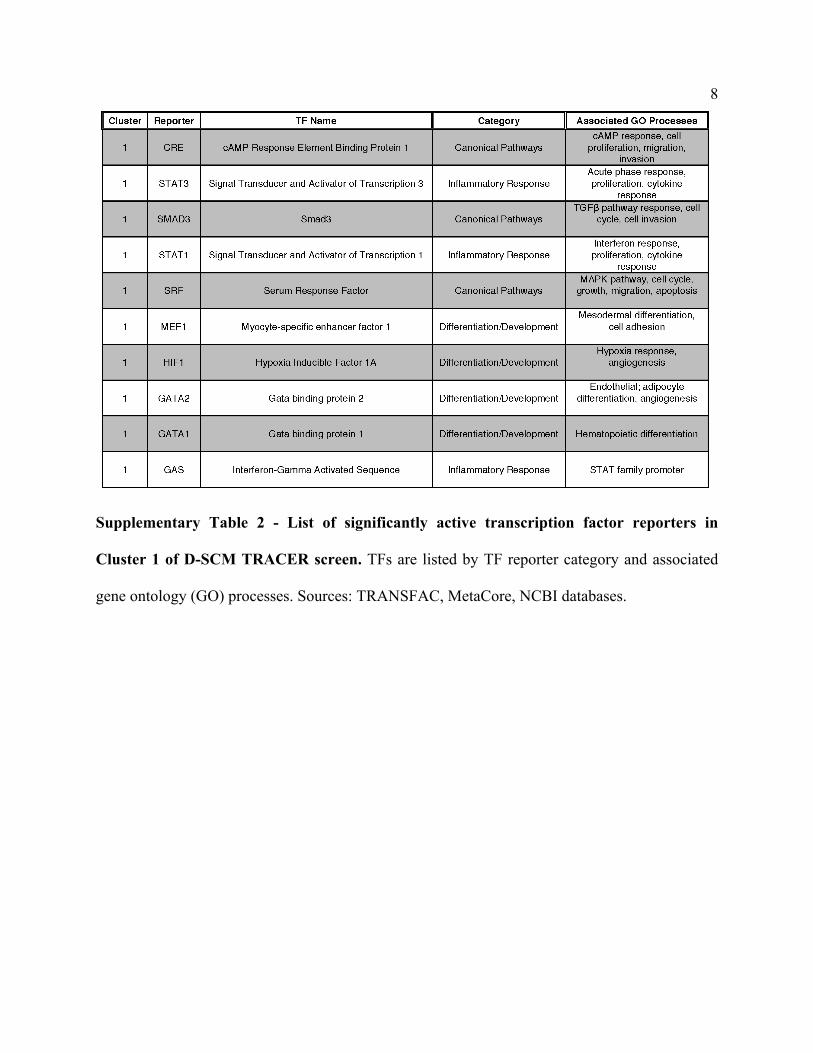
Supplementary Table 2 - List of significantly active transcription factor reporters in
Cluster 1 of D-SCM TRACER screen. TFs are listed by TF reporter category and associated
gene ontology (GO) processes. Sources: TRANSFAC, MetaCore, NCBI databases.
9
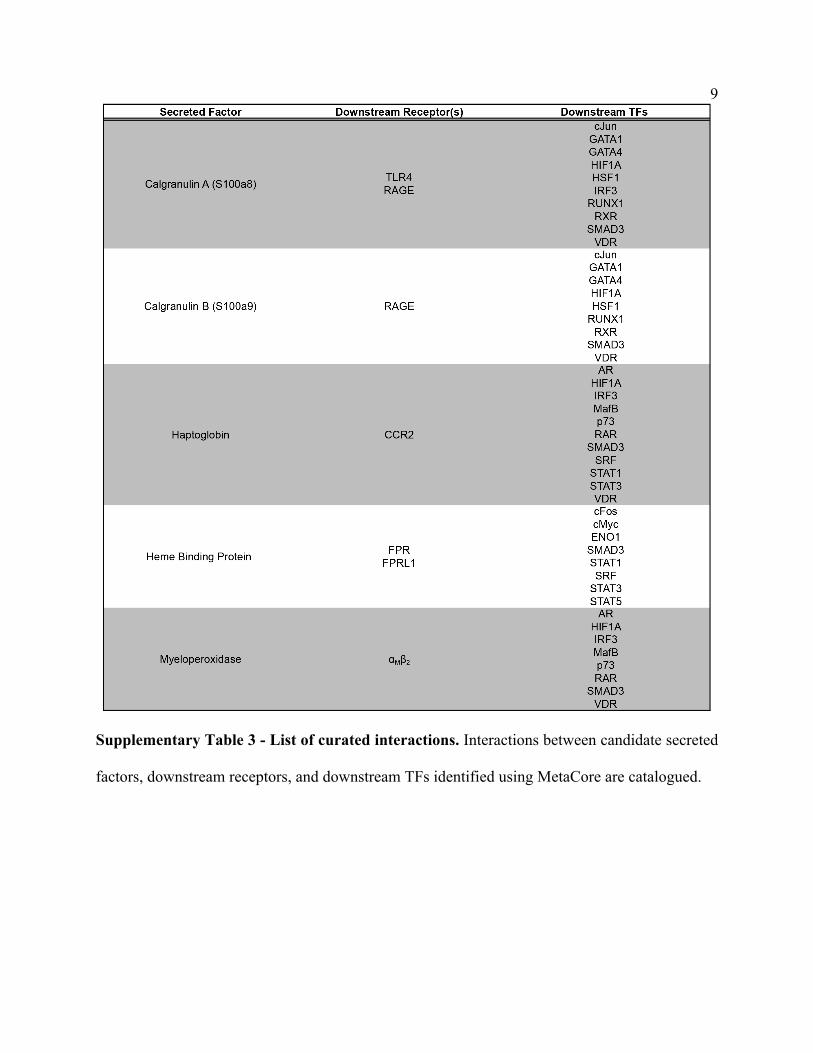
Supplementary Table 3 - List of curated interactions. Interactions between candidate secreted
factors, downstream receptors, and downstream TFs identified using MetaCore are catalogued.
10
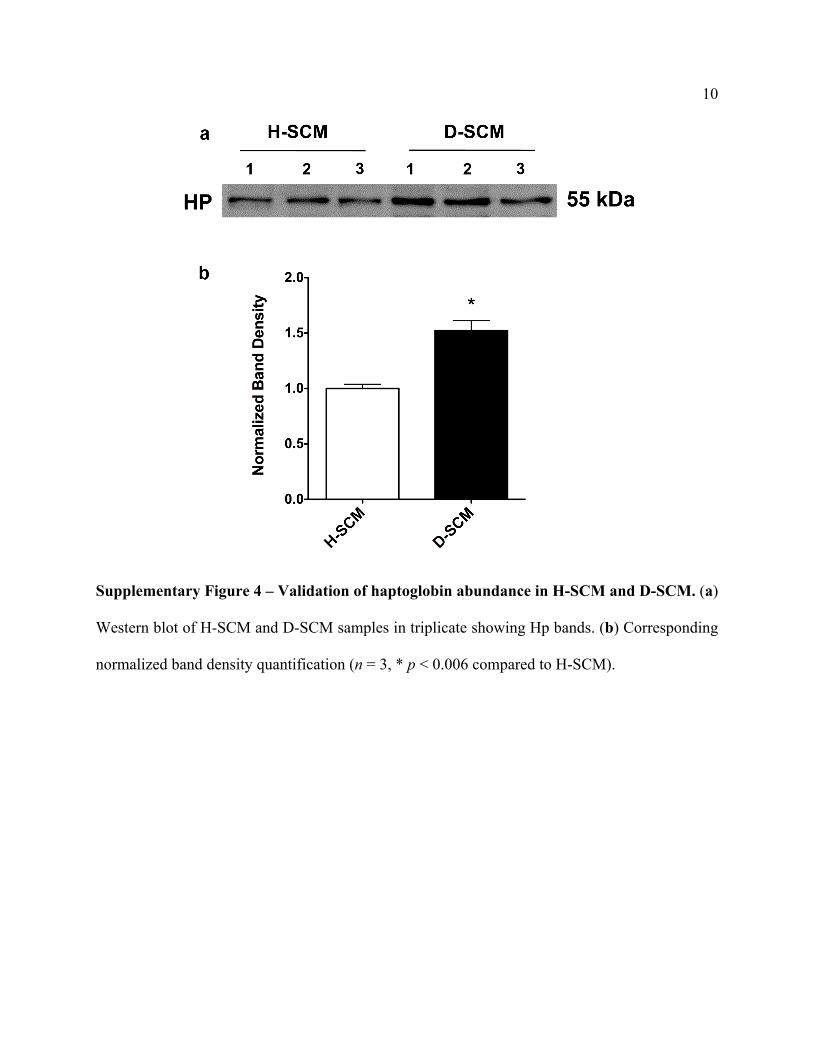
Supplementary Figure 4 – Validation of haptoglobin abundance in H-SCM and D-SCM. (a)
Western blot of H-SCM and D-SCM samples in triplicate showing Hp bands. (b) Corresponding
normalized band density quantification (n = 3, * p < 0.006 compared to H-SCM).
11
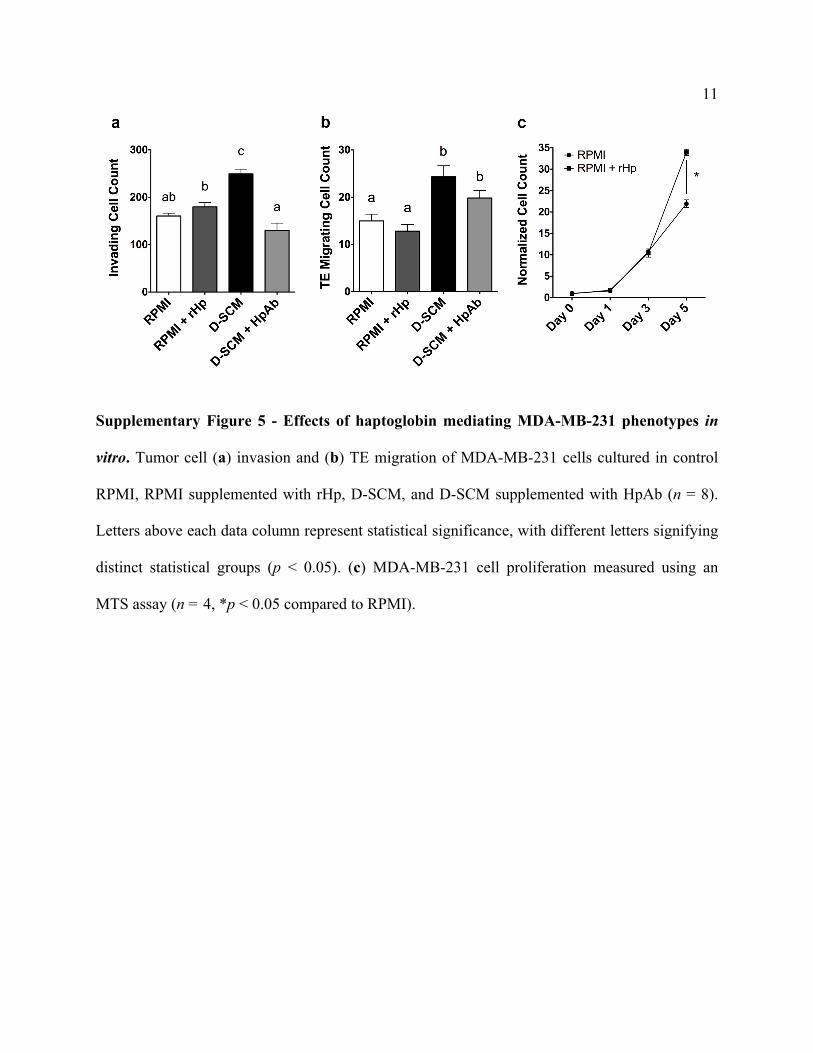
Supplementary Figure 5 - Effects of haptoglobin mediating MDA-MB-231 phenotypes in
vitro. Tumor cell (a) invasion and (b) TE migration of MDA-MB-231 cells cultured in control
RPMI, RPMI supplemented with rHp, D-SCM, and D-SCM supplemented with HpAb (n = 8).
Letters above each data column represent statistical significance, with different letters signifying
distinct statistical groups (p < 0.05). (c) MDA-MB-231 cell proliferation measured using an
MTS assay (n = 4, *p < 0.05 compared to RPMI).
12
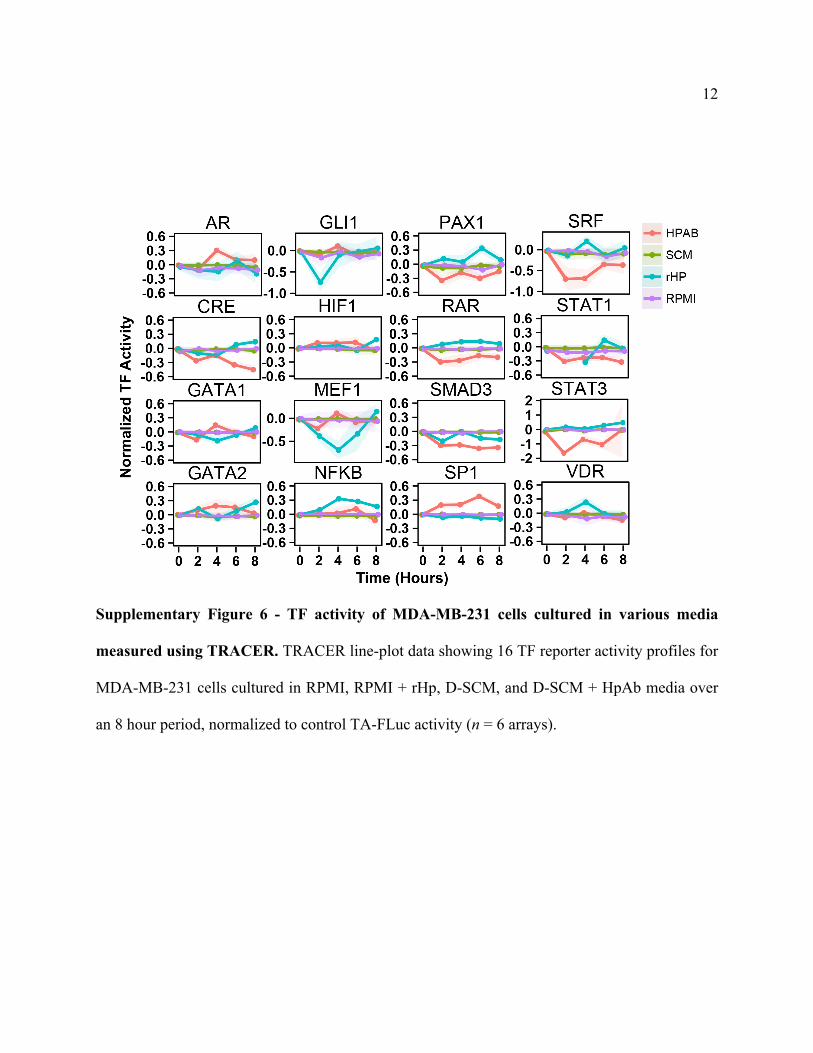
Supplementary Figure 6 - TF activity of MDA-MB-231 cells cultured in various media
measured using TRACER. TRACER line-plot data showing 16 TF reporter activity profiles for
MDA-MB-231 cells cultured in RPMI, RPMI + rHp, D-SCM, and D-SCM + HpAb media over
an 8 hour period, normalized to control TA-FLuc activity (n = 6 arrays).
13
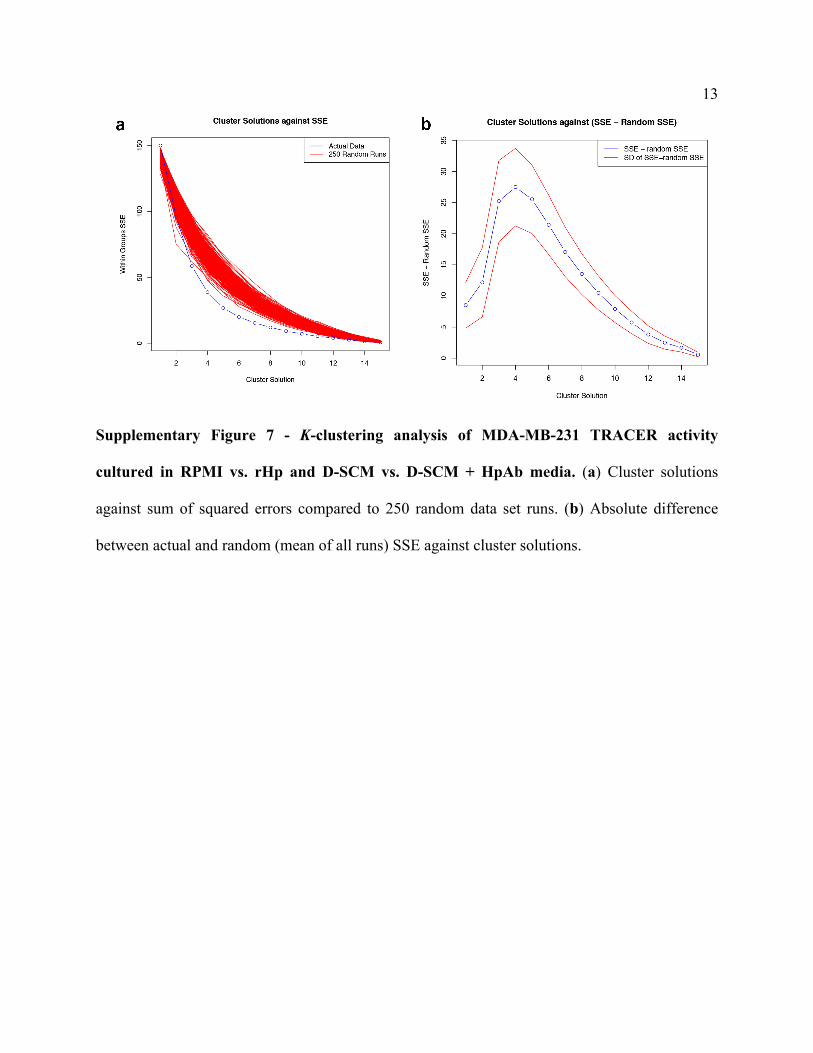
Supplementary Figure 7 - K-clustering analysis of MDA-MB-231 TRACER activity
cultured in RPMI vs. rHp and D-SCM vs. D-SCM + HpAb media. (a) Cluster solutions
against sum of squared errors compared to 250 random data set runs. (b) Absolute difference
between actual and random (mean of all runs) SSE against cluster solutions.