Embed Size (px)
Citation preview

AIA Guide to Building Life Cycle Assessment in Practice

A Guide to Life Cycle Assessment of Buildings
Authorship and Acknowledgements
Guide Prepared By Georgia Institute of Technology Dr. Charlene Bayer, Project Director Professor Michael Gamble Dr. Russell Gentry, Project Director Surabhi Joshi, Research Assistant Published 2010 by The American Institute of Architects 1735 New York Avenue NW Washington, DC 20006 © The American Institute of Architects All Rights Reserved Printed in the United States
Acknowledgements Thanks to all the individuals, organizations, and firms who reviewed and contributed to this work. Special thanks to members of the AIA Committee on the Environment (COTE) and AIA National staff.

A Guide to Life Cycle Assessment of Buildings
2
Table of Contents List of Abbreviations ................................................................................................................................... 8
Executive Summary: The Future of Building Life Cycle Assessment in Practice .................................. 9
1 LIFE CYCLE ASSESSMENT: INTRODUCTION AND TERMINOLOGY ............................................................ 43
Background ........................................................................................................................................... 43
Organization of the Document ............................................................................................................. 45
History of LCA ....................................................................................................................................... 45
Definitions and Aspects of Life Cycle Assessment ................................................................................. 46
Variants of LCA .................................................................................................................................. 46
Life Cycle Stages .................................................................................................................................... 48
Material Manufacturing .................................................................................................................... 48
Construction ..................................................................................................................................... 49
Use and Maintenance ....................................................................................................................... 49
End of Life ......................................................................................................................................... 49
Embodied Energy, Operational Energy and LCA ................................................................................... 49
Steps of LCA Process ............................................................................................................................. 50
Step 1: Goal and Scope Definition ..................................................................................................... 50
Step 2: Inventory Analysis ................................................................................................................. 51
Step3: Impact Assessment ................................................................................................................ 51
Step 4: Interpretation ....................................................................................................................... 52
Summary of Steps ............................................................................................................................. 52
Impact Categories ................................................................................................................................. 53
Global Warming Potential (GWP) ..................................................................................................... 53
Acidification Potential (AP) ............................................................................................................... 53
Eutrophication Potential (EP) ............................................................................................................ 54
Fossil Fuel Depletion ......................................................................................................................... 54
Smog Formation Potential ................................................................................................................ 54
Ozone Depletion Potential ................................................................................................................ 54

A Guide to Life Cycle Assessment of Buildings
3
Ecological Toxicity ............................................................................................................................. 55
Water Use ......................................................................................................................................... 55
Life Cycle Impact Assessment (LCIA) Method ....................................................................................... 55
Equivalents ........................................................................................................................................ 55
Normalization ................................................................................................................................... 55
Weighting Methods .......................................................................................................................... 56
LCA Terminology ................................................................................................................................... 56
Functional Unit.................................................................................................................................. 56
System Boundary .............................................................................................................................. 56
Life Cycle Inventory (LCI) Database ................................................................................................... 57
Life Cycle Management (LCM) .......................................................................................................... 58
Life Cycle Costing (LCC) ..................................................................................................................... 58
Life Cycle Energy Analysis (LCEA) ...................................................................................................... 59
Carbon Accounting ............................................................................................................................ 59
Life Cycle Assessment in the Building Industry ..................................................................................... 59
Material Level ................................................................................................................................... 60
Product Level .................................................................................................................................... 60
Building Level .................................................................................................................................... 61
Industry Level .................................................................................................................................... 61
LCA and the Design Process .................................................................................................................. 61
Pre-Design Stage ............................................................................................................................... 62
Schematic Design Stage .................................................................................................................... 62
Design Development Stage ............................................................................................................... 63
Challenges in the Use of LCA ................................................................................................................. 63
Data collection .................................................................................................................................. 63
Data Quality ...................................................................................................................................... 63
Issues with Impact Assessment Methods ......................................................................................... 64
Issues with Weighting ....................................................................................................................... 64
Role of ISO Standards, SETAC/UNEP & EPA .......................................................................................... 64
Incentives for conducting LCA – Building Standards and Rating Systems ............................................. 65
Incentives for Building LCA at Present .............................................................................................. 66
Future Incentives for Building LCA .................................................................................................... 67

A Guide to Life Cycle Assessment of Buildings
4
Research to Address Shortcomings in Building-Specific LCA ................................................................. 68
Allocating Recycling Activities in a Building Life-Cycle ...................................................................... 68
Weighting Impact Categories ............................................................................................................ 70
Streamlining the LCA Process ............................................................................................................ 70
Benchmarking LCA ............................................................................................................................ 70
Chapter Summary ................................................................................................................................. 71
2 STATE OF TOOLS .................................................................................................................................... 73
Configuration of an LCA Tool ................................................................................................................ 74
Classification of Tools............................................................................................................................ 74
Based on different levels of LCA application ..................................................................................... 74
Based on User Skills .......................................................................................................................... 75
Based on Region................................................................................................................................ 76
Based on its Application to a Design Stage ....................................................................................... 76
Based on Life-Cycle Phases Included ................................................................................................. 76
ATHENA® Impact Estimator ................................................................................................................... 76
Tool Assumptions .............................................................................................................................. 77
Input ................................................................................................................................................. 78
Output............................................................................................................................................... 78
Additional Features ........................................................................................................................... 78
Strengths ........................................................................................................................................... 78
Weaknesses ...................................................................................................................................... 79
ATHENA® EcoCalculator ......................................................................................................................... 80
Tool Assumptions .............................................................................................................................. 80
Input ................................................................................................................................................. 81
Output............................................................................................................................................... 81
Strengths ........................................................................................................................................... 81
Weaknesses ...................................................................................................................................... 81
Building for Economic and Environmental Sustainability (BEES®) ......................................................... 82
Tool Assumptions .............................................................................................................................. 83
Input ................................................................................................................................................. 83
Output............................................................................................................................................... 83
Strengths ........................................................................................................................................... 83

A Guide to Life Cycle Assessment of Buildings
5
Weaknesses ...................................................................................................................................... 83
Economic Input Output – LCA (EIO-LCA) ............................................................................................... 84
Tool Assumptions .............................................................................................................................. 84
Input ................................................................................................................................................. 85
Output............................................................................................................................................... 85
Strengths ........................................................................................................................................... 85
Weaknesses ...................................................................................................................................... 85
US LCI Database – by NREL ................................................................................................................... 85
US LCIA Method – TRACI by EPA ........................................................................................................... 86
International LCA Tools ......................................................................................................................... 86
EQUER ............................................................................................................................................... 86
LCAidTM .............................................................................................................................................. 86
Eco-Quantum .................................................................................................................................... 87
LCA in Sustainable Architecture (LISA) .............................................................................................. 87
Envest ............................................................................................................................................... 87
LCAit .................................................................................................................................................. 87
PEMS ................................................................................................................................................. 88
TEAM™ .............................................................................................................................................. 88
Umberto............................................................................................................................................ 88
SBi LCA tool ....................................................................................................................................... 88
Boustead ........................................................................................................................................... 88
SimaPro ............................................................................................................................................. 89
GaBi................................................................................................................................................... 89
Related Tools – Pharos, Green Footsteps & Eco-Scorecard .................................................................. 89
Pharos Framework ............................................................................................................................ 89
Green Footstep ................................................................................................................................. 90
ecoScorecard .................................................................................................................................... 91
BIM and LCA – LCADesign™ Tool........................................................................................................... 91
Chapter Summary ................................................................................................................................. 92
3 STATE OF PRACTICE ............................................................................................................................... 99
LCA from Architect’s Perspective ........................................................................................................ 100
Target audience for LCA – Who will benefit? ...................................................................................... 101

A Guide to Life Cycle Assessment of Buildings
6
Real Projects ....................................................................................................................................... 101
Case Study 1: NJMC Center for Environmental and Scientific Education, NJ, US ............................ 102
Case Study 2: Stadium Australia / ANZ Stadium, New South Wales, Australia ................................ 109
Case Study 3: Moreau School, Mendoza, Argentina ....................................................................... 115
Case Study 4: Emeryville Resourceful Building, California, USA ...................................................... 121
Research Case Studies ........................................................................................................................ 129
Case Study 5: Three Variants of a Family House in Switzerland ...................................................... 132
Case Study 6: Two variants of a Single Family house in US ............................................................. 135
Case Study 7: Office Building in Thailand ........................................................................................ 139
Case Study 8: Office Building in the US ........................................................................................... 141
Useful Observations from Case Studies .............................................................................................. 142
Case Study 1-4................................................................................................................................. 142
Case Study 5-6................................................................................................................................. 143
Case Study 7-8................................................................................................................................. 146
Related Case Studies ........................................................................................................................... 147
LCEA of Land Use in Ireland ............................................................................................................ 147
LCA of Retrofitting Buildings ........................................................................................................... 148
Chapter Summary ............................................................................................................................... 148
4 CONDUCTING AN LCA – EXAMPLE ....................................................................................................... 150
Project Overview................................................................................................................................. 150
Environmental Design Features .......................................................................................................... 151
Conducting an LCA Using the ATHENA® Impact Estimator .................................................................. 151
Goal and Scope Definition ............................................................................................................... 152
Required Inputs............................................................................................................................... 152
Output............................................................................................................................................. 156
Interpretation ..................................................................................................................................... 161
Global Warming Potential (GWP) ................................................................................................... 162
Acidification Potential ..................................................................................................................... 162
Ozone Depletion Potential (ODP).................................................................................................... 162
Chapter Summary ............................................................................................................................... 163
5 GUIDELINES TO INTEGRATE LCA IN BUILDING DESIGN AND EVALUATION .......................................... 165
Exploring the Scenarios of Use of LCA................................................................................................. 165

A Guide to Life Cycle Assessment of Buildings
7
Guidelines to Integrate LCA in Building Design and Evaluation .......................................................... 168
Step 1: Defining the Project’s Sustainability Targets ....................................................................... 168
Step 2: Conduct an LCA or not? ...................................................................................................... 169
Step 3: Defining the Goals and Scope of LCA Study ........................................................................ 169
Step 4: Choosing an LCA Tool .......................................................................................................... 170
Step 5: Life Cycle Inventory (LCI) Analysis ....................................................................................... 177
Step 6: Life Cycle Impact Assessment (LCIA) .................................................................................. 179
Step 7: Results and Interpretations ................................................................................................. 179
Chapter Summary ............................................................................................................................... 180
6 CONCLUSION AND DISCUSSION ........................................................................................................... 181
7 GLOSSARY ............................................................................................................................................ 182
8 REFERENCES ......................................................................................................................................... 186
APPENDIX A ............................................................................................................................................ 190
Big Nerd Ranch – Building ‘A’ Ground Floor Plan ................................................................................ 190
Big Nerd Ranch – Building ‘A’ First Floor Plan ..................................................................................... 191
Inventory Analysis Results .................................................................................................................. 192

A Guide to Life Cycle Assessment of Buildings
8
List of Abbreviations AAP Aquatic Acidification Potential
AP Acidification Potential
ASHRAE American Society of Heating, Refrigerating and Air-Conditioning Engineers
BEES® Building for Environmental and Economic Sustainability
BREEAM Building Research Establishment Environmental Assessment Method
CMU Concrete Masonry Unit
DPWS Department of Public Works and Services
EIO-LCA Economic Input Output – Life Cycle Assessment
EP Eutrophication Potential
EPA Environmental Protection Agency
EPD Environmental Product Declarations
GBC Green Building Challenge
GBI Green Building Initiative
GWP Global Warming Potential
IGCC International Green Construction Code
ISO International Organization for Standardization
LCA Life Cycle Assessment
LCC Life Cycle Costing
LCEA Life Cycle Energy Analysis
LCI Life Cycle Inventory
LCIA Life Cycle Impact Assessment
LCM Life Cycle Management
LEED Leadership in Energy and Environmental Design
NJMC New Jersey Meadowland Commission
OD Ozone Depletion
POCP Photochemical Smog Potential
SBTC Sustainable Building Technology Committee
SETAC Society of Environmental Toxicology and Chemistry
TRACI Tool for the Reduction and Assessment of Chemical and Other Environmental Impacts
UNEP United Nations Environment Programme
USGBC United States Green Building Council

A Guide to Life Cycle Assessment of Buildings
9
Executive Summary: The Future of Building Life Cycle Assessment in Practice
Summary As the architectural and construction industries increasingly
emphasize sustainability, more comprehensive methods are being
developed to evaluate and reduce environmental impacts by
buildings. Life Cycle Assessment (LCA) is emerging as one of the most
functional assessment tools; however, presently there is a scarcity of
clear guiding principles specifically directed towards the architectural
profession in the use of building LCA during the design process. In
this paper, we are providing those guidelines to help architects
understand and use LCA methodology as part of the design process
by identifying scenarios for the use of LCA in the design process and
providing a set of proposed guidelines for the conductance of whole-
building LCA. The scenarios were developed by an extensive
literature review of previously completed whole-building LCA case
studies, architect interviews, and an evaluation of a set of North
American and international LCA tools for use in the proposed
scenarios. Additionally, the study shows an example of whole-
building LCA of an institutional facility being designed in Georgia.
In this paper, we established a basic understanding about LCA for the
building industry—particularly architects, the utility of LCA, and
proposed guidelines/suggestions for conducting LCA. The state of
research was reviewed to find answers to present limitations of use
of LCA in practice. We showed that LCA results help answer
numerous questions that arise during the design and construction
of a green building. It can reinforce the decisions made by architects
by providing a scientific justification for those decisions. A number
of whole building LCA tools are available for use by architects.
In the current state of LCA, the limitations must be recognized;
however, it also needs to be recognized that with increasing use,
research, and tools development these limitations will be resolved.
One limitation is the scarcity of the financial incentives for LCA use at
this time, although this is expected to change quickly as LEED and
ASHRAE 189.1 become proponents of the use of LCA in the design
process. Currently the greatest incentive for the use of LCA in the
design process is the ability of an architect to show to the client
Currently the greatest
incentive for the use of
LCA in the design process
is the ability of an
architect to show to the
client that the use of LCA
will improve and
demonstrate the “green-
ness” of the project and
help significantly in
increasing long-term
paybacks by better
decision-making
A Guide to Life Cycle Assessment of Buildings
10
that the use of LCA will improve and demonstrate the “green-ness”
of the project and help significantly in increasing long-term
paybacks by better decision making. A second limitation is the
deficiencies in the databases completeness requiring the architect or
LCA practitioner to be required to use multiple data sources and
increasing uses of assumptions. This limitation is being reduced as
the databases enlarge their information bases and as more and more
easily used tools become available. The last major limitation is the
lack of benchmarks established by government authorities,
particularly in the US, that can be used for comparisons. This
limitation also will be overcome as LCA becomes more commonly
used and the benchmark data become more readily available.
We opine that with improvements in LCI databases and whole
building LCA tool capabilities, design practitioners will have more
faith in LCA results and be more inclined to conduct LCA analyses as
larger numbers of case studies are conducted representing different
building types to set benchmarks. Robust normalizing and weighting
methods will be established as the tools are advanced. The
establishment of attractive incentives in terms of tax incentives and
other financial incentives, particularly in the US, will lead the path of
integration of LCA in building design and promote its use by
architects.
Introduction Architects are increasingly interested in characterizing and reducing
the environmental impacts of the buildings they design. Tools like
energy modeling assist in predicting and, through good design,
reducing the operational energy in buildings. LCA is a tool that allows
architects and other building professionals to understand the energy
use and other environmental impacts associated with all life cycle
phases of the building: procurement, construction, operation, and
decommissioning.
Today, state building codes and the model codes on which they are
based are adopting modest improvements in energy-related design.
A large segment of those decision makers procuring new buildings
are choosing to follow elective green-building scorecard and
branding schemes such as Energy-Star and LEED. The AIA and major
US cities have embraced auspicious targets for reducing the
environmental impact and climate change potential of the country’s
building stock—as embodied by the AIA 2030 Commitment.

A Guide to Life Cycle Assessment of Buildings
11
The environmental impact of human actions is quite evident in the present-day world.
EPA’s statistical summary published in 2004 suggests that the building industry is a
major contributor to this impact. EPA’s analysis indicates the building industry’s share
in various resource consumption and environmental impact categories and their
distribution amongst commercial and residential building sectors.
Though current efforts such as LEED and Energy-Star are laudable,
they are incomplete. Scorecard approaches such as these do not fit
well within design practice. The credits given within LEED do not
provide design guidance or feedback on how well a given design
decision is working. Rather, they provide a specific list of do’s and
don’ts to be applied during the design process. Architects seek
methods to answer specific design questions—to help them
understand the environmental impact of both the overall building
and of particular design decisions.
LCA is an emerging tool that promises to aid in architectural decision
making. Industrial ecologists, chemists, and chemical engineers
seeking to understand and reduce the impact of manufacturing and
process chemistry developed LCA. Today, LCA is being promoted as a
tool for analyzing the environmental impact of buildings and making
decisions to reduce these impacts.
The output of an LCA can be thought of as a wide-ranging environmental footprint of a building—including aspects such as energy use, global warming potential, habitat destruction, resource depletion, and toxic emissions.
Currently there exists, however, significant confusion about LCA and
A Guide to Life Cycle Assessment of Buildings
12
how it can be used in its current state, as was demonstrated by the
architect interviews that we conducted as part of this study. The AIA
has commissioned our document to aid practitioners in the
understanding and adoption of the LCA methodology.
The use of LCA for buildings requires a set of guiding principles,
which consider the unique character of each building design,
complexity in defining systems, and related decisions.
LCA is relatively new to the building industry. As in any developing
field, there is a great deal of confusion about LCA, which can
inadvertently lead to misuse of LCA tools, techniques, and supporting
data. Thus, there is a need for a clear working definition of LCA and
related terminology to help build credibility for the methodology and
make the building industry more receptive to this new way of
evaluating their work.
Definitions and Aspects of Life Cycle Assessment
The LCA process is governed under ISO 14000, the series of
international standards addressing environmental management.
According to International Standard ISO 14040, LCA is a “compilation
and evaluation of the inputs, outputs and the potential
environmental impacts of a product system throughout its life cycle.”
The Code of Practice by the Society of Environmental Toxicology and
Chemistry (SETAC) describes LCA as “a process to evaluate the
environmental burdens associated with a product, process, or
activity by identifying and quantifying energy and materials used and
wastes released to the environment; to assess the impact of those
energy and materials used and released to the environment; and to
identify and evaluate opportunities to affect environmental
improvements.” The Environmental Protection Agency (EPA) refers
to LCA as “a cradle-to-grave approach for assessing industrial
systems that evaluates all stages of a product’s life.”

A Guide to Life Cycle Assessment of Buildings
13
Variants of LCA
The scope of LCA can extend to various stages and processes in a
product’s life. Depending on the purpose of conducting the LCA, one
of two primary means for conducting the LCA can be considered. The
two primary variants of LCA are process-based LCA and Economic
Input-Output based LCA. Within each variant there exists a number
of options to be considered. LCA methods implemented in the
building construction industry are based primarily on process-based
LCA.
Life Cycle Stages
Every product or process goes through various phases or stages in its
life. Each stage is composed of a number of activities. For industrial
products, these stages can be broadly defined as material
acquisition, manufacturing, use and maintenance, and end-of-life. In
case of buildings, these stages are more specifically delineated as:
materials manufacturing, construction, use and maintenance, and
end of life.
Types of Process-Based LCA Methods: In a process-based LCA, the inputs (materials and energy resources) and the outputs (emissions and wastes to the environment) for each step required to produce a product. LCA methods implemented in the building construction industry are based primarily on process-based LCA.
Economic Input-
Output Based LCA
Method
(EIO-LCA)
Estimates the materials
and energy resources
required for, and the
environmental emissions
resulting from, activities
in our economy.
Considers an entire sector of the economy – all activities of all industrial sectors.
Gives a more holistic view of the impact from a process or product.
Relies on sector-level averages that may or may not represent a subset of the sector relevant to a particular project
In terms of the building industry, is not an appropriate tool for determining whether specific actions are environmentally beneficial or harmful
Better suited to track overall aspect of one aspect in the entire construction industry as a whole (i.e. the use of fly ash in concrete)

A Guide to Life Cycle Assessment of Buildings
14
The Life-Cycle Stages of a building are:
Materials Manufacturing: Removal of raw materials from earth, transportation of materials to the manufacturing locations, manufacture of finished or intermediate materials, building product fabrication, and packaging and distribution of building products
Construction: All activities relating to the actual building project construction
Use and Maintenance: Building operation including energy consumption, water usage, environmental waste generation, repair and replacement of building assemblies and systems, and transport and equipment use for repair and replacement
End of Life: Includes energy consumed and waste produced due to building demolition and disposal of materials to landfills, and transport of waste materials. Recycling and reuse activities related to demolition waste also can be included and have a “negative impact.”
Embodied Energy, Operational Energy and LCA
The output from an energy model, such as DOE2 or BLAST, is the
projected energy use within a building as it operates over a typical
meteorological year. This energy is considered the “operational
energy” and is one component of the input needed to complete a
building LCA.
The second major component of energy consumed by a building is
the “embodied energy,” which comes from the materials
manufacturing and construction phases of the building project. The
need to understand embodied energy becomes more important as
measures to reduce operational energy are taken. For “net-zero
buildings,” the majority of the energy impacts will be embodied, as
operational energy needs are increasingly met by on-site power
generation. An LCA that includes the materials manufacturing and
construction phase of the project is the primary means of
computing the embodied energy in a building.
An LCA that includes the
materials manufacturing
and construction phase of
the project is the primary
means of computing the
embodied energy in a
building.

A Guide to Life Cycle Assessment of Buildings
15
building shell (embodied effect)
green building systems (+ embodied)
energy use over time
building shell (embodied effect)
energy use over time
energy or GWP
energy or GWP
0
0
ener
gy o
r G
WP
time
green building alternative
baseline building
building shell (embodied effect)
green building systems (+ embodied)
energy use over time
building shell (embodied effect)
energy use over time
energy or GWP
energy or GWP
0
0
ener
gy o
r G
WP
time
green building alternative
baseline building
The embodied and operational energies of two building projects. The baseline building (in red) has the
smallest embodied energy but uses more energy over time. The green building alternative includes
additional embodied energy from systems like high-performance insulation and glazing, and
photovoltaics. Over time, the energy embodied in the green build systems is “paid back”, and the overall
impact of the green building, embodied+operational, becomes less than that of the baseline building. If
energy sources for building construction and operation are known, then energy use can be converted to
carbon emissions, often denoted global warming potential or GWP.
Step 1: Goal and Scope Definition
In this phase, the product(s) or service(s) to be assessed are defined,
a functional unit is chosen, and the required level of detail is defined.
The type of analysis, impact categories to be evaluated, and the set
of data that needs to be collected are identified in this step.
Step 2: Inventory Analysis
In this step, the energy and raw materials used and the emissions to
atmosphere, water, and soil are quantified for each step in the
process, then combined in the process flow chart and related back to
the functional unit—an inventory of all the inputs and outputs to and
from the production system is prepared as part of the inventory
analysis. Thus, products and processes can be compared and
evaluated using Life Cycle Inventory (LCI) results. If the results of LCI
are consistent, which means that a product performs well or poorly
in all environmental burdens, there is no need to carry out Step 3:
Impact Assessment. However, if the LCI results are inconsistent, Step
3 becomes essential.

A Guide to Life Cycle Assessment of Buildings
16
In the inventory analysis stage, software tools and databases are
critical. It is not possible to analyze each individual material and
process from scratch each time an LCA is performed. Instead,
software tools tied to extensive product and process databases are
used to complete the inventory analysis. The simplest software tools
are spreadsheets, in which material quantities can be entered. More
complex tools act more like cost-estimating software, so that
automated tabulation of material quantities from assemblies, on a
square-foot basis, can be completed.
A graphical representation of the Inventory Analysis step. The diagram can
be applied to the overall product or process being analyzed, or can be
thought of as a building block which is applied to each discreet sub-product
within an overall LCA. For example, the diagram above could apply to
anodized aluminum extrusions, which would then be one component of an
overall LCA on a curtain wall system (from “British Royal Chemistry
Society”).
Step 3: Impact Assessment
The impact assessment translates the emissions from a given product or process into impacts on various human and terrestrial eco-systems. To aid in the understanding of impacts, the effects of the resource use and emissions generated are grouped and quantified into a limited number of categories,
The LCA begins with a definition of the goals for completing the LCA -- a clear list of the questions that the LCA is intended to answer. The boundary of the LCA is drawn so that it is understood which materials and processes are being considered and which are beyond the scope of the assessment. The main effort of the LCA is in the inventory analysis, where materials and activities are analyzed and the emissions from them are accrued. As an option, the environmental impact of these emissions can be analyzed, using a recognized method for impact analysis. Finally, the results of the LCA must be analyzed in light of the questions posed as the beginning of the process.

A Guide to Life Cycle Assessment of Buildings
17
which may then be weighted for importance. In other words, data from the inventory analysis (Step 2) is attributed to appropriate impact category defined in scoping (Step 1). The results from this step can either be obtained for different impact categories or a single value result can be obtained by applying weights.
Impact assessments differ among the LCA tools used—and there is
no one dominant impact framework. For this reason, a given LCA
may choose to skip the impact assessment step and instead present
its results in terms of bulk emissions. The judging of impacts
necessarily invokes the value system of either the LCA user or the
value system embedded in the LCA tool. A given impact assessment
may focus primarily on greenhouse gas emissions and deemphasize
or ignore habitat alteration or toxic releases to waterways. The BEES
LCA tool includes a range of options for impact assessment, allowing
the user to select a suite of impacts that most closely aligns with the
value system of the user.
Step 4: Interpretation
LCA results are reported in the most informative way possible, and
the need and opportunities to reduce the impact of the product(s) or
service(s) on the environment are systematically evaluated. The
outcome of this step is directly useful in making environmentally
friendly decisions. LCA can be an iterative process; therefore, the
interpretation of the LCA can lead to changes in the proposed design,
which then leads back to Step 2 in the process.
Impact Categories
The impact categories of LCA methodologies vary from system to
system.
Environmental Impact Categories are mappings from quantities of
emissions to the environmental impacts that these emissions cause.
They can be thought of as a class of environmental issues of concern
to which Life Cycle Inventory (LCI) results may be assigned. The
impact categories have been established from nationally recognized
standards established by agencies such as the EPA, OSHA, and NIH.
The impact is usually given as a ratio of the quantity of the impact
per functional unit of product produced. Each category is an
indicator of the contribution of a product to a specific environmental
problem. These categories are defined by the Life Cycle Impact

A Guide to Life Cycle Assessment of Buildings
18
Assessment (LCIA) methods.
Life Cycle Impact Assessment (LCIA) Method
A number of technical terms are used to describe Life Cycle
Assessment, its components and related assessment methods. One
term that is often used is Life Cycle Analysis, which is simply a
synonym for Life Cycle Assessment.
Functional Unit
The functional unit can be defined as the unit of comparison that
assures that the products being compared provide an equivalent
level of function or service. It is difficult to establish functional
equivalence in the building industry.
System Boundary
System boundary is defined as an interface between a product
system and the environment or other product systems. It defines the
activities and processes that will be included in each life-cycle stage
for the LCA analysis and those that will be excluded.
Life Cycle Inventory (LCI) Database
LCI data make up the heart of any LCA analysis. Several organizations and LCA tool developers have developed LCI databases that contain material and energy use data as well as emissions data for commonly used products and processes. These databases contain elementary flows (inputs and outputs) for each unit process for a product system and are specific to countries and regions within countries. The LCI data are region-specific because the energy fuel mix and methods of production often differ from region to region. The data can be based on industry averages or could be supplier-specific. The data in the LCI databases generally account for raw material extraction, transportation to manufacturing unit, manufacturing process, and packaging and distribution.
Databases may contain industry averages or product-specific data.
Industry averages make more sense in whole-building LCA tools, as
these tools are designed to be used by architects to make decisions
about assemblies at the schematic design stage. A specific supplier is
not usually identified in early-stage design. At the specification and
procurement stages, if the supplier-specific data are available, a
Examples of LCI databases:
EcoInvent Database with global, European, an Swiss datasets
US LCI database managed by NREL and available in spreadsheet form from http://www.nrel.gov/lci/database/
Available with LCA tools such as BEES® LCA Tool and Athena Impact Estimator

A Guide to Life Cycle Assessment of Buildings
19
decision to select the most environmentally sensitive supplier for a
specific product could be assisted by the use of LCA. It may be
necessary to engage an LCA practitioner at this stage, as LCA tools for
architects may not have supplier-specific capabilities.
Life Cycle Management (LCM)
LCM is a framework that utilizes methods like Life Cycle Assessment
and Life Cycle Costing (LCC) to support decisions leading to
sustainable development. LCM has been defined by the SETAC
Working Group as “a flexible integrated framework of concepts,
techniques and procedures to address environmental, economic,
technological and social aspects of products and organizations to
achieve continuous environmental improvement from a Life Cycle
perspective”. A Life Cycle Management (LCM) approach can form the
basis of an effective business strategy by providing a framework for
improving the performance of an organization and its respective
products and services.
Life Cycle Costing (LCC)
LCC provides decision support in selection of a building system or
whole-building design based on its financial benefits, as opposed to
LCA, in which a decision is based on the environmental benefits of a
system or design. LCC provides a basis for contrasting initial
investments with future costs over a specified period of time. The
future costs are discounted back in time to make economic
comparisons between different alternative strategies. LCC involves
the systematic consideration of all relevant costs and revenues
associated with the acquisition and ownership of an asset. In the
context of buildings, this consists of initial capital cost, occupation
costs, operating costs, and the costs incurred or benefited from its
disposal. An LCC analysis is a data-intensive process, and the final
outcome is highly dependent on the accessibility, quality, and
accuracy of input data.
Life Cycle Energy Analysis (LCEA)
Life Cycle Energy Analysis, also referred to as Life Cycle Energy
Assessment, is an abbreviated form of LCA that uses energy as the
only measure of environmental impact. This helps in choosing energy
efficient materials, systems, and processes for the life cycle of
buildings.
Carbon Accounting
Carbon accounting is the process by which CO2 emissions from fossil

A Guide to Life Cycle Assessment of Buildings
20
Material
Product
Building
Industry
LCI
Database
fuel combustion are calculated. Carbon emissions factors are
expressed in many forms. It can either be expressed as a mass of CO2
or only as the mass of carbon contained in the CO2, and may be
expressed in any mass units. In case of buildings, carbon accounting
would consider CO2 emissions from all life stages.
Life Cycle Assessment in the Building Industry
The LCA methodology as it relates to the building industry can be
pictured as operating at one of four levels: material, product,
building, or industry, as shown in the diagram below. Each larger
level builds from the level below, and expands from the material
kernel.
Material Level
At its core, process-based LCA is defined at the material level.
It is not likely that an architect or any building industry consultant
would be called on to produce material-level LCI data. This
information is calculated by process chemists, chemical engineers,
and associated specialists and submitted for inclusion in various LCI
databases. There is some direct use of material-level LCI data by
building professionals however.
Product Level
At the product level, an LCA is calculated as a collection of materials,
which are assembled into a final (or intermediate) product. A
quantity takeoff of the product is completed, and the emissions from
LCA in the building industry can be thought of as
operating at one of four levels. At the material and
product level, architects are likely to be consumers of
LCA information, that is, they may use this information
to guide in their material and product selection
process. At the building level, architects may
themselves be the LCA practitioners, using building-
specific LCA tools to create LCAs that characterize the
environmental footprint of proposed projects, either
for the purpose of meeting regulatory requirements
(e.g., to stay below a specified impact threshold) or as
part of an iterative design methodology that seeks to
minimize the environmental impact of a project. LCAs
created at the industry level are more likely to be of
use to policy makers and planners.

A Guide to Life Cycle Assessment of Buildings
21
each component of the products are summed. To complete a
product LCA, a thorough knowledge of the source and quantities of
materials and the manufacturing processes of the finished product
are required. General-purpose LCA software, such as Gabi,
Boustead, or SimaPro is usually used to complete a product LCA.
There is emerging an increasing quantity of product-level LCA data
useful to architects. This is especially true in areas where products
can clearly be compared on a one-to-one basis or in LCA terminology,
where the functional unit for a product can be clearly delineated.
Building Level
Building LCA, or whole-building LCA is a product LCA where the
product is the building. In this case, the architect can be the LCA
expert, as the architect understands how the building is constructed,
how building materials and products flow to the jobsite, and how the
building is going to be operated over time.
Industry Level
At the building industry level, the Economic Input-Output (EIO) based
LCA method is probably the best tool for completing an
industry/neighborhood LCA. Instead of completing a process-based
LCA of every building in the portfolio—not a realistic approach—an
LCA at the building industry scale is completed by examining
industrial production and economic output data. The EIO-LCA
method has been used in the building industry to quantify the
impacts of cement and steel production, suburban sprawl and urban
densification, and changes in land use, for example.
Again, it is clear that LCA at this industry-wide scale is not actionable
by a practicing architect. Rather, it is at the smaller scales—material,
product, and building—that the LCA becomes useful to the architect.
LCA and the Design Process
At what stages of the design process can LCA be useful?

A Guide to Life Cycle Assessment of Buildings
22
Pre-Design Stage
During this stage, LCA can help define the environmental goals of a
project. LCA could be used to make decisions regarding the building
footprint among several options. The basic decisions for choosing a
structural system can also be based on LCA. Trade-offs between
impacts from manufacturing phase and operational phase can be
evaluated to select assembly types.
Schematic Design Stage
Choices regarding selection of building products and assemblies can
be made with the help of LCA. Energy conservation measures can be
assessed for their environmental burdens and an informed decision
can be facilitated by the use of LCA.
Design Development Stage
In the design development stage, LCA can help evaluate the life-long
impacts of proposed lighting and HVAC systems. The most crucial
stages in a system’s life can be identified in terms of environmental
impact, and appropriate modifications to the system design can be
proposed. Material finishes can also be compared with the help of
LCA results, and the right choices can be made.
LCA is applicable at each of the three design stages; however, the stage of performance is important defines the tool to be used and the types of impacts evaluated.

A Guide to Life Cycle Assessment of Buildings
23
Challenges in the Use of LCA
Although LCA is doubtless the best tool for analyzing the
environmental impact of product or project, the methodology and
underlying data are still being developed. LCA is a complex method
heavily relying on the availability and completeness of data (LCI) and
methodologies for tabulating material use within the LCA tools.
Table 1. Typical Design Activities and Tasks Accomplished
(Activities in “red” indicate those where input from and LCA is clearly relevant.)

A Guide to Life Cycle Assessment of Buildings
24
State of LCA Tools Four LCA tools are commonly used in the U.S. and are linked to
domestic data sources.
1. ATHENA® Impact Estimator
2. ATHENA® EcoCalculator
3. BEES®
4. EIO-LCA
Another issue that needs resolving for
whole-building LCA is the
development of benchmarks.
Benchmarks are needed for
comparisons among projects
performance. Benchmarking can be
performed by project comparisons in:
Past Performance: comparing current versus historical data
Industry Average: comparing to an established performance metric
Best in Class: marking against the best in the industry and not the average
Best Practices: qualitatively comparing against certain, established practices considered to be the industry best
Four primary areas present
challenges to architects and
LCA practitioners in the
performance of whole-
building LCAs.
1. Data Collection 2. Data Quality 3. Impact Assessment
Methods 4. Weighting of Impact
Scores

A Guide to Life Cycle Assessment of Buildings
25
Twelve additional tools are available in other countries.
1. EQUER
2. LCAid™
3. Eco-Quantum
4. LISA
5. Envest
6. LCAit
7. PEMS
8. TEAM™
9. Umberto
10. SIB LCA
11. Boustead
12. SimaPro
13. GaBi
Configuration of an LCA Tool
An LCA tool is environmental modeling software that develops and
presents life cycle inventory (LCI) and perhaps life cycle impact
assessment (LCIA) results through a rigorous analytical process that
adheres closely to relevant ISO standards and other accepted LCA
guidelines.
The most basic LCA tool takes inputs in the form of material take-offs
(in area or volume) and converts it into mass. Then it attaches this
mass value to the LCI data available from an LCI database and other
sources. This step results in quantities of inputs and outputs of a
product system. The inputs and outputs may include the use of
resources and releases to air, water, and land associated with the
system.
Important Questions to
Consider When Choosing a Tool
1. What is the configuration of
the tool? Does it embed a
LCI database and impact
assessment method within
or are these two required
separately?
2. What type of tool is it?
Material/Assembly/Whole-
Building LCA tool.
3. What life-cycle stages are
accounted for in the tool?
4. What is the level of
expertise required for using
the tool?
5. What inputs are required?
What is the method of
input?
6. What are the outputs
obtained from the tool?
What are the options to
view the outcome/results?
7. How capable is the tool in
terms of interoperability?
Will it accept databases from
other sources? Are the
outcomes of the tool
compatible with other
analysis and documentation
tools?
8. What kind and number of
building assemblies and
materials that can be
evaluated by the tool?
9. What impact categories can
be evaluated if the tool has
an impact assessment model
embedded within?
10. Does the tool provide
normalized results?
11. What is the latest version of
the tool?
12. How much does the tool
cost?

A Guide to Life Cycle Assessment of Buildings
26
Basic configuration of a typical whole-building LCA tool: takes inputs in the
form of material take-offs (in area or volume) and converts it into mass.
Then it attaches this mass value to the LCI data available from an LCI
database and other sources. This step results in quantities of inputs and
outputs of a product system. The inputs and outputs may include the use of
resources and releases to air, water, and land associated with the system.
Classification of Tools
LCA tools can be classified based on their ability to analyze building
systems (for building-specific tools) and the required user skill to use
the tools.
Based on different levels of LCA application
For tools that focus on the building industry, there are three main
types of LCA tools, although some tools may have characteristics of
more than one class:
1. Building product tools 2. Building assembly tools 3. Whole-building LCA tools.
LCA Model
(Boustead, SimaPro)
LCI Database (US LCI, EcoInvent)
Normalization
LCIA Method
(Eco-indicator 99, TRACI)
Weighting
User Interface
Input (bill of
quantities)
Output (emissions to air, Acidification
Potential etc.)
Whole Building LCA Tool
Commonly Used US LCA Tools
1. ATHENA® Impact Estimator
Allows user to evaluate whole buildings and assemblies
Assemblies include foundations, walls, floors and roofs, columns, and beams
Provides full inventory of natural resources, energy, water usage, and emissions to air, water, and land
Indicates implications of different material mixes and design options
Considers trade-offs among the various environmental effects
http://www.athenasmi.org/tools/ecoCalculator/index.html
2. BEES® (Building for Environmental and Economic Sustainability)
Provides product-to-product comparisons on basis of environmental and economic performance
Allows users to apply weighting factors selectively to environmental and economic impact and then weigh various environmental factors
http://www.bfrl.nist.gov/oae/software/BEES/bees.html
3. EIO-LCA (Economic Input-Output LCA)
Economic input-output LCA-based tool (the other tools are process-based LCA tools)
Provides guidance on the relative impacts of different types of products, materials, services, or industries with respect to resource use and emissions throughout the supply chain
Available for various national and state economies
Generally not applicable to completing and LCA for a

A Guide to Life Cycle Assessment of Buildings
27
State of Practice
Literature Case Study Reviews
In this study, we review eight whole-building case studies. Four of
the case studies are real-world projects and four are research paper
studies. Each of the case studies presents its own scenario of use of
whole-building LCA and revealed practical issues associated with
conducting an LCA.
LCA Tools based on application
LCA Tools based on user

A Guide to Life Cycle Assessment of Buildings
28
The case studes were:
Real Projects
Case Study 1: New Jersey Meadowlands Commission (NJMC)
Center for Environmental and Scientific Education Building, New
Jersey, U.S.
Case Study 2: Stadium Australia, New South Wales, Australia
Case Study 3: Emeryville Resourceful Building, California, USA
Case Study 4: Alicia Moreau De Justo School, Mendoza,
Argentina
Research Paper Studies
Case study 5: Three Variants of a House, Switzerland
Case Study 6: Commercial Office, Thailand
Case Study 7: Two variants of a House, USA
Case Study 8: Office Building, USA
These case studies are thoroughly reviewed in the main body of the
full paper.
LCA from an Architect’s Perspective
To understand LCA from an architect’s perspective, architects from
seven architecture firms agreed to interviews, ranging from small to
large firms. Some of these firms focused on sustainable practices
only.
The interview results are thoroughly outlined in the main body of the
full paper.
It was generally observed that large firms were more inclined to
sustainable practices as compared to small firms. Integration of LCA
in the design process also showed a similar trend. This was primarily
due to the fact that LCA is a time and money intensive exercise. Large
firms were able to afford it while smalls were not. Moreover, most of
these firms that used LCA in their projects had hired an LCA expert to
carry out the LCA study. This could be because of one of two reasons:
(1) architects are not completely aware of simplified whole-building
LCA tools or (2) architects do not have faith in these simplified
whole-building LCA tools. One of the major obstacles that prevented
the use of LCA in practice is the overwhelming information that
architects obtain from the LCA experts. Since an LCA may result in
environmental impact scores spread over different categories, it
Questions Addressed in Case
Study Reviews
1. Why a particular study was
conducted? The motive
behind the study.
2. What specific aspect of the
building project was
evaluated? Goal Definition.
3. During which project stage
was LCA introduced in the
project? (only in case of real
projects)
4. How was the study scoped?
5. Which stages of building life-
cycle are included in the
study?
6. How were the data
collected?
7. What were the assumptions
made for data not available?
8. What LCA tools, LCI
database, and LCIA method
were used in a specific case?
9. Which team members were
involved in the LCA process?
A Guide to Life Cycle Assessment of Buildings
29
becomes difficult for the architects to rate which category is more
important than the other. Another obstacle is the lack of incentives
at present for the use of LCA. When asked about the kind of
incentives that would instigate the use of LCA in practice, a range of
responses was received. Some believed that monetary incentives in
terms of tax benefits and subsidies on the purchase of green
products would help whereas others believed that if a range of
projects using LCA were showcased and case studies compiled, it
would be a great incentive for other firms to adopt the LCA
methodology. In terms of benefits of LCA, one interesting response
suggested that since LCA is not a common practice at present, it
could give an architecture firm an edge over the others and increase
the market value of the firm. Responses regarding possible
applications of LCA ranged from selecting a building product to
selecting consultants and product vendors. A firm employing LCA in a
project would prefer consultants and vendors who have an
understanding of the LCA methodology.
Thus, we concluded that although LCA at present is not an essential
component of most of the architecture practices, a general
understanding of the methodology is critical for architects to
understand the process and results of LCA.
The target audiences in the building industry for LCA are mostly
architects, product manufacturers, and sustainability consultants. A
general contractor can also take the responsibility of conducting an
LCA study for the project in some situations. Other stakeholders,
such as owners, building occupant, and other consultants, are
indirectly affected by the use of LCA in practice.
CONDUCTING AN LCA—EXAMPLE An LCA was conducted on a small institutional design project (Big
Nerd Range—BNR) using the ATHENA® Impact Estimator tool. The
study demonstrates how an LCA can be performed in the early
design phase by architects using simplified LCA tools.
The ATHENA® Impact Estimator is a tool for general users that can be
used for whole-building LCA analysis. It is appropriate to be
employed during the schematic design stage when basic building
plans and sections are available and preliminary material assignment
is accomplished. Thus, it has been used in this study to get a
snapshot of the environmental footprint of the Training Center

A Guide to Life Cycle Assessment of Buildings
30
(Building A) for BNR. The LCA study is thoroughly discussed in the
main body of the full paper.
The facility used to conduct the example LCA is a proposed training
facility that is being designed for software professionals and located
in the metro Atlanta area. The project is in the construction
documents stage at present. The facility will comprise three building
blocks (a training center and two residential blocks for trainees)
spread over a contoured site measuring 6.7 acres. For the purpose of
this study, an LCA was conducted only for the training center also
referred to as Building A.
The training center (Building A) is an 8,230 ft2 building comprising
two floors. The ground floor consists of a dining area, kitchen,
gymnasium, and restrooms. The first floor consists of a classroom,
recreation space, office, and store. The structure is primarily wood-
frame construction. The floor plans of the building can be found in
Appendix A of the main document. Building assemblies used in the
training center are described in the sidebar.
Description of Building Assemblies for Building A
Assem-bly Type
Description
Foun-dation
Cast-in-place concrete retaining walls
Floors Light frame wood truss with ¾” plywood base finish. Carpet, rubber, cork tile, and ceramic tiles have been used for the floor finishes
Exterior Walls
2” x 6” wood stud wall with brick cladding + plywood sheathing + R-19 batt insulation + 5/8” gypsum board + latex based paint
Interior Walls
2” x 6” wood stud wall with 5/8” gypsum board + latex based paint
Roof Standing seam metal roof with prefabricated wood scissor truss + plywood roof decking + R-30 batt insulation
Doors Hollow core metal doors, solid core wood doors, and French doors
Windows Aluminum-clad wood window frame with double low-e glazing
A Guide to Life Cycle Assessment of Buildings
31
Goal and Scope Definition
Goal: The goal of the study is to evaluate the overall environmental
impact of Building A to help in identifying the life-cycle stages and
assemblies causing maximum impact. The study is focused on
determining the inventory analysis results in terms of energy use,
resource use and emissions, and impact assessment results available
in terms of impact categories.
Scope: The scope of the LCA is limited to assessing global warming
potential, acidification potential, and ozone depletion potential.
These categories have been chosen as being common to the other
case studies reviewed in this guide. Having common categories
should facilitate easy comparison and benchmarking of the LCA
results of this study.
Functional Unit: Provision of the training center for 60 years. For
comparison purposes, the results have also been normalized on a
per-square-foot-per-year basis.
Building Lifespan: A 60-year building life has been estimated by the
structural engineer based on type of structure, assemblies, and
climatic conditions.
System Boundary: The user is not required to define the system
boundary for the LCA, as this information is embedded inside the
ATHENA tool.
Tools used: ATHENA® Impact Estimator for LCA analysis, eQUEST for
energy calculation, and MS-Excel for tabulating the quantities.
Required Inputs
Basic information regarding
the training center area,
location, and expected life
were entered in the
ATHENA® tool to set-up the
project. The user is only
required to specify the
building assembly
configuration and area to
calculate the inventory
analysis results. The
inventory analysis process is
pre-designed within the
ATHENA® model with
standard assumptions.
The following building
assembly types can be
configured within the
ATHENA® tool.
Foundations
Walls
Floors
Roof
A table of assembly
dimensions was prepared for
each assembly type for easy
data input. These dimensions
were obtained from the
architectural drawings.
Although the operational
energy input is optional in
ATHENA, it was considered
essential to include it in this
study. Inclusion of
operational energy facilitates
comparison of embodied and
operational energy during a
building’s life cycle. The
energy calculation was done
using eQUEST hourly energy-
simulation software.

A Guide to Life Cycle Assessment of Buildings
32
Output
Both inventory analysis as well
as impact assessment results
can be obtained from the
Impact Estimator. Since the goal
of the study is to identify life
cycle stages and assemblies
causing maximum impact, the
following reports were
generated in ATHENA® Impact
Estimator.
Graphs for Absolute
Values – by Life-Cycle
Stages
Tables for Absolute
Values – by Assembly
Group
Table for Summary
Measures – by Life-Cycle
Stages
Graphs for Summary
Measures – by Assembly
Types
Comparison Graphs –
BNR and R2000 House
Design
LC Results
Annual Energy Consumption: The annual energy consumption for
Building A was estimated to be 132.74 x 10³ kWh. Its energy
intensity, thus, equals 17.68 kWh/ft2, making Building A 27 percent
more energy-efficient than a standard educational facility[1] due to
the use of high-performance building systems.
Energy Consumption by Life-Cycle Stages: Coal (2.62 x 10⁶ kg) and
natural gas (3.34 x 10⁵ m3) are the most used resources during the
training center’s life-cycle (see figure below). The operations stage is
primarily responsible for this use. Other significant use of resources
are water (4.33 x 10⁵ L), coarse aggregate (1.16 x 10⁵ kg), fine
aggregate (9.64 x 10⁴ kg), and clay and shale (7.64 x 10⁴ kg), owning
to their use in the manufacturing stage.
Energy consumption is also dominated by the operations stage with
coal, nuclear, and natural gas as the major contributors. Maximum
emissions to air, water, and land are during the operations stage.
Carbon dioxide, sulfur dioxide, methane, and particulate matter
contribute significantly to air emissions whereas emissions to water
are primarily dissolved solids (4.94 x 10¹⁰ mg), chloride (4.06 x 10¹⁰
mg), and sodium ion (1.13 x 10¹⁰ mg). Land emissions are mainly
composed of other solid waste (6.12 x 10⁵ kg) and concrete solid
waste (2.20 x 10⁴ kg).

A Guide to Life Cycle Assessment of Buildings
33
Output
The results for inventory
analysis are consistent. By life-
cycle stages, operation stage
emerges to be the most
dominant, and, by assembly
group, wall assemblies have
been found to cause the
maximum emissions and
resource use in case of BNR. The
next step should be to identify
alternatives that would
potentially reduce the
environmental burden caused
during the operations stage and
from wall assemblies. Another
LCA run should be carried out
using these alternatives to
make a more informed decision.
Energy Consumption by Assembly Groups: Viewing inventory analysis results according to assembly groups helps in identifying assemblies consuming maximum energy and causing greatest emissions. The BNR LCA analysis showed that the walls account for more than 50 percent of the total energy use. Roofs are the second largest consumer of energy in terms of their manufacturing, construction, maintenance, and end-of-life activities. Having identified these hot spots, alternative assemblies can be tested for their walls and roof to choose the option with the lowest energy consumption. In terms of resource use, foundations consume 73 percent of the total coarse aggregate, whereas the walls and roof together consume 67 percent of the total water used in the life-cycle of the training center (excluding water consumed during operations). Wall assemblies are responsible for most of the emissions to air, water, and land: emissions of carbon dioxide, sulfur dioxide, methane, and particulate matters for air; concrete and other solid waste in the case of emissions to land; and chloride, sodium, and dissolved salts in the case of emissions to water.

A Guide to Life Cycle Assessment of Buildings
34
Impact Assessment
ATHENA® Impact Estimator presents impact assessment results in
terms of “summary measures” format. Three summary measures,
global warming potential (GWP), acidification potential (AP), and
ozone depletion potential (ODP) have been evaluated in this study.
The impact assessment result by life-cycle stages shows that the
operations stage dominates GWP and AP whereas ODP is most
significant in the manufacturing stage.
Life-Cycle Stage Impact Assessment for BNR. The y-axis represents the totally impact for a given impact category.
The wall assemblies have the highest impact on all the three evaluated impact categories.
Interpretation The results from inventory analysis and impact assessment either
compared one life-cycle stage with the other or one assembly to
another. This helped in identifying the hot-spots within the training
center’s life-cycle. To understand the overall performance of the
training center, it is essential to compare it with a benchmark. Since
standard benchmarks have not been published by any reliable

A Guide to Life Cycle Assessment of Buildings
35
sources, past case studies’ results were used to rate the performance
of BNR. The following case studies were used for comparison.
R2000 House Design - Toronto (Sample Projects from
ATHENA® Impact Estimator Tool)
NJMC Center for Environmental and Scientific Education
(Chapter 3 – Case Study 1 of this guide)
Wood Frame House – Tucson (Chapter 3 – Case Study 6 of
this guide)
Comparison of Impact Assessment Results of BNR Training Center with Other Case Studies
GWP
(kg CO2 equiv. per sf per
year)
AP
(Moles of H+ eqiv. per
sf per year)
ODP
(g CFC-11 per sf per
year)
BNR Training Center 11.85 4.27 4.76 x 10⁻⁶
R2000 House Design 3.08 1.31 3.20 x 10⁻⁶
NJMC Building 3.12 - 444.21 x 10⁻⁶
Wood Frame House -
Tucson
7.33 - 529.90 x 10⁻⁶
Table presents impact assessment results normalized on per square foot per year basis.
Acidification by Life-Cycle Stages (per sf)
GWP: The GWP value for BNR Training Center is the highest
compared to other case studies. Since GWP can be considered a
function of energy use, this high GWP value could be due to a
difference in energy use during building life-cycle and a variation
in fuel mix used to produce energy in these four cases.
Acidification Potential: When compared to R2000 House, the AP
value for BNR is higher.
Ozone Depletion Potential (ODP): The values for ODP vary by a

A Guide to Life Cycle Assessment of Buildings
36
large margin across different case studies. It can be observed that
the values for BNR and R2000 house fall under a close range. The
ODP value for BNR is reasonably more than R2000 house in the
manufacturing stage. Thus, the difference in the overall value for
ODP can primarily be attributed to the manufacturing stage.
GUIDELINES TO INTEGRATE LCA IN BUILDING
DESIGN
Exploring the Scenarios of Use of LCA
Any building-related LCA is defined by four variables
Life-cycle stages to be included in analysis
Building systems to be studied
Type of expected results from either the Life Cycle Inventory
(LCI) Analysis or the Life Cycle Impact Assessment (LCIA)
Project phase at which the LCA analysis is conducted.
Each variable can have several possible values, and various
combinations of these variables can lead to different scenarios of use
for LCA. Contributors to this guide calculated 84 different possible
scenarios as a result of the combination of these variables.
Guidelines to Choose an LCA tool
The choice of an LCA tool depends on the scenario of use of LCA.
Seven commonly encountered scenarios, each with a rationale for
tool selection, are thoroughly discussed in the guide.
Scenario 1: LCIA Results of
Whole-Building for All Life-Cycle
Stages to Optimize a Building
Design during Preliminary
Design Stage
A common step in every building design process is evaluation of
several alternatives with the goal of selecting the most
environmentally friendly option. The LCA analysis to achieve this
goal is defined by the four variables: 1) All Life Cycle Stages, 2) Whole
Building Systems, 3) All Categories of LCIA Results, and 4) LCA
performed in preliminary design phase. Since the LCA is being
conducted in the Preliminary Stage, the project and assembly
information will be minimal; therefore, the tool must allow for the
input of approximate information. Also it must be able to analyze
the whole building; therefore, the tool must have the LCIA method
Any building-related LCA
analysis is defined by four
variables:
1. Life-cycle stages to be
included in the analysis
2. Building systems to be
studied
3. Type of expected results
from either Life Cycle
Inventory (LCI) Analysis
or Life Cycle Impact
Assessment (LCIA)
4. Project phase at which
the LCA analysis is
conducted
The opportunities for use of
LCA are numerous.

A Guide to Life Cycle Assessment of Buildings
37
embedded. Since the study goal is the assessment of all building life-
cycle stages, the tool must consider all life-cycle stages. Based on
these criteria, Envest is an appropriate tool.
Scenario 2: LCIA Results of
Whole-Building for All Life-Cycle
Stages to Evaluate a Building
Design during Detailed Design
Stage
At the detail design stage, a design team may want to know how
precisely their proposed design is performing better than the
baseline cases. The LCA analysis to achieve this goal is defined by
the four variables: 1) All Life Cycle Stages, 2) Whole Building Systems,
3) All Categories of LCIA Results, and 4) LCA performed in the
detailed design phase. Since this LCA is to be performed in the
second stage, the quality of information is more precise; therefore, a
more precise quantification can be made. The suitable tool will be
capable of assessing details for assemblies and systems, such as the
ATHENA® Impact Estimator.
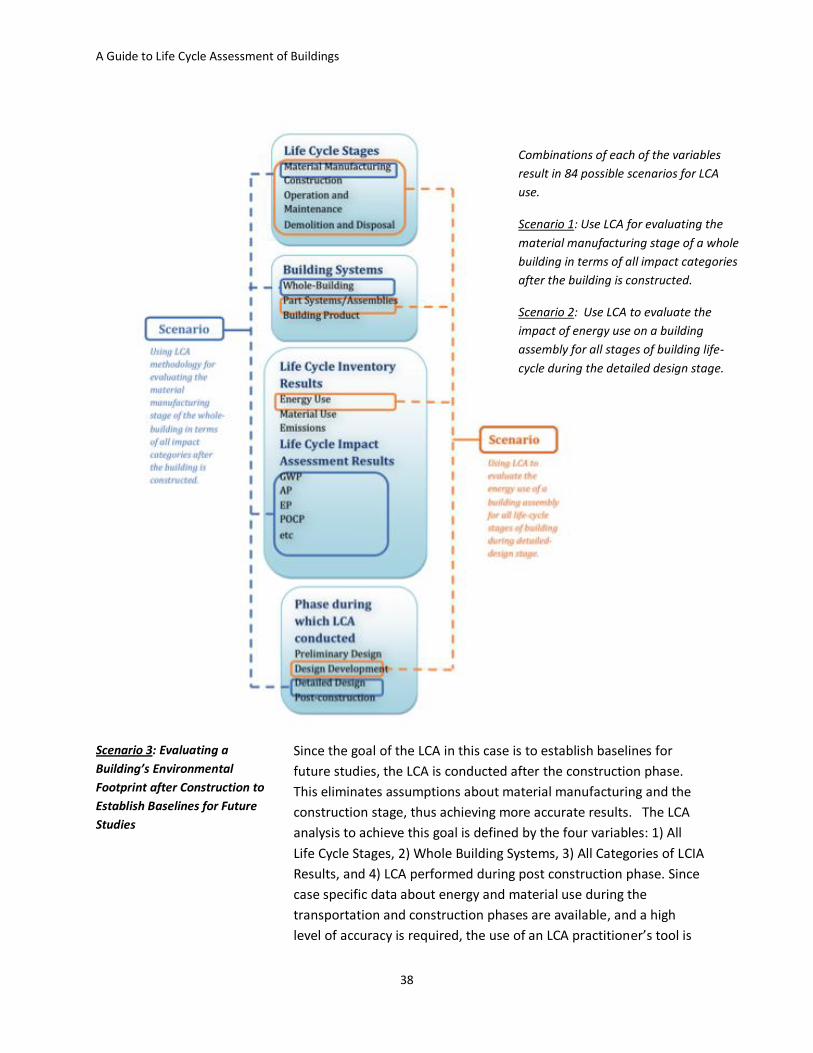
A Guide to Life Cycle Assessment of Buildings
38
Scenario 3: Evaluating a
Building’s Environmental
Footprint after Construction to
Establish Baselines for Future
Studies
Since the goal of the LCA in this case is to establish baselines for
future studies, the LCA is conducted after the construction phase.
This eliminates assumptions about material manufacturing and the
construction stage, thus achieving more accurate results. The LCA
analysis to achieve this goal is defined by the four variables: 1) All
Life Cycle Stages, 2) Whole Building Systems, 3) All Categories of LCIA
Results, and 4) LCA performed during post construction phase. Since
case specific data about energy and material use during the
transportation and construction phases are available, and a high
level of accuracy is required, the use of an LCA practitioner’s tool is
Combinations of each of the variables
result in 84 possible scenarios for LCA
use.
Scenario 1: Use LCA for evaluating the
material manufacturing stage of a whole
building in terms of all impact categories
after the building is constructed.
Scenario 2: Use LCA to evaluate the
impact of energy use on a building
assembly for all stages of building life-
cycle during the detailed design stage.

A Guide to Life Cycle Assessment of Buildings
39
warranted, such as SimaPro.
Scenario 4: Evaluating the
Impact of One Assembly over
the Life-Cycle of Building to Help
in Selection of Assembly
During the design development stage, choice among competing
assemblies are made. This goal can be met by defining LCA study by
the four variables: 1) All Life Cycle Stages, 2) One Building Assembly,
3) All Categories of LCIA Results, and 4) LCA performed during design
development phase. This scenario focuses on only one assembly for
its impact during the building life-cycle, thus an assembly LCA can be
used that accounts for all life-cycle states and shows results for
different impact categories. ATHENA® EcoCalculator could be used,
but it does not account for the building operation phase; therefore,
the impact due to the operation phase will have to be added
externally. ATHENA® Impact Estimator will fulfill all needs for this
scenario.
Scenario 5: Evaluating a Specific
Impact for the Whole Building
The goal of the LCA may be only to quantify and mitigate a specific
impact like global warming potential (GWP) for the whole building.
This goal can be met by defining LCA study by the four variables: 1)
All Life Cycle Stages, 2) Whole Building Systems, 3) Global Warming
Potential LCIA Results, and 4) LCA performed during
preliminary/design development phase. Since the evaluation impact
category is specified, a tool that presents results in that category is
required. The expected accuracy of the results needs to be clearly
defined prior to tool selection—either a simplified LCA tool or a
detailed LCA tool. EcoCalculator is an appropriate simplified tool.
Operational energy needs to be externally calculated with this tool.
EQUER is an appropriate detailed tool.
Scenario 6: Evaluating the
Impact Using a Product during
the Maintenance Stage of a
Building Life-Cycle
The LCA study may be conducted to help design a facility
housekeeping program. Since this is a recurring activity, the
products selection could significantly affect a building’s life-cycle
impact. This goal can be met by defining the LCA study by the four
variables: 1) Operations and Maintenance Life Cycle Stage, 2)
Product Building Systems, 3) All LCIA Results, and 4) LCA performed
during post construction phase. Since the goal is only to study the
impact of a building product on the maintenance stage, a product
LCA tool should be used that shows impact distribution among
different ranges of life. BEES® may be an appropriate tool if the
specific product is available in the BEES® product list. If not, a
detailed LCA tool will be required.

A Guide to Life Cycle Assessment of Buildings
40
Scenario 7: Calculating the
Environmental Payback of a
Green Technology
Green buildings use high performance systems and assemblies for
increased energy efficiency during the operations phase. The study
goal is to weigh the environmental impacts of a green technology
during different phases of design. Additionally, how are the material
impacts in life-cycle phases mitigated by the energy saved or
produced during the operations phase. This goal can be met by
defining LCA study by the four variables: 1) All Life Cycle Stages, 2)
Green Technology (Assembly - Building Systems), 3) All LCIA Results,
and 4) LCA performed during design development/detail phase. Since
a green technology is being evaluated, the tool options are very
limited, since the inventory data for innovative technologies have not
been incorporated into the LCI databases. A detailed LCA tool is
required to model the life of the green technology. Negative values
of impacts due to energy saved or produced from use of the
technology should be plotted against added impacts during the
production and maintenance stage. The result is the environmental
payback of the technology. Tools such as GaBi, Boustead, and
SimaPro may be used to model this type of study.
Other Criteria to Consider When
Selecting Tools
Design/project stage
Availability of information about building materials and assemblies
Availabiity of building energy analysis results
Time constraints
User skills
Accuracy of required output
When selecting a tool, the features must be matched to the specific
requirements and project goals. The table below compares the
features in the two popular whole-building LCA tools ATHENA®
Impact Estimator (IE) and LCAid™.

A Guide to Life Cycle Assessment of Buildings
41
Features ATHENA® IE LCAid™
1 LCA Tool Type Whole Building LCA Tool Whole Building LCA Tool
2 Acceptable Building
Type
Industrial, Institutional, Commercial,
Residential
All Types
3 Acceptable Building
Phase
New Construction and Major
Renovation
New Construction and Existing
Buildings
4 Target Users Architects, engineers, designers,
environmental consultants
Architects, engineers, students,
LCA practitioners and evaluators
5 Required User Skills None None
6 LCI Data ATHENA® database based on
Canadian and North American
Region
DPWS database based specific to
Australia. Can import data from
other databases like Boustead
(UK), SimaPro(NL)
7 Available Building
Material/Assembly
Combinations
1200 Assemblies 400+ Building Materials
8 Units SI and Imperial -
9 Life Cycle Stages 1. Material Extraction and
Manufacturing
2. Related Transport
3. On-site Construction
4. Operation (energy only) and
Maintenance
5. Demolition and Disposal
1. Material Extraction and
Manufacturing
2. Related Transport
3. On-site Construction
4. Operation (energy and water)
and Maintenance
5. Demolition and Disposal
10 Impact Categories 1. Embodied primary energy use
2. Acidification Potential
3. Global Warming Potential
4. Human Health Respiratory
Effects Potential
5. Ozone Depletion Potential
6. Smog Potential
7. Aquatic Eutrophication
Potential
8. Weighted Resource Use
1. Life Cycle embodied energy
2. Acidification Potential
3. Life Cycle Green House Gas
Emissions
4. Carcinogenesis
5. Ozone depletion
6. Summer/Winter smog
7. Nutriphication
8. Heavy metals
9. Solid Wastes
10. Water consumption
11. Primary fuels
11 Input Method Manual Entry Material Quantities can be
imported from 3D Models:
CAD(.dwf), ECOTECT (.eco/.zon).
All other, manual entry
Features ATHENA® IE LCAid™
12 Input 1. Location 1. Climate Zone
Guidelines to Conduct an LCA Process
Once the study goal is fixed and the appropriate tool selected, key
issues during each step of the LCA process need to be indentified,
particularly when a detailed LCA tool is used. When a simplified LCA
tool is used, the user still has to be aware of the way that the tool
deals with the key issues.
Features comparison of two popular
whole-building LCA tools. Features list
presents the recommended list of tool
features for the performance of whole-
building LCA.

A Guide to Life Cycle Assessment of Buildings
42
Key issues to be addressed during each step of an LCA process. Awareness of these
issues is critical when conducting a detailed LCA. When a simplified tool is used, it is
essential to be aware of the way that the LCA tool deals with these key issues.

A Guide to Life Cycle Assessment of Buildings
43
1 LIFE CYCLE ASSESSMENT: INTRODUCTION AND TERMINOLOGY
Background
This document describes the process of life cycle assessment, or LCA, as it is applied to building design and construction. Tools like energy modeling assist in predicting and, through good design, reducing the operational energy in buildings. Life Cycle Assessment (LCA) is a tool that allows architects and other building professionals to understand the energy use and other environmental impacts associated with all life cycle phases of the building: procurement, construction, operation, and decommissioning.
Architects have embraced the premise that it is their professional obligation to lead the greening of the building industry. Many architects have expanded their practices to include studios that only work on green buildings or that complete green energy audits for their clients. Sustainable design in the practice of architecture has gone through many phases. Through history, vernacular building forms world over were constructed of local materials, tailored to respond to prevailing climatic conditions, and configured to take advantage of natural ventilation. In the United States, climate-aware designs like the “dogtrot house” emerged as sustainable solutions for their specific regional climates. Early architectural and technological solutions to building sustainability were demonstrated in Wright's Solar Hemicycle house and in the MIT Solar Houses. Significant fundamental research in the US Department of Energy laboratories, which led to widespread use of building energy modeling, and applied research by the US Green Building Council, which has led to the development of LEED™, one of the major green building guidelines, are indications of progress in the green building movement. Regional efforts promoted by organizations such as the New Buildings Institute and Southface demonstrate the widespread impact of sustainability research and implementation.
This leads us to a current snapshot of green building design. Today, state building codes and the model
codes on which they are based have adopted modest improvements in energy efficiency. Legislation on
the energy efficiency of buildings has been proposed and debated in both the US Senate and House of
Representatives at the time of this report that will require more aggressive energy efficiency
improvements, a promise around which the next generation of model codes is being developed,
including the International Green Construction Code (IgCC).
A significant number of new buildings’ owners are choosing to follow elective green-building scorecard and branding schemes such as Energy-Star, LEED, and Green Globes and highly progressive systems such as the Living Building Challenge. Combined with new codes aimed at

A Guide to Life Cycle Assessment of Buildings
44
energy efficiency, the industry has passed the tipping point for the promotion of green buildings, from special case and best practice to an initial approach for the industry for mainstreaming green construction practices in the building industry. The AIA, many other building industry associations, and major US cities have embraced auspicious targets for reducing the environmental impact and climate change potential of the country’s building stock—as embodied by programs such as Architecture 2030 Challenge, the AIA 2030 Commitment Program, and the US Conference of Mayors Pledge.
As part of their comprehensive national Energy Conservation and Improved Energy Efficiency policy, the
National Association of Governors (NGA) has adopted the promotion of carbon neutral new and
renovated buildings by 2030 as outlined by the AIA. Governor Chris Gregoire (D) from Washington
proposed the NGA policy change in July 2009. On May 8, 2009, she had signed carbon neutral legislation
in Washington State that was proposed by AIA Washington (based on AIA national model legislation),
then took that concept and convinced her colleagues in all 50 states to encourage each other to do the
same. This adoption by the nation’s governors follows the U.S. Conference of Mayors’ unanimous
adoption of the AIA’s carbon neutral building policy in 2006 and the National Association of Counties
announcing their support for the policy in 2007. (from AIA news release:
http://info.aia.org/aiarchitect/thisweek09/0724/0724n_nga.cfm)
The environmental impact of human actions is quite evident in the present day world. EPA’s
statistical summary published in 2004 [1] suggests that the building industry is a major contributor
to this impact. EPA’s analysis indicates the building industry’s share in various resource
consumption and environmental impact categories and their distribution amongst commercial and
residential building sectors.
Though the role of rating systems in the marketplace and the progress that they have made to mainstream the understanding of green architecture are laudable, rating systems are an incomplete approach to achieving truly high performance buildings. Scorecard approaches do

A Guide to Life Cycle Assessment of Buildings
45
not fit well and automatically within design practice. Credits and points do not provide design guidance and do not provide feedback on how well a given design decision is actually working—rather, they provide a specific list of options and do’s and don’ts to be applied during the design process. Inherent to the design process is comparative analysis among design options. Architects seek both 1) methods to answer specific design questions and make those comparative decisions on behalf of their clients and 2) aid to their understanding of the environmental impact of both the overall building and of particular design decisions.
Life Cycle Assessment is an emerging tool that promises to aid in architectural decision making. LCA was developed by industrial ecologists, chemists, and chemical engineers seeking to understand and reduce the impact of manufacturing and process chemistry. Today, LCA is being promoted as a tool for analyzing the environmental impact of buildings and making decisions to reduce these impacts.
The output of an LCA can be thought of as a wide-ranging environmental footprint of a building—including aspects such as energy use, global warming potential, habitat destruction, resource depletion, and toxic emissions. In the future, LCA will highlight those building components that cause the highest environmental impact, and whether the impact of a project is coming primarily from site selection or the ongoing operation of the building. The method allows the designer to assess tradeoffs in building design, such as those in selecting a steel or concrete frame or a clay masonry or stone veneer. These are the promises of LCA.
There exists, however, significant confusion about LCA and how it can be used in its current state.
Though one can complete an LCA on a building, there are few baseline metrics to allow for comparison
with other buildings. Rating systems and standards currently under development—such as LEED, Green
Globes, and ASHRAE/USGBC/IESDNA Standard 189—are beginning to incorporate Life Cycle Assessment.
The AIA has commissioned this document to aid practitioners’ understanding and adoption of the LCA
methodology.
Organization of the Document This document reviews the state-of-the art of Life Cycle Assessment in the building industry. The
document also reviews the state of practice and research. Because few practitioners are likely to
attempt an LCA without the use of software tools, the document reviews the tools currently available
and identifies likely scenarios for their use in the building design process. To illustrate examples of LCA,
case studies of LCA use in commercial and residential buildings are presented, for both built projects and
in conceptual works. Finally, the document provides guidelines for use of LCA in building projects based
on the questions being asked of the LCA and the phase in the design process in which the LCA is being
implemented.
History of LCA The LCA methodology dates back to 1960s, when concerns over the limited availability of raw materials
and energy resources led to new ways to account for energy use and the consequences of these uses.[2]
In the early 1990s, LCA was used for external purposes, such as marketing.[3] Its application broadened

A Guide to Life Cycle Assessment of Buildings
46
in the present decade into building materials, construction, chemicals, automobiles, and electronics.
This was primarily because of the formalization of LCA standards in the ISO 14000 series (1997 through
2002) and the launch of the Life Cycle Initiative, a combined effort by United Nations Environment
Programme (UNEP) and the Society of Environmental Toxicology and Chemistry (SETAC), in 2002.[2]
The principles provided by ISO standards and SETAC are well structured for industrial processes.
However, when applied to buildings, the following basic differences need to be considered[4]:
The useful life for a building is typically much longer than for industrial products
The unique character of every building project differs from the thousands of identical products in industrial systems
It is difficult to characterize the functional unit or boundary of analysis for a building, as compared as to an industrial product
These differences make it apparent that the guidelines used for industrial products cannot be borrowed
directly for use in buildings. Use of LCA for buildings requires a set of guiding principles that takes into
consideration the unique character of every building design, complexity in defining systems, and related
decisions made by the owner and design team.
Another major problem with LCA is that it is relatively new to the building industry. As in any developing
field, there is a great deal of confusion about LCA, which can inadvertently lead to misuse of LCA tools,
techniques, and supporting data.[5] Thus there is a need for a clear working definition of LCA and
related terminology to help build credibility for the methodology and make the building industry more
receptive to this new way of evaluating their work.
Definitions and Aspects of Life Cycle Assessment The LCA process is governed under ISO 14000, the series of international standards addressing
environmental management. According to International Standard ISO 14040,[6] LCA is a “compilation
and evaluation of the inputs, outputs and the potential environmental impacts of a product system
throughout its life cycle.”
The Code of Practice by the Society of Environmental Toxicology and Chemistry (SETAC) describes LCA as
“a process to evaluate the environmental burdens associated with a product, process, or activity by
identifying and quantifying energy and materials used and wastes released to the environment; to
assess the impact of those energy and materials used and releases to the environment; and to identify
and evaluate opportunities to affect environmental improvements.” [7] The Environmental Protection
Agency (EPA) refers to LCA as “a cradle-to-grave approach for assessing industrial systems that evaluates
all stages of a product’s life.” [2]
Variants of LCA
The scope of LCA can extend to various stages and processes in a product’s life. Depending on the
purpose of conducting the LCA, one of two primary means for conducting the LCA can be considered:
process-based LCA and economic input-output-based LCA. Within each variant, there exists a number of
options to be considered.

A Guide to Life Cycle Assessment of Buildings
47
Process-based LCA Method
In a process-based LCA, one itemizes the inputs (materials and energy resources) and the outputs
(emissions and wastes to the environment) for each step required to produce a product.[8] LCA
methods implemented in the building construction industry are based primarily on process-based LCA,
and thus this document focuses on this method.
Different types of process-based LCA methods are:
Cradle-to-Grave
Cradle-to-grave is the full Life Cycle Assessment from manufacture or “cradle” to use phase and disposal
phase, “grave.” An example would be to use process-based LCA to capture the impact of cellulose
insulation:
Tree → Paper → Cellulose insulation → Ceiling insulation in the building → Building demolition →
Insulation incinerated
Cradle-to-Gate
Cradle-to-gate is an assessment of a partial product life cycle from manufacture, “cradle,” to the factory
gate,i.e., before it is transported to the consumer. Cradle-to-gate assessments are sometimes the basis
for Environmental Product Declarations (EPDs). Used for buildings, this would only include the
manufacturing and, and perhaps, depending on how the LCA was carried out, the construction stage.
For building LCA tools based on assemblies, the starting point for the assessment might be a collection
of cradle-to-gate LCAs completed on major building systems, for example, curtain wall, roof systems,
load bearing frames, etc., which are then assembled into a complete cradle-to-grave assessment of the
entire building.
Cradle-to-Cradle
Cradle-to-cradle is a specific kind of cradle-to-grave assessment where the end-of-life disposal step for
the product is a recycling process. From the recycling process originate new, identical products or
different products. Due to the work of William McDonough,[9] the term cradle-to-cradle often implies
that the product under analysis is substantially recycled, thus reducing the impact of using the product
in the first place.
Gate-to-Gate
Gate-to-Gate is a partial LCA that examines only one value-added process in the entire production chain,
for example by evaluating the environmental impact due to the construction stage of a building.
Economic Input-Output Based LCA Method
The Economic Input-Output Life Cycle Assessment (EIO-LCA) method estimates the materials and energy
resources required for, and the environmental emissions resulting from, activities in a given
economy.[8] Unlike process-based LCA methods, which focus on examining a single process in detail,
input-output-based LCA methods consider an entire sector of the economy—all activities of all industry
sectors. Although such analysis gives a more holistic view of the impact of a process or product, it relies
on sector-level averages that may or may not appropriately represent a subset of the sector relevant to

A Guide to Life Cycle Assessment of Buildings
48
a particular product. In terms of the building industry, the EIO-LCA method is not an appropriate tool
for use in determining whether specific actions are environmentally beneficial or harmful within a given
project. Rather, the EIO-LCA method is better suited to track the overall impact of one aspect, e.g., the
use of fly ash in concrete, in the entire construction industry as a whole.
A graphical representation of the LCA process after DANTES[10]
Life Cycle Stages Every product or process goes through various phases or stages in its life. Each stage is composed of a
number of activities. For industrial products, these stages can be broadly defined as material acquisition,
manufacturing, use and maintenance, and end-of-life. In case of buildings, these stages are more fully
delineated as: materials manufacturing, construction, use and maintenance, and end of life.
Material Manufacturing
This stage includes removal of raw material from the earth, transportation of these materials to the
manufacturing location, manufacture of finished or intermediate materials, building product fabrication,
and packaging and distribution of building products.[6]

A Guide to Life Cycle Assessment of Buildings
49
Construction
This phase accounts for activities relating to actual construction of a building project. Typically, the
following activities are included in this stage: transportation of materials and products to the project
site, use of power tools and equipment during construction of the building, on-site fabrication, and
energy used for site work. Permanent impacts to the building site also fall into this stage, though these
impacts are fully considered in current LCA methods.
Use and Maintenance
This stage refers to building operation, which includes energy consumption, water use, and
environmental waste generation. It also takes into account the repair and replacement of building
assemblies and systems. The transport and equipment use for repair and replacement is also considered
in this stage.
End of Life
This includes energy consumed and environmental waste produced due to building demolition and
disposal of materials to landfills. The transport of waste building material is also included in this stage.
Recycling and reuse activities related to demolition waste can also be included in this stage, depending
on the availability of data. (The return of significant high-value materials to the inventory through
recycling can even be considered as a “negative impact.”)
It should be noted here that the description of building life-cycle stages presented above is based on
review of previous LCA studies.[4] [11] [12] Each life-cycle stage may or may not include all the activities
described above, depending on the scope of the project.
Embodied Energy, Operational Energy and LCA Energy modeling has been applied to buildings for more than 30 years, starting with the advent of
computer simulations such as DOE2 and BLAST in the early 1970s. The use of energy modeling is at the
heart of the LEED rating system and, as such, is becoming more widely used as a building design tool.
Though architects do not generally craft their own energy models, most are familiar with the process.
Energy modeling is perhaps the most appropriate way to meet the energy code requirements for
buildings, such as those embedded in ASHRAE 90.1 and 90.2, for commercial and residential buildings
respectively, as well as the higher performance levels expected by LEED. The output from an energy
model is the projected energy use within a building as it operates over a typical meteorological year.
This energy can be considered the “operational energy” and is one component of the input needed to
complete an LCA for a building. The second major component of the energy consumed by the building is the embodied energy. This
embodied energy comes from the materials manufacturing and construction phases of the building
project. The need to understand embodied energy becomes more important as measures to reduce
operational energy are taken. For so-called net-zero buildings, most of the impacts will be embodied, as
systems are designed to cover net operational needs with on-site power generation. An LCA that
includes the materials manufacturing and construction phase of the projects is the primary means of
computing the embodied energy in a building.

A Guide to Life Cycle Assessment of Buildings
50
building shell (embodied effect)
green building systems (+ embodied)
energy use over time
building shell (embodied effect)
energy use over time
energy or GWP
energy or GWP
0
0
ener
gy o
r G
WP
time
green building alternative
baseline building
building shell (embodied effect)
green building systems (+ embodied)
energy use over time
building shell (embodied effect)
energy use over time
energy or GWP
energy or GWP
0
0
ener
gy o
r G
WP
time
green building alternative
baseline building
The embodied and operational energies of two building projects. The baseline building (in red) has the smallest embodied energy but uses more
energy over time. The green building alternative includes additional embodied energy from systems like high-performance insulation and glazing
and photovoltaics. Over time, the energy embodied in the green build systems is “paid back,” and the overall impact of the green building,
embodied+operational, becomes less than that of the baseline building. If energy sources for building construction and operation are known,
then energy use can be converted to carbon emissions, often denoted as global warming potential or GWP.
Steps of the LCA Process According to ISO 14040, LCA consists of four components or steps: (1) Goal and Scope Definition, (2)
Inventory Analysis, (3) Impact Assessment, and (4) Interpretation.
Step 1: Goal and Scope Definition
In this phase, the product(s) or service(s) to be assessed are defined, a functional unit is chosen, and the
required level of detail is defined.[13] The type of analysis, impact categories to be evaluated, and set of
data that needs to be collected are identified. System boundary and functional unit definition are
important elements of this component. (See definitions of these terms, below.)
Functional Unit: The functional unit is a description of the product or system being assessed, defined with great specificity so that
the resulting LCA can be compared to the LCA of a similar product or system on a one-to-one basis. For a floor cleaning product, the
functional unit might be 16 ounces of cleaner. It also might be the recommended amount of cleaner for 1,000 square feet of
flooring (to account for cleaner concentration). For a building LCA, the functional unit might be “the entire building supplied from
design to demolition for a 50-year service life,” or it might be computed on a per-square-foot basis and limited to one life cycle
stage (e.g., construction).
System Boundary: The system boundary dictates the breadth and depth of the proposed LCA. For example, if the LCA is completed on a
building enclosure system, then the system boundary will likely exclude the primary building structure that supports the façade. The
assessment might or might not include the clips, brackets, and lintels that are used to attach the façade to the building. If a comparative
LCA is anticipated, then it is critical that the system boundary be established in the same way for the systems being compared.

A Guide to Life Cycle Assessment of Buildings
51
Step 2: Inventory Analysis
In this step, the energy and raw materials used; the emissions to atmosphere, water, and soil; and
different types of land use are quantified for each process then combined in the process flow chart and
related to the functional basis.[13] In other words, an inventory of all the inputs and outputs to and
from the production system is prepared in this step. As an example, the inputs may include water
consumption and the outputs may include sulfur oxides (SOx). Thus, products and processes can be
compared and evaluated using Life Cycle Inventory (LCI) results. If the results of LCI are consistent,
which means that a product performs well or poorly in all environmental burdens, there is no need to
carry out Step 3, Impact Assessment. However, if the LCI results are inconsistent, Step 3 becomes
essential.
In the inventory analysis stage, software tools and databases are critical. It is not possible to analyze
each individual material and process from scratch each time an LCA is performed. Instead, software
tools tied to extensive product and process databases are used to complete the inventory analysis. The
simplest software tools are spreadsheets, in which material quantities can be entered. More complex
tools act more like cost-estimating software, so that automated tabulation of material quantities from
assemblies can be completed on a square-foot basis.
A graphical representation of the Inventory Analysis step. The diagram can be applied to the overall product or process being analyzed or can be
thought of as a building block applied to each discreet sub-product within an overall LCA. For example, the diagram above could apply to
anodized aluminum extrusions, which would then be one component of an overall LCA on a curtain wall system (from British Royal Chemistry
Society).
Step3: Impact Assessment
The impact assessment translates the emissions from a given product or process into impacts on various
human and terrestrial eco-systems. (See the section on Impact Categories, below.) To aid in the
understanding of impacts, the effects of the resource use and emissions generated are grouped and
quantified into a limited number of impact categories, which may then be weighted for importance.[13]
In other words, data from the inventory analysis (Step 2) is attributed to an appropriate impact category
defined in scoping (Step 1). The results from this step can either be obtained for different impact
categories or a single value result can be obtained by applying weights. Continuing the example above,

A Guide to Life Cycle Assessment of Buildings
52
the outputs of SOx may contribute to a number of impact categories, but primarily to impact categories
related to acid rain (acidification) and the production of smog.
Impact assessments differ among the LCA tools used, and there is no one dominant impact framework,
either in North America or internationally. For this reason, a given LCA may choose to skip the impact
assessment step and instead present its results in terms of bulk emissions. The BEES LCA tool includes a
range of options for impact categories, allowing the user to select a suite of impacts that most closely
aligns with the value system of the user.
LCA Steps according to ISO 14040[13]
Step 4: Interpretation
LCA results are reported in the most informative way possible and the need and opportunities to reduce
the impact of the product(s) or service(s) on the environment are systematically evaluated.[13]. In this
step, the results are often presented in the form of tables or graphs, which is especially helpful when
comparing two competing design options or products. The outcome of this step is directly useful in
making environmentally friendly decisions. Like any other design feedback tool, LCA can be an iterative
process; the interpretation of the LCA can lead to changes in the proposed design, which then leads back
to Step 2 in the process.
Summary of Steps
The LCA, therefore, starts with a definition of the goals for completing the LCA; that is, a clear list of the
questions that the LCA is intended to answer. The boundary of the LCA is drawn so that one
understands which materials and processes are being considered and which are beyond the scope of the
assessment. The main effort of the LCA is in the inventory analysis, where materials and activities are

A Guide to Life Cycle Assessment of Buildings
53
analyzed and the emissions from them are accrued. As an option, the environmental impact of these
emissions can be analyzed using a recognized method for impact analysis. Finally, the results of the LCA
must be analyzed in light of the questions posed at the beginning of the process. ISO 14040 presents
this graphically, as shown.
Impact Categories The impact categories of LCA methodologies vary from system to system. A full comparison of the
impact categories is beyond the scope of this guide. Environmental Impact Categories are mappings
from quantities of emissions to the environmental impacts that these emissions cause. They can be
thought of as a class of environmental issues of concern to which Life Cycle Inventory (LCI) results may
be assigned.[14] The impact categories have been established from nationally recognized standards
established by agencies such as the Environmental Protection Agency, Occupational Safety and Health
Administration, and National Institutes of Health. The impact is usually given as a ratio of the quantity
of the impact per functional unit of product produced. Each category is an indicator of the contribution
of a product to a specific environmental problem. These categories are defined by the Life Cycle Impact
Assessment (LCIA) methods described below. A set of impact categories common to many LCA methods
are also provided below.[15]
Global Warming Potential (GWP)
Global Warming Potential, or GWP, has been developed to characterize the change in the greenhouse
effect due to emissions and absorptions attributable to humans. The unit for measurement is grams
equivalent of CO2 per functional unit of product (note that other greenhouse gases, such as methane,
are included in this category, thus the term “CO2 equivalent” is an impact and not an emission).
Acidification Potential (AP)
Acidifying compounds emitted in a gaseous state either dissolve in atmospheric water or fixed on solid
particles. They reach ecosystems through dissolution in rain. The two compounds principally involved in
acidification are sulfur and nitrogen compounds. The unit of measurement is grams of hydrogen ions per
functional unit of product.

A Guide to Life Cycle Assessment of Buildings
54
BEES (Building for Environmental and Economic Sustainability) impact categories and weighting. Different weighting strategies may be selected
in order to establish the environmental performance score. Though the environmental performance score may be useful in comparing two
functionally identical building products or functionally equivalent buildings, the use of such scores may mask the character of the impacts and
the ability to understand the most significant impacts of a given product or process (after BEES Technical Manual and User Guide).
Eutrophication Potential (EP)
Eutrophication is the addition of mineral nutrients to the soil or water. In both media, the addition of
large quantities of mineral nutrients such as nitrogen and phosphorous results in generally undesirable
shifts in the number of species in ecosystems and a reduction in ecological diversity. In waterways,
excess nutrient leads to increased biological oxygen demand (BOD) from the dramatic increase in flora
that feed on these nutrients, a subsequent reduction in dissolved oxygen levels, and the collapse of fish
and other aquatic species. The unit of measurement is grams of nitrogen per functional unit of product.
Fossil Fuel Depletion
This impact addresses only the depletion aspect of fossil fuel extraction, not the fact that the extraction
itself may generate impacts. The unit for measurement is mega joules (MJ) of fossil-based energy per
functional unit of the product. This category helps demonstrate positive environmental goals, such as
reducing the energy needed to produce a product, or such as producing a product with renewable, non-
fossil-based energy.
Smog Formation Potential
Under certain climatic conditions, air emissions from industry and fossil-fueled transportation can be
trapped at ground level, where they react with sunlight to produce photochemical smog. The
contribution of a product or system to smog formation is quantified by this category. The unit of
measurement is grams of nitrogen oxide per functional unit of product. This highlights an area where a
regional approach to LCA may be appropriate, as certain regions of the world are climatically more
susceptible to smog.
Ozone Depletion Potential
Emissions from some processes may result in the thinning of the ozone layer, which protects the earth
from certain parts of the solar radiation spectrum. Ozone depletion potential measures the extent of

A Guide to Life Cycle Assessment of Buildings
55
this impact for a product or system. The unit of measurement is CFC-11 per functional unit of the
product.
Ecological Toxicity
The ecological toxicity impact measures the potential of a chemical released into the environment to
harm terrestrial and aquatic ecosystems. The unit of measurement is grams of 2, 4-dichlorophenoxy-
acetic acid per functional unit of product.
Water Use
Water resource depletion has not been routinely assessed in LCAs to date, but researchers are beginning
to address this issue to account for areas where water is scarce, such as the western United States. The
unit of measurement is liters per functional unit.
It should be noted that the impact categories listed above is in accordance with TRACI LCIA method used
in the Building for Environmental and Economic Stability (BEES®) tool [15]. Other impact categories
included in BEES but not described here are Habitat Alteration, Criteria Air Pollutants and Human
Health. These definitions and units may differ depending on the LCIA method used (see below).
Life Cycle Impact Assessment (LCIA) Method Several methods are used to convert the LCI analysis results (quantities of materials and energy used
and resulting emissions) into environmental impacts. Some commonly used methods are Eco-indicator
99, EDIP 1997 and IMPACT 2002+. The Tool for the Reduction and Assessment of Chemical and other
environmental Impacts (TRACI) is an impact assessment tool developed by Environmental Protection
Agency (EPA). TRACI allows the examination of the potential for impacts associated with the raw
material usage and chemical releases resulting from the processes involved in producing a product. It
allows the user to examine the potential for impacts for a single life cycle stage or the whole life cycle
and to compare the results between products or processes.
Within a given impact category, groups of emissions that contribute to single impact are often converted
into an equivalent value as part of the LCIA step. The results from LCIA step are often normalized and
weighted to provide simpler interpretations of the results. The processes of equivalence-ing,
normalizing, and weighting are discussed below.
Equivalents
A wide range of emissions may contribute to given impact category. For example, 12 chemical
emissions are listed in the BEES manual as contributing to global warming.[15] Common GWP chemicals
are CO2 and methane—but the release of methane has 23 times more impact than a release of the same
amount of CO2. Therefore, the CO2 equivalent of an emission of methane is 23 times the methane
release. The summation of the 12 chemicals, multiplied by their equivalence values, leads to the global
warming impact or GWP, measured in CO2 equivalents.
Normalization
Normalization is a technique for changing impact indicator values with differing units into a common,
unit-less format. This is achieved by dividing the impact category value by a selected reference quantity.

A Guide to Life Cycle Assessment of Buildings
56
The reference may be chosen, but often the average yearly environmental load in a country or
continent, divided by the number of inhabitants, is used as the reference.[14]. In case of the BEES® LCA
tool, normalization results in impact caused per person in the U.S. over a year towards a specific impact
category. This process increases the comparability of data among various impact categories as all the
categories are reduced to the same scale.[2]
Weighting Methods
Some LCIA methods allow weighting across impact categories. This means the impact (or damage)
category indicator results are multiplied by the weighting factors and added to form a total
“environmental performance” score.[14] Weighting can be applied on normalized or non-normalized
scores. It can either be user-defined—representing the value system of the LCA user—or predefined by
experts. For example, the BEES® Stakeholder panel proposes weights for each impact category.
According to this panel, GWP contributes 29 percent to the total environmental score, whereas AP
contributes 3 percent. Though weighing can make environmental impacts easier to understand (by
providing a scalar quantity), it has the potential to mask the underlying impacts.
LCA Terminology A number of technical terms are used to describe Life Cycle Assessment, its components, and related
assessment methods. One term that is often used is Life Cycle Analysis, which is simply a synonym for
Life Cycle Assessment.
Functional Unit
The functional unit can be defined as the unit of comparison that assures that the products being
compared provide an equivalent level of function or service.[2] It is difficult to establish functional
equivalence in the building industry. True equivalence can only be ensured at the level of a complete
building design. For example, a wood structure is likely to have different cladding and insulation
requirements than a steel or concrete structure. Therefore, if wood is being compared with steel or
concrete for environmental impact, then all the related decisions, such as for cladding and insulation
options, need to be accounted for to achieve functional equivalence. Case-specific considerations should
be explicitly stated when determining functional equivalence.[5] An example of a functional unit when
comparing two building design options for a school can be “provision of a school building that operates
for 50 years.”
System Boundary
System boundary is defined as an interface between a product system and the environment or other
product systems.[14] It defines the activities and processes that will be included in each life-cycle stage
for the LCA analysis and those that will be excluded. Figure 5 presents an example of a system boundary
defined for conducting an LCA of a house.[16] It can be seen that recycling and landfilling are not
included within the system boundary as impacts because these two activities have not been accounted
in the LCA.

A Guide to Life Cycle Assessment of Buildings
57
System boundary for the LCA of a house[16]
Life Cycle Inventory (LCI) Database
LCI data are at the heart of any LCA analysis. Several organizations and LCA tool developers have
developed LCI databases that contain material and energy use data as well as emissions data for
commonly used products and processes. These databases contain elementary flows (inputs and outputs)
for each unit process for a product system[2] and are specific to countries and regions within countries.
The LCI data are region-specific because the energy fuel mix and methods of production often differ
from region to region. The data can be based on industry averages or could be supplier-specific. For
example, the BEES® LCA Tool is driven largely by product data supplied by suppliers.[15] However, the
modules do not contain data characterizing the full life cycles of specific products.[2] The data in the LCI
databases generally account for raw material extraction, transportation to a manufacturing unit, the
manufacturing process, and packaging and distribution. Examples of some LCI databases are the
EcoInvent Database with global, European, and Swiss datasets and the US LCI database managed by the
National Renewable Energy Lab with US datasets.[17] The databases are either available with an LCA
tool or can be imported into a tool. The US LCI database is also available in spreadsheet form (from
http://www.nrel.gov/lci/database/).
Databases may contain industry averages or product-specific data. Industry averages make more sense
in whole-building LCA tools, as these tools are designed to be used by architects to make decisions
about assemblies at the schematic design stage[5]. A specific supplier is not usually identified in early-
stage design. At the specification and procurement stages, if the supplier-specific data are available, a
decision to select the most environmentally sensitive supplier for a specific product could be assisted by
the use of LCA. It may be necessary to engage an LCA practitioner at this stage, as LCA tools for
architects may not have supplier-specific capabilities.

A Guide to Life Cycle Assessment of Buildings
58
Life Cycle Management (LCM)
LCM is a framework that uses methods like LCA and Life Cycle Costing (LCC) to support decisions
leading to sustainable development. LCM has been defined by the SETAC Working Group as “a
flexible integrated framework of concepts, techniques, and procedures to address environmental,
economic, technological, and social aspects of products and organizations to achieve continuous
environmental improvement from a Life Cycle perspective.”[18] A Life Cycle Management (LCM)
approach can form the basis of an effective business strategy by providing a framework for
improving the performance of an organization and its respective products and services. An example
of use of the LCM approach is discussed by Junnila.[19] The study uses the LCM approach for
estimating the life-cycle impacts of three products by EIO-LCA method and assesses the suitability
of such an approach in a company environment.
Life Cycle Costing (LCC)
LCC provides decision support in selecting a building system or whole-building design based on its
financial benefits as opposed to LCA, in which a decision is based on the environmental benefits of a
system or design. LCC provides a basis for contrasting initial investments with future costs over a
specified period of time. The future costs are discounted back in time to make economic
comparisons between different alternative strategies. LCC involves the systematic consideration of
all relevant costs and revenues associated with the acquisition and ownership of an asset. In the
context of buildings, this consists of initial capital cost, occupation costs, operating costs, and the
costs incurred or benefited from its disposal.[20] An LCC analysis is a data-intensive process, and the
final outcome is highly dependent on the accessibility, quality, and accuracy of input data.
There are a number of factors limiting the use of LCC at present.[20] They are:
A general lack of motivation to use LCC because it is a time-intensive process. Moreover,
there is lack of confidence in the results.
Clients are not willing to pay the architect or other consultant for the added cost of
conducting an LCC, as there is a lack of awareness of its benefits.
There is no standardized method.
The nature of buildings makes the whole-building LCC methodically much more complex.
There is significant uncertainty in operational cost data.
The performance information about innovative green materials and technologies is missing.
Though they are quite different in terms of intent, many of the problems associated with life cycle
costing also apply to life cycle assessment. An example of LCC applied to a construction project is
presented by Rutgers Center for Green Building.[21]
Symbiotic Relation between LCA and LCC
LCA and LCC when used together can lead to more holistic decision making. Most building projects are
constrained by budgets. In a given scenario, LCA will produce results indicating the environmental
impacts of different options. The option with least impact is proposed as the best solution based on LCA

A Guide to Life Cycle Assessment of Buildings
59
results, but this option might have a large initial cost. In such a situation, LCC can evaluate the life cycle
cost of the option and help in selecting the most suitable option based on a limited budget and
calculated payback period, while simultaneously managing environmental impacts. An example of
simultaneous use of LCA and LCC can be found in a project by Siegel and Strain Architects.[22]
Life Cycle Energy Analysis (LCEA)
Life Cycle Energy Analysis, also referred to as Life Cycle Energy Assessment, is an abbreviated form
of LCA that uses energy as the only measure of environmental impact.[23] This helps in choosing
energy efficient materials, systems, and processes for the life cycle of the building. An example of
use of LCEA can be found in a study by Huberman and Pearlmutter.[23] The study aims to identify
building materials from a number of possible alternatives that will optimize a building’s energy use
over its entire life cycle.
Carbon Accounting
Carbon accounting is the process by which CO2 emissions from fossil fuel combustion are
calculated.[24] Carbon emissions factors are expressed in many forms, either expressed as a mass of
CO2 or only as the mass of carbon contained in the CO2, and may be expressed in any unit of mass. In
case of buildings, carbon accounting would consider CO2 emissions from all life stages.[25] Thus,
carbon accounting can be described as a narrow-scoped LCA that is only targeted to measure the
CO2 emissions for a building life-cycle.
Life Cycle Assessment in the Building Industry The LCA methodology as it relates to the building industry can be pictured as operating at one of four
levels: material, product, building, or industry, as shown in the diagram below. Each larger level builds
from the level below and expands from the material kernel.
Material
Product
Building
Industry
LCI
Database
LCA in the building industry can be thought of as operating at
one of four levels. At the material and product levels,
architects are likely to be consumers of LCA information, that
is, they may use this information to guide in their material
and product selection process. At the building level, architects
may themselves be the LCA practitioners, using building-
specific LCA tools to create LCAs that characterize the
environmental footprint of proposed projects, either for the
purpose of meeting regulatory requirements (e.g., to stay
below a specified impact threshold) or as part of an iterative
design methodology that seeks to minimize the
environmental impact of a project. LCAs created at the
industry level are more likely to be of use to policy makers and
planners.

A Guide to Life Cycle Assessment of Buildings
60
Material Level
At its core, process-based LCA is defined at the material level. In the United States, the primary source
for information about the environmental impact of materials is the LCI (life cycle impacts) database
managed by the National Renewable Energy Laboratory or NREL.[17] Participants in the US LCI
Database Project are actively involved in analyzing widely used building materials and formatting their
analysis for inclusion in the LCI database (Institute et al. 2003). Athena Impact Estimator uses the US LCI
database.
Prior to the development of this database, LCA software for the United States used LCA data from
foreign data sources. The early versions of BEES used US data for energy production and European data
for materials, along with proprietary material-supplier data for the manufacturing life cycle.[68] The
current version of BEES uses these proprietary data, the US LCI database, and supplemental analysis
from SimaPro with the EcoInvent database.
The question “What is a material?” seems straightforward, but is not. Both cement and concrete are
building materials, but cement is a constituent of concrete. The environmental footprint of Portland
cement is significant, due the extraction of precursor minerals from the earth and the energy necessary
to create the Portland cement clinker.[69] An LCA of a given concrete will depend on the percentage of
cement that is included in the concrete and whether fly-ash is used as a substitute for cement.[70] In
addition, the location of cement production relative to the building site will have a significant impact on
the LCA outcomes.[26] The BEES LCA tool, for example, allows for the user to select a concrete with 100
percent Portland cement, as well as other concretes with fly-ash, limestone, and slag as substitutes for a
portion of the cement.
It is not likely that an architect or any building industry consultant would be called on to produce
material-level LCI data. This information is calculated by process chemists, chemical engineers, and
associated specialists and submitted for inclusion in various LCI databases. There is some direct use of
material-level LCI data by building professionals, however. If one wanted to calculate the positive
impacts of using fly-ash as a substitute for part of the Portland cement in concrete, this calculation could
easily be made by directly accessing data from the LCI database.
Product Level
At the product level, an LCA is calculated as a collection of materials, which are assembled into a final (or
intermediate) product. A quantity takeoff of the product is completed, and the emissions from each
component of the products are summed. The product LCA of a heat pump would include the production
of the pre-cursor materials—steel, copper, aluminum, plastics, refrigerants—plus emissions from
galvanizing processes, painting, metal fabrication, welding, etc. Completion of the heat pump LCA might
be made easier if the LCA of a particular component, say an electric motor, is already available.
To complete a product LCA, thorough knowledge is required of the source and quantities of materials
and the manufacturing processes of the finished product. General-purpose LCA software, such as Gabi,
Boustead, or SimaPro, is usually employed to complete a product LCA.

A Guide to Life Cycle Assessment of Buildings
61
A large quantity of product-level LCA data is emerging that is useful to architects. This is especially true
in areas where products can clearly be compared on a one-to-one basis or in LCA terminology, where
the functional unit for a product can be clearly delineated. Manufacturers of office furniture and
carpets are adopting the LCA method widely and providing the results of these LCAs to architects to
demonstrate the “green-ness” of their products.[27]
Building Level
Building LCA, or whole-building LCA, can be thought of as a product LCA writ large, where the product is
the building. In this case, the architect can be the LCA expert, as the architect understands how the
building is constructed, how building materials and products flow to the jobsite, and how the building is
going to be operated over time. A rationale for conducting whole-building LCA, and specific strategies
for the use of building-scale LCA information, are discussed in detail in Chapter 5 of this document.
In North America, three tools exist to support the whole-building LCA process: Athena Eco-Calculator,
BEES, and Athena Impact Estimator. A detailed description of these tools is given in Chapter 2.
Industry Level
At the building industry level, the Economic Input-Output (EIO) based LCA method is probably the best
tool for completing an LCA. Instead of completing a process-based LCA of every building in the
portfolio—not a realistic approach—an LCA at the building industry scale is completed by examining
industrial production and economic output data. And so, for example, to characterize the environmental
impact of the residential housing industry, surveys of homebuilders, housing start data, income of
wood-products suppliers, property tax rolls, and construction employment data could be collected and
analyzed to predict the amount of green-field land, non-renewable materials, and energy are directed
into residential construction on a national or regional basis each year. In this way, an LCA of an entire
segment of the AEC industry is created, but with little of the specificity found in process-based LCAs. The
EIO LCA method has been used in the building industry to quantify the impacts of cement and steel
production, suburban sprawl and urban densification, and changes in land use, for example.
Again, it is clear that LCA at this industry-wide scale is not actionable by a practicing architect. Rather, it
is at the smaller scales: material, product, and building that the LCA becomes useful to the architect.
LCA and the Design Process In addition to asking the question: “At what level of detail can an LCA be used?” it is also possible to
clarify LCA by asking: “At what stages of the design process can LCA be useful?” To aid in this discussion,
we will use the typical stages of the architectural design process taken from AIA D200[28] and focus on
the pre-design, schematic design, and design development stages of the design process.
The table below presents typical design activities that take place at these three stages of the design
process. Activities where input from an LCA would clearly be relevant are indicated in the table in bold.
These activities are discussed in detail in the text following the table.

A Guide to Life Cycle Assessment of Buildings
62
Table 1 - Tasks accomplished in three design stages of a building project[28]
Pre-Design Stage Schematic Design Stage Design Development Stage
Identify owner’s requirement Site plan and principal floor
plans prepared
Detailed site plan indicating
building location and site
improvements prepared
Departmental and room-by-
room interaction matrix
established
Views, elevations, sketches,
and models prepared to
convey building configuration
Detailed plans, elevations,
sections, schedules, and notes
prepared
Preliminary structural,
mechanical, electrical, and
other engineering systems
determined
Comparative structural,
mechanical, electrical, and
other systems analyzed
Structural, mechanical,
electrical ,and other building
systems finalized
Block plans created showing
all rooms, corridor, and
vertical solutions
Space and location
requirement for these
systems determined
Review obtained from
regulatory agencies
Estimates prepared for total
project cost and annual
project operating expenses
Preliminary screening of
materials, equipment, and
fixtures carried out
Code compliance check
Pre-Design Stage
In this design stage a concept based on feasibility studies is prepared. It shows the design analysis and
options considered and will be sufficiently detailed to establish the outline proposal preferred. This
design stage is often time constrained.[28] [29] During this stage, LCA can help define the environmental
goals of a project. LCA could be used to make decisions regarding the building footprint among several
options. The basic decisions for choosing a structural system can also be based on LCA. Trade-offs
between impacts from the manufacturing and operational phases can be evaluated to decide assembly
types.
Schematic Design Stage
The pre-design proposal approved by the client is now taken to a more detailed level. The tangible
material produced can include site layout, planning and spatial arrangements, elevation treatment,
construction, and environmental system. [28] [29] Choices regarding selection of building products and
assemblies can be made with the help of LCA. Energy conservation measures can be assessed for their
environmental burdens, and an informed decision can be facilitated by the use of LCA.
A Guide to Life Cycle Assessment of Buildings
63
Design Development Stage
At this stage, the schematic design solution is worked through in detail. At the end of this phase,
detailed design drawings are produced for co-coordinating structure, services, and specialist installation.
Internal spaces may be detailed to include fittings, equipment, and finishes. [28] [29] In the design
development stage, LCA can help evaluate the life-long impacts of proposed lighting and HVAC systems.
The most crucial stages in a system’s life can be identified in terms of environmental impact, and
appropriate modifications to the system design can be proposed. Material finishes can also be
compared with the help of LCA results, and the right choices can be made.
In summary, LCA can be helpful in:
Making choices among various building design options
Making choices among various building structural systems, assemblies, and products
Identifying products or assemblies causing the maximum and minimum contribution to the
overall environmental impact throughout building’s life cycle
Identifying stages of building life cycle causing the maximum and minimum contribution to
overall impact
Mitigating impacts targeted at a specific environmental issue.
Challenges in the Use of LCA Though LCA is doubtless the best tool for analyzing the environmental impact of product or project, the
methodology and underlying data are still being developed. In this section of the text, the challenges of
applying the LCA methodology to buildings is discussed.
LCA is a complex method heavily relying on the availability and completeness of data (LCI) and
methodologies for tabulating material use within the LCA tools. A number of key challenges for applying
the LCA methodology to buildings are enumerated below.
Data collection
Data collection for the inventory analysis can be quite exhausting. The availability of good life cycle
inventory data is more limited in North America than it is in Europe, where LCA is practiced and
understood more widely.[30] Again, this lack of data is being addressed in the United States through
the US Life Cycle Inventory project, overseen by NREL.[17] The deficiency in present databases leads to
collection of data from other sources, such as product manufacturers (first party data, instead of third-
party data). The lack of readily available data makes the task of conducting LCA difficult for the architect
or even for an LCA practitioner. It is unlikely that any design professional will use LCA unless the
inventory analysis data have already been collected, tabulated, and indexed in a way that promotes ease
of use. Further development of aggregated LCAs of building assemblies, as are present in BEES and Eco-
Calculator, will assist architects in constructing LCAs of buildings without the need for extensive manual
data collection.
Data Quality
Data collected from single manufacturers can be unreliable and inconsistent. This may lead to unfair
comparison between two competing products. Additions to the LCA databases by industry trade

A Guide to Life Cycle Assessment of Buildings
64
associations (instead of single suppliers), has improved the quality of LCI data. Nevertheless, such data
require third-party validation.
Issues with Impact Assessment Methods
LCIA is an evolving science based on assumptions and extrapolations from work of scientists in many
fields.[30] The methods used to translate inventories into impacts vary by impact category. Impacts such
as global warming and ozone depletion are estimated based on internationally established methods. For
impact categories like eco-system toxicity, the impact assessment method is less consistent, as the
impacts are much more complex to quantify. For example, it is widely acknowledged that a release of
mercury into the environment is harmful to eco-systems, but it is difficult to quantify this impact in
terms of human morbidity and mortality.
Issues with Weighting
The impact assessment results in scores for different impact categories. Often, the decision of selecting
the more important impact to compare the products is left to the user. Some LCA tools facilitate the
weighting process or even include default weightings. But reducing the results to a single score requires
even more questionable assumptions and generalizations than impact category assessment, which is not
found acceptable by many LCA experts.[30] Many believe that a better approach is to report the
impacts in each of the categories and then use these values without weighting.
Role of ISO Standards, SETAC/UNEP, and EPA The 14040 series of ISO (International Organization for Standardization) includes a series of standards
relating to LCA. ISO is primarily responsible for standardizing the LCA methodology. It concerns the
technical as well as the organizational aspects of an LCA project.[6] Organizational aspects include
design of critical review processes and matters like the involvement of stakeholders. It has been agreed
that the ISO 14040 family of LCA standards should be used as a starting point for further development of
LCA methodology within the building industry sector.[31] The following standards are included under
the 14040 series.
- ISO 14040 – General Principles and Framework
- ISO 14041 – Goal and Scope Definition and Inventory Analysis
- ISO 14042 – Life Cycle Impact Assessment (LCIA)
- ISO 14043 – Life Cycle Interpretation
- ISO 14047 – Technical Report
- ISO 14048 – LCA Data Documentation Format
- ISO 14049 – Technical Report
The Society of Environmental Toxicology and Chemistry (SETAC) was the first international organization to propel the development of LCA. The United Nations developed the Environment Programme (UNEP) to focus on the application of LCA particularly in developing countries. In 2002, SETAC and UNEP jointly launched the Life Cycle Initiative, which aims at putting life cycle thinking into practice and improving the supporting tools through better data and indicators.[2] Following are the three programs under this initiative.
A Guide to Life Cycle Assessment of Buildings
65
- The Life Cycle Management (LCM) program creates awareness and improves the skills of decision makers by producing informational materials, establishing forums for sharing best practice, and carrying out training programs in all parts of the world.
- The Life Cycle Inventory (LCI) program improves global access to transparent, high quality life cycle data.
- The Life Cycle Impact Assessment (LCIA) program increases the quality and global reach of life cycle indicators by promoting the exchange of views among experts whose work results in a set of widely accepted recommendations.
The US Environmental Protection Agency (EPA) has been a key player in propagating the use of LCA methodology in the United States. EPA organizes international workshops dealing with various aspects of LCA. Its LCA101 document, "Life Cycle Assessment: Principles and Practice," provides an introductory overview of Life Cycle Assessment (LCA) and describes the general uses and major components of LCA.[32] Moreover, EPA has been fundamental in the development of the LCIA method TRACI, which is widely used in LCA. EPA’s science advisory board has also proposed weights for different environmental categories for the TRACI method.[15]
Incentives for conducting LCA – Building Standards and Rating Systems Completing an LCA is a time and resource intensive process. LCA has been successfully integrated into
many industrial manufacturing systems because of benefits available to the manufacturer and the
consumer. These benefits are:
Indirect monetary incentives
Process enhancements that can be achieved by using LCA methodology is rewarding for consumer
product and similar industries. This is because of the repetitive nature of production in these industries.
An improvement in one process stage affects all subsequent batches of products. Both time and other
resources are optimized, leading to monetary savings for the manufacturer. These savings are also
reflected in the market prices and thus benefit the consumer. This is not the case with buildings where
each is unique in its construct and the way it is operated. The use of LCA with its present capabilities and
limitations tends to consume more time and resources than it saves for building projects. In addition,
monetary savings for reducing environmental emissions are only possible if the release of emissions is
taxed or limited in some way. In many cases, there is no direct economic payback to reduction of
emissions beyond the threshold levels set by environmental regulators.
Another incentive is the increase in the market value of a product by signing up for programs like
Environmental Product Declaration (EPD).[33] EPD requires the use of scientifically accepted, valid
methods of using LCA. Not many such programs exist for the building industry. Green Globes™ is the
Web-links
EPA LCA Research http://www.epa.gov/nrmrl/lcaccess/index.html
ATHENA® Institute http://www.athenasmi.org/index.html
BEES Tool http://www.bfrl.nist.gov/oae/software/bees/
American Center for Life Cycle Assessment
http://www.lcacenter.org/
SETAC http://www.setac.org/node/32
The International Journal of Life Cycle Assessment
http://www.springerlink.com/content/0948-3349
Building LCA Project by Royal Melbourne Institute of Technology
(RMIT) http://buildlca.rmit.edu.au/

A Guide to Life Cycle Assessment of Buildings
66
only green building rating system at present recognizes and rewards the use of LCA in building
design.[34]
Direct monetary incentives
Direct monetary incentives can be defined in terms of tax credits or benefits which are available to the
manufacturer for using LCA or complying with programs that have LCA embedded in it. Consumers also
receive monetary incentives if LCA-compliant green products or technologies are available at subsidized
rates.
Incentives for Building LCA at Present
At this time, the incentives of using LCA in building projects are minimal. The present incentives are
available in form of Green Globes™ green building rating system, ASHRAE Standard 189.1 and the
Carbon Cap-and-Trade Bill. In the future, it is anticipated that there will be many other incentives for
the use of whole-building LCA and that the method will be easier to use due to improvement in LCA
tools.
Green Globes™ [34]
Green Globes™ is a building rating system that provides guidance for green building design, operations,
and maintenance through its Web-based tool. With its roots in Canada, it was launched in the United
States in 2004 and is being distributed by the Green Building Initiative (GBI). The rating system
comprises 1,000 points, which are sub-divided into 7 sections. The Resources section carries 100 points,
out of which 50 can be achieved by implementing LCA methodology. GBI’s purpose behind introducing
LCA in Green Globes™ was to initiate a fundamental shift in the way green building rating systems have
traditionally approached green building—away from a prescriptive methodology to one that relies on
objective environmental performance scoring, especially in the area of material resource use.
Green Globes™ recommends adopting an assembly-scale LCA during the schematic design stage where
important large-scale design decisions are made. Assembly scale LCA allows the decision maker to
understand the impact of the whole assembly compared to one specific product choice. The ATHENA®
Impact Estimator tool is suggested to be a good tool for this stage of LCA. For the contract document
stage, the rating system suggests the use of LCA for product-to-product comparison. The proposed tool
for this analysis is Building for Economic and Environmental Sustainability (BEES®). The assemblies
generally evaluated by LCA are (but are not limited to): foundation systems, floor assemblies and
materials, column-beam/post-beam assemblies, and wall/roof/other envelope assemblies.
ASHRAE 189.1
ASHRAE Standard 189.1, Standard for the Design of High-Performance Green Buildings except Low-Rise
Residential Buildings was released in January 2010. The standard is intended to act as a reference
standard for green building design codes. It recommends the use of LCA performed in accordance with
ISO standard 14044 for ‘Section 9 – The Building’s Impact on the Atmosphere, Materials and Resources’.
LCA is specified as a performance option for compliance. Thus, acceptance of this standard might results
in wider acceptance of the LCA method. It is also anticipated that ASHRAE 189.1 would eventually
transform into building codes which would accelerate the integration of LCA in building industry.
A Guide to Life Cycle Assessment of Buildings
67
Carbon Cap-and-Trade Bill
The carbon cap-and-trade bill passed by the US House of Representatives in June 2009 contains a
number of provisions that would, indirectly, encourage the use of LCA, as LCA is the primary
methodology for calculating the carbon footprint of a building. “The bill sets a cap on emissions of
greenhouse gases. By 2020, emissions must be reduced 17 percent over 2005 levels. By 2050, emissions
must be reduced 80 percent or more. Staying under these caps is done with a system of permits or
allowances. Companies must have an allowance for every ton of greenhouse gas they emit. They are
allowed to buy and sell those allowances, but gradually the total number of allowances will be reduced,
thus reducing overall emissions.” [35] This suggests that companies are looking for opportunities to
offset their greenhouse gases emissions. As mentioned in Chapter 1, buildings account for 38 percent of
the total carbon emissions. Thus, large amount of emission reduction can be achieved by making
buildings greener. This will encourage building owners and developers to conduct abbreviated LCA to
account for the total emissions due to construction and use of facilities.
Future Incentives for Building LCA
Future incentives for using the LCA methodology can be anticipated, given the evolution of current
rating systems and the emergence of green building codes.
LEED
Leadership in Energy and Environmental Design (LEED) is a product offered by the US Green Building
Council and is currently the most widely accepted green building rating system in the US. On September
29, 2004, a meeting was convened in Washington, D.C., by the USGBC to begin the process of
determining how best to integrate LCA in the LEED assessment system.[36] Six working groups were
assigned specific tasks for the realization of this process, to define:
LCA Goal and Scope
Inventory Analysis and Allocation
Impact Analysis
Normalization
Benchmarking
Weighting
Available Tools and Methods Survey
Definition of Required Characteristics for LEED Tools and Methods
Pilot Test of Tools
Design of Draft Credits Recommendations.
The project is still in progress, and it is expected that a future version of LEED will award points for using
the LCA method within the system. Implementation of LCA within LEED should have a great effect in
popularizing LCA, similar to the degree that LEED has popularized energy modeling.

A Guide to Life Cycle Assessment of Buildings
68
IgCC
The Sustainable Building Technology Committee (SBTC) of the International Code Council (ICC) is
developing the International Green Construction Code (IgCC). The first draft of this code is expected to
be released in 2010. The draft standard is auspicious in scope. Once adopted by a municipality, the
provisions of this code shall apply to the construction, alteration, movement, enlargement,
replacement, repair, equipment, location, maintenance, removal, and demolition of every building or
structure or any appurtenances connected or attached to such buildings or structures. [37] At the time
this document was written, LCA was nested in Chapter 3, “General Compliance,” of the IgCC draft and
was a project elective. Project electives can become mandatory by building jurisdictions or designers,
should they so choose. Thus, the acceptance and implementation of this code would encourage the use
of LCA in some areas of building construction.
It is important here to understand the difference between building codes, standards, and rating systems.
Building codes are an enforceable body of rules that govern the design, construction, alteration, and
repair of buildings, whereas standards, for example the standard ASHRAE 90.1, outlines a series of
options for performance of building systems and assemblies and are often referenced by codes but are
not alone enforceable, unless adopted as part of a code. Rating systems typically aim to achieve
environmental goals above and beyond the code. While also not written in enforceable language, rating
systems aspire to a set of criteria for construction and performance, not minimums.[38]
Research to Address Shortcomings in Building-Specific LCA This short section focuses on research on seven key questions in building LCA currently being addressed.
Advances in these areas will lead to more widespread and reliable use of LCA in building design and
construction and point the way to the future of LCA in buildings.
1. How can the impacts due to site selection and construction for a given project be accounted for in LCA?
2. Given the desire to promote a “cradle-to-cradle” approach, how can the credits for recycling demolition waste at the building’s end of life be accounted for?
3. Can the LCA methodology be used to assess the environmental benefits of existing building retrofits?
4. What simplified and less time consuming methods exist to conduct LCA?
5. How can BIM help in streamlining the LCA process for buildings?
6. How does one choose a weighting system from among different available systems? Should weighting be applied on LCA results across categories?
7. How can benchmarks or thresholds be established for LCA?
Allocating Recycling Activities in a Building Life Cycle
Recycling activities can be a part of all the stages of a building’s life. During the material manufacturing
phase, many building products and assemblies may contain recycled content and need to be accounted
in calculating the impacts. The waste produced during construction may also be recycled. During
maintenance, the materials replaced could be diverted from the landfills by transporting the material to

A Guide to Life Cycle Assessment of Buildings
69
a recycling center. During the demolition phase, which accounts for the biggest share of waste produced
in a building’s life, the majority of building waste can either be reused or recycled. Accounting for
recycling activities may result in negative values for impacts, which can reduce the overall impact of a
building. By not accounting for these activities in an LCA analysis, projects deprive themselves of the
credits of recycling. Most of the case studies reviewed in this document only accounted for the recycled
content of materials during the material manufacturing phase. It is believed that the other stages were
not included, as the methods to account for recycling activities are not well integrated in the LCA tools.
Research in this area is well-developed. Several approaches like the “bonus” and “stock flow” methods
have been proposed by researchers to address the end of life recycling activities.[39] The bonus method
credits a material being recycled with half of the bonus (impacts of recycling minus impacts of the
avoided fabrication thanks to recycling) at the fabrication, and the other half at the end of life phase,
often resulting in negative values at this stage. On the contrary, the stock flow approach does not
account of recycling processes at end of life; the only parameters of recycling at end of life are the
dismantling impact and transportation distances. It allocates the credit of the recycling process at the
fabrication phase, which enables analysts always to evaluate current recycling technologies. As a
consequence, stock flow may result in assessing a better environmental impact for a land filling or
incinerating scenario compare to the recycling scenario, since the transportation distances to recycling
facilities are often higher than the distances to a landfill, due to local landfill opportunities.[39]
An example of “offsets” or negative impacts, taken at the end of life of a building. By the two methods used for assessing the value of the offsets
(the flow model and the bonus method), it pays to recycle the concrete if the distance to the recycle facility is less than 80 km (flow model) or
400 km (bonus method).
The impact due to recycling a tonne of concrete remains negative up to 400 km from recycling facilities
for the bonus method. For the stock method, it only remains negative for the first 80 km
(approximately). Although there is variation in the results because of the difference in the way credits
for recycling are allocated, recycling activities are accounted by adopting one of these methods.
Currently neither accounting method is prevalent in practice for building LCA studies. The authors of this

A Guide to Life Cycle Assessment of Buildings
70
guide suggest that embedding any such method in building LCA tools would aid in evaluation of this very
important activity in the life-cycle assessment of a building project.
Weighting Impact Categories
Weighting is a value-based process that represents the scientific interpretation and ideological, political, and ethical principles.[40] It is argued by many scientists that introduction of weights make the results of an LCA subjective. This is mostly true as weights are generally defined by a group of scientists or stakeholders and are based on their general understanding of the importance of each impact category. For example, a new optional weighting set was introduced in BEES version 4.0 that was created by a multi-stakeholder panel via the AHP method.[40] The panel comprised 19 members representing the three stakeholder categories. A weighting-set proposed by such a small group of representatives may not be representative of the entire scientific community.
However, the benefits of weighting cannot be undermined. It is helpful in decision making as it
generates a single-value result to help decision makers understand the environmental impact of a
product, assembly, or design option. Moreover, it is recognized that it is necessary to use weighting in
order to conform to the ISO 14044 requirement that a “comprehensive set of environmental issues
related to the product system being studied shall be reflected” when conducting an LCA study.[40] Thus,
there is a need for the formulation of more robust methods of creating weighting-sets that truly
represent the understanding and importance of different impact categories.
Streamlining the LCA Process
LCA is a comprehensive and time-intensive process. This characteristic of LCA is a major obstacle in its
adoption during building design. Many efforts have been made to simplify the LCA process. One such
study was conducted by Kellenberger and Althaus.[26] The study explored the deviation in LCA results
when certain insignificant activities were excluded from the scope of LCA. These activities included
transportation activities from factory gate to the site, some ancillary materials that are less obvious in a
building component, the building processes, and the associated cutting waste.[26] It was concluded that
transportation and ancillary materials are of relevance whereas building processes and cutting waste
can be neglected. The results of one study cannot be generalized to be applicable in other cases. Thus
there is a need for a detailed study that tests this method of simplification and thus concludes with a list
of activities that can be excluded from the scope of an LCA to get approximate results that are
informative towards decision making.
Benchmarking LCA
The final unresolved issue in the LCA analysis of buildings is the identification of benchmarks.
Benchmarks are important in the building performance studies as they provide a basis for comparing the
performance of a given project under consideration. Benchmarking for energy can be completed in a
variety of ways[41]:

A Guide to Life Cycle Assessment of Buildings
71
1. Past performance—A comparison of current versus past performance
2. Industry average—Based on an established performance metric, such as the recognized average performance of a peer group
3. Best in class—Benchmarking against the best in the industry and not the average
4. Best practices—A qualitative comparison against certain, established practices considered to be the best in the industry.
Note that items 2 and 3 are part of the Energy Star method assessing the energy use of buildings. Similar
methods can be adopted for benchmarking buildings for their overall environmental impact assessed by
LCA. Some argue against benchmarking a building design based on its past performance or worst-case
scenario, since it does not provide a sound basis for establishing a building’s performance. Thus, federal
agencies and organizations, such as EPA, need to establish “industry average” LCA data to benchmark
buildings.[41]
Chapter Summary In this chapter, we discussed:
Some highlights of the buildings sustainability movement and how LCA is relevant
History of LCA development and application
LCA definition
Variants of LCA
o Process-based LCA method: cradle-to-cradle, cradle-to-grave, cradle-to-gate, gate-to-
gate
o Economic Input-Output LCA method
Life-cycle stages for a building
o Material manufacturing
o Construction
o Use and maintenance
o End-of-Life
How LCA can help one understand the relation between embodied and operational energy
related to buildings
Steps of an LCA process
o Goal and scope definition
o Life-Cycle Inventory (LCI)
o Life-Cycle Impact Assessment (LCIA)
o Results andiInterpretations
Terminology related to LCA
o Impact Categories: global warming potential (GWP), acidification potential (AP), etc.
o LCIA relating methods: equivalents, normalization, and weighting
o Functional unit
o System boundary

A Guide to Life Cycle Assessment of Buildings
72
o LCI database
o LCM, LCC, LCEA, carbon accounting
o How LCA and LCC, when conducted together, prove beneficial
Different levels of LCA application: industry, building, product, and material
How LCA can be applied at different design stages
The challenges in use of LCA: data collection, data quality, issues with weighting, etc.
Role of ISO standards, SETAC, UNEP, and EPA in development and propagation of LCA method
Incentives for conducting LCA: Direct monetary and indirect incentives
o Incentives for building LCA at present: Green Globes, ASHRAE 189.1, and carbon cap-
and-trade bill
o Future incentives for building LCA: LEED and IgCC
Research to address shortcomings in building-specific LCA
o Allocating recycling activities in a building life cycle
o Weighting impact categories
o Streamlining the LCA process
o Benchmarking LCA

A Guide to Life Cycle Assessment of Buildings
73
2 STATE OF TOOLS
This chapter describes the LCA tools or software available in the United States and internationally
suitable for use in the building sector, including their utility in various scenarios.
ATHENA® Impact Estimator, EcoCalculator, BEES®, and EIO-LCA can be used in the US and are linked to
domestic data sources. Some other tools that will be briefly described to get a sense of LCA tools
available in different countries are: EQUER, LCAid™, Eco-Quantum, LISA, Envest, LCAit, PEMS, TEAM™,
Umberto, SIB LCA, Boustead, SimaPro, and GaBi. This chapter seeks answers to the questions:
1. What is the configuration of the tool? Does it embed an LCI database and impact assessment
method within or are these two required separately?
2. What type of tool is it? Material/assembly/whole-building LCA tool?
3. What life-cycle stages are accounted for in the tool?
4. What is the level of expertise required for using the tool?
5. What inputs are required? What is the method of input?
6. What are the outputs obtained from the tool? What are the options to view the
outcome/results?
7. How capable is the tool in terms of interoperability? Will it accept databases from other
sources? Are the outcomes of the tool compatible with other analysis and documentation tools?
8. What kind and number of building assemblies and material can be evaluated by the tool?
9. What impact categories can be evaluated if the tool has an impact assessment model embedded
within?
10. Does the tool provide normalized results?
11. What is the latest version of the tool?
12. How much does the tool cost?
It should be noted here that there is a difference between LCA tools and building assessment
frameworks like Leadership in Energy and Environmental Design (LEED), Building Research
Establishment’s Environmental Assessment Method (BREEAM) and Green Building Challenge (GBC). GBC
has been described in the GBC Assessment Manual as “an assessment framework which can
accommodate a variety of building assessment tools and be configured to meet a variety of different
output requirements.” [5] An LCA tool is one of the many building assessment tools that are
accommodated in these frameworks. The scope of the chapter is limited to LCA tools, and building
assessment frameworks have not been discussed.

A Guide to Life Cycle Assessment of Buildings
74
Configuration of an LCA Tool An LCA tool can be defined as an environmental modeling software that develops and presents life cycle
inventory (LCI) and perhaps life cycle impact assessment (LCIA) results through a rigorous analytical
process that adheres closely to relevant ISO standards and other accepted LCA guidelines.[5] The most
basic LCA tool takes inputs in the form of material take-offs (in area or volume) and converts it into
mass. Then it attaches this mass value to the LCI data available from an LCI database and other sources.
This step results in quantities of inputs and outputs of a product system. The inputs and outputs may
include the use of resources and releases to air, water, and land associated with the system.[4] Figure 30
depicts the basic configuration of a whole-building LCA tool.
Configuration of a typical whole-building LCA tool
Classification of Tools LCA tools can be classified based on their ability to analyze building systems (for building-specific tools)
and based on the required user skill to use the tool (for all tools).
Based on different levels of LCA application
For tools that focus on the building industry, three main types of LCA tools can be identified: building
product tools, building assembly tools, and whole-building LCA tools. The classifications are not exact;
that is, some tools have characteristics of more than one class.
LCA Model
(Boustead, SimaPro)
LCI Database (US LCI, EcoInvent)
Normalization
LCIA Method
(Eco-indicator 99,
TRACI)
Weighting
User Interface
Input (bill of
quantities)
Output (emissions to air,
Acidification Potential etc.)
Whole Building LCA Tool

A Guide to Life Cycle Assessment of Buildings
75
Building Product LCA Tools
Within building product tools, the products themselves are the smallest element of analysis. Individual
materials are not modeled within the tools by the user (but the tools are based on underlying material
data). These tools evaluate and compare competing building products. Such tools can provide a valuable
service if they compare products that are sufficiently similar in their basic composition as well as in their
function within a building context and they are legitimate substitutes.[5] These tools could provide a
good framework for supplier-to-supplier comparisons as opposed to material-to-material comparisons.
BEES® (Building for Environmental and Economic Sustainability) is an example of a building product LCA
tool.
Building Assembly LCA Tools
A building assembly is a group of interdependent building components that make up a system within a
building. For example, a wall is made up of several elements, all of which are needed to build, weather-
proof, and finish a wall[22] Building assembly tools evaluate complete assemblies for their
environmental footprint by considering the combined effect of all the products. These tools are even
wider in scope (and less specific in analysis results) than building product tools. ATHENA® EcoCalculator
is an example of a building assembly LCA tool.
Whole-building LCA Tools
Whole-building LCA tools assess the environmental impact of bringing together all the systems and
assemblies. These tools are generally capable of comparing several design options for a building
program and are generally helpful during initial design. Example: ATHENA® Impact Estimator is a whole-
building LCA tool that takes input in terms of building geometry and building assemblies. The result is
aggregated for the entire building and presented in the form of environmental impacts due to different
life-cycle stages or the contribution of the building towards a particular impact.
Based on User Skills
Based on required user skills, LCA tools can be categorized as tools for LCA practitioners and tools for
general users (for example, architects).
Tools for LCA Practitioners[5]
These tools help in structuring the analysis; linking user-defined or pre-defined unit processes; making it
easy to take into account standard transport, energy production, and other common datasets; and
providing necessary analytical and computational frameworks. These provide databases that can be
adjusted or replaced by the user. These tools may facilitate an LCA of individual products and relatively
complex components like window assemblies. Carrying out an LCA of a whole building using these tools
can be a strenuous task. The analogy here would be to imagine creating an energy model of a building
directly in the underlying simulation tool (e.g., DOE2) without using one of the modeling tools that act as
a front-end to the software (e.g., eQUEST). The real use for LCA practitioners’ tools in the building
industry is to use these tools to build product and assembly LCAs, which can then be embedded in
building-specific tools like BEES® and ATHENA® Eco-Calculator.

A Guide to Life Cycle Assessment of Buildings
76
Tools for General Users
Tools for general users, such as architects, have all the basic LCA work done in the background. In most
cases, databases are locked and cannot be modified by the user.[5] Thus it can only be used for the
building products, materials, and activity stages for which it has data (often a serious drawback). These
tools have a user-friendly interface in which the user is prompted for inputs and need not structure the
analysis. The tool may ask for a building location region to determine aspects like electrical grid, source
of building products, and transportation modes and distances. The model breaks down the selected
assemblies into their respective products, converts it onto a bill of quantities, and applies LCI databases
to it to get the inventory of consumed resources and emissions. For some tools, this is followed by
impact assessment. It is essential for the user to understand the basic working of the tool to get an idea
about the precision of the expected results.
Based on Region
Some LCA tools have an LCI database locked to them and are not compatible with other databases.
Since LCI databases are region-specific tools. For example, ATHENA® Impact Estimator has the ATHENA®
and US LCI databases embedded in it, which are specific to North America so, at present, it can only be
used for building locations in Canada and the United States. Other tools, like SimaPro, are more adaptive
in their linkages to different databases and thus are not region-specific.
Based on Its Application to a Design Stage
The classification of tools based on their application to a design stage is dependent on two factors: (1)
the amount of information available for the project during that stage (2) the type of decisions taken
during that stage. During pre-design stage, basic information like building form, gross building area, and
schematic floor plans is available for a number of design options. Thus a tool from the simplified whole-
building LCA tool category can be used at this stage to assess the impact of a specific form or structure
system. Examples of such tools are Envest, ATHENA® Impact Estimator, ATHENA® EcoCalculator, and
Eco-Quantum. During the detailed design stage, more accurate information is available and decisions
regarding building systems and products are taken. Thus product LCA tools are the tools suitable for the
detailed design stage.
Based on Life-Cycle Phases Included
Not all the LCA tools are capable of conducting a cradle-to-grave LCA analysis. Cradle-to-gate LCA tools
will only account for impacts due to material manufacturing and the building construction phase,
whereas cradle-to-grave LCA tools like BEES® & ATHENA® Impact Estimator account for all life-cycle
stages.
ATHENA® Impact Estimator ATHENA® Impact Estimator (IE) is the primary software tool in North America allowing users to evaluate
whole buildings and assemblies based on internationally recognized LCA methodology.[42] The types of
assemblies covered by this tool are foundations, walls, floors and roofs, columns, and beams. It provides
a full inventory of natural resource, energy, and water use and of emissions to air, water, and land for a
complete building or for individual assemblies. The aim of the tool is to indicate implications of different

A Guide to Life Cycle Assessment of Buildings
77
material mixes and design options and consider trade-offs among the various environmental effects.
Table 13 gives an overview of ATHENA® Impact Estimator.
Table 3 - ATHENA® Impact Estimator overview
Tool Developer ATHENA® Institute LCA Tool Type Whole Building Analysis Tool, Tool for Architects Life Cycle Stages Included Material Extraction and Manufacturing, Related Transport, On-
site Construction (energy use + related emissions), Operation (energy only), Maintenance and Replacement, Demolition and Transport to Landfill.
Acceptable Building Type Industrial, Institutional, Commercial, Residential for both New Construction and Major Renovation
LCI Database ATHENA® Database (cradle-to-grave), US LCI Database Data Location Canada and US Region
LCIA Method EPA TRACI Impact Categories and Units Acidification Potential – Moles of Hydrogen Ion
Equivalent Mass
Global Warming Potential – CO2 Equivalent Mass
Human Health Respiratory Effects Potential – PM2.5 Equivalent Mass
Ozone Depletion Potential – CFC11 equivalent
Smog Potential – Nox equivalent mass
Aquatic Eutrophication Potential – N Equivalent Mass
Total Fossil Energy – GJ
Unit System SI and Imperial Building Material/Assembly Combinations
1,200+
Required User Skill Moderate Target Users Architects, Engineers, Designers, Environmental Consultants Tool Vendor Morrison Hershfield
Cost $750 Latest Version 4.0.64 Web-Link http://www.athenasmi.org/tools/impactEstimator/
Tool Assumptions
Since Impact Estimator (IE) is a simplified LCA tool; the system boundaries and assumptions for
calculation are already embedded within the tool.[5] [43]
Effects of building factories, producing machines, building and maintaining transportation
systems, housing workers, or other activities related to basic systems are not included in the
calculations.
Only energy use associated with processing, transporting, converting and delivering fuel, and
energy are accounted for.
Impact from site selection and site preparation is not accounted for.
All off-shore products are treated as though they were manufactured in North America.

A Guide to Life Cycle Assessment of Buildings
78
Maintenance, repair, and replacement schedules are assessed based on the building type and
occupancy (owner occupied or leased).
Replacement materials will be the same as those used in original construction.
If service life of a replacement material or component exceeds the remaining assumed life of the
building, the difference is credited.
All building components and assemblies that are recycled or reused at present are assumed to
get recycled or reused after the end of product’s life, as no reliable data are available for these
practices 40-60 years from now.
Input
The tool requires building location, building type, expected life span of the building, and material and
assembly details as inputs. Options to building location are limited to eight cities in Canada and five in
the US (Pittsburgh, Minneapolis, Atlanta, Orlando, and New York).[42] [43]. Through the location
information, the tool tries to identify a region to determine aspects like electrical grid, source of building
products, and transportation modes and distances.[5] Thus, the user must select a location closest in
these aspects from the actual location of the project. It covers around 1,200 assemblies, which primarily
comprise of wood, steel, and concrete products used in foundations and in vertical and horizontal
structural assemblies. The user defines envelope material layers applicable to the assembly and
geometry of the building. Two types of quantity take-offs are possible within the Impact Estimator—a
“prescriptive take-off,” where the user prescribes a set of elements composing the take-off calculations,
or a “deterministic take-off,” where the user specifies functional requirements like live loads and bay
sizes, and the model determines the size of the element to match the requirements.[43] Operational
energy can also be fed into the tool by fuel type, if data are available. The tool also gives a choice
between whether the building is owner occupied or rental. This choice turns on effects specific to the
maintenance, repair, and replacement for envelope materials such as roofing, cladding, and window
systems.[43]
Output
The Estimator allows users to change the design, substitute materials, and make side-by-side
comparisons for any one or all of the environmental impact indicators.[42] The result of the analysis can
be viewed either in form of summary tables or graphs. The results can be categorized by assembly
groups or life-cycle stages. Operational impact versus embodied impact can also be viewed separately.
Up to five design options can be compared at a time. No weighting options are available. Thus, a single
value environmental indicator cannot be obtained.
Additional Features
ATHENA® Impact Estimator allows the tabulated results to be directly exported to MS-excel or PDF.
Moreover, bills of quantities for the evaluated design options can also be obtained as an output of the
analysis.
Strengths
The high-quality, regionally sensitive databases and user-friendly interface provide both detailed and
aggregated results. It offers superior assembly and complete design comparison capability.[44]

A Guide to Life Cycle Assessment of Buildings
79
Weaknesses
The tool is limited to analysis of load-bearing materials and assemblies. It accounts for exterior and interior wall finishes but does not consider floor and ceiling finishes. Also, housekeeping products and home appliances are not available to be included in the ATHENA LCA model. It is expected that future versions of the tool would include more building finishes, products, and systems, making the tool more powerful. Such a tool would help architects obtain a more complete picture of their building’s environmental footprint.
Another weakness is that the tool at present has limited options of designing a wall assembly. Most of
the conventional wall assemblies can be created within the tool, but options to create a high-
performance wall are not available yet. Eventually, it would be good to have a tool wherein architects
can customize an infinite number of assemblies and have an impact number generated by a more
dynamic version of the tool—this is what is missing in the tool as it stands.

A Guide to Life Cycle Assessment of Buildings
80
ATHENA® EcoCalculator ATHENA® EcoCalculator is a free spreadsheet-based LCA tool developed by the ATHENA® Institute in
association with the University of Minnesota and Morrison Hershfield Consulting Engineers. It was
commissioned by the Green Building Initiative™ (GBI) for use with the Green Globes™ environmental
assessment and rating system.[45] This MS-Excel-based tool provides quick LCA results for more than
400 common building assemblies. The results embedded in the tool are based on detailed assessments
completed with the ATHENA® Impact Estimator for buildings. Thus, the LCI database related to this tool
is the same as ATHENA® Impact Estimator. Table 14 gives an overview of ATHENA® EcoCalculator.
Table 4 - ATHENA® EcoCalculator overview
Tool Developer ATHENA® Institute LCA Tool Type Building Assembly Analysis Tool
Life Cycle Stages Included Material Extraction and Manufacturing, Related Transport, On-site Construction of Assemblies, Maintenance and Replacement, Demolition, and Transport to Landfill. Operational energy not included
Acceptable Building Type Industrial, Institutional, Commercial, Residential for New Construction, Retrofits, and Major Renovation
LCI Database ATHENA® Database (cradle-to-grave), US LCI Database
Data Location Canada and US Region LCIA Method Based on methods used in ATHENA® Impact Estimator Impact Categories Global Warming Potential – tons
Embodied Primary Energy - MMBtu
Pollution to Air - index
Pollution to Water - index
Weighted Resource Use - tons
Unit System Imperial Building Material/Assembly Combinations
400+
Required User Skill Low Target Users Architects, engineers, designers, environmental consultants Tool Vendor Morrison Hershfield
Cost $0 Latest Version 2.3 Web-Link http://www.athenasmi.org/tools/ecoCalculator/index.html
Tool Assumptions[45]
Results are presented on a per unit area basis (e.g., per square foot)
Installation for all assemblies was assumed to use components and loadings typical for central
areas of the United States.
It was assumed that all assemblies would be used in owner-occupied office buildings with a 60-
year lifespan–which affects the maintenance and repair/replacement schedules of relevant
building envelope materials (e.g., roofing membranes, claddings, and window systems).
Other specific assumptions covered factors such as:

A Guide to Life Cycle Assessment of Buildings
81
o Window-to-wall ratio
o Concrete strength and fly-ash content
o Gypsum board type and thickness with latex paint
o Live load for all intermediate floors, columns and beams, and roofs
o Bay sizes
o Column heights
o External wall thicknesses, depending on construction system
o Stud size/strength and spacing
o Sheathing and decking materials.
Input
The installation of the tool requires the user to give information about the project location, building
type, and scale. Based on the user input, the tool is installed as an MS-Excel file that contains six
assembly sheets for the following categories: exterior walls, interior walls, roofs, windows, intermediate
floors and columns, and beams. The number of assemblies in each category varies widely, depending on
the possible combinations of layers and materials.[45] The tool requires input in terms of area of an
assembly used. The user can indicate the relative area represented by each assembly type in a category.
For example, there could be a case where two types of window assemblies have been used in a project.
In such a case, the user can input values specifying the percentage of each window type.
Output
The results are available for five impact categories: global warming potential, embodied primary energy,
pollution to air, pollution to water, and weighted resource use. These are available in tabular form and
show real time changes as the inputs are adjusted.[45] This tool feature aids quick and easy testing of
different assembly options. The results take into account all the standard life-cycle stages but do not
include operating energy impact. No weighting options are available. Thus, a single value environmental
indicator cannot be obtained.
Strengths
Real-time feedback obtained from the tool makes it easy to compare assemblies and make decisions.
Moreover, its simple user interface makes EcoCalculator available to architects. The tool is available for
free. This tool should be the starting point for learning about LCA for most building professionals in
North America.
Weaknesses
Only assembly options available in the tool can be evaluated unlike ATHENA® Impact Estimator in which
custom assemblies could be built from available products. Moreover, column and beam sizes are fixed.

A Guide to Life Cycle Assessment of Buildings
82
Building for Environmental and Economic Sustainability (BEES®) Developed by National Institute of Standards and Technology (NIST), Building for Environmental and
Economic Sustainability (BEES®) provides product-to-product comparisons on the basis of environmental
and economic performance. Users are allowed to apply weighting factors selectively to environmental
and economic impact and then weigh various environmental factors. Table 15 gives an overview of
BEES®.
Table 5 - BEES® overview
Tool Developer NIST LCA Tool Type Building Product LCA tool, Tool for Architects Life Cycle Stages Included Material Extraction and Manufacturing, Transportation,
Installation, Operation and Maintenance, Recycling and Waste Management
Acceptable Building Type - LCI Database Data collected for BEES® 4.0, US LCI Database Data Location US Region
LCIA Method EPA TRACI Impact Categories Acidification Potential – grams of hydrogen ion
equivalent per functional unit
Global Warming Potential – grams of CO2 equivalent per functional unit
Eutrophication Potential - grams of nitrogen per functional unit of product
Fossil Fuel Depletion - surplus megajoules (MJ) per functional unit of product
Indoor Air Quality
Habitat Alteration – threatened and endangered species count per functional unit of product
Water Intake – liters per functional unit
Criteria Air Pollutants
Human Health – grams of toluene per functional unit of product
Smog Formation Potential – grams of nitrogen dioxides per functional unit
Ozone Depletion Potential – CFC11 equivalent
Ecological Toxicity – grams of 2, 4-D per functional unit
Unit System SI and Imperial Building Material/Assembly Combinations
230+ building products
Required User Skill Moderate
Target Users Designers, Specifiers, Builders, Product Manufacturers, Purchasers, Researchers, and Policy Makers[44]
Tool Vendor NIST Cost $0 Latest Version 4.0
Web-Link http://www.bfrl.nist.gov/oae/software/BEES/bees.html

A Guide to Life Cycle Assessment of Buildings
83
Tool Assumptions[15]
The BEES® system considers only those materials in a product system that are significant in
either weight, energy, or cost.
The functional unit for most building products is 0.09 m2 (1 ft2) of product service for 50 years.
For other products, the functional unit is specified in the BEES® manual.
The data are US averages.
For generic products, the most representative technology is evaluated. When data for the most
representative technology are not available, an aggregated result is developed based on the US
average technology for that industry.
For manufacturer-specific products, data are collected from the manufacturer through a
questionnaire and validated by a third-party consultant.
Normalization is applied to impact assessment results, and normalized results are presented in
the unit of impacts per year per capita.
Input
BEES® is a Windows-based modeling tool. The user is prompted to define “analysis parameters” by
providing information about weights to be assigned to environmental and economic performance and to
the environmental impact categories. Four weighting options are available for impact categories. The
user can then select alternatives products from a group of elements listed in BEES® for comparison.
Another window prompt allows users to select the impact categories for which the results are to be
displayed. The results obtained from BEES® are for a unit area or volume of a material or product. These
results could be multiplied to the actual quantity of material or product to get its total impact in a
building.
Output
The output can be viewed in graph form. Detailed graphs are available by life-cycle stages and
environmental flow. Summary graphs can also be viewed for overall, environmental, and economic
performance.
Strengths
BEES® offers a unique blend of environmental and economic performance for a product system,
facilitating easy comparison of products. The user can obtain a single value for performance, which
eliminates the need to decide the importance of various environmental impact categories. It includes
building element groups, such as building sitework and repair and maintenance elements. It is
transparent in documenting and providing all the supporting performance data and computational
algorithms.[44] It also includes interior fittings and furnishing to a certain extent.
Weaknesses
Right now, the tool has an embedded catalog of building products. It only includes data for 200 building
products covering 23 building elements.
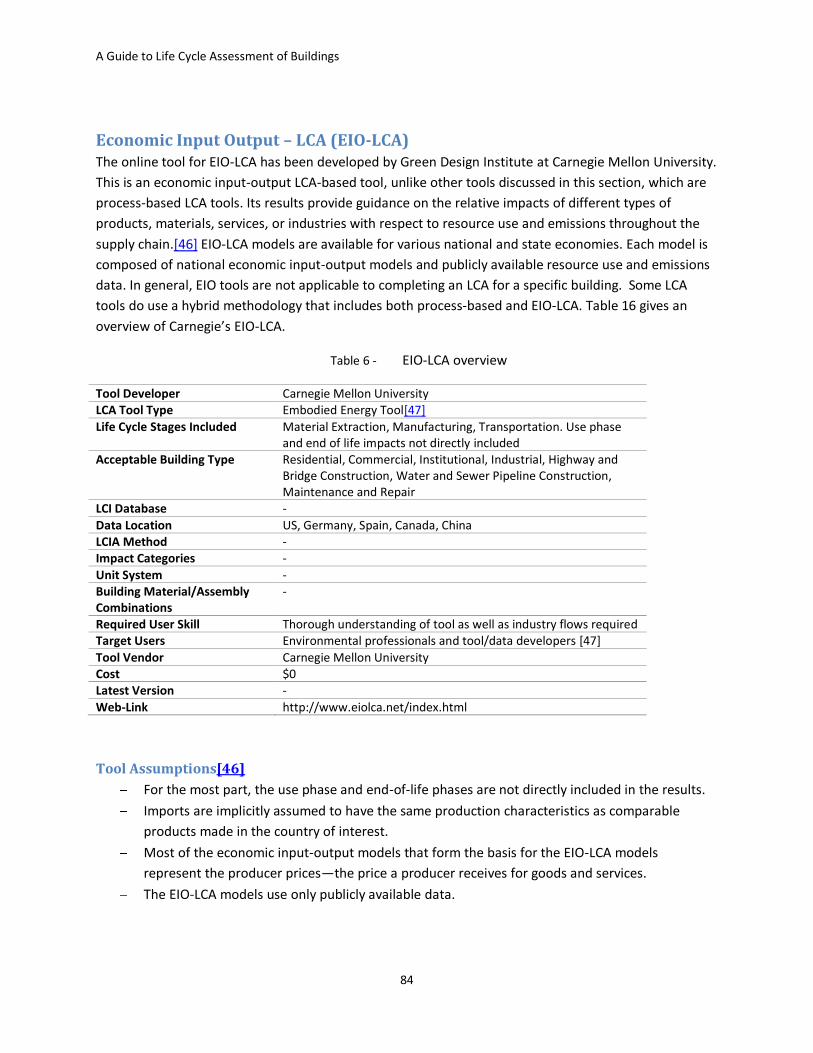
A Guide to Life Cycle Assessment of Buildings
84
Economic Input Output – LCA (EIO-LCA) The online tool for EIO-LCA has been developed by Green Design Institute at Carnegie Mellon University.
This is an economic input-output LCA-based tool, unlike other tools discussed in this section, which are
process-based LCA tools. Its results provide guidance on the relative impacts of different types of
products, materials, services, or industries with respect to resource use and emissions throughout the
supply chain.[46] EIO-LCA models are available for various national and state economies. Each model is
composed of national economic input-output models and publicly available resource use and emissions
data. In general, EIO tools are not applicable to completing an LCA for a specific building. Some LCA
tools do use a hybrid methodology that includes both process-based and EIO-LCA. Table 16 gives an
overview of Carnegie’s EIO-LCA.
Table 6 - EIO-LCA overview
Tool Developer Carnegie Mellon University LCA Tool Type Embodied Energy Tool[47]
Life Cycle Stages Included Material Extraction, Manufacturing, Transportation. Use phase and end of life impacts not directly included
Acceptable Building Type Residential, Commercial, Institutional, Industrial, Highway and Bridge Construction, Water and Sewer Pipeline Construction, Maintenance and Repair
LCI Database -
Data Location US, Germany, Spain, Canada, China LCIA Method - Impact Categories -
Unit System - Building Material/Assembly Combinations
-
Required User Skill Thorough understanding of tool as well as industry flows required Target Users Environmental professionals and tool/data developers [47]
Tool Vendor Carnegie Mellon University Cost $0 Latest Version -
Web-Link http://www.eiolca.net/index.html
Tool Assumptions[46]
For the most part, the use phase and end-of-life phases are not directly included in the results.
Imports are implicitly assumed to have the same production characteristics as comparable
products made in the country of interest.
Most of the economic input-output models that form the basis for the EIO-LCA models
represent the producer prices—the price a producer receives for goods and services.
The EIO-LCA models use only publicly available data.

A Guide to Life Cycle Assessment of Buildings
85
Input
The tool requires four types of input. The user is asked to select a price model based on the country of
analysis. Then, the industry and sector the product belongs to is selected. In case of buildings, the
industry to be selected is “Construction.” Sectors like commercial buildings and residential buildings are
available as options under the Construction industry selection. The amount of economic activity for that
sector is also required in units of million dollars. In the fourth step, the user selects the category of
results to be displayed.
Output
The EIO-LCA model produces results for inventory analysis and do not estimate the actual
environmental or human health impacts. Results can be viewed for six categories: economic activity,
conventional air-pollutants, greenhouse gases, energy, toxic releases, and employment.
Strengths
The EIO-LCA model allows for system-level comparisons. It also provides for future product
development assessments. Moreover, the results are economy-wide, comprehensive assessments.
Weaknesses
The results of an EIO-LCA analysis represent the impacts from a change in demand for an industry
sector. Depending on the model chosen, an industry sector represents a collection of several industry
types, and this aggregation leads to uncertainty in how well a specific industry is modeled.
US LCI Database – by NREL The High-Performance Buildings research group at the National Renewable Energy Laboratory (NREL) is
working with the ATHENA® Institute in developing the U.S. Life-Cycle Inventory (LCI) Database, which is
publicly available on the NREL Web site. The LCA experts at NREL aim to solve the problem of data
consistency and transparency by providing a central source of critically reviewed LCI data.[17] The LCI
data are available in several formats: a streamlined spreadsheet, EcoSpold format spreadsheet,
EcoSpold XML file, and detailed spreadsheet with all the calculation details. The figure below presents a
screenshot of the US LCI Database in spreadsheet format obtained from the NREL Web site.

A Guide to Life Cycle Assessment of Buildings
86
Snapshot of the LCI spreadsheet for ‘Laminated Veneer Lumber Processing, at plant, in U.S. Pacific North West Region’
US LCIA Method – TRACI by EPA TRACI (Tool for the Reduction and Assessment of Chemical and other environmental Impacts) is an
impact assessment tool developed by EPA for Sustainability Metrics, Life Cycle Assessment, Industrial
Ecology, Process Design, and Pollution Prevention. The impact categories in TRACI include acidification,
eco-toxicity, eutrophication, fossil fuel depletion, global warming, human health cancer, human health
criteria, human health non-cancer, ozone depletion, and smog formation. The categories were selected
based on their level of commonality with existing literature in this area, consistency with EPA
regulations and policies, current state of development, and perceived societal value.[48] TRACI was
developed specifically for the US using input parameters consistent with US locations.
International LCA Tools
EQUER
(http://www.cenerg.ensmp.fr/english/logiciel/indexequer.html)
Developed by the Center for Energy and Processes in Paris, the life cycle simulation tool EQUER is based
on a building model structured in objects, this structure being compatible with the thermal simulation
tool COMFIE. The functional unit considered is the whole building operated over a given duration.[51]
Impacts due to the activities of occupants (e.g., home-to-work transportation, domestic waste
production, and water consumption) may be taken into account according to the purpose of the study:
this possibility is useful, e.g., when comparing various building sites with different home-to-work
distances, waste collection system, water network efficiency, etc.
LCAidTM
(http://buildlca.rmit.edu.au/CaseStud/Buxton/BuxtonPS_LCAid_use.html)

A Guide to Life Cycle Assessment of Buildings
87
LCAid™ is computer software developed by DPWS Environmental Services with computer programming
by Dr. Andrew Marsh of the University of Western Australia Department of Architectural Science.[49] It
is a user-friendly decision-making tool for evaluating the environmental performance and impacts of
designs and options over the whole life cycle of a building, object, or system. It is well integrated with
other environmental software—it can work on a 3D model created in software such as ECOTECT or
Autocad. ECOTECT has been developed to interface with LCAid™ using building geometry as a bridge to
incorporate LCA data into the design tool. It is possible to read other sets of LCA data from SimaPro or
other LCA models.[49]
Eco-Quantum
(http://www.ivam.uva.nl/index.php?id=373&L=1)
Developed by IVAM, Eco-Quantum is an LCA tool to analyze residential projects. Eco-Quantum’s VO Tool
is for use during the provisional design phase.[49] First a type of building is selected. Then the materials
to be used are specified. Clients and local planning authorities can use Eco-Quantum as a policy tool to
define the environmental specifications for a house-building program. And the built-in VO Tool for
provisional design provides architects with a clear picture of their building’s sustainability from early in
the design phase, thus helping them to improve its environmental performance while it’s still on the
drawing board.[50]
LCA in Sustainable Architecture (LISA)
(http://www.lisa.au.com/)
LISA is a streamlined LCA decision support tool for construction. It includes construction and operation
impacts. The tool was developed keeping in mind the specific needs of architects and other industry
professionals who require a simplified LCA tool to assist in green design. Bill of materials and quantities,
work schedules, fuel consumption by construction equipment, and utilization schedules are required as
input. Output is produced in both graphical and tabular format showing the environmental impact of
each stage in terms of: resource energy use in GJ, greenhouse gas emissions in metric tons of equivalent
CO2, SPM, NMVOC, water, NOx, and SOx.
Envest
(http://envestv2.bre.co.uk/account.jsp)
Developed by BRE, the Web-based tool Envest has been designed to simplify the process of designing
environmentally friendly buildings. It allows both environmental and financial tradeoffs to be made
explicit in the design process, allowing the client to optimize the concept of best value according to their
own priorities.[51] It has been developed for use during the early design stage. It allows large design
companies to store and share information in a controlled way, enabling in-house benchmarking and
design comparison. Two versions of the tools are available: Envest 2 estimator and Envest 2 calculator.
LCAit
This tool was developed by CIT Ekologic, a division of Chalmers. It is a complex tool where emissions,
wastes, and resources generated by a process are specified in the Process Card. The primary product of

A Guide to Life Cycle Assessment of Buildings
88
a process (i.e., resources which flow between processes) cannot be defined until links have been
established between two or more processes.
PEMS
(http://www.pira.com/ClientServices/USEMIS.htm)
Pira Environmental Management System (PEMS) is a tool for experts. Ample descriptive fields allow the
user to offer narrative information for all process blocks and the system as a whole. Data developed by
the user, however, are difficult to input into the database format, and archiving systems for reuse is
tedious.
TEAM™
(https://www.ecobilan.com/uk_team.php)
This LCA tool is developed from EcoBalance/Ecobilan. TEAM™ is one of the most powerful and flexible of
the tools. Selecting and defining inputs and outputs within the lowest process/unit level is quite simple
using the tool bar; flows may be defined by values or variables and equations. TEAM™ allows the user to
build and use a large database and model any system representing the operations associated with
products, processes, and activities.
Umberto
(http://www.umberto.de/en/)
Umberto was developed by a European consortium, among which are mostly German and Swiss
institutions and companies (e.g the German Institute for Environmental Informatics and Institute for
Energy and Environmental Research). Umberto is a software tool for material and energy flow
calculation and analysis based on graphical modeling of process systems. Based on the concept of
material flow networks, the powerful calculation algorithm of Umberto allows one to determine all
material and energy flows in the system under study.
SBi LCA tool
(http://www.en.sbi.dk/)
Developed at the Danish Building Research Institute (SBi), this LCA tool consists of a database and an
inventory tool for the calculation of the potential environmental effects for buildings and building
elements. It differs from most other LCA tools currently available by the method it uses to handle
uncertainty.
Boustead
(http://www.boustead-consulting.co.uk/products.htm)
Developed by Dr. Ian Boustead, this model is best known for its extensive database especially for the
building industry. It includes extensive data modules for energy carriers, fuels production, and
transportation. Individual process, segment, and complete product data are included for common
process operation segments and commodity materials manufacturing subsystems.
A Guide to Life Cycle Assessment of Buildings
89
SimaPro
(http://www.pre.nl/default.htm)
Developed by PRe consultants, this software is product design orientated. SimaPro is a professional LCA
software tool. Complex products with complex life cycles are easily compared and analyzed. The
inventory databases and the impact assessment methods can be edited and expanded without
limitation. The ability to trace the origin of any result makes SimaPro unique. It is one of the most widely
used LCA tool. Three versions of SimaPro are available, depending on the kind of analysis one intends to
conduct.
GaBi
(http://www.gabi-software.com/)
Developed at the IKP University of Stuttgart in cooperation with PE Product Engineering GmbH and
distributed by PE Product Engineering GmbH, GaBi is a generic LCA tool applicable to any industrial
product or process. It is very popular in the automobile industry. The GaBi 4 software is one of the
leading expert systems for balancing complex and data-intensive process networks. Other than LCA,
GaBi has the capabilities to assist in greenhouse gas accounting, life cycle engineering, design for
environment, substance flow analysis, strategic risk management, and total cost accounting.[52] GaBi
enables the user to develop the product system for analysis.[49] Since the product system is user-
defined and not fixed, as in other building product and whole-building LCA tools, it is presumed that
there are no tool assumptions.
Related Tools – Pharos, Green Footsteps, and Eco-Scorecard
Pharos Framework
(http://www.pharosproject.net/framework/index/)
The Pharos framework is under development by the Healthy Building Network, University of Tennessee
and Cascadia. It aims at providing a 360° view of green material attributes , putting those claims in
context and testing them against verifiable data and community consensus of ideal goals.[53] The
framework provides results in three impact categories:
Health and Pollution
Environment and Resources
Social and Community.
Pharos is an online-tool providing impacts for three building product classes:
MDF-Particle Board –Wheatboard
Resilient Flooring
Batt Insulation
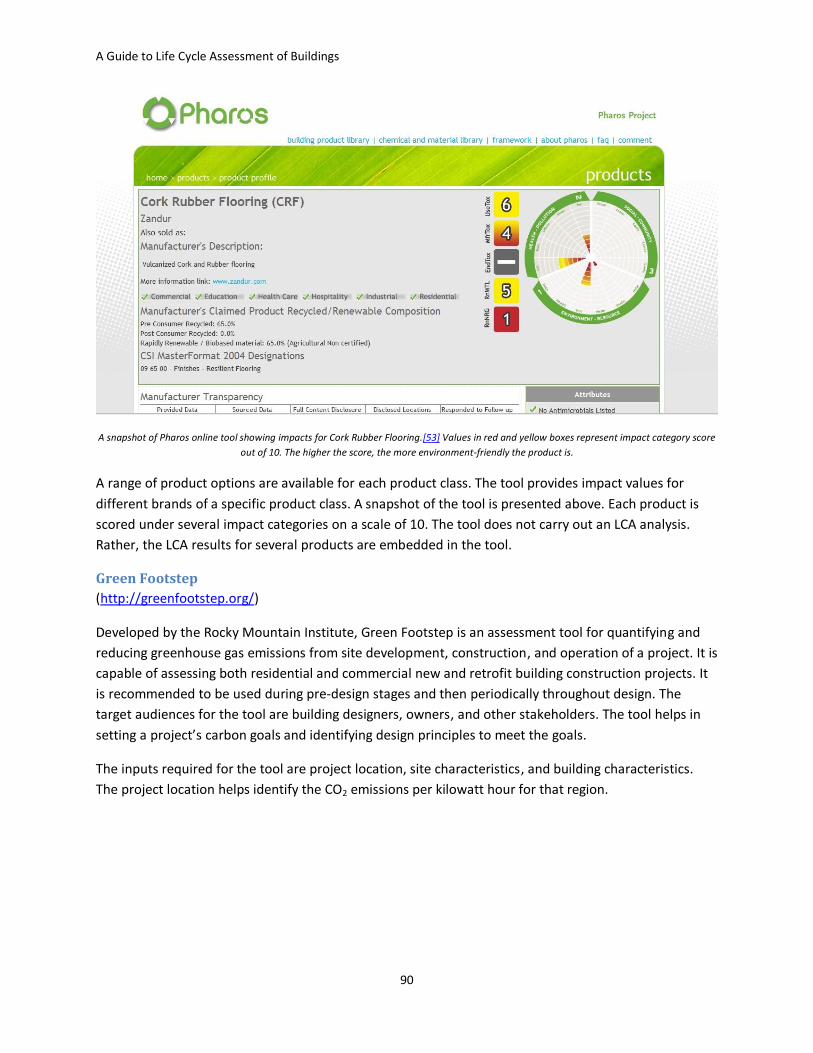
A Guide to Life Cycle Assessment of Buildings
90
A snapshot of Pharos online tool showing impacts for Cork Rubber Flooring.[53] Values in red and yellow boxes represent impact category score
out of 10. The higher the score, the more environment-friendly the product is.
A range of product options are available for each product class. The tool provides impact values for
different brands of a specific product class. A snapshot of the tool is presented above. Each product is
scored under several impact categories on a scale of 10. The tool does not carry out an LCA analysis.
Rather, the LCA results for several products are embedded in the tool.
Green Footstep
(http://greenfootstep.org/)
Developed by the Rocky Mountain Institute, Green Footstep is an assessment tool for quantifying and
reducing greenhouse gas emissions from site development, construction, and operation of a project. It is
capable of assessing both residential and commercial new and retrofit building construction projects. It
is recommended to be used during pre-design stages and then periodically throughout design. The
target audiences for the tool are building designers, owners, and other stakeholders. The tool helps in
setting a project’s carbon goals and identifying design principles to meet the goals.
The inputs required for the tool are project location, site characteristics, and building characteristics.
The project location helps identify the CO2 emissions per kilowatt hour for that region.

A Guide to Life Cycle Assessment of Buildings
91
A snapshot of the Green Footstep tool showing analysis results for an 8,000-square-foot multi-family residential building with an expected
building lifespan of 50 years. The figure shows carbon emissions for the proposed building design compared to a net-zero and carbon neutral
building design. The user can slide the bar for building size and lifespan to see the change in values of Carbon Debt.
ecoScorecard
(http://ecoscorecard.com/)
ecoScorecard allows manufacturers to publish their green products with corresponding environmental
characteristics on a Web-based catalog so clients may quickly search by name, contribution, or another
attribute. Then, ecoScorecard goes further, enabling the user to evaluate a product, or group of
products, against major environmental rating systems and generate the documentation necessary for
inclusion in the certification process. ecoScorecard allows the user to determine the score value from
the use of the specific products for various green rating systems, such as LEED, CHPS, and Green Globes.
The value of ecoScorecard in LCA analysis is to adapt the data to provide products data for the LCA
analysis.[54]
BIM and LCA – LCADesign™ Tool Effective tools can potentially reduce the time consumed in conducting an LCA. Building Information
Modeling (BIM) is seen as one such tool that can aid in the LCA process, as it provides the opportunity
for quantity take-offs. An integration of BIM and LCA tools seems to be an ideal setup to streamline the
process of LCA. One such ongoing effort is the LCADesign™ tool being developed by Cooperative
Research Center for Construction Innovation in Australia. LCADesign™ is fully automated from the 3D
CAD drawing of a building to enable the calculation of environmental impacts resulting from the choice
of materials to be reflected in design assessment.[55] The automated take-offs provide quantities of all-
building components created from an extensive list of materials such as concrete, metals, timber, glass,

A Guide to Life Cycle Assessment of Buildings
92
plastics, etc. This design information is combined with a life cycle inventory of construction materials to
estimate key internationally recognized environmental indicators such as Eco-indicator 99.[55] The input
required for the tool is a 3D drawing for a building. LCADesign™ reads the information contained in the
IFC format of the 3D drawing file. The Australian Life Cycle Inventory (LCI) database is linked to the tool.
The LCADesign™ tool can be used to assess design at the preliminary as well as detailed stages. Thus, it
can be predicted that the availability of this tool and other similar tools in the market will surely change
the way LCA is perceived by the architects.
Chapter Summary In this chapter, we discussed:
Configuration of an LCA tool
LCA tools can be classified
o Based on different levels of LCA application: Product, building assembly and whole-
building LCA tools
o Based on user skills: Tools for LCA practitioners and tools for general users
o Based on region: Tools containing LCI data for a specific country or region
o Based on its application to a design stage
o Based on life-cycle stages that can be evaluated using the tool
US LCI Database – by NREL
US LCIA Method – TRACI by EPA
Three related tools were described
o Pharos by University of Tennessee
o Green Footsteps by Rocky Mountain Institute
o Eco-Scorecard by the ecoScorecard Company
LCA and BIM – LCADesign Tool
Following LCA tools were discussed (see table below)

A Guide to Life Cycle Assessment of Buildings
93
Tool LCA Tool Type Life Cycle Stages
Included
Acceptable
Building
Type
Impact Categories Web-
Link
ATHENA®
Impact
Estimator
Whole
Building
Analysis
Tool
Building
Assembly
Analysis
Tool
Tool for
General
Users
Material
Extraction and
Manufacturing
Related Transport
On-site
Construction
(energy use +
related
emissions)
Operation
(energy only)
Maintenance and
Replacement
Demolition and
Transport to
Landfill
Industrial,
Institutional,
Commercial,
Residential for
both New
Construction
and Major
Renovation
Acidification
Potential
Global Warming
Potential
Human Health
Respiratory
Effects Potential
Ozone Depletion
Potential
Smog Potential
Aquatic
Eutrophication
Potential
Total Fossil
Energy
http://w
ww.ath
enasmi.
org/tool
s/impac
tEstimat
or/
ATHENA®
EcoCalculator
Building
Assembly
Analysis
Tool
Tool for
General
Users
Material
Extraction and
Manufacturing
Related Transport
On-site
Construction of
Assemblies
Maintenance and
Replacement
Demolition and
Transport to
Landfill
Industrial,
Institutional,
Commercial,
Residential for
New
Construction,
Retrofits and
Major
Renovation
Global Warming
Potential
Embodied Primary
Energy
Pollution to Air
Pollution to Water
Weighted
Resource Use
http://w
ww.ath
enasmi.
org/tool
s/ecoCal
culator/i
ndex.ht
ml
BEES® Building
Product
LCA Tool
Material
Extraction and
Manufacturing
Not applicable Acidification
Potential
Global Warming
http://w
ww.bfrl.
nist.gov
/oae/so

A Guide to Life Cycle Assessment of Buildings
94
Tool LCA Tool Type Life Cycle Stages
Included
Acceptable
Building
Type
Impact Categories Web-
Link
Tool for
General
Users
Also a Life
Cycle Cost
Analysis
Tool
Transportation
Installation
Maintenance
Recycling and
Waste
Management
Potential
Eutrophication
Fossil Fuel
Depletion Indoor
Air Quality
Habitat Alteration
Water Intake
Criteria Air
Pollutants
Human Health
Smog Formation
Potential
Ozone Depletion
Potential
Ecological Toxicity
ftware/
BEES/be
es.html
EIO-LCA Embodied
Energy Tool
Material
Extraction and
Manufacturing
Transportation
(Use phase and end
of life impacts not
directly included)
Residential,
Commercial,
Institutional,
Industrial,
Highway and
Bridge
Construction,
Water and
Sewer
Pipeline
Construction,
Maintenance
and Repair
Not Applicable http://w
ww.eiol
ca.net/i
ndex.ht
ml
EQUER Whole
Building
Analysis
Tool
Material
Extraction and
manufacturing
Construction
Operation
Industrial,
Institutional,
Commercial,
Residential for
both New
Construction
and Major
Exhaust of abiotic
resources
Primary energy
consumption
Water
http://w
ww.cen
erg.ens
mp.fr/e
nglish/l
ogiciel/i
ndexeq

A Guide to Life Cycle Assessment of Buildings
95
Tool LCA Tool Type Life Cycle Stages
Included
Acceptable
Building
Type
Impact Categories Web-
Link
(energy +water +
domestic waste +
occupant
transportation)
and Maintenance
Demolition and
Waste
Management
Renovation comsumption
Acidification
Eutrophication
Global warming
Non-radioactive
waste
Radioactive waste
Odors
Aquatic
ecotoxicity
Human toxicity
Photochemical
smog
uer.htm
l
LCAid™ Whole
Building
Analysis
Tool
Building
Assembly
Analysis
Tool
Material
Analysis
Tool
Tool for
General
Users
Materials
Construction
Operations
(Energy +Water +
domestic waste)
and maintenance
Demolition and
waste
management
All types Life Cycle
Greenhouse gas
emissions
Life Cycle
embodied energy
Ozone depletion
Nutriphication
Heavy metals
Acidification
Summer/Winter
smog
Carcinogenesis
http://b
uildlca.r
mit.edu.
au/Case
Stud/Bu
xton/Bu
xtonPS_
LCAid_u
se.html

A Guide to Life Cycle Assessment of Buildings
96
Tool LCA Tool Type Life Cycle Stages
Included
Acceptable
Building
Type
Impact Categories Web-
Link
Solid Wastes
Water
consumption
Primary fuels
Eco-Quantum Whole
Building
Analysis
VO Tool:
Tool for
General
Users
Materials
Construction
Operations
(energy) and
Maintenance
Demolition and
waste
management
- (Eco-Point
method)
Greenhouse
effect
Eco toxicity
Human Toxicity
and more
http://
www.iv
am.uva
.nl/inde
x.php?i
d=373
&L=1
LISA Whole
Building
Analysis
Tool
Tool for
General
Users
Materials
Site Activities
Construction
Operations
(energy) and
Maintenance
Demolition and
Waste
Management
Multi-storey
offices, High
rise, Wide
span
warehouse
and Road and
rail bridges
Resource energy
use
Greenhouse gas
emissions
Suspended
particulate matter
Non-methane
VOC
Water
consumption
NOx
Sox
http://w
ww.lisa.
au.com/
Envest Whole
Building
Analysis Tool
Materials
Construction
Operations
- Climate change
Fossil fuel
depletion
http://e
nvestv2.
bre.co.u
k/accou

A Guide to Life Cycle Assessment of Buildings
97
Tool LCA Tool Type Life Cycle Stages
Included
Acceptable
Building
Type
Impact Categories Web-
Link
Tool for
General
Users
Also a Life
Cycle Cost
Analysis Tool
(energy) and
Maintenance
Demolition and
Waste
Management
Ozone depletion
Freight transport
Human toxicity to
air
Human toxicity to
Water
Waste disposal
Water extraction
Acid deposition
Ecotoxicity
Eutrophication
Summer smog
Minerals
extraction
nt.jsp
LCAit Product
Analysis Tool
Tool for LCA
Practitioners
Flexible to include or
exclude any life-
cycle stage
Not applicable Can be customized to
produce LCIA results
http://w
ww.eine
t.net/re
view/96
2195-
588110/
LCAiT.ht
m
PEMS Product
Analysis Tool
Tool for LCA
Practitioners
Flexible to include or
exclude any life-
cycle stage
Not applicable (Two impact
assessment
calculation methods:
problem-oriented
and media-oriented,
critical volume
assessment
methods.)
-
TEAM Product
Analysis Tool
Flexible to include or
exclude any life-
Not applicable - https://
www.ec

A Guide to Life Cycle Assessment of Buildings
98
Tool LCA Tool Type Life Cycle Stages
Included
Acceptable
Building
Type
Impact Categories Web-
Link
Tool for LCA
Practitioners
cycle stage obilan.c
om/uk_
team03.
php
Umberto Product
Analysis Tool
Tool for LCA
Practitioners
Flexible to include or
exclude any life-
cycle stage
Not applicable (Evaluates material
and energy flow)
http://w
ww.um
berto.d
e/en/
SBi LCA Product
Analysis Tool
Tool for LCA
Practitioners
- Not applicable (LCA database and
inventory tool)
-
Boustead Product
Analysis Tool
Tool for LCA
Practitioners
Cradle-to-Grave Not applicable (for life cycle
inventory
calculations)
http://w
ww.bou
stead-
consulti
ng.co.uk
/produc
ts.htm
SimaPro Product
Analysis Tool
Tool for LCA
Practitioners
Cradle-to-Grave Complex
products with
complex life
cycles
Climate change
Carcinogens
Respiratory
organics
Respiratory
inorganics
Radiation
Ozone layer
Ecotoxicity
Acidification /
eutrophication
Land Use
http://w
ww.pre.
nl/defau
lt.htm
A Guide to Life Cycle Assessment of Buildings
99
Tool LCA Tool Type Life Cycle Stages
Included
Acceptable
Building
Type
Impact Categories Web-
Link
Minerals
Fossil fuels
GaBi Product
Analysis Tool
Tool for LCA
Practitioners
Cradle-to-Grave Any industrial
product or
process
- http://w
ww.gabi
-
softwar
e.com/
3 STATE OF PRACTICE
This section presents the views of architects on the use of LCA methodology and examples of use of LCA
in practice. Seven architects were interviewed to understand the present state of integration of LCA in
practice. A review of eight building LCA case studies was completed that were either fictitious buildings
as part of an academic research exercise or typical design and construction projects to understand a
building’s environmental footprint.
Real design and construction projects are:
Case Study 1: New Jersey Meadowlands Commission (NJMC) Center for Environmental and
Scientific Education Building, New Jersey, US
Case Study 2: Stadium Australia, New South Wales, Australia
Case Study 3: Emeryville Resourceful Building, California, US
Case Study 4: Alicia Moreau De Justo School, Mendoza, Argentina
The research studies or ‘fictitious’ projects are:
Case study 5: Three Variants of a House, Switzerland
Case Study 6: Commercial Office, Thailand
Case Study 7: Two Variants of a House, US
Case Study 8: Office Building, US
This set of case studies was selected for review because each of them presents a unique scenario of use
of LCA in buildings and reveals practical issues associated with conducting LCA. The section also briefly
describes two LCA-related studies. One explores the possibility of including land-use impact in assessing
a building’s total environmental impact. The other presents a case of evaluating a building’s retrofit to
understand its benefit against constructing a new building. The aim of this section is to understand:

A Guide to Life Cycle Assessment of Buildings
100
1. Why a particular study was conducted and the motives behind the study
2. What specific aspect(s) of the building project were evaluated and a goal definition for each
project
3. During which project stage LCA was introduced in the project (only in case of real projects)
4. How the study was scoped
5. Which stages of building life-cycle are included in the study
6. How the data were collected
7. What assumptions were made for data not available
8. What LCA tools, LCI database, and LCIA method were used in each specific case
9. What team members were involved in the LCA process.
LCA from the Architect’s Perspective
To understand LCA from an architect’s perspective, researchers interviewed architects from seven architecture firms, which ranged from small to large. Some of these firms focused on sustainable practices only.
Large firms seemed more inclined to sustainable practices as compared to small firms. Integration of LCA in the design process also showed a similar trend. Apparently, this was primarily due to the fact that LCA is a time and money intensive exercise. Large firms were able to afford it while small were not. Moreover, most of these firms, which had used LCA in their projects, had hired an LCA expert to carry out the LCA study. This could be because of one of the two reasons (1) architects are not completely aware of simplified whole-building LCA tools or (2) architects do not have faith in these simplified whole-building LCA tools. One of the major obstacles that prevented the use of LCA in practice is the overwhelming information that architects obtain from the LCA experts. Since an LCA may result in environmental impact scores spread over different categories, it becomes difficult for the architects to rate which category is more important than the other. Another obstacle is the lack of incentives at present for the use of LCA. When asked about the kind of incentives that would instigate the use of LCA in practice, a range of responses were received. Some believed that monetary incentives in terms of tax benefits and subsidies on the purchase of green products would help, whereas others believed that if a range of projects using LCA were showcased and case studies compiled, it would be great incentive for other firms to adopt the LCA methodology. In terms of benefits of LCA, one interesting response suggested that since LCA is not a common practice at present, it could give an architecture firm an edge over the others and increase the market value of the firm. Responses regarding possible applications of LCA ranged from selecting a building product to selecting consultants and product vendors. A firm employing LCA in a project would prefer consultants and vendors who have an understanding of the LCA methodology.
Thus, it can be concluded that although LCA at present is not an essential component of most of the
architecture practices, a general understanding of the methodology is critical for architects to
understand the process and results of LCA.

A Guide to Life Cycle Assessment of Buildings
101
Target audience for LCA – Who will benefit? The target audiences in the building industry for LCA are mostly architects, product manufacturers, and
sustainability consultants. General contractors can also take the responsibility of conducting an LCA
study for the project in some situations. Other stakeholders, such as owners, building occupants, and
other consultants, are indirectly affected by the use of LCA in practice.
Real Projects Case studies 1-4 were reviewed in detail to understand and demonstrate the implementation of LCA in
building practice.

A Guide to Life Cycle Assessment of Buildings
102
Case Study 1: NJMC Center for Environmental and Scientific Education, NJ, US
This case study was reviewed because it represents one of the few documented examples of an
application of whole-building LCA in practice in the US. The primary source of information for this review
was the report published by the Rutgers’ Center for Green Building.[12]
Project Overview
Building Type Educational Facility Construction Duration
Commenced operation in April 2008
Area 9,590 SF
Purpose Built as an addition to NJMC’s existing educational facilities
Building Program
3 Classrooms, a Classroom/Laboratory, a Wet Chemistry Laboratory, Administrative Offices, along with an Observatory
Project Cost -
Architect Fredric A. Rosen Exterior view of the NJMC building [56] Contractor -
The building is supported by wooden beams and
columns along with concrete masonry units. The
exterior wall is constructed out of 2 x 6 wood stud
systems with glass fiber insulation and gypsum
board. The structure has a cast-in-place concrete
floor slab and two-pitched roofs with north-facing
clerestory windows. A variety of flooring materials,
such as linoleum, carpet, and terrazzo are featured
in the project. The windows use high-performance
glazing, and exterior doors are aluminum-clad wood
and glass.[12]
LCA Expert Rutgers Center for Green Building
LCA Tool SimaPro 7.1
LCI Database EcoInvent 2.0 for US conditions
LCIA method BEES® and IMPACT 2002+
Energy Calculation
Software
Phase in which LCA was introduced
Construction Phase[56]
Project Team Members involved in LCA
LCA Expert, General Contractor, Product Vendor/Manufacturer, Architect, Owner, Energy Modeler
Environmental Features[57]
165-unit rooftop solar panel array
Ceiling solar tubes
Recycled building materials
Recyclable and locally manufactured standing-seam metal roof
Energy-efficient heating, lighting ,and water system

A Guide to Life Cycle Assessment of Buildings
103
Why was an LCA study conducted?
The NJMC has been charged since its inception with the tasks of balancing economic development and
environmental preservation throughout the Meadowlands area.[12] In continuation of this mission,
NJMC decided to build its new Center for Environmental and Scientific Education to LEED standards. To
better understand the financial and environmental implications of this project over its life cycle, Rutgers
Center for Green Building was assigned the task of conducting the Life Cycle Cost (LCC) and Life Cycle
Assessment (LCA).
Incorporating LCA[12]
Step 1: Goal and Scope Definition Goal: The goal of the study was to evaluate and compare the life-cycle environmental impacts of the new NJMC center with the data from the literature; that is, to compare the environmental impact of building materials and systems used in the NJMC center with typical buildings. The impact categories evaluated were ozone depletion, acidification, and eutrophication potential with special emphasis on primary energy consumption and global warming.
Scope: The observatory building, which is physically separated from the classroom building, was excluded from the scope of the study because its area is only 5.5 percent of the total project area and is responsible for little energy use. Other components excluded were: bathroom supplies, furniture, laboratory equipment, site work outside the building footprint, landscaping and utilities outside the building, and any impacts resulting from planning and designing the building.
Functional Unit: Impacts have been calculated on a per square foot basis.
Building Lifespan: A 50-year lifespan was estimated by the architect. The study also explores the variation on the impacts for a 75-year lifespan.
System Boundary: The life cycle of the project was divided into three phases: Material Placement,
Operation, and Decommissioning. Figure 8 illustrates processes involved in each phase and thus defines
the boundary of the system to be studied.

A Guide to Life Cycle Assessment of Buildings
104
System boundary for LCA study of NJMC[12]
Step 2: Inventory Analysis An inventory of inputs and outputs was prepared using the EcoInvent 2.0 database (US conditions) for the majority of the inventory data sets. Other databases used include Franklin US LCI, the USA Input Output Database 98, IDEMAT 2001, and Industry 2.0.
Data Collection and Assumptions: The data collected for the material placement phase were based on contract documents, construction cost estimates, invoices, product submittals, material data safety sheets, personal communications with the architect and the owner, and inquiries of manufacturers and trade organizations.[12] For the inventory, the composition of the New Jersey (NJ) electricity grid was used for materials produced there. For materials produced in other states, inputs based on US-average electricity were used. Material losses during manufacturing and construction were added to the inventory. A 5 percent loss was assumed in the absence of information about losses. Information on replacement frequencies was estimated by the architect where information from published sources was missing. Transportation of raw materials to refinement and manufacturing is included within the LCI database EcoInvent 2.0.[12] Transportation from the manufacturing facility to the construction site was added. Energy consumed during the construction phase due to the use of power tools, lighting, and heavy equipment was also added. Allowances were made for using recycled materials or components.

A Guide to Life Cycle Assessment of Buildings
105
The operations phase only accounted for impacts due to heating, cooling, and ventilating the building; lighting; and water heating. To accomplish this, DesignBuilder software was used to model the energy consumption for this phase. Adjustments for solar photovoltaic panels were made in this calculation. The calculation for energy consumed for demolition of the NJMC center was based on a published research. It was assumed to be 16.5 MJ/ft2 (4.58 kWh/ft2). Some building materials and components from demolition will be recycled and reused, and the rest will be disposed of in a landfill.[12] Current practices of the local recycling industry were considered, and calculations were completed assuming recycling of as many building products or assemblies as possible. It was also assumed that the building’s environmental impact is not decreased if a building material or component is recycled or reused in the decommissioning phase. This implies that the credits for recycling or reuse are not accounted in the inventory calculation. Transportation to local recycling facilities was taken into account. Given the scope and boundaries of this LCA, it could be best described as a cradle-to-grave, process-based LCA.
Inventory Results: Once the data were collected, the material flows were then modeled using SimaPro
7.1 software. This software uses EcoInvent 2.0 and other inventory databases for calculations. The
building has an initial mass of 2,052 tons, out of which crushed concrete accounted for 761.0 tons (37.1
percent), gravel and sand together accounted for 696.7 tons (34 percent), and cement accounted for
118.0 tons (5.7 percent). Wood certified by the Forest Stewardship Council (FSC)[58] accounted for 94.4
tons (4.6 percent). The addition of materials for renovations and replacements account for 4 percent of
the life cycle building mass and raises the total mass to 2,140 tons. Following are the major contributors
during renovations and replacements: cold rolled steel, windows, GALVALUME, insulation, HVAC,
photovoltaic panels, doors, and paint. The mass distribution for the life cycle of the project is presented
in figure 9.
Life cycle mass distribution for NJMC building

A Guide to Life Cycle Assessment of Buildings
106
Note that the calculation of building materials and their contribution by weight is a useful way to
visualize the materials and their potential impacts. It may also be useful to normalize material
quantities in terms of the volume of material used, and by the relative cost of the materials used, as this
provides a more complete picture of materials used in the project, and their potential environmental
impact.
Step 3: Impact Assessment
The impact categories evaluated for the study were: primary energy consumption, global warming
potential, ozone depletion, acidification, and eutrophication potential. Two different environmental
impact methods supply the emission factors used in this study to convert the inventory data to
environmental impacts: Building for Environmental and Economic Sustainability (BEES®) and IMPACT
2002+.[12] Two impact methods were used to test the robustness of the results. The results for primary
energy, global warming, and acidification potential yielded the same results for both impact methods,
whereas ozone depletion and eutrophication potential results differed. The difference in the results for
ozone depletion and eutrophication potential was mainly because the two methods account for
different chemicals in calculating the impacts.
Step 4: Results and Interpretations
Results: The overall environmental impact on primary energy consumption, global warming potential,
and acidification potential for NJMC is less than a conventional educational building (based on studies by
Scheuer et al [2003], Kole and Kernan [1996], and EIA [2003]). NJMC has a higher impact than a
conventional building in the material placement phase, which is offset by a much lower impact during
the operation phase. The impacts for NJMC in the material placement phase is higher than its peer
group due to the quantity of materials used in the foundation, photovoltaic cells, concrete foundation
caps and floor slab, roof decking, and standing seam metal roof. The decommissioning phase is relatively
less important than the materials placement and operations phase, as it makes a significantly lower
contribution to the impacts.[12] Figure 10 shows how each impact is distributed among different life-
cycle phases of the NJMC building. The Y-axis presents the contribution of each life-cycle stage towards
each impact category calculated as a percentage of overall impact.

A Guide to Life Cycle Assessment of Buildings
107
Distribution of impacts among different life cycle phases based on IMPACT 2002+ method[12]
Total primary energy consumption after reduction for the use of photovoltaic panels is 8.9 x 10³
megawatt-hours. The global warming potential (GWP) for the material placement phase was slightly
higher than is conventional. Total GWP was equal to 1,660 tons of carbon dioxide equivalent according
to IMPACT 2002+. Aquatic acidification potential was equal to 10.2 tons of sulfur dioxide equivalent, and
terrestrial acidification potential was 33.5 tons of sulfur dioxide equivalents, according to IMPACT
2002+. Total acidification potential (AP) is equal to 528 of hydrogen-ion ton moles equivalent in BEES®
4.0. The results for ozone depletion (OD) potential and eutrophication were not consistent from the two
LCIA methods. Total ozone depletion for NJMC was 0.47 lb of CFC-11 equivalent based on IMPACT 2002+
and 0.23 lb of CFC-11 equivalent based on BEES® 4.0. This is because the IMPACT 2002+ method
accounts for more compounds leading to ozone depletion.
Interpretations:
Linoleum, which is often considered a green material because it is manufactured from
renewable feedstock, carries a large eutrophication burden because of the way it is produced.
The life-cycle ozone depletion potential of NJMC is minimal.
The life-cycle primary energy consumption of the NJMC is much less dominated by the
operations phase than in conventional buildings, due to the energy efficiency of the NJMC and
the solar panels.
The LCA also highlighted how building material choices may inadvertently shift impacts across
impact categories and/or geographies.
As predicted building lifespan increases, the primary impacts shift from the construction phase
to the operations phase.

A Guide to Life Cycle Assessment of Buildings
108
Benefits of the NJMC LCA
The design team at the NJMC made the following conclusions regarding their LCA study.
LCA can act as a valuable tool for quantifying the benefits of a green building.
The results of the study can be used to guide future policy making regarding the construction of
green buildings throughout the Meadowlands area.
LCA can prove useful to the U.S. Green Building Council’s ongoing evaluation and revision of the
LEED Standards.
This study highlights the importance of design choices in determining environmental impacts
during materials placement, operation, and decommissioning of buildings. It shows that choices
imposing higher impacts during the materials placement phase can yield dramatically lower
impacts during operation.
Lessons Learned
Materials generally regarded as low-impact can have a large environmental footprint. LCA helps
in selecting materials on a case-to-case basis rather than going with popular choices.
The estimated life of a building can be a useful criteria in deciding which life-cycle stage needs
more attention: manufacturing and construction or operation and maintenance.

A Guide to Life Cycle Assessment of Buildings
109
Case Study 2: Stadium Australia / ANZ Stadium, New South Wales, Australia
This case study was reviewed as it presents one of the most early and successful examples of using
whole-building LCA to review design options during the schematic design phase and review impacts of
each life-cycle stage during the construction phase. Two LCA studies were conducted for the project,
one at the project tender stage and the other during construction. The primary source of information for
this review was the study conducted by RMIT[59] and a paper by Andrew Myer and Chet Chaffee.[60]
Project Overview[59]
Building Type Stadium Construction Duration
1996-1999 (new construction), 2001-2003 (reconfiguration)
Capacity 110,000 (Olympic), 80,000 (post Olympic)
Purpose Built as part of the 2000 Summer Olympic Park development plan
Building Program
7 floor levels + 1 basement Houses restaurants, lounges, private boxes, two large banquet halls and public areas along with stadium seating
Project Cost $690 million Architect Bligh Lobb Sports Architects
View of Stadium Australia Contractor Multiplex Constructions
The stadium is a steel and concrete structure with a
30,000 m2 elliptic shaped roof, supported by two 14
m deep tapering steel trusses anchored in concrete
thrust blocks and covered with translucent
polycarbonate sheeting with four levels of opacity
to filter the sun. The original capacity of the
stadium was reduced to 80,000 after the conclusion
of the 2000 Olympic Games. The project
management scheme adopted for the project was
Build-Own-Operate-Transfer back to the
Government (BOOT).
LCA Expert ERM Mitchell McCotter, Department of Public Works and Services (DPWS)
LCA Tool LCA tool by NSW Department of Public Works and Services based around the Boustead 3 model
LCI Database Boustead 3 + data collected from other sources
LCIA method -
Energy Calculation
Estimated by Rudds Pty Ltd
Phase in which LCA was introduced
Preliminary design phase, Construction phase
Project Team members involved in LCA
Developer, Environmental Consultant, Structural Engineer, Architect, Quantity Surveyor, Services Engineer, LCA Expert, Contractor

A Guide to Life Cycle Assessment of Buildings
110
Environmental Features
Passive ventilation
Daylighting through specially constructed light voids
Harvested rainwater used for irrigation
Recycled water used for flushing toilets
Water saving devices provided throughout the stadium
Minimal use of PVC and other building materials with high environmental impacts as identified
by the LCA methodology
Environmentally friendly gas fired co-generators serve as a backup to the main supply of
electricity
Why was an LCA study conducted?
LCA was used for Stadium Australia because the Planning Policy for Olympic games projects No 38 (SEPP
38) refers to compliance with Ecologically Sustainable Development (ESD) and the Environmental
Guidelines for the Summer Olympic Games.[59] These required that the project consider the
environmental impact during the life of the project; that is, the impact of the manufacture, use, and
disposal of materials. Multiplex Construction used LCA to quantify Stadium Australia’s environmental
performance.
Incorporating LCA: Preliminary LCA
The first LCA study was conducted to evaluate three design options and select the most environmentally
friendly one. It was implemented as a broad-brush approach, appropriate to the level of detail available
at the pre-design stage.[60]
Option 1: Base Case – design based on normal building practice, with little environmental innovation
Option 2: Improved design including reduced-impact components and available technologies
Option 3: Enhanced environmental case that included cutting-edge technologies expected to come onto
the market within the development program.
As part of the first LCA, energy profiles, water use, and material quantities were estimated. Inventory
calculations were completed using the Boustead model. An eco-profile was developed for each design
option, but results were not broken down for investigation of individual components. The results of the
LCA study[60] are presented in figure 12.

A Guide to Life Cycle Assessment of Buildings
111
Environmental burdens for three design options for Stadium Australia
It can be observed that option 2 achieved significant reduction in all the categories. Option 3 goes a step
ahead in reducing toxic air pollution to 35 percent of the base case. Using a mixture of Life Cycle
Assessment and cost/benefit analysis, option 2, improved design case, was chosen. This use of LCA can
be considered parallel the current use of energy modeling within the LEED rating system. In the LEED
rating system, a “base” building, meeting current energy code requirements, is modeled. A set of design
improvements, aiming to make the building more energy efficient, are then chosen, and additional
energy models are created to demonstrate the improvements in energy use as compared to the “base”
building. This points to one future option for use of LCA in building design, and one that is parallel to a
well-understood process in U.S. building practice.
Incorporating LCA: Detailed LCA
The project also included a detailed LCA, completed during the construction phase of the
building.
Step 1: Goal and Scope Definition
Goal: The goal of the detailed LCA was to quantify raw material use, energy use, emissions to air and
water, and solid wastes.
Scope: The scope of the study was limited to reporting the quantities of environmental inputs (raw
material and energy) and outputs (air and water emissions and solid waste). No life-cycle impact
assessment was carried out. Only the major building systems were included in calculations. Furnishings
and fit-out were not included.
Functional Unit: The functional unit was the provision of a stadium for 50 years. The functional unit was
further split into four life-cycle stages. For example, the functional unit for the procurement stage is
extraction, manufacturing, and transportation of materials to the site.

A Guide to Life Cycle Assessment of Buildings
112
Building Lifespan: 50 years
System Boundary: Stages included for evaluation are procurement (raw material extraction,
manufacture, and transport) of the building systems, construction and reconfiguration, operation and
maintenance, and demolition. Figure 13 presents the system boundary for the study. It can be seen that
recycling activities are not included in the system boundary.
System boundary for LCA study of Stadium Australia[59]
Step 2: Inventory Analysis
Data regarding building systems and operational processes for all the four stages of the life cycle were
collected. This included estimated annual energy and water consumption and material quantities.
Data Collection and Assumptions: This was accomplished using a quantitative questionnaire completed
by the contractor, which was then verified and supplemented using computer databases of previous
studies, published literature, previous energy or environmental audits, and direct contact with the
product manufacturer or designer. Building product suppliers were contacted for a description of their
manufacturing process and associated raw materials, energy use, water use, and waste products; thus,
product-specific data were used. Data were also collected from other studies, especially for the
operational phase. Operational data were collected from invoices for electricity, water, diesel, gasoline,
natural gas, and monthly reports on energy use. Input data was sourced from suppliers and was product
and site specific where possible. Where site specific data were not available, generic LCA data for similar
products and processes were used. The results were aggregated for the whole life cycle of the stadium.
Once all the data were collected from all the sources, they were fed into the Boustead model using a
DPWS (Department of Public Works and Services) tool. The Boustead model calculated the emissions
and waste produced at different stages.
Inventory Results: The result from inventory analysis is discussed in Step 4, as it forms the basis of
interpretations. (This is because impact assessment was not carried out for the study.)
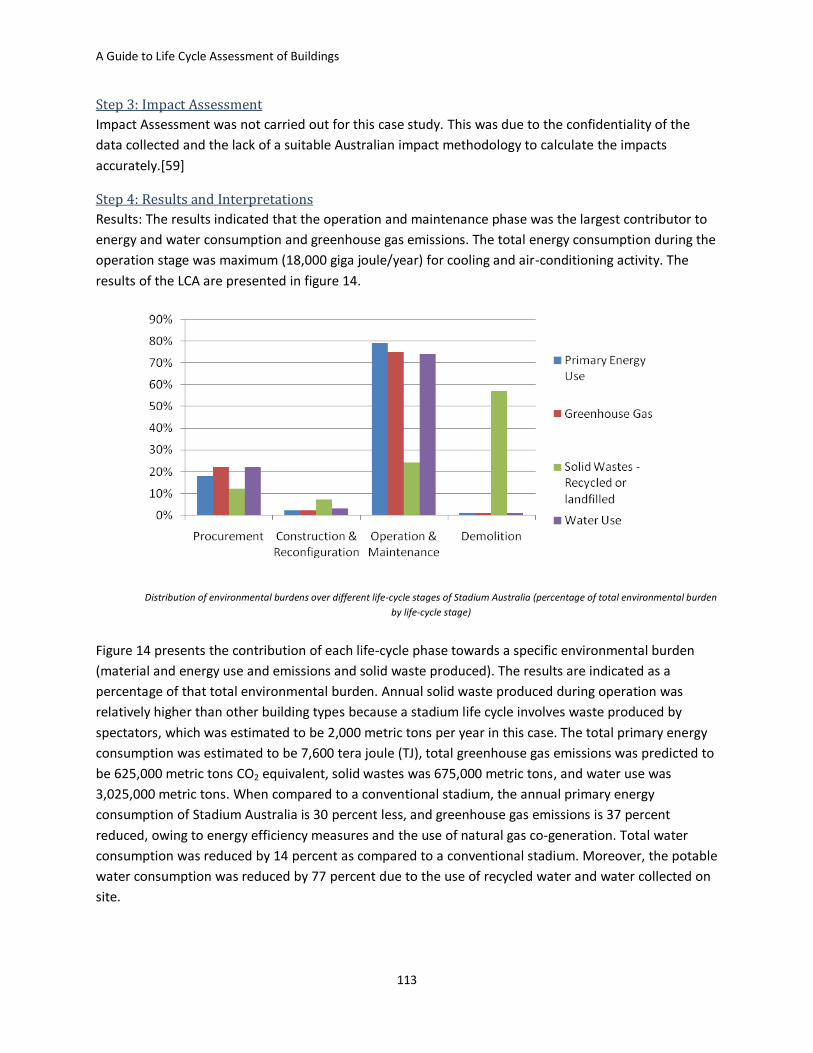
A Guide to Life Cycle Assessment of Buildings
113
Step 3: Impact Assessment
Impact Assessment was not carried out for this case study. This was due to the confidentiality of the
data collected and the lack of a suitable Australian impact methodology to calculate the impacts
accurately.[59]
Step 4: Results and Interpretations
Results: The results indicated that the operation and maintenance phase was the largest contributor to
energy and water consumption and greenhouse gas emissions. The total energy consumption during the
operation stage was maximum (18,000 giga joule/year) for cooling and air-conditioning activity. The
results of the LCA are presented in figure 14.
Distribution of environmental burdens over different life-cycle stages of Stadium Australia (percentage of total environmental burden
by life-cycle stage)
Figure 14 presents the contribution of each life-cycle phase towards a specific environmental burden
(material and energy use and emissions and solid waste produced). The results are indicated as a
percentage of that total environmental burden. Annual solid waste produced during operation was
relatively higher than other building types because a stadium life cycle involves waste produced by
spectators, which was estimated to be 2,000 metric tons per year in this case. The total primary energy
consumption was estimated to be 7,600 tera joule (TJ), total greenhouse gas emissions was predicted to
be 625,000 metric tons CO2 equivalent, solid wastes was 675,000 metric tons, and water use was
3,025,000 metric tons. When compared to a conventional stadium, the annual primary energy
consumption of Stadium Australia is 30 percent less, and greenhouse gas emissions is 37 percent
reduced, owing to energy efficiency measures and the use of natural gas co-generation. Total water
consumption was reduced by 14 percent as compared to a conventional stadium. Moreover, the potable
water consumption was reduced by 77 percent due to the use of recycled water and water collected on
site.

A Guide to Life Cycle Assessment of Buildings
114
Interpretation: The operation and maintenance phase can be considered the most crucial stage, as its
energy use, greenhouse gas emissions, and water use are high relative to the other stages. Measures
should be taken to reduce the cooling and air-conditioning load for the project, since that is the largest
contributor to primary energy use and greenhouse gas emissions.
Benefits of Stadium Australia LCA
Following is a list of benefits of the preliminary and the detailed LCA on Stadium Australia.
The preliminary LCA was helpful in reviewing design options and choosing the best option taking
into account both cost and environmental impacts.
In general, results of early-stage LCA can aid in decision and policy making.
Detailed LCA can help in preparing environmental management plans and programs for the
operation of a facility.
The detailed LCA helped Multiplex Construction to quantify the environmental performance of
the stadium.
The detailed LCA helped to set a benchmark for the environmental performance of future
stadiums.
The preliminary LCA ensured that the regulatory and planning requirements were met.
The preliminary LCA assisted in choosing building materials and in design issues such as waste
and energy efficient design.
Multiplex Construction can use the lessons learned from the LCA in other large-scale public
buildings.
Multiplex Construction and building product manufacturers, suppliers, and subcontractors have
gained a better understanding of their interaction with the environment in terms of raw
materials, energy use, and emissions to air, water, and land.
Problems Encountered
The following problems were highlighted by the Stadium Australia design and construction team:
As mentioned earlier, data were collected through questionnaire completed by the contractors;
data collection was difficult because subcontractors were asked to participate in building the
inventory, which was not an easy task for them; using international data was also a problem, as
different countries had different fuel mixes for energy
Confidentiality of the data
Lack of a suitable Australian impact methodology—because of the lack of an established impact
methodology in Australia, the detailed LCA used quantities of emissions instead of quantifying
environmental impacts
Lack of data on impacts for Australia.
Lessons Learned
Conducting LCA at the early design stage and then at an intermediate stage of construction can
be a helpful strategy to make sure that a project’s environmental goals are met.
State or local codes can affect the application of LCA in a project.

A Guide to Life Cycle Assessment of Buildings
115
Case Study 3: Moreau School, Mendoza, Argentina
This case study presents an example in which a simplified whole-building LCA was used to compare a
few simple energy-conserving technologies with traditional building technologies. This can be thought of
as the sort of LCA that would be completed when the goal is to understand the environmental
implications of product substitution; that is, the replacement of traditional construction means and
methods with systems that purport to provide better energy performance. This type of case study can
also be used to calculate an environmental payback estimate on the amount of time it takes to
ameliorate the incremental environmental damage used caused by using better performing materials
that may have a larger initial environmental footprint. The primary source of information for this review
was a journal paper by Arena and de Rosa.[4]
Project Overview
Building Type School Construction Duration
-
Area - Purpose -
Building Program
3 blocks, Only the classroom block considered for the study
Section through the classroom block of Moreau School[4] Project Cost - Architect Human Environment and Housing
Laboratory, R and D
Owner School Board of Mendoza
The building structure composed of metal sloping
roofs and horizontal concrete roofs, both insulated
with expanded polystyrene. It is assumed that the
external walls for the traditional case were
composed of a single brick layer. For the energy-
conserving case, a double brick layer with thermal
insulation in between was considered. The aim of
the project was to obtain maximum thermal and
visual comfort with minimum fossil energy
consumption, using local available technologies,
maximizing the use of local specialized labor, and
reducing global cost without affecting the building’s
durability and quality.
LCA Expert A.P. Arena, C. de Rosa LCA Tool -
LCI Database SBID Database from the Danish Research Institute
LCIA method SBID Database Energy Calculation
LANL Method
Phase in which LCA was introduced
Post-construction
Project Team Members involved in LCA
-

A Guide to Life Cycle Assessment of Buildings
116
Environmental Features
Solar gain from north facing clerestory windows
Cross ventilation in the northern rooms assisted by wind catchers
Fixed external overhang
Conservative double glazed windows with rubber gasketting
Double layer brick wall with insulation in between
Internal diffuser devices to avoid the direct radiation incident on the work surface
Hybrid ground cooling system for summer conditioning of northern rooms
Why was an LCA study conducted?
The LCA study was taken up to meet the project goal of obtaining maximum visual and thermal comfort
with minimum fossil energy consumption. The design of the building was commissioned by the School
Board of Mendoza and given to the Human Environment and Housing Laboratory of the National
Scientific and Technological Research Council of Argentina.[4]
Incorporating LCA
Step 1: Goal and Scope Definition
Goal: The goal of the LCA was to perform a comparison of traditional and energy-conserving
technologies applied in school buildings of Andean arid regions in Mendoza, Argentina, using LCA as a
tool.
Scope: The scope of the study was limited to comparing one classroom built with energy-conserving
technologies with a functionally identical classroom built following traditional technologies. Only locally
available technologies were taken into consideration in for the energy-conserving case. The study only
included external environmental aspects; no indoor or human effects were studied. The environmental
impacts covered in the study are:
Global Warming
Acid Rain
Photochemical Smog
Resource Consumption
Eutrophication
Toxicity
The study is focused on the vertical components of the building envelope: exterior walls and windows.
Only the energy-conserving technologies designed for the heating energy consumption are considered.
Thus the chosen assemblies for comparison are:
1. Efficient external wall versus traditional external wall
2. Double-glazing windows with rubber gasket versus traditional single-glazing windows (without
gaskets)

A Guide to Life Cycle Assessment of Buildings
117
Functional unit: The functional unit for this case was defined as “the environmental impacts of the
implementation of a given technology in the school building together with all the additional materials
required, including the reduction of heat losses over its operative lifetime.”
Building Lifespan: 50 years
System Boundary: No secondary effects, such as the production processes for components or
infrastructure, were included except for energy flows. Secondary effects include impacts due to the
production of manufacturing machinery and parts, construction of roads, etc. The building demolition
phase was not included.
Step 2: Inventory Analysis
Data Collection and Assumptions: Only the differences between the studied technologies were taken
into account. Thus, in the energy-conserving case, only those materials that were used in addition to the
traditional case have been included, whereas in the traditional case, only the extra natural gas
consumed over the building life cycle in addition to the conservative case has been considered. It is
unclear how the impacts due to construction of these assemblies were calculated for this study.
It was also assumed that the decision of building the school in its location was a given, and thus outside
of the LCA boundary. When emissions data for the Mendoza region were not available, foreign values
were used, but taking into account the local energy mix. Average data have been used except when the
supplier was known. The structural frames for double and single glazed windows were considered to be
the same. The differences in production energy consumption in the compared windows are due only to
the energy content of the additional glazing, which has been calculated to be 19.92 mega joule/kg, and
the energy content of the gaskets, which has been taken as 77.5MJ/kg, based on a published study.
Table 5 shows the annual and life-cycle energy savings of the energy-conserving case. Specific savings in
the table implies savings per unit floor area.
Table 4 - Annual and life-cycle energy savings of the conservative case [4]

A Guide to Life Cycle Assessment of Buildings
118
It was found that using insulated external walls results in 60 percent of the total energy savings; double
glazing amounts for 24 percent and the remaining 16 percent is saved by the reduction in infiltrations
due to gaskets. Figure 16 shows the contribution of each conservative measure towards energy savings.
Contribution of energy-conserving measures towards energy savings[4] (energy savings presented in giga joule)
Step 3: Impact Assessment
The SBID model was used for impact assessment. Global warming potential (GWP), acid rain, photo-
smog, resource consumption, eutrophication, and toxicity were the impacts evaluated.
Step 4: Results and Interpretations
Results: A normalization phase was carried out. The concept of “person equivalent” (PE) was used for
normalization. This normalization method relates the amount of emissions resulting from a studied
system with the mean value corresponding to a region, apportioned to each person of the population of
that region. An environmental profile was then established for each case. As seen from the figure, the
GWP for the traditional case was approximately 33 x 103 µPE whereas for the energy-conserving case is
less than 1 x 10³µPE. Although impact values for all other categories are low for the traditional case, it is
still higher than the energy-conserving case values.
It was concluded that even though the insulated walls save the largest amount of energy, they require
also the largest amount of additional energy for their construction. However, the net energy saved by
the walls is still the main contribution to the total savings. On the contrary, the gasket for infiltration
control produces a small saving compared with the other strategies. But the ratio of embodied energy
content to energy saved is lowest for the gasket. This implies that the gasket saves more energy during

A Guide to Life Cycle Assessment of Buildings
119
the operational phase than it consumes during the manufacturing. Figure 17 presents normalized
environmental impacts for both the conservative and traditional cases.
Normalized environmental impacts for energy-conserving and traditional case[4]
It can also be observed that almost every environmental aspect considered is improved in the energy-
conserving case, except for the photochemical ozone creation potential. As mentioned earlier, the
energy-conserving case used two brick layers as compared to the one used in the traditional case. Use of
uncontrolled wood combustion as the heat source for the brick baking was found to be the main cause
for the higher POCP in the energy-conserving case. Assuming that wood was replaced with natural gas,
the results change partially, as shown in figure 18.
Normalized environmental impacts for the two cases, assuming use of natural gas for brick baking[4]

A Guide to Life Cycle Assessment of Buildings
120
It is evident from the above figures that although the GWP increases for the energy-conserving case by
replacing wood with natural gas for brick manufacturing, all of the environmental effects are now
improved as compared with the traditional case.
Benefits of Moreau School LCA
LCA helped in assessing the energy and environmental effects of applying energy-conserving
strategies in school buildings in arid Andean regions of Argentina.
The study revealed that in certain situations the use of a non-renewable fuel can lower the
environmental impact of a product or system (natural gas versus wood).
The LCA method helped in evaluating the environmental impacts produced by each design
alternative as well as the materials or processes responsible for those impacts.
Problems Encountered
Lack of local inventory data and high costs for conducting LCA were viewed as the main problems.
Lessons Learned
LCA can help identify the cause of high environmental impact due to a particular assembly. For
example, in this case study, uncontrolled wood combustion during brick-baking was the main
cause of a higher POCP impact due to an energy-conserving wall assembly.
The better defined and scoped an LCA study is, the more useful and meaningful the results shall
be.

A Guide to Life Cycle Assessment of Buildings
121
Case Study 4: Emeryville Resourceful Building, California, USA
This case study was included because it presents a case of assembly-level LCA where choices among
different assembly options were made based on LCA during the design development stage. The primary
source of information for this review was the report received from Siegel and Strain Architects.[22]
Project Overview
Building Type Residential
Construction Duration
Area One 3-bedroom house 1600 SF in size
Purpose Provide high quality, green affordable housing for the city of Emeryville
Building Program
Three-unit project consisting of a two-story duplex and a two-story single family house built with five parking spaces
View of Emeryville Resourceful Building
This was an infill housing project built on a 5,500-
square-foot empty lot in an otherwise developed
neighborhood of older homes and apartments. The
project had physical and financial constraints. The
design was already approved by the city’s Planning
Commission before it was decided to add green
features. The overall massing and placement of the
building was tightly constrained by the size and
proportion of the site.
Project Cost - Owner Emeryville Redevelopment
Agency. Additional funding from Alameda County Resource Reduction and Recycling Board and the Alameda County Waste Management
Architect Siegel and Strain Architects
LCA Expert Boustead Engineering LCA Tool Boustead LCI Database Boustead
LCIA method - Energy Calculation
-
Phase in which LCA was introduced
Design Development Phase
Project team members involved in LCA
Mechanical Engineer, Structural Engineer, General Contractor, LCA Consultant and Architect
Three major project constraints:
The selected environmental features had to support the affordable housing goals.
The environmental measures selected needed to provide tangible benefits to the occupants by
lowering maintenance and operating costs and providing a healthier place to live.

A Guide to Life Cycle Assessment of Buildings
122
The project had to be built using conventional means (the materials and technologies) as state
law required that the construction contract would be awarded to the low bidder—probably a
contractor without any specialized training or knowledge of green building.
Thus, the goal of the project was to find simple, cost-effective ways to reduce environmental impacts,
using mostly conventional means of construction while maximizing benefits to the future occupants.
Methodology
Standard building assemblies for walls, roof, and floors were first created to define the baseline.
Following that, alternate assemblies were created by selecting materials and designing on the basis of
prior experience in affordable housing and knowledge of environmentally sound building practices.
Seven to eight alternates were designed for each assembly type. These options were reduced to two to
three for each assembly to stay within the research budget and other constraints discussed earlier.
Figure 20 illustrates the shortlisted assemblies for each assembly type.

A Guide to Life Cycle Assessment of Buildings
123
Various options of assemblies considered for each assembly type[22]
Proposed assemblies that were not within the project budget were eliminated. A life cycle cost (LCC)
analysis was also conducted along with life cycle assessment (LCA) to weigh the trade-offs across the
life-cycle environmental and financial impacts.
Environmental Features
An emphasis on durable long-lasting building materials
Using materials efficiently, with the so-called “optimum value engineering” framing techniques
by NAHB[61] and engineered wood products
Use of recycled or recyclable materials and techniques for reducing construction waste
Use of materials from well managed sources—all framing and finish lumber was certified and
procured from a local supplier
Improved IAQ by careful selection of materials and HVAC systems
Why was an LCA study conducted?
The original aim of the project was constructing high quality affordable housing for first-time buyers.
Grants to fund green demonstration projects by the Alameda County Recycling Board and the Alameda
County Waste Management Authority steered the project to employ resource-efficient building
techniques and other green features. Thus, LCA was brought into the picture to make decisions based on
a quantitative environmental analysis.
Incorporating LCA
Step 1: Goal and Scope Definition
Goal: The goal of conducting LCA was to measure the environmental impacts of green construction
systems and assemblies and compare them to standard construction systems and assemblies.
Scope: Only exterior wall assemblies in one typical project unit, a three-bedroom, 2-1/2 bath unit
measuring 1,600 sq. ft. that includes a one-car garage was studied. A cradle-to-gate life cycle assessment
also described as an eco-profile was used.
Functional Unit: A total exterior assembly required for the three-bedroom house with a 50-year life.
Building Lifespan: 50 years
System Boundary: The study considered all the upstream processes—resource extraction,
manufacturing process, and transportation to the job sit—in an assembly’s life cycle. Downstream

A Guide to Life Cycle Assessment of Buildings
124
processes like building construction, operation, and demolition stages were not included in the study,
but maintenance and replacement activities for the assemblies were included. Figure 21 shows the two
wall assemblies that were evaluated using LCA. Figure 22 shows the upfront cost of these two. Figure 23
presents the added cost during the life of the two assemblies.
Two options for the exterior wall assembly[22]

A Guide to Life Cycle Assessment of Buildings
125
Upfront cost of the two assemblies[22]
Added cost during the life cycle of the two assemblies[22]
The maintenance phase for the exterior wall assembly will include replacement of the siding for
both the options.

A Guide to Life Cycle Assessment of Buildings
126
Step 2: Inventory Analysis
The material take-offs developed by the cost estimator was converted by Boustead from units of area
and volume (board feet and cubic yards) to units of weight and then weights were used to calculate
inputs to the system.
Data Collection and Assumptions: Information about materials and components came from technical
literature, industry databases, the Boustead database, and manufacturers’ specifications. Assemblies
were compared on the basis of inputs and outputs obtained from the inventory analysis.
Inventory Results: The result from inventory analysis is discussed in Step 4, as it forms the basis of
interpretations since Step 3 was not carried out for the study.
Step 3: Impact Assessment
It is assumed that no impact assessment was performed in this case, as the report contains no
information on impact assessment.
Step 4: Results and Interpretations
Results: The ERB wall assembly generates less solid waste than the standard assembly. The standard
wall assembly includes wood fiber siding with a 25-year warranty, while the ERB wall assembly includes
fiber cement siding with a 50-year warranty. If the wood fiber siding were replaced after 25 years, an
additional 5,750 lbs. of solid waste would be sent to the landfill. Table 7 presents the energy and
material consumption values obtained as part of the inventory results for the standard and selected wall
assembly. Figure 24, 25, and 26 show the emission values calculated from the inventory analysis.
Table 7 - Inventory results for energy and material consumption for exterior wall assembly
Standard Wall Assembly
Selected Wall Assembly
Savings Percentage Savings
Gross Energy Requirements
4,550 therms 2,900 therms 1,650 therms 36 percent
Gross Material Consumption
18.5 Metric Tons 11.5 Metric Tons 7.0 Metric Tons
38 percent

A Guide to Life Cycle Assessment of Buildings
127
Emissions to air for the two wall assembly options[22]
Emissions to water for the two wall assembly options[22]
Gross solid waste generated by the two wall assembly options[22]
Interpretations: It can be observed from the table that the CO2 equivalents sequestered is more than the
CO2 equivalents emitted. This suggests that no CO2 is released as a result of the manufacture, packaging,
and distribution of the building materials selected for the project. This is due to the fact that large
amounts of CO2 are sequestered in the wood used in the selected assembly. The lumber in the house
was not analyzed at the end of its life, when the wood might be disposed of and the CO2 released back
into the atmosphere. Therefore, the net overall value for CO2 production is reported as negative. Also, it
can be observed that significant savings are reported in energy requirements and material consumption
for the selected assembly. It should be noted that results reported here are only based on a cradle-to-
gate analysis and thus do not take into account the effect that these assemblies might have on the
operation and demolition phases of the projects.

A Guide to Life Cycle Assessment of Buildings
128
Similar analysis was done for other building assemblies to compare standard assemblies with selected
ones to validate the selection made by the design team. Some of the project’s accomplishments include:
Reduction of operating energy by approximately 33 percent
Reduction by 23 percent of those emissions from operating energy that contribute to global
warming
Reduction by 16 percent of those emissions from operating energy that contribute to acid rain
Reduction in the amount of fuel used for materials production by 50 percent
Reduction of wood used for framing by 19 percent
Finally, the ERB cost no more than conventional affordable housing.
Benefits of ERB LCA
The project team from the ERB cites the following benefits of using LCA as part of their design process.
Information about the contribution of various life-cycle phases in a building-component’s life
was useful as it provided measurable environmental inputs and outputs.
This study established a method for designing and evaluating environmentally sound, energy
efficient affordable housing using LCA.
LCA provided measurable environmental impacts and, coupled with LCC, costs of green
construction systems and assemblies as compared to standard construction systems and
assemblies.
In general, LCA results can be used to design a project with reduced environmental impacts,
operating costs, and maintenance costs, demonstrating that green can also be affordable.
It can aid developers, agencies, and architects in designing environmentally sound, cost-
effective, affordable housing.
The results will encourage others to take on similar studies. As a result, a body of work will
emerge, ultimately bringing more environmentally sound building practices to the design and
construction industries.
Problems Encountered
There was difficulty in accounting water emissions because its effects are local rather than
global, unlike, for example, certain air emissions.
Lessons Learned
Any design that deviates from established conventions demands more vigilance, either through
increased site supervision or increased submittal requirements, to verify that the specifications
are being followed.
The owner must be willing to accept delays in schedule if non-conforming work is to be rejected.
The contractor should be adequately compensated for time spent on tasks normally outside the
scope of work.
A Guide to Life Cycle Assessment of Buildings
129
Research Case Studies Four research case studies have been briefly reviewed in this section. Research case studies are
completed for a number of different reasons, for example: (1) to understand the overall impact of given
construction systems (steel versus concrete versus wood); (2) to characterize the environmental impact
of the design and construction phases of the building industry, in comparison to the operational phase,
which can be easily captured through energy modeling; (3) to track the changes in environmental impact
as a given building goes from standard construction, to a “green” building, all the way to a so-called “net
zero” building; or (4) to demonstrate the LCA methodology and highlight the weakness of building LCA,
and thus drive the development of improved LCA tools for the building industry.
The goal for the review of research case studies, as opposed to case studies from actual practice, was to
understand how impacts vary from office buildings to residential buildings and from one country to
another across the same building type. Another motivation was to obtain baseline values for each
impact category, as these studies represent standard typical examples of a building type. Table 8
presents consolidated information about four research LCA case studies that are elaborated in the next
section.

A Guide to Life Cycle Assessment of Buildings
130
Table 8 - Overview of case studies 5-8
Case Study 5 Case Study 6 Case Study 7 Case Study 8
Building Type Individual Family House
Individual Family House
Office Building Office Building
Building Location
Geneva Lake, Switzerland
Various locations, US
Bangkok, Thailand Minnesota, US
Project Area 226 m2 (2,431.7 SF) of heated area
228 m2
(2,453.28 SF) 60,000 m2
(645,600 SF) 4,400 m2 (47,344 SF)
Type of LCA carried out
LCA conducted to evaluate the impact of energy consumption through all life-cycle stages on the different impact categories
Process-based LCA used to evaluate the impacts; this study includes normalization and weighting
Hybrid LCA model that uses both process and input-output life cycle inventory methods
Hybrid LCA model that utilizes both process and input-output life cycle inventory methods
Goal To compare three variants of a house with the same architectural aspect but different insulation types and thicknesses, different energy production systems, and use of different renewable energies.
To compare the environmental impacts of a concrete masonry house to those of a wood frame house
To estimate the environmental impacts of a typical commercial office building in Thailand
To find the relative contribution of each building life-cycle phase to the total energy and environmental effects over a 50-year lifetime
Scope - Material losses included - Environmental impacts due to infrastructures or their fabrication neglected - Water supply, gas, and electricity network not accounted
- System boundary excludes capital goods, human labor, impacts caused by people and waste treatment after disposal
- Potential of on-site renewable energy was ruled out - Indoor air quality issues neglected - Water consumption and water effluents excluded
- The study was limited to an LCI analysis, and no impact assessment was carried out
Functional Unit
Per square meter of floor area
A single family house
60,000 m2 gross floor area of building
Provision of 4,400 m2 office for 50 years
Assumed Lifespan
Not given 100 years 50 years 50 years
Assumptions Interior comfort between the alternatives assumed to be constant
Occupant behavior and other performance characteristics assumed to be same for all houses
All the materials and transportation components assumed to be manufactured in Thailand

A Guide to Life Cycle Assessment of Buildings
131
Case Study 5 Case Study 6 Case Study 7 Case Study 8
Life Cycle Stages Included
Manufacturing, Transport, Maintenance, Deconstruction, elimination of Building Material
Manufacturing, Construction, Maintenance and Occupancy, Demolition, Disposal
Material Production, Construction, Occupation, Maintenance, Demolition and Disposal
Material Production, Construction, Use, Maintenance, End-of-Life
LCI Database ESU LCI of PCC and various databases embedded in SimaPro
Thailand Government Database
Carnegie-Mellon EIO-LCA
Other Data Sources
Previously published studies + averages from building industry
-DHW and other energy use load profile taken from ASHRAE Standard.
Priced bills of quantities, technical specifications, materials from building contractor
R.S. Means, industry average
Impact Categories
Global Warming, Acidification, Photochemical Oxidation and Non-renewable Energy
Results for 11 categories were evaluated for each LCIA method.
Global Warming, Acidification, Photo-oxidant formation
Not quantified
Energy Calculation
Lesosai (to calculate yearly energy demand), Polysun (to calculate energy produced by solar collectors), PVsyst (electricity production by PV panels)
HVAC sizing for Concrete Homes using the DOE-2.1E simulation engine
Based on analysis of data on mechanical and electrical equipment design specifications and anticipated usage pattern of the building
Estimated based on data for electricity and natural gas use for typical office building by EIA
LCIA Method ESU Eco-indicator 99, EDIP/UMIP 97, EPS 2000 embedded in SimaPro
Conversion factor by DEDE of Thailand used
Not quantified

A Guide to Life Cycle Assessment of Buildings
132
Case Study 5: Three Variants of a Family House in Switzerland
The primary source of information for this study was a journal paper by Citherlet and Defaux. [62]. Three
variants of a house are compared in this. The variants are described in table 9.
Table 8 - Description of the three variants for a family house in Switzerland
Exterior Façade Insulation
Roof Insulation
Floor Insulation
Window Specs
Heating DHW Lighting and other appliances
Variant 1
12cm mineral wool (U=0.25 W/m2K)
14cm mineral wool (U=0.28 W/m2K)
6cm polystyrene (U=0.48 W/m2K)
Low-e Double Glazing (U=1.7 W/m2K)
223 MJ/m2
23 MJ/m2
80 MJ/m2
Variant 2
16cm mineral wool (U=0.20 W/m2K)
20cm mineral wool (U=0.20 W/m2K)
12cm polystyrene (U=0.27 W/m2K)
Low-e Double Glazing (U=1.7 W/m2K)
145 MJ/m2
23 MJ/m2
80 MJ/m2
Variant 3
20cm mineral wool (U=0.16 W/m2K)
14cm mineral wool +3mm vacuum (U=0.10 W/m2K)
3mm vacuum insulation (U=0.10 W/m2K)
Low-e Triple Glazing (U=0.7 W/m2K)
67 MJ/m2 (energy produced from solar collector and PV deducted)
50MJ/m2
The first variant corresponds to the building standard in force in Switzerland and uses a gas
condensation boiler for heating. The second alternative is designed to the requirements of a green
building quality control label for houses with low energy consumption and employs a heat pump with
vertical ground-source probes. The third case is a low energy consumption building that uses a 4kW heat
pump, 20 m2 of solar-thermal collector, and 20 m2 of photovoltaic panels. High-efficiency lighting and an
optimized operating schedule are used to control electricity consumption. To analyze the effect of the
electricity production origins, the environmental impact results were calculated with two types of
energy mix: the Swiss mix (60 percent hydro power + 40 percent nuclear) and the UCTE (Union for the
Co-ordination of Transmission of Electricity) mix.
Results for Swiss mix: There was a significant reduction of the non-renewable energy demand over
the life cycle from Variant 1 (approx. 575 MJ/m2 per year) to Variant 3 (200 MJ/m2 per year). This was
due to the use of heat pumps and solar energy in Variant 3. Global warming potential dropped by 62
percent from Variant 1 to Variant 2 but remained almost same for variants 2 and 3. This was mainly due
to the reduction in emissions caused by the gas boiler used in Variant 1. It is interesting to note here
that GWP only slightly changed from Variant 2 to 3. The reason for this trend was assumed to be the fuel
mix considered in this case, which was composed of 60 percent hydro power.

A Guide to Life Cycle Assessment of Buildings
133
Variant 1 for Swiss mix
Variant 2 for Swiss Mix

A Guide to Life Cycle Assessment of Buildings
134
Variant 3 for Swiss Mix
The acidification potential only varied slightly for the three variants, as construction, maintenance, and
replacement stages were the largest contributors to acidification, and this impact was similar for all the
variants. The photochemical oxidation potential was relatively large for Variant 1. Values for variants 2
and 3 were almost equal and were 29 percent less as compared to Variant 1.
Results for UCTE mix: The non-renewable energy and global warming potential impacts show similar
distribution for the three variants. The impact is maximum for Variant 1 and reduces to one-third of the
value for Variant 3. Acidification potential results deviate from the trend. Variants 1 and 2 are almost
equal whereas Variant 3 is only 50 percent of the impact caused by variants 1 or 2. Photochemical
oxidation follows the expected trend and reduces as we go from Variant 1 to 3.
Conclusion: As observed in both cases of energy mix, the contribution of the construction, repair and
maintenance, and elimination (deconstruction) phases remain the same for the three variants across all
the impact categories. The difference in impacts was mainly due to energy consumption in the
operations phase. It was also seen that most of the impacts were less for Variant 3 as compared to
variants 1 and 2. Thus, the share of impacts due to the construction, repair and maintenance, and
elimination phases increases in case of Variant 3, which is a low energy consuming option. It was
concluded that it becomes important in the case of a residential-scale building to be concerned about
the indirect (impacts due to construction, maintenance, replacement, and demolition) impact when the
final (total) energy demand is lower than about 150 MJ/m2/y for Swiss mix electricity production and
lower than about 50MJ/m2/y for UCTE mix. When the energy demand is higher than these values, it is
reasonable to emphasize the reduction of direct impacts (energy consumption during operation) first.
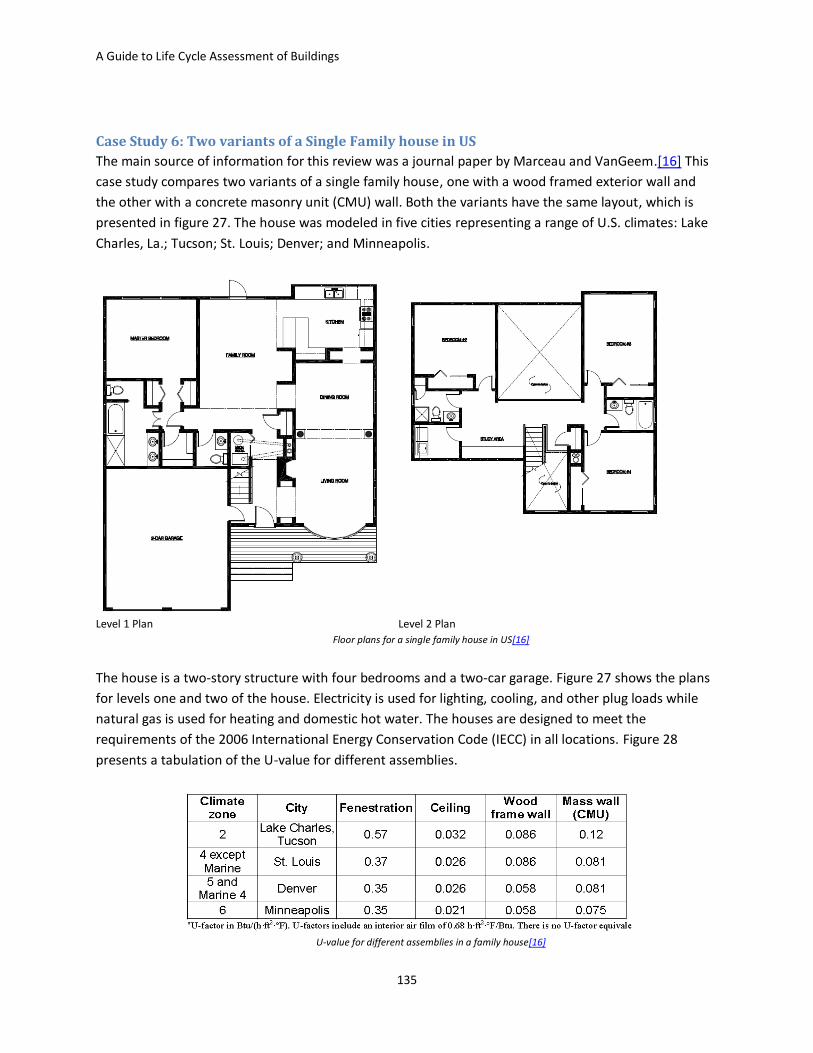
A Guide to Life Cycle Assessment of Buildings
135
Case Study 6: Two variants of a Single Family house in US
The main source of information for this review was a journal paper by Marceau and VanGeem.[16] This
case study compares two variants of a single family house, one with a wood framed exterior wall and
the other with a concrete masonry unit (CMU) wall. Both the variants have the same layout, which is
presented in figure 27. The house was modeled in five cities representing a range of U.S. climates: Lake
Charles, La.; Tucson; St. Louis; Denver; and Minneapolis.
Level 1 Plan Level 2 Plan
Floor plans for a single family house in US[16]
The house is a two-story structure with four bedrooms and a two-car garage. Figure 27 shows the plans
for levels one and two of the house. Electricity is used for lighting, cooling, and other plug loads while
natural gas is used for heating and domestic hot water. The houses are designed to meet the
requirements of the 2006 International Energy Conservation Code (IECC) in all locations. Figure 28
presents a tabulation of the U-value for different assemblies.
U-value for different assemblies in a family house[16]

A Guide to Life Cycle Assessment of Buildings
136
Windows are aluminum framed with thermal breaks and double panes. Roofs and ceilings are wood-
frame construction with medium-colored asphalt shingles. The exterior walls of the wood-frame houses
consist of medium-colored aluminum siding, 12-mm (½-in.) wood sheathing, RSI-2.3 (R-13) fiberglass-
batt insulation between 2×4 wood studs 400 mm (16 in.) on center, and 12-mm (½-in) painted gypsum
board. The CMU walls consist of partially grouted normal-weight CMUs, interior wood furring spaced
400 mm (16 in.) on center, gypsum wallboard on the inside surface, and stucco on the outside surface.
No insulation was provided for the CMU walls, as concrete itself acts as a thermal mass. Interior walls
and floors are wood-framed. All the houses are slab-on-grade construction.
In each of the five climates, the CMU houses have similar household energy use as the wood frame
houses (the difference is within 1 to 6 percent, depending on climate) as calculated by DOE-2.1E hourly
simulation tool. Energy for construction has been assumed to be 900-2700 MJ based on the use of a
hydraulic excavator for the foundations. Transportation energy for bringing the materials to the house
at the start of the life cycle and removing it from the house at the end-of-life has been added.
Results: The impacts in each category are approximately the same on average for the wood and CMU
houses. The CMU house performs better than the wood frame house in Tucson and St. Louis. The wood
frame house performs better than the CMU house in Lake Charles and Minneapolis. Five methods for
normalization and weighting were employed to get a single score. In each of the five methods, the CMU
house has a lower score than the wood frame house in almost all impact categories in Tucson and St.
Louis. The CMU house has a higher score than the wood frame house in almost all impact categories in
Lake Charles and Minneapolis. In Denver, the scores are approximately equal.
GLOBAL WARMING POTENTIAL ACCORDING TO EDIP/UMIP 97 LCIA METHOD

A Guide to Life Cycle Assessment of Buildings
137
OZONE DEPLETION POTENTIAL ACCORDING TO EDIP/UMIP 97 LCIA METHOD
ACIDIFICATION POTENTIAL ACCORDING TO EDIP/UMIP 97 LCIA METHOD
EUTROPHICATION POTENTIAL ACCORDING TO EDIP/UMIP 97 LCIA METHOD

A Guide to Life Cycle Assessment of Buildings
138
PHOTOCHEMICAL SMOG POTENTIAL ACCORDING TO EDIP/UMIP 97 LCIA METHOD
Conclusion: Most of the environmental load is from the household use of natural gas and electricity
during the life of the houses. The household use of electricity and natural gas represents 97 percent of
the environmental impacts of the CMU houses and 97 percent of the environmental impacts of the
wood frame houses. In all locations, cement-based materials represent a small fraction of the total
environmental impacts. The most significant impact categories are fossil fuel depletion and respiratory
inorganics. Most of the LCIA methods produced similar results. Less than 0.5 percent of the life cycle
energy use is embodied in the concrete portion of the house. The most significant environmental
impacts are not from construction materials but from the production of electricity and natural gas and
the use of electricity and natural gas in the houses by the occupants. When considering only the
construction materials, most of the environmental impacts are from aluminum siding, ceramic tiles,
paint, roof shingles, cement-based materials, steel, and cast iron.

A Guide to Life Cycle Assessment of Buildings
139
Case Study 7: Office Building in Thailand
A complete life-cycle assessment has been carried out for a typical office building in Thailand. The
primary source of information for this study was a paper by Kofoworola and Gheewala.[63] This building
has the structural and envelope systems as well as building use patterns typical of any commercial
building in Thailand and operates completely on electricity. Thus, the results of the single case study are
representative of commercial office buildings in Thailand. The building materials and structural system
for this case study is similar to case study 8 (office building in US) and hence they can be compared with
each other.
The building has a reinforced concrete structure with its façade constructed out of brick and curtain
wall. It has a cast-in-place concrete floor and roof. Electricity is obtained from the national grid, which
has an energy mix of 76 percent natural gas, lignite coal 17 percent, diesel 3 percent, hydro 3 percent,
fuel oil and others 1 percent. A hybrid LCA model was used for the analysis. Figure 29 presents the
system boundary for this case and indicates how IO-LCA and process-based LCA were used for different
life-cycle stages.
System boundary for office building evaluated in the case study[63]
IO-LCA was used to account for only the production of building materials. The construction, operation,
maintenance, and demolition phases in this study were accounted for separately by process-based LCA.
The IO-LCA model used in this case was developed by Kofoworola and Gheewala.[63] Conversion factors
for the various energy types (i.e., coal, natural gas, etc.) available in the energy input-output table were
obtained from the Department of Alternative Energy Development and Efficiency (DEDE) of the Ministry
of Energy, Thailand.
Results: In terms of materials, steel and concrete dominated the environmental impacts due to
manufacturing phase. Steel accounted for 17 percent of the GWP, 42 percent of the photo-oxidant
formation, and 38 percent of the acidification potential for manufacturing phase, whereas concrete
accounted for 64 percent of the GWP, 30 percent of the photo-oxidant formation, and 42 percent of the
acidification potential (AP) for the same phase. This dominance was due to the use of large quantities of
steel and concrete in the building. The Global warming potential (GWP) was split between the operation
stage (52 percent) and the manufacturing stage (42 percent). The construction stage contributed 4
percent, whereas maintenance and demolition stages accounted for 0.1 percent of the total GWP.

A Guide to Life Cycle Assessment of Buildings
140
The greatest contributor to the acidification potential was the operations stage (71 percent). This was
due to large amounts of SOx and NOx emissions from grid electricity. The manufacturing stage
contributed 27.9 percent to this impact. The construction, maintenance, and demolition phases each
contributed about 0.4 percent, 0.8 percent, and 0.2 percent, respectively, to the total acidification
potential. The operation stage constituted approximately 66 percent of the total photochemical ozone
creation, which arose primarily from the use of electricity. The contribution to this impact category from
the manufacturing stage is 25 percent.
Conclusion: The results of the impact assessment of the office building reveals that lighting, air
conditioning, office equipment, and other office appliances in the operational phase produced 40
percent or more of the overall impact in any given category. Opportunities for mitigating the impact due
to this stage were explored, and it was revealed that 1.14×10⁶ kWh/year of electric energy (electricity
generated from power plants) would be saved if the set-point of room temperature is changed from
24°C to 26°C. Also switching off the lighting, office equipment, and air-conditioning during the one-hour
lunchtime could save approximately 1.8×10⁶ kWh/year. These two strategies have the potential to
achieve estimated reductions of 10.2 percent GWP, 5.3 percent AP, and 0.21 percent photo-oxidant
formation potential per year, respectively, in emissions from the power generation sector.

A Guide to Life Cycle Assessment of Buildings
141
Case Study 8: Office Building in the US
This study presents the life-cycle assessment of an office building in the US. The primary source of this
study was a paper by Junnila et al.[11] The study is only targeted to measure the impact due to life-cycle
energy use. In this study, the focus is on inventory analysis for quantifying resource inputs and emissions
and wastes, and interpretation for identifying environmental hot spots.
The office building under consideration is a steel-reinforced concrete beam-and-column structure. The
exterior envelope consists of an aluminum curtain wall. A hybrid LCA approach has been followed in this
case. Process-based emissions data were used for all life-cycle phases, except for the materials
manufacturing phase and the material and electricity components of the other phases for which IO-LCA
was used.
The effects of construction due to materials transportation and construction equipment has been
calculated on estimation of transport distances, diesel consumption of truck, and average hours of
equipment operation. Annual electricity use has been estimated as 184 kWh/m2 and natural gas use as
17.5 m3/m2. Annual lighting energy is assumed to be 56 kWh/m2. Emissions from electricity and lighting
are calculated using CMU EIO-LCA.[46] Emissions from natural gas have been estimated using EPA data.
The service life of each element was estimated based on experience and expert opinion. The end-of-life
equipment and transportation data have been estimated by using average trip distances and R.S.
Means.
Results: The use phase dominates all categories but PM10 (particulate matter measuring 10
micrometers in size). For the material manufacture stage, steel products are the largest contributor to
energy use and emissions, followed by concrete, glass, insulation, and copper. Steel products account
for 43 percent of the energy use, 42 percent of the CO2 emissions, 40 percent of the SO2 emissions, 31
percent of the NOx emissions, and 27 percent of the PM10 emissions. Equipment use dominates the
construction stage. Use phase is dominated by electricity use. Materials repair and replacement are
responsible for the majority of the energy use and emissions in the maintenance phase. The end-of-life
phase has maximum emissions from demolition equipment. In fact, it is slightly more than the energy
use and emissions from equipment used in the construction stage. In terms of energy use, the
manufacturing stage accounts for 9 percent, construction accounts for 2 percent, use accounts for 83
percent, maintenance for 6 percent, and end-of-life for 1 percent. The distribution of CO2 and SO2
emissions over different life-cycle stages follows the trend of energy use. The NOx emission is 11 percent
for the manufacturing stage, 11 percent for construction stage, 64 percent for use, 7 percent for
maintenance, and 8 percent for end-of-life stage. For PM10, the manufacturing stage contributes 29
percent, construction 8 percent, use 37 percent, maintenance 23 percent, and end-of-life 4 percent.

A Guide to Life Cycle Assessment of Buildings
142
Conclusion: It can be observed in general that the maintenance phase has a larger environmental
footprint than the construction phase. End-of-life treatment is only somewhat relevant for overall NOx
and PM10 emissions. The relevance of the materials, construction, maintenance, and end-of-life phases
relative to the use of buildings is expected to increase considerably as functional obsolescence of office
buildings becomes more rapid, and complete reconstruction and reconfiguration become more
frequent.
Useful Observations from Case Studies
Case Study 1-4
Case studies 1-4 can help in designing a road map for an LCA process. These provide guidance
about scoping an LCA study, sources of data collection, and a basis for making assumptions, which are
most critical issues in an LCA process. Following can be inferred from the case studies:
1. Except for Stadium Australia, all other case studies were done on small projects, the largest
being 9,590 square feet . One possible reason for this was that it was easier to handle the
complexity of LCA on small-scale projects.
2. Although none of the studies were conducted solely by architects, architects played an
important role by providing input and making assumptions for unavailable data based on their
experience. Moreover, it was apparent that the architects concerned with the project
understood the basic underlying principles of LCA, as they were able to understand and use the
results of LCA study.
3. LCA experts were consulted in each study, and generic LCA tools were used, not whole-building
LCA.
4. All projects were funded by some governmental agency.
5. Although well-respected LCI databases like Boustead and EcoInvent were used for these studies,
they partly relied on other sources for inventory data. One reason for the unavailability of
required information in the database could be that each project used unconventional

A Guide to Life Cycle Assessment of Buildings
143
assemblies or systems due to environmental concerns. It can be concluded that collection of
inventory data from other sources is an inevitable part of any LCA study and, therefore, this
activity should be kept in mind while choosing materials for building.
6. Case studies 1 (NJMC) and 3 (School in Argentina) conducted Life Cycle Impact Assessment
(LCIA), whereas case studies 2 and 4 derived interpretations from the results of inventory
analysis. Here it should be noted that case studies 1 and 3 were conducted during or after the
construction stage, while 2 and 4 were completed during schematics design phase. There could
be possible links between these similar trends.
Case Study 5-6
Case studies 5 and 6 are representative of standard building practices in the residential sector in
Switzerland and the US respectively. Thus, these can be used to establish benchmarks for future studies
for various environmental impacts. Both case studies quantified results for three common
environmental impact categories: Global Warming Potential (GWP), Acidification Potential (AP), and
Photochemical Smog (POCP). These case studies are comparable, as both are similar in their scope and
system boundary. The values for the GWP category are tabulated in Table 10 for each variant evaluated
in these two case studies. Tables 11 and 12 present the values for AP and POCP for the two houses.

A Guide to Life Cycle Assessment of Buildings
144
Table 10 - Comparison of GWP values for a house in Switzerland and the US
Variants House Area (m2)
GWP (kgCO2
equivalent)
GWP per unit area (kg-CO2
equi./ m2)
Assumed Life-span (years)
GWP per unit area per year (kg CO2 equi./
m2/Y)
1 Swiss House - Variant 1- Swiss
266 - - - 27.0
2 Swiss House - Variant 2 - Swiss
266 - - - 10.5
3 Swiss House - Variant 3 - Swiss
266 - - - 9.5
4 Swiss House - Variant 1- UCTE
266 - - - 40.0
5 Swiss House - Variant 2 - UCTE
266 - - - 24.5
6 Swiss House - Variant 3 - UCTE
266 - - - 13
7 US Wood House – Lake Charles
228 1,700,000 7,456.14 100 74.5
8 US Wood House – Tucson
228 1,800,000 7,894.73 100 78.9
9 US Wood House – St. Louis
228 2,100,000 9,210.52 100 92.1
10 US Wood House – Denver
228 1,900,000 8,333.33 100 83.3
11 US CMU House – Minneapolis
228 2,200,000 9,649.12 100 96.4
12 US CMU House – Lake Charles
228 1,800,000 7,894.73 100 78.9
13 US CMU House – Tucson
228 1,800,000 7,894.73 100 78.9
14 US CMU House – St. Louis
228 2,100,000 9,210.52 100 92.1
15 US CMU House – Denver
228 1,900,000 8,333.33 100 83.3
16 US CMU House – Minneapolis
228 2,200,000 9,649.12 100 96.4
From table 10, it can be observed that GWP emissions for a house in Switzerland are less than
half as compared to a house in the US. In case of Switzerland, the GWP can range from 40 kg-CO2
equi./m2/Y for a standard house to 9.5 kg-CO2 equi./m2/Y for an energy efficient house, whereas for the
US it ranges from 96 kg-CO2 equi./m2/Y to 74 kg-CO2 equi./m2/Y. The main reason for this variation can
be difference in climatic conditions and electricity mix used in the two countries.

A Guide to Life Cycle Assessment of Buildings
145
Table 11 - Comparison of AP values for a house in Switzerland and in US
Variants House Area (m2)
AP (g-SOx
equivalent)
AP per unit area (g-SOx
equivalent/ m2)
Assumed Life-span (years)
AP per unit area per year (g-SOx
equi./ m2/Y)
1 Swiss House - Variant 1- Swiss
266 - - - 71
2 Swiss House - Variant 2 - Swiss
266 - - - 64
3 Swiss House - Variant 3 - Swiss
266 - - - 62
4 Swiss House - Variant 1- UCTE
266 - - - 160
5 Swiss House - Variant 2 - UCTE
266 - - - 175
6 Swiss House - Variant 3 - UCTE
266 - - - 87
7 US Wood House – Lake Charles
228 12,000,000 52,631.5 100 526.3
8 US Wood House – Tucson
228 13,000,000 57,017.5 100 570.1
9 US Wood House – St. Louis
228 13,000,000 57,017.5 100 570.1
10 US Wood House – Denver
228 11,000,000 48,245.6 100 482.4
11 US Wood House – Minneapolis
228 11,000,000 48,245.6 100 482.4
12 US CMU House – Lake Charles
228 12,000,000 52,631.5 100 526.3
13 US CMU House – Tucson
228 13,000,000 57,017.5 100 570.1
14 US CMU House – St. Louis
228 12,000,000 52,631.5 100 526.3
15 US CMU House – Denver
228 10,000,000 43,859.6 100 438.6
16 US CMU House – Minneapolis
228 11,000,000 48,245.6 100 482.4
Table 11 shows the values for the Acidification Potential category for each variant of the two
case studies reviewed. This impact shows trends similar to GWP. For variants of Swiss House, the value
of AP varies from 62 to 175 g-SOx equi./ m2/Y. In case of US House variants, it is much higher and ranges
from 438.6 to 570.1 g-SOx equi./ m2/Y.

A Guide to Life Cycle Assessment of Buildings
146
Table 12 - Comparison of POCP values for a house in Switzerland and in US
Variants House Area (m2)
POCP (g-C2H4
equivalent)
POCP per unit area (g-C2H4
equivalent / m2)
Assumed Life-span (years)
POCP per unit area per year (g-C2H4 equi./
m2/Y)
1 Swiss House - Variant 1- Swiss
266 - - - 37.5
2 Swiss House - Variant 2 - Swiss
266 - - - 27.0
3 Swiss House - Variant 3 - Swiss
266 - - - 26.0
4 Swiss House - Variant 1- UCTE
266 - - - 55.0
5 Swiss House - Variant 2 - UCTE
266 - - - 46.0
6 Swiss House - Variant 3 - UCTE
266 - - - 31.0
7 US Wood House – Lake Charles
228 510,000 2,236.8 100 22.3
8 US Wood House – Tucson
228 540,000 2,368.2 100 23.6
9 US Wood House – St. Louis
228 610,000 2,675.4 100 26.7
10 US Wood House – Denver
228 540,000 2,368.2 100 23.6
11 US Wood House – Minneapolis
228 600,000 2,631.5 100 26.3
12 US CMU House – Lake Charles
228 520,000 2,280.7 100 22.8
13 US CMU House – Tucson
228 520,000 2,280.7 100 22.8
14 US CMU House – St. Louis
228 580,000 2,543.8 100 25.4
15 US CMU House – Denver
228 540,000 2,368.2 100 23.6
16 US CMU House – Minn. 228 610,000 2,675.4 100 26.7
Table 12 shows the Photochemical Smog Potential (POCP) for case studies 5 (Swiss House) and 6
(US House). This impact is slightly higher for the Swiss House unlike other impacts. POCP ranges from 26
to 55 g-C2H4 equi./ m2/Y for Swiss House whereas it falls between 22.6 and 26.7 g-C2H4 equi./ m2/Y for
US House. In the case of US House, it can also be observed that POCP is higher in the cities of St. Louis
and Minneapolis for both wood and CMU house.
Case Study 7-8
The results for the two office buildings LCA studies reviewed cannot be compared, as the Thailand study
results are in the form of impact indicators while the US study ended at the inventory analysis stage.
Nevertheless, some common inferences can be drawn from the two studies.

A Guide to Life Cycle Assessment of Buildings
147
The operational phase was the most dominant stage in all the impact categories for the Thai
study and in all inventory analysis results in case of US Office Building.
Both office buildings had a steel-reinforced concrete frame structure. It was observed that steel
and concrete were responsible for the major impacts and emissions during the manufacturing
stage in both cases.
Related Case Studies The eight case studies described earlier in this chapter presented cases where LCA was either used
during building design and construction to evaluate design and product options or after building
construction to evaluate its footprint. Related case studies have been included in this chapter to present
cases where LCA was applied in unconventional scenarios. Both the case studies in this section are
fictitious and were conducted for the purpose of research.
LCEA of Land Use in Ireland
This case study describes a narrow-scoped LCA of land use. Accounting for land use impact is a future
promise of LCA and difficult to establish. This case study presents a snapshot of the present state of
research of land use LCA and is hence relevant to review.
A study conducted by Aidan Duffy[64] presents the Life Cycle Energy Analysis (LCEA) of residential
development in four zones of the Dublin area. These zones are located at increasing distances from the
city center. Zone 1 is the city center spread over 3.0 km radius around the city. Zone 2 is the suburb area
located between the city and 9.0 km radius around the city. Zone 3 is the exurbs located between the
suburbs and 30 km radius around the city. Zone 4 comprises commuter towns located more than 40 km
away from the city center. The study compared the life cycle energy consumption of residential
developments in these four zones. The life of the building stock was assumed to be 100 years and
construction, operation, transportation, maintenance, and demolition stages were considered in the
LCEA. The results were calculated in terms of CO2 equivalent emissions. It was found that operating
emissions from dwellings in the commuter town and extra-urban zones were almost twice those in the
city center, both due to larger dwelling sizes and the predominance of detached and semi-detached
dwellings (with large amounts of exposed walls) in the former and the prevalence of smaller apartments
in the latter. [64] Despite their smaller size, the per capita construction CO2 emissions of apartments
were approximately one third greater than for low-rise dwellings due to the greater energy intensity of
the structure. However, this difference was more than compensated for by the significantly lower
operational emissions referred to above. [64]
The case study shows that location of a building can influence its program, structure, and choice of
construction materials. The impacts caused due to these differences were captured by utilizing the LCEA
method. Although the case study did not evaluate other impacts, such as habitat destruction or
eutrophication potential, it did propose a method of accounting for site selection in evaluating a
project’s environmental footprint. Such studies can help locate projects in a particular low-impact zone,
but they do not account for impacts due to a specific site option. Methods that account for impacts due
to a specific site choice are not well developed and call for the attention of life cycle assessment experts.

A Guide to Life Cycle Assessment of Buildings
148
LCA of Retrofitting Buildings
This case study describes the application of LCA in evaluating the impacts due to retrofit of an existing
building. Since existing building retrofit and renovation is very critical to the green building movement, it
is relevant to examine how LCA can help in this situation.
Retrofitting existing buildings to improve their energy efficiency or to accommodate a new building
program is quite common. Decisions between renovating an existing building or constructing a new one
are based on several criteria. The LCA method can help make decisions on environmental grounds. Two
scenarios emerge in this context for the application of LCA:
Evaluating the environmental impact due to retrofits to improve energy efficiency
Comparing renovation of an existing building to construction of a new building for a specific
building program.
In case 1, where LCA is used to evaluate the environmental impact of a retrofit to improve energy
efficiency, the materials added and discarded during the renovation process should be considered. Two
variants should be developed to assess the environmental impacts over all life-cycle stages, one
considering the life of the building without renovation and other considering the building performance
after renovation. Variant one would assume no improvement in the building’s energy efficiency. Variant
two would account for the improved energy efficiency but would also account for the added impacts
due to the addition of new and disposal of the old materials and systems. Thus, these two variants can
be compared and a decision made to select the lower impact option. A study evaluating the impacts of
discarded fluorescent lamps and HCFC from air-conditioners during a retrofit was conducted by Techato
et al[65] that suggested that such retrofits should be evaluated for their environmental impacts, as they
may result in harmful emissions to the environment due to disposal of old material and systems.
In case 2, which compares renovation of an existing building to construction of a new building, two
variants need to be developed. Variant one would only account for impacts due to renovation of the
existing building (which would include the addition of new materials and disposal of old) and its
operation and demolition impacts from that point. Variant two would account for all the impacts due to
various stages of a new building. Thus, by comparing the impacts for both the variants, a decision can be
made. ATHENA® Institute conducted similar study[66] evaluating the embodied effects of existing
buildings.
Chapter Summary In this chapter, we discussed:
Four real projects that used LCA
o Case Study 1: NJMC Center for Environmental and Scientific Education
o Case Study 2: Stadium Australia / ANZ Stadium
o Case Study 3: Moreau School
o Case Study 4: Emeryville Resourceful Building
Four research projects that explored the use of LCA

A Guide to Life Cycle Assessment of Buildings
149
o Case Study 5: Three variants of a family house in Switzerland
o Case Study 6: Two variants of a single family house in the US
o Case Study 7: Office Building in Thailand
o Case Study 8: Office Building in the US
Useful observations from case studies
o Case Study 1-4: Most of these projects were small in scale, were funded by federal or
local agencies, LCA was conducted by LCA practitioners using generic LCA tools, and
assumptions were made in all these LCA studies.
o Case Study 5-6: The GWP and AP values for US house are greater than the Swiss house,
whereas the POCP value for US house was slightly less than the house in Switzerland.
o Case Study 7-8: In both office buildings, the operational stage was the most dominant
life-cycle stage in terms of overall environmental impact. Steel and concrete were the
main contributors to the impact due to the manufacturing stage.
Related Case Studies
o LCEA of land use in Ireland: A method of accounting for site selection in evaluating a
project’s environmental footprint has been discussed.
o LCA of retrofitting buildings: It demonstrates a case where LCA was used to aid in
decision making between renovating an existing building or constructing a new one.

A Guide to Life Cycle Assessment of Buildings
150
4 CONDUCTING AN LCA – EXAMPLE
This section presents an LCA study of a small institutional project, the Big Nerd Ranch, using the
ATHENA® Impact Estimator tool, and was conducted for the purpose of this paper. The study
demonstrates how LCA can be conducted in the early design phase by architects using simplified LCA
tools.
Project Overview The Big Nerd Ranch (BNR) is a proposed training facility for software professionals located in Fairburn,
Ga., approximately 20 miles from Atlanta. The project is in the Construction Documents stage at
present. The facility will comprise three building blocks (a training center and two residential blocks for
trainees) spread over a contoured site measuring 6.7 acres. For the purpose of this study, an LCA was
only conducted for the training center, also referred to as Building A.
The training center is an 8,230 sf building comprising two floors. The ground floor consists of a dining
area, kitchen, gymnasium, and restrooms. The first floor consists of a classroom, recreation space,
office, and store. The structure is primarily of wood-frame construction. The floor plans of the building
can be found in Appendix A. Building assemblies used in the training center have been described in
Table 13.
Table 13 - Description of Building Assemblies for the BNR Training Center
Assembly Type Description
Foundation Cast-in-place concrete retaining walls
Floors Light frame wood truss with ¾” plywood base finish. Carpet, rubber, cork tile, and ceramic tiles have been used for the floor finishes
Exterior Walls 2” x 6” wood stud wall with brick cladding + plywood sheathing + R-19 batt insulation + 5/8” gypsum board + latex based paint
Interior Walls 2” x 6” wood stud wall with 5/8” gypsum board + latex based paint
Roof Standing seam metal roof with prefabricated wood scissor truss + plywood roof decking + R-30 batt insulation
Doors Hollow core metal doors, solid core wood doors, and French doors
Windows Aluminum-clad wood window frame with double low-e glazing
The project resides in DOE Climate Region 3 (see figure below). The swing climate of the Piedmont
region of Georgia is challenging for ecologically driven design, as the region has significant cooling and
heating seasons with a humid summer.

A Guide to Life Cycle Assessment of Buildings
151
DOE Climate Map showing BNR project location
Environmental Design Features [67]
Gray Water Capture in Cisterns and Site Features
On-site Detention Ponds for Water Storage
Geothermal Kit
Reflective Metal Roofs
LEED Standards on Enclosure and Insulation
Low Energy/Resource Consumption Appliances and Appurtenances
Use of Local Material - SYP, Cypress, Brick
Site Conservation and Watershed Protection
Indigenous Plant Materials and Water-conserving Landscaping Plan
It should be noted here that ATHENA® Impact Estimator does not account for impacts due to land use, so environmental design features like site conservation and a water-conserving landscaping plan do not offset the project’s footprint. This is a weakness in the tool’s capabilities and is expected to be addressed by whole-building LCA tool developers. For the sake of this exercise, only the impacts caused due to the life-cycle of the training center are being evaluated, which excludes any land use impact.
Conducting an LCA Using the ATHENA® Impact Estimator As mentioned earlier in chapter 2, ATHENA® Impact Estimator is a tool for general users that can be
used for whole-building LCA analysis. It is appropriate to be employed during the schematic design stage
when basic building plans and sections are available, and preliminary material assignment is

A Guide to Life Cycle Assessment of Buildings
152
accomplished. Thus, it has been used in this study to get a snapshot of the environmental footprint of
the training center (Building A) for BNR.
Goal and Scope Definition
Goal: The goal of the study is to evaluate the overall environmental impact of Building A, which would
help in identifying the life-cycle stages and assemblies causing maximum impact. The study is focused on
determining the inventory analysis results in terms of energy use, resource use and emissions, and
impact assessment results available in terms of impact categories.
Scope: The scope of the LCA is limited to assessing global warming potential, acidification potential, and
ozone depletion potential. These categories have been chosen because they are common to other case
studies reviewed in this guide. Having common categories facilitates easy comparison and
benchmarking of the LCA results of this study.
Functional Unit: Provision of the training center for 60 years. For comparison purposes, the results have
also been normalized on a per-square-foot-per-year basis.
Building Lifespan: A 60-year life has been estimated by the structural engineer, based on type of
structure (wood frame), finishes, and climatic conditions. Most building LCAs select a service life of
between 50 and 100 years, but the basis for making this selection has yet to be standardized. In
general, for a building to realize a service life of 100 years, a comprehensive program of annual
maintenance and a significant replacement program for building systems (enclosure system, interior
finishes, mechanical systems) must be in place. If a high service life is projected, then the energy and
material flows associated with maintenance and system replacement should be included in the LCA.
System Boundary: The user is not required to define the system boundary for the LCA, as this
information is embedded inside the ATHENA tool.
Tools Used: ATHENA® Impact Estimator for LCA analysis, eQUEST for energy calculation, and MS-Excel
for tabulating the quantities. ATHENA® Impact Estimator was selected since the intention of this
exercise was to demonstrate how LCA can be conducted in the early design phase by architects using
simplified LCA tools. As mentioned in the tools chapter, ATHENA® Impact Estimator is a simplified tool
and requires input that is easily available during the early design phase. eQUEST was chosen since it is
one of the most widely accepted energy simulation software packages in the building simulation
community. MS-Excel was used, as it aids in easy tabulation of assembly dimensions and because
ATHENA® Impact Estimator results are directly exportable to MS-Excel.
Required Inputs
Basic information regarding the training center area, location, and expected life were entered in the
ATHENA® tool to set up the project. The user is only required to specify the building assembly
configuration and area to calculate the inventory analysis results. The inventory analysis process is pre-
designed within the ATHENA® model with standard assumptions. For example, ATHENA® Impact
Estimator assumes that all off-shore products are treated as though they were manufactured in North
America. Also, replacement materials are considered to be the same as those used in original
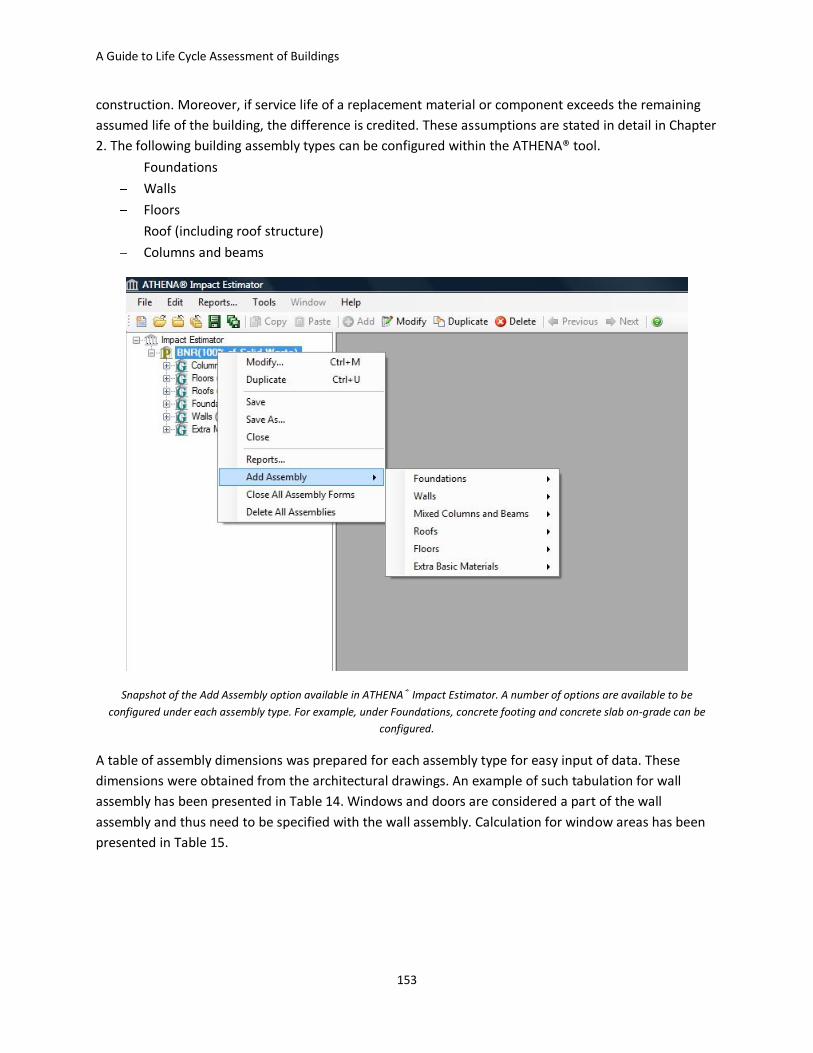
A Guide to Life Cycle Assessment of Buildings
153
construction. Moreover, if service life of a replacement material or component exceeds the remaining
assumed life of the building, the difference is credited. These assumptions are stated in detail in Chapter
2. The following building assembly types can be configured within the ATHENA® tool.
Foundations
Walls
Floors
Roof (including roof structure)
Columns and beams
Snapshot of the Add Assembly option available in ATHENA® Impact Estimator. A number of options are available to be
configured under each assembly type. For example, under Foundations, concrete footing and concrete slab on-grade can be
configured.
A table of assembly dimensions was prepared for each assembly type for easy input of data. These
dimensions were obtained from the architectural drawings. An example of such tabulation for wall
assembly has been presented in Table 14. Windows and doors are considered a part of the wall
assembly and thus need to be specified with the wall assembly. Calculation for window areas has been
presented in Table 15.

A Guide to Life Cycle Assessment of Buildings
154
Table 14 - Wall Dimensions
Name length (ft.) height (ft.)
1 Wall-Wood-Exterior-GF 216.7 11.3
2 Wall-conc-Exterior-GF 89.7 11.3
3 Wall-conc-Exterior-GF-w/clad 31.2 11.3
4 Wall-Wood-Double-Exterior-GF 63.0 11.3
5 GF Interior Wall 270.8 11.3
6 FF-Ext-Wall 307.8 10
7 FF-Int-Wall 130.1 10
Exterior Wall Detail for Building A. Such detail sections from the architectural drawings can be used to extract information for
configuring an assembly in ATHENA® Impact Estimator
The size of the door is fixed within ATHENA, which the user cannot change. Thus, the user is only
required to specify the number of doors and the material. Most of the information required by ATHENA
can be easily obtained from the architectural drawings prepared at the Schematic Design or Design
Development stage.
5/8” Gypsum Board
Latex water-based paint
5.5” Fiberglass Batt Insulation with 2” x 6 “
Wood Stud Framing
¾” Plywood Sheathing
with Tyvek Building Wrap
Brick Veneer with 1 ½” Air Space
INTERIOR EXTERIOR

A Guide to Life Cycle Assessment of Buildings
155
Table 15 - Window Areas
Window Label Number Size Area
A 3 32.40 97.20
B 1 94.20 94.20
C 1 64.80 64.80
D 2 16.20 32.40
E 2 18.00 36.00
F 2 8.91 17.82
G 1 23.76 23.76
Total 12 366.18
Window Label Number Size Area
A 10 32.40 324.00
C 3 64.80 194.40
D 1 16.20 16.20
G 1 23.76 23.76
H 1 48.60 48.60
I 1 11.88 11.88
Total 17 618.84
WINDOWS: Wood Stud Wall-Ext-GF
WINDOWS: Wood Stud Wall-Ext-FF
Wall assembly configuration window in ATHENA® Impact Estimator. Wall type, openings detail, and envelope specifications are
entered through this window. Other assembly types like floor and roof were configured in a similar manner.
A Guide to Life Cycle Assessment of Buildings
156
The figure above shows the method of configuration of an exterior wall in ATHENA® Impact Estimator. In
a similar manner, other assemblies can also be configured.
Although the operational energy input is optional in ATHENA, it was considered essential in this study.
Inclusion of operational energy facilitates the comparison of embodied and operational energy during a
building’s life cycle. The energy calculation was done using eQUEST hourly energy-simulation software.
Default plug-loads in eQUEST were used in the model. The annual energy consumption for Building A
was estimated to be 132.74 x 10³ kWh. Its energy intensity thus equals 17.68 kWh/sf, which makes
Building A 27 percent more energy-efficient than a standard educational facility.[1] This is due to the use
of high-performance building systems.
Output
Both inventory analysis as well as impact assessment results can be obtained from the Impact Estimator.
Results can be viewed in the form of tables and graphs. Since the goal of the study is to identify life cycle
stages and assemblies causing maximum impact, the following reports were generated in ATHENA®
Impact Estimator.
Graphs for Absolute Values – by Life-Cycle Stages
Tables for Absolute Values – by Assembly Group
Table for Summary Measures – by Life-Cycle Stages
Graphs for Summary Measures – by Assembly Types
Comparison Graphs – BNR and R2000 House Design
These reports can be easily generated in ATHENA® Impact Estimator by clicking on the Reports tab
on the menu bar. This opens a window with several options for creating reports. The time consumed
in generating each report (stated above) varied from one to two minutes for our exercise.
Inventory Analysis Results
ATHENA® Impact Estimator presents inventory analysis results in terms of absolute values. The term
absolute values here implies that the results are raw and comprise a long list of highly speciated flows
from and to nature in the form of energy and raw materials as well as emissions to air, water, and land.
No factorization or consolidation of the inventory results has been carried out, thus the results are
referred to as absolute values. Results can be obtained for the following environmental burdens, either
according to life-cycle stages or assembly groups.
Energy use
Resource use
Emissions to air
Emissions to water
Emissions to land
If a decision is to be made on the basis of inventory analysis results, then the results for all the five
burdens should be consistent. If the results are inconsistent, the user has to choose the environmental
burden that is most relevant for a specific project.
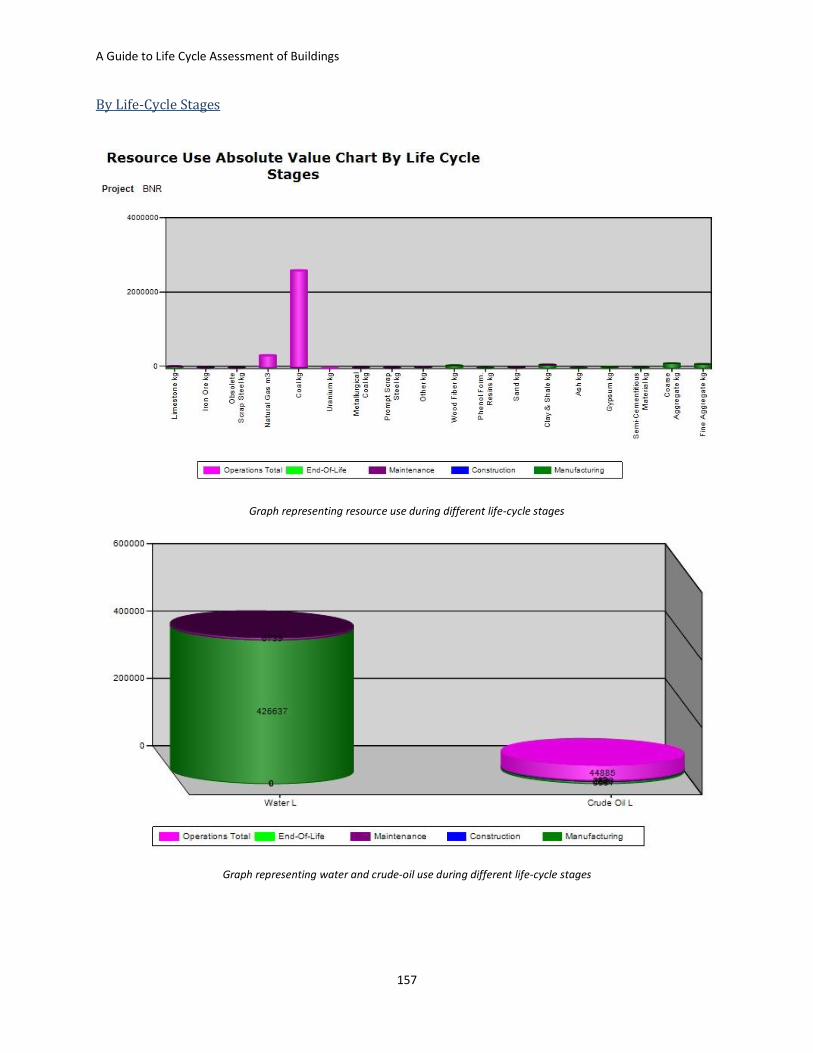
A Guide to Life Cycle Assessment of Buildings
157
By Life-Cycle Stages
Graph representing resource use during different life-cycle stages
Graph representing water and crude-oil use during different life-cycle stages

A Guide to Life Cycle Assessment of Buildings
158
It can be observed from graphs that coal (2.62 x 10⁶ kg) and natural gas (3.34 x 10⁵ m3) are the most
used resources during the training center’s life cycle. The operations stage is primarily responsible for
this use. Other significant resources used are water (4.33 x 10⁵ L), coarse aggregate (1.16 x 10⁵ kg), fine
aggregate (9.64 x 10⁴ kg), and clay and shale (7.64 x 10⁴ kg) owning to their use in the manufacturing
stage. The precise values for each of the resources have been obtained from the table generated in
addition to the graphs. It should be noted here that ATHENA Impact Estimator only accounts for the
energy consumption during the operations stage and does not include water consumption. Inclusion of
water consumption in operations may have added more burdens to the operations stage, as water
consumption contributes to the resource-use burden. Increase in water use results in depletion of water
resources, thus harming the environment.
Energy consumption is also dominated by the operations stage with coal, nuclear, and natural gas as the
major contributors. Maximum emissions to air, water, and land are caused due to the operations stage.
Carbon dioxide, sulfur dioxide, methane, and particulate matter contribute significantly to air emissions,
whereas emissions to water are primarily dissolved solids (4.94 x 10¹⁰ mg), chloride (4.06 x 10¹⁰ mg), and
sodium ion (1.13 x 10¹⁰ mg). Land emissions are mainly composed of other solid waste (6.12 x 10⁵ kg)
and concrete solid waste (2.20 x 10⁴ kg). Graphs for all these inventory analysis results can be found in
Appendix A. Thus, it can be inferred that the operations stage is the most dominant life-cycle stage in
the inventory analysis results.
By Assembly Groups
Viewing inventory analysis results according to assembly groups helps in identifying assemblies
consuming maximum energy and causing greatest emissions. The table below presents the energy
consumption by various assembly groups as well as their total energy consumption for the BNR training
center.
Table 16 - Inventory Analysis Results for Energy Consumption by Assembly Groups
92149.50 74% 2124.62 2% 22067.13 18% 4916.21 4% 343.39 0%
263454.04 96% 794.08 0% 7427.18 3% 1445.54 1% 73.33 0%
225238.96 48% 12469.09 3% 135521.10 29% 31515.78 7% 3329.90 1%
94483.27 52% 5844.31 3% 31937.75 18% 8246.23 5% 2014.51 1%
201304.08 50% 33534.64 8% 143650.15 36% 10882.11 3% 24.41 0%
788.08 65% 3.38 0% 288.35 24% 118.12 10% 4.59 0%
45297.05 59% 868.77 1% 12276.83 16% 576.83 1% 1248.31 2%
2355.99 68% 21.04 1% 661.28 19% 192.68 6% 122.99 4%
491197.31 68% 22329.75 3% 146482.73 20% 13754.44 2% 11476.93 2%
42970.97 46% 3117.96 3% 33173.26 36% 7712.04 8% 618.51 1%
73215.46 46% 0.00 0% 49926.01 31% 34801.92 22% 1735.76 1%Wood MJ 159679.16
Walls Columns and
Beams
Roofs Floors Extra Basic
Materials
LPG MJ 3448.26
Natural Gas MJ 717439.72
Nuclear MJ 93376.89
Feedstock MJ 400768.41
Gasoline MJ 1209.57
Heavy Fuel Oil MJ 76501.71
Hydro MJ 273973.21
Coal MJ 473566.12
Diesel MJ 181444.64
Material ID Total
Electricity kWh 124847.13
It can be observed from table 16 that walls account for more than 50 percent of the total energy use.
Roofs are the second largest consumer of energy in terms of their manufacturing, construction,
maintenance, and end-of-life activities. Having identified these “hot spots,” alternative assemblies can
be tested for walls and roofs to choose the option with the lowest energy consumption.

A Guide to Life Cycle Assessment of Buildings
159
In terms of resource use, foundations consume 73 percent of the total coarse aggregate, whereas the
walls and roof together consume 67 percent of the total water used in the life-cycle of the training
center (excluding water consumed during operations). Wall assemblies are responsible for most of the
emissions to air, water, and land: emissions of carbon dioxide, sulfur dioxide, methane, and particulate
matters in the case of air; concrete and other solid waste in emissions to land; and chloride, sodium, and
dissolved salts in emissions to water.
The results for inventory analysis are consistent. By life-cycle stages, the operation stage emerges to be
the most dominant, and by assembly group, wall assemblies have been found to cause the maximum
emissions and resource use in the BNR case study. The next step would typically be to identify
alternatives that can potentially reduce the environmental burden caused during the operations stage
and as a result of wall assemblies. Following the identification of alternatives, another LCA run would be
carried out using these alternatives to make a more informed decision. The application of the results has
been described in detail in the “Interpretation’ section.
Impact Assessment
ATHENA® Impact Estimator presents impact assessment results in terms of a “summary measures”
format. Three summary measures, Global Warming Potential (GWP), Acidification Potential (AP), and
Ozone Depletion Potential (ODP) have been evaluated in this study.
By Life-Cycle Stages
Graphs presenting impact assessment results for the BNR Training Center. The Y-axis represents the percent of total impact for a
given impact category

A Guide to Life Cycle Assessment of Buildings
160
Table 17 - Impact Assessment Results by Life-Cycle Stages
Total Effects
110,039.125 4,384.134 12,083.338 32.894 5,855,266.982
51,595.488 1,874.543 7,447.988 9.571 2,111,342.806
2.353 0.000 0.006 0.000 2.362
Manufacturing Construction Maintenance End - Of - Life Operating
Energy
Global Warming Potential
(kg CO2 eq)
5,728,727.491
Acidification Potential
(moles of H+ eq)
2,050,415.216
Ozone Depletion Potential
(g CFC-11 eq)
0.003
The impact assessment result by life-cycle stages shows that the operations stage dominates GWP and
AP, whereas ODP is most significant in the manufacturing stage.
Impact Assessment Results by Assemblies

A Guide to Life Cycle Assessment of Buildings
161
The graphs further illustrate that the wall assemblies have the highest impact on all of the three
evaluated impact categories. It should be noted here that the findings from the impact assessment align
with those of the inventory analysis.
Interpretation The results from inventory analysis and impact assessment either compared one life-cycle stage with the
other or one assembly to another. This helped in identifying the hot-spots within the training center’s
life-cycle. To understand the overall performance of the training center, it is essential to compare it with
a benchmark. Since widely accepted and standardized benchmarks for this type of analysis have not
been published, past case studies’ results will be used to rate the performance of BNR. The following
case studies will be used for comparison.
R2000 House Design – Toronto (Sample Projects from ATHENA® Impact Estimator Tool)
NJMC Center for Environmental and Scientific Education (Chapter 3 – Case Study 1 of this guide)
Wood Frame House – Tucson (Chapter 3 – Case Study 6 of this guide)
Table 18 - Comparison of Impact Assessment Results of BNR Building A with Other Case Studies
GWP (kg CO2 equiv. per sf per
year)
AP (Moles of H+ eqiv. per
sf per year)
ODP (g CFC-11 per sf per
year)
BNR Training Center 11.85 4.27 4.76 x 10⁻⁶
R2000 House Design 3.08 1.31 3.20 x 10⁻⁶
NJMC Building 3.12 - 444.21 x 10⁻⁶
Wood Frame House – Tucson
7.33 - 529.90 x 10⁻⁶
Table presents impact assessment results normalized on per-square-foot-per-year basis.

A Guide to Life Cycle Assessment of Buildings
162
Global Warming Potential (GWP)
The GWP value for the BNR Training Center is the highest compared to other case studies. Since GWP
can be considered a function of energy use, this variation in GWP value could be due to differences in he
embodied energy of the buildings, energy consumption during building operations, and the fuel mix
used to produce energy in these four cases.
The results for energy use for the BNR Training Center and Wood Frame House can be compared since
both the projects are located in climate zone 3. The annual energy use intensity for Tucson House is 15.8
kWh/sf whereas for the BNR Training Center it is 17.68 kWh/sf. Thus, the variation in the GWP results
for these two cases could be attributed to the difference in their energy use intensity. Since the data for
energy fuel mix was not available for Tucson, the variation in results could not be tested considering
different fuel mix.
Acidification Potential
The AP value for BNR cannot be compared with that of NJMC and wood frame house in Tucson, as the
results have been expressed in different units. When compared to R2000 House, the AP value for BNR is
higher.
Comparison of Acidification Potential by Life-Cycle Stages (per sf)
The figure above shows that the AP value for BNR is lower than R2000 House in manufacturing,
construction, maintenance, and end-of-life stages. This implies that the overall high value of AP for BNR
is due to the operations stage.
Ozone Depletion Potential (ODP)
The values for ODP vary by a large margin across different case studies. It can be observed that the
values for BNR and R2000 House fall under a close range. Thus, a probable cause of the varied results for
the four cases could difference in calculation methods used to account for ODP.

A Guide to Life Cycle Assessment of Buildings
163
Comparison of Ozone Depletion Potential by Life-Cycle Stages (per sf)
The ODP value for BNR is more than for R2000 House. The figure above indicates that the ODP value for
BNR is reasonably more than R2000 House in manufacturing stage. Thus, the difference in the overall
value for ODP can primarily be attributed to the manufacturing stage.
Chapter Summary In this chapter, we demonstrated an example of conducting LCA using simplified LCA tools. The key
points discussed were:
Details of building assemblies of the Big Nerd Ranch Training Center
Environmental features of the project
Conducting an LCA using ATHENA Impact Estimator, which involves the following aspects
o Required input: Building area, location, estimated life-span, and assembly details
o Output: Inventory analysis and impact assessment results available in the form of graphs
and tables
Environmental burdens assessed under Life Cycle Inventory (LCI) analysis:
o Energy use
o Resource use
o Emissions to air
o Emissions to water
o Emissions to land
Inventory analysis results: By life-cycle stages, the operation stage was most dominant, and by
assembly group, wall assemblies caused the maximum emissions and resource use
Impact categories evaluated under Life Cycle Impact Assessment (LCIA):
o Global Warming Potential (GWP)
o Acidification Potential (AP)

A Guide to Life Cycle Assessment of Buildings
164
o Ozone Depletion Potential (ODP)
LCIA results: The operations stage and wall assemblies have the highest impact
LCIA results of BNR compared with LCIA results of three other LCA studies
o R2000 House Design
o NJMC Building
o Wood Frame House - Tucson

A Guide to Life Cycle Assessment of Buildings
165
5 GUIDELINES TO INTEGRATE LCA IN BUILDING DESIGN AND
EVALUATION
This chapter presents guidelines to integrate LCA in building design and evaluation for a number of
scenarios. Prior to presenting the guidelines, various scenarios of application of LCA in buildings are
discussed in the early part of this chapter. The rest of the chapter describes key issues and decisions to
be addressed in each step of LCA. The intent of the chapter is to answer the question: Where and how
can LCA be used in buildings?
Exploring the Scenarios of Use of LCA Based on the literature reviewed for this paper, it was concluded that any building-related LCA analysis
is defined by four variables:
Life-cycle stages to be included in analysis
Building systems to be studied
Type of expected results from either Life Cycle Inventory (LCI) Analysis or Life Cycle Impact
Assessment (LCIA)
Project phase at which LCA analysis is carried out.
Each variable can have several possible values. Figure 32 presents possible values for each variable.
Various combinations of these variables can lead to different scenarios of use for LCA. Two
combinations of these variables presented in figure 32 result in two possible scenarios of use. Scenario A
uses LCA methodology for evaluating the material manufacturing stage of the whole-building in terms of
all impact categories after the building is constructed. Another possible combination is represented by
Scenario B which uses LCA to evaluate the impact on energy use of a building assembly for all stages of
building life-cycle during the detailed-design stage.

A Guide to Life Cycle Assessment of Buildings
166
Definition of scenario A and scenario B
Life Cycle Stages Material Manufacturing
Construction
Operation and
Maintenance
Demolition and Disposal
Building Systems Whole-Building
Part Systems/Assemblies
Building Product
Life Cycle Inventory
Results Energy Use
Material Use
Emissions
Life Cycle Impact
Assessment Results (LCIA) GWP
AP
EP
POCP
etc
Phase during which
LCA is conducted Preliminary Design
Design Development
Detailed Design
Post-construction
Scenario A
Scenario B
Using the LCA
methodology for
evaluating the
material
manufacturing
stage of the whole
building in terms of
all impact
categories after the
building is
constructed.
Using LCA to
evaluate the
energy use of a
building assembly
for all life-cycle
stages of a
building during
detailed design.
.stage.

A Guide to Life Cycle Assessment of Buildings
167
If one value is picked from each of the four variable categories at a time, 84 possible scenarios emerge
for calculation. Because the opportunities for using LCA are so numerous, describing each possible
scenario is beyond the scope of this guide. Instead, this discussion will focus on seven of the most
common scenarios building LCA:
Scenario 1 – Life Cycle Impact Assessment (LCIA) of Whole-Building for All Life-Cycle Stages to
Optimize a Building Design during Preliminary Design Stage
o Variables: All life-cycle stages – Whole building – All categories in LCIA results – LCA
included during preliminary design stage
Scenario 2 – LCIA of Whole-Building for All Life-Cycle Stages to Evaluate a Building Design during
Detailed Design Stage
o Variables: All life-cycle stages – Whole building – All categories in LCIA results – LCA
included during detailed design stage
Scenario 3 - Evaluating a Building’s Environmental Footprint after Construction to Establish
Baselines for Future Studies
o Variables: All life-cycle stages – Whole building – All categories in LCIA results – LCA
included during post-construction stage
Scenario 4 – Evaluating the Impact of One Assembly over the Life-Cycle of Building to Help in
Selection of Assembly
o Variables: All life-cycle stages – One building assembly – All categories in LCIA results –
LCA included during design development stage
Scenario 5 – Evaluating a Specific Impact for the Whole Building
o Variables: All life-cycle stages – Whole building – Global Warming Potential – LCA
included during preliminary design or design development stage
Scenario 6 – Evaluating the Impact of Using a Product during Maintenance Stage of a Building
Life-Cycle
o Variables: Operation and maintenance stage – Product – All categories in LCIA results –
LCA included during post-construction stage
Scenario 7 – Calculating the Environmental Payback of a Green Technology
o Variables: All life-cycle stages – Green Technology (assembly) – All categories in LCIA
results – LCA included during design development or detail design stage
These scenarios have been described in detail in the next section.

A Guide to Life Cycle Assessment of Buildings
168
Guidelines to Integrate LCA in Building Design and Evaluation Integration of LCA in building design and evaluation calls for a step-by-step process. The following
process can be adopted to using LCA in buildings.
Process to utilize LCA in building design and evaluation
Step 1: Defining the Project’s Sustainability Targets
Sustainability targets for a green building project are usually defined during the early stages. These
targets could range from achieving 20 percent energy efficiency during building operation to reducing 50
percent carbon emissions caused due to a building’s life cycle. In this first step, it is important to define

A Guide to Life Cycle Assessment of Buildings
169
objective sustainability targets to be met by the project. Objective targets help in evaluating the success
of a project.
Step 2: Conduct an LCA or Not?
In this step, the vital decision of whether to conduct an LCA should be taken. This decision shall depend
on the project’s sustainability targets and time and resource constraints. For example, a project’s target
could be to achieve 50 percent reduction in its carbon emissions during building operation. In this case,
conducting an LCA is not required. An energy simulation coupled with an energy-to-emissions converter
can help quantify the achievement of targets. However, if a project aims to achieve 50 percent
reduction in its carbon footprint over the entire life cycle, use of LCA becomes almost imperative. If a
decision to conduct an LCA is taken here, steps 3 to 8 can be followed to help quantify the achievement
of project targets.
Step 3: Defining the Goals and Scope of an LCA Study
The goal and scope of the LCA study can be defined by the four variables described earlier in this
chapter:
Life-cycle stages to be included in the analysis
Building systems to be studied
The type of expected results from either Life Cycle Inventory (LCI) Analysis or Life Cycle Impact
Assessment (LCIA)
The project phase at which LCA analysis is carried out.
For example, the goal of an LCA study can be evaluating the material manufacturing stage of the whole
building in terms of all impact categories after the building is constructed. In this case, the scope of the
LCA is limited to the material manufacturing stage and, therefore, systems and flows in other life-cycle
stages need not be accounted. Other key issues that need consideration in this step are:
Defining system boundary
This is usually presented in the form of a flow chart that clearly depicts the systems and flows included
in the LCA study. If the four variables are clearly defined, sketching this diagram is easy. Previous case
studies can be referenced in drawing a system boundary diagram.
Functional unit
The decision for a functional unit must be taken with care. Based on the case studies reviewed, it can be
concluded that in the case of whole-building LCA, an apt functional unit is the provision of a building for
the expected lifespan of a building—for example, provision of a school for 50 years. In case of a
comparison of assemblies, the suggested functional unit is the unit area of assembly for the lifespan of
building. An example would be comparing two exterior wall assemblies for a 50-year lifespan. Product
comparison should be completely dependent on functional equivalence. For example, two options for
floor covering, carpet, and ceramic tiles cannot be compared on a per-square-foot basis because
maintenance and replacement impacts for carpet are much higher than for ceramic tiles. An appropriate
functional unit for this should be “the provision of floor covering for 50 years.”

A Guide to Life Cycle Assessment of Buildings
170
Step 4: Choosing an LCA Tool
The choice of an LCA tool depends on the goal and scope definition of an LCA study. Goal and scope
definition outlines a scenario for the use of LCA. The seven most common scenarios of LCA application
have been briefly explained in the following section along with guidelines to choosing the right tool to
suit the scenario.
Scenario 1 – Life Cycle Impact Assessment (LCIA) of Whole-Building for All Life-Cycle Stages to
Optimize a Building Design during Preliminary Design Stage
Evaluating several alternatives during the schematic design stage is a common step in every building
design process. The goal during this stage is to select the most environmentally friendly option from
among those available. The LCA analysis conducted to achieve this goal can be defined by the four
variables as shown in Figure 33.
Scenario 1 defined by four variable values
Tool selection: These four variables also set the criteria for selecting LCA tools to be employed in the
study. The study is to be conducted during the preliminary stage, when information available about the
project and building assembly detail is minimal. Thus, a tool must be selected that takes approximate
information. Also, it is required to analyze the whole building, thus a whole-building LCA tool is needed.
Moreover, Life Cycle Impact Assessment (LCIA) results are expected as outputs. Thus the tool needs to
have an LCIA method embedded in it. Finally, the goal of the study is to assess all the life-cycle stages of
a building. Thus, a tool that considers all the life cycle stages needs to be selected. Considering all the
criteria, a tool like Envest would be most suitable for this scenario.
Example: Case study 2, Stadium Australia[59] included in this document is an example of such a
scenario. In this case study, three options for stadium design were evaluated during the preliminary
design stage.
Scenario 2 – LCIA of Whole-Building for All Life-Cycle Stages to Evaluate a Building Design during
Detailed Design Stage
At the detail design stage, the design team might be interested to know how precisely their proposed
design is performing better than the baseline cases. Thus, analysis conducted to achieve this goal can be
defined by the variables presented in Figure 34.
Life Cycle Stages
All
Building Systems
Whole Building
LCIA Results All categories
Phase During
Which LCA Is Included Preliminary
Design Stage

A Guide to Life Cycle Assessment of Buildings
171
Scenario 2 defined by four variable values
Tool selection: The only difference between scenarios 1 and 2 is the stage at which the LCA study is
taken up. This changes the quality of information that is available regarding a project. Thus, a more
precise quantification can now be carried out. This leads to the choice of a tool capable of taking details
for assemblies and systems. ATHENA® Impact Estimator can be a suitable tool for this scenario.
Example: Case study 1, New Jersey Meadowland Commission’s Center for Environmental and Scientific
Education, is an example of such a scenario. In this case, SimaPro was used to study the impact of the
building during the detailed design stage and to compare it with published baselines.
Scenario 3 - Evaluating a Building’s Environmental Footprint after Construction to Establish
Baselines for Future Studies
The goal of conducting an LCA in this case is to establish baselines for future studies. Thus, LCA is carried
out after the construction stage, which eliminates a number of assumptions that are made for the
material manufacturing and construction stages and helps arrive at more accurate results. This scenario
is defined by the four variable values presented in Figure 35.
Scenario 3 defined by four variable values
Tool selection: The only difference between scenarios 3 and 2 is the stage at which LCA was conducted.
Since case-specific data about energy and material use during transportation and construction are
available and a high level of accuracy is required in the results, use of an LCA practitioner tool is
suggested here, for example, SimaPro.
Example: Research Case Study 7, Variants of a House in US can be considered to be an example of this
scenario. Although it was not a real project, and so assumptions were made for some activities, it
presented a case where detailed LCA was conducted on a representative building type.
Life Cycle Stages
All
Building Systems
Whole Building
LCIA Results All categories
Phase During Which LCA Is
Included Post-
construction
Life Cycle Stages
All
Building Systems
Whole Building
LCIA Results All categories
Phase During
Which LCA Is Included
Detailed Design Stage

A Guide to Life Cycle Assessment of Buildings
172
Scenario 4 – Evaluating the Impact of One Assembly over the Life-Cycle of Building to Help in
Selection of Assembly
During design development stage, choices among competing assemblies are made. This goal can be
fulfilled by defining the LCA study by the variable values presented in Figure 36.
Scenario 4 defined by four variable values
Tool selection: The values of two variables have changed if this scenario is compared to scenario 3. This
scenario focuses on evaluating only one assembly for its impact during the building life cycle. Thus, an
assembly LCA tool can be used that accounts for all the life-cycle stages and shows results for different
impact categories. ATHENA® EcoCalculator could be used for this, but note that it does not account for
the building operation phase. Thus, impact due to the operation phase needs to be added externally if
ATHENA® EcoCalculator is used. A tool that fulfills all the needs of this scenario could be ATHENA®
Impact Estimator.
Scenario 5 – Evaluating a Specific Impact for the Whole Building
The goal of an LCA study could be to quantify and mitigate only a specific impact, such as Global
Warming Potential (GWP) for the whole building. This scenario is defined by the variables shown in
Figure 37.
Scenario 5 defined by four variable values
Tool selection: Since the impact category to be evaluated is specified, a tool that presents results in this
category should be selected. The goal of this study should be to recognize the level of accuracy expected
in results. Taking this factor into account and the stage at which LCA is conducted, a choice can be made
between a simplified LCA tool and a detailed LCA tool. In the case of a simplified tool, EcoCalculator can
Life Cycle Stages
All
Building Systems
Whole Building
LCIA Results Global
Warming Potential
Phase During Which LCA Is
Included Preliminary/
Design Development
Life Cycle Stages
All
Building Systems
One Building Assembly
LCIA Results All categories
Phase During Which LCA Is
Included Design
Development

A Guide to Life Cycle Assessment of Buildings
173
be used as it gives results for GWP. Operational energy should be externally accounted for in this case.
Otherwise, a tool like EQUER could also be used.
Example: To apply for carbon credits, a building’s life cycle would be evaluated for only global warming
potential (GWP).
Scenario 6 – Evaluating the Impact of Using a Product during Maintenance Stage of a Building Life-
Cycle
An LCA study could also be conducted to help design the housekeeping program of a facility. The choice
of products for this could significantly affect a building’s life cycle impact, as maintenance is a recurring
activity. This scenario can be defined by the four variables presented in Figure 38.
Scenario 6 represented by four variable values
Tool selection: Since the goal is to study only the impact of a building product on the maintenance
stage, a product LCA tool should be used that shows impact distribution among different stages of life. It
should be confirmed that the specific tool takes into account the maintenance stage. BEES® could be
used in this case if the specific product is available in BEES® product list. Otherwise, a detailed LCA tool
could be used to evaluate a more accurate result for the environmental impact of the product.
Example: Evaluating the impact of using a cleaning product during maintenance phase for an airport.
Scenario 7 – Calculating the Environmental Payback of a Green Technology
Green buildings use high-performance systems and assemblies to make the building more energy-
efficient during the operations phase. Examples of such systems and assemblies can be high-
performance window assembly, high insulation walls, or solar technologies like photovoltaic panels. The
goal of such a study is to weigh the environmental impacts of a green technology during different
phases of design and evaluate how impacts in other life cycle phases can be mitigated by energy saved
or produced during the operations phase. Variables characterizing scenario 7 are presented in Figure 39.
Life Cycle Stages
Operation and
Maintenance
Building Systems Product
LCIA Results All
Phase During Which LCA Is
Included Post-
construction

A Guide to Life Cycle Assessment of Buildings
174
Scenario 7 defined by four variable values
Tool selection: Since a green technology needs to be evaluated, the tool options available are very
limited, as the inventory data for these innovative technologies have not been incorporated in the
database. A detailed LCA tool is required to model the life of the green technology. Negative values of
impacts due to energy saved or produced because of the use of technology should be plotted against
added impacts during the production and maintenance stage to obtain the environmental payback of a
technology. Tools like GaBi, Boustead, and SimaPro might be able to model such an LCA study.
Example: Case study 3 presents an example where an attempt was made to calculate the environmental
payback for using high-performance glazing in a school in Argentina.
Other Criteria to Consider While Selecting Tools
The previous sections make suggestions for choosing a suitable tool based on a scenario of use of LCA.
Other than these suggestions, a list of tool aspects should also be considered in too selection:
Availability of information about building materials and assemblies
Availability of building energy analysis results
Time constraint
User Skills
Accuracy of required output.
The user must be aware of the features to be considered while selecting a tool suited to specific
requirements. Table 22 presents a recommended list of features that each tool should be judged
against. To aid in a better understanding of this process, two popular whole-building LCA tools have
been selected for comparison: ATHENA® IE and LCAid™.
Life Cycle
Stages
All stages
Building
Systems
Green
Technology
(Assembly)
LCIA Results
All
Phase During
Which LCA Is
Included
Design
Development/
Detail Design

A Guide to Life Cycle Assessment of Buildings
175
Table 13 - Comparison of features of ATHENA®-IE and LCAid™ tool
Features ATHENA® IE LCAid™
1 LCA Tool Type Whole Building LCA Tool Whole Building LCA Tool
2 Acceptable Building
Type
Industrial, Institutional, Commercial,
Residential
All Types
3 Acceptable Building
Phase
New Construction and Major
Renovation
New Construction and Existing
Buildings
4 Target Users Architects, engineers, designers,
environmental consultants
Architects, engineers, students,
LCA practitioners and evaluators
5 Required User Skills Moderate Moderate
6 LCI Data ATHENA® database based on
Canadian and North American
Region
DPWS database based specific to
Australia. Can import data from
other databases like Boustead
(UK), SimaPro(NL)
7 Available Building
Material/Assembly
Combinations
1,200 Assemblies 400+ Building Materials
8 Units SI and Imperial -
9 Life Cycle Stages 1. Material Extraction and
Manufacturing
2. Related Transport
3. On-site Construction
4. Operation (energy only) and
Maintenance
5. Demolition and Disposal
1. Material Extraction and
Manufacturing
2. Related Transport
3. On-site Construction
4. Operation (energy and water)
and Maintenance
5. Demolition and Disposal
10 Impact Categories 1. Embodied primary energy use
2. Acidification Potential
3. Global Warming Potential
4. Human Health Respiratory
Effects Potential
5. Ozone Depletion Potential
6. Smog Potential
7. Aquatic Eutrophication
Potential
8. Weighted Resource Use
1. Life Cycle embodied energy
2. Acidification Potential
3. Life Cycle Green House Gas
Emissions
4. Carcinogenesis
5. Ozone depletion
6. Summer/Winter smog
7. Eutrophication
8. Heavy metals
9. Solid Wastes
10. Water consumption
11. Primary fuels
11 Input Method Manual Entry Material Quantities can be
imported from 3D Models:

A Guide to Life Cycle Assessment of Buildings
176
CAD(.dwf), ECOTECT (.eco/.zon).
All other, manual entry
Features ATHENA® IE LCAid™
12 Input 1. Location
2. Building Type
3. Building Life
4. Building Material and Assembly
Details
5. Operational Energy (optional)
1. Climate Zone
2. Building Type
3. Building Material and
Assembly Details
4. Operational Energy (optional)
5. Waste Management
6. Water Management
7. Water Use (optional)
8. Indoor Air Quality (optional)
9. Biodiversity (optional)
13 Output Format Summary Tables/ Graphs Graphs
14 Output Can be categorized by assembly
groups and life-cycle stages
Operating vs Embodied impact
results
Five design options can be
compared at a time
Bill of quantities
Comparison of a design to a
benchmarked building
Environmental impacts for a
design at each stage of the
buildings life cycle
Five design options can be
compared at a time
Waste generation
Water consumed
Energy consumption(if linked
to Australian Energy Thermal
Engine)
15 Interoperability Tables can be directly exported to
MS-excel or PDF
Can import .dxf, .eco and .zon files
for material quantity input
16 Additional Features Creation of Bill of Quantities Life Cycle Costing Modules
17 Strengths High quality, regionally sensitive
databases and user-friendly
interface provide both detailed and
aggregated results and superior
assembly and complete design
comparison capability.
LCA highlights the strengths and
weaknesses of a building in terms
of energy and water use, and
waste generation
18 Weaknesses Limited to structural materials and
assemblies. Right now the ATHENA®
model only contains databases for
wood, steel, and concrete products
used in structural applications
Output format is not flexible.
Limited building
material/assembly options.
19 Latest Available
Version
ATHENA® Impact Estimator for
Building Version 4.0
-
20 Cost $750 -

A Guide to Life Cycle Assessment of Buildings
177
Step 5: Life Cycle Inventory (LCI) Analysis Once the goal of the study is fixed and an appropriate tool has been selected, there are some key issues
that require consideration during the next two steps that will be critical both when a detailed LCA study
is conducted using a detailed LCA tool and in the case of simplified tools that have the entire LCA
process preset within.
Inventory analysis is the most critical part of an LCA. Most of the whole-building LCA tools only require
inputs in form of building area, assembly detail, and material take-offs. There are a lot of assumptions
that are embedded in the calculation of inventory flows. In detailed LCA tools, many other decisions
need to be taken by the user during this stage, which will involve data collection. It is also essential to
understand the role of different team members in the project. Some of the key issues are:
Quantity take-offs
Quantity take-offs are required as input in some LCA tools. The contractor is responsible for providing
this. Tools like RS Means can be used for this, as well. And if a BIM model is used during design, a bill of
quantities can be generated from that.
LCI data for building materials
Simplified LCA tools ask for building location information. This helps the tool to extract inventory data
appropriate for that region. As mentioned in earlier chapters, an array of country-specific databases is
available. Most of the databases have industry average data. It was observed in the case studies,
however, that these databases are not robust enough to include most of the building products. Thus, it
is unlikely in any detailed whole-building study to avoid collecting data from other sources. Product
manufacturers, trade organizations, final invoices, and product submittals from previous projects can
help one collect or estimate required data.
Fuel mix for electricity generation
Different regions of the world have different fuel mix. Fuel mix can be described as a distribution of the
share of each renewable and non-renewable source of energy generation as a ratio of the overall
electricity generation for a region. For example, according to the US DOE Energy Information
Administration, the fuel mix for electricity in Atlanta is 70 percent coal, 15 percent natural gas, 14
percent nuclear, and 1 percent hydroelectric. Check that a tool considers the difference in fuel mix for
electricity generation when buildings in two different regions are compared.
Estimation and calculation
The LCA tool being used may or may not have default values for certain activities during building life
cycle. Therefore, a number of estimations need to be made to complete the LCA. In other instances, an
LCA tool might prompt for values calculated using other software. For example, an LCA tool can have an
option to feed in the annual energy and water consumption values calculated externally. Thus, other
tools might be required in conjunction with an LCA tool to complete an LCA study. The figure below
briefly describes ways of estimating and calculating these values.
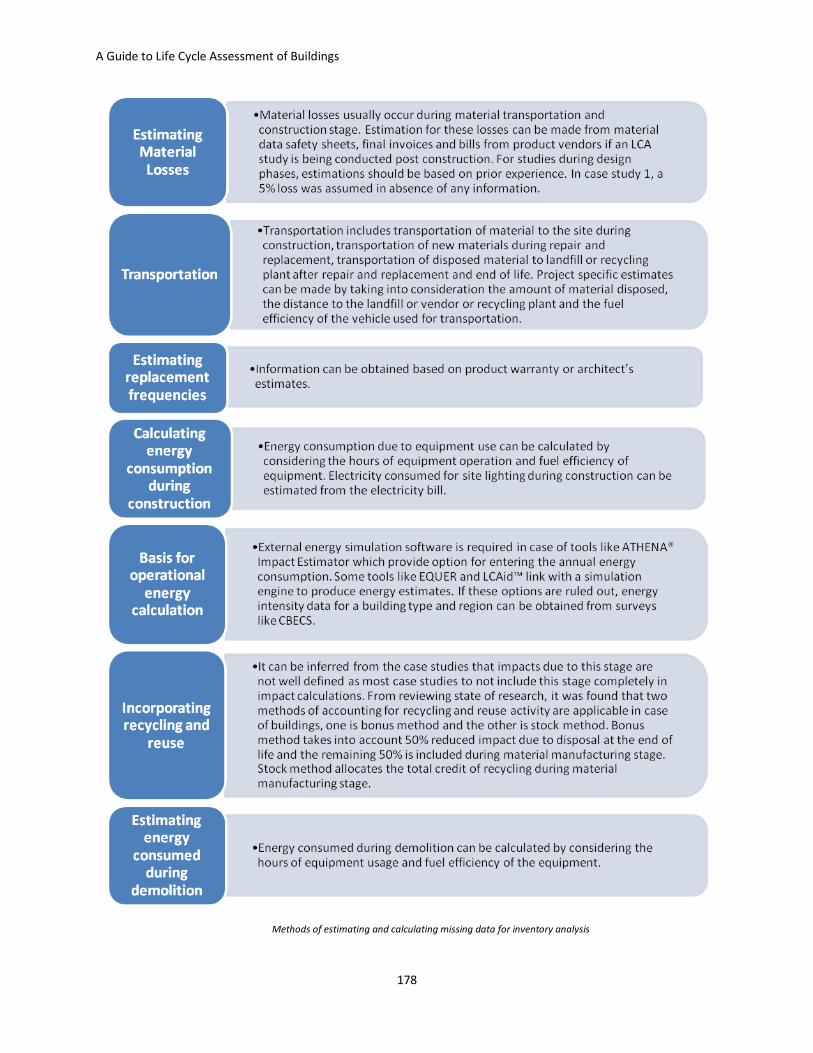
A Guide to Life Cycle Assessment of Buildings
178
Methods of estimating and calculating missing data for inventory analysis

A Guide to Life Cycle Assessment of Buildings
179
Inclusion of photovoltaic panels or other green technologies
LCA data should be obtained from the manufacturer. This issue has been explained in Scenario 7 of the
previous section.
Whether to conduct LCIA?
LCI analysis results can assist in decision making when one design option seems to perform better in all
categories than the other. If, however, there is no such distinction evident in the LCI results, one can go
a step further and use an impact assessment model to understand impacts in various environmental
categories. In this case, the user can either decide which impact matters the most to make a decision or
use the category weights defined by the BEES® stakeholder panel or EPA scientific advisory board to get
the overall environmental performance of the product.
Step 6: Life Cycle Impact Assessment (LCIA)
If the inventory results are not conclusive, impact assessment is taken up. Decisions that need to be
taken are the method to be employed for calculation and whether the required output for result should
be a single value or multiple values.
Method to be used
Various methods of impact assessment have been proposed by different scientific organizations and
groups. For example, TRACI is a method proposed by US EPA. An assessment method that produces
results for the required impact category should be selected. Moreover, using more than one impact
method will help validate the robustness of assessment results, as was done in Case Study 6 (Two
Variants of a House in US).
Whether to normalize results
Depending on the required format for results, a decision can be made on normalization, which is a
technique for changing impact indicator values with differing units into a common, unit-less format by
dividing the impact category value by a selected reference quantity.[71]
Whether to apply weights
Weights need to be applied only if a single-value performance indicator is required. Weights have been
defined by various scientific groups, and any of those can be used. Or weights can be defined by users by
their own assessment of the relative importance of each impact.
Step 7: Results and Interpretations
The output from step 5 or 6 will either be a single value or multiple impact values. To assess the
performance of the building, these values need to be compared to benchmark or baseline values. From
Case Study 6, baseline values were obtained for a wood and concrete house for five locations. The global
warming potential was measured to fall between 96 kg-CO2 equi./m2/Y and 74 kg-CO2 equi./m2/Y. The
acidification potential for a standard house should range between 438.6 and 570.1 g-SOx equi./ m2/Y,
whereas the photochemical smog formation potential should range between 22.6 and 26.7 g-C2H4 equi./
m2/Y. Similar baselines can be obtained for other building types by conducting similar studies. Thus, by
comparison with baseline numbers, environmental performance of a building can be rated and
improved.
A Guide to Life Cycle Assessment of Buildings
180
The next step would typically be to identify alternatives that can potentially reduce the environmental
burden of the building. Following the identification of alternatives, another LCA run would be carried out
using these alternatives to make a more informed decision.
Chapter Summary In this chapter, we discussed:
Four variables that help define the goal and scope of an LCA study
o Life-cycle stages to be included in analysis
o Building systems to be studied
o Type of expected results from either Life Cycle Inventory (LCI) Analysis or Life Cycle
Impact Assessment (LCIA)
o Project phases at which LCA analysis is carried out
Seven most common scenarios of use of LCA in buildings
o Scenario 1 – Life Cycle Impact Assessment (LCIA) of Whole-Building for All Life-Cycle
Stages to Optimize a Building Design during Preliminary Design Stage
o Scenario 2 – LCIA of Whole-Building for All Life-Cycle Stages to Evaluate a Building
Design during Detailed Design Stage
o Scenario 3 - Evaluating a Building’s Environmental Footprint after Construction to
Establish Baselines for Future Studies
o Scenario 4 – Evaluating the Impact of One Assembly over the Life Cycle of Building to
Help in Selection of Assembly
o Scenario 5 – Evaluating a Specific Impact for the Whole Building
o Scenario 6 – Evaluating the Impact of Using a Product during Maintenance Stage of a
Building Life Cycle
o Scenario 7 – Calculating the Environmental Payback of a Green Technology
Process to integrate LCA in building design and evaluation
o Step 1: Defining the project’s sustainability targets
o Step 2: Deciding whether to conduct an LCA or not – based on project scope, time, and
resource limitations; if it is decided to conduct an LCA, go to step 3 or follow an
alternate methods to check if the project targets are met
o Step 3: Defining the goals and scope of LCA study
o Step 4: Choosing an LCA tool appropriate to the goals also finding alternate methods to
evaluate processes not included in the tool
o Step 5: Life Cycle Inventory (LCI) analysis
o Step 6: Life Cycle Impact Assessment (LCIA)
o Step 7: Results and Interpretations (and implementing design improvements if
conducted during design stage)

A Guide to Life Cycle Assessment of Buildings
181
6 CONCLUSION AND DISCUSSION
In this guide, we established a basic understanding about LCA for participants in the building industry—
particularly architects—that includes the utility of LCA and proposed guidelines/suggestions for
conducting LCA. To achieve this, we reviewed a set of eight case studies and nine LCA tools as well as
conducted an example LCA. The guide reviewed the state of research to find answers to present
limitations of use of LCA in practice. We showed that LCA results can help answer numerous questions
that arise during the design and construction of a green building. It can reinforce the decisions taken
by architects by providing a scientific justification. A number of whole-building LCA tools are available
for use by architects.
In the current state of LCA, the limitations must be recognized. However, it also needs to be recognized that with increasing use, research, and tools development, these limitations will be resolved.
One limitation is the scarcity of the financial incentives for LCA use at this time, although this is expected to change quickly as LEED and ASHRAE 189.1 become proponents of the use of LCA in the design process. Currently, the greatest incentive is the ability of an architect to show the client that the use of LCA will improve and demonstrate the green-ness of the project and help significantly in increasing long-term paybacks by better decision making.
A second limitation is the deficiencies in the completeness of available databases, requiring the architect or LCA practitioner to use multiple data sources and an increased number of assumptions. This limitation is being ameliorated as the databases enlarge their store of information and as more tools and more easily used tools become available. The last major limitation is the lack of benchmarks established by government authorities, particularly in the US, that can be used for comparisons. This limitation also will be overcome as LCA becomes more commonly used and benchmark data become more readily available.
We opine that with improvements in LCI databases and whole-building LCA tool capabilities, design
practitioners will have more faith in LCA results and be more inclined to conduct LCA analyses. As larger
numbers of case studies are conducted representing different building types to set benchmarks, robust
normalizing and weighting methods will be established as the tools are advanced. The establishment of
attractive incentives in terms of tax incentives and other financial incentives, particularly in the US, will
entice more owners along the path toward integration of LCA in building design and promote its
widespread use by architects.

A Guide to Life Cycle Assessment of Buildings
182
7 GLOSSARY
(Source: http://www.lcacenter.org/LCA/LCA-definitions.html ;
http://lca.jrc.ec.europa.eu/lcainfohub/glossary.vm)
Acidification Potential (AP)
Acidifying compounds emitted in a gaseous state either dissolve in atmospheric water or become fixed
on solid particles. They reach ecosystems through dissolution in rain. The two compounds principally
involved in acidification are sulfur and nitrogen compounds. The unit of measurement is grams of
hydrogen ions per functional unit of product.
Benchmarking
Comparison of products to determine improvement, optimization, and saving potentials.
Carbon Accounting
The process by which CO2 emissions from fossil fuel combustion are calculated.
Cradle-to-Cradle
A specific kind of cradle-to-grave assessment in which the end-of-life disposal step for the product is a
recycling process.
Cradle-to-Gate
An assessment of a partial product life cycle from manufacture (cradle) to the factory gate, i.e., before it
is transported to the consumer.
Cradle-to-Grave
The full Life Cycle Assessment from manufacture (cradle) through the use phase and to the disposal
phase (grave).
Ecological Toxicity
The impact potential of a chemical released into the environment to harm terrestrial and aquatic
ecosystems. The unit of measurement is grams of 2, 4-dichlorophenoxy-acetic acid per functional unit of
product.
Embodied Energy
The sum of energy input during the material manufacturing and construction phase of a building.
Environmental Product Declaration (EPD)
An internationally standardized (ISO 14025) and LCA based method to communicate the environmental
performance of a product or service.
A Guide to Life Cycle Assessment of Buildings
183
Equivalents
A metric measure used to compare, based on impact potential, the emissions from different sources
contributing to a particular impact category.
Eutrophication Potential (EP)
The addition of mineral nutrients to the soil or water. In both media, the addition of large quantities of
mineral nutrients, such as nitrogen and phosphorous, results in generally undesirable shifts in the
number of species in ecosystems and a reduction in ecological diversity. The unit of measurement is
grams of nitrogen per functional unit of product.
Fossil Fuel Depletion
An impact that addresses only the depletion aspect of fossil fuel extraction, not the fact that the
extraction itself may generate impacts. The unit for measurement is mega joules (MJ) of fossil-based
energy per functional unit of the product.
Functional Unit
The unit of comparison that assures that the products being compared provide an equivalent level of
function or service.
Fuel-mix for Energy Generation
A breakdown, typically expressed in percentages, of the contribution of each renewable and
nonrenewable source in the production of energy for a specific region.
Gate-to-Gate
A partial LCA that examines only one value-added process in the entire production chain, for example
evaluating the environmental impact due to the construction stage of a building.
Global Warming Potential (GWP)
Characterizes the change in the greenhouse effect due to emissions and absorptions attributable to
humans. The unit for measurement is grams equivalent of CO2 per functional unit (i.e., other
greenhouse gases, such as methane, are included in this category and measured in CO2 equivalents).
Greenhouse Effect
Warming of the atmosphere due to the reduction in outgoing long-wave heat radiation resulting from
their absorption by gases such as CO2, methane, etc.
Impact Category
Class representing environmental issues of concern to which LCI results may be assigned.
Life Cycle
Consecutive and interlinked stages of a product system, from raw material acquisition or generation of
natural resources to final disposal.
Life Cycle Assessment (LCA)
A process of compilation and evaluation of the inputs, outputs, and potential environmental impacts of
a product system throughout its life cycle.

A Guide to Life Cycle Assessment of Buildings
184
Life Cycle Costing (LCC)
a) The total cost linked to the purchase, operation, and disposal of a product (equivalent to "Total Cost
of Ownership" [TCO]); b) The cost of a product or service over its entire life cycle, including external
costs.
Life Cycle Energy Analysis (LCEA)
An abbreviated form of LCA that uses energy as the only measure of environmental impact. Also
referred to as Life Cycle Energy Assessment.
Life Cycle Impact Assessment (LCIA)
The LCA phase aimed at understanding and evaluating the magnitude and significance of the potential
environmental impacts of a product system.
Life Cycle Impact Assessment (LCIA) Method
Methods that provide impact factors for elementary flows to evaluate the environmental effects of a
product or a process through its whole life cycle. For example, Eco-indicator-95 and Eco-indicator-99.
Life Cycle Inventory (LCI) Analysis
The phase of LCA involving the compilation and quantification of inputs and outputs for a given product
system throughout its life cycle.
Life Cycle Management (LCM)
A business management concept based on life cycle considerations that can be used in the development
and application of sustainability strategies. Life cycle management is about minimizing environmental
burdens throughout the life cycle of a product or service.
Normalization
A technique for changing impact indicator values with differing units into a common, unit-less format.
This is achieved by dividing the impact category value by a selected reference quantity.
Operational Energy
Energy used in buildings during their operational phase, including energy consumption due to HVAC
system, lighting, service hot water, etc.
Ozone Depletion Potential
The extent to which emissions from some processes may result in the thinning of the ozone layer, which
protects the earth from certain parts of the solar radiation spectrum. The unit of measurement is CFC-11
per functional unit of the product.
System Boundary
Interface between a product system and the environment or other product systems.
Smog Formation Potential
The contribution of a product or system to the production of photochemical smog under certain climatic
conditions (e.g., air emissions from industry and fossil-fueled transportation trapped at ground level and
reacting with sunlight). The unit of measurement is grams of nitrogen oxide per functional unit of

A Guide to Life Cycle Assessment of Buildings
185
product. This highlights an area where a regional approach to LCA may be appropriate, as certain
regions of the world are climatically more susceptible to smog.
Water Use
Water resource depletion has not been routinely assessed in LCAs to date, but researchers are beginning
to address this issue to account for areas where water is scarce, such as the western United States. The
unit of measurement is liters per functional unit.
Weighting
A calculation by which impact (or damage) category indicator results are multiplied by specific factors
and added to form a total score. Some methods allow weighting across impact categories. Weighting
can be applied on normalized or non-normalized scores.

A Guide to Life Cycle Assessment of Buildings
186
8 REFERENCES
1. International, D.R., 2008 Buildings Energy Data Book. 2008, U.S. Department of Energy. 2. SAIC, Life Cycle Assessment: Principles & Practice. 2006, EPA. p. 88. 3. Elcock, D., Life-Cycle Thinking for the Oil & Gas Exploration & Production Industry. 2007, Argonne
National Laboratory. p. 160. 4. Arena, A.P. and C. de Rosa, Life cycle assessment of energy and environmental implications of
the implementation of conservation technologies in school buildings in Mendoza--Argentina. Building and Environment, 2003. 38(2): p. 359-368.
5. Trusty, W.B., J.K. Meil, and G.A. Norris, ATHENA: A LCA Decision Support Tool for the Building Community, ATHENA Sustainable Materials Institute: Canada.
6. Guinee, J.B., et al., Life Cycle Assessment - An Operational Guide to the ISO Standards. 2001. 7. Srinivas, H. Defining Life Cycle Assessment. Available from: http://www.gdrc.org/uem/lca/lca-
define.html. 8. CMU. Approaches to Life Cycle Assessment. Available from:
http://www.eiolca.net/Method/LCAapproaches.html. 9. McDonough, W. and M. Braungart, Cradle to Cradle - Remaking the Way We Make Things. 2002:
North Point Press. 10. Carlson, R. and A.-C. Palsson. LCA Web. 1998; Available from:
http://www.dantes.info/Images/LCA-web.gif. 11. Junnila, S., A. Horvath, and A.A. Guggemos, Life-Cycle Assessment of Office Buildings in Europe
and the United States. Journal of Infrastructure Systems, 2006. 12(1): p. 10-17. 12. Krogmann, U., et al., Life Cycle Assessment of New Jersey Meadowlands Commission's Center for
Environmental & Scientific Education. 2008, Rutgers Edward J. Bloustein School of Planning & Public Policy: New Jersey. p. 47.
13. UNEP, Evaluation of Environmental Impacts in Life Cycle Assessment. 2003. p. 108. 14. ACLCA. Life Cycle Assessment Definitions. Available from: http://www.lcacenter.org/LCA/LCA-
definitions.html. 15. Lippiatt, B., BEES 4.0 Technical Manual and User Guide. 2007, NIST. p. 327. 16. Marceau, M.L. and M.G. VanGeem, Comparison of the Life Cycle Assessments of a Concrete
Masonary House & a Wood Frame House. 2008, Portland Cement Institution. p. 59. 17. NREL. US Life-Cycle Inventory Database. Available from: http://www.nrel.gov/lci/. 18. Konrad Saur, G.D., Elisa Cobas Flores, Paolo Frankl, Allan Astrup Jensen, Evans and K.M.L. Kituyi,
Tom Swarr, Mohammed Tawfic, Arnold Tukker, Draft Final Report of the LCM Definition Study. 2003. p. 37.
19. Junnila, S., Life Cycle Management of Energy-Consuming Products in Companies Using IO-LCA. The International Journal of Life Cycle Assessment, 2008. 13(5): p. 8.
20. Cole, R.J. and E. Sterner, Reconciling theory and practice of life-cycle costing. Building Research & Information, 2000. 28: p. 368-375.
21. Life Cycle Cost Analysis of the New NJMC Building. 2008, Rutgers Edward J. Bloustein School of Planning & Public Policy: New Jersey. p. 34.

A Guide to Life Cycle Assessment of Buildings
187
22. Larry Strain, H.S., Nancy Malone, Jacqueline Lange, Emeryville Resourceful Building Residence. p. 46.
23. Huberman, N. and D. Pearlmutter, A Life-Cycle Energy Analysis of Building Materials in the Negev Desert. Energy and Buildings, 2008. 40(5): p. 837-848.
24. Garbesi, K. Carbon Accounting. Available from: http://www.rprogress.org/energyfootprint/carbon_accounting/.
25. Malin, N. (2008) Counting Carbon: Understanding Carbon Footprints of Buildings. Environmental Building News, 8.
26. Kellenberger, D. and H.-J. Althaus, Relevance of simplifications in LCA of building components. Building and Environment, 2009. 44(4): p. 818-825.
27. Babarenda Gamage, G., et al., Life Cycle Assessment of Commercial Furniture: A Case Study of Formway LIFE Chair. The International Journal of Life Cycle Assessment, 2008. 13(5): p. 401-411.
28. AIA, AIA Document D200 - 1995. 1995. 29. Morbitzer, C., et al., Integartion of Building Simulation into th Design Process of an Architecture
Practice, in IBPSA COnference. 2001: Rio de Janeiro, Brazil. p. 8. 30. Malin, N., Life Cycle Assessment for Whole Buildings: Seeking the Holy Grail in Building Design &
Construction. 2005. p. 6. 31. Fava, J.A., Can ISO Life Cycle Assessment Standards Provide Credibility for LCA?, in Building
Design & Construction. 2005. p. 4. 32. EPA. LCA 101. October 17, 2008; Available from:
http://www.epa.gov/nrmrl/lcaccess/lca101.html. 33. GEDNET. What is an environmental product declaration, EPD? ; Available from:
http://www.gednet.org/?page_id=13. 34. Skopek, J., LCA and the Green Globes Environmental Assessment and Rating System for
Commercial Structures. Building Design & Construction, 2005: p. 4. 35. Carey, J., House Passes Carbon Cap-and-Trade Bill, in Business Week. 2009. 36. Trusty, W., Integrating LCA into LEED - Working Group A Interim Report #1. 2006, USGBC. p. 11. 37. SBTC, International Green Building Code - Version 2 of the First Draft. 2009. 38. Codes, Standards and Rating Systems. 39. Lasvaux, S., B. Peuportier, and J. Chevalier, Modeling the Recycling Processes in the LCA of
Buildings, Centre Scientifique et Technique du Bâtiment. p. 8. 40. Gloria, T.P., B.C. Lippiatt, and J. Cooper, Life Cycle Impact Assessment Weights to Support
Environmentally Preferable Purchasing in the United States. Environmental Science & Technology, 2007. 41(21): p. 7551-7557.
41. EnergyStar. Step 2.3: Benchmark. Available from: http://www.energystar.gov/index.cfm?c=assess_performance.benchmark.
42. ATHENA. The Impact Estimator for Buildings. April 20, 2009; Available from: http://www.athenasmi.org/tools/impactEstimator/.
43. ATHENA, Athena Impact Estimator for Buildings V3.0.3 Software & Database Overview. 2008, ATHENA Sustainable Materials Institute.
44. EERE. Building Energy Software Tools Directory. August 13, 2008; Available from: http://apps1.eere.energy.gov/buildings/tools_directory/subjects.cfm/pagename=subjects/pagename_menu=whole_building_analysis/pagename_submenu=sustainability.
45. ATHENA. EcoCalculator Overview. April 20, 2009; Available from: http://www.athenasmi.org/tools/ecoCalculator/index.html.
46. CMU. EIO-LCA: Free, Fast, Easy Life Cycle Assessment. Available from: http://www.eiolca.net/index.html.

A Guide to Life Cycle Assessment of Buildings
188
47. RMIT. Building LCA & Associated Tool Matrix. Greening the Building Life Cycle; Available from: http://buildlca.rmit.edu.au/menu8.html.
48. J. Bare, T.G., Life Cycle Impact Assessment for the Building Design & Construction Industry, in Building Design & Construction. 2005. p. 3.
49. RMIT, Building LCA Tools Description, in Greening the Building Life Cycle, Environmenta Australia.
50. IVAM. Environmental Performance of Buildings. Available from: http://www.ivam.uva.nl/index.php?id=59&L=1&L=1.
51. BRE. Envest 2. Available from: http://envestv2.bre.co.uk/account.jsp. 52. PE and International. The New Generation GaBi 4 Available from: http://www.pe-europe.com/. 53. HBN. About Pharos. Available from: http://www.pharosproject.net/about/index/. 54. ecoScorecard, ecoScorecard the Software. 55. Seongwon Seo, S.T., Peter Newton, Automated Material Selection and Environmental
Assessment in the Context of 3D Building Modelling. Journal Of Green Building, 2007. 2(2): p. 11. 56. Rutgers. NJMC Observatory & Classroom Building Life Cycle Analysis. Available from:
http://www.greenbuildingrutgers.us/projects.asp?Level2ItemID=55. 57. Dyszkiewicz, T. Sustainability in Action: A New Jersey-Based Environmental Center Practices
What It Preaches. 2008; Available from: http://www.metalarchitecture.com/Default.aspx?PublicationID=3&ArticleID=837&Title=Sustainability+in+action percent3A+A+New+Jersey-based+environmental+center+practices+what+it+preaches.
58. FSC. Forest Stewardship Council. Available from: http://www.fsc.org/. 59. Hes, D. The Olympic stadium analysed using the DPWS tool. Greening the Building Life Cycle;
Available from: http://buildlca.rmit.edu.au/CaseStud/Stadium/Stadium.html. 60. A. Myer, C.C., Life-Cycle Analysis for Design of the Sydney Olympic Stadium. Renewable Energy,
1997. 10(2/3): p. 4. 61. NAHB, Advanced Framing Techniques, NAHB Research Center. 62. Citherlet, S. and T. Defaux, Energy & Environmental Comparison of Three Variants of a Family
House During its Whole Life Span. Building and Environment, 2007. 42(2): p. 591-598. 63. Kofoworola, O. and S. Gheewala, Environmental Life Cycle Assessment of a Commercial Office
Building in Thailand. The International Journal of Life Cycle Assessment, 2008. 13(6): p. 498-511. 64. Duffy, A., Land Use Planning in Ireland—A Life Cycle Energy Analysis of Recent Residential
Development in the Greater Dublin Area. The International Journal of Life Cycle Assessment, 2009. 14(3): p. 268-277.
65. Techato, K.-a., D.J. Watts, and S. Chaiprapat, Life cycle analysis of retrofitting with high energy efficiency air-conditioner and fluorescent lamp in existing buildings. Energy Policy, 2009. 37(1): p. 318-325.
66. ATHENA, A Life Cycle Assessment Study of Embodied Effects for Existing Historic Buildings. 2009, Athena Sustainable Materials Institute: Ontario. p. 33.
67. Gamble, M. and L.A. Gamble, Big Nerd Ranch Project Information, S. Joshi, Editor. 2009. 68. Lippiatt, B. C. BEES 1.0: Building for Environmental and Economic Sustainability Technical
Manual and User Guide. NISTIR 6144; 93 p. April 1998. 69. Van Geem, M.G. and Nisbet, M. "The Portland Cement Association's Environmental Life Cycle
Assessment of Concrete," PCA R&D Serial No. 2186, 1998. 70. Reiner, M., and Rens, K.,” High-Volume Fly Ash Concrete: Analysis and Application,” Practice
Periodical on Structural Design and Construction, V.11, No.1, Feb 2006, pp. 58-64.

A Guide to Life Cycle Assessment of Buildings
189
71. US EPA National Environmental Performance Track, "Guidance for Normalizing Environmental Performance Results." 2004; Available from: http://www.p2pays.org/esi/2008Documents/EPANormalization.pdf.

A Guide to Life Cycle Assessment of Buildings
190
APPENDIX A
Big Nerd Ranch – Building ‘A’ Ground Floor Plan

A Guide to Life Cycle Assessment of Buildings
191
Big Nerd Ranch – Building ‘A’ First Floor Plan

A Guide to Life Cycle Assessment of Buildings
192
Inventory Analysis Results

A Guide to Life Cycle Assessment of Buildings
193