Embed Size (px)
Citation preview
Aid with Multiple Personalities
Simeon Djankov
The World Bank and CEPR
Jose G. Montalvo
Universitat Pompeu Fabra and IVIE
Marta Reynal-Querol*
Universitat Pompeu Fabra, CEPR and CESifo
December 2006 ____________________________________ * Corresponding author: Marta Reynal-Querol, Universitat Pompeu Fabra, C/ Ramon Trias Fargas 25-27, Barcelona 08005, Spain. Office phone number: (34) 93 542 2509. Fax: (34) 93 542 1746. Email: [email protected]. We thank Caroline Freund, Stephen Knack and Dani Rodrik for their comments.
Abstract The existing research on foreign aid offers inconclusive evidence on the factors
that make aid effective. In this paper, we test the hypothesis that the success of foreign
aid depends on the fagmentation of donors. We study the supply of aid money in 112
developing countries over the period 1960-1999 and find that the presence of multiple
donors in a given country renders aid ineffective. This is in part because donor
fragmentation increases corruption in the recipient country’s government. In particular, if
a country receiving the average amount of oda (3% of GDP) goes from a single donor to
the sample mean of donor fragmentation, corruption increases by 7% to 10%.
JEL: O19, F35, F34, P11.
2
Introduction
After the tsunami disaster in 2004, donors directed $14 billion to the areas that suffered
the greatest damage. Aid came from over 1,000 governments and non-governmental
organizations. If the market for aid were like any other market, this competition among
donors may have resulted in faster delivery of humanitarian aid and subsequent
reconstruction efforts. But the market for aid is not like other markets: many new
organizations enter every year, but no significant organization has even exited.1
Regardless of how inefficient donors can be, they stay in the aid business. This often
results in over-whelmed government officials, who spent all their time meeting donor
delegations; and ample possibilities for corruption.
Two examples. In 2001, Tanzania had to produce more than 2,400 reports to
donors and government officials met with over 1,000 donor delegations.2 Second, in the
aftermath of the tsunami disaster a local doctor in Banda Aceh, one of the most affected
areas, wrote: “In February, in Riga (close to Calang) we had a case of measles, a little
girl. Immediately, all epidemiologists of Banda Aceh came in, because they were afraid
of a propagation of measles among displaced people, but the little girl recovered very
fast. Then, we realized that this was not a normal case of measles and we discovered that
this girl has received the same vaccine three times, from three different organizations.
The measles symptoms were a result of the three vaccines she received.”3
The research on foreign aid offers inconclusive evidence on the factors that make
aid effective. Most studies focus on the characteristics of recipient countries, and in
particular on the presence of good policies and institutions. Burnside and Dollar (2000)
1 Klein and Harford (2005). See chapter 2: A century of entry but no exit. 2 Easterly (2003), p.20.
3
find that aid works in “good policy environments,” using proxies for sound fiscal,
monetary and trade policy. These results imply that increasing the conditionality of aid on
policies would improve its effectiveness. Related studies have corroborated this finding:
the interaction of aid and good policies is robust to the inclusion of additional explanatory
variables, such as commodity export price shocks in Collier and Dehn (2001), or the
usage of alternative proxies for good policies (Collier and Dollar, 2002).
However, Easterly, Levine and Roodman (2003) find that the results of Burnside
and Dollar (2000) collapse when changing the sample period (by extending the sample to
1997) or filling in missing observations in the period 1970-93. The results in Przeworski
and Vreeland (2000) and Barro and Lee (2005) cast further doubts. Both studies analyze
the effectiveness of IMF aid and conclude that loans reduce economic growth and
investment in the recipient countries. More recently, Rajan and Subramanian (2005) find
no evidence of the relationship between aid and economic growth even after correcting
for the fact that aid goes typically to countries with poor economic performance.
Another strand of the literature has argued that the effectiveness of foreign aid
depends on the way in which aid is disbursed. Cordella and Dell’Ariccia (2003) show
that the relationship between aid, policies and growth depends on whether the aid is
delivered in budget support or project financing. They find no effect of aid by itself or
when interacted with good policies. But when the interaction of aid and policy is broken
into two variables (budget support by policies and project aid by policies), Cordella and
Dell’Ariccia find positive and statistically significant results in the former. Djankov,
Montalvo and Reynal-Querol (2006) show that foreign aid has a negative impact on the
democratic stance of developing countries, and on economic growth by reducing
3 El Pais, April 13, 2005, p. A2.
4
investment and increasing government consumption. But receiving grants (free money) is
negatively associated with future growth, while receiving loans has an insignificant effect
of economic development.
A third hypothesis, little explored in previous literature, is that the effectiveness of
foreign aid depends on the fragmentation of donors. This is the topic of our study. In
particular, we document the supply of aid money in developing countries and find that
the presence of multiple donors in a given country renders aid ineffective. This is
consistent with Knack and Rahman (2004) who find that aid undermines the quality of
government in recipient countries with multiple donors. We provide some evidence that
this is due to increased corruption in the recipient country’s government.
Using data on 112 recipient countries for the period 1960-1999, we distinguish
among 37 donors, among which 15 are multilateral and 22 are bilateral agencies, and
construct a donor fragmentation index in each recipient country. We show that donor
fragmentation has increased dramatically since the 1970s. Consistent with Easterly et al
(2003), we do not find a positive effect of aid on growth, nor do we find a positive effect
of aid in good policy environments. Instead, we find that, for a country receiving the
average amount of oda in the sample (3% of GDP), going from a single donor to the
average donor fragmentation, which is 0.67, is associated with a 2.01% reduction in
economic growth over a 5-year period. We then test the hypothesis that this result is
driven by the effect of multiple donors of increased corruption and find that for a country
receiving the average amount of oda going from a single donor to the mean of donor
fragmentation is associated with a 7% to 10% increase in corruption.
5
Section 2 describes the data sources. Section 3 provides the basic estimation
results. Section 4 presents alternative interpretations: showing that donor fragmentation is
not associated with better social outcomes (negating the hypothesis that donor
fragmentation is bad for growth but good for increasing the focus on improved health and
education in developing countries); but is associated with increased corruption. Section 5
concludes.
2. Data
The literature that analyzes the effect of aid on development has traditionally used the
Official Development Assistance (oda) measure. This is the measure used in this paper
too. Oda captures the flows of money that arrives in the recipient country in a particular
year minus what the country pays back. Oda includes grants and concessional loans,
whose grant element is at least 25%.
Data on oda are in current US dollars and come from the Development Assistance
Committee (DAC) of the OECD. We use the IMF's unit value import index to transform
the data in constant dollars and at purchasing power parity. The unit value import index is
the ratio between the unit values of imports and import prices. To obtain aid data in
constant dollars, we multiply the original data by the unit value import index for 1985
and then divide by the unit value import index of the current year. Finally, we divide the
aid value by real GDP in constant 1985 prices from the Penn World Tables 5.6.
6
Following the OECD, we distinguish 37 donors, among which 15 are multilateral
and 22 are bilateral agencies (Table 1).4 In 1960-64, the United States is by far the largest
donor, with nearly two-thirds of official development assistance (64.1%). France is
second with 9.8% and the United Kingdom third with 8%. By 1995-99, Japan is the
largest bilateral donor, with 22.8%, followed by the International Development
Association (IDA) with 12.3% and the United States with 10.5%.
Using these data, we measure the degree of competition among donors by
constructing a donor fragmentation index. The index has two counterparts in other
economics fields. First, the Herfindahl-Hirschman index is used in the industrial
organization literature to measure the degree of market power in oligopolistic markets
(for example, Borenstein and Rose (1984)). An index of fragmentation is also used in the
literature studying the effects of ethnic diversity (for example, Montalvo and Reynal-
Querol (2005a, b)).
The index of donor fragmentation has the following form,
∑=
−=N
iiFRAG
1
21 π
where πi is the proportion of aid given by donor i with respect to all aid the country
received. That is, is the relative size of donor i. It measures the probability that if we
take two dollars of foreign aid each dollar would come from a different donor.
iπ
4 Data for five donors is incomplete and not included here: the Council of Europe, the Nordic Development Fund, the International Fund for Agricultural Development, the Caribbean Development Bank, and the European Bank for Reconstruction and Development.
7
Figure 1 shows the evolution of the average annual donor fragmentation over
time. From this figure it is clear that donor fragmentation has increased. This started with
the establishment of the International Development Association, established in 1960,
Japan’s Overseas Economic Cooperation Fund (1961), and the Asian Development Bank
in 1966.5 The late 1980s and early 1990s saw the establishment of the Multilateral
Investment Guarantee Agency, the European Bank for Reconstruction and Development,
France’s Pomarco and Denmark’s Investment Fund for Central and Eastern Europe.
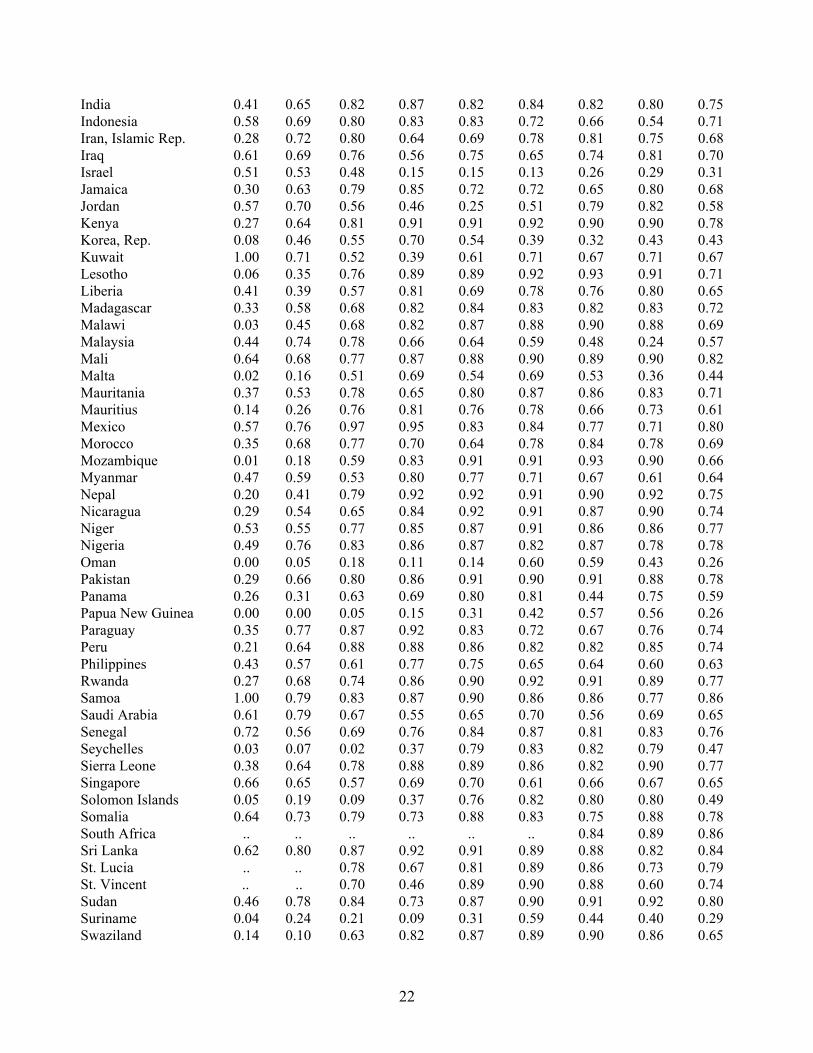
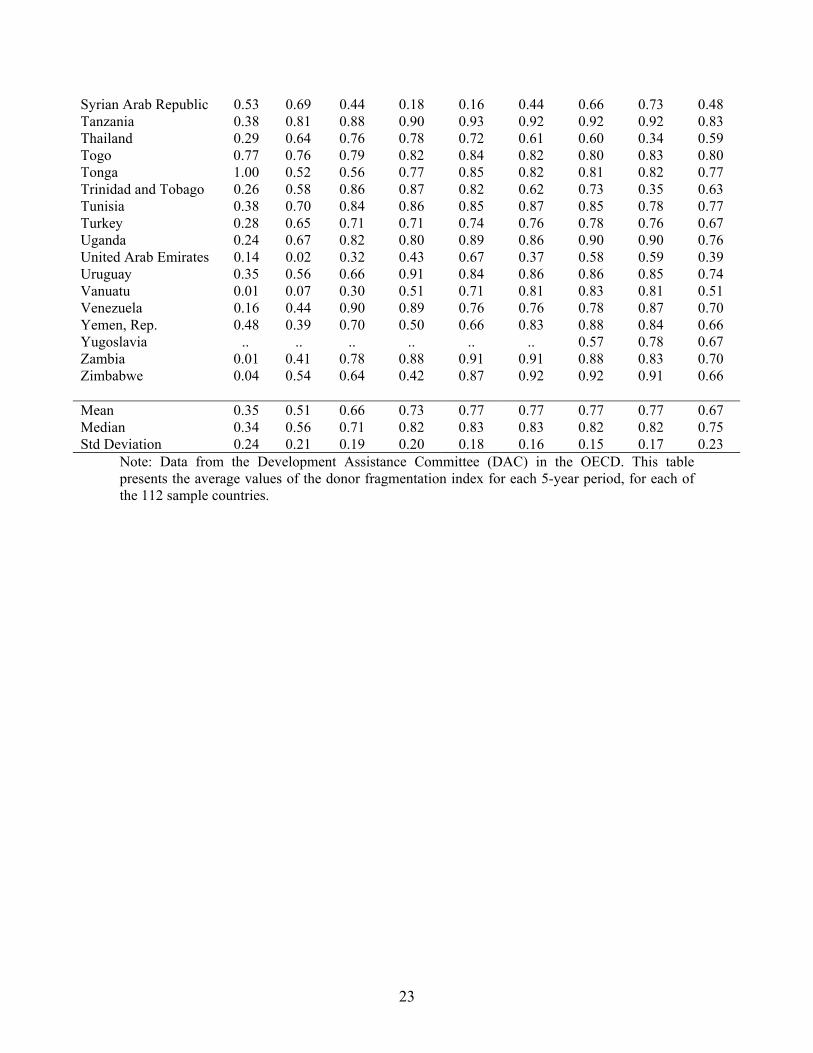
Table 2 lists all 112 sample countries, with their index of donor fragmentation in
each time period. Not all recipient countries have fragmented donors. For some recipient
countries and periods, there is only one donor: for example in Cape Verde in 1960-64
(Portugal) and 1965-69 (Germany), Oman in 1960-1964 (the UK) and Papua New
Guinea in 1960-69 (Australia). Some Middle Eastern countries – Bahrain, Oman, Syria
and the United Arab Emirates – have few donors throughout the sample period. Many
African countries – for example Botswana, the Gambia, Guinea-Bissau, Malawi,
Mozambique and Zambia – start with one or two donors in 1960-64 and have nearly
every donor present by 1999.
In the analysis of the effect of donor fragmentation on growth, we use the
standard set of controls. The set includes the ratio of real government consumption to real
GDP (gov), the absolute deviation of the PPP value of the investment deflator from the
sample mean (ppdev), the ratio of real domestic investment to GDP (inv), secondary-
school enrollment rate (sec) and primary-school enrollment (pri). Civil war is the
incidence of civil war, we include three regional dummies for Sub-Saharan Africa, Latin
5 Data on these institutions can be found at http://www.worldbank.org/ida, http://www.oecf.go.jp, and http://www.adb.org.
8
America, and East Asia. The sources and definitions of all variables used in the analysis
are described in Table 3.
Having many donors, and higher donor fragmentation, does not lead to receiving
more foreign aid (Table 4). In particular, the correlation between donfrag and oda is -
0.05. Donor fragmentation is high in sub-Saharan Africa (correlation coefficient is 0.29),
in countries with corrupt governments (correlation coefficients of 0.16, 0.31 and 0.34,
respectively), and in countries with high level of government consumption (coefficient is
0.18) and countries in civil war (0.16). In contrast, donor fragmentation is lowest in East
Asia (-0.51) and in middle-income countries (correlation with logGDP is -0.28).
3. Estimation
Our hypothesis is that the burden imposed by multiple donors is an important determinant
of the effectiveness of foreign aid. Acharya et al. (2006) argues that the “immediate
consequence of the proliferation of donor organizations is a very large increase in the
transactions costs incurred by agencies of recipient governments in their engagements
with aid donors. The more donors there are, the easier it is to assume or assert that the
lack of development progress is someone else’s fault; and the greater are the temptations
for individual donor agencies to focus efforts on obtaining good results from their own
projects, even if this impinges adversely on overall aid performance.” Morss (1984)
argues that, “…donor and project build-up, which continues into the 1980s, is having a
negative impact on the major government institutions of developing nations. Instead of
working to establish comprehensive and consistent development objectives and policies,
9
government officials are forced to focus on pleasing donors by approving projects that
mirror the current development enthusiasm of each donor.”
For all the empirical analysis we consider a sample of 112 recipient countries and
data from 1960 to 1999 organized in five-year intervals:
itititititit aidcwsXyGROWTH µββββ ++++= 4321 ' (1)
where GROWTH is the growth rate of GDP per capita; is the log of gross domestic
product per capita in the initial year of each sub-period; and the vector X has the usual
controls in growth regressions.
ity
As aid generally flows to countries whose growth rate is getting worse, we may
need an instrument for foreign aid. We follow Burnside and Dollar (2000) and Easterly et
al. (2003) and use the logarithm of initial income, the logarithm of population and a
group of variables that captures donors’ “strategic interests” – proxied by dummy
variables for sub-Saharan Africa, the Franc Zone, Egypt, and Central American countries.
Therefore the equation for aid is the following:
itziitpityit zpyaid ζγφγ +++= −− '11 (2)
where the excluded instruments are initial income in the previous period (y), the
logarithm of population in the previous period (p) and the group of variables that capture
donors’ “strategic interests” (z).
3a. Replicating previous results
We start by replicating the results of earlier studies on foreign aid, using the standard
Barro (1991) specification. The F test for excluded instruments is large (F= 19.49), which
suggesting that the instruments are good. The Durbin test, however, cannot reject the
10

hypothesis that foreign aid is exogenous and, therefore, OLS estimation is recommended.
This result is similar to the findings in Burnside and Dollar (2000) who tested and could
not reject that foreign aid was exogenous in their set up. Finally, Sargan’s test of over-
identification shows that the chosen instruments are appropriate.
Table 5 presents the results of the OLS estimation. Note that it is quite likely that
there is intra-group correlation. Under this circumstance, OLS estimators are still
consistent but the usual standard deviation will not be consistent. For this reason, we
present the z-statistics obtained using a cluster-robust standard deviation. Column 1
shows that foreign aid has a negative and statistically significant effect on economic
growth. In particular, an increase in oda from zero to the sample mean (3% of GDP)
results in 1.8% reduction in economic growth during a 5-year period.6
In column 2, we analyze whether the same result applies to the sub-sample of
poor countries. Burnside and Dollar (2000) define low-income countries as the countries
that have a GDP per capita lower than $1,900. As before, the Durbin test cannot reject the
hypothesis that foreign aid is exogenous for the sub-sample of low-income countries, and
therefore OLS estimation is recommended. Results again indicate that foreign aid has a
negative and significant effect on economic growth.7 This is consistent with the findings
in Easterly et al (2003), Rajan and Subramanian (2005) and Djankov, Montalvo and
Reynal-Querol (2006).
A second hypothesis, as in Burnside and Dollar (2000), is that the effectiveness of
aid depends on prevalent policies and institutions in the recipient country. We take as a
6 We run the same regressions using an alternative set of instruments. Instead of including variables that capture donors’ “strategic interests”, we use a dummy variable that indicates whether the recipient country was a colony or not (using data from La Porta et al, 1999). The results are robust to this change. 7 The same result obtains if instead the World Bank classification of poor countries (below $1,350) is used.
11
measure of institutional quality, the Law and Order, from the International Country Risk
Guide. The law-and-order variable ranges from 1 to 6. We turn it into a discrete variable,
equal to 1 if the value is 3 or higher; 0 otherwise. In the specification we include oda, the
interaction term of oda and law-and-order, and law-and-order. The results, shown in
columns 3 and 4, indicate that aid has a negative and significant effect on economic
growth independently of the institutional development of the country. This is consistent
with Easterly et al (2003).
In sum, we are able to replicate the main results from the previous empirical
literature on aid effectiveness.
3b. Donor fragmentation and aid effectiveness
It has been argued that donors may follow political and strategic interests in directing aid.
Alesina and Dollar (2000), for example, find that colonial past and political alliances are
major determinants of foreign aid. Dollar and Levin (2004) examine the allocation of
foreign aid by 41 bilateral and multilateral agencies. They find that some of the largest
donors, for example France and the United States, do not direct aid to countries with
good policies.
In this section we analyze the effect of donor fragmentation on the effectiveness
of foreign aid. We argue that it is not only the identity of donors but their number in any
recipient country that matter for aid effectiveness. When many donors are involved, aid
may have no effect, or in some cases even a negative one. The former may be the result
of increased coordination problems between the government and various donors. The
12
latter can take place when the presence of multiple donors increases corruption in
government.
Donfrag is a continuous variable that ranges between 0 and 1. For the purpose of
interpreting the interaction term, we also construct a dummy variable, d_donfrag, which
equals 1 if donor fragmentation is larger than or equal to 0.75 (the sample’s median), and
zero otherwise. The results are shown in table 6. Column 1 indicates that in countries
with a low degree of donor fragmentation, aid has no effect on economic growth.
However, if the recipient country has a high degree of donor fragmentation aid has a
negative effect on economic growth.
In order to show the robustness of this result, we analyze the effect of aid in a
sample of countries with high donor fragmentation and in a sample of countries with low
donor fragmentation. The results are shown in columns 2 and 3. We observe that for the
sample of countries with high donor fragmentation, aid has a significant negative effect
on economic growth. However, for countries with a low degree of donor fragmentation,
aid has no effect.
4. Interpretation
4.1 Better social outcomes
So far we have investigated the effect of foreign aid on economic growth. It could be,
however, that the multiplicity of donors in a given country is a proxy for a broader focus:
that some donors focus on growth and other donors focus on health, education, gender
issues, the environment. If so, the results in the previous section are simply a
misinterpretation of the goals of some aid organizations. To test this, we consider two
13
indicators - secondary education attainment and infant mortality - that capture some of
the alternative interpretations.
First, we analyze the effect of foreign aid on changes in secondary education
attainment. This variable captures the change in the percentage of secondary school
attained in the total population. We consider several explanatory variables besides foreign
aid: the initial level of secondary education, the level of GDP at the beginning of the
period, and shocks to terms of trade.
As aid may flow to countries whose education is getting worse, we need an
instrument for foreign aid. We follow the specification in section 3. We present the
results using IV estimation. The F-test for excluded instruments is large and above the
usual thresholds, which implies that the instruments are not weak. Moreover, the Durbin
test rejects the hypothesis that foreign aid is exogenous and, therefore, IV estimation is
recommended.
In column 1 of table 7 we summarize the results (the bottom part of the table
shows the first step of the estimation). Results indicate that aid has a negative impact on
the change of secondary education attainment. Following the previous analysis, in
column 2 and 3, we separate the sample between the countries with donor fragmentation
above the median (column 2), and the sample of countries with donor fragmentation
below the median (column 3). The results indicate that aid affects negatively the change
in secondary education attainment when recipient countries face multiple donors.
In columns 4, 5 and 6, we analyze the effect of foreign aid on infant mortality.
Again, we include several explanatory variables besides foreign aid: the initial level of
infant mortality, the level of GDP at the beginning of the period, and shocks to terms of
14
trade. Here, oda has a negative impact on infant mortality, independent of donor
fragmentation.
In sum, the hypothesis that donor fragmentation may proxy for expanded focus on
social outcomes is not borne out in the data.
4.2 Increased corruption
Competition may not be beneficial in the market of aid, because it could generate
corruption in the government. This could happen by various donors working with
different layers of the government, sometimes with little oversight of how the money is
spent. Reinikka and Svensson (2004), for example, show that in Uganda only 16 cents of
every aid dollar directed to primary school education reached its intended target. The rest
disappeared on the way. Olken (2005) shows that 28% of the aid money in community-
development infrastructure projects in Indonesia is lost due to corruption.
To test this hypothesis, we use 3 existing indices on corruption in government
(described in Table 3) and regress corruption on aid, donor fragmentation, and several
control variables. Since corruption indicators have been constructed only recently, we use
a cross-section analysis (Table 8). Aid has no effect on corruption. However, aid in
countries with high donor fragmentation is associated with a higher degree of corruption.
In particular, if a country receiving the average amount of oda (3% of GDP) goes from a
single donor to the sample mean of donor fragmentation, corruption increases by 7% to
10%. Table 8 does not show a causal direction. But it is difficult to come up with a reason
for donors giving money to more corrupt governments, which would be the implication if
reverse causality were present.
15
5. Conclusions
Aid is generally not associated with better economic outcomes. But the effectiveness of
aid is further reduced when donor fragmentation is high. This is in part because donor
fragmentation seems to increase corruption in the recipient country’s government.
This finding has two implications. First, the recent focus on reducing corruption
in donors’ programs may have a larger-than-expected benefit in increasing the impact of
aid. Second, winding down some aid agencies may improve the market for development
assistance. Previous literature (Przeworski and Vreeland, 2000; Barro and Lee, 2005)
points to the International Monetary Fund as associated with particularly negative
development outcomes. This may be the place to start.
16
References Acharya, Arnab, Ana Teresa Fuzzo de Lima, and Mick Moore, 2006. “Aid proliferation:
how responsible are the donors,” Journal of Development Studies, 42, 1: 1-21. Alesina, Alberto, and David Dollar, 2000. “Who Gives Foreign Aid to Whom and Why?”
Journal of Economic Growth, 5: 33-63. Barro, Robert, 1991. “Economic Growth in a Cross Section of Countries,” Quarterly
Journal of Economics, CVI, 407-43. Barro, Robert, and Jong-Wha Lee, 2005. “IMF programs: who is chosen and what are the
effects?”, Journal of Monetary Economics, 52, 7: 1245-69. Borenstein, Severin, and Nancy Rose, 1994. “Competition and Price Discrimination in
Competitive Markets”, Journal of Political Economy 102, 4: 653-683. Burnside Craig, and David Dollar, 2000. “Aid, Policies and Growth”. American
Economic Review, 90, 4: 847-88. Collier, Paul and Jan Dehn., 2001. “Aid, shocks and growth,” The World Bank, Policy
Research Working Paper 2688, Washington DC. Collier, Paul, and David Dollar, 2002. “Aid Allocation and poverty reduction.” European
Economic Review, 46, 8: 1475-1500. Cordella, Tito and Giovanni Dell'Ariccia, 2003. “Budget support versus project aid,”
International Monetary Fund, Working paper 88/03, Washington DC. Djankov, Simeon, Jose Montalvo and Marta Reynal-Querol, 2006, “Does Foreign Aid
Help?,” Cato Journal, 26, 1:1-28. Dollar, David, and Victoria Levin, 2004. “The Increasing Selectivity of Foreign Aid,
1984-2002”. The World Bank, mimeo. Easterly, William, 2003. “The Cartel of Good Intentions: The Problem of Bureaucracy in
Foreign Aid,” Journal of Policy Reform, 7: 1-28. Easterly William, Ross Levine and Roodman Daniel, 2003. “New Data, New Doubts: A
Comment on Burnside and Dollar’s “Aid, Policies, and Growth”. American Economic Review.
El Pais, 2005. “Demasioado Dinero en Banda Aceh,” April 13, p. A2. Klein, Michael and Tim Harford, 2005. The Market for Aid, The International Finance
Corporation, Washington DC. Knack, Stephen, and Aminur Rahman, 2004. “Donor fragmentation and bureaucracy in
aid recipients,” Policy Research Working Paper 3286, World Bank, Washington DC.
La Porta, Rafael, Florencio Lopez de Silanes, Andrei Shleifer and Robert Vishny, 1999. “The Quality of Government.” Journal of Law, Economics and Organization, 15, 1: 222-279.
Montalvo, Jose, and Marta Reynal-Querol, 2005a. “Ethnic Polarization, Potential Conflict, and Civil Wars.” American Economic Review, 95 (3), 796-816.
Montalvo, Jose, and Marta Reynal-Querol, 2005b. “Ethnic Diversity and Economic Development.” Journal of Development Economics, 76, 4: 293-323.
Morss, E. R, 1984. “Institutional Destruction Resulting from Donor and Project Proliferation in Sub-Saharan African Countries.” World Development 12 (4): 465–70.
17
Olken, Ben, 2005. “Monitoring Corruption: Evidence from a Field Experiment in Indonesia”, National Bureau for Economic Research, Working Paper #11753, Cambridge, MA.
Przeworski, A., and Vreeland, J. R., 2000. “The Effect of IMF Programs on Economic Growth.” Journal of Development Economics 62: 385–421.
Rajan, Raghuram and Arvind Subramanian, 2005. “Aid and growth: what does the cross country evidence really show?,” International Monetary Fund, mimeo.
Reinikka, Ritva, and Jacob Svensson, 2004. “Local capture: evidence from a government transfer program in Uganda.” Quarterly Journal of Economics 119, 12: 679-705.
18
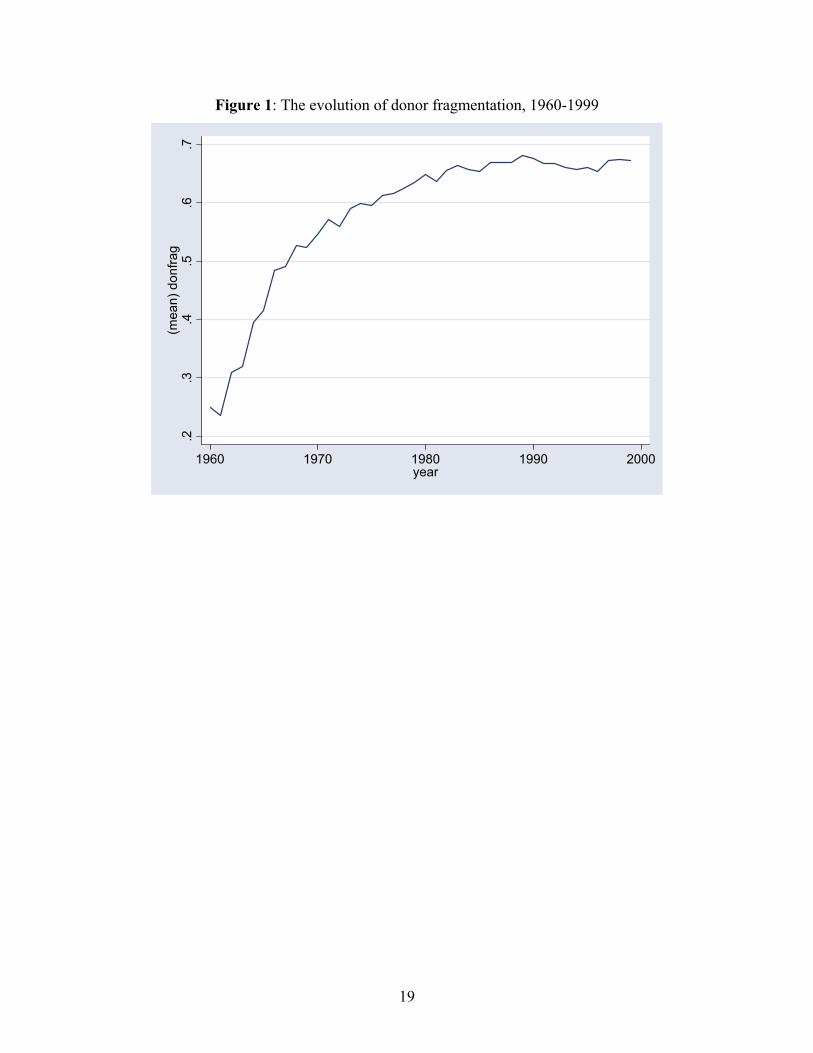
Figure 1: The evolution of donor fragmentation, 1960-1999
.2.3
.4.5
.6.7
(mea
n) d
onfra
g
1960 1970 1980 1990 2000year
19
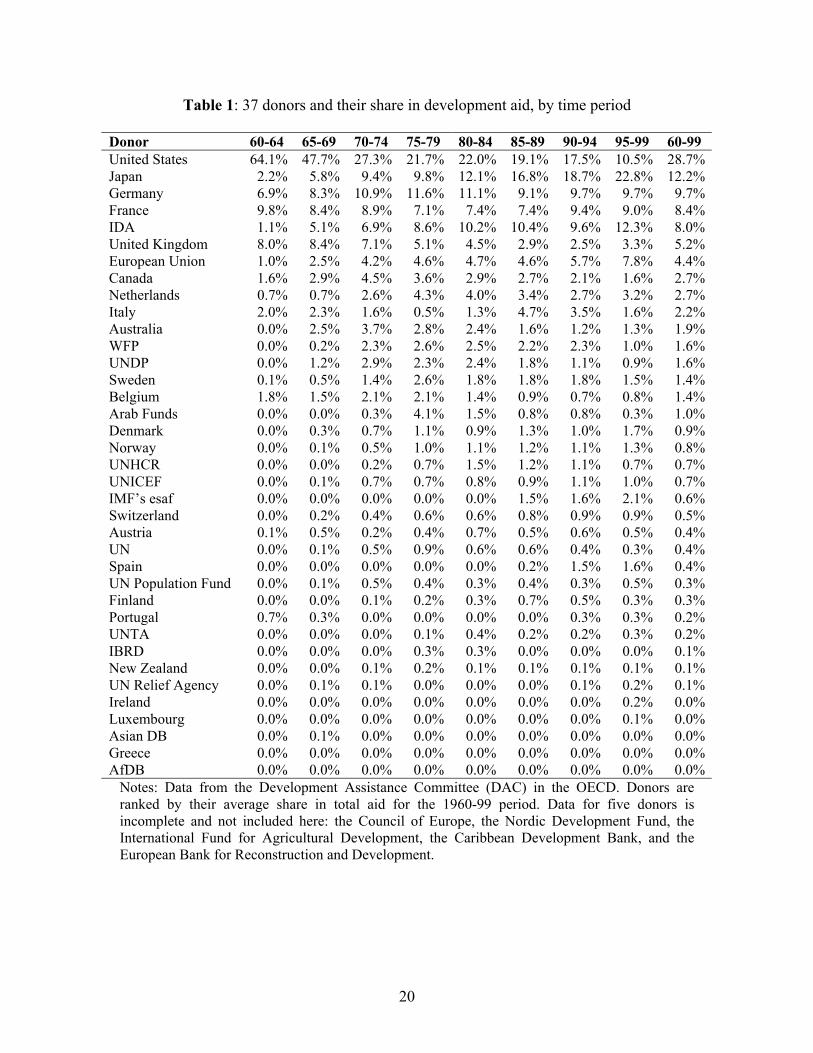
Table 1: 37 donors and their share in development aid, by time period
Donor 60-64 65-69 70-74 75-79 80-84 85-89 90-94 95-99 60-99 United States 64.1% 47.7% 27.3% 21.7% 22.0% 19.1% 17.5% 10.5% 28.7%Japan 2.2% 5.8% 9.4% 9.8% 12.1% 16.8% 18.7% 22.8% 12.2%Germany 6.9% 8.3% 10.9% 11.6% 11.1% 9.1% 9.7% 9.7% 9.7%France 9.8% 8.4% 8.9% 7.1% 7.4% 7.4% 9.4% 9.0% 8.4%IDA 1.1% 5.1% 6.9% 8.6% 10.2% 10.4% 9.6% 12.3% 8.0%United Kingdom 8.0% 8.4% 7.1% 5.1% 4.5% 2.9% 2.5% 3.3% 5.2%European Union 1.0% 2.5% 4.2% 4.6% 4.7% 4.6% 5.7% 7.8% 4.4%Canada 1.6% 2.9% 4.5% 3.6% 2.9% 2.7% 2.1% 1.6% 2.7%Netherlands 0.7% 0.7% 2.6% 4.3% 4.0% 3.4% 2.7% 3.2% 2.7%Italy 2.0% 2.3% 1.6% 0.5% 1.3% 4.7% 3.5% 1.6% 2.2%Australia 0.0% 2.5% 3.7% 2.8% 2.4% 1.6% 1.2% 1.3% 1.9%WFP 0.0% 0.2% 2.3% 2.6% 2.5% 2.2% 2.3% 1.0% 1.6%UNDP 0.0% 1.2% 2.9% 2.3% 2.4% 1.8% 1.1% 0.9% 1.6%Sweden 0.1% 0.5% 1.4% 2.6% 1.8% 1.8% 1.8% 1.5% 1.4%Belgium 1.8% 1.5% 2.1% 2.1% 1.4% 0.9% 0.7% 0.8% 1.4%Arab Funds 0.0% 0.0% 0.3% 4.1% 1.5% 0.8% 0.8% 0.3% 1.0%Denmark 0.0% 0.3% 0.7% 1.1% 0.9% 1.3% 1.0% 1.7% 0.9%Norway 0.0% 0.1% 0.5% 1.0% 1.1% 1.2% 1.1% 1.3% 0.8%UNHCR 0.0% 0.0% 0.2% 0.7% 1.5% 1.2% 1.1% 0.7% 0.7%UNICEF 0.0% 0.1% 0.7% 0.7% 0.8% 0.9% 1.1% 1.0% 0.7%IMF’s esaf 0.0% 0.0% 0.0% 0.0% 0.0% 1.5% 1.6% 2.1% 0.6%Switzerland 0.0% 0.2% 0.4% 0.6% 0.6% 0.8% 0.9% 0.9% 0.5%Austria 0.1% 0.5% 0.2% 0.4% 0.7% 0.5% 0.6% 0.5% 0.4%UN 0.0% 0.1% 0.5% 0.9% 0.6% 0.6% 0.4% 0.3% 0.4%Spain 0.0% 0.0% 0.0% 0.0% 0.0% 0.2% 1.5% 1.6% 0.4%UN Population Fund 0.0% 0.1% 0.5% 0.4% 0.3% 0.4% 0.3% 0.5% 0.3%Finland 0.0% 0.0% 0.1% 0.2% 0.3% 0.7% 0.5% 0.3% 0.3%Portugal 0.7% 0.3% 0.0% 0.0% 0.0% 0.0% 0.3% 0.3% 0.2%UNTA 0.0% 0.0% 0.0% 0.1% 0.4% 0.2% 0.2% 0.3% 0.2%IBRD 0.0% 0.0% 0.0% 0.3% 0.3% 0.0% 0.0% 0.0% 0.1%New Zealand 0.0% 0.0% 0.1% 0.2% 0.1% 0.1% 0.1% 0.1% 0.1%UN Relief Agency 0.0% 0.1% 0.1% 0.0% 0.0% 0.0% 0.1% 0.2% 0.1%Ireland 0.0% 0.0% 0.0% 0.0% 0.0% 0.0% 0.0% 0.2% 0.0%Luxembourg 0.0% 0.0% 0.0% 0.0% 0.0% 0.0% 0.0% 0.1% 0.0%Asian DB 0.0% 0.1% 0.0% 0.0% 0.0% 0.0% 0.0% 0.0% 0.0%Greece 0.0% 0.0% 0.0% 0.0% 0.0% 0.0% 0.0% 0.0% 0.0%AfDB 0.0% 0.0% 0.0% 0.0% 0.0% 0.0% 0.0% 0.0% 0.0%
Notes: Data from the Development Assistance Committee (DAC) in the OECD. Donors are ranked by their average share in total aid for the 1960-99 period. Data for five donors is incomplete and not included here: the Council of Europe, the Nordic Development Fund, the International Fund for Agricultural Development, the Caribbean Development Bank, and the European Bank for Reconstruction and Development.
20
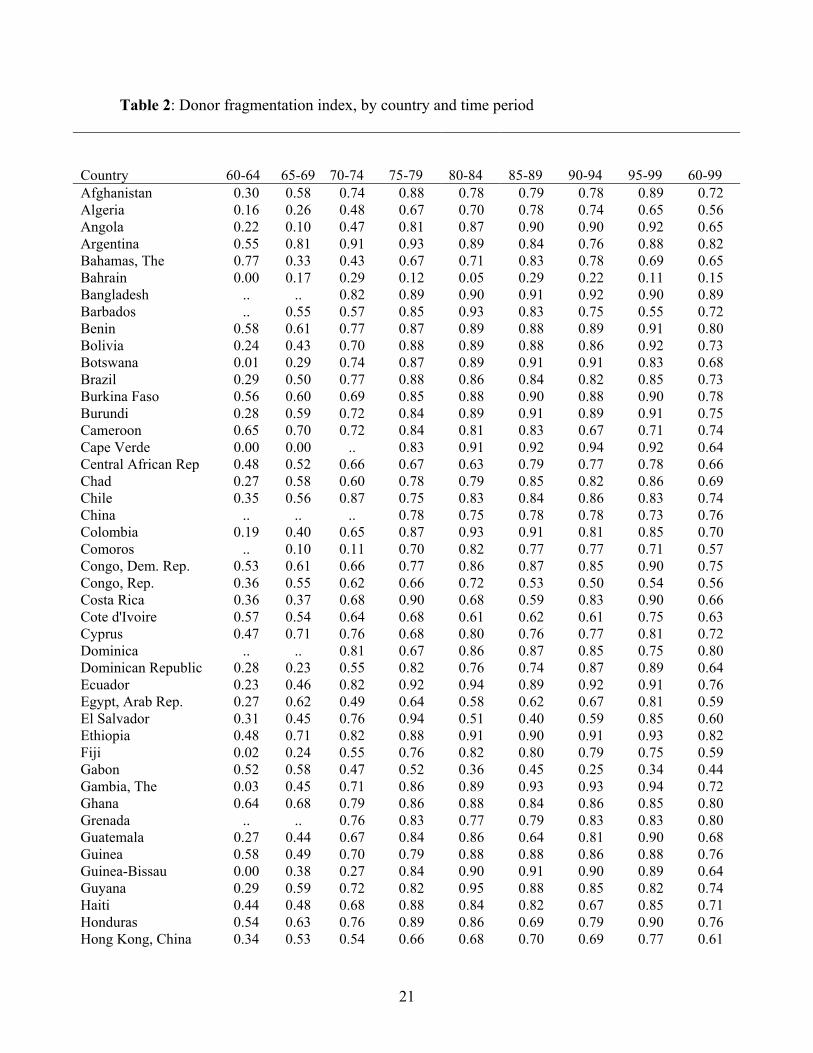
Table 2: Donor fragmentation index, by country and time period
Country 60-64 65-69 70-74 75-79 80-84 85-89 90-94 95-99
60-99
Afghanistan 0.30 0.58 0.74 0.88 0.78 0.79 0.78 0.89 0.72 Algeria 0.16 0.26 0.48 0.67 0.70 0.78 0.74 0.65 0.56 Angola 0.22 0.10 0.47 0.81 0.87 0.90 0.90 0.92 0.65 Argentina 0.55 0.81 0.91 0.93 0.89 0.84 0.76 0.88 0.82 Bahamas, The 0.77 0.33 0.43 0.67 0.71 0.83 0.78 0.69 0.65 Bahrain 0.00 0.17 0.29 0.12 0.05 0.29 0.22 0.11 0.15 Bangladesh .. .. 0.82 0.89 0.90 0.91 0.92 0.90 0.89 Barbados .. 0.55 0.57 0.85 0.93 0.83 0.75 0.55 0.72 Benin 0.58 0.61 0.77 0.87 0.89 0.88 0.89 0.91 0.80 Bolivia 0.24 0.43 0.70 0.88 0.89 0.88 0.86 0.92 0.73 Botswana 0.01 0.29 0.74 0.87 0.89 0.91 0.91 0.83 0.68 Brazil 0.29 0.50 0.77 0.88 0.86 0.84 0.82 0.85 0.73 Burkina Faso 0.56 0.60 0.69 0.85 0.88 0.90 0.88 0.90 0.78 Burundi 0.28 0.59 0.72 0.84 0.89 0.91 0.89 0.91 0.75 Cameroon 0.65 0.70 0.72 0.84 0.81 0.83 0.67 0.71 0.74 Cape Verde 0.00 0.00 .. 0.83 0.91 0.92 0.94 0.92 0.64 Central African Rep 0.48 0.52 0.66 0.67 0.63 0.79 0.77 0.78 0.66 Chad 0.27 0.58 0.60 0.78 0.79 0.85 0.82 0.86 0.69 Chile 0.35 0.56 0.87 0.75 0.83 0.84 0.86 0.83 0.74 China .. .. .. 0.78 0.75 0.78 0.78 0.73 0.76 Colombia 0.19 0.40 0.65 0.87 0.93 0.91 0.81 0.85 0.70 Comoros .. 0.10 0.11 0.70 0.82 0.77 0.77 0.71 0.57 Congo, Dem. Rep. 0.53 0.61 0.66 0.77 0.86 0.87 0.85 0.90 0.75 Congo, Rep. 0.36 0.55 0.62 0.66 0.72 0.53 0.50 0.54 0.56 Costa Rica 0.36 0.37 0.68 0.90 0.68 0.59 0.83 0.90 0.66 Cote d'Ivoire 0.57 0.54 0.64 0.68 0.61 0.62 0.61 0.75 0.63 Cyprus 0.47 0.71 0.76 0.68 0.80 0.76 0.77 0.81 0.72 Dominica .. .. 0.81 0.67 0.86 0.87 0.85 0.75 0.80 Dominican Republic 0.28 0.23 0.55 0.82 0.76 0.74 0.87 0.89 0.64 Ecuador 0.23 0.46 0.82 0.92 0.94 0.89 0.92 0.91 0.76 Egypt, Arab Rep. 0.27 0.62 0.49 0.64 0.58 0.62 0.67 0.81 0.59 El Salvador 0.31 0.45 0.76 0.94 0.51 0.40 0.59 0.85 0.60 Ethiopia 0.48 0.71 0.82 0.88 0.91 0.90 0.91 0.93 0.82 Fiji 0.02 0.24 0.55 0.76 0.82 0.80 0.79 0.75 0.59 Gabon 0.52 0.58 0.47 0.52 0.36 0.45 0.25 0.34 0.44 Gambia, The 0.03 0.45 0.71 0.86 0.89 0.93 0.93 0.94 0.72 Ghana 0.64 0.68 0.79 0.86 0.88 0.84 0.86 0.85 0.80 Grenada .. .. 0.76 0.83 0.77 0.79 0.83 0.83 0.80 Guatemala 0.27 0.44 0.67 0.84 0.86 0.64 0.81 0.90 0.68 Guinea 0.58 0.49 0.70 0.79 0.88 0.88 0.86 0.88 0.76 Guinea-Bissau 0.00 0.38 0.27 0.84 0.90 0.91 0.90 0.89 0.64 Guyana 0.29 0.59 0.72 0.82 0.95 0.88 0.85 0.82 0.74 Haiti 0.44 0.48 0.68 0.88 0.84 0.82 0.67 0.85 0.71 Honduras 0.54 0.63 0.76 0.89 0.86 0.69 0.79 0.90 0.76 Hong Kong, China 0.34 0.53 0.54 0.66 0.68 0.70 0.69 0.77 0.61
21
India 0.41 0.65 0.82 0.87 0.82 0.84 0.82 0.80 0.75 Indonesia 0.58 0.69 0.80 0.83 0.83 0.72 0.66 0.54 0.71 Iran, Islamic Rep. 0.28 0.72 0.80 0.64 0.69 0.78 0.81 0.75 0.68 Iraq 0.61 0.69 0.76 0.56 0.75 0.65 0.74 0.81 0.70 Israel 0.51 0.53 0.48 0.15 0.15 0.13 0.26 0.29 0.31 Jamaica 0.30 0.63 0.79 0.85 0.72 0.72 0.65 0.80 0.68 Jordan 0.57 0.70 0.56 0.46 0.25 0.51 0.79 0.82 0.58 Kenya 0.27 0.64 0.81 0.91 0.91 0.92 0.90 0.90 0.78 Korea, Rep. 0.08 0.46 0.55 0.70 0.54 0.39 0.32 0.43 0.43 Kuwait 1.00 0.71 0.52 0.39 0.61 0.71 0.67 0.71 0.67 Lesotho 0.06 0.35 0.76 0.89 0.89 0.92 0.93 0.91 0.71 Liberia 0.41 0.39 0.57 0.81 0.69 0.78 0.76 0.80 0.65 Madagascar 0.33 0.58 0.68 0.82 0.84 0.83 0.82 0.83 0.72 Malawi 0.03 0.45 0.68 0.82 0.87 0.88 0.90 0.88 0.69 Malaysia 0.44 0.74 0.78 0.66 0.64 0.59 0.48 0.24 0.57 Mali 0.64 0.68 0.77 0.87 0.88 0.90 0.89 0.90 0.82 Malta 0.02 0.16 0.51 0.69 0.54 0.69 0.53 0.36 0.44 Mauritania 0.37 0.53 0.78 0.65 0.80 0.87 0.86 0.83 0.71 Mauritius 0.14 0.26 0.76 0.81 0.76 0.78 0.66 0.73 0.61 Mexico 0.57 0.76 0.97 0.95 0.83 0.84 0.77 0.71 0.80 Morocco 0.35 0.68 0.77 0.70 0.64 0.78 0.84 0.78 0.69 Mozambique 0.01 0.18 0.59 0.83 0.91 0.91 0.93 0.90 0.66 Myanmar 0.47 0.59 0.53 0.80 0.77 0.71 0.67 0.61 0.64 Nepal 0.20 0.41 0.79 0.92 0.92 0.91 0.90 0.92 0.75 Nicaragua 0.29 0.54 0.65 0.84 0.92 0.91 0.87 0.90 0.74 Niger 0.53 0.55 0.77 0.85 0.87 0.91 0.86 0.86 0.77 Nigeria 0.49 0.76 0.83 0.86 0.87 0.82 0.87 0.78 0.78 Oman 0.00 0.05 0.18 0.11 0.14 0.60 0.59 0.43 0.26 Pakistan 0.29 0.66 0.80 0.86 0.91 0.90 0.91 0.88 0.78 Panama 0.26 0.31 0.63 0.69 0.80 0.81 0.44 0.75 0.59 Papua New Guinea 0.00 0.00 0.05 0.15 0.31 0.42 0.57 0.56 0.26 Paraguay 0.35 0.77 0.87 0.92 0.83 0.72 0.67 0.76 0.74 Peru 0.21 0.64 0.88 0.88 0.86 0.82 0.82 0.85 0.74 Philippines 0.43 0.57 0.61 0.77 0.75 0.65 0.64 0.60 0.63 Rwanda 0.27 0.68 0.74 0.86 0.90 0.92 0.91 0.89 0.77 Samoa 1.00 0.79 0.83 0.87 0.90 0.86 0.86 0.77 0.86 Saudi Arabia 0.61 0.79 0.67 0.55 0.65 0.70 0.56 0.69 0.65 Senegal 0.72 0.56 0.69 0.76 0.84 0.87 0.81 0.83 0.76 Seychelles 0.03 0.07 0.02 0.37 0.79 0.83 0.82 0.79 0.47 Sierra Leone 0.38 0.64 0.78 0.88 0.89 0.86 0.82 0.90 0.77 Singapore 0.66 0.65 0.57 0.69 0.70 0.61 0.66 0.67 0.65 Solomon Islands 0.05 0.19 0.09 0.37 0.76 0.82 0.80 0.80 0.49 Somalia 0.64 0.73 0.79 0.73 0.88 0.83 0.75 0.88 0.78 South Africa .. .. .. .. .. .. 0.84 0.89 0.86 Sri Lanka 0.62 0.80 0.87 0.92 0.91 0.89 0.88 0.82 0.84 St. Lucia .. .. 0.78 0.67 0.81 0.89 0.86 0.73 0.79 St. Vincent .. .. 0.70 0.46 0.89 0.90 0.88 0.60 0.74 Sudan 0.46 0.78 0.84 0.73 0.87 0.90 0.91 0.92 0.80 Suriname 0.04 0.24 0.21 0.09 0.31 0.59 0.44 0.40 0.29 Swaziland 0.14 0.10 0.63 0.82 0.87 0.89 0.90 0.86 0.65
22
Syrian Arab Republic 0.53 0.69 0.44 0.18 0.16 0.44 0.66 0.73 0.48 Tanzania 0.38 0.81 0.88 0.90 0.93 0.92 0.92 0.92 0.83 Thailand 0.29 0.64 0.76 0.78 0.72 0.61 0.60 0.34 0.59 Togo 0.77 0.76 0.79 0.82 0.84 0.82 0.80 0.83 0.80 Tonga 1.00 0.52 0.56 0.77 0.85 0.82 0.81 0.82 0.77 Trinidad and Tobago 0.26 0.58 0.86 0.87 0.82 0.62 0.73 0.35 0.63 Tunisia 0.38 0.70 0.84 0.86 0.85 0.87 0.85 0.78 0.77 Turkey 0.28 0.65 0.71 0.71 0.74 0.76 0.78 0.76 0.67 Uganda 0.24 0.67 0.82 0.80 0.89 0.86 0.90 0.90 0.76 United Arab Emirates 0.14 0.02 0.32 0.43 0.67 0.37 0.58 0.59 0.39 Uruguay 0.35 0.56 0.66 0.91 0.84 0.86 0.86 0.85 0.74 Vanuatu 0.01 0.07 0.30 0.51 0.71 0.81 0.83 0.81 0.51 Venezuela 0.16 0.44 0.90 0.89 0.76 0.76 0.78 0.87 0.70 Yemen, Rep. 0.48 0.39 0.70 0.50 0.66 0.83 0.88 0.84 0.66 Yugoslavia .. .. .. .. .. .. 0.57 0.78 0.67 Zambia 0.01 0.41 0.78 0.88 0.91 0.91 0.88 0.83 0.70 Zimbabwe 0.04 0.54 0.64 0.42 0.87 0.92 0.92 0.91 0.66 Mean 0.35 0.51 0.66 0.73 0.77 0.77 0.77 0.77 0.67 Median 0.34 0.56 0.71 0.82 0.83 0.83 0.82 0.82 0.75 Std Deviation 0.24 0.21 0.19 0.20 0.18 0.16 0.15 0.17 0.23
Note: Data from the Development Assistance Committee (DAC) in the OECD. This table presents the average values of the donor fragmentation index for each 5-year period, for each of the 112 sample countries.
23
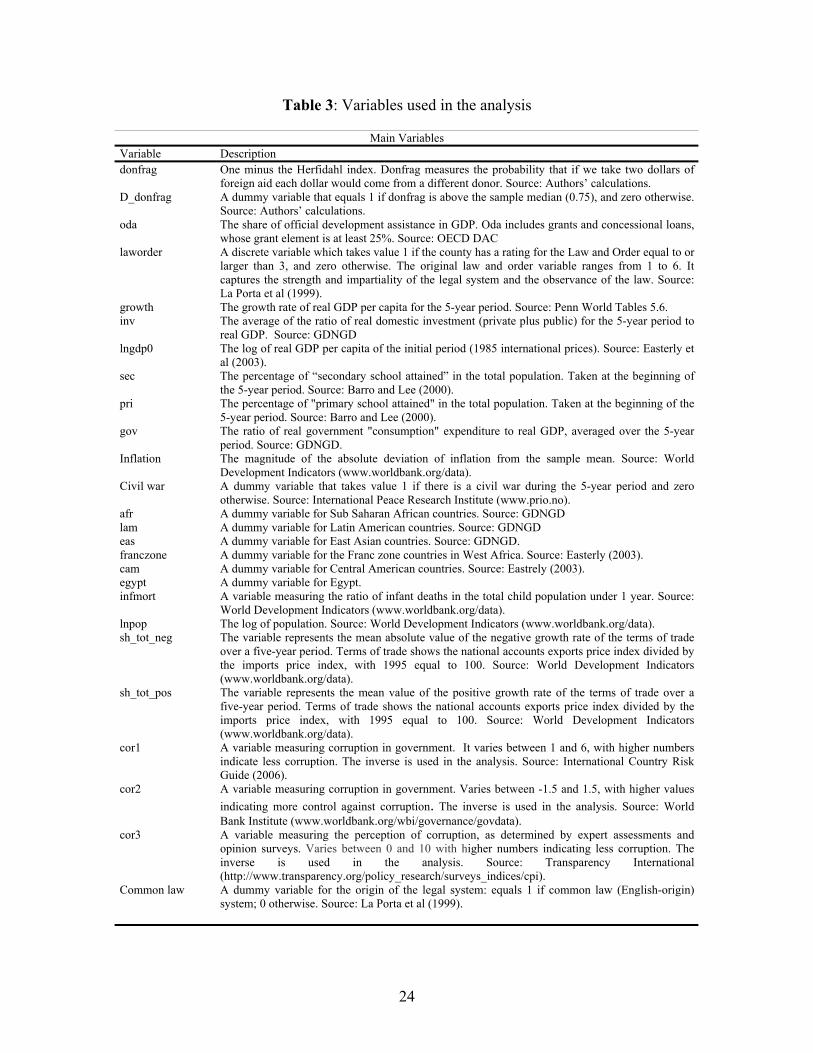
Table 3: Variables used in the analysis
Main Variables Variable Description donfrag One minus the Herfidahl index. Donfrag measures the probability that if we take two dollars of
foreign aid each dollar would come from a different donor. Source: Authors’ calculations. D_donfrag A dummy variable that equals 1 if donfrag is above the sample median (0.75), and zero otherwise.
Source: Authors’ calculations. oda The share of official development assistance in GDP. Oda includes grants and concessional loans,
whose grant element is at least 25%. Source: OECD DAC laworder A discrete variable which takes value 1 if the county has a rating for the Law and Order equal to or
larger than 3, and zero otherwise. The original law and order variable ranges from 1 to 6. It captures the strength and impartiality of the legal system and the observance of the law. Source: La Porta et al (1999).
growth The growth rate of real GDP per capita for the 5-year period. Source: Penn World Tables 5.6. inv The average of the ratio of real domestic investment (private plus public) for the 5-year period to
real GDP. Source: GDNGD lngdp0 The log of real GDP per capita of the initial period (1985 international prices). Source: Easterly et
al (2003). sec The percentage of “secondary school attained” in the total population. Taken at the beginning of
the 5-year period. Source: Barro and Lee (2000). pri The percentage of "primary school attained" in the total population. Taken at the beginning of the
5-year period. Source: Barro and Lee (2000). gov The ratio of real government "consumption" expenditure to real GDP, averaged over the 5-year
period. Source: GDNGD. Inflation The magnitude of the absolute deviation of inflation from the sample mean. Source: World
Development Indicators (www.worldbank.org/data). Civil war A dummy variable that takes value 1 if there is a civil war during the 5-year period and zero
otherwise. Source: International Peace Research Institute (www.prio.no). afr A dummy variable for Sub Saharan African countries. Source: GDNGD lam A dummy variable for Latin American countries. Source: GDNGD eas A dummy variable for East Asian countries. Source: GDNGD. franczone A dummy variable for the Franc zone countries in West Africa. Source: Easterly (2003). cam A dummy variable for Central American countries. Source: Eastrely (2003). egypt A dummy variable for Egypt. infmort A variable measuring the ratio of infant deaths in the total child population under 1 year. Source:
World Development Indicators (www.worldbank.org/data). lnpop The log of population. Source: World Development Indicators (www.worldbank.org/data). sh_tot_neg The variable represents the mean absolute value of the negative growth rate of the terms of trade
over a five-year period. Terms of trade shows the national accounts exports price index divided by the imports price index, with 1995 equal to 100. Source: World Development Indicators (www.worldbank.org/data).
sh_tot_pos The variable represents the mean value of the positive growth rate of the terms of trade over a five-year period. Terms of trade shows the national accounts exports price index divided by the imports price index, with 1995 equal to 100. Source: World Development Indicators (www.worldbank.org/data).
cor1
A variable measuring corruption in government. It varies between 1 and 6, with higher numbers indicate less corruption. The inverse is used in the analysis. Source: International Country Risk Guide (2006).
cor2
A variable measuring corruption in government. Varies between -1.5 and 1.5, with higher values indicating more control against corruption. The inverse is used in the analysis. Source: World Bank Institute (www.worldbank.org/wbi/governance/govdata).
cor3
A variable measuring the perception of corruption, as determined by expert assessments and opinion surveys. Varies between 0 and 10 with higher numbers indicating less corruption. The inverse is used in the analysis. Source: Transparency International (http://www.transparency.org/policy_research/surveys_indices/cpi).
Common law A dummy variable for the origin of the legal system: equals 1 if common law (English-origin) system; 0 otherwise. Source: La Porta et al (1999).
24
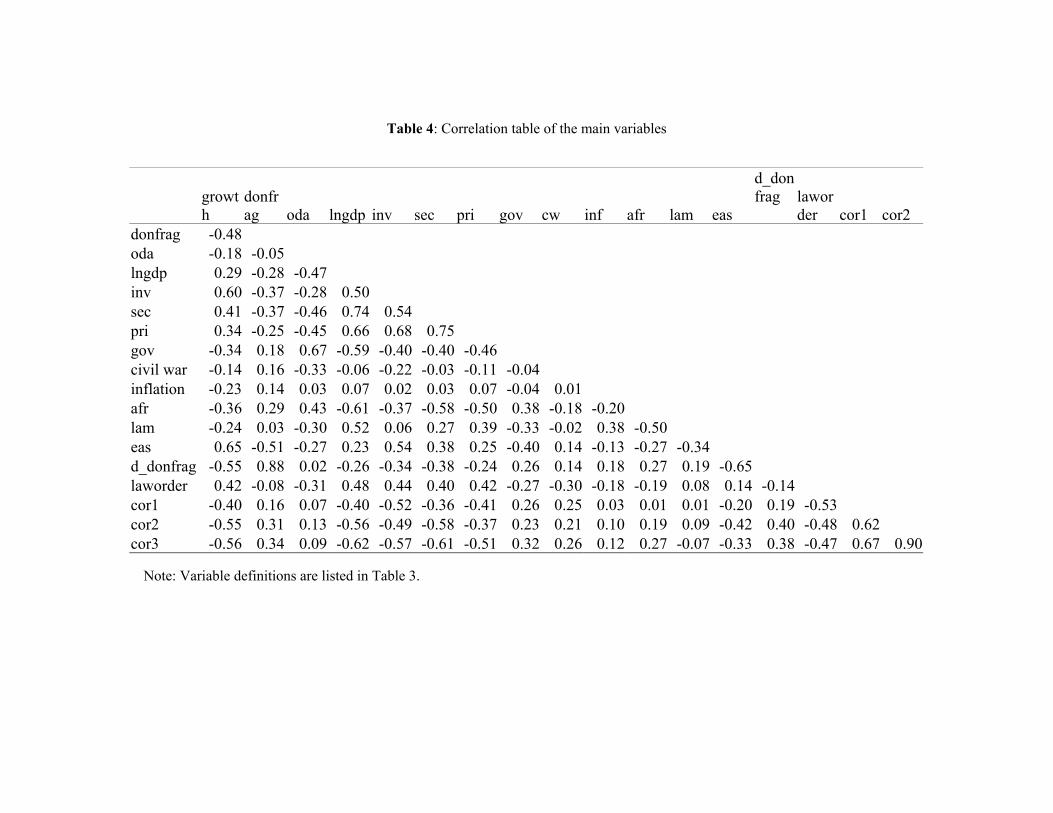
Table 4: Correlation table of the main variables
growth
donfrag oda lngdp inv sec pri gov cw inf afr lam eas
d_donfrag
laworder cor1 cor2
donfrag -0.48 oda -0.18 -0.05
lngdp 0.29 -0.28 -0.47inv 0.60 -0.37 -0.28 0.50sec 0.41 -0.37 -0.46 0.74 0.54pri 0.34 -0.25 -0.45 0.66 0.68 0.75gov -0.34 0.18 0.67 -0.59 -0.40 -0.40 -0.46civil war -0.14 0.16 -0.33 -0.06 -0.22 -0.03 -0.11 -0.04inflation
-0.23 0.14 0.03 0.07 0.02 0.03 0.07 -0.04 0.01
afr -0.36 0.29 0.43 -0.61 -0.37 -0.58 -0.50 0.38 -0.18 -0.20lam
-0.24 0.03 -0.30 0.52 0.06 0.27 0.39 -0.33 -0.02 0.38 -0.50
eas 0.65 -0.51 -0.27 0.23 0.54 0.38 0.25 -0.40 0.14 -0.13 -0.27 -0.34 d_donfrag
-0.55 0.88 0.02 -0.26 -0.34 -0.38 -0.24 0.26 0.14 0.18 0.27 0.19 -0.65
laworder
0.42 -0.08 -0.31 0.48 0.44 0.40 0.42 -0.27 -0.30 -0.18 -0.19 0.08 0.14 -0.14 cor1 -0.40 0.16 0.07 -0.40 -0.52 -0.36 -0.41 0.26 0.25 0.03 0.01 0.01 -0.20 0.19 -0.53cor2 -0.55 0.31 0.13 -0.56 -0.49 -0.58 -0.37 0.23 0.21 0.10 0.19 0.09 -0.42 0.40 -0.48 0.62cor3 -0.56 0.34 0.09 -0.62 -0.57 -0.61 -0.51 0.32 0.26 0.12 0.27 -0.07 -0.33 0.38 -0.47 0.67 0.90
Note: Variable definitions are listed in Table 3.
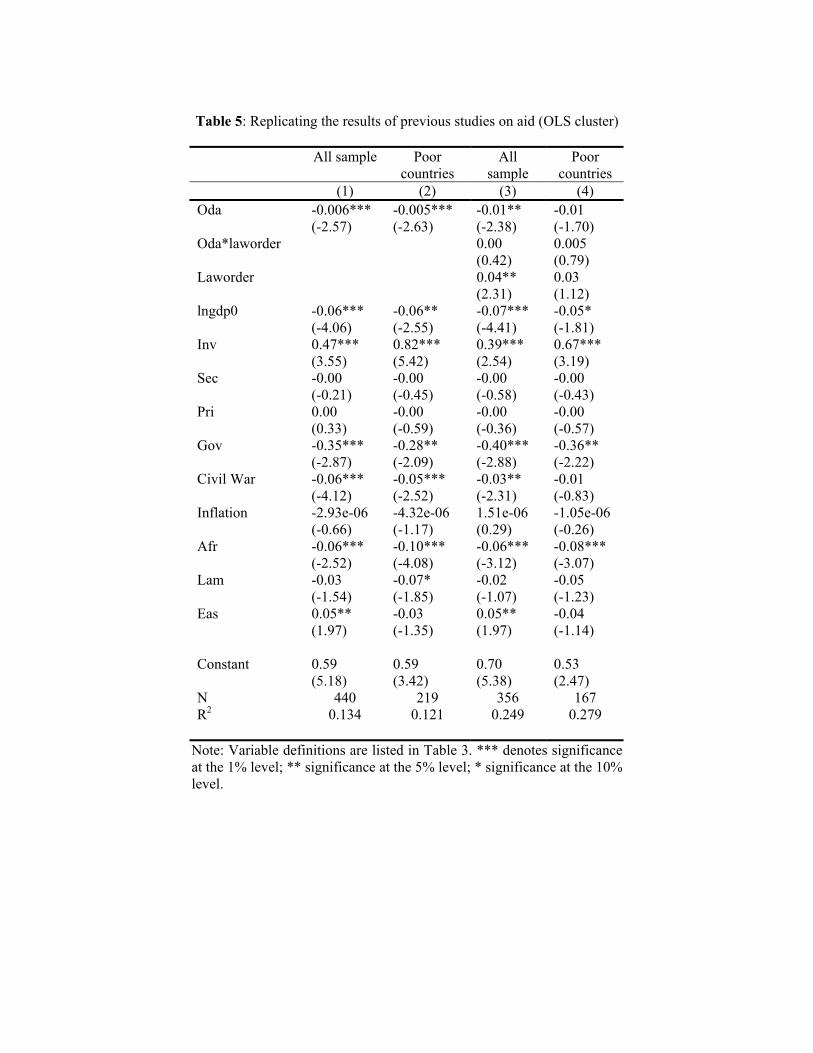
Table 5: Replicating the results of previous studies on aid (OLS cluster)
All sample Poor
countries All
sample Poor
countries (1) (2) (3) (4) Oda -0.006***
(-2.57) -0.005*** (-2.63)
-0.01** (-2.38)
-0.01 (-1.70)
Oda*laworder 0.00 (0.42)
0.005 (0.79)
Laworder 0.04** (2.31)
0.03 (1.12)
lngdp0 -0.06*** (-4.06)
-0.06** (-2.55)
-0.07*** (-4.41)
-0.05* (-1.81)
Inv 0.47*** (3.55)
0.82*** (5.42)
0.39*** (2.54)
0.67*** (3.19)
Sec -0.00 (-0.21)
-0.00 (-0.45)
-0.00 (-0.58)
-0.00 (-0.43)
Pri 0.00 (0.33)
-0.00 (-0.59)
-0.00 (-0.36)
-0.00 (-0.57)
Gov -0.35*** (-2.87)
-0.28** (-2.09)
-0.40*** (-2.88)
-0.36** (-2.22)
Civil War -0.06*** (-4.12)
-0.05*** (-2.52)
-0.03** (-2.31)
-0.01 (-0.83)
Inflation -2.93e-06 (-0.66)
-4.32e-06 (-1.17)
1.51e-06 (0.29)
-1.05e-06 (-0.26)
Afr -0.06*** (-2.52)
-0.10*** (-4.08)
-0.06*** (-3.12)
-0.08*** (-3.07)
Lam -0.03 (-1.54)
-0.07* (-1.85)
-0.02 (-1.07)
-0.05 (-1.23)
Eas 0.05** (1.97)
-0.03 (-1.35)
0.05** (1.97)
-0.04 (-1.14)
Constant 0.59
(5.18) 0.59 (3.42)
0.70 (5.38)
0.53 (2.47)
N 440 219 356 167 R2 0.134 0.121 0.249 0.279
Note: Variable definitions are listed in Table 3. *** denotes significance at the 1% level; ** significance at the 5% level; * significance at the 10% level.
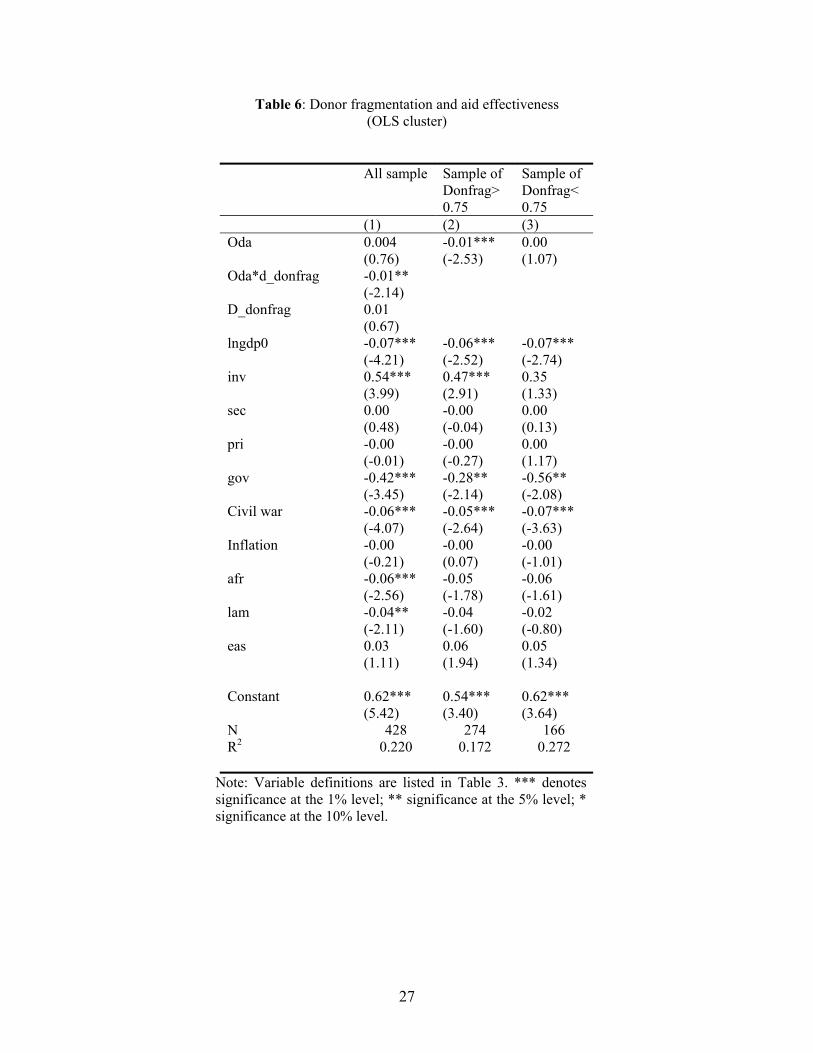
Table 6: Donor fragmentation and aid effectiveness (OLS cluster)
All sample Sample of Donfrag> 0.75
Sample of Donfrag< 0.75
(1) (2) (3) Oda 0.004
(0.76) (-2.53) 0.00 (1.07)
Oda*d_donfrag -0.01** (-2.14)
D_donfrag 0.01 (0.67)
lngdp0 -0.07*** (-4.21)
-0.06*** (-2.52)
-0.07*** (-2.74)
inv 0.54*** (3.99)
0.47*** (2.91)
0.35 (1.33)
sec 0.00 (0.48)
-0.00 (-0.04)
0.00 (0.13)
pri -0.00 (-0.01)
-0.00 (-0.27)
0.00 (1.17)
gov -0.42*** (-3.45)
-0.28** (-2.14)
-0.56** (-2.08)
Civil war -0.06*** (-4.07)
-0.05*** (-2.64)
-0.07*** (-3.63)
Inflation -0.00 (-0.21)
-0.00 (0.07)
-0.00 (-1.01)
afr -0.06*** (-2.56)
-0.05 (-1.78)
-0.06 (-1.61)
lam -0.04** (-2.11)
-0.04 (-1.60)
-0.02 (-0.80)
eas 0.03 (1.11)
0.06 (1.94)
0.05 (1.34)
Constant 0.62***
(5.42) 0.54*** (3.40)
0.62*** (3.64)
N 428 274 166 R2 0.220 0.172 0.272
-0.01***
Note: Variable definitions are listed in Table 3. *** denotes significance at the 1% level; ** significance at the 5% level; * significance at the 10% level.
27
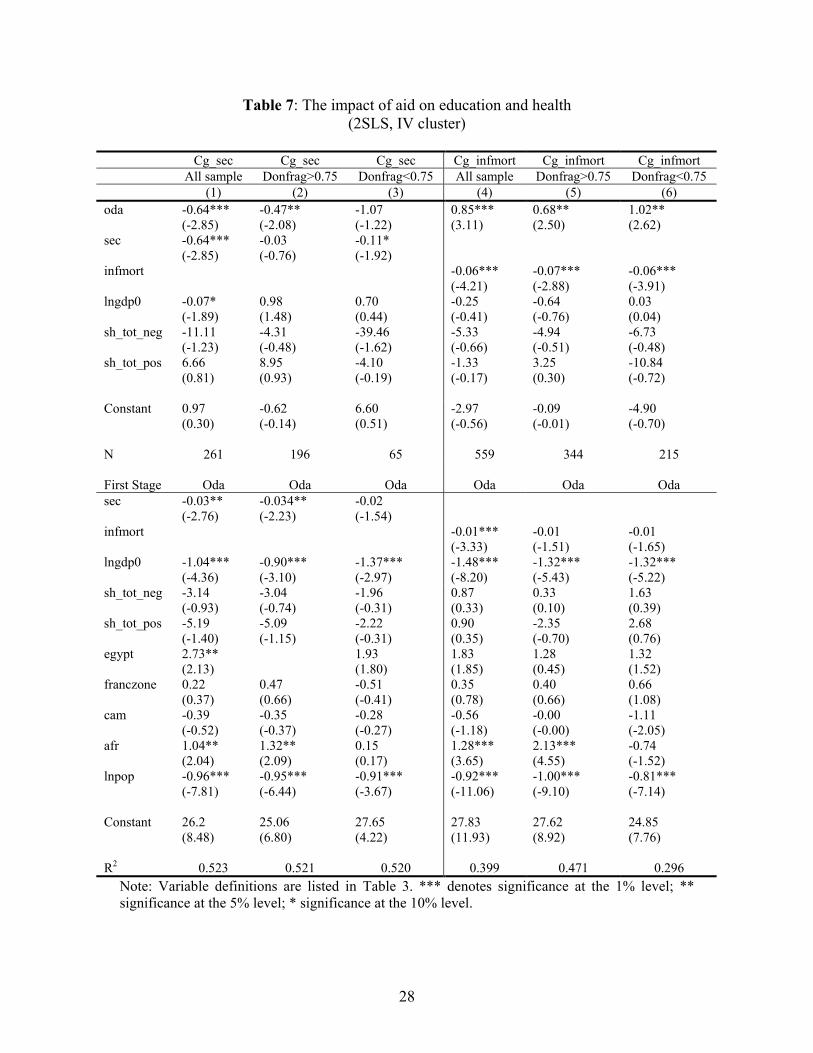
Table 7: The impact of aid on education and health (2SLS, IV cluster)
Cg_sec Cg_sec Cg_sec Cg_infmort Cg_infmort Cg_infmort All sample Donfrag>0.75 Donfrag<0.75 All sample Donfrag>0.75 Donfrag<0.75 (1) (2) (3) (4) (5) (6) oda -0.64***
(-2.85) -0.47** (-2.08)
-1.07 (-1.22)
0.85*** (3.11)
0.68** (2.50)
1.02** (2.62)
sec -0.64*** (-2.85)
-0.03 (-0.76)
-0.11* (-1.92)
infmort -0.06*** (-4.21)
-0.07*** (-2.88)
-0.06*** (-3.91)
lngdp0 -0.07* (-1.89)
0.98 (1.48)
0.70 (0.44)
-0.25 (-0.41)
-0.64 (-0.76)
0.03 (0.04)
sh_tot_neg -11.11 (-1.23)
-4.31 (-0.48)
-39.46 (-1.62)
-5.33 (-0.66)
-4.94 (-0.51)
-6.73 (-0.48)
sh_tot_pos 6.66 (0.81)
8.95 (0.93)
-4.10 (-0.19)
-1.33 (-0.17)
3.25 (0.30)
-10.84 (-0.72)
Constant 0.97
(0.30) -0.62 (-0.14)
6.60 (0.51)
-2.97 (-0.56)
-0.09 (-0.01)
-4.90 (-0.70)
N 261 196 65 559 344 215 First Stage Oda Oda Oda Oda Oda Oda sec -0.03**
(-2.76) -0.034** (-2.23)
-0.02 (-1.54)
infmort -0.01*** (-3.33)
-0.01 (-1.51)
-0.01 (-1.65)
lngdp0 -1.04*** (-4.36)
-0.90*** (-3.10)
-1.37*** (-2.97)
-1.48*** (-8.20)
-1.32*** (-5.43)
-1.32*** (-5.22)
sh_tot_neg -3.14 (-0.93)
-3.04 (-0.74)
-1.96 (-0.31)
0.87 (0.33)
0.33 (0.10)
1.63 (0.39)
sh_tot_pos -5.19 (-1.40)
-5.09 (-1.15)
-2.22 (-0.31)
0.90 (0.35)
-2.35 (-0.70)
2.68 (0.76)
egypt 2.73** (2.13)
1.93 (1.80)
1.83 (1.85)
1.28 (0.45)
1.32 (1.52)
franczone 0.22 (0.37)
0.47 (0.66)
-0.51 (-0.41)
0.35 (0.78)
0.40 (0.66)
0.66 (1.08)
cam -0.39 (-0.52)
-0.35 (-0.37)
-0.28 (-0.27)
-0.56 (-1.18)
-0.00 (-0.00)
-1.11 (-2.05)
afr 1.04** (2.04)
1.32** (2.09)
0.15 (0.17)
1.28*** (3.65)
2.13*** (4.55)
-0.74 (-1.52)
lnpop -0.96*** (-7.81)
-0.95*** (-6.44)
-0.91*** (-3.67)
-0.92*** (-11.06)
-1.00*** (-9.10)
-0.81*** (-7.14)
Constant 26.2
(8.48) 25.06 (6.80)
27.65 (4.22)
27.83 (11.93)
27.62 (8.92)
24.85 (7.76)
R2 0.523 0.521 0.520 0.399 0.471 0.296
Note: Variable definitions are listed in Table 3. *** denotes significance at the 1% level; ** significance at the 5% level; * significance at the 10% level.
28
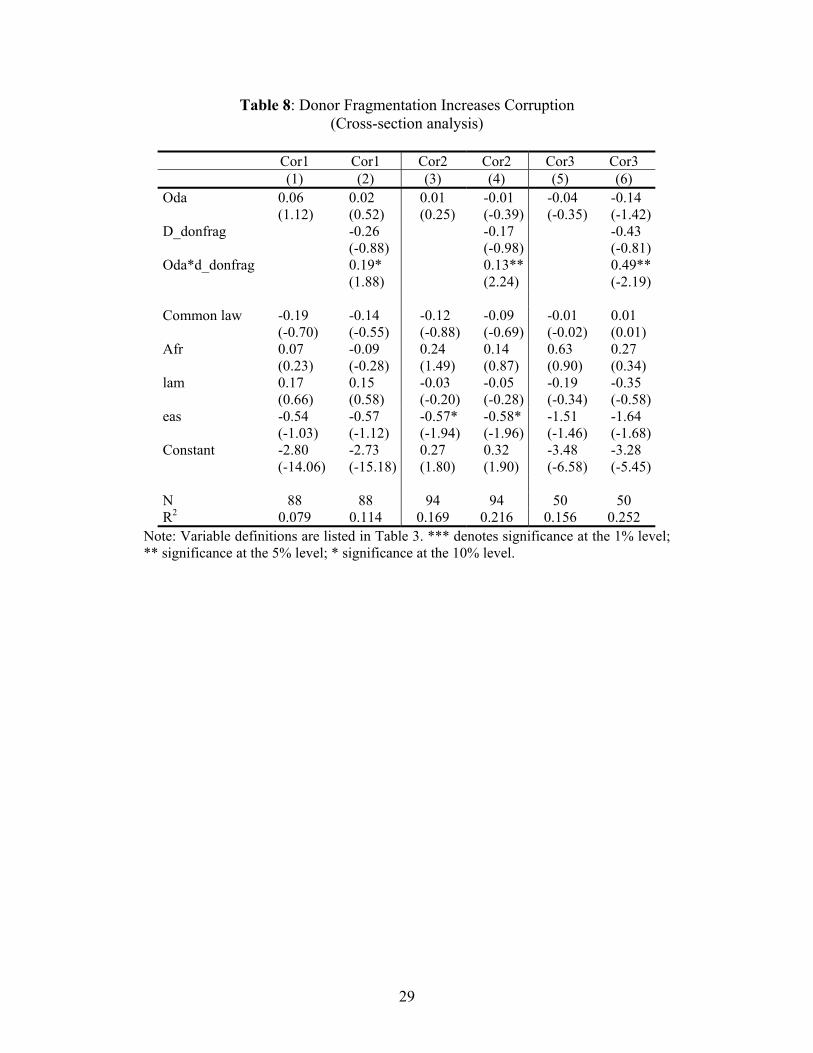
Table 8: Donor Fragmentation Increases Corruption (Cross-section analysis)
Cor1 Cor1 Cor2 Cor2 Cor3 Cor3 (1) (2) (3) (4) (5) (6) Oda 0.06
(1.12) 0.02 (0.52)
0.01 (0.25)
-0.01 (-0.39)
-0.04 (-0.35)
-0.14 (-1.42)
D_donfrag -0.26 (-0.88)
-0.17 (-0.98)
-0.43 (-0.81)
Oda*d_donfrag 0.19* (1.88)
0.13**(2.24)
0.49** (-2.19)
Common law -0.19
(-0.70) -0.14 (-0.55)
-0.12 (-0.88)
-0.09 (-0.69)
-0.01 (-0.02)
0.01 (0.01)
Afr 0.07 (0.23)
-0.09 (-0.28)
0.24 (1.49)
0.14 (0.87)
0.63 (0.90)
0.27 (0.34)
lam 0.17 (0.66)
0.15 (0.58)
-0.03 (-0.20)
-0.05 (-0.28)
-0.19 (-0.34)
-0.35 (-0.58)
eas -0.54 (-1.03)
-0.57 (-1.12)
-0.57*(-1.94)
-0.58* (-1.96)
-1.51 (-1.46)
-1.64 (-1.68)
Constant -2.80 (-14.06)
-2.73 (-15.18)
0.27 (1.80)
0.32 (1.90)
-3.48 (-6.58)
-3.28 (-5.45)
N 88 88 94 94 50 50 R2 0.079 0.114 0.169 0.216 0.156 0.252
Note: Variable definitions are listed in Table 3. *** denotes significance at the 1% level; ** significance at the 5% level; * significance at the 10% level.
29


![Aparato Reproductor [MONTALVO]](https://img.pdfslide.net/doc/110x75/558e55471a28ab32508b45a4/aparato-reproductor-montalvo.jpg)


![Antimonio - Montalvo[1]](https://img.pdfslide.net/doc/110x75/577d1cf41a28ab4e1e8b48e1/antimonio-montalvo1.jpg)
![Aparato circulatorio [montalvo]](https://img.pdfslide.net/doc/110x75/55b5d7c1bb61ebf3518b457f/aparato-circulatorio-montalvo-55bd3f376c645.jpg)
![Osteologia [Montalvo]](https://img.pdfslide.net/doc/110x75/5596bd151a28aba02d8b468d/osteologia-montalvo.jpg)