Embed Size (px)
Citation preview
Middlesbrough Council
Cargo Fleet Lane Junction Feasibility Study
Aimsun Modelling Report
18 April 2018
Version 0.1
Draft
Middlesbrough Council
Cargo Fleet Lane Junction Feasibility Study – Aimsun Modelling Report
18 April 2018 ▪ Version 0.1 ▪ Draft
i
Contents
1 Introduction 1
1.1 Commission 1
1.2 Model Background 1
1.3 Aimsun Model Development 2
1.4 Purpose of this Report 2
1.5 Report Structure 2
2 Summary of Cargo Fleet Aimsun Modelling 3
2.1 Introduction 3
2.2 Summary of Capacity Improvements 4
3 Proposed Highway Scheme 5
3.1 Introduction 5
3.2 Existing Layout 5
3.3 Proposed Layout (Layout A) 6
3.4 Development of LinSig Model 7
4 Aimsun Model Review 10
4.1 Proposed Layout 10
4.2 Proposed Changes to Layout 10
5 Aimsun Model Results 12
5.1 Introduction 12
5.2 Network Statistics 12
5.3 Individual Arm Statistics 15
5.4 Junction Statistics 22
5.5 Recommendation 23
6 Summary and Conclusions 24
6.1 Introduction 24
6.2 Future Year Scenarios 24
6.3 Future Year Modelling 24

Middlesbrough Council
Cargo Fleet Lane Junction Feasibility Study – Aimsun Modelling Report
18 April 2018 ▪ Version 0.1 ▪ Draft
ii
Appendices
Appendix A: General Arrangement of Proposed Cargo Fleet Lane / South Bank Road Junction
Appendix B: LinSig Output (Layout A)
Middlesbrough Council
Cargo Fleet Lane Junction Feasibility Study – Aimsun Modelling Report
18 April 2018 ▪ Version 0.1 ▪ Draft
1
1 Introduction
1.1 Commission
Fore Consulting Limited (Fore) has been appointed by Middlesbrough Council to undertake
microsimulation modelling of proposals for the reconfiguration and implementation of
signal control at the Cargo Fleet Lane / South Bank Road roundabout, Middlesbrough, in
order to provide a signal-controlled crossing facility for National Cycle Route 1 which runs
along South Bank Road. The modelling will help inform the design of the proposals and
confirm whether they would operate satisfactorily.
1.2 Model Background
In 2017 Fore were appointed by Middlesbrough Council to develop an Aimsun
microsimulation model of the Cargo Fleet Roundabout located on the A66. The model was
developed to test the impact of implementing various roundabout options to determine the
highway mitigation that is required to accommodate future year traffic.
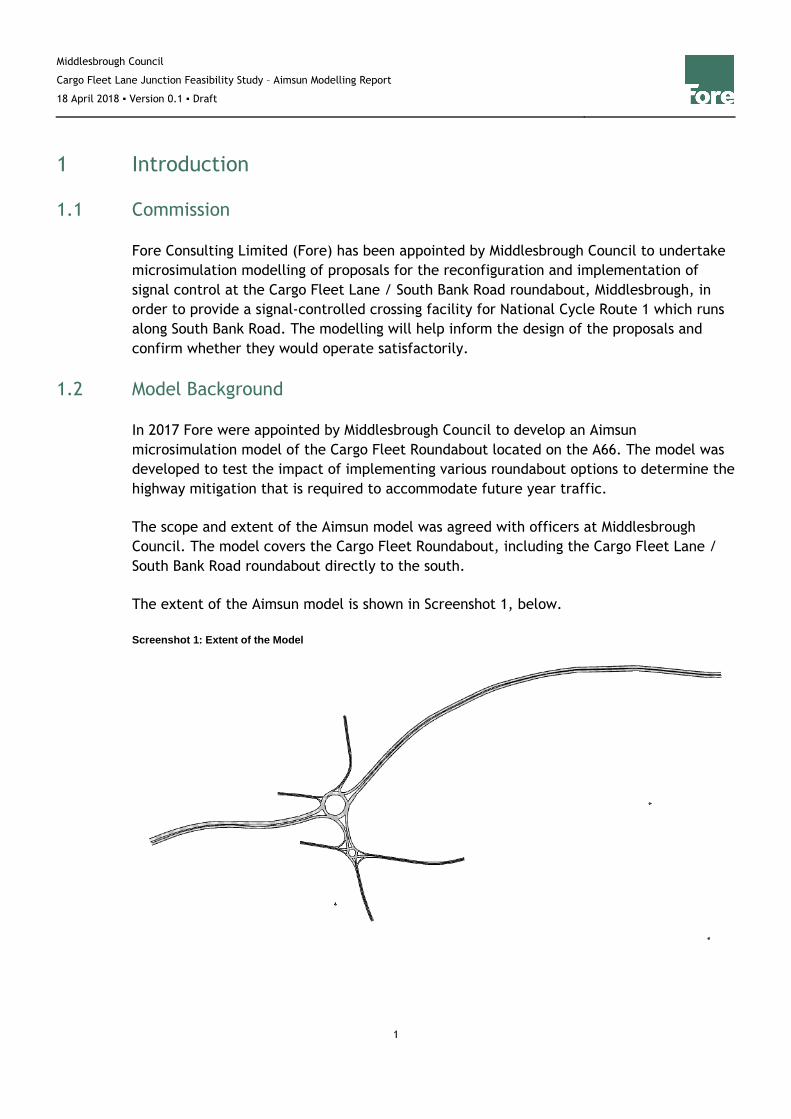
The scope and extent of the Aimsun model was agreed with officers at Middlesbrough
Council. The model covers the Cargo Fleet Roundabout, including the Cargo Fleet Lane /
South Bank Road roundabout directly to the south.
The extent of the Aimsun model is shown in Screenshot 1, below.
Screenshot 1: Extent of the Model
Middlesbrough Council
Cargo Fleet Lane Junction Feasibility Study – Aimsun Modelling Report
18 April 2018 ▪ Version 0.1 ▪ Draft
2
1.3 Aimsun Model Development
Full details, including the development, calibration and validation of the Aimsun model
can be found in the corresponding Aimsun Modelling Report1 which was issued to
Middlesbrough Council in March 2017.
1.4 Purpose of this Report
The purpose of this report is to undertake microsimulation modelling of proposals for the
reconfiguration and implementation of signal control at the Cargo Fleet Lane / South Bank
Road roundabout to the immediate south of the Cargo Fleet roundabout.
This report sets out the methodology adopted in developing the future year scenarios and
describes the data that has been outputted from the model and provided to Middlesbrough
Council.
1.5 Report Structure
This report is structured as follows:
• Chapter 2 provides a summary of the Cargo Fleet Roundabout Aimsun modelling
undertaken in 2017.
• Chapter 3 sets out details of the proposed highway scheme at the Cargo Fleet Lane /
South Bank Road junction.
• Chapter 4 provides an initial review of the highway scheme undertaken in Aimsun and
sets out the proposed changes to the initial layout.
• Chapter 5 sets out the modelling methodology and presents and discusses the results
from the Aimsun modelling.
• Chapter 6 summarises the findings of the modelling.
1 Cargo Fleet Throughabout Feasibility Study, Aimsun Modelling Report (Issue v1.0), Fore Consulting, 2017.
Middlesbrough Council
Cargo Fleet Lane Junction Feasibility Study – Aimsun Modelling Report
18 April 2018 ▪ Version 0.1 ▪ Draft
3
2 Summary of Cargo Fleet Aimsun Modelling
2.1 Introduction
In 2017 Fore developed four potential highway mitigation schemes at the Cargo Fleet
Roundabout located on the A66. Following detailed modelling of the junction it was
concluded that Option 1 would provide the greatest benefit and perform most favourably
overall due to the greater capacity improvements provided by the scheme.
Full details of each mitigation scheme can be found at Chapter 7 of the Aimsun Modelling
Report. The Option 1 highway mitigation scheme includes the following:
• Realignment of the A66 to allow the provision of eastbound and westbound through-
movements through the centre of the exiting roundabout.
• Provision of a two-lane approach through and around the roundabout on the A66
eastbound and westbound approach.
• Provision of two lanes eastbound and westbound through the roundabout.
• Realignment of the kerb line to allow turning from the A66 eastbound to Cambridge
Road.
• Realignment of the kerb line to allow turning from Works Road to the A66 eastbound.
• Reallocation of lane usage on northern and eastern circulatory to allow for two exiting
lanes of traffic to Cargo Fleet Lane and one exit lane to the A66 eastbound.
• Provision of a give-way on the A66 eastbound exit of the roundabout.
• Provision of a signal-controlled pedestrian crossing across the A66 eastbound approach /
westbound exit for through traffic.
• Provision of a signal-controlled pedestrian crossing across the A66 westbound exit of the
roundabout.
• Provision of a new footway linking the new signal-controlled pedestrian crossing across
the A66 westbound exit to the existing crossing across the Cargo Fleet Lane approach.
The Aimsun coding is shown on Screenshot 2, overleaf.
Middlesbrough Council
Cargo Fleet Lane Junction Feasibility Study – Aimsun Modelling Report
18 April 2018 ▪ Version 0.1 ▪ Draft
4
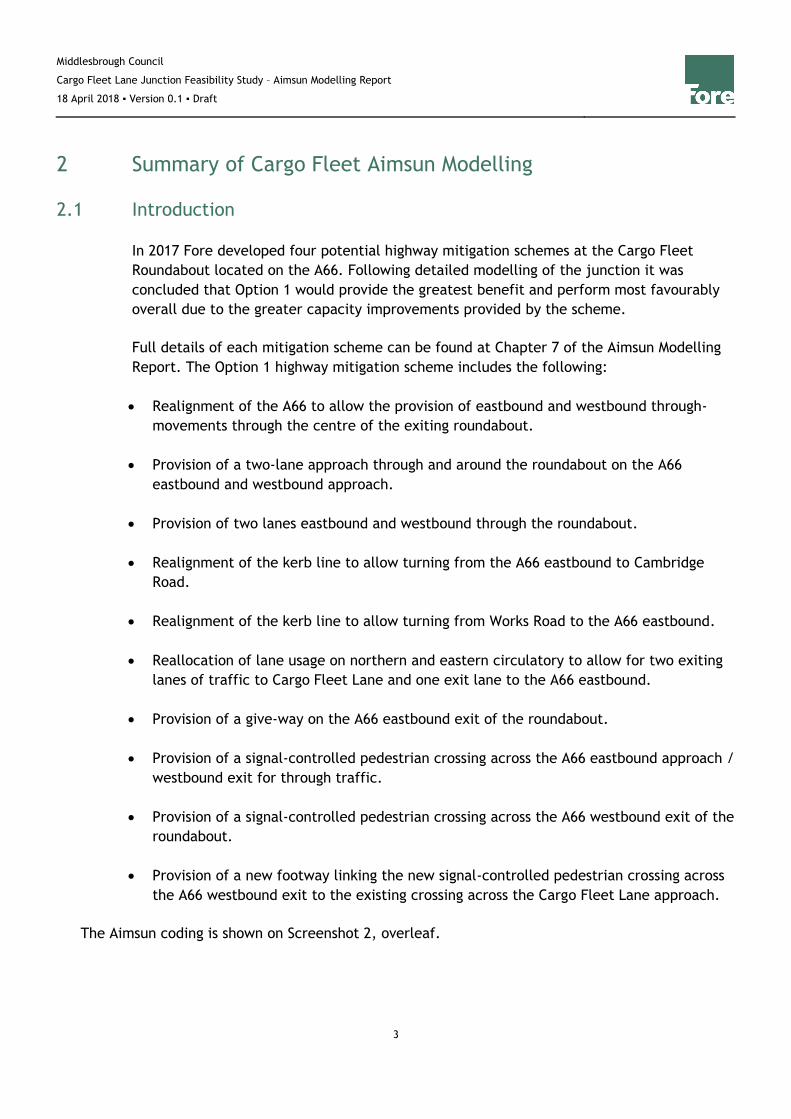
Screenshot 2: 2025 Future Year Do Something Option 1 Network Coding
2.2 Summary of Capacity Improvements
The Aimsun modelling results demonstrated that Option 1 would:
• Result in significant reductions in both travel time and network delay.
• Result in a material reduction in delay on the Cambridge Road approach to the
roundabout.
• Significantly reduce queuing on the A66 Eastbound and A66 Westbound approach arms
to the roundabout.
Full details of the model outputs and a description of the results can be found in at Chapter
8 of the Aimsun Modelling Report.
Middlesbrough Council
Cargo Fleet Lane Junction Feasibility Study – Aimsun Modelling Report
18 April 2018 ▪ Version 0.1 ▪ Draft
5
3 Proposed Highway Scheme
3.1 Introduction
Following the identification of a preferred highway mitigation scheme at the Cargo Fleet
Roundabout, Middlesbrough Council have advised that a subsequent highway improvement
scheme has been identified at the existing Cargo Fleet Lane / South Bank Road roundabout
to the immediate south of the Cargo Fleet roundabout, aimed at better facilitating
pedestrian and cycle connectivity, particularly with regards to National Cycle Route 1.
The proposed scheme includes the reconfiguration of the junction layout alongside the
implementation of traffic signal control.
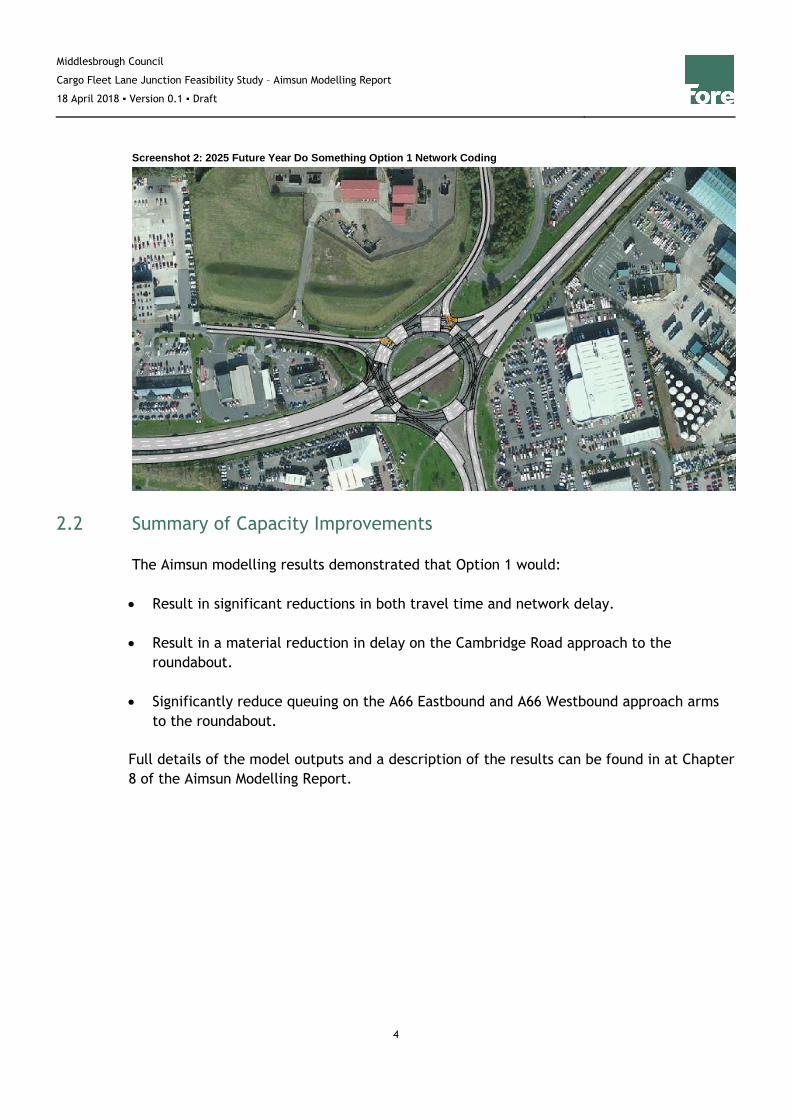
3.2 Existing Layout
The existing junction arrangement takes the form of a normal four-arm roundabout with
dual lane entry and single lane exit across all four arms of the junction. The roundabout
has a kerbed central island of approximately 20m in diameter and a dual lane circulatory
carriageway. Left turn priority-controlled slips are present on both the eastbound and
westbound approach arms.
The Aimsun coding is shown on Screenshot 3, below.
Screenshot 3: Existing Cargo Fleet Lane / South Bank Road Roundabout Network Coding
Middlesbrough Council
Cargo Fleet Lane Junction Feasibility Study – Aimsun Modelling Report
18 April 2018 ▪ Version 0.1 ▪ Draft
6
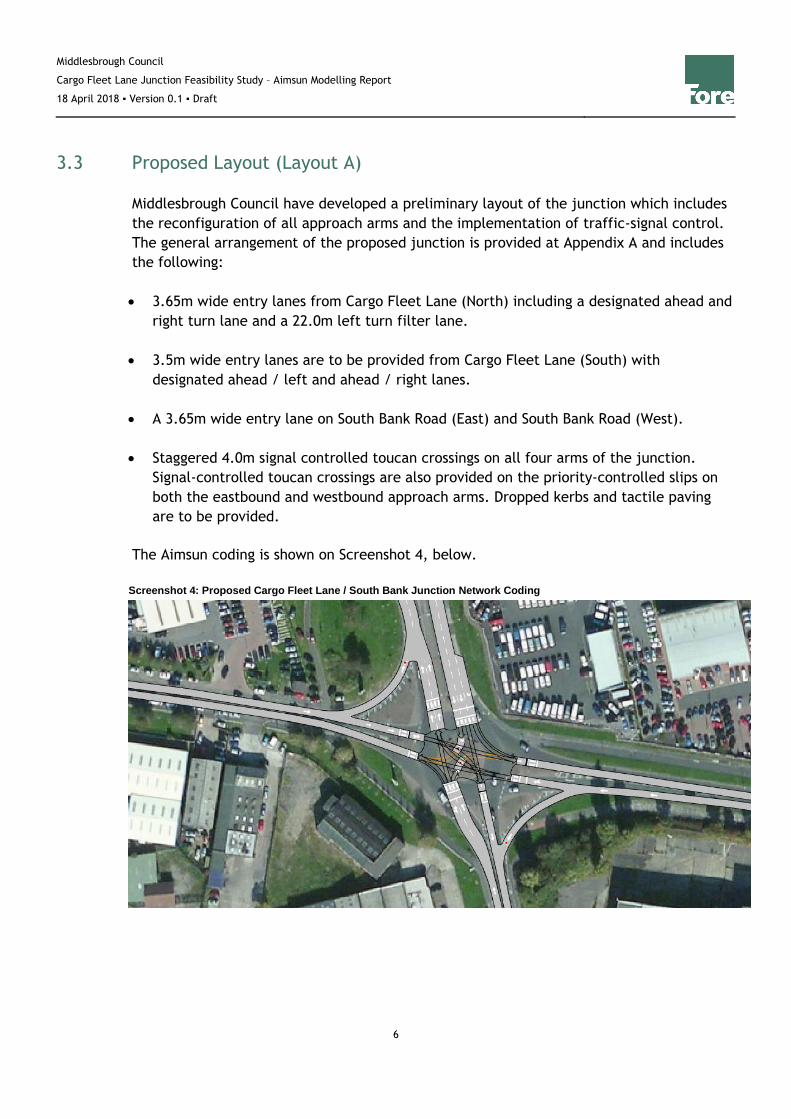
3.3 Proposed Layout (Layout A)
Middlesbrough Council have developed a preliminary layout of the junction which includes
the reconfiguration of all approach arms and the implementation of traffic-signal control.
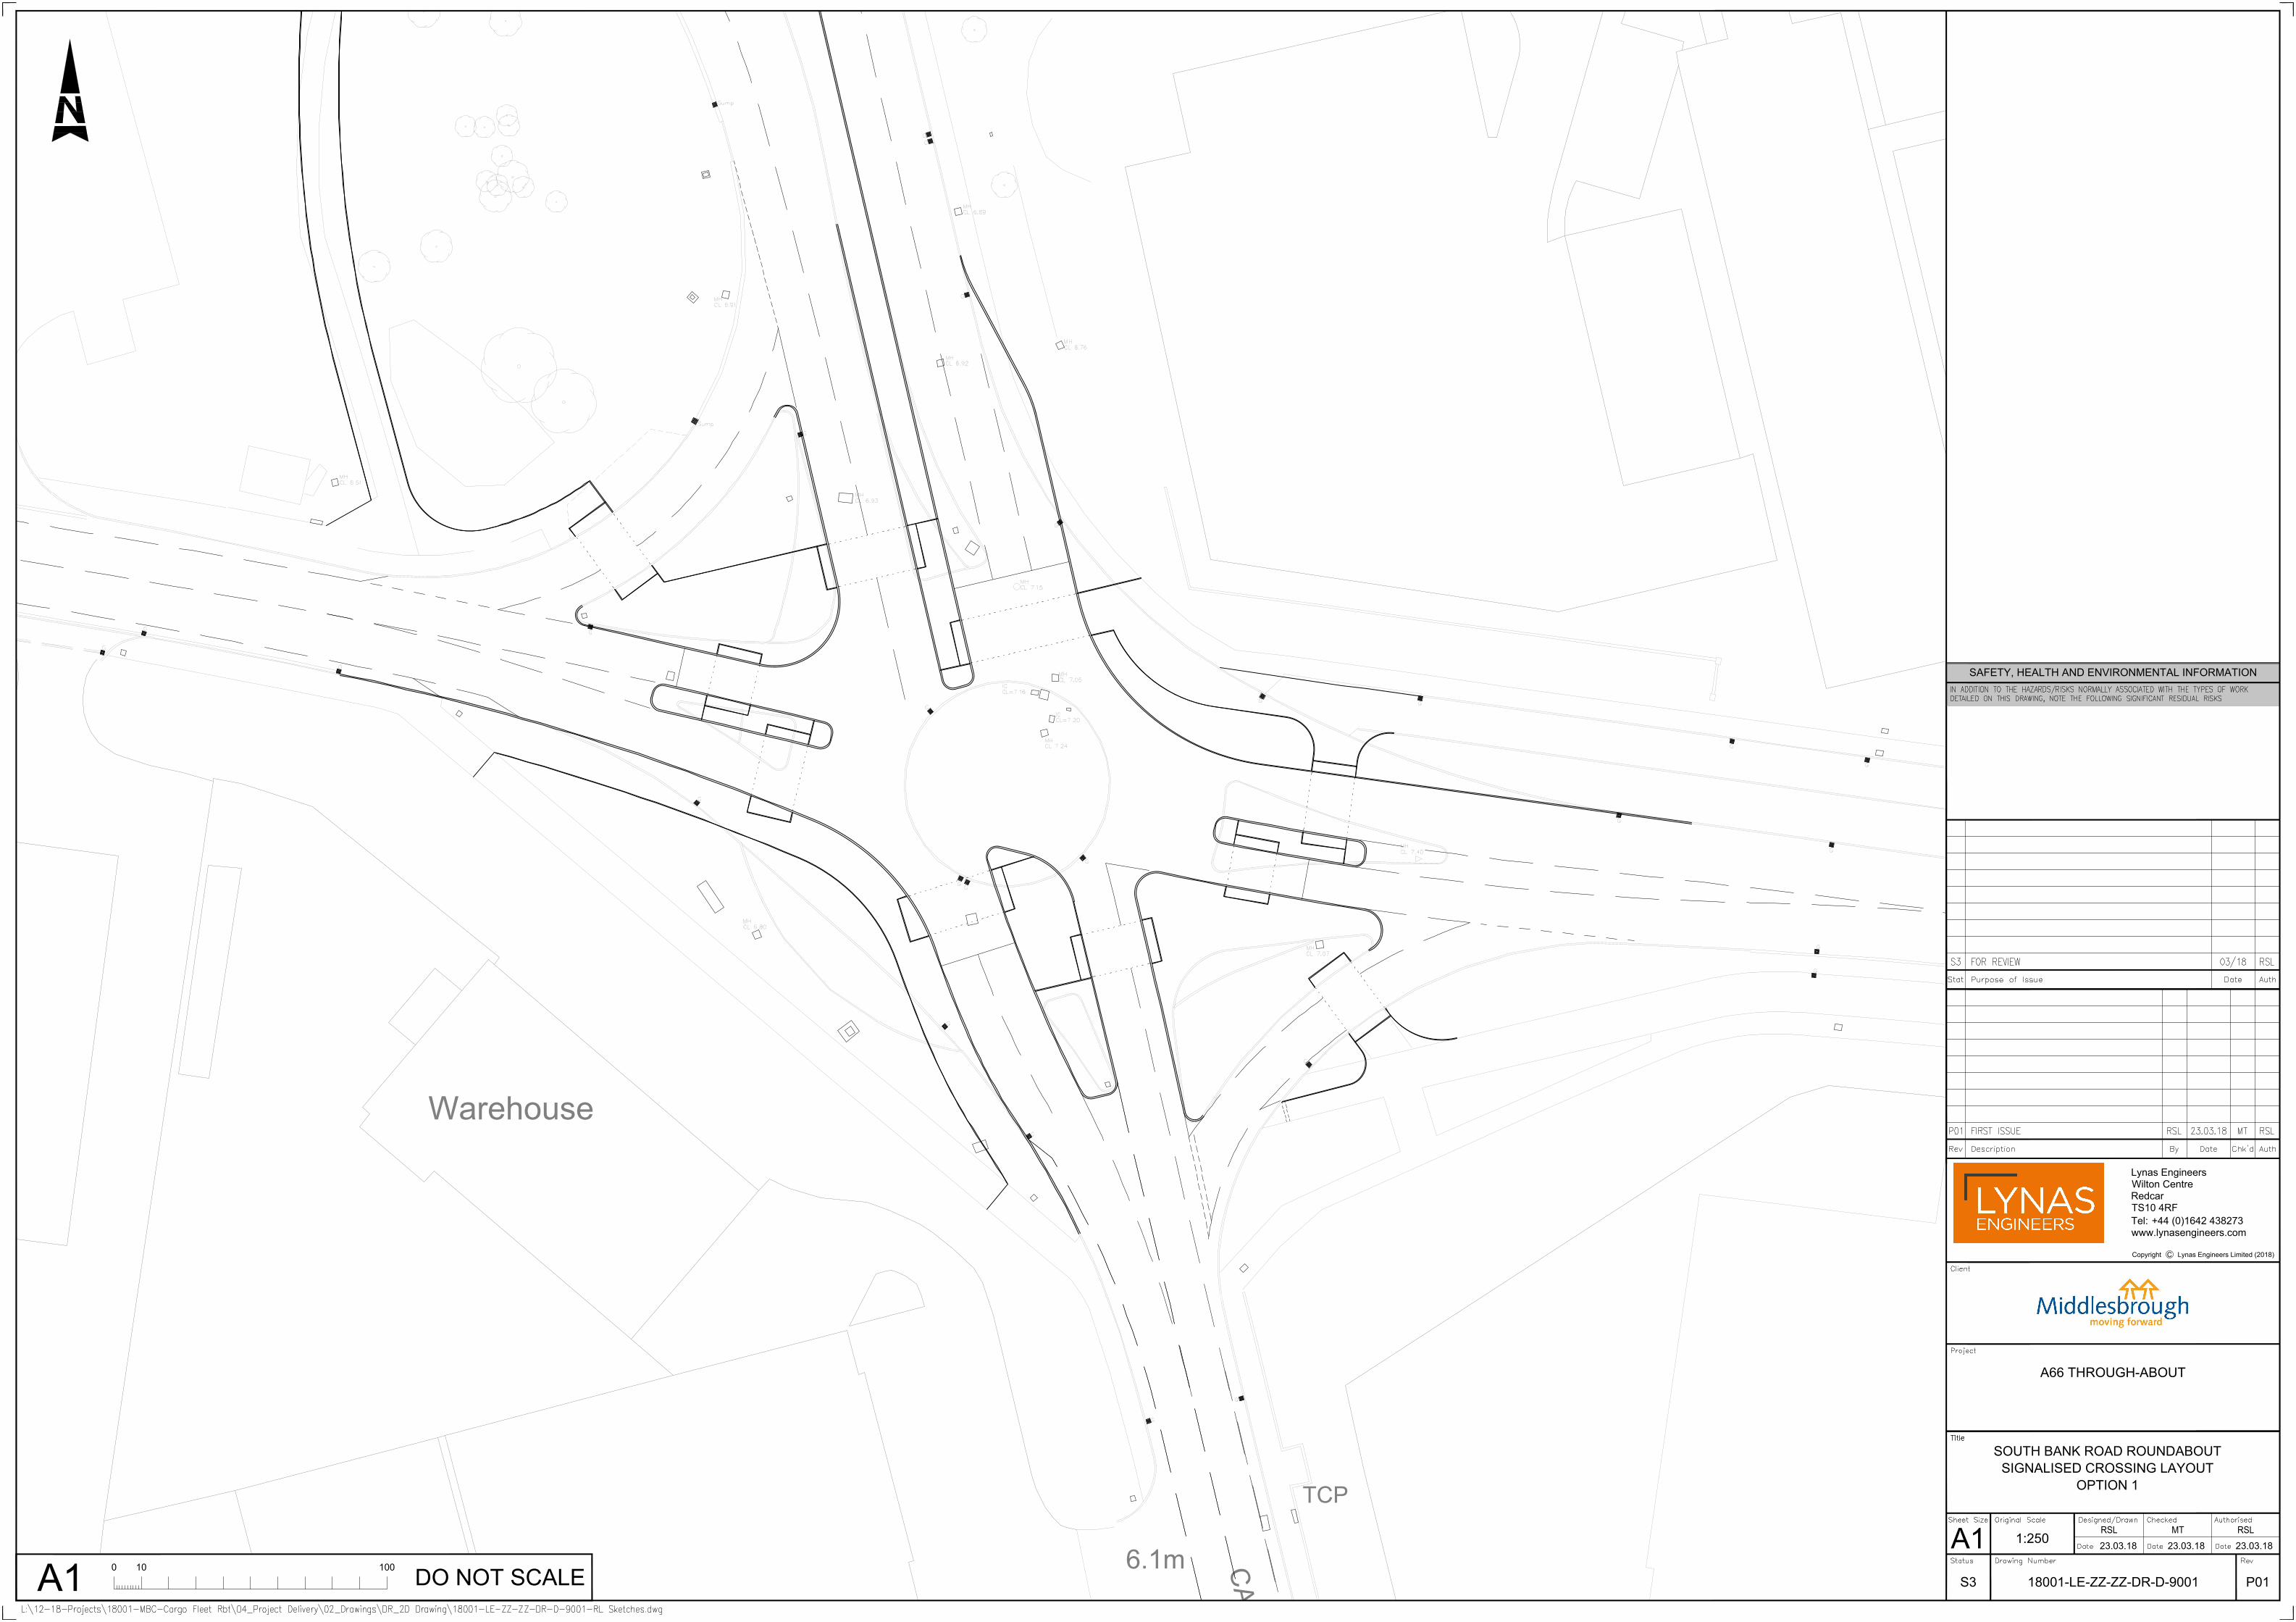
The general arrangement of the proposed junction is provided at Appendix A and includes
the following:
• 3.65m wide entry lanes from Cargo Fleet Lane (North) including a designated ahead and
right turn lane and a 22.0m left turn filter lane.
• 3.5m wide entry lanes are to be provided from Cargo Fleet Lane (South) with
designated ahead / left and ahead / right lanes.
• A 3.65m wide entry lane on South Bank Road (East) and South Bank Road (West).
• Staggered 4.0m signal controlled toucan crossings on all four arms of the junction.
Signal-controlled toucan crossings are also provided on the priority-controlled slips on
both the eastbound and westbound approach arms. Dropped kerbs and tactile paving
are to be provided.
The Aimsun coding is shown on Screenshot 4, below.
Screenshot 4: Proposed Cargo Fleet Lane / South Bank Junction Network Coding
Middlesbrough Council
Cargo Fleet Lane Junction Feasibility Study – Aimsun Modelling Report
18 April 2018 ▪ Version 0.1 ▪ Draft
7
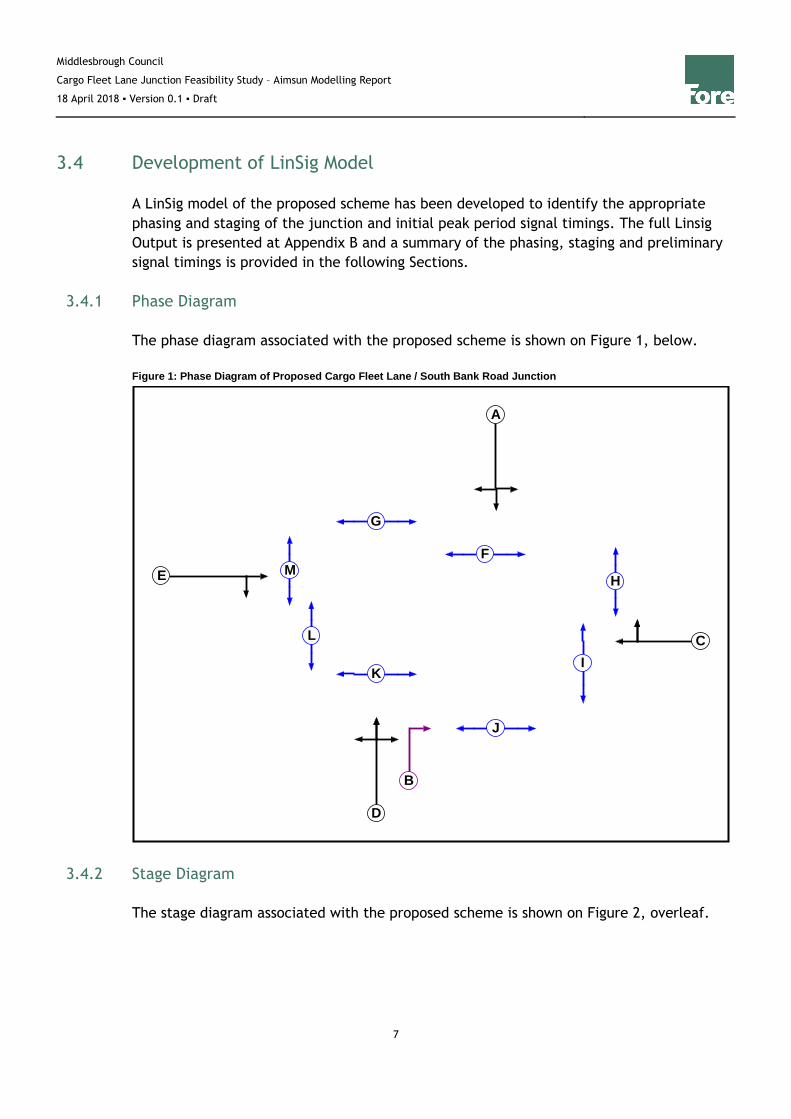
3.4 Development of LinSig Model
A LinSig model of the proposed scheme has been developed to identify the appropriate
phasing and staging of the junction and initial peak period signal timings. The full Linsig
Output is presented at Appendix B and a summary of the phasing, staging and preliminary
signal timings is provided in the following Sections.
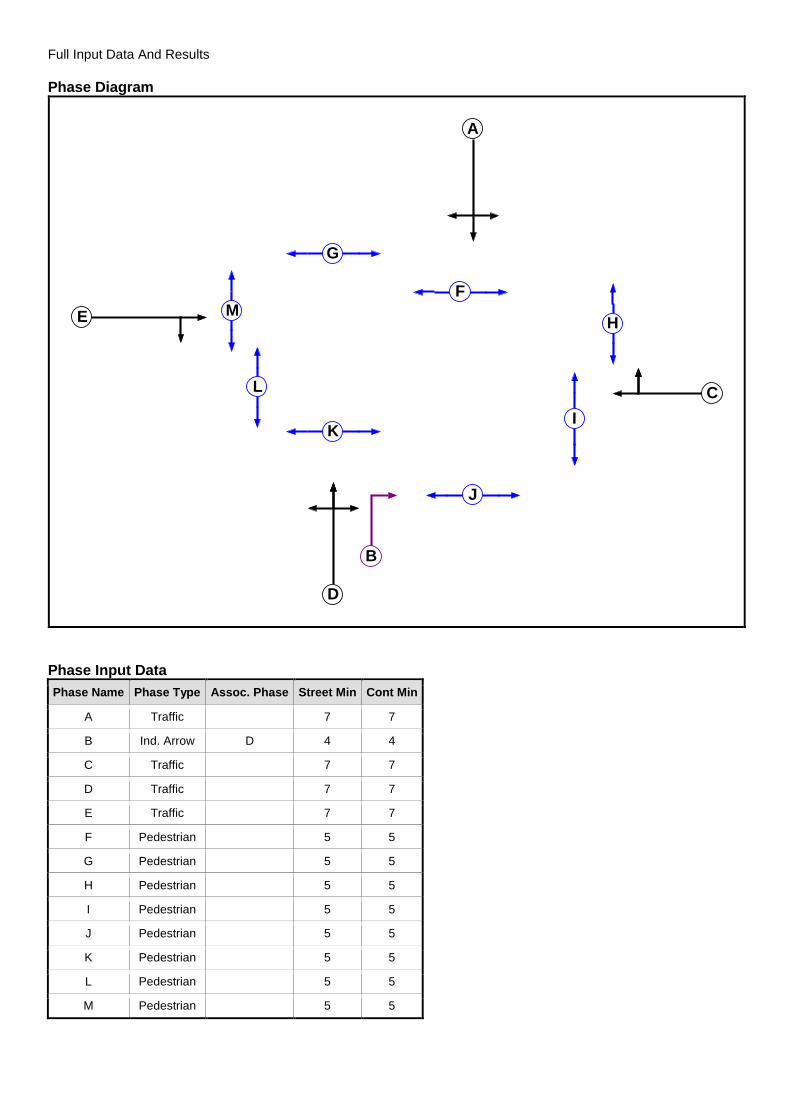
3.4.1 Phase Diagram
The phase diagram associated with the proposed scheme is shown on Figure 1, below.
Figure 1: Phase Diagram of Proposed Cargo Fleet Lane / South Bank Road Junction
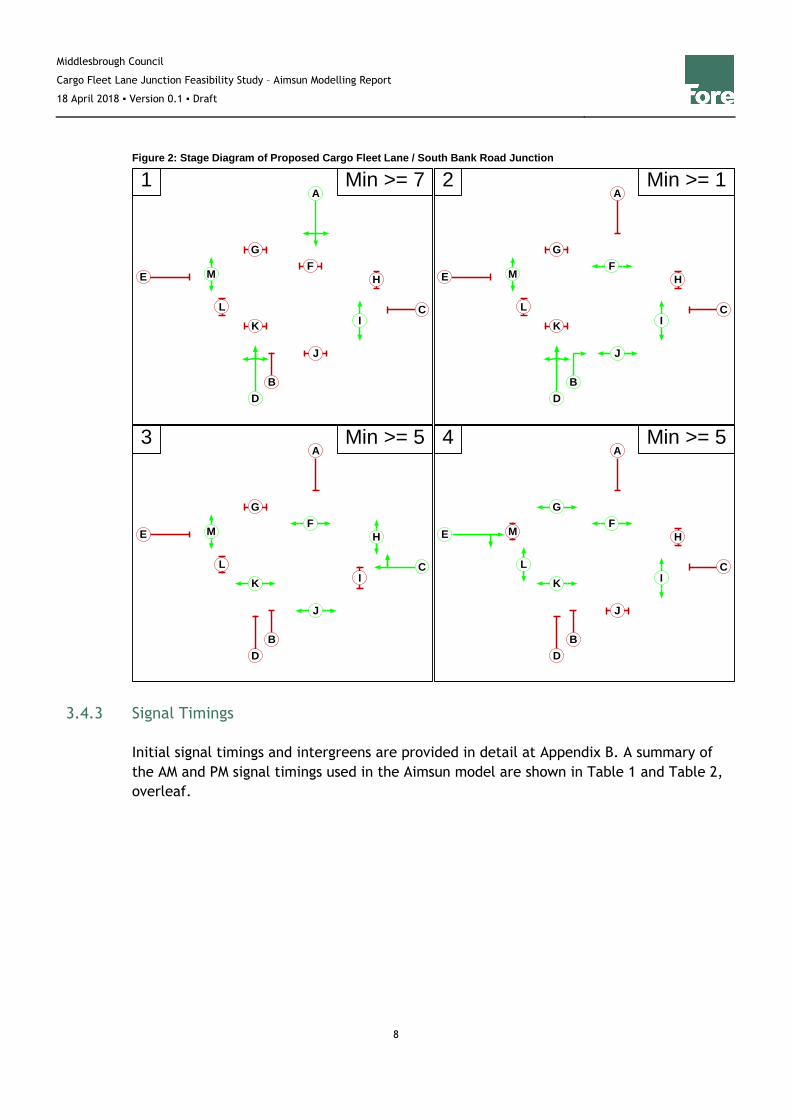
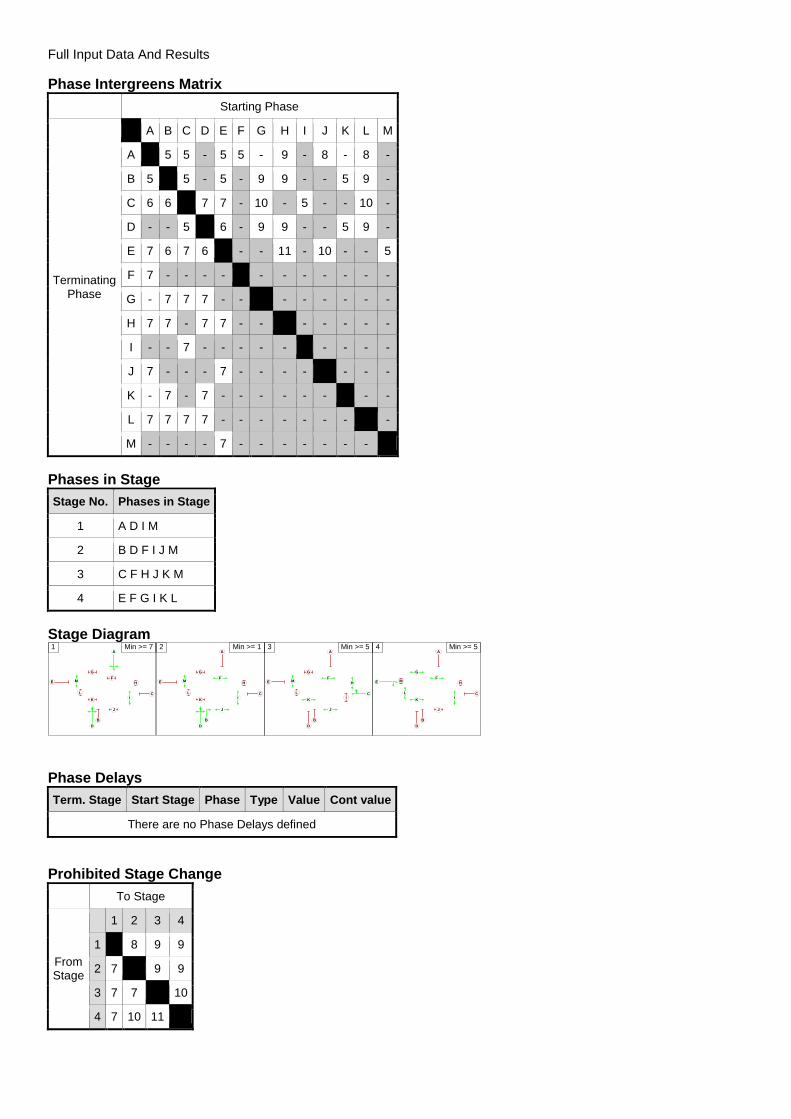
3.4.2 Stage Diagram
The stage diagram associated with the proposed scheme is shown on Figure 2, overleaf.
A
B
C
D
E
F
G
H
I
J
K
L
M
Middlesbrough Council
Cargo Fleet Lane Junction Feasibility Study – Aimsun Modelling Report
18 April 2018 ▪ Version 0.1 ▪ Draft
8
Figure 2: Stage Diagram of Proposed Cargo Fleet Lane / South Bank Road Junction
3.4.3 Signal Timings
Initial signal timings and intergreens are provided in detail at Appendix B. A summary of
the AM and PM signal timings used in the Aimsun model are shown in Table 1 and Table 2,
overleaf.
A
B
C
D
EF
G
H
I
J
K
L
M
1 Min >= 7A
B
C
D
EF
G
H
I
J
K
L
M
2 Min >= 1
A
B
C
D
EF
G
H
I
J
K
L
M
3 Min >= 5A
B
C
D
EF
G
H
I
J
K
L
M
4 Min >= 5
Middlesbrough Council
Cargo Fleet Lane Junction Feasibility Study – Aimsun Modelling Report
18 April 2018 ▪ Version 0.1 ▪ Draft
9
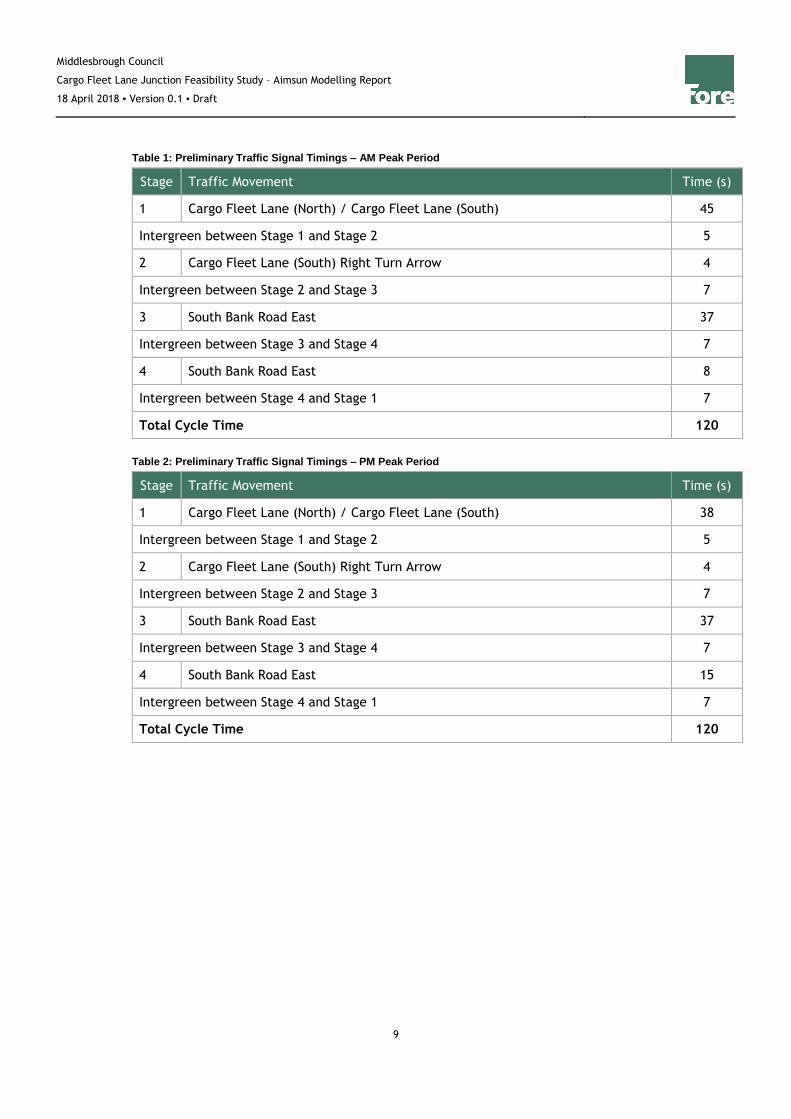
Table 1: Preliminary Traffic Signal Timings – AM Peak Period
Stage Traffic Movement Time (s)
1 Cargo Fleet Lane (North) / Cargo Fleet Lane (South) 45
Intergreen between Stage 1 and Stage 2 5
2 Cargo Fleet Lane (South) Right Turn Arrow 4
Intergreen between Stage 2 and Stage 3 7
3 South Bank Road East 37
Intergreen between Stage 3 and Stage 4 7
4 South Bank Road East 8
Intergreen between Stage 4 and Stage 1 7
Total Cycle Time 120
Table 2: Preliminary Traffic Signal Timings – PM Peak Period
Stage Traffic Movement Time (s)
1 Cargo Fleet Lane (North) / Cargo Fleet Lane (South) 38
Intergreen between Stage 1 and Stage 2 5
2 Cargo Fleet Lane (South) Right Turn Arrow 4
Intergreen between Stage 2 and Stage 3 7
3 South Bank Road East 37
Intergreen between Stage 3 and Stage 4 7
4 South Bank Road East 15
Intergreen between Stage 4 and Stage 1 7
Total Cycle Time 120
Middlesbrough Council
Cargo Fleet Lane Junction Feasibility Study – Aimsun Modelling Report
18 April 2018 ▪ Version 0.1 ▪ Draft
10
4 Aimsun Model Review
4.1 Proposed Layout
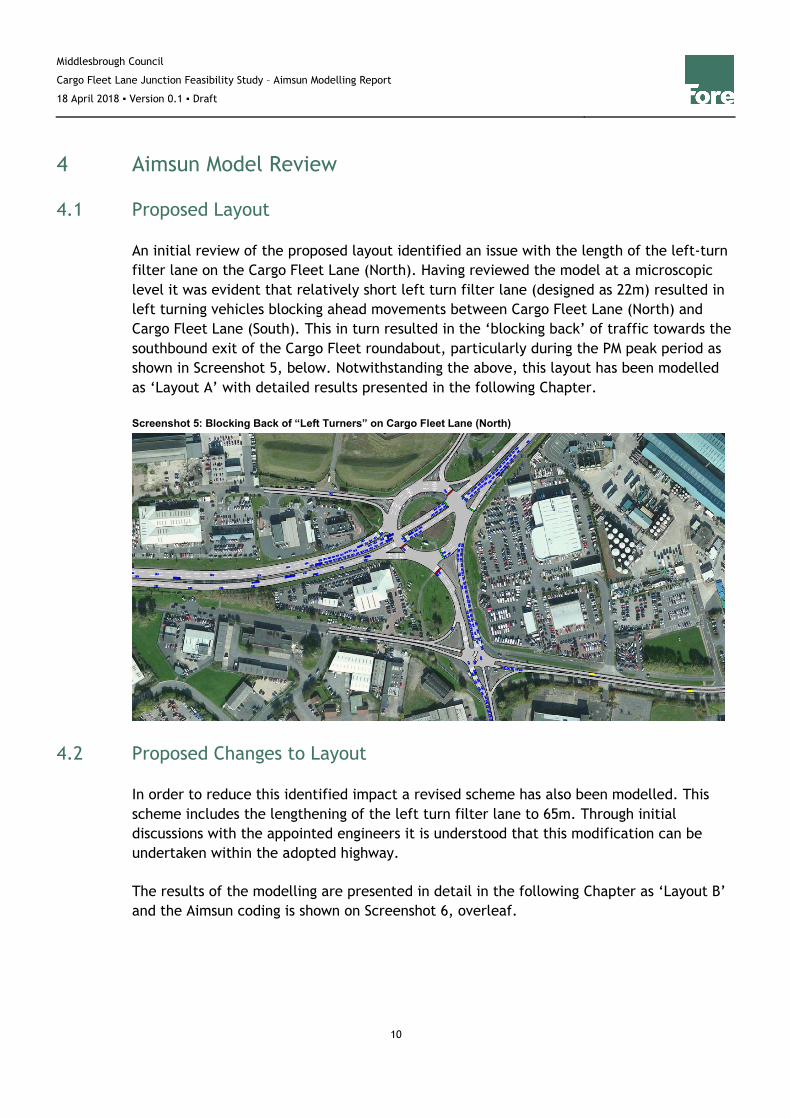
An initial review of the proposed layout identified an issue with the length of the left-turn
filter lane on the Cargo Fleet Lane (North). Having reviewed the model at a microscopic
level it was evident that relatively short left turn filter lane (designed as 22m) resulted in
left turning vehicles blocking ahead movements between Cargo Fleet Lane (North) and
Cargo Fleet Lane (South). This in turn resulted in the ‘blocking back’ of traffic towards the
southbound exit of the Cargo Fleet roundabout, particularly during the PM peak period as
shown in Screenshot 5, below. Notwithstanding the above, this layout has been modelled
as ‘Layout A’ with detailed results presented in the following Chapter.
Screenshot 5: Blocking Back of “Left Turners” on Cargo Fleet Lane (North)
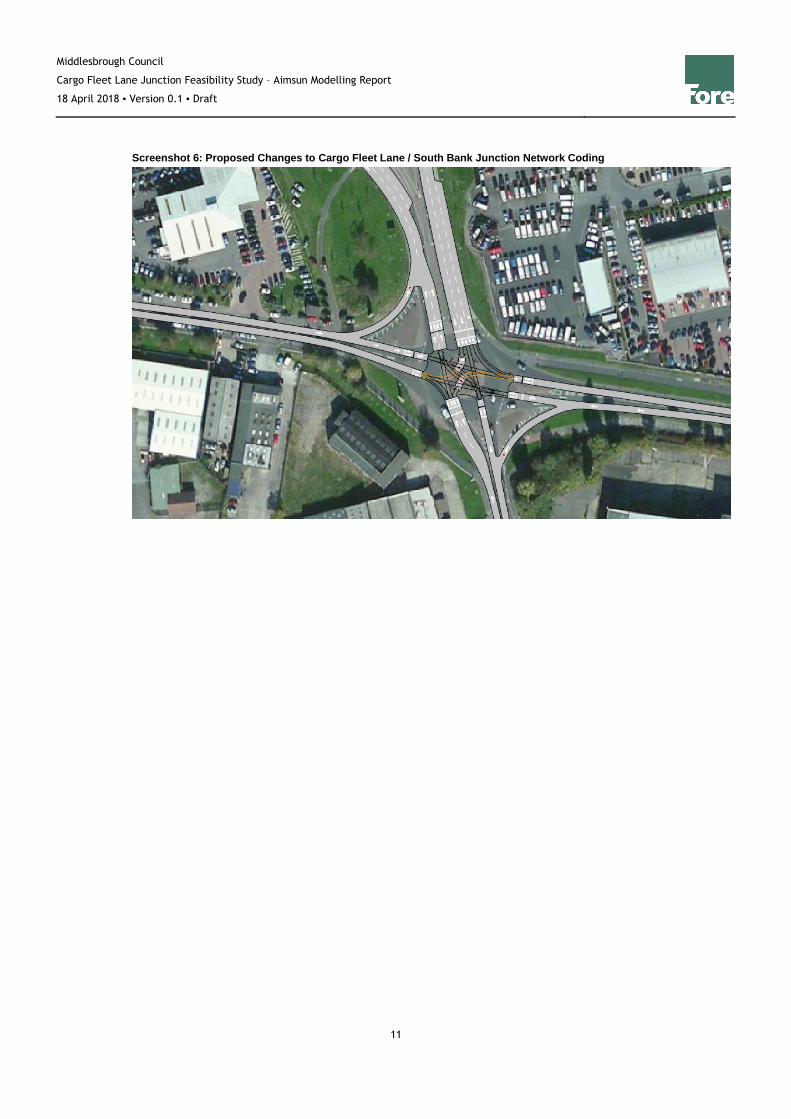
4.2 Proposed Changes to Layout
In order to reduce this identified impact a revised scheme has also been modelled. This
scheme includes the lengthening of the left turn filter lane to 65m. Through initial
discussions with the appointed engineers it is understood that this modification can be
undertaken within the adopted highway.
The results of the modelling are presented in detail in the following Chapter as ‘Layout B’
and the Aimsun coding is shown on Screenshot 6, overleaf.
Middlesbrough Council
Cargo Fleet Lane Junction Feasibility Study – Aimsun Modelling Report
18 April 2018 ▪ Version 0.1 ▪ Draft
11
Screenshot 6: Proposed Changes to Cargo Fleet Lane / South Bank Junction Network Coding
Middlesbrough Council
Cargo Fleet Lane Junction Feasibility Study – Aimsun Modelling Report
18 April 2018 ▪ Version 0.1 ▪ Draft
12
5 Aimsun Model Results
5.1 Introduction
The basis of this modelling assumes that the Option 1 highway mitigation scheme at the
Cargo Fleet Roundabout is delivered and therefore provides statistics for the following
Future Year scenarios:
• 2025 Do Something Option 1: this represents the baseline Future Year scenario
whereby the Cargo Fleet roundabout highway mitigation scheme is delivered in
isolation.
• 2025 Do Something Option 1 & Layout A: this represents a Future Year scenario
whereby the Cargo Fleet roundabout highway mitigation scheme is delivered alongside
the implementation of the signal control (Layout A) at the at the Cargo Fleet Lane /
South Bank Road junction
• 2025 Do Something Option 1 & Layout B: this represents a Future Year scenario
whereby the Cargo Fleet roundabout highway mitigation scheme is delivered alongside
the implementation of the signal control (Layout B) junction at Cargo Fleet Lane /
South Bank Road junction.
2025 Do Minimum (i.e. without the delivery of either junction) statistics are also provided
with regards to the network statistics presented in Section 5.2.
It should be noted that for ease of reference and comparison the statistics presented are
consistent with the previously issued Aimsun Modelling Report.
5.2 Network Statistics
Network statistics provide a strategic overview of the performance of the whole network.
These statistics have been extracted for the modelled network to understand the global
network impacts of each layout. These are presented in Graph 1 to Graph 4 and the
following statistics are reported:
• Travel time - mean time it takes for vehicles to travel through the network in the
modelled time period (unit: s/km);
• Delay time – mean delay incurred by vehicles travelling through the network in the
modelled time period and is calculated as the difference between actual travel time
and free flow travel (unit: s/km);
Middlesbrough Council
Cargo Fleet Lane Junction Feasibility Study – Aimsun Modelling Report
18 April 2018 ▪ Version 0.1 ▪ Draft
13
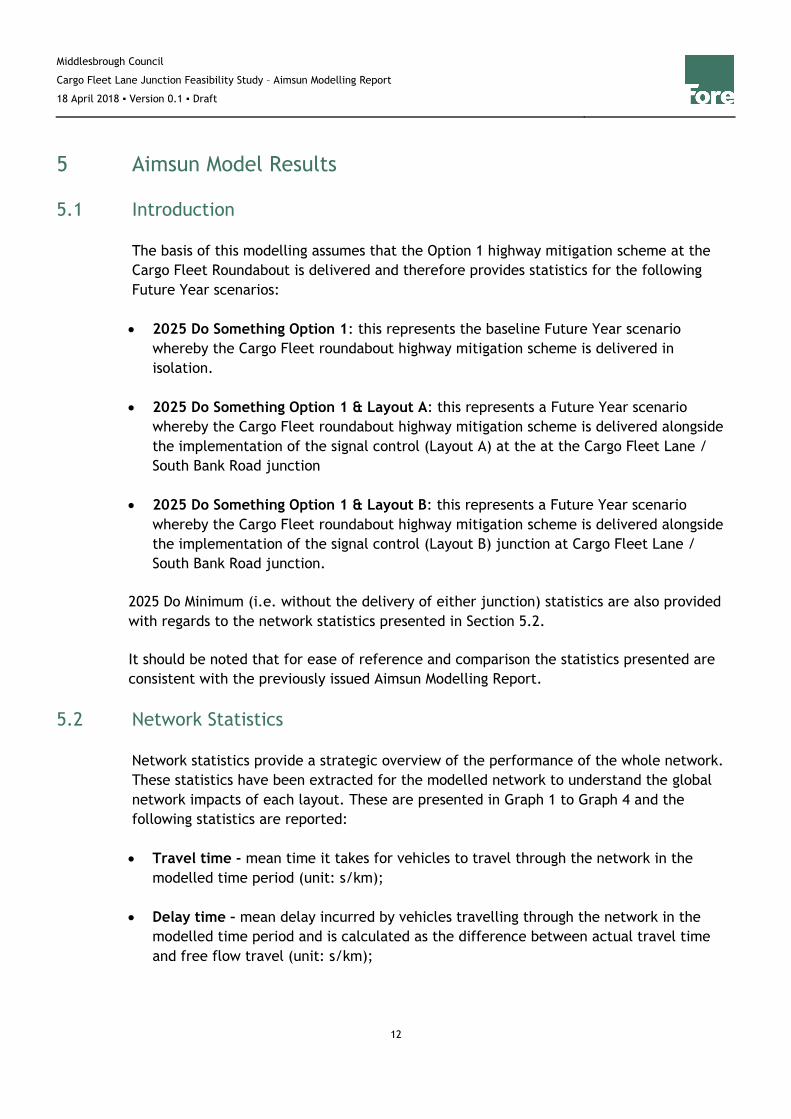
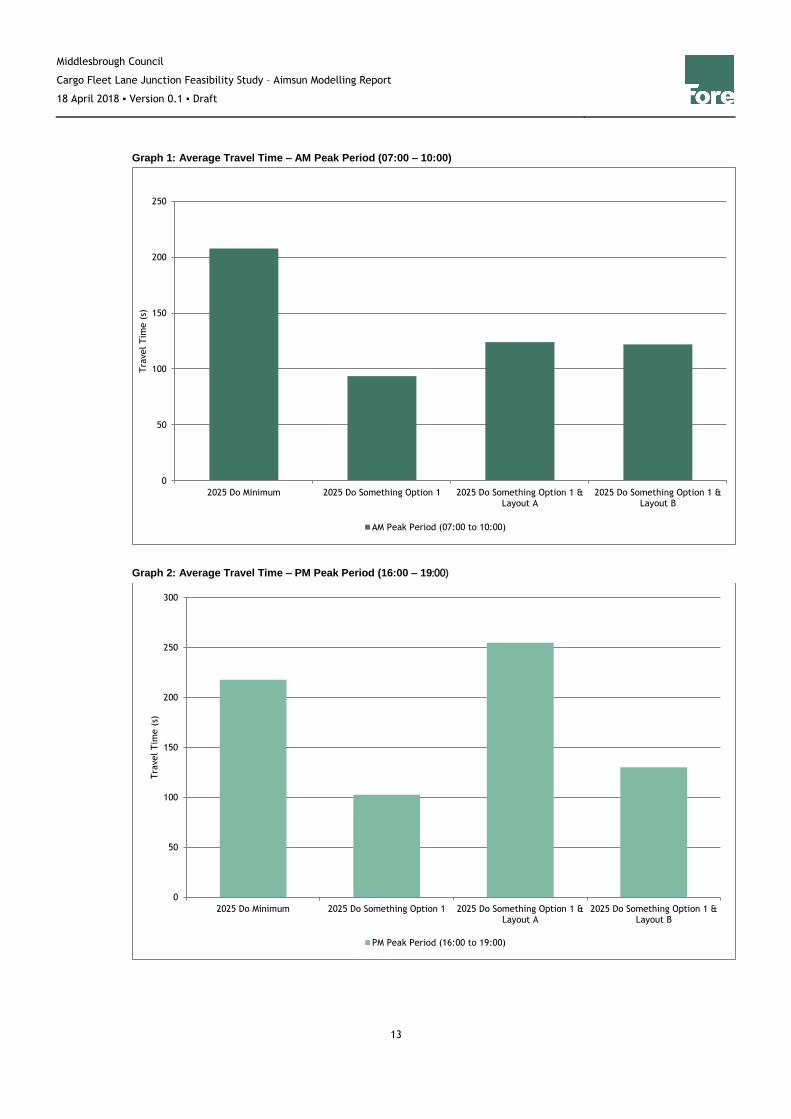
Graph 1: Average Travel Time – AM Peak Period (07:00 – 10:00)
Graph 2: Average Travel Time – PM Peak Period (16:00 – 19:00)
0
50
100
150
200
250
2025 Do Minimum 2025 Do Something Option 1 2025 Do Something Option 1 &Layout A
2025 Do Something Option 1 &Layout B
Tra
vel Tim
e (
s)
AM Peak Period (07:00 to 10:00)
0
50
100
150
200
250
300
2025 Do Minimum 2025 Do Something Option 1 2025 Do Something Option 1 &Layout A
2025 Do Something Option 1 &Layout B
Tra
vel Tim
e (
s)
PM Peak Period (16:00 to 19:00)
Middlesbrough Council
Cargo Fleet Lane Junction Feasibility Study – Aimsun Modelling Report
18 April 2018 ▪ Version 0.1 ▪ Draft
14
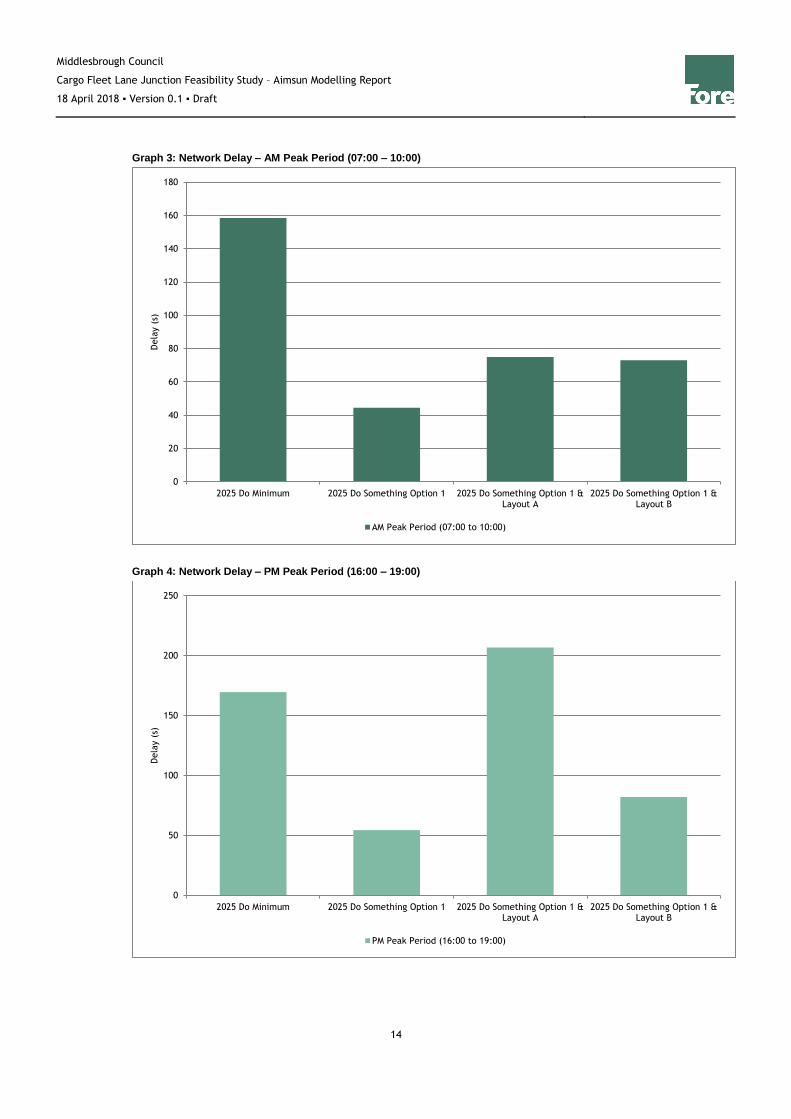
Graph 3: Network Delay – AM Peak Period (07:00 – 10:00)
Graph 4: Network Delay – PM Peak Period (16:00 – 19:00)
0
20
40
60
80
100
120
140
160
180
2025 Do Minimum 2025 Do Something Option 1 2025 Do Something Option 1 &Layout A
2025 Do Something Option 1 &Layout B
Dela
y (
s)
AM Peak Period (07:00 to 10:00)
0
50
100
150
200
250
2025 Do Minimum 2025 Do Something Option 1 2025 Do Something Option 1 &Layout A
2025 Do Something Option 1 &Layout B
Dela
y (
s)
PM Peak Period (16:00 to 19:00)
Middlesbrough Council
Cargo Fleet Lane Junction Feasibility Study – Aimsun Modelling Report
18 April 2018 ▪ Version 0.1 ▪ Draft
15
The graphs indicate that travel time and delay is likely to increase as a result of the
implementation of traffic signal control in both the AM and PM peak periods.
During the AM peak period both layouts would result in similar increases in travel time
across the network when compared against the results of Option 1. Layout A is predicted
to increase the travel time per vehicle by 31s compared with a respective increase of 28s
as a result of Layout B. In terms of delay, corresponding increases of 31s and 29s of delay
per km are predicted as a result of Layout A and Layout B respectively.
When compared against the 2025 Do Minimum scenario (i.e. without the delivery of both
highway schemes) it can be seen that both layouts would result in significant reductions in
terms of travel time and delay.
During the PM peak period both layouts are expected to result in an increase in travel time
when compared against the results of Option 1, with Layout B performing with significantly
less impact. For example, Layout A is predicted to increase the travel time per vehicle by
152s compared with a respective increase of only 28s as a result of Layout B. This trend is
also reflective in terms of delay, whereby Layout A and Layout B are predicted to result in
respective increases of 152s and 27s per km.
When compared against the 2025 Do Minimum scenario (i.e. without the delivery of both
highway schemes) the statistics demonstrate that Layout A would result in considerable
increases in travel time and delay. However, with the lengthened left turn filter lane
associated with Layout B it can be seen that the delivery of both highway schemes would
result in significant reductions in travel time and delay when compared against the
corresponding Do Minimum scenario.
Whilst both layouts are expected to give rise to an increase in travel time and delay on the
network when compared against the results of Option 1 in isolation, the statistics
demonstrate that the delivery of Option 1 and Layout B undoubtedly performs with the
least overall impact and is predicted to provide significant benefits in terms of travel time
and delay when compared against the corresponding 2025 Do Minimum scenario.
5.3 Individual Arm Statistics
The above delay and travel time statistics are only collected for vehicles that have crossed
the network (i.e. entered and exited the network) during the modelled period. As such,
statistics for vehicles that are still in the network, or are in virtual queues waiting to enter
the network, are not represented in the results.
For this reason, it is also important to consider other statistics such the level of queuing in
the model, which is a direct indicator of congestion. A 15-minute extraction period was
Middlesbrough Council
Cargo Fleet Lane Junction Feasibility Study – Aimsun Modelling Report
18 April 2018 ▪ Version 0.1 ▪ Draft
16
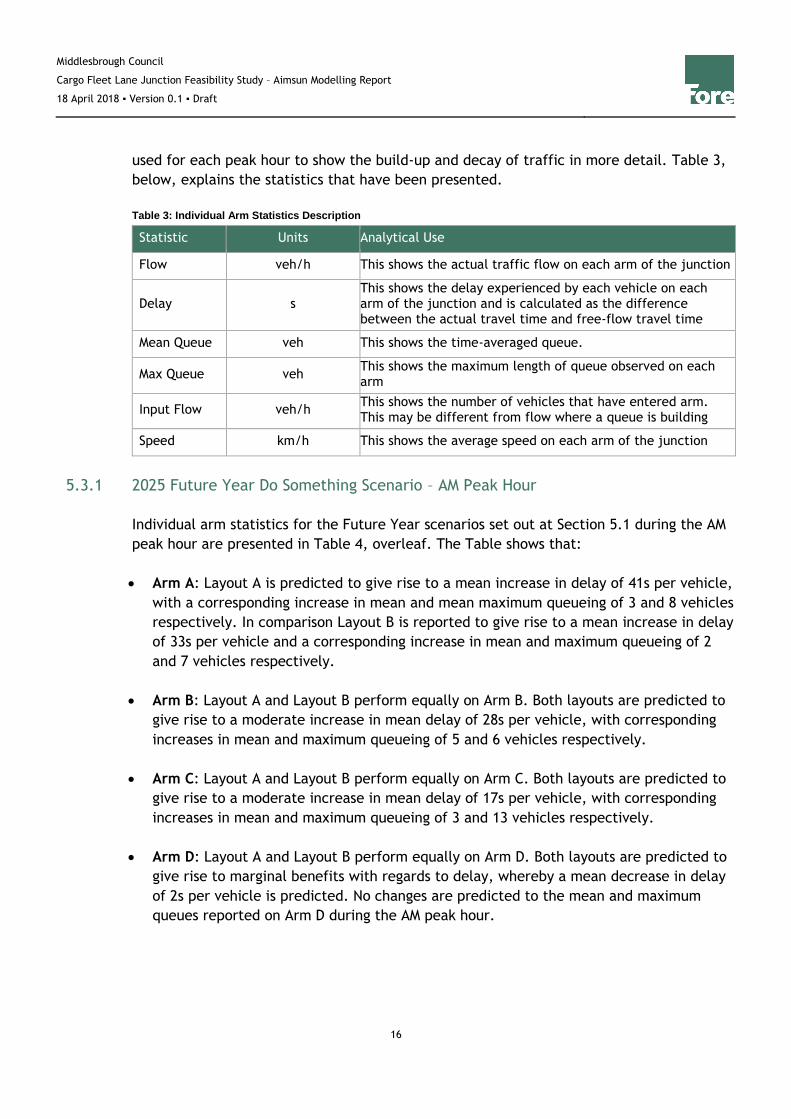
used for each peak hour to show the build-up and decay of traffic in more detail. Table 3,
below, explains the statistics that have been presented.
Table 3: Individual Arm Statistics Description
Statistic Units Analytical Use
Flow veh/h This shows the actual traffic flow on each arm of the junction
Delay s This shows the delay experienced by each vehicle on each arm of the junction and is calculated as the difference between the actual travel time and free-flow travel time
Mean Queue veh This shows the time-averaged queue.
Max Queue veh This shows the maximum length of queue observed on each arm
Input Flow veh/h This shows the number of vehicles that have entered arm. This may be different from flow where a queue is building
Speed km/h This shows the average speed on each arm of the junction
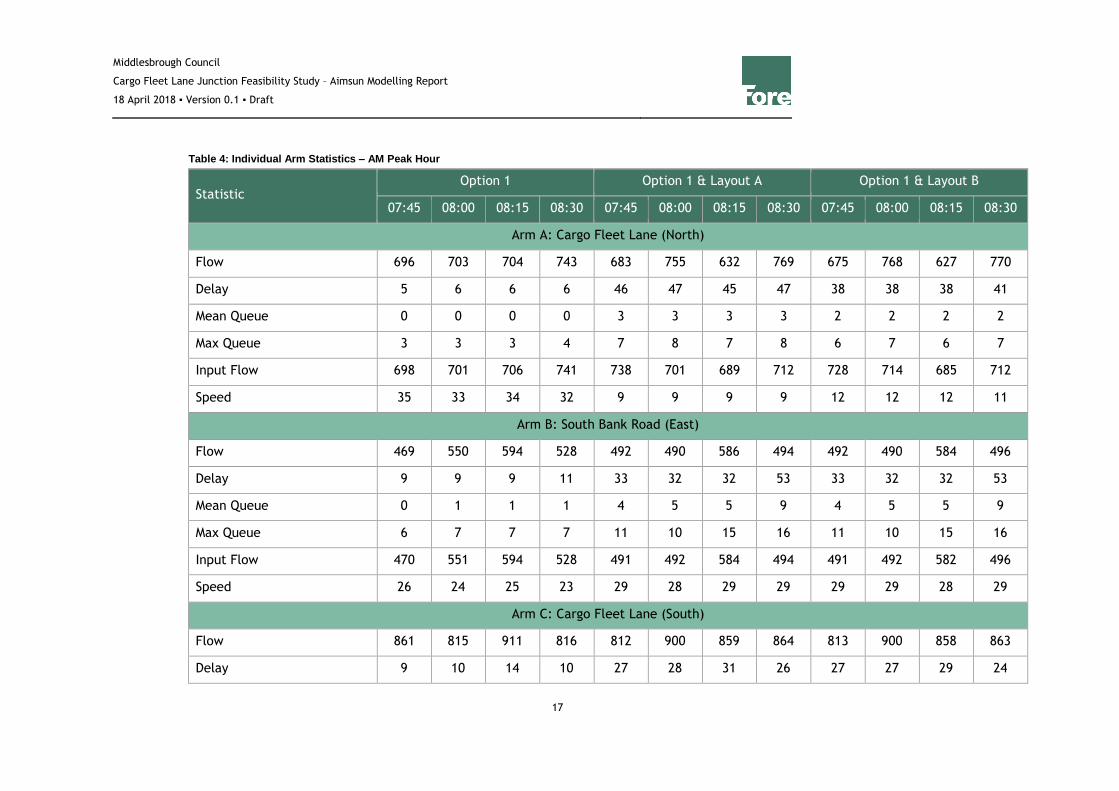
5.3.1 2025 Future Year Do Something Scenario – AM Peak Hour
Individual arm statistics for the Future Year scenarios set out at Section 5.1 during the AM
peak hour are presented in Table 4, overleaf. The Table shows that:
• Arm A: Layout A is predicted to give rise to a mean increase in delay of 41s per vehicle,
with a corresponding increase in mean and mean maximum queueing of 3 and 8 vehicles
respectively. In comparison Layout B is reported to give rise to a mean increase in delay
of 33s per vehicle and a corresponding increase in mean and maximum queueing of 2
and 7 vehicles respectively.
• Arm B: Layout A and Layout B perform equally on Arm B. Both layouts are predicted to
give rise to a moderate increase in mean delay of 28s per vehicle, with corresponding
increases in mean and maximum queueing of 5 and 6 vehicles respectively.
• Arm C: Layout A and Layout B perform equally on Arm C. Both layouts are predicted to
give rise to a moderate increase in mean delay of 17s per vehicle, with corresponding
increases in mean and maximum queueing of 3 and 13 vehicles respectively.
• Arm D: Layout A and Layout B perform equally on Arm D. Both layouts are predicted to
give rise to marginal benefits with regards to delay, whereby a mean decrease in delay
of 2s per vehicle is predicted. No changes are predicted to the mean and maximum
queues reported on Arm D during the AM peak hour.
Middlesbrough Council
Cargo Fleet Lane Junction Feasibility Study – Aimsun Modelling Report
18 April 2018 ▪ Version 0.1 ▪ Draft
17
Table 4: Individual Arm Statistics – AM Peak Hour
Statistic Option 1 Option 1 & Layout A Option 1 & Layout B
07:45 08:00 08:15 08:30 07:45 08:00 08:15 08:30 07:45 08:00 08:15 08:30
Arm A: Cargo Fleet Lane (North)
Flow 696 703 704 743 683 755 632 769 675 768 627 770
Delay 5 6 6 6 46 47 45 47 38 38 38 41
Mean Queue 0 0 0 0 3 3 3 3 2 2 2 2
Max Queue 3 3 3 4 7 8 7 8 6 7 6 7
Input Flow 698 701 706 741 738 701 689 712 728 714 685 712
Speed 35 33 34 32 9 9 9 9 12 12 12 11
Arm B: South Bank Road (East)
Flow 469 550 594 528 492 490 586 494 492 490 584 496
Delay 9 9 9 11 33 32 32 53 33 32 32 53
Mean Queue 0 1 1 1 4 5 5 9 4 5 5 9
Max Queue 6 7 7 7 11 10 15 16 11 10 15 16
Input Flow 470 551 594 528 491 492 584 494 491 492 582 496
Speed 26 24 25 23 29 28 29 29 29 29 28 29
Arm C: Cargo Fleet Lane (South)
Flow 861 815 911 816 812 900 859 864 813 900 858 863
Delay 9 10 14 10 27 28 31 26 27 27 29 24

Middlesbrough Council
Cargo Fleet Lane Junction Feasibility Study – Aimsun Modelling Report
18 April 2018 ▪ Version 0.1 ▪ Draft
18
Statistic Option 1 Option 1 & Layout A Option 1 & Layout B
07:45 08:00 08:15 08:30 07:45 08:00 08:15 08:30 07:45 08:00 08:15 08:30
Mean Queue 1 1 2 1 4 4 5 3 4 4 5 3
Max Queue 6 7 11 6 20 20 22 20 20 19 22 20
Input Flow 867 819 914 811 838 876 882 840 840 874 882 840
Speed 12 12 9 12 30 28 29 28 30 28 30 29
Arm D: South Bank Road (West)
Flow 21 84 73 91 15 77 74 96 15 77 74 96
Delay 16 20 28 19 3 18 34 43 3 17 34 43
Mean Queue 0 0 0 0 0 0 0 1 0 0 0 1
Max Queue 0 3 2 3 0 3 3 4 0 3 3 4
Input Flow 21 84 72 91 15 77 74 97 15 77 74 97
Speed 10 11 9 12 24 20 15 14 24 20 15 14
Middlesbrough Council
Cargo Fleet Lane Junction Feasibility Study – Aimsun Modelling Report
18 April 2018 ▪ Version 0.1 ▪ Draft
19
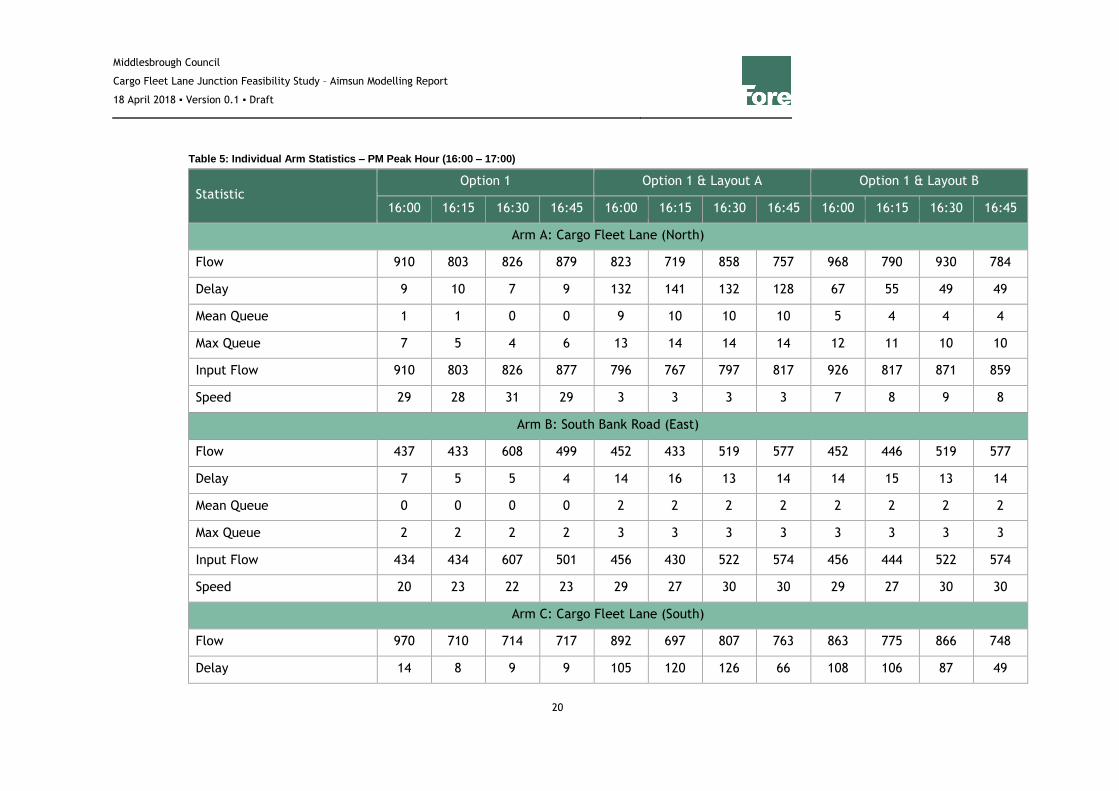
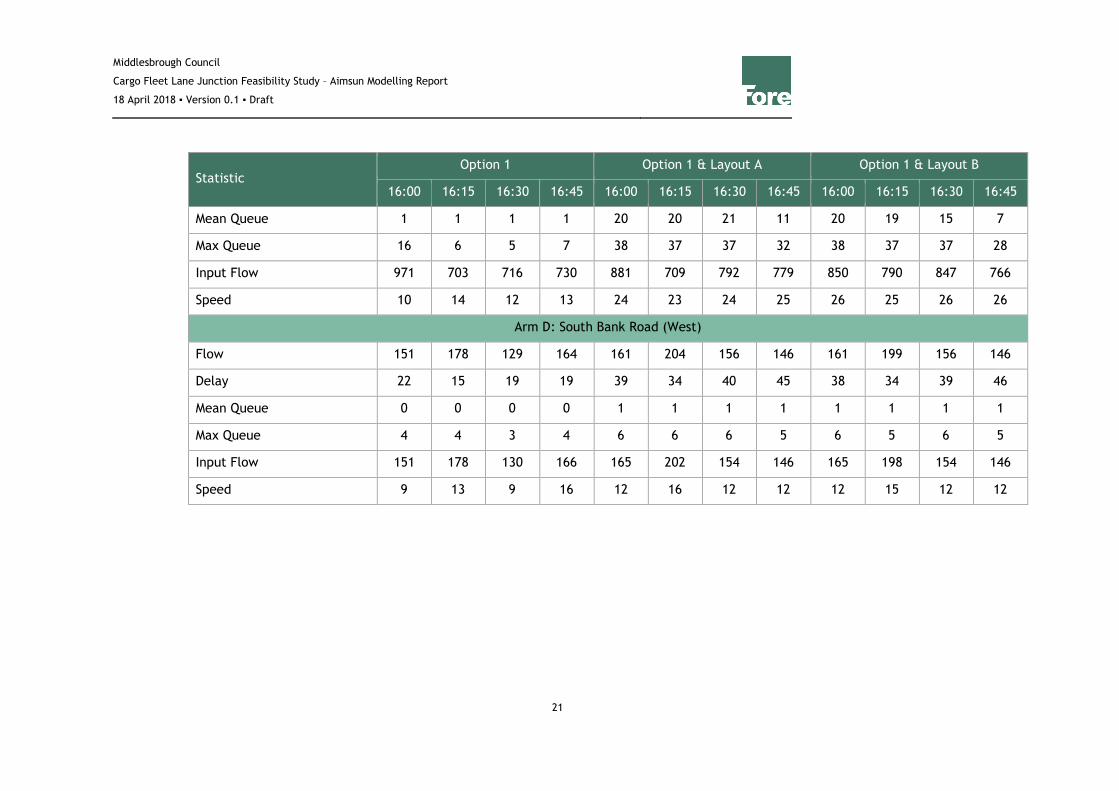
5.3.2 2025 Future Year Do Something Scenario – PM Peak Hour
Individual arm statistics for the Future Year scenarios set out at Section 5.1 during the PM
peak hour are presented in Table 5, overleaf. The Table shows that:
• Arm A: Layout A is predicted to give rise to a mean increase in delay of 124s per
vehicle, with a corresponding increase in mean and mean maximum queues of 9 and 8
vehicles respectively. In comparison Layout B is reported to give rise to a more
moderate mean increase in delay of 46s per vehicle, with a corresponding increase in
mean and maximum queues of 3 and 5 vehicles respectively.
• Arm B: Layout A and Layout B perform equally on Arm B. Both layouts are predicted to
give rise to a moderate increase in mean delay of 9s per vehicle, with corresponding
increases in mean and maximum queueing of 2 and 1 vehicles respectively.
• Arm C: Layout A is predicted to give rise to a mean increase in delay of 94s per vehicle
on Arm C, with a corresponding increase in mean and maximum queues of 17 and 27
vehicles respectively. Layout B, however, is reported to give rise to a mean increase in
delay of 78s per vehicle, with a corresponding increase in mean and maximum queues
of 14 and 26 vehicles respectively.
• Arm D: Layout A and Layout B perform equally on Arm D. Both layouts are predicted to
give rise to a mean increase in delay of 21s per vehicle, with a corresponding increase
in mean and maximum queues of 1 and 2 vehicles respectively.
Middlesbrough Council
Cargo Fleet Lane Junction Feasibility Study – Aimsun Modelling Report
18 April 2018 ▪ Version 0.1 ▪ Draft
20
Table 5: Individual Arm Statistics – PM Peak Hour (16:00 – 17:00)
Statistic Option 1 Option 1 & Layout A Option 1 & Layout B
16:00 16:15 16:30 16:45 16:00 16:15 16:30 16:45 16:00 16:15 16:30 16:45
Arm A: Cargo Fleet Lane (North)
Flow 910 803 826 879 823 719 858 757 968 790 930 784
Delay 9 10 7 9 132 141 132 128 67 55 49 49
Mean Queue 1 1 0 0 9 10 10 10 5 4 4 4
Max Queue 7 5 4 6 13 14 14 14 12 11 10 10
Input Flow 910 803 826 877 796 767 797 817 926 817 871 859
Speed 29 28 31 29 3 3 3 3 7 8 9 8
Arm B: South Bank Road (East)
Flow 437 433 608 499 452 433 519 577 452 446 519 577
Delay 7 5 5 4 14 16 13 14 14 15 13 14
Mean Queue 0 0 0 0 2 2 2 2 2 2 2 2
Max Queue 2 2 2 2 3 3 3 3 3 3 3 3
Input Flow 434 434 607 501 456 430 522 574 456 444 522 574
Speed 20 23 22 23 29 27 30 30 29 27 30 30
Arm C: Cargo Fleet Lane (South)
Flow 970 710 714 717 892 697 807 763 863 775 866 748
Delay 14 8 9 9 105 120 126 66 108 106 87 49
Middlesbrough Council
Cargo Fleet Lane Junction Feasibility Study – Aimsun Modelling Report
18 April 2018 ▪ Version 0.1 ▪ Draft
21
Statistic Option 1 Option 1 & Layout A Option 1 & Layout B
16:00 16:15 16:30 16:45 16:00 16:15 16:30 16:45 16:00 16:15 16:30 16:45
Mean Queue 1 1 1 1 20 20 21 11 20 19 15 7
Max Queue 16 6 5 7 38 37 37 32 38 37 37 28
Input Flow 971 703 716 730 881 709 792 779 850 790 847 766
Speed 10 14 12 13 24 23 24 25 26 25 26 26
Arm D: South Bank Road (West)
Flow 151 178 129 164 161 204 156 146 161 199 156 146
Delay 22 15 19 19 39 34 40 45 38 34 39 46
Mean Queue 0 0 0 0 1 1 1 1 1 1 1 1
Max Queue 4 4 3 4 6 6 6 5 6 5 6 5
Input Flow 151 178 130 166 165 202 154 146 165 198 154 146
Speed 9 13 9 16 12 16 12 12 12 15 12 12
Middlesbrough Council
Cargo Fleet Lane Junction Feasibility Study – Aimsun Modelling Report
18 April 2018 ▪ Version 0.1 ▪ Draft
22
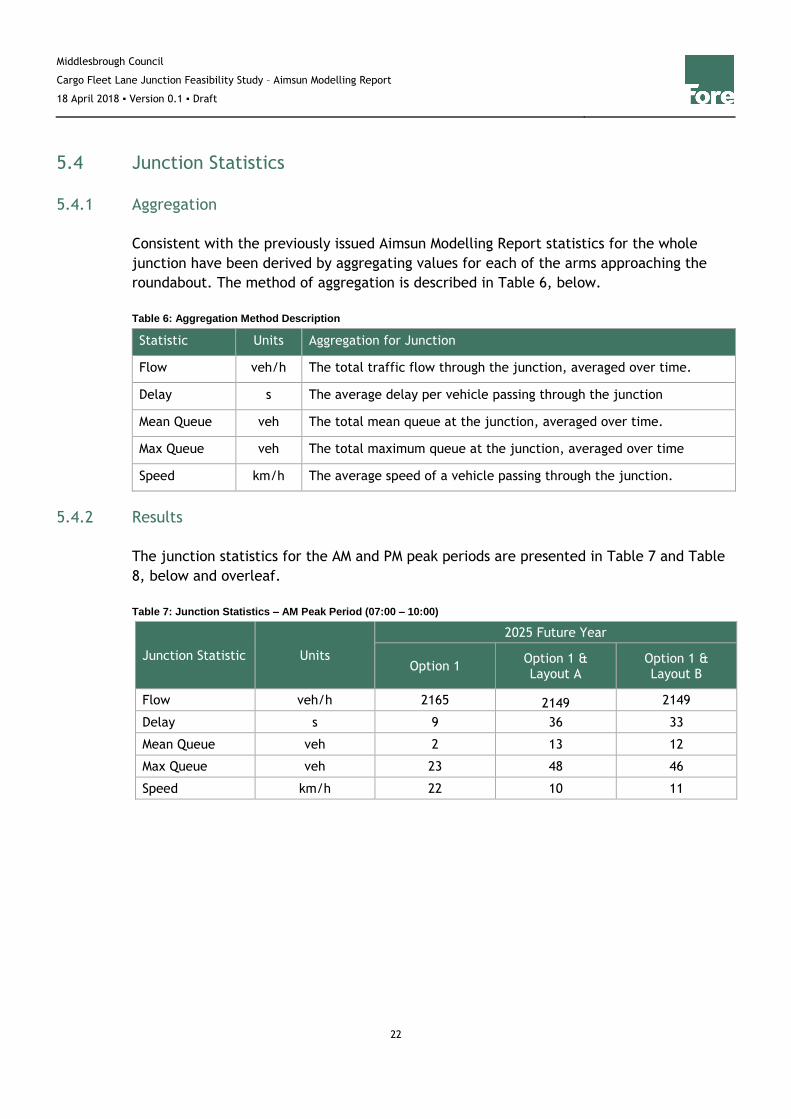
5.4 Junction Statistics
5.4.1 Aggregation
Consistent with the previously issued Aimsun Modelling Report statistics for the whole
junction have been derived by aggregating values for each of the arms approaching the
roundabout. The method of aggregation is described in Table 6, below.
Table 6: Aggregation Method Description
Statistic Units Aggregation for Junction
Flow veh/h The total traffic flow through the junction, averaged over time.
Delay s The average delay per vehicle passing through the junction
Mean Queue veh The total mean queue at the junction, averaged over time.
Max Queue veh The total maximum queue at the junction, averaged over time
Speed km/h The average speed of a vehicle passing through the junction.
5.4.2 Results
The junction statistics for the AM and PM peak periods are presented in Table 7 and Table
8, below and overleaf.
Table 7: Junction Statistics – AM Peak Period (07:00 – 10:00)
Junction Statistic Units
2025 Future Year
Option 1 Option 1 & Layout A
Option 1 & Layout B
Flow veh/h 2165 2149 2149
Delay s 9 36 33
Mean Queue veh 2 13 12
Max Queue veh 23 48 46
Speed km/h 22 10 11
Middlesbrough Council
Cargo Fleet Lane Junction Feasibility Study – Aimsun Modelling Report
18 April 2018 ▪ Version 0.1 ▪ Draft
23
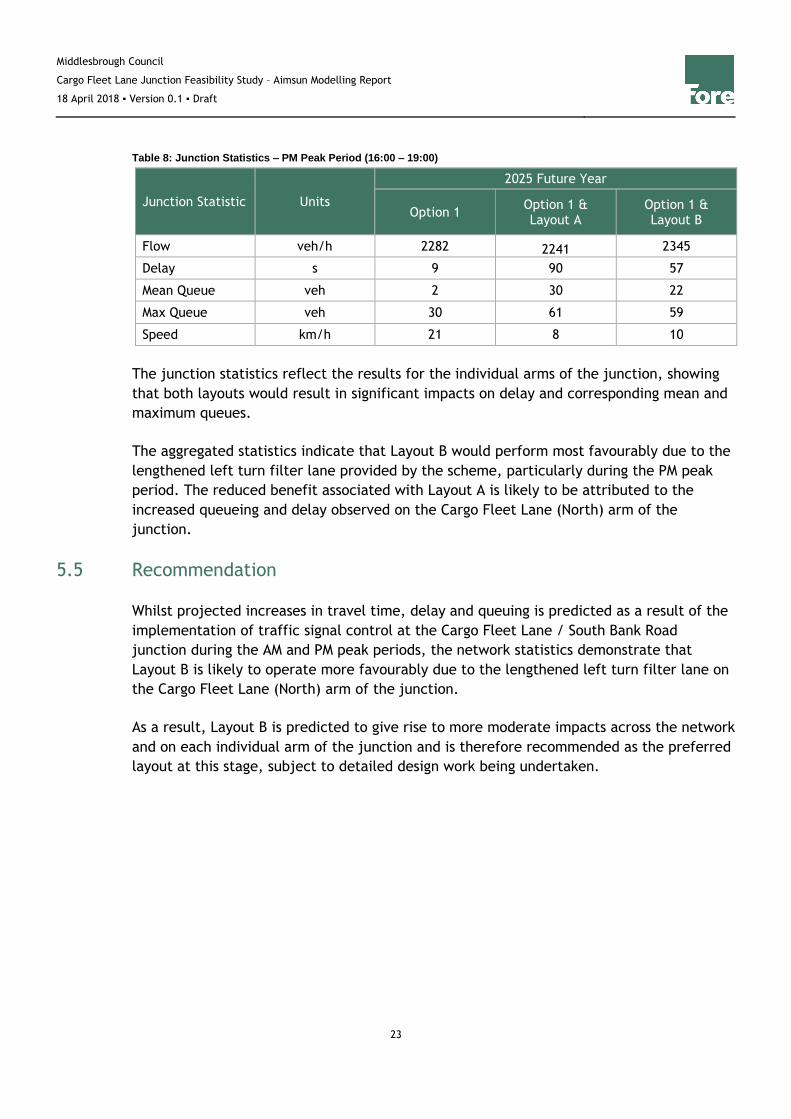
Table 8: Junction Statistics – PM Peak Period (16:00 – 19:00)
Junction Statistic Units
2025 Future Year
Option 1 Option 1 & Layout A
Option 1 & Layout B
Flow veh/h 2282 2241 2345
Delay s 9 90 57
Mean Queue veh 2 30 22
Max Queue veh 30 61 59
Speed km/h 21 8 10
The junction statistics reflect the results for the individual arms of the junction, showing
that both layouts would result in significant impacts on delay and corresponding mean and
maximum queues.
The aggregated statistics indicate that Layout B would perform most favourably due to the
lengthened left turn filter lane provided by the scheme, particularly during the PM peak
period. The reduced benefit associated with Layout A is likely to be attributed to the
increased queueing and delay observed on the Cargo Fleet Lane (North) arm of the
junction.
5.5 Recommendation
Whilst projected increases in travel time, delay and queuing is predicted as a result of the
implementation of traffic signal control at the Cargo Fleet Lane / South Bank Road
junction during the AM and PM peak periods, the network statistics demonstrate that
Layout B is likely to operate more favourably due to the lengthened left turn filter lane on
the Cargo Fleet Lane (North) arm of the junction.
As a result, Layout B is predicted to give rise to more moderate impacts across the network
and on each individual arm of the junction and is therefore recommended as the preferred
layout at this stage, subject to detailed design work being undertaken.
Middlesbrough Council
Cargo Fleet Lane Junction Feasibility Study – Aimsun Modelling Report
18 April 2018 ▪ Version 0.1 ▪ Draft
24
6 Summary and Conclusions
6.1 Introduction
Fore Consulting Limited (Fore) has been appointed by Middlesbrough Council
(Middlesbrough Council) to undertake microsimulation modelling of proposals for the
reconfiguration and implementation of signal control at the Cargo Fleet Lane / South Bank
Road roundabout in Middlesbrough, in order to provide a signal-controlled crossing facility
for National Cycle Route 1 which runs along South Bank Road. The modelling will help
inform the design of the proposals and confirm whether they would operate satisfactorily.
6.2 Future Year Scenarios
The basis of this modelling assumes that the Option 1 highway mitigation scheme at the
Cargo Fleet Roundabout is delivered and therefore provides statistics for the Following
Future Year scenarios:
• 2025 Do Something Option 1: this represents the baseline Future Year scenario
whereby the Cargo Fleet Roundabout highway mitigation scheme is delivered in
isolation.
• 2025 Do Something Option 1 & Layout A: this represents a Future Year scenario
whereby the Cargo Fleet Roundabout highway mitigation scheme is delivered
alongside the implementation of the signal control (Layout A) at the at the Cargo
Fleet Lane / South Bank Road junction
• 2025 Do Something Option 1 & Layout B: this represents a Future Year scenario
whereby the Cargo Fleet Roundabout highway mitigation scheme is delivered
alongside the implementation of the signal control (Layout B) junction at Cargo Fleet
Lane / South Bank Road junction.
It should be noted that for ease of reference and comparison the statistics presented are
consistent with the previously issued Aimsun Modelling Report.
6.3 Future Year Modelling
Statistics have been extracted for individual arms and also for the junction as a whole.
The statistics show that whilst projected increases in travel time, delay and queuing is
predicted as a result of the implementation of traffic signal control at the Cargo Fleet
Lane / South Bank Road junction, Layout B is likely to operate more favourably due to the
lengthened left turn filter lane on the Cargo Fleet Lane (North) arm of the junction.
Appendix A
General Arrangement of Proposed Cargo Fleet Lane / South Bank Road Junction
C
A
R
G
O
F
L
E
E
T
L
A
N
E
TCP
6.1m
Warehouse
A66 THROUGH-ABOUT
SOUTH BANK ROAD ROUNDABOUT
SIGNALISED CROSSING LAYOUT
OPTION 1
1:250
RSL
23.03.18
MT
23.03.18
RSL
23.03.18
S3 18001-LE-ZZ-ZZ-DR-D-9001 P01
A1
A1
100
DO NOT SCALE
100
SAFETY, HEALTH AND ENVIRONMENTAL INFORMATION
Lynas Engineers
Wilton Centre
Redcar
TS10 4RF
www.lynasengineers.com
Tel: +44 (0)1642 438273
Copyright C Lynas Engineers Limited (2018)

Appendix B
LinSig Output (Layout A)
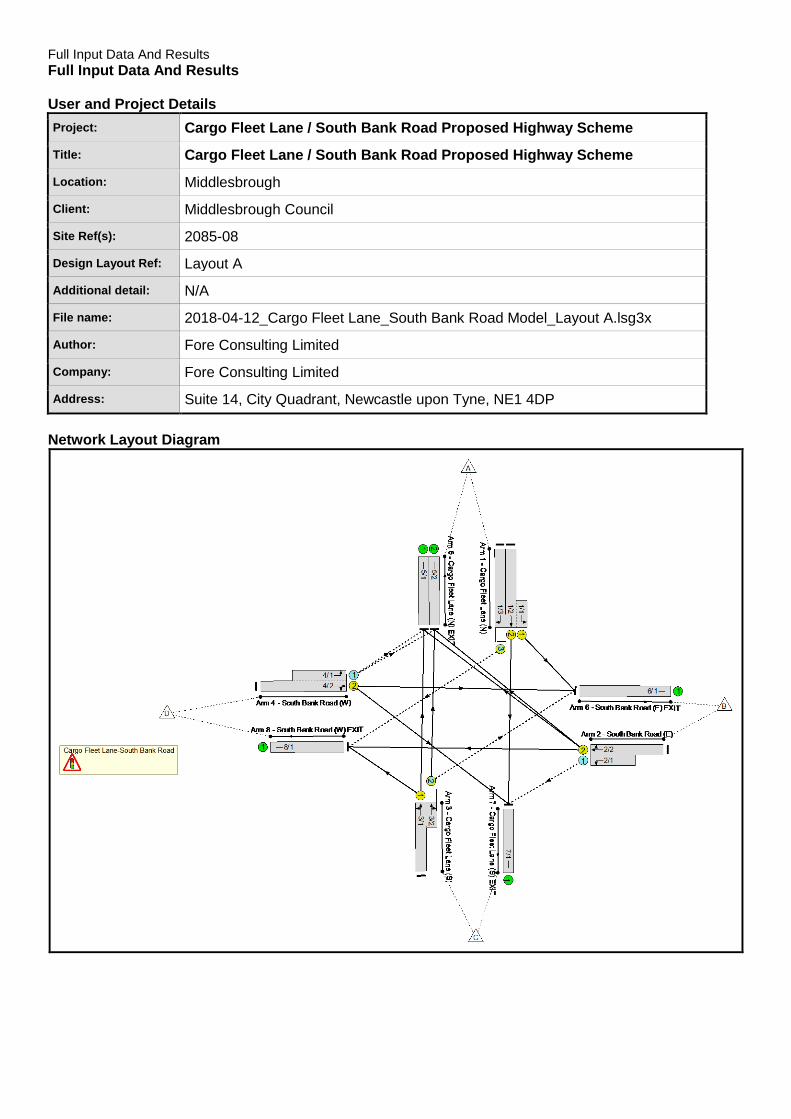
Full Input Data And Results
Full Input Data And Results User and Project Details
Project: Cargo Fleet Lane / South Bank Road Proposed Highway Scheme
Title: Cargo Fleet Lane / South Bank Road Proposed Highway Scheme
Location: Middlesbrough
Client: Middlesbrough Council
Site Ref(s): 2085-08
Design Layout Ref: Layout A
Additional detail: N/A
File name: 2018-04-12_Cargo Fleet Lane_South Bank Road Model_Layout A.lsg3x
Author: Fore Consulting Limited
Company: Fore Consulting Limited
Address: Suite 14, City Quadrant, Newcastle upon Tyne, NE1 4DP
Network Layout Diagram
Full Input Data And Results
Phase Diagram
A
B
C
D
E
F
G
H
I
J
K
L
M
Phase Input Data
Phase Name Phase Type Assoc. Phase Street Min Cont Min
A Traffic 7 7
B Ind. Arrow D 4 4
C Traffic 7 7
D Traffic 7 7
E Traffic 7 7
F Pedestrian 5 5
G Pedestrian 5 5
H Pedestrian 5 5
I Pedestrian 5 5
J Pedestrian 5 5
K Pedestrian 5 5
L Pedestrian 5 5
M Pedestrian 5 5
Full Input Data And Results
Phase Intergreens Matrix
Starting Phase
Terminating Phase
A B C D E F G H I J K L M
A - 5 5 - 5 5 - 9 - 8 - 8 -
B 5 - 5 - 5 - 9 9 - - 5 9 -
C 6 6 - 7 7 - 10 - 5 - - 10 -
D - - 5 - 6 - 9 9 - - 5 9 -
E 7 6 7 6 - - - 11 - 10 - - 5
F 7 - - - - - - - - - - - -
G - 7 7 7 - - - - - - - - -
H 7 7 - 7 7 - - - - - - - -
I - - 7 - - - - - - - - - -
J 7 - - - 7 - - - - - - - -
K - 7 - 7 - - - - - - - - -
L 7 7 7 7 - - - - - - - - -
M - - - - 7 - - - - - - - -
Phases in Stage
Stage No. Phases in Stage
1 A D I M
2 B D F I J M
3 C F H J K M
4 E F G I K L
Stage Diagram A
B
C
D
EF
G
H
I
J
K
L
M
1 Min >= 7A
B
C
D
EF
G
H
I
J
K
L
M
2 Min >= 1A
B
C
D
EF
G
H
I
J
K
L
M
3 Min >= 5A
B
C
D
EF
G
H
I
J
K
L
M
4 Min >= 5
Phase Delays
Term. Stage Start Stage Phase Type Value Cont value
There are no Phase Delays defined
Prohibited Stage Change
To Stage
From Stage
1 2 3 4
1 8 9 9
2 7 9 9
3 7 7 10
4 7 10 11
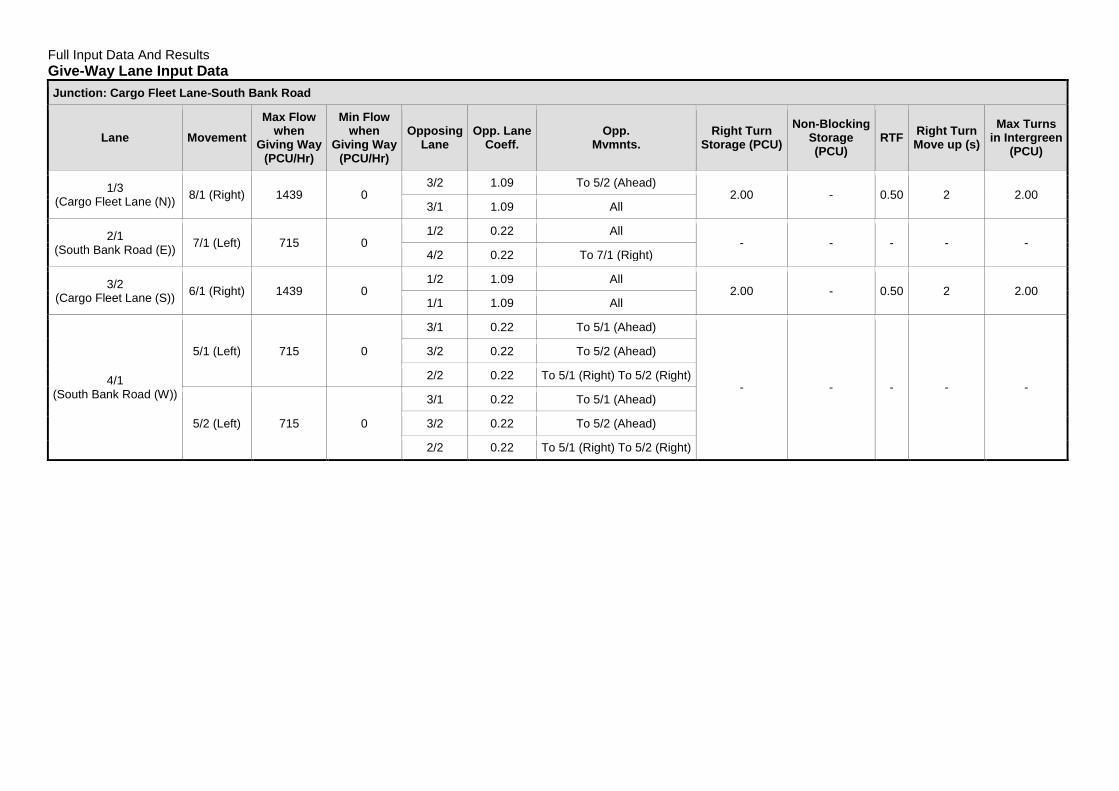
Full Input Data And Results
Give-Way Lane Input Data
Junction: Cargo Fleet Lane-South Bank Road
Lane Movement
Max Flow when
Giving Way (PCU/Hr)
Min Flow when
Giving Way (PCU/Hr)
Opposing Lane
Opp. Lane Coeff.
Opp. Mvmnts.
Right Turn Storage (PCU)
Non-Blocking Storage (PCU)
RTF Right Turn Move up (s)
Max Turns in Intergreen
(PCU)
1/3 (Cargo Fleet Lane (N))
8/1 (Right) 1439 0 3/2 1.09 To 5/2 (Ahead)
2.00 - 0.50 2 2.00 3/1 1.09 All
2/1 (South Bank Road (E))
7/1 (Left) 715 0 1/2 0.22 All
- - - - - 4/2 0.22 To 7/1 (Right)
3/2 (Cargo Fleet Lane (S))
6/1 (Right) 1439 0 1/2 1.09 All
2.00 - 0.50 2 2.00 1/1 1.09 All
4/1 (South Bank Road (W))
5/1 (Left) 715 0
3/1 0.22 To 5/1 (Ahead)
- - - - -
3/2 0.22 To 5/2 (Ahead)
2/2 0.22 To 5/1 (Right) To 5/2 (Right)
5/2 (Left) 715 0
3/1 0.22 To 5/1 (Ahead)
3/2 0.22 To 5/2 (Ahead)
2/2 0.22 To 5/1 (Right) To 5/2 (Right)
Full Input Data And Results
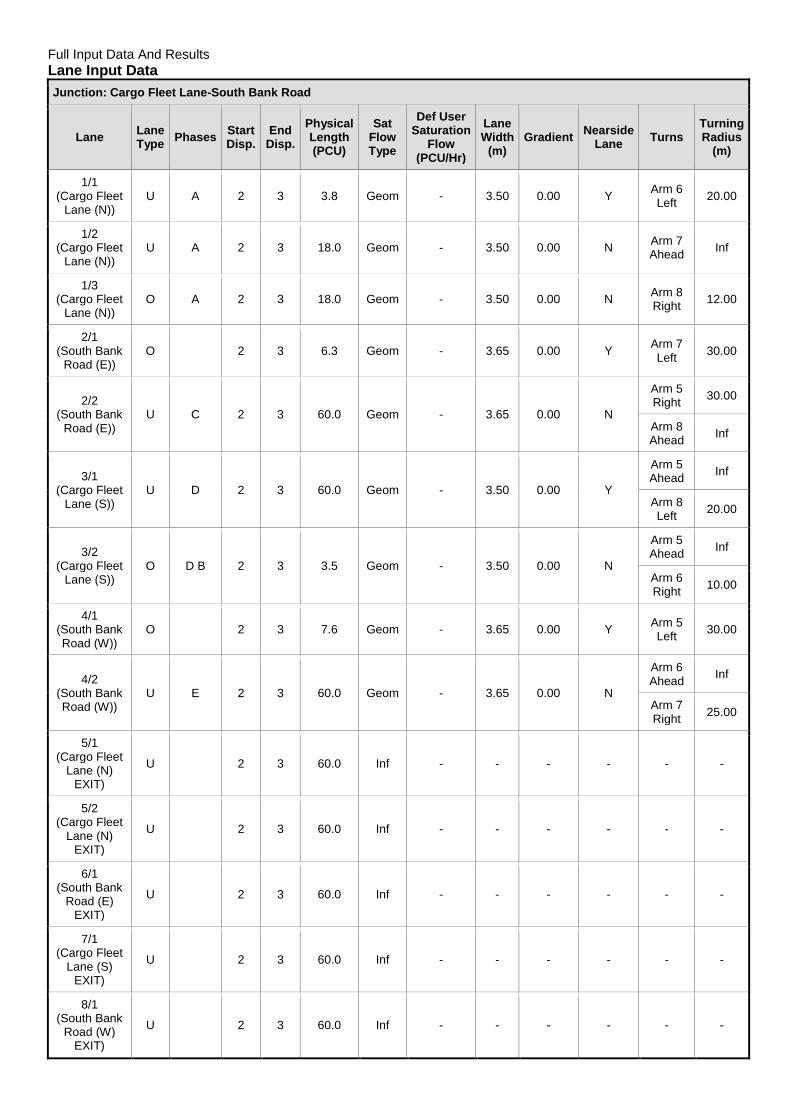
Lane Input Data
Junction: Cargo Fleet Lane-South Bank Road
Lane Lane Type
Phases Start Disp.
End Disp.
Physical Length (PCU)
Sat Flow Type
Def User Saturation
Flow (PCU/Hr)
Lane Width
(m) Gradient
Nearside Lane
Turns Turning Radius
(m)
1/1 (Cargo Fleet
Lane (N)) U A 2 3 3.8 Geom - 3.50 0.00 Y
Arm 6 Left
20.00
1/2 (Cargo Fleet
Lane (N)) U A 2 3 18.0 Geom - 3.50 0.00 N
Arm 7 Ahead
Inf
1/3 (Cargo Fleet
Lane (N)) O A 2 3 18.0 Geom - 3.50 0.00 N
Arm 8 Right
12.00
2/1 (South Bank
Road (E)) O 2 3 6.3 Geom - 3.65 0.00 Y
Arm 7 Left
30.00
2/2 (South Bank
Road (E)) U C 2 3 60.0 Geom - 3.65 0.00 N
Arm 5 Right
30.00
Arm 8 Ahead
Inf
3/1 (Cargo Fleet
Lane (S)) U D 2 3 60.0 Geom - 3.50 0.00 Y
Arm 5 Ahead
Inf
Arm 8 Left
20.00
3/2 (Cargo Fleet
Lane (S)) O D B 2 3 3.5 Geom - 3.50 0.00 N
Arm 5 Ahead
Inf
Arm 6 Right
10.00
4/1 (South Bank Road (W))
O 2 3 7.6 Geom - 3.65 0.00 Y Arm 5 Left
30.00
4/2 (South Bank Road (W))
U E 2 3 60.0 Geom - 3.65 0.00 N
Arm 6 Ahead
Inf
Arm 7 Right
25.00
5/1 (Cargo Fleet
Lane (N) EXIT)
U 2 3 60.0 Inf - - - - - -
5/2 (Cargo Fleet
Lane (N) EXIT)
U 2 3 60.0 Inf - - - - - -
6/1 (South Bank
Road (E) EXIT)
U 2 3 60.0 Inf - - - - - -
7/1 (Cargo Fleet
Lane (S) EXIT)
U 2 3 60.0 Inf - - - - - -
8/1 (South Bank
Road (W) EXIT)
U 2 3 60.0 Inf - - - - - -
Full Input Data And Results
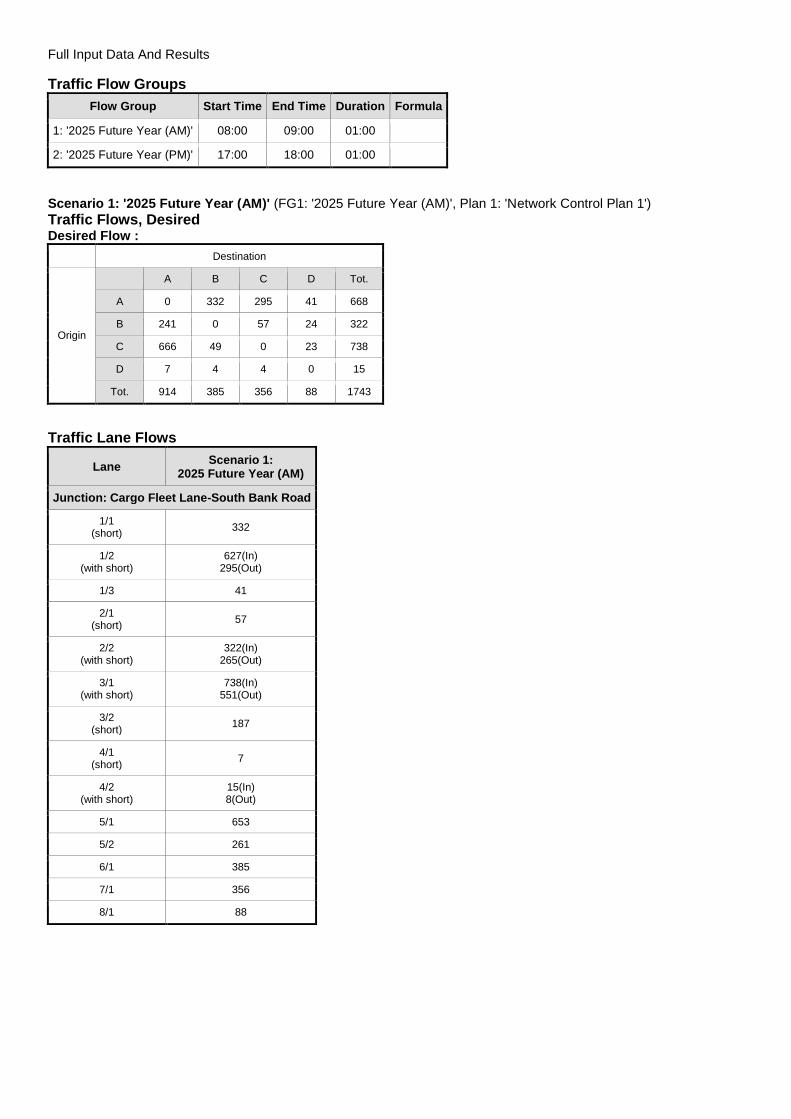
Traffic Flow Groups
Flow Group Start Time End Time Duration Formula
1: '2025 Future Year (AM)' 08:00 09:00 01:00
2: '2025 Future Year (PM)' 17:00 18:00 01:00
Scenario 1: '2025 Future Year (AM)' (FG1: '2025 Future Year (AM)', Plan 1: 'Network Control Plan 1')
Traffic Flows, Desired Desired Flow :
Destination
Origin
A B C D Tot.
A 0 332 295 41 668
B 241 0 57 24 322
C 666 49 0 23 738
D 7 4 4 0 15
Tot. 914 385 356 88 1743
Traffic Lane Flows
Lane Scenario 1:
2025 Future Year (AM)
Junction: Cargo Fleet Lane-South Bank Road
1/1 (short)
332
1/2 (with short)
627(In) 295(Out)
1/3 41
2/1 (short)
57
2/2 (with short)
322(In) 265(Out)
3/1 (with short)
738(In) 551(Out)
3/2 (short)
187
4/1 (short)
7
4/2 (with short)
15(In) 8(Out)
5/1 653
5/2 261
6/1 385
7/1 356
8/1 88
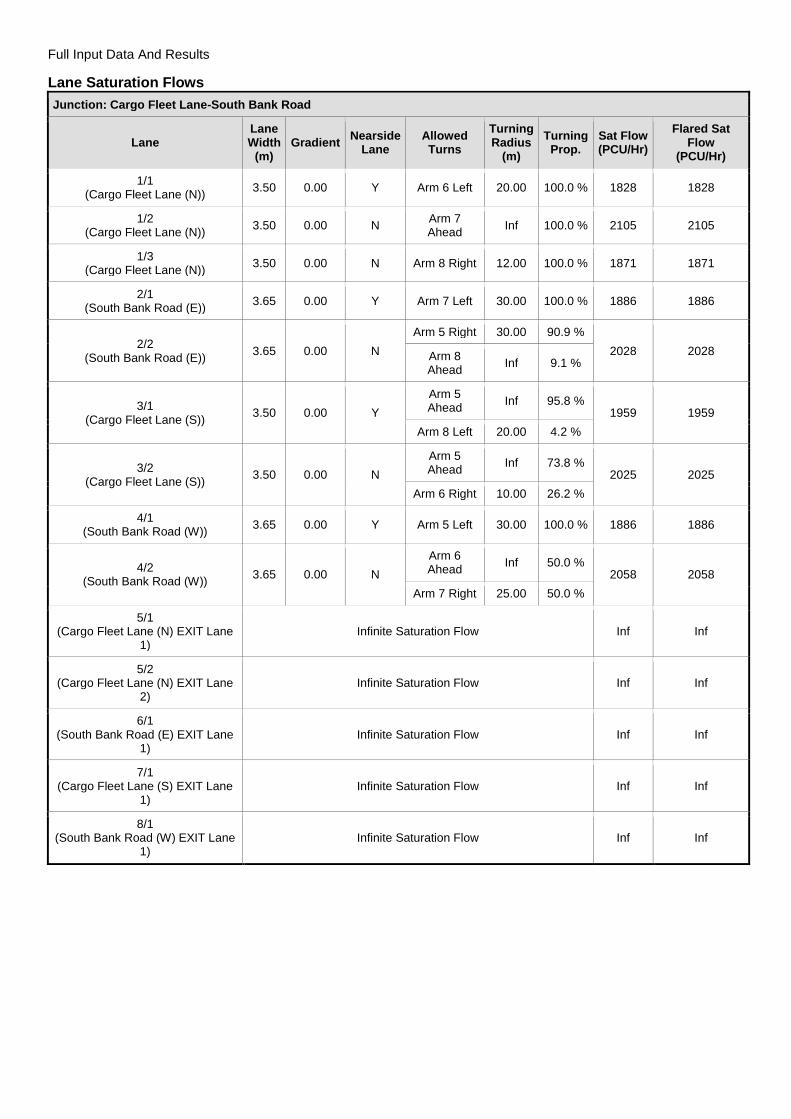
Full Input Data And Results
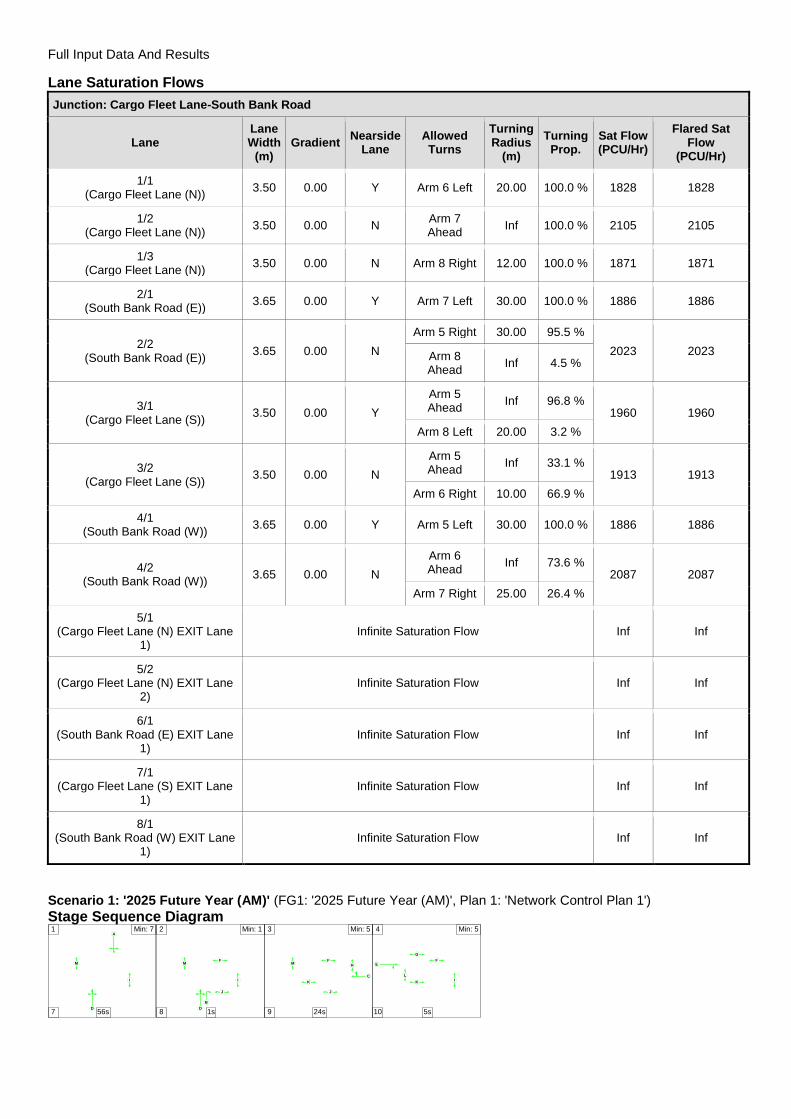
Lane Saturation Flows
Junction: Cargo Fleet Lane-South Bank Road
Lane Lane Width
(m) Gradient
Nearside Lane
Allowed Turns
Turning Radius
(m)
Turning Prop.
Sat Flow (PCU/Hr)
Flared Sat Flow
(PCU/Hr)
1/1 (Cargo Fleet Lane (N))
3.50 0.00 Y Arm 6 Left 20.00 100.0 % 1828 1828
1/2 (Cargo Fleet Lane (N))
3.50 0.00 N Arm 7 Ahead
Inf 100.0 % 2105 2105
1/3 (Cargo Fleet Lane (N))
3.50 0.00 N Arm 8 Right 12.00 100.0 % 1871 1871
2/1 (South Bank Road (E))
3.65 0.00 Y Arm 7 Left 30.00 100.0 % 1886 1886
2/2 (South Bank Road (E))
3.65 0.00 N
Arm 5 Right 30.00 90.9 %
2028 2028 Arm 8 Ahead
Inf 9.1 %
3/1 (Cargo Fleet Lane (S))
3.50 0.00 Y
Arm 5 Ahead
Inf 95.8 % 1959 1959
Arm 8 Left 20.00 4.2 %
3/2 (Cargo Fleet Lane (S))
3.50 0.00 N
Arm 5 Ahead
Inf 73.8 % 2025 2025
Arm 6 Right 10.00 26.2 %
4/1 (South Bank Road (W))
3.65 0.00 Y Arm 5 Left 30.00 100.0 % 1886 1886
4/2 (South Bank Road (W))
3.65 0.00 N
Arm 6 Ahead
Inf 50.0 % 2058 2058
Arm 7 Right 25.00 50.0 %
5/1 (Cargo Fleet Lane (N) EXIT Lane
1) Infinite Saturation Flow Inf Inf
5/2 (Cargo Fleet Lane (N) EXIT Lane
2) Infinite Saturation Flow Inf Inf
6/1 (South Bank Road (E) EXIT Lane
1) Infinite Saturation Flow Inf Inf
7/1 (Cargo Fleet Lane (S) EXIT Lane
1) Infinite Saturation Flow Inf Inf
8/1 (South Bank Road (W) EXIT Lane
1) Infinite Saturation Flow Inf Inf
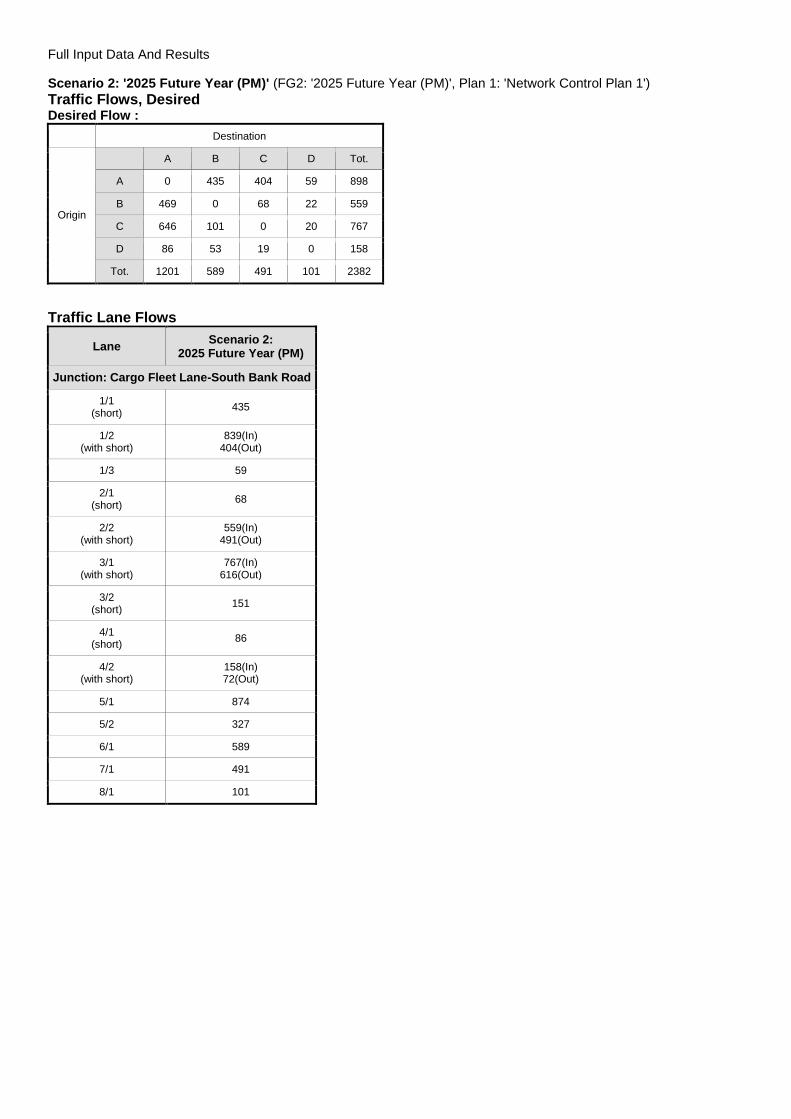
Full Input Data And Results
Scenario 2: '2025 Future Year (PM)' (FG2: '2025 Future Year (PM)', Plan 1: 'Network Control Plan 1')
Traffic Flows, Desired Desired Flow :
Destination
Origin
A B C D Tot.
A 0 435 404 59 898
B 469 0 68 22 559
C 646 101 0 20 767
D 86 53 19 0 158
Tot. 1201 589 491 101 2382
Traffic Lane Flows
Lane Scenario 2:
2025 Future Year (PM)
Junction: Cargo Fleet Lane-South Bank Road
1/1 (short)
435
1/2 (with short)
839(In) 404(Out)
1/3 59
2/1 (short)
68
2/2 (with short)
559(In) 491(Out)
3/1 (with short)
767(In) 616(Out)
3/2 (short)
151
4/1 (short)
86
4/2 (with short)
158(In) 72(Out)
5/1 874
5/2 327
6/1 589
7/1 491
8/1 101
Full Input Data And Results
Lane Saturation Flows
Junction: Cargo Fleet Lane-South Bank Road
Lane Lane Width
(m) Gradient
Nearside Lane
Allowed Turns
Turning Radius
(m)
Turning Prop.
Sat Flow (PCU/Hr)
Flared Sat Flow
(PCU/Hr)
1/1 (Cargo Fleet Lane (N))
3.50 0.00 Y Arm 6 Left 20.00 100.0 % 1828 1828
1/2 (Cargo Fleet Lane (N))
3.50 0.00 N Arm 7 Ahead
Inf 100.0 % 2105 2105
1/3 (Cargo Fleet Lane (N))
3.50 0.00 N Arm 8 Right 12.00 100.0 % 1871 1871
2/1 (South Bank Road (E))
3.65 0.00 Y Arm 7 Left 30.00 100.0 % 1886 1886
2/2 (South Bank Road (E))
3.65 0.00 N
Arm 5 Right 30.00 95.5 %
2023 2023 Arm 8 Ahead
Inf 4.5 %
3/1 (Cargo Fleet Lane (S))
3.50 0.00 Y
Arm 5 Ahead
Inf 96.8 % 1960 1960
Arm 8 Left 20.00 3.2 %
3/2 (Cargo Fleet Lane (S))
3.50 0.00 N
Arm 5 Ahead
Inf 33.1 % 1913 1913
Arm 6 Right 10.00 66.9 %
4/1 (South Bank Road (W))
3.65 0.00 Y Arm 5 Left 30.00 100.0 % 1886 1886
4/2 (South Bank Road (W))
3.65 0.00 N
Arm 6 Ahead
Inf 73.6 % 2087 2087
Arm 7 Right 25.00 26.4 %
5/1 (Cargo Fleet Lane (N) EXIT Lane
1) Infinite Saturation Flow Inf Inf
5/2 (Cargo Fleet Lane (N) EXIT Lane
2) Infinite Saturation Flow Inf Inf
6/1 (South Bank Road (E) EXIT Lane
1) Infinite Saturation Flow Inf Inf
7/1 (Cargo Fleet Lane (S) EXIT Lane
1) Infinite Saturation Flow Inf Inf
8/1 (South Bank Road (W) EXIT Lane
1) Infinite Saturation Flow Inf Inf
Scenario 1: '2025 Future Year (AM)' (FG1: '2025 Future Year (AM)', Plan 1: 'Network Control Plan 1')
Stage Sequence Diagram A
D
I
M
1 Min: 7
7 56s
B
D
F
I
J
M
2 Min: 1
8 1s
C
F
H
J
K
M
3 Min: 5
9 24s
EF
G
IK
L
4 Min: 5
10 5s
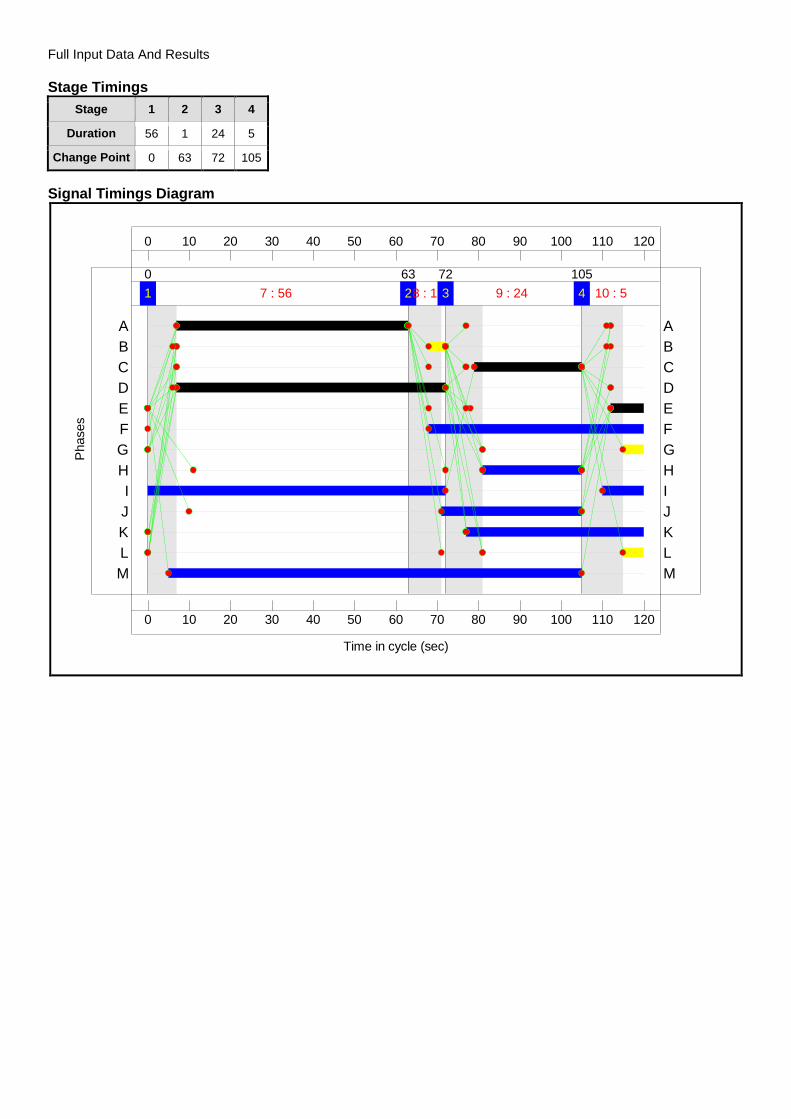
Full Input Data And Results
Stage Timings
Stage 1 2 3 4
Duration 56 1 24 5
Change Point 0 63 72 105
Signal Timings Diagram
0
0
10
10
20
20
30
30
40
40
50
50
60
60
70
70
80
80
90
90
100
100
110
110
120
120
Time in cycle (sec)
Phases
1 7 : 56
0
28 : 1
63
3 9 : 24
72
4 10 : 5
105
M M
L L
K K
J J
I I
H H
G G
F F
E E
D D
C C
B B
A A

Full Input Data And Results
Network Layout Diagram
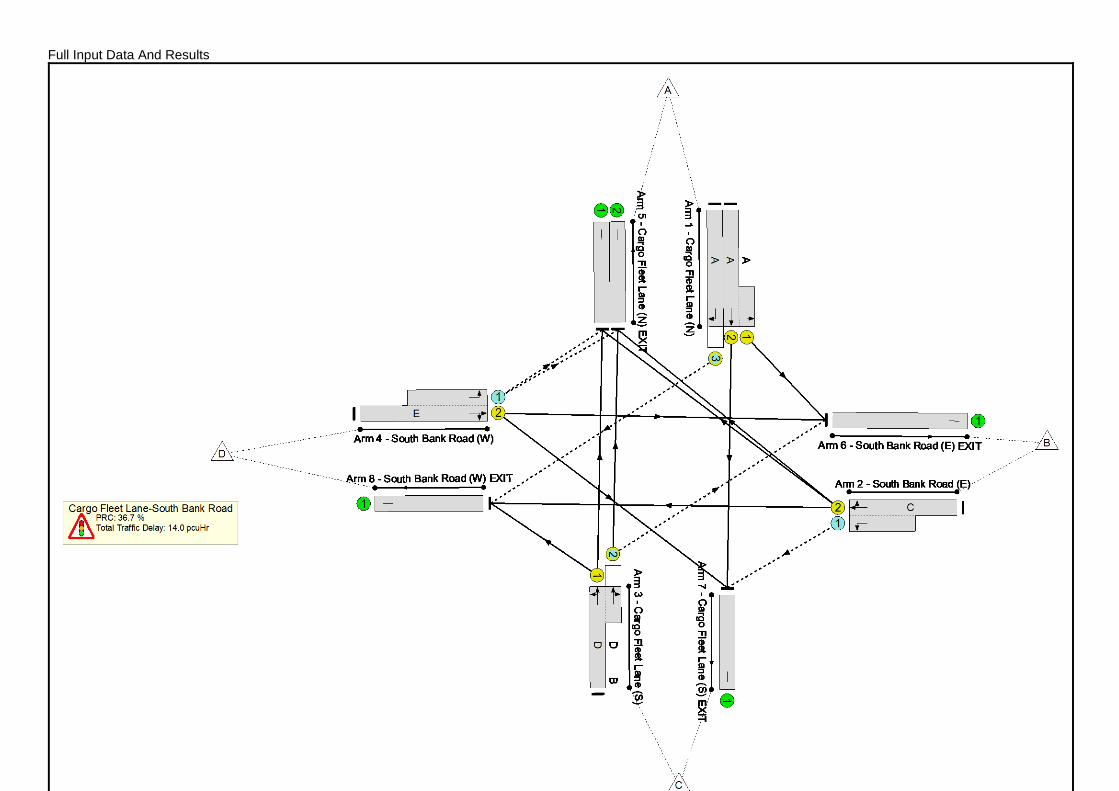
Full Input Data And Results
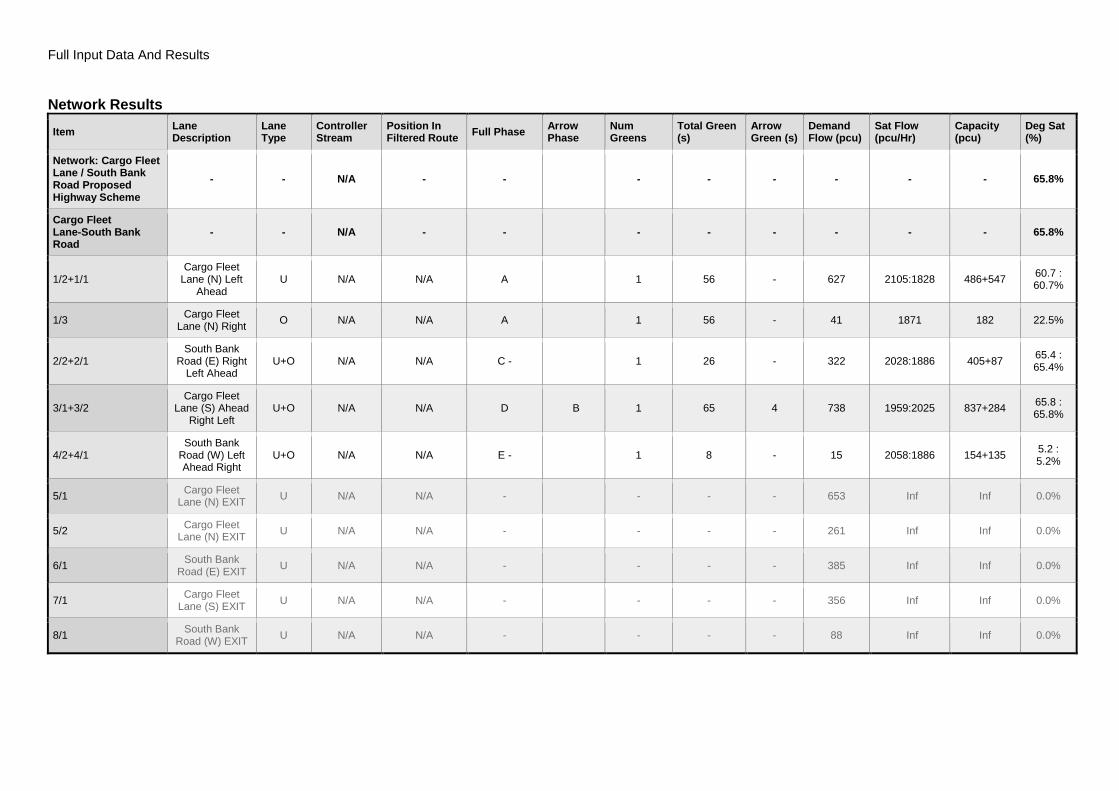
Full Input Data And Results
Network Results
Item Lane Description
Lane Type
Controller Stream
Position In Filtered Route
Full Phase Arrow Phase
Num Greens
Total Green (s)
Arrow Green (s)
Demand Flow (pcu)
Sat Flow (pcu/Hr)
Capacity (pcu)
Deg Sat (%)
Network: Cargo Fleet Lane / South Bank Road Proposed Highway Scheme
- - N/A - - - - - - - - 65.8%
Cargo Fleet Lane-South Bank Road
- - N/A - - - - - - - - 65.8%
1/2+1/1 Cargo Fleet
Lane (N) Left Ahead
U N/A N/A A 1 56 - 627 2105:1828 486+547 60.7 : 60.7%
1/3 Cargo Fleet
Lane (N) Right O N/A N/A A 1 56 - 41 1871 182 22.5%
2/2+2/1 South Bank
Road (E) Right Left Ahead
U+O N/A N/A C - 1 26 - 322 2028:1886 405+87 65.4 : 65.4%
3/1+3/2 Cargo Fleet
Lane (S) Ahead Right Left
U+O N/A N/A D B 1 65 4 738 1959:2025 837+284 65.8 : 65.8%
4/2+4/1 South Bank
Road (W) Left Ahead Right
U+O N/A N/A E - 1 8 - 15 2058:1886 154+135 5.2 : 5.2%
5/1 Cargo Fleet
Lane (N) EXIT U N/A N/A - - - - 653 Inf Inf 0.0%
5/2 Cargo Fleet
Lane (N) EXIT U N/A N/A - - - - 261 Inf Inf 0.0%
6/1 South Bank
Road (E) EXIT U N/A N/A - - - - 385 Inf Inf 0.0%
7/1 Cargo Fleet
Lane (S) EXIT U N/A N/A - - - - 356 Inf Inf 0.0%
8/1 South Bank
Road (W) EXIT U N/A N/A - - - - 88 Inf Inf 0.0%
Full Input Data And Results
Item Arriving (pcu) Leaving (pcu)
Turners In Gaps (pcu)
Turners When Unopposed (pcu)
Turners In Intergreen (pcu)
Uniform Delay (pcuHr)
Rand + Oversat Delay (pcuHr)
Storage Area Uniform Delay (pcuHr)
Total Delay (pcuHr)
Av. Delay Per PCU (s/pcu)
Max. Back of Uniform Queue (pcu)
Rand + Oversat Queue (pcu)
Mean Max Queue (pcu)
Network: Cargo Fleet Lane / South Bank Road Proposed Highway Scheme
- - 123 30 1 10.8 2.8 0.4 14.0 - - - -
Cargo Fleet Lane-South Bank Road
- - 123 30 1 10.8 2.8 0.4 14.0 - - - -
1/2+1/1 627 627 - - - 3.6 0.8 - 4.4 25.0 11.1 0.8 11.9
1/3 41 41 41 0 0 0.2 0.1 0.3 0.6 54.1 0.7 0.1 0.9
2/2+2/1 322 322 31 26 0 3.1 0.9 - 4.0 44.9 8.3 0.9 9.2
3/1+3/2 738 738 45 3 1 3.8 1.0 0.1 4.8 23.6 15.6 1.0 16.6
4/2+4/1 15 15 5 2 0 0.1 0.0 - 0.1 34.2 0.2 0.0 0.3
5/1 653 653 - - - 0.0 0.0 - 0.0 0.0 0.0 0.0 0.0
5/2 261 261 - - - 0.0 0.0 - 0.0 0.0 0.0 0.0 0.0
6/1 385 385 - - - 0.0 0.0 - 0.0 0.0 0.0 0.0 0.0
7/1 356 356 - - - 0.0 0.0 - 0.0 0.0 0.0 0.0 0.0
8/1 88 88 - - - 0.0 0.0 - 0.0 0.0 0.0 0.0 0.0
C1 PRC for Signalled Lanes (%): 36.7 Total Delay for Signalled Lanes (pcuHr): 13.98 Cycle Time (s): 120 PRC Over All Lanes (%): 36.7 Total Delay Over All Lanes(pcuHr): 13.98
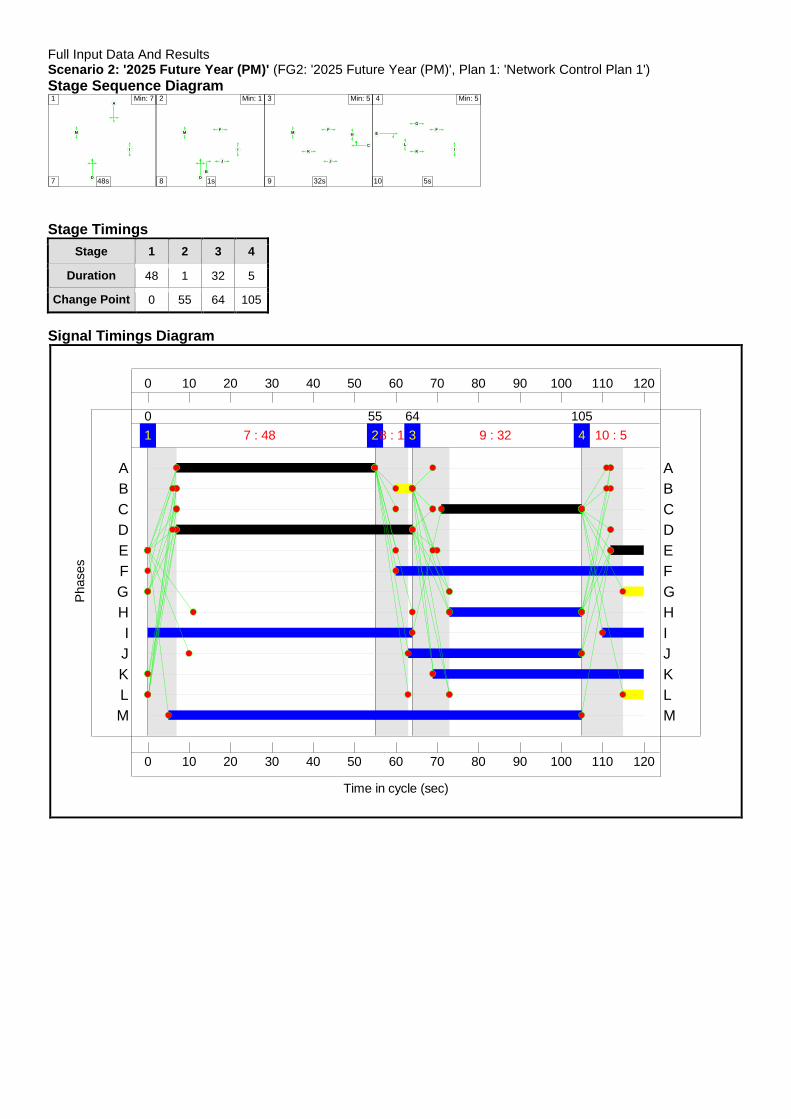
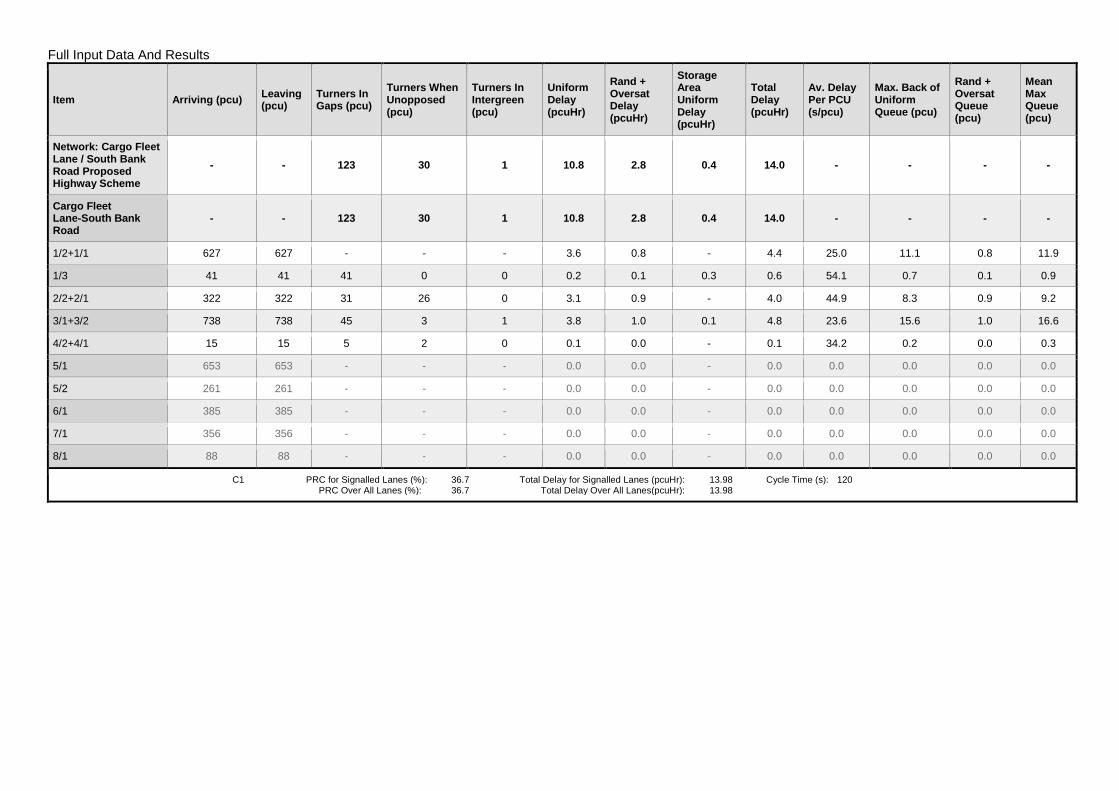
Full Input Data And Results Scenario 2: '2025 Future Year (PM)' (FG2: '2025 Future Year (PM)', Plan 1: 'Network Control Plan 1')
Stage Sequence Diagram A
D
I
M
1 Min: 7
7 48s
B
D
F
I
J
M
2 Min: 1
8 1s
C
F
H
J
K
M
3 Min: 5
9 32s
EF
G
IK
L
4 Min: 5
10 5s Stage Timings
Stage 1 2 3 4
Duration 48 1 32 5
Change Point 0 55 64 105
Signal Timings Diagram
0
0
10
10
20
20
30
30
40
40
50
50
60
60
70
70
80
80
90
90
100
100
110
110
120
120
Time in cycle (sec)
Phases
1 7 : 48
0
28 : 1
55
3 9 : 32
64
4 10 : 5
105
M M
L L
K K
J J
I I
H H
G G
F F
E E
D D
C C
B B
A A

Full Input Data And Results
Network Layout Diagram

Full Input Data And Results
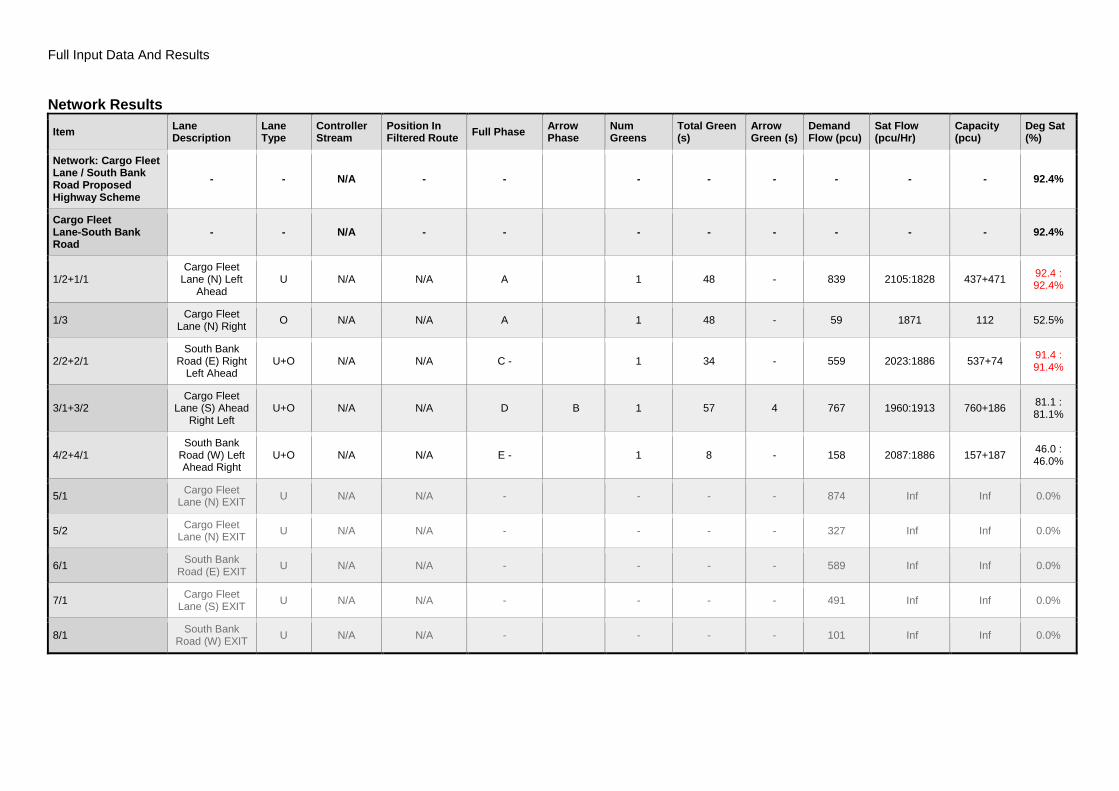
Full Input Data And Results
Network Results
Item Lane Description
Lane Type
Controller Stream
Position In Filtered Route
Full Phase Arrow Phase
Num Greens
Total Green (s)
Arrow Green (s)
Demand Flow (pcu)
Sat Flow (pcu/Hr)
Capacity (pcu)
Deg Sat (%)
Network: Cargo Fleet Lane / South Bank Road Proposed Highway Scheme
- - N/A - - - - - - - - 92.4%
Cargo Fleet Lane-South Bank Road
- - N/A - - - - - - - - 92.4%
1/2+1/1 Cargo Fleet
Lane (N) Left Ahead
U N/A N/A A 1 48 - 839 2105:1828 437+471 92.4 : 92.4%
1/3 Cargo Fleet
Lane (N) Right O N/A N/A A 1 48 - 59 1871 112 52.5%
2/2+2/1 South Bank
Road (E) Right Left Ahead
U+O N/A N/A C - 1 34 - 559 2023:1886 537+74 91.4 : 91.4%
3/1+3/2 Cargo Fleet
Lane (S) Ahead Right Left
U+O N/A N/A D B 1 57 4 767 1960:1913 760+186 81.1 : 81.1%
4/2+4/1 South Bank
Road (W) Left Ahead Right
U+O N/A N/A E - 1 8 - 158 2087:1886 157+187 46.0 : 46.0%
5/1 Cargo Fleet
Lane (N) EXIT U N/A N/A - - - - 874 Inf Inf 0.0%
5/2 Cargo Fleet
Lane (N) EXIT U N/A N/A - - - - 327 Inf Inf 0.0%
6/1 South Bank
Road (E) EXIT U N/A N/A - - - - 589 Inf Inf 0.0%
7/1 Cargo Fleet
Lane (S) EXIT U N/A N/A - - - - 491 Inf Inf 0.0%
8/1 South Bank
Road (W) EXIT U N/A N/A - - - - 101 Inf Inf 0.0%

Full Input Data And Results
Item Arriving (pcu) Leaving (pcu)
Turners In Gaps (pcu)
Turners When Unopposed (pcu)
Turners In Intergreen (pcu)
Uniform Delay (pcuHr)
Rand + Oversat Delay (pcuHr)
Storage Area Uniform Delay (pcuHr)
Total Delay (pcuHr)
Av. Delay Per PCU (s/pcu)
Max. Back of Uniform Queue (pcu)
Rand + Oversat Queue (pcu)
Mean Max Queue (pcu)
Network: Cargo Fleet Lane / South Bank Road Proposed Highway Scheme
- - 172 140 2 20.2 12.9 1.0 34.0 - - - -
Cargo Fleet Lane-South Bank Road
- - 172 140 2 20.2 12.9 1.0 34.0 - - - -
1/2+1/1 839 839 - - - 7.2 5.3 - 12.5 53.5 22.6 5.3 27.8
1/3 59 59 59 0 0 0.4 0.5 0.5 1.4 86.7 1.2 0.5 1.7
2/2+2/1 559 559 18 50 0 5.8 4.5 - 10.3 66.5 17.0 4.5 21.5
3/1+3/2 767 767 28 71 2 5.8 2.1 0.5 8.4 39.2 20.2 2.1 22.3
4/2+4/1 158 158 67 19 0 1.1 0.4 - 1.5 33.9 2.3 0.4 2.7
5/1 874 874 - - - 0.0 0.0 - 0.0 0.0 0.0 0.0 0.0
5/2 327 327 - - - 0.0 0.0 - 0.0 0.0 0.0 0.0 0.0
6/1 589 589 - - - 0.0 0.0 - 0.0 0.0 0.0 0.0 0.0
7/1 491 491 - - - 0.0 0.0 - 0.0 0.0 0.0 0.0 0.0
8/1 101 101 - - - 0.0 0.0 - 0.0 0.0 0.0 0.0 0.0
C1 PRC for Signalled Lanes (%): -2.7 Total Delay for Signalled Lanes (pcuHr): 34.05 Cycle Time (s): 120 PRC Over All Lanes (%): -2.7 Total Delay Over All Lanes(pcuHr): 34.05

Fore Consulting Limited Suite 14, City Quadrant
11 Waterloo Square Newcastle upon Tyne
NE1 4DP
0191 255 7778 [email protected]
www.foreconsulting.co.uk
Fore Consulting Limited. Registered in England and Wales No. 7291952. Registered Address: Gresham House, 5 - 7 St Pauls Street, Leeds LS1 2JG, United Kingdom
VAT Registration No. 105 0341 75