Embed Size (px)
Citation preview
AiMT Advances in Military Technology Vol. 8, No. 2, December 2013
Applied Sensor Fault Detection, Identification and Data Reconstruction
Y. Zhang*, C.M. Bingham and M. Gallimore
School of Engineering, University of Lincoln, Lincoln, U.K.
The manuscript was received on 21 May 2013 and was accepted after revision for publication on 16 October 2013.
Abstract:
Sensor fault detection and identification (SFD/I) has attracted considerable attention in military applications, especially when safety- or mission-critical issues are of paramount importance. Here, two readily implementable approaches for SFD/I are proposed through hierarchical clustering and self-organizing map neural networks. The proposed methodologies are capable of detecting sensor faults from a large group of sensors measuring different physical quantities and achieve SFD/I in a single stage. Furthermore, it is possible to reconstruct the measurements expected from the faulted sensor and thereby facilitate improved unit availability. The efficacy of the proposed approaches is demonstrated through the use of measurements from experimental trials on a gas turbine. Ultimately, the underlying principles are readily transferable to other complex industrial and military systems.
Keywords:
Sensor fault detection and identification, hierarchical clustering, self-organizing map neural network, data reconstruction.
1. Introduction Electronic equipment now supports almost every technical device and appliance to help a user or operator, with sensors taking the role of localised ‘eyes and ears’. Such systems are of special importance for military application where the safety issues are of significant concern. Sensor fault detection and identification (SFD/I) has therefore attracted considerable recent attention, both in industrial and military sectors, due to the benefits of reducing down-time and loss of productivity, and increasing the assurance of safety, quality and reliability of systems.
The uses of Neural Networks (NNs), for instance, have become popular candidate solutions for SFD/I. By way of example, [1] applied NNs to detect anomalous sensor
* Corresponding author: Dr. Yu Zhang, School of Engineering, University of Lincoln, Lincoln,
LN6 7TS, U.K. Tel: +44(0)1522 837938, E-mail: [email protected]
2 Y. Zhang, C.M. Bingham and M. Gallimore
2
( ) ( )
signal patterns for advanced military aircraft, whilst Probabilistic Neural Networks (PNNs) have been reported for detecting sensor faults specifically for gas turbine systems, with some success (although the sensitivity of PNNs was also discussed in) [2]. Moreover, the application of unsupervised self-organizing map neural networks (SOMNNs) for fault detection has also been shown in [3], with a study in [4] also pointing out that SOMNNs generally provide better solutions than approaches based on other radial basis function neural networks (RBFNNs).
Cluster analysis methodologies have also been a popular choice for system fault detection and diagnosis. Compared to the use of ‘black-box’ models typical of those used in NNs, or alternative complex eigenvector-eigenvalue techniques such as principal component analysis (PCA), cluster analysis is a more straight-forward technique derived from relatively basic distance algorithms, and have therefore gained favour since they are readily implementable and interpreted. Specifically in [5], four unsupervised clustering models are employed, including SOMNNs, hierarchical tree models and quality adaptive threshold models, along with a new hybrid model for fault diagnosis of industrial robots. From the results, the authors conclude that supervised classification algorithms often failed when encountering ‘new data’, whilst in contrast, unsupervised techniques, such as SOMNNs and hierarchical clustering (HC) methods, are very capable of novelty detection under such conditions [6,7].
An advantage of both techniques proposed in this paper (HC and SOMNNs), is that they are capable of detecting sensor faults within a large group of sensors rather than individually monitoring only a single sensor. Whilst SOMNNs arrange high-dimensional data automatically by their topological properties through the ‘black-box’ approach, and result in numerical classifications, an unsupervised agglomerative HC method is utilized to build a graphical interface showing the hierarchy of clusters according to dataset similarities. Moreover, the proposed approaches can achieve SFD/I in a single stage. Such rapid and secure fault identification procedures are very important in military systems where the aggressive surrounding activities may create hazards to human or technical resources.
After identifying faults, to discriminate sensor failures from other types of component failure, the paper goes on to consider the use of other sensors in the group to estimate the data that a potentially faulted sensor would be providing (as if it remained operational). An extension of the SOMNN algorithm is employed, and a l -norm error index is used to evaluate the ‘estimation’ results.
2. Hierarchical Clustering The underlying concept of agglomerative HC is to assemble a set of objects into a hierarchical tree, where objects with similar characteristics join in lower branches and these branches join based on object ‘similarity’ [8]. Objects with the smallest distance between them are joined by a branch of a tree (i.e. a cluster). Further clusters are then formed from merged sub-clusters, and the hierarchical process iterates until only one cluster remains. The resulting hierarchical tree is then dissected according to either the linkage-distance or cluster number, and in so doing provide novelty detection.
Although a number of distance- and linkage-functions have been proposed, here, the most common measure, the Euclidean distance, is used:
∑=
−=N
iii yxd
1
2yx, , (1)
3
Applied Sensor Fault Detection, Identification and Data Reconstruction
)Nx,,2 Lxx ,1 and (where x and y are two 1×N vectors, i.e. the signals, ( )Nyyy ,,, 21 L
( )
, along with an average linkage measure to calculate the mean distance between all pairs of objects in clusters m and n:
( )∑∑= =
=m nN
j
N
knkmj
nmd
NNn
1 1
,1 yx
,,2 L nNk ,,2,1 L
mD , . (2)
( )where and mNj ,1= = . nkmjd yx ,
mN nN
is the distance between two
objects in the two clusters. is the number of objects in cluster m, and is the number of objects in cluster n.
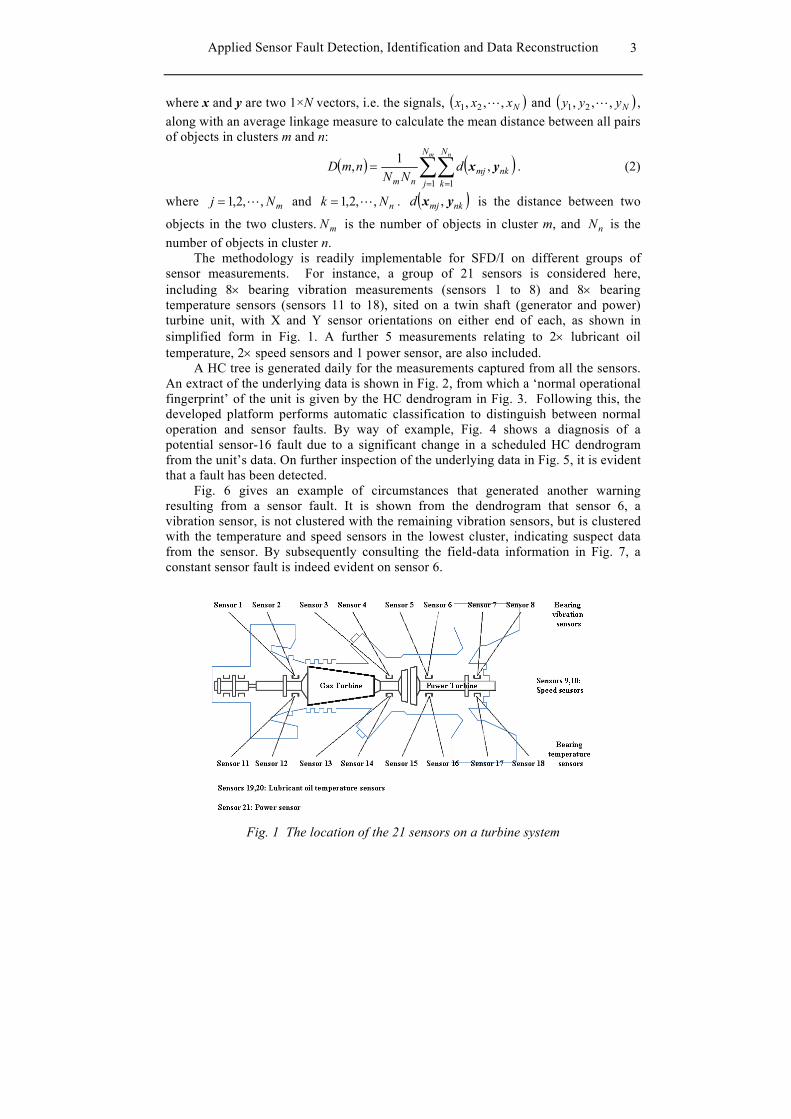
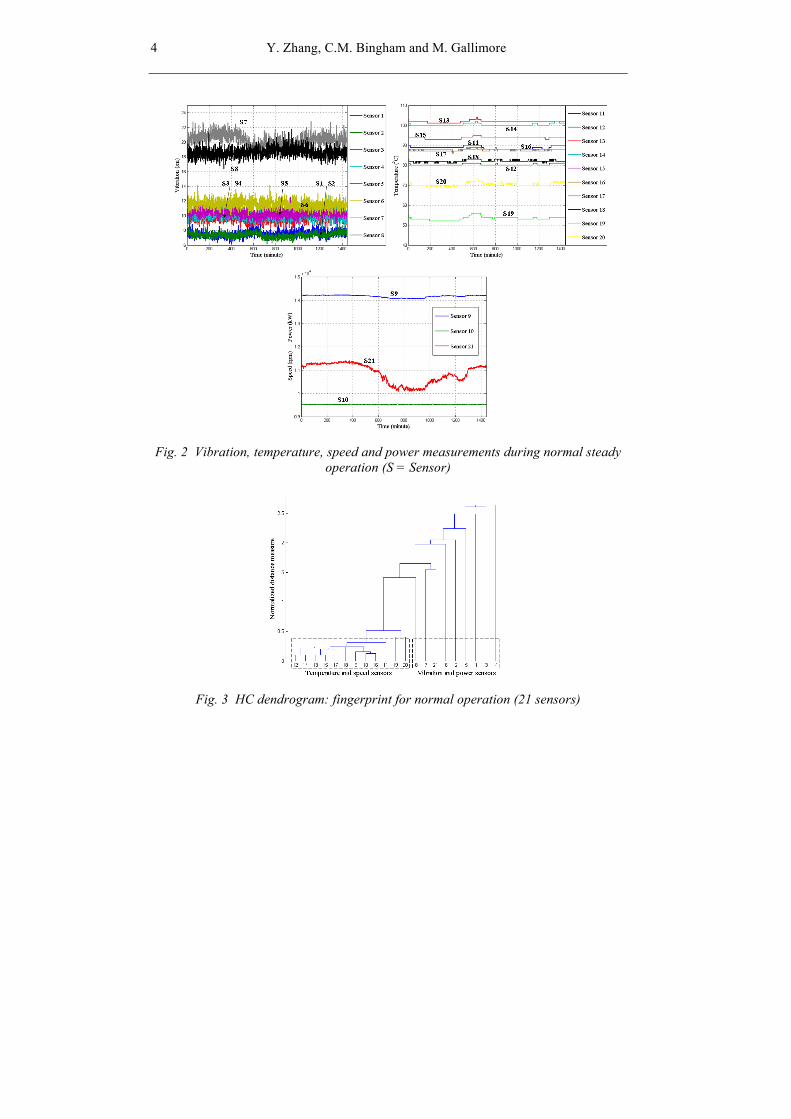
The methodology is readily implementable for SFD/I on different groups of sensor measurements. For instance, a group of 21 sensors is considered here, including 8× bearing vibration measurements (sensors 1 to 8) and 8× bearing temperature sensors (sensors 11 to 18), sited on a twin shaft (generator and power) turbine unit, with X and Y sensor orientations on either end of each, as shown in simplified form in Fig. 1. A further 5 measurements relating to 2× lubricant oil temperature, 2× speed sensors and 1 power sensor, are also included.
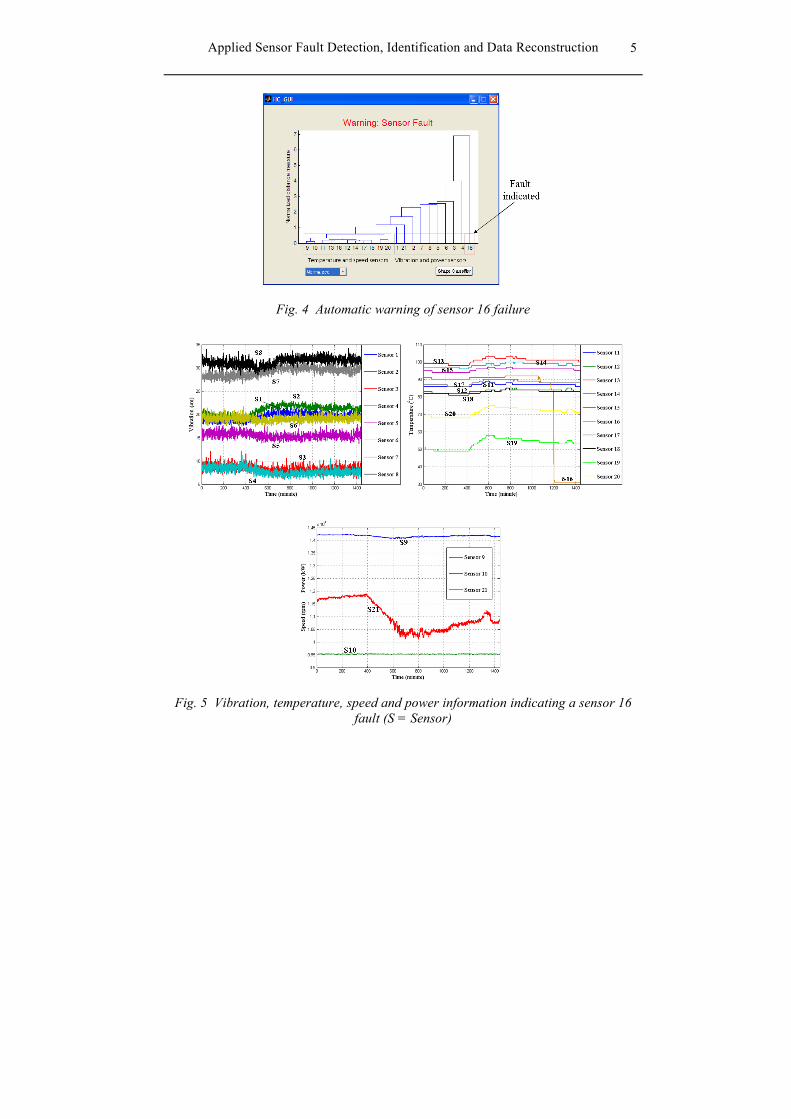
A HC tree is generated daily for the measurements captured from all the sensors. An extract of the underlying data is shown in Fig. 2, from which a ‘normal operational fingerprint’ of the unit is given by the HC dendrogram in Fig. 3. Following this, the developed platform performs automatic classification to distinguish between normal operation and sensor faults. By way of example, Fig. 4 shows a diagnosis of a potential sensor-16 fault due to a significant change in a scheduled HC dendrogram from the unit’s data. On further inspection of the underlying data in Fig. 5, it is evident that a fault has been detected.
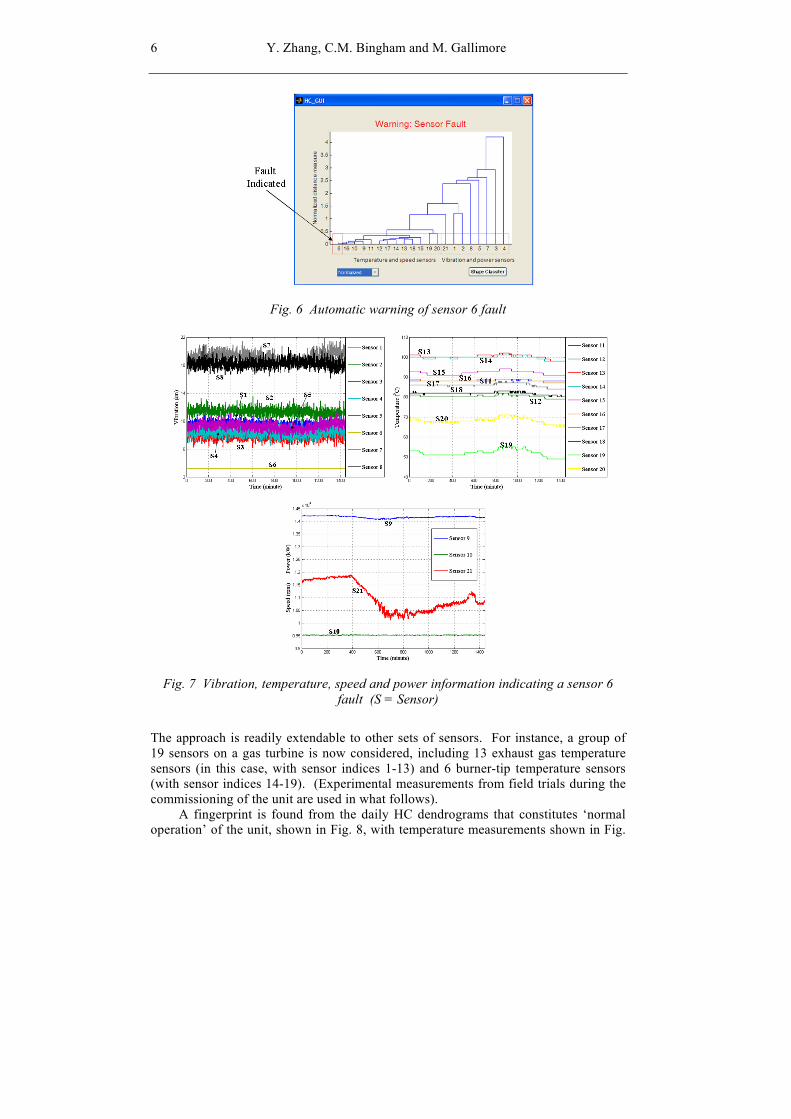
Fig. 6 gives an example of circumstances that generated another warning resulting from a sensor fault. It is shown from the dendrogram that sensor 6, a vibration sensor, is not clustered with the remaining vibration sensors, but is clustered with the temperature and speed sensors in the lowest cluster, indicating suspect data from the sensor. By subsequently consulting the field-data information in Fig. 7, a constant sensor fault is indeed evident on sensor 6.
Fig. 1 The location of the 21 sensors on a turbine system
4 Y. Zhang, C.M. Bingham and M. Gallimore
Fig. 2 Vibration, temperature, speed and power measurements during normal steady
operation (S = Sensor)
Fig. 3 HC dendrogram: fingerprint for normal operation (21 sensors)
5
Applied Sensor Fault Detection, Identification and Data Reconstruction
Fig. 4 Automatic warning of sensor 16 failure
Fig. 5 Vibration, temperature, speed and power information indicating a sensor 16
fault (S = Sensor)
6 Y. Zhang, C.M. Bingham and M. Gallimore
Fig. 6 Automatic warning of sensor 6 fault
Fig. 7 Vibration, temperature, speed and power information indicating a sensor 6
fault (S = Sensor)
The approach is readily extendable to other sets of sensors. For instance, a group of 19 sensors on a gas turbine is now considered, including 13 exhaust gas temperature sensors (in this case, with sensor indices 1-13) and 6 burner-tip temperature sensors (with sensor indices 14-19). (Experimental measurements from field trials during the commissioning of the unit are used in what follows).
A fingerprint is found from the daily HC dendrograms that constitutes ‘normal operation’ of the unit, shown in Fig. 8, with temperature measurements shown in Fig.

7
Applied Sensor Fault Detection, Identification and Data Reconstruction
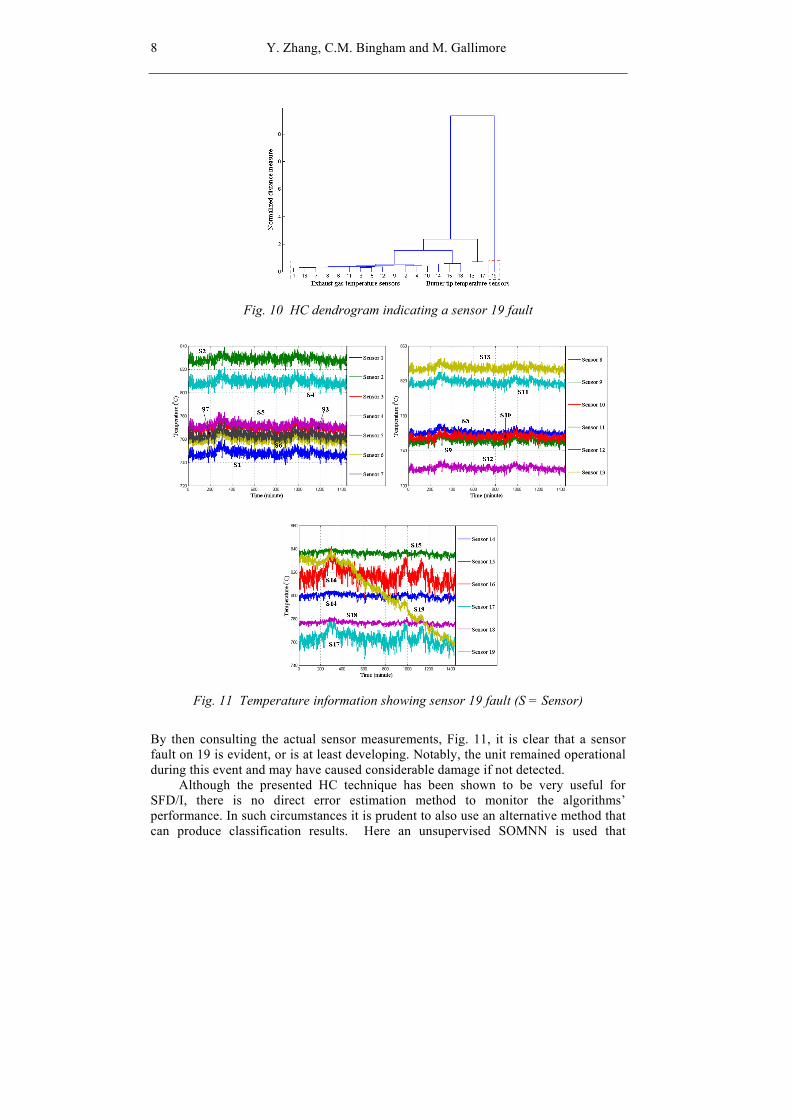
9. It can be observed that a clear separation exists between the exhaust gas and the burner tip temperatures in the dendrogram, although it is less apparent from the original measurement data. By comparing subsequent data with the ‘normal’ HC fingerprint, sensor faults are detected from an object’s cluster changes in the dendrogram. By way of example, Fig. 10 shows a subsequent dendrogram that does not ‘fit’ that of the normal fingerprint. In particular, sensor 19 resides in a higher sub-cluster with a significant change in linkage distance. This is indicative of a change in characteristics.
Fig. 8 HC dendrogram: fingerprint for normal operation (19 sensors)
Fig. 9 Temperature information for normal operation (S = Sensor)
8 Y. Zhang, C.M. Bingham and M. Gallimore
Fig. 10 HC dendrogram indicating a sensor 19 fault
Fig. 11 Temperature information showing sensor 19 fault (S = Sensor)
By then consulting the actual sensor measurements, Fig. 11, it is clear that a sensor fault on 19 is evident, or is at least developing. Notably, the unit remained operational during this event and may have caused considerable damage if not detected.
Although the presented HC technique has been shown to be very useful for SFD/I, there is no direct error estimation method to monitor the algorithms’ performance. In such circumstances it is prudent to also use an alternative method that can produce classification results. Here an unsupervised SOMNN is used that
9
Applied Sensor Fault Detection, Identification and Data Reconstruction
provides classifications in a graphical manner for operators, once prompted, or output results numerically. The resulting classification maps are therefore used as additional evidence to support the detection results obtained from HC.
3. Self-organizing Map Neural Network A SOMNN is a competitive learning network [9]. An input data vector,
, with N variables, is associated with a reference vector,
, which is often randomly initiated to give each neuron a displacement vector in the input space. For each sample of , constitutes ‘the winner’, by seeking the minimum distance between the input vector and the reference vector, and is calculated from:
[ ] NNxxx ℜ∈= ,...,, 21x
Nℜ∈ir)(tx )(twr
)()()( ttt iw rxr −≤−)(tx for ∀ i . (3)
After obtaining a ‘winner’, the reference vectors are updated using: ( ))()()()()1 , tttnt iw ii rxr(tir + −=+ , (4)
where n is a neighbourhood function, which is normally chosen as Gaussian. The reference vectors are adjusted to match the training signals, in a regression process over a finite number of steps, in order to achieve the final ‘self-organizing maps’.
)(, tiw
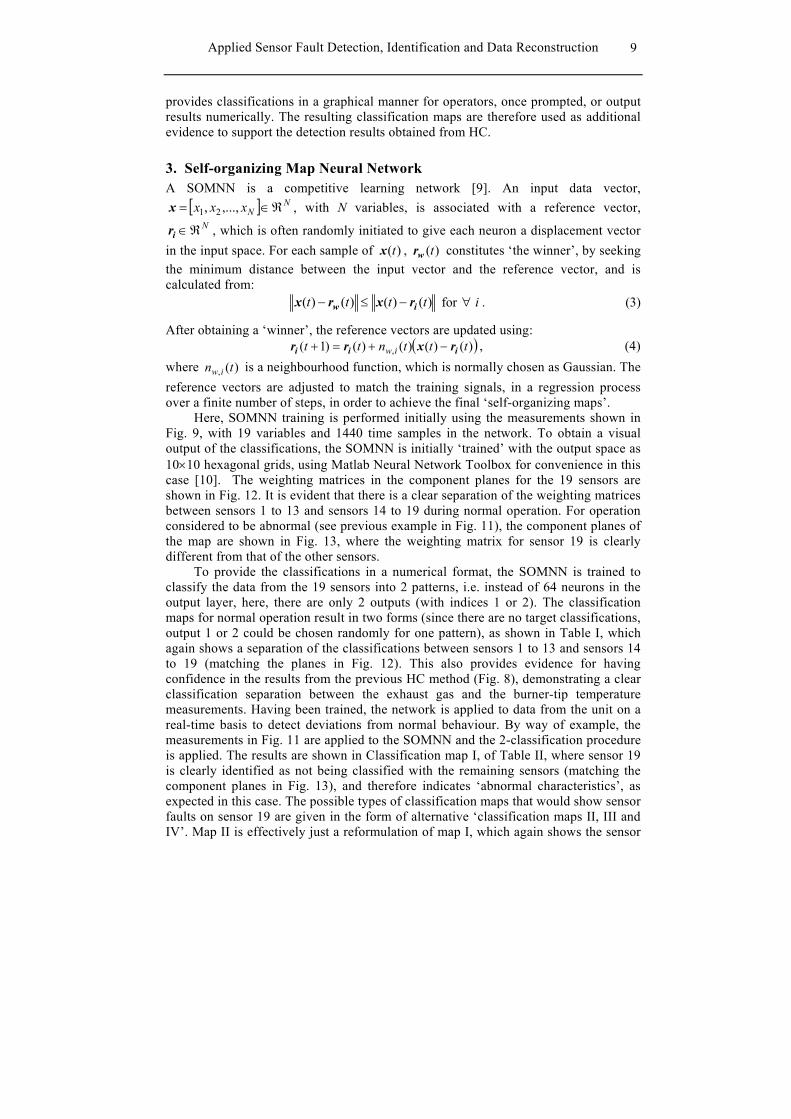
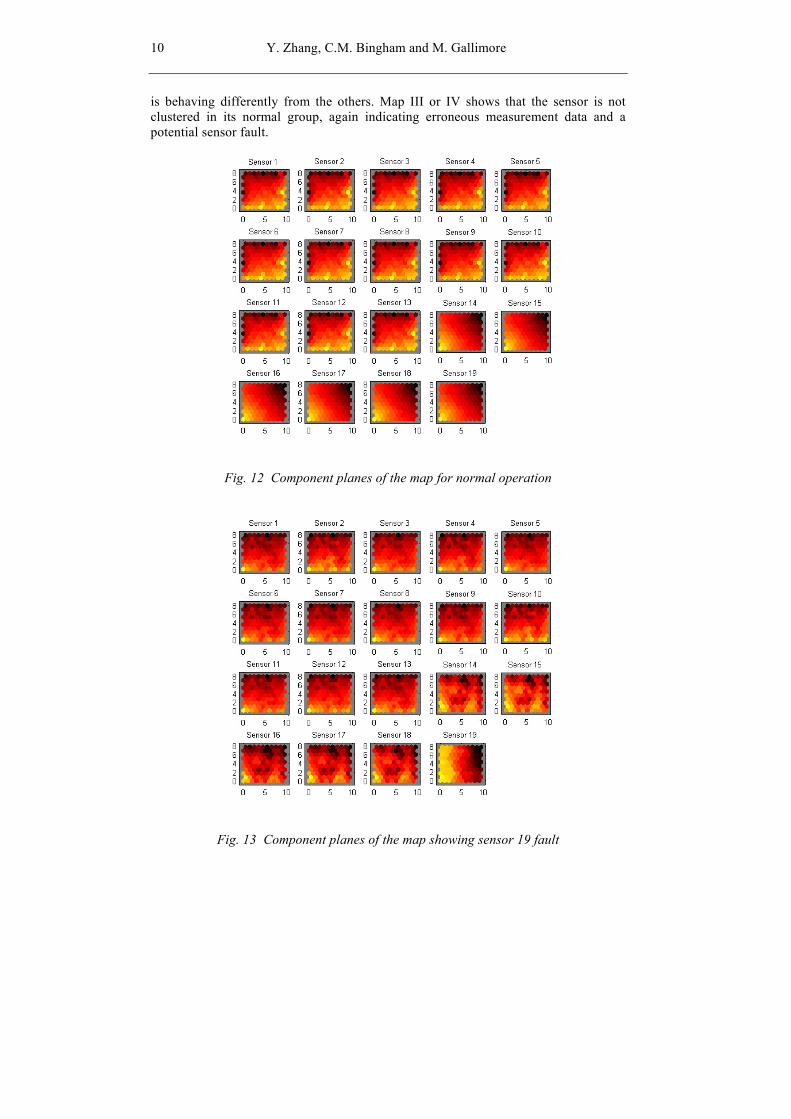
Here, SOMNN training is performed initially using the measurements shown in Fig. 9, with 19 variables and 1440 time samples in the network. To obtain a visual output of the classifications, the SOMNN is initially ‘trained’ with the output space as 10×10 hexagonal grids, using Matlab Neural Network Toolbox for convenience in this case [10]. The weighting matrices in the component planes for the 19 sensors are shown in Fig. 12. It is evident that there is a clear separation of the weighting matrices between sensors 1 to 13 and sensors 14 to 19 during normal operation. For operation considered to be abnormal (see previous example in Fig. 11), the component planes of the map are shown in Fig. 13, where the weighting matrix for sensor 19 is clearly different from that of the other sensors.
To provide the classifications in a numerical format, the SOMNN is trained to classify the data from the 19 sensors into 2 patterns, i.e. instead of 64 neurons in the output layer, here, there are only 2 outputs (with indices 1 or 2). The classification maps for normal operation result in two forms (since there are no target classifications, output 1 or 2 could be chosen randomly for one pattern), as shown in Table I, which again shows a separation of the classifications between sensors 1 to 13 and sensors 14 to 19 (matching the planes in Fig. 12). This also provides evidence for having confidence in the results from the previous HC method (Fig. 8), demonstrating a clear classification separation between the exhaust gas and the burner-tip temperature measurements. Having been trained, the network is applied to data from the unit on a real-time basis to detect deviations from normal behaviour. By way of example, the measurements in Fig. 11 are applied to the SOMNN and the 2-classification procedure is applied. The results are shown in Classification map I, of Table II, where sensor 19 is clearly identified as not being classified with the remaining sensors (matching the component planes in Fig. 13), and therefore indicates ‘abnormal characteristics’, as expected in this case. The possible types of classification maps that would show sensor faults on sensor 19 are given in the form of alternative ‘classification maps II, III and IV’. Map II is effectively just a reformulation of map I, which again shows the sensor
10 Y. Zhang, C.M. Bingham and M. Gallimore
is behaving differently from the others. Map III or IV shows that the sensor is not clustered in its normal group, again indicating erroneous measurement data and a potential sensor fault.
Fig. 12 Component planes of the map for normal operation
Fig. 13 Component planes of the map showing sensor 19 fault
11
Applied Sensor Fault Detection, Identification and Data Reconstruction
Table 1 Classification maps for normal operation
Sensor index 1 16 17 18 19 2 3 4 5 6 7 8 9 10 11 12 13 14 15
Classification map I 1 1 1 1 1 1 1 1 1 1 1 1 1 2 2 2 2 2 2
Classification map II 2 2 2 2 2 2 2 2 2 2 2 2 2 1 1 1 1 1 1
Table 2 assificat s so au nsor 19
Sensor index 17 18 19
Cl ion maps showing en r f lt on se
1 2 3 4 5 6 7 8 9 10 11 12 13 14 15 16
Classification map I 1 1 1 1 1 1 1 1 1 1 1 1 1 1 1 1 1 1 2
Classification map II 2 2 2 2 2 2 2 2 2 2 2 2 2 2 2 2 2 2 1
Classification map III 1 1 1 1 1 1 1 1 1 1 1 1 1 2 2 2 2 2 1
Classification map IV 2 2 2 2 2 2 2 2 2 2 2 2 2 1 1 1 1 1 2
n advanA tage f in S M N are simpl alized it b ic m c utput. However, the ‘black-box’ nature of ANNs provides little insight into the
n of a faulted sensor, a decision needs to be made as to it can continue, possibly at reduced capacity or lower
ht vector using a combination of its k nearest node
o us g O N s is that they y re w h a as nu eriorelationship between the actual inputs, and the ultimate confidence in the final results at the output. Nevertheless, the SOMNN has been shown to be effective as a warning of sensor faults, and for discriminating which sensor is at fault. Whilst HC provides a more user-friendly interface for operators, SOMNN can also provide classifications in a visual sense by the component planes in a 2-dimensional output space, and provide corroborating evidence.
4. Data ReconstructioFollowing the identificationwhether operation of the unperformance, or whether the unit should be shut-down for immediate maintenance. The latter option is often of considerable disturbance to both the makers of the unit and their customers/operators. An alternative, therefore, is to try and reconstruct a ‘best estimate’ of the measurements expected from the faulted sensor with a view to retaining the ability to keep the unit operating. This can be accomplished by an extension of the SOMNN algorithm.
Based on SOMNN, for a 2-dimensional output space, the faulted signal can be reconstructed by adjusting the weig
s. Firstly, a function is defined to calculate the activation of output neuron n for an input vector x by using a Gaussian kernel:
⎟⎠⎝
− nn
rx , (5)
n representing the influence current sample of sensor measurement data is detected as being faulty, the ‘winning’ neuron for this measurement is considered as being no longer valid, and the weighting
⎟⎞
⎜⎜⎛ −
= 222
1exp)(nTσ
where 2σ is a parameter region of neuron n. When the
12 Y. Zhang, C.M. Bingham and M. Gallimore
is evector stimated by considering the k nearest neighbouring neurons in the output space, using:
( ) ∑∑==
≈k
mm
k
mimmi TT
11
rz , (6)
where z is thi e estimation of the measurement, i is sensor index and m is the neuron index.
To evaluate the re ction performance, the 2l -norm relative reconstruction construerror, E , is used, as follows
∑=
==I
ii
I
iE
1
22
1
|||| x
. (7)
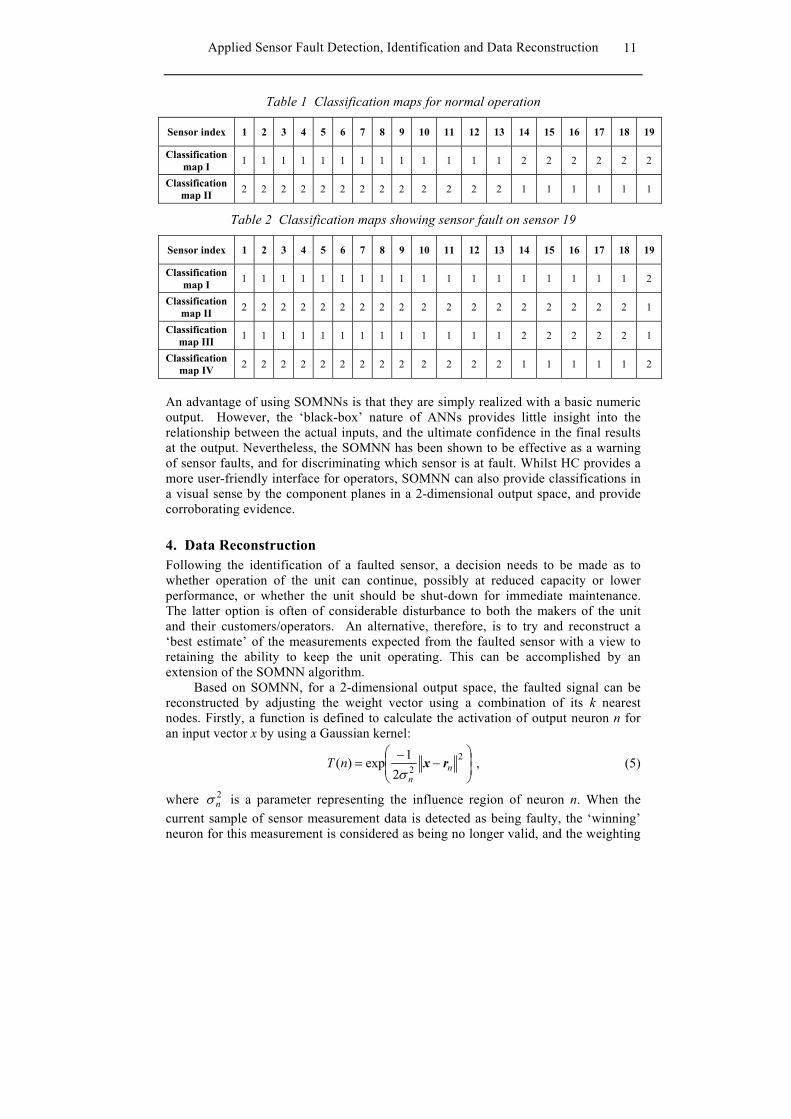
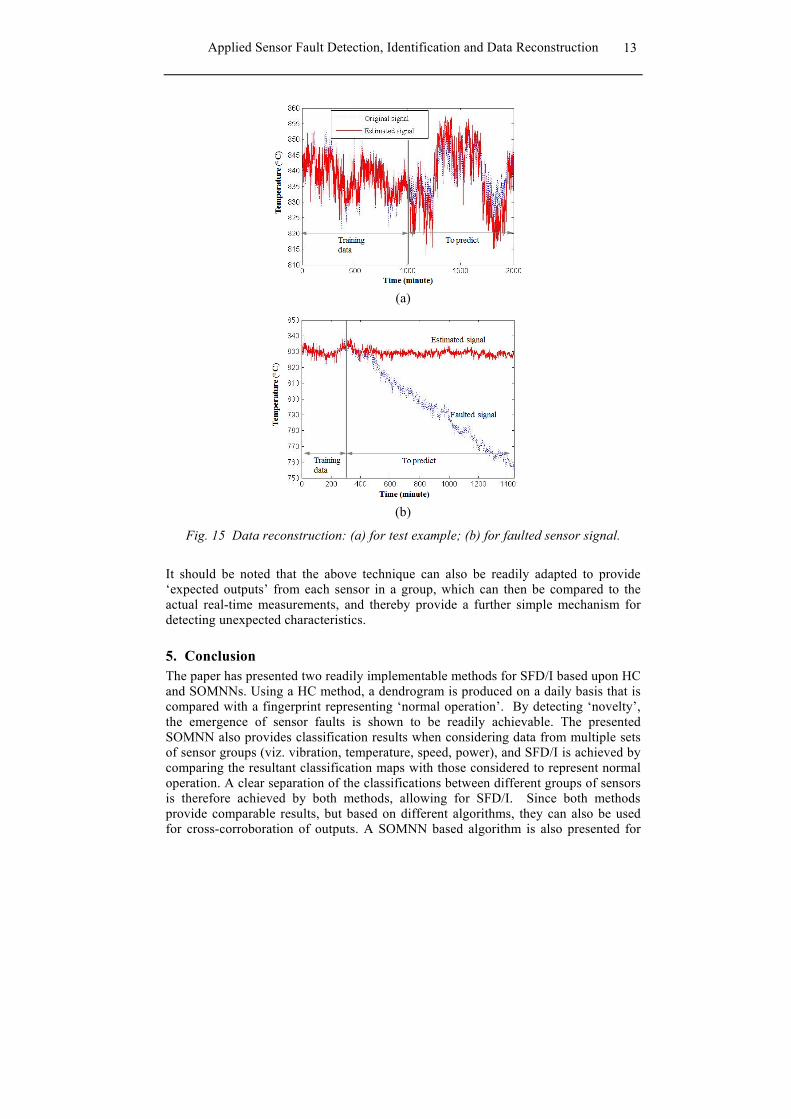
As a test example, normal operational measuresensors are studied, as shown in Fig. 14. The first 1000 minutes are used as training data, and estimates of measurement of sensor 19, from 1000 to 2000 minutes, are calcu
a
∑ − ii22|||| xz
ments from burner tip temperature
lted. The original and estimation signals are shown in Fig. 15(a). The 2l -norm relative prediction error is 0.005% for the test example, signifying that the reconstruction bears an excellent correspondence with the ‘real’ measurements. For a further operational case study, the method is applied to the experimental trial d ta with a developing sensor fault, Fig. 11, and estimates of what would be expected from sensor 19 is reconstructed from the from the data of sensors 14 to 18. The reconstruction is shown in Fig. 15(b). From the results it can be seen that from the onset of the ‘fault period’, the reconstructed data follows the ‘normal trend’, as might be expected from the characteristics of the other sensors, very reliably.
Fig. 14 Data reconstruction test example (6 burner tip temperature sensors)
(S = Sensor)
13
Applied Sensor Fault Detection, Identification and Data Reconstruction
(a)
(b)
Fig. 15 Data reconstruction: (a) for t xample; (b) for faulted sensor signal.
should be noted that the above technique can also be readily adapted to provide
5. Conclusion sented two readily implementable methods for SFD/I based upon HC
est e
It‘expected outputs’ from each sensor in a group, which can then be compared to the actual real-time measurements, and thereby provide a further simple mechanism for detecting unexpected characteristics.
The paper has preand SOMNNs. Using a HC method, a dendrogram is produced on a daily basis that is compared with a fingerprint representing ‘normal operation’. By detecting ‘novelty’, the emergence of sensor faults is shown to be readily achievable. The presented SOMNN also provides classification results when considering data from multiple sets of sensor groups (viz. vibration, temperature, speed, power), and SFD/I is achieved by comparing the resultant classification maps with those considered to represent normal operation. A clear separation of the classifications between different groups of sensors is therefore achieved by both methods, allowing for SFD/I. Since both methods provide comparable results, but based on different algorithms, they can also be used for cross-corroboration of outputs. A SOMNN based algorithm is also presented for
14 Y. Zhang, C.M. Bingham and M. Gallimore
References RTON, T., JOHNSON, T. Anomaly Detection for Advanced Military
[2] S, K. Setting Up of a Probabilistic Neural
[3] based
[4] , GONCALVES, L. F., BOSA, J. L., BALEN, T. R.,
[5] f Unsupervised Clustering
[6] YU, D. Abnormal Data Detection Based on
[7] Based on
[8] DMAN, J. 14.3.12 Hierarchical Clustering,
[9]
sensor measurement reconstruction. It is demonstrated that estimated measurements from a sensor identified as being faulted, can be reconstructed through an extension to the presented SOMNN algorithm. The efficacy of the technique is shown through the use of measurements from a set of burner tip temperature sensors that are subject to an operational fault. The underlying principles of the techniques presented here are currently being used for monitoring a fleet of gas turbines.
[1] BROTHEAircraft Using Neural Networks. IEEE Proceedings of Aerospace Conference, vol. 6, 2001, 3113 p. ROMESIS, C., MATHIOUDAKINetwork for Sensor Fault Detection Including Operation with Component Faults. Journal of Engineering for Gas Turbines and Power, vol. 125, 2003. 634 p. WU, S., CHOW, T. W. S. Induction Machine Fault Detection Using SOM-RBF Neural Networks. IEEE Transactions on Industrial Electronics, vol. 51(1), 2004. 183 p. ELISSA, K.LUBASZEWSKI, M. S., SCHNEIDER, E. L., and HENRIQUES, R. V. Fault Detection, Diagosis and Prediction in Electrical Valves using Self-organizing Maps, Journal of Electron Test, vol. 10, 2011. 1007 p. DATTA, A., MAVROIDIS, C., HOSEK, M. A Role ofor Intelligent Fault Diagnosis. ASME International Mechanical Engineering Congress and Exposition, 2007. KUN, Y., BAO, W., HU, Q., Hierarchical Clustering. Power Engineering, vol. 25(6), 2005. 865 p. ZHANG, Y., ZHANG, J., MA, J., WANG, Z. Fault Detection Hierarchical Cluster Analysis in Wide Area Backup Protection System. Energy and Power Engineering, 2009. 21 p. HASTIE, T., TIBSHIRANI, R., FRIEThe Elements of Statistical Learning (2nd ed.). New York: Springer. 2009. 520 p. FORT, J.C. SOM’s Mathematics, Neural Networks, vol. 19, 2006, 812 p.
[10] Matlab version 7.10.0. Natick Massachusetts, the Mathworks Inc., 2010.