Embed Size (px)
Citation preview

Further Assessment
City of Bradford Metropolitan District Council
Department of Environmental Protection and Waste Management January 2007
- 45 -
Air Quality Monitoring Station Report for
City of Bradford Metropolitan District Council
Air Quality Monitoring Station at Mayo Avenue
Interim Report October 2004 – June 2005
Casella ETI Data Services, Regent House, Wolseley Road, Kempston, Bedford, MK42 7JY
Tel: 01234 844100 Fax: 01234 841490
A.Q.M.S. Report for Mayo Avenue Page 1

Further Assessment
City of Bradford Metropolitan District Council
Department of Environmental Protection and Waste Management January 2007
- 46 -
Data Management Report for Mayo Avenue Air Quality Monitoring Station
Contents
1. Introduction
2. Data Summary
2.1 Nitrogen Dioxide (NO2) 2.2 Data Capture 2.3 Calibrations
Appendices
1. Graphical Reports
1.1 Monthly plots of comparative one hour NO2 mean (µg/m3) in reference to N.A.Q.S. guideline values
2. Conversion Factors from ppb to µg/m3
A.Q.M.S. Report for Mayo Avenue Page 2

Further Assessment
City of Bradford Metropolitan District Council
Department of Environmental Protection and Waste Management January 2007
- 47 -
1. Introduction
This report is a summary of air quality data from the ambient Air Quality Monitoring Station (A.Q.M.S.) located at the following site:
Mayo Avenue
Pollutants and other parameters monitored at Mayo Avenue are:
• NOx (Oxides of Nitrogen) • NO (Nitric Oxide) • NO2 (Nitrogen Dioxide)
This report presents the summarised data in relation to the UK National Air Quality Standards (N.A.Q.S.) (Jan. 2000), with updates to reflect the 2005 guidance figures.
NO2 OBJECTIVES: 200 micrograms per cubic metre or less, when expressed as an hourly mean, not to be exceeded more than eighteen times a year to be achieved by 31st December 2005. 40 micrograms per cubic metre or less, when expressed as an annual mean, to be achieved by 31st December 2005.
For the purpose of consistency in relation to UK Automatic Urban and Rural Network Air Quality Monitoring Stations, gaseous data and calibration results are measured and logged as ppb (parts per billion) or ppm (parts per million) concentrations and not as µg/m3 (micrograms per cubic metre). Data for gas concentrations for this report that is reported as a weight / volume figure has been converted from ppb or ppm to µg/m3 or mg/m3 concentrations.
A.Q.M.S. Report for Mayo Avenue Page 3
Further Assessment
City of Bradford Metropolitan District Council
Department of Environmental Protection and Waste Management January 2007
- 48 -
2. Data Summary
2.1 Nitrogen Dioxide (NO2)
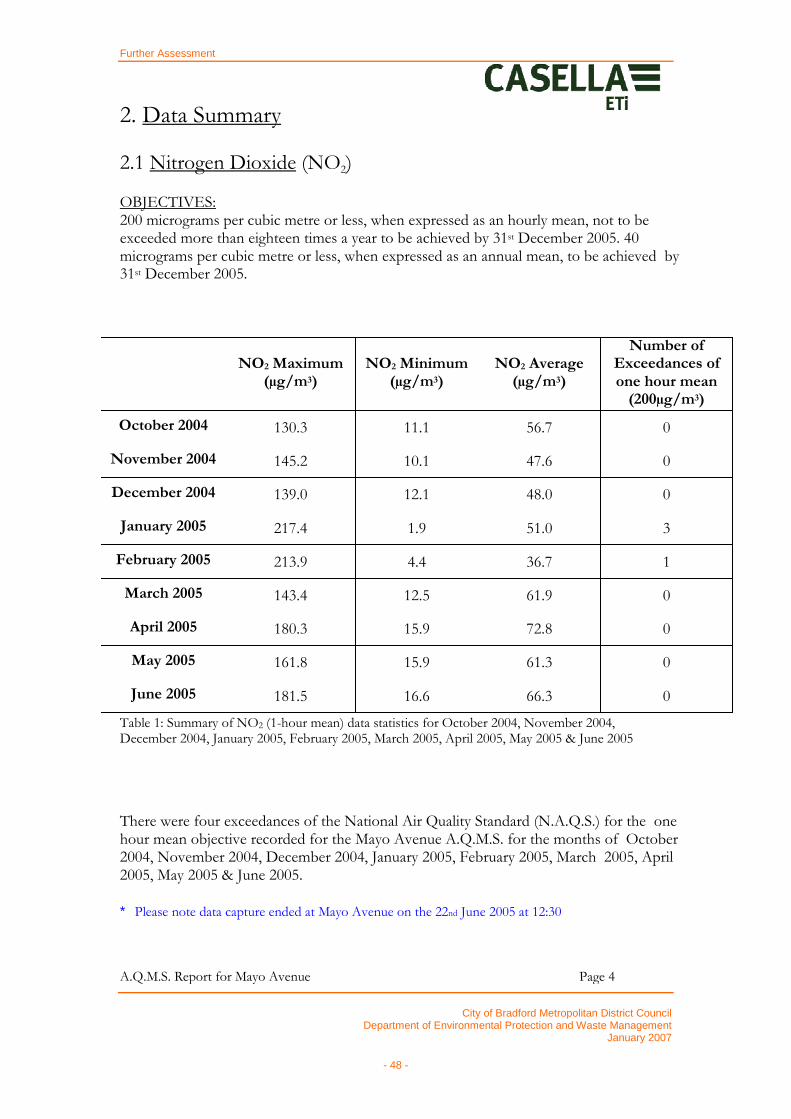
OBJECTIVES: 200 micrograms per cubic metre or less, when expressed as an hourly mean, not to be exceeded more than eighteen times a year to be achieved by 31st December 2005. 40 micrograms per cubic metre or less, when expressed as an annual mean, to be achieved by 31st December 2005.
NO2 Maximum (µg/m3)
NO2 Minimum (µg/m3)
NO2 Average (µg/m3)
Number of Exceedances of one hour mean (200µg/m3)
October 2004 130.3 11.1 56.7 0
November 2004 145.2 10.1 47.6 0
December 2004 139.0 12.1 48.0 0
January 2005 217.4 1.9 51.0 3
February 2005 213.9 4.4 36.7 1
March 2005 143.4 12.5 61.9 0
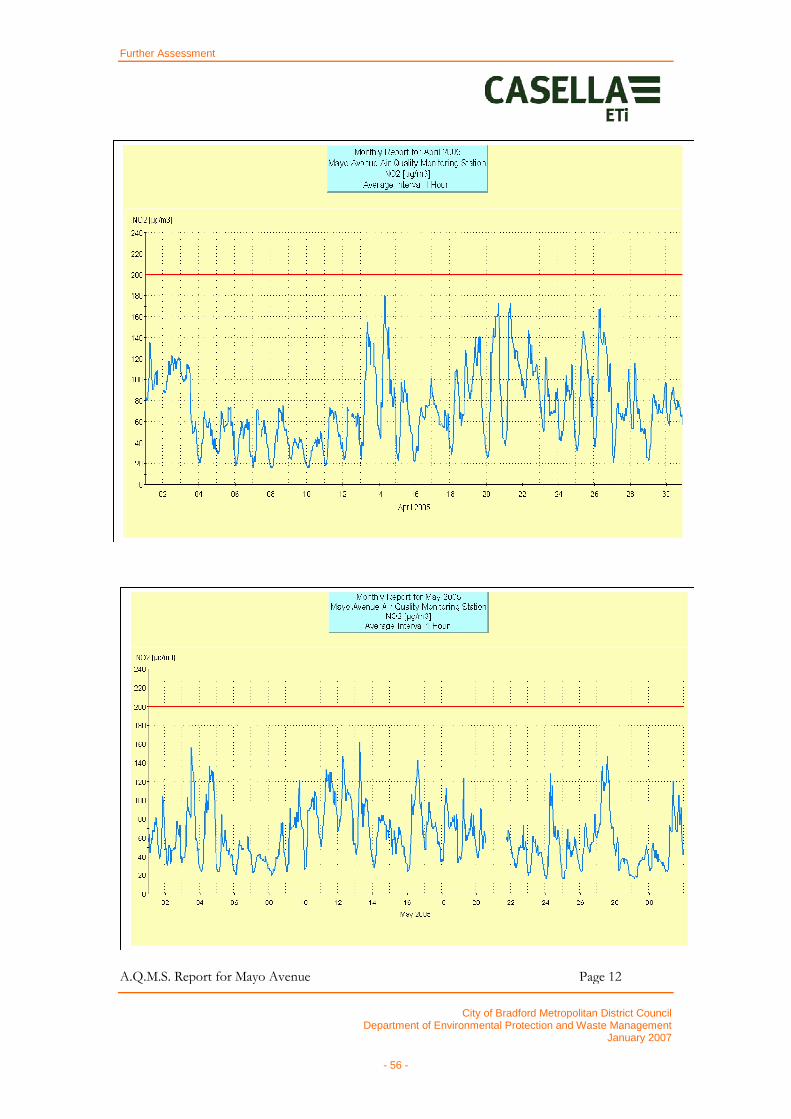
April 2005 180.3 15.9 72.8 0
May 2005 161.8 15.9 61.3 0
June 2005 181.5 16.6 66.3 0
Table 1: Summary of NO2 (1-hour mean) data statistics for October 2004, November 2004, December 2004, January 2005, February 2005, March 2005, April 2005, May 2005 & June 2005
There were four exceedances of the National Air Quality Standard (N.A.Q.S.) for the one hour mean objective recorded for the Mayo Avenue A.Q.M.S. for the months of October 2004, November 2004, December 2004, January 2005, February 2005, March 2005, April 2005, May 2005 & June 2005.
∗ Please note data capture ended at Mayo Avenue on the 22nd June 2005 at 12:30
A.Q.M.S. Report for Mayo Avenue Page 4

Further Assessment
City of Bradford Metropolitan District Council
Department of Environmental Protection and Waste Management January 2007
- 49 -
2004 - 2005 NO2 Monthly Mean
(µg/m3)
Number of Exceedances of one hour mean
(200µg/m3)
October 2004 56.7 0
November 2004 47.6 0
December 2004 48.0 0
January 2005 51.0 3
February 2005 36.7 1
March 2005 61.9 0
April 2005 72.8 0
May 2005 61.3 0
June 2005 66.3 0
Average to date: 54.2 Total: 4
Table 2: Summary of NO2 (1-hour mean) data statistics for 2004 - 2005
∗ Please note data capture ended at Mayo Avenue on the 22nd June 2005 at 12:30
A.Q.M.S. Report for Mayo Avenue Page 5

Further Assessment
City of Bradford Metropolitan District Council
Department of Environmental Protection and Waste Management January 2007
- 50 -
2.2 Data Capture
Data capture statistics are for all valid data. When the analysers are in calibration or there are visits to the station by service engineers, data can be excluded. Data is stored in the data logger by communication between the logger and the analysers. Data loss can occur if the data cannot be stored onto the logger. This can occur when there are:
• Power cuts to the A.Q.M.S. • Analyser faults • Logger faults
The following is a summary of the data capture statistics for Mayo Avenue A.Q.M.S.
Nitrogen Oxides (NOx)
Nitric Oxide (NO)
Nitrogen Dioxide (NO2)
October 2004 96.2 % 96.2 % 96.2 %
November 2004 93.1 % 93.1 % 93.1 %
December 2004 84.1 % 84.0 % 84.4 %
January 2005 66.4 % 66.0 % 65.7 %
February 2005 63.7 % 63.7 % 63.7 %
March 2005 79.2 % 79.2 % 79.2 %
April 2005 98.3 % 98.3 % 98.3 %
May 2005 95.6 % 95.6 % 95.6 %
June 2005 100 % 100 % 100 %
Table 3: Data capture statistics for the months of October 2004, November 2004, December 2004, January 2005, February 2005, March 2005, April 2005, May 2005 & June 2005
∗ Please note data capture ended at Mayo Avenue on the 22nd June 2005 at 12:30
A.Q.M.S. Report for Mayo Avenue Page 6

Further Assessment
City of Bradford Metropolitan District Council
Department of Environmental Protection and Waste Management January 2007
- 51 -
2.3 Calibrations
Data from an analyser is stored on the logger as ‘raw’ or ‘uncorrected’ data, therefore data needs to be corrected or ‘validated’. To validate data, the analysers need to be checked against a referenced standard of ‘zero’ air and ‘span’ gas.
There are two methods available to correct data by using calibration checks to verify that the analyser is corrected for any response change:
• Daily automatic calibration checks • Fortnightly manual calibration checks
The A.Q.M.S. at Mayo Avenue uses the fortnightly manual calibration checks.
A fortnightly manual calibration is also performed at the A.Q.M.S. at Mayo Avenue. This check is performed to verify the response of the analyser in reference to the ‘zero’ and ‘span’ by introducing a high concentration of NO gas. These results are then used to validate the data for the NOx analyser and the calibration results are then used to create a calibration factor, which is used to rescale the data.
A.Q.M.S. Report for Mayo Avenue Page 7
Further Assessment
City of Bradford Metropolitan District Council
Department of Environmental Protection and Waste Management January 2007
- 52 -
Appendices
1. Graphical Reports
1.1 Monthly plots of comparative one hour NO2 mean (µg/m3) in reference to N.A.Q.S. guideline values
2. Conversion Factors from ppb to µg/m3
A.Q.M.S. Report for Mayo Avenue Page 8

Further Assessment
City of Bradford Metropolitan District Council
Department of Environmental Protection and Waste Management January 2007
- 53 -
Appendix 1 Graphical Reports
1.1 Monthly plots for Nitrogen Dioxide (NO2) • The objective for NO2 is 200 µg/m3 when expressed as a one-hour mean, not to be
exceeded more than eighteen times per year. • Monthly plots of comparative one hour NO2 average values (µg/m3), objective
expressed by the red limit line. ∗ Due to software error there is a change of format for NO2 graphs for October and November 2004.
A.Q.M.S. Report for Mayo Avenue Page 9

Further Assessment
City of Bradford Metropolitan District Council
Department of Environmental Protection and Waste Management January 2007
- 54 -
A.Q.M.S. Report for Mayo Avenue Page 10

Further Assessment
City of Bradford Metropolitan District Council
Department of Environmental Protection and Waste Management January 2007
- 55 -
A.Q.M.S. Report for Mayo Avenue Page 11
Further Assessment
City of Bradford Metropolitan District Council
Department of Environmental Protection and Waste Management January 2007
- 56 -
A.Q.M.S. Report for Mayo Avenue Page 12

Further Assessment
City of Bradford Metropolitan District Council
Department of Environmental Protection and Waste Management January 2007
- 57 -
∗ Please note data capture ended at Mayo Avenue on the 22nd June 2005 at 12:30
A.Q.M.S. Report for Mayo Avenue Page 13

Further Assessment
City of Bradford Metropolitan District Council
Department of Environmental Protection and Waste Management January 2007
- 58 -
Appendix 2 Conversion factors for ppb to µg/m3
Conversion rates at 20°C and 101.3kPa:
• NO2
1.91 x ppb = µg/m3
Craig Peet Kelly Petts Sarah Jones
Casella ETi Data Management Services
June 2005
END OF REPORT
This report is based on information collected from your Air Quality Monitoring Station and the data has been interpreted into a report to the best of our ability. We are unable to accept any responsibility for inaccuracies created during this process. If you require further clarification of this report and the data held within, please contact Casella Data Services.
A.Q.M.S. Report for Mayo Avenue Page 14


![CITY OF BRADFORD METROPOLITAN DISTRICT COUNCIL (1… · CITY OF BRADFORD METROPOLITAN DISTRICT COUNCIL (1) AS AUTHORITY AND [] (2) AS PROVIDER ... City of Bradford Metropolitan District](https://img.pdfslide.net/doc/110x75/5b94921409d3f2df3f8d406f/city-of-bradford-metropolitan-district-council-1-city-of-bradford-metropolitan.jpg)