Embed Size (px)
Citation preview

Air Toxics Inventories at the National, Regional, Air Toxics Inventories at the National, Regional, and Local Leveland Local Level
Bob McConnellBob McConnellU.S. EPA, Region 1U.S. EPA, Region 1
Boston, MABoston, MA{[email protected]}{[email protected]}

Geographic Scale of InventoriesGeographic Scale of Inventories
EPA’s National Emissions EPA’s National Emissions Inventory (NEI)Inventory (NEI)
HAP Inventory HAP Inventory Improvements in New Improvements in New EnglandEngland
Local inventory developed Local inventory developed by New Haven, CTby New Haven, CT

EPA’s National Inventory for HAPsEPA’s National Inventory for HAPs
Most recent version is the draft 2002 NEI, available at:Most recent version is the draft 2002 NEI, available at:– ftp://ftp.epa.gov/EmisInventory/draftnei2002/ftp://ftp.epa.gov/EmisInventory/draftnei2002/
A more “user friendly” version is available at (for 1999):A more “user friendly” version is available at (for 1999):– http://www.epa.gov/air/data/index.htmlhttp://www.epa.gov/air/data/index.html
EPA’s NEI is prepared once every 3 yearsEPA’s NEI is prepared once every 3 years– 1996, 1999, 2002 ……..1996, 1999, 2002 ……..
The emission estimates are from …..The emission estimates are from …..– State, Local and Tribal agenciesState, Local and Tribal agencies
– EPA’s Emission Standards DivisionEPA’s Emission Standards Division
– Other EPA offices & programs (Transportation, TRI, etc)Other EPA offices & programs (Transportation, TRI, etc)
Emission estimates prepared for all 188 HAPs defined by the CAAEmission estimates prepared for all 188 HAPs defined by the CAA

1999 National Emission Inventory1999 National Emission Inventory
From EPA’s Air Data From EPA’s Air Data website for 1999website for 1999
Stationary source Stationary source emissions > mobile emissions > mobile source emissionssource emissions
PointAreaOnroadOffroad
Total HAPs

1999 Emissions Inventory for Texas1999 Emissions Inventory for Texas
From EPA’s Air Data From EPA’s Air Data website for 1999website for 1999
Similar to National Similar to National inventory; slightly inventory; slightly higher Onroad mobile higher Onroad mobile contributioncontribution
PointAreaOnroadOffroad
Total HAPs

1999 Emissions Inventory for Harris County, TX1999 Emissions Inventory for Harris County, TX
From EPA’s Air Data From EPA’s Air Data website for 1999website for 1999
Onroad mobile Onroad mobile emissions greater still.emissions greater still.
Mobile > stationary Mobile > stationary source emissionssource emissions
PointAreaOnroadOffroad
Total HAPs

HAP Inventories for U.S., Texas, and Harris CountyHAP Inventories for U.S., Texas, and Harris County
PointAreaOnroadOffroad
PointAreaOnroadOffroad
PointAreaOnroadOffroad
U.S.
Texas
Harris County
Top 6 HAPs at National, State, and County LevelTop 6 HAPs at National, State, and County Level
PollutantPollutant Primary SourcePrimary Source
BenzeneBenzene Mobile sourcesMobile sources
FormaldehydeFormaldehyde Area sourcesArea sources{resins, fertilizer mfg., forest fires}{resins, fertilizer mfg., forest fires}
AcetaldehydeAcetaldehyde Mobile sourcesMobile sources
Methylene chlorideMethylene chloride Area sourcesArea sources{degreasing solvent, paint remover}{degreasing solvent, paint remover}
1,3-Butadiene1,3-Butadiene Mobile sourcesMobile sources
PerchloroethylenePerchloroethylene Point sources Point sources {degreasing solvent, dry cleaning}{degreasing solvent, dry cleaning}

Other HAPs Emitted in Large AmountsOther HAPs Emitted in Large Amounts
NationalNational TexasTexas Harris CountyHarris County7. Acrolein7. Acrolein 7. Acrolein7. Acrolein 7. 1,3-Dichloropropene7. 1,3-Dichloropropene
8. 1,3-Dichloropropene8. 1,3-Dichloropropene 8. 1,3-Dichloropropene8. 1,3-Dichloropropene 8. Chloroform8. Chloroform
9. Trichloroethylene9. Trichloroethylene 9. Chloroform9. Chloroform 9. Acrolein9. Acrolein
10. Chloroform10. Chloroform 10. Trichloroethylene10. Trichloroethylene 10. Vinyl Chloride10. Vinyl Chloride
11. Lead compounds11. Lead compounds 11. Ethylene oxide11. Ethylene oxide 11. Trichloroethylene11. Trichloroethylene
12. Manganese12. Manganese 12. Vinyl Chloride12. Vinyl Chloride 12. Ethylene Dichloride12. Ethylene Dichloride
13. POM13. POM 13. Ethylene Dichloride13. Ethylene Dichloride 13. Carbon Tet.13. Carbon Tet.
14. Carbon Tet.14. Carbon Tet. 14. POM14. POM 14. Ethylene oxide14. Ethylene oxide
15. Nickel compounds15. Nickel compounds 15. Carbon Tet.15. Carbon Tet. 15. Chromium comp.15. Chromium comp.

Point Source Estimation Methods in the NEIPoint Source Estimation Methods in the NEI
No emission cutoff used for inclusion as a point sourceNo emission cutoff used for inclusion as a point source– if facility level data exists, included as a point sourceif facility level data exists, included as a point source
Data source rankings:Data source rankings:– 1. “Preferred” EPA MACT data1. “Preferred” EPA MACT data– 2. State, local, tribal data2. State, local, tribal data– 3. Other EPA MACT data3. Other EPA MACT data– 4. TRI data4. TRI data
““Preferred” EPA MACT source categories:Preferred” EPA MACT source categories:– Medical Waste CombustorsMedical Waste Combustors– Medical Waste IncineratorsMedical Waste Incinerators– Brick & Clay ManufacturingBrick & Clay Manufacturing– Coke OvensCoke Ovens
NEI includes data for all 188 CAA HAPsNEI includes data for all 188 CAA HAPs– Some states collect other HAPs; not currently put into NEISome states collect other HAPs; not currently put into NEI
NEI assigns a unique facility ID to plant locations NEI assigns a unique facility ID to plant locations

Development of Nonpoint (area) inventoryDevelopment of Nonpoint (area) inventory
EPA gives preference to state, local, tribal data, except:EPA gives preference to state, local, tribal data, except:– portable fuel containersportable fuel containers– animal husbandryanimal husbandry– agricultural fertilizersagricultural fertilizers– biogenic, geogenic emission sourcesbiogenic, geogenic emission sources
Data origination codesData origination codes– S, State agencyS, State agency– L, Local agencyL, Local agency– R, Tribal agencyR, Tribal agency– P, Regional planning organizationP, Regional planning organization– E, EPA data, from Emissions Inventory GroupE, EPA data, from Emissions Inventory Group– M, EPA data, from Emission Standards GroupM, EPA data, from Emission Standards Group

States that submitted Nonpoint data to EPA’s 2002 NEIStates that submitted Nonpoint data to EPA’s 2002 NEI

Onroad Mobile Source Estimates in the NEIOnroad Mobile Source Estimates in the NEI
Developed using EPA’s NMIM modelDeveloped using EPA’s NMIM model– this model uses Mobile 6 based emission factorsthis model uses Mobile 6 based emission factors
State data used, if provided, for:State data used, if provided, for:– Vehicle miles traveled (VMT)Vehicle miles traveled (VMT)– Mobile 6 inputsMobile 6 inputs
States can also just send alternative emissionsStates can also just send alternative emissions If no state data supplied:If no state data supplied:
– Default VMT from FHADefault VMT from FHA Most states provided Onroad data for 2002 NEIMost states provided Onroad data for 2002 NEI Onroad mobile estimates provided for 33 HAPsOnroad mobile estimates provided for 33 HAPs Different fuel blends can be modeledDifferent fuel blends can be modeled

Nonroad Emission Estimates in 2002 NEINonroad Emission Estimates in 2002 NEI
Developed using NMIMDeveloped using NMIM– NMIM incorporates EPA’s NONROAD 2004 modelNMIM incorporates EPA’s NONROAD 2004 model– State supplied inputs to NONROAD used if providedState supplied inputs to NONROAD used if provided– State supplied Nonroad emission estimates used if providedState supplied Nonroad emission estimates used if provided
Commercial AircraftCommercial Aircraft– FAA’s Emissions and Dispersion Modeling System FAA’s Emissions and Dispersion Modeling System
Commercial Marine VesselsCommercial Marine Vessels– Applied speciation profiles to PM and VOC emission estimatesApplied speciation profiles to PM and VOC emission estimates– Used state data where providedUsed state data where provided
LocomotivesLocomotives– Applied speciation profiles to PM and VOC emission estimatesApplied speciation profiles to PM and VOC emission estimates– Used Dept. of Transportation data on county level rail activity to apportion Used Dept. of Transportation data on county level rail activity to apportion
national data to countiesnational data to counties– Used state data where providedUsed state data where provided
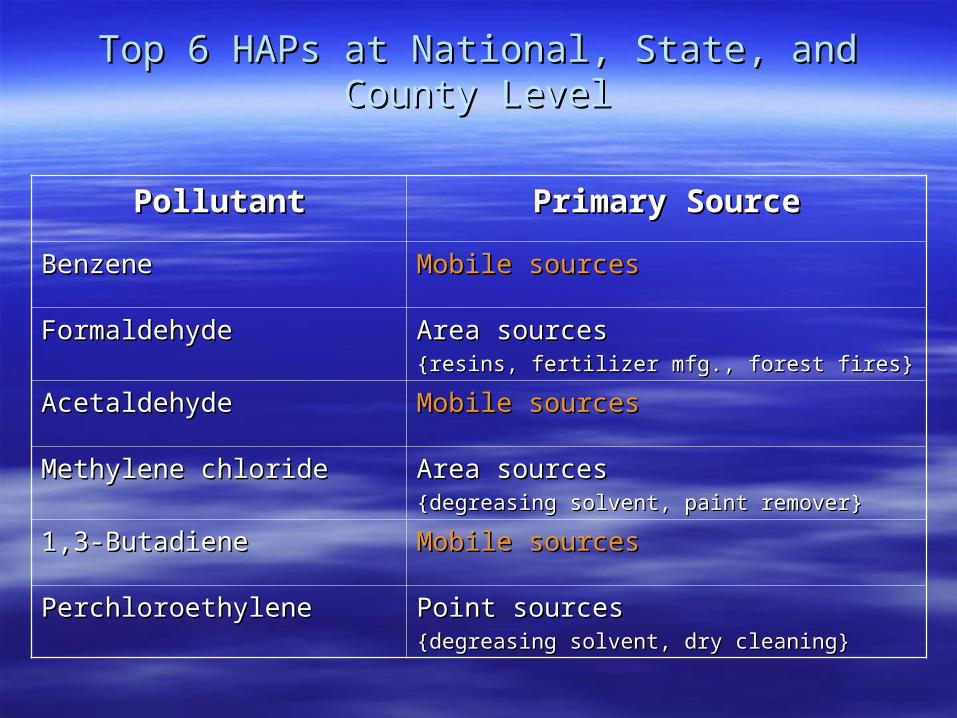
EPA Region I Efforts to Improve HAP InventoriesEPA Region I Efforts to Improve HAP Inventories
1999: Regional workshop devoted to HAP inventory methods1999: Regional workshop devoted to HAP inventory methods Development of HAP inventory preparation plansDevelopment of HAP inventory preparation plans
– Meetings with all region 1 StatesMeetings with all region 1 States Focus on Point source HAP data collectionFocus on Point source HAP data collection
– Some New England states already were collecting HAP dataSome New England states already were collecting HAP data– Others, most notably Massachusetts, began collecting HAP dataOthers, most notably Massachusetts, began collecting HAP data
2001 - 2002: Region 1 analysis of 1996 NATA Results2001 - 2002: Region 1 analysis of 1996 NATA Results– Identified pollutants of concern in New EnglandIdentified pollutants of concern in New England
Defined as any HAP NATA showed exceeded cancer health benchmarkDefined as any HAP NATA showed exceeded cancer health benchmark Region prepared and distributed detailed inventories for these pollutantsRegion prepared and distributed detailed inventories for these pollutants
Developed comprehensive HAP websiteDeveloped comprehensive HAP website Encouraged and supported local HAP mitigation effortsEncouraged and supported local HAP mitigation efforts
– New Haven, CTNew Haven, CT– Lawrence, MALawrence, MA– Maine Air Toxics InitiativeMaine Air Toxics Initiative
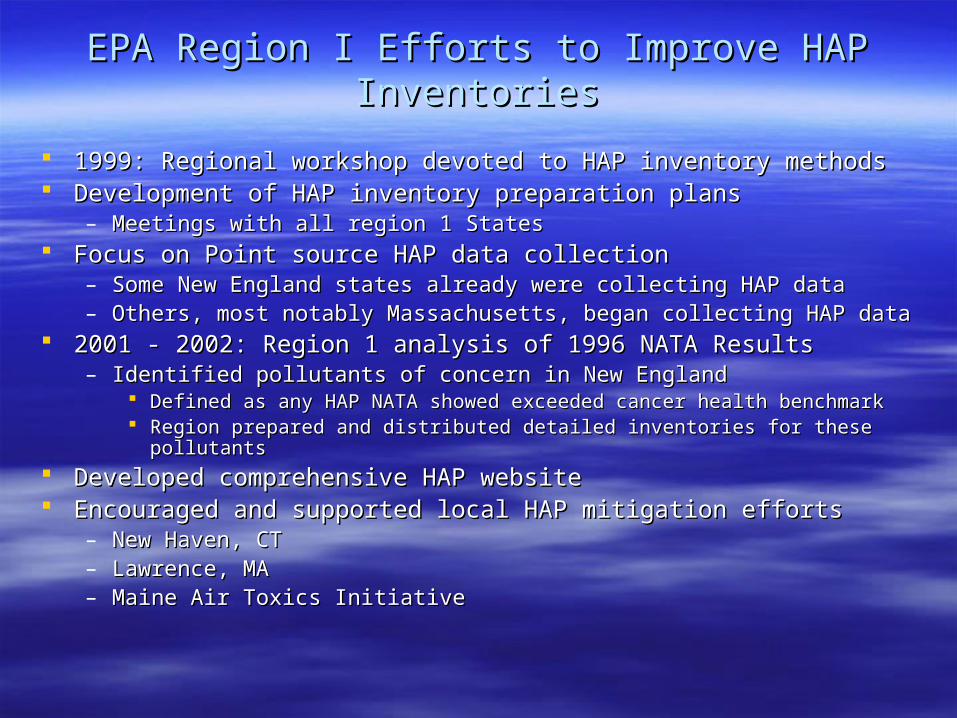
HAP Pollutants of Concern in New EnglandHAP Pollutants of Concern in New England
AcetaldehydeAcetaldehyde ChromiumChromium
AcroleinAcrolein Ethylene dibromideEthylene dibromide
BenzeneBenzene Ethylene dichlorideEthylene dichloride
1,3-Butadiene1,3-Butadiene FormaldehydeFormaldehyde
Carbon TetrachlorideCarbon Tetrachloride Polycyclic organic matterPolycyclic organic matter
ChloroformChloroform Diesel PMDiesel PM
Based on 1996 NATA

1996 Benzene Emissions in Connecticut1996 Benzene Emissions in Connecticut
Source CategorySource Category Emissions (tons/year)Emissions (tons/year)
Total PointTotal Point 0.130.13
Area & Nonpoint sourcesArea & Nonpoint sources
Gasoline distribution (Stage 1)Gasoline distribution (Stage 1) 37.137.1
Gasoline distribution (Stage 2)Gasoline distribution (Stage 2) 10.610.6
Misc. organic chemical processesMisc. organic chemical processes 0.20.2
LandfillsLandfills 2.22.2
Nat. gas transmission & storageNat. gas transmission & storage 6.66.6
Oil & nat. gas productionOil & nat. gas production 2.82.8
Forest FiresForest Fires 81.081.0
Open burningOpen burning 1.61.6
POTWsPOTWs 5.75.7
Stationary ICE enginesStationary ICE engines 0.130.13
Architectural surface coatingArchitectural surface coating 6.76.7
Total Area & Nonpoint sourcesTotal Area & Nonpoint sources 154.7154.7
Stationary sources

1996 Benzene Emissions in Connecticut1996 Benzene Emissions in Connecticut
Source CategorySource Category Emissions (tons/year)Emissions (tons/year)
Heavy duty diesel vehiclesHeavy duty diesel vehicles 24.224.2
Heavy duty gasoline vehiclesHeavy duty gasoline vehicles 60.160.1
Light duty diesel trucksLight duty diesel trucks 2.22.2
Light duty diesel vehiclesLight duty diesel vehicles 44
Light duty gasoline trucks Light duty gasoline trucks 576.3576.3
Light duty gasoline vehiclesLight duty gasoline vehicles 738.8738.8
MotorcyclesMotorcycles 10.710.7
Total Onroad Benzene EmissionsTotal Onroad Benzene Emissions 1416.31416.3
AircraftAircraft 3.73.7
Nonroad dieselNonroad diesel 109.8109.8
Nonroad gasoline, 2-stroke enginesNonroad gasoline, 2-stroke engines 146.2146.2
Nonroad gasoline, 4-stroke enginesNonroad gasoline, 4-stroke engines 404.2404.2
Commercial marine vesselsCommercial marine vessels 00
Total Nonroad Benzene EmissionsTotal Nonroad Benzene Emissions 663.9663.9
Mobile Sources

Inventory ImprovementsInventory Improvements
Prioritizing pollutants made Prioritizing pollutants made workload manageableworkload manageable
Providing detailed inventories to Providing detailed inventories to states eased review, fostered states eased review, fostered feedbackfeedback– Benzene emissions from Benzene emissions from
petroleum storage facilitiespetroleum storage facilities
– Chloroform emissions from pulp Chloroform emissions from pulp & paper mills& paper mills
– Identification of areas with open Identification of areas with open burning restrictionsburning restrictions
– Identification of closed, missing, Identification of closed, missing, and duplicate facilitiesand duplicate facilities

Development of Local Inventory for New Haven, CTDevelopment of Local Inventory for New Haven, CT
Coastal city bounded by hillsCoastal city bounded by hills Junction of 2 major interstate Junction of 2 major interstate
highwayshighways Population of 123,600Population of 123,600 Nonattainment for ozone and Nonattainment for ozone and
PM2.5 as well PM2.5 as well New Haven county had the New Haven county had the
Second largest amount of Second largest amount of air toxics in New Englandair toxics in New England

Source of Air Pollution in New HavenSource of Air Pollution in New Haven
Large stationary sources include Large stationary sources include petroleum storage facilities, petroleum storage facilities, fabric coaters, and metal fabric coaters, and metal products industries.products industries.
Smaller sources include many Smaller sources include many graphic arts and auto refinishing graphic arts and auto refinishing facilities.facilities.
Mobile sources include Mobile sources include emissions from 2 major emissions from 2 major interstates, the Tweed-New interstates, the Tweed-New Haven airport, the Providence Haven airport, the Providence and Worcester rail-line, and the and Worcester rail-line, and the Port of New HavenPort of New Haven

Preparing a Local InventoryPreparing a Local Inventory
EPA provided funding through our Community Air Toxics EPA provided funding through our Community Air Toxics Assessment programAssessment program
Work done by graduate students at Yale, New Haven Work done by graduate students at Yale, New Haven Board of Health, and New Haven Office of City PlanBoard of Health, and New Haven Office of City Plan
Effort made to inventory all mobile and stationary source Effort made to inventory all mobile and stationary source categoriescategories– Focus ended up being on stationary sourcesFocus ended up being on stationary sources
Final inventory used to focus local stakeholders on HAP Final inventory used to focus local stakeholders on HAP mitigation strategiesmitigation strategies

Point Source Inventory DevelopmentPoint Source Inventory Development
Started with a merged list of 33 sources from:Started with a merged list of 33 sources from:– 1999 NEI1999 NEI– 2000 TRI2000 TRI– 2000 CT-DEP VOC inventory (speciated)2000 CT-DEP VOC inventory (speciated)
Surveys sent to all sourcesSurveys sent to all sources– 16/33 responded16/33 responded– Emissions went from 211 tpy to 114 tpyEmissions went from 211 tpy to 114 tpy
Emissions from 13 of the 33 = 96% of total HAP emissionsEmissions from 13 of the 33 = 96% of total HAP emissions Difficulties encountered included:Difficulties encountered included:
– Lack of authority to require information from non-respondersLack of authority to require information from non-responders– trouble extracting data from EPA’s NEI databasetrouble extracting data from EPA’s NEI database

Area Source Inventory DevelopmentArea Source Inventory Development
Area source activity data resources:Area source activity data resources:– SurveysSurveys
Gas stations, dry cleaners, printers, auto refinishersGas stations, dry cleaners, printers, auto refinishers
– Local expertsLocal experts Structure fires, traffic markings, residential heating (oil)Structure fires, traffic markings, residential heating (oil)
– Local utilityLocal utility Residential heating (nat. gas)Residential heating (nat. gas)
– Existing researchExisting research Residential wood combustionResidential wood combustion
– Per capita analysisPer capita analysis Arch. surface coating, consumer & commercial productsArch. surface coating, consumer & commercial products
– Employee dataEmployee data Solvent cleaning, industrial surface coatingSolvent cleaning, industrial surface coating

Comparison to NEI Derived EstimatesComparison to NEI Derived Estimates
Source CategorySource Category NEI derived vs. Local estimateNEI derived vs. Local estimate
Res. Heating with GasRes. Heating with Gas + 34%+ 34%
Automobile RefinishingAutomobile Refinishing + 28%+ 28%
Architectural Surf. Coating; Architectural Surf. Coating;
Consumer ProductsConsumer Products
00
Stage 2Stage 2 - 5%- 5%
Structure FiresStructure Fires - 14%- 14%
Dry CleaningDry Cleaning - 56%- 56%
Aircraft RefuelingAircraft Refueling - 67%- 67%
Graphic ArtsGraphic Arts (- 85%)(- 85%)
Res. Heating with OilRes. Heating with Oil - 87%- 87%
Traffic MarkingsTraffic Markings Different set of HAPsDifferent set of HAPs
Stage 1Stage 1 No emissions in NEINo emissions in NEI

Onroad Mobile Source EmissionsOnroad Mobile Source Emissions
Considered using EPA’s Mobile model directlyConsidered using EPA’s Mobile model directly– too difficult to perform sub-county run too difficult to perform sub-county run
Obtained local data from CT-DOT for:Obtained local data from CT-DOT for:– Traffic counts Traffic counts – Vehicle mixVehicle mix
Used this data with emission factors from Mobile 6Used this data with emission factors from Mobile 6 Uncertainty with Onroad emission estimateUncertainty with Onroad emission estimate
– couldn’t address traffic congestioncouldn’t address traffic congestion– believe that heavy duty diesel is being under-predictedbelieve that heavy duty diesel is being under-predicted

Nonroad Mobile Source EmissionsNonroad Mobile Source Emissions
AircraftAircraft– LTO data for Tweed New Haven AirportLTO data for Tweed New Haven Airport
RailRail– Fuel consumption records obtained from the three local companiesFuel consumption records obtained from the three local companies
Commercial MarineCommercial Marine– EIA fuel consumption data, Waterborne Commerce StatisticsEIA fuel consumption data, Waterborne Commerce Statistics
Remaining Nonroad sectors apportioned from county levelRemaining Nonroad sectors apportioned from county level

New Haven HAP Inventory by CategoryNew Haven HAP Inventory by Category
Point
Area
Onroad
Offroad
Total HAP Emissions: 997 tons
116 different HAPs

Emissions vs. Health RiskEmissions vs. Health Risk
Top 10 by EmissionsTop 10 by Emissions Top 10 by Health RiskTop 10 by Health RiskDiesel PMDiesel PM Diesel PMDiesel PM
TolueneToluene POMPOM
XyleneXylene AcroleinAcrolein
MTBEMTBE 2,2,4-TMP2,2,4-TMP
BenzeneBenzene FormaldehydeFormaldehyde
2,2,4-TMP2,2,4-TMP DioxinDioxin
FormaldehydeFormaldehyde BenzeneBenzene
Methyl ChloroformMethyl Chloroform ChromiumChromium
Ethyl BenzeneEthyl Benzene 1,3-Butadiene1,3-Butadiene
N-HexaneN-Hexane PropionaldehydePropionaldehyde

HAP Risk Reduction Stakeholder GroupHAP Risk Reduction Stakeholder Group
EPAEPA CT-DEPCT-DEP New Haven Office of City Plan, Health Dept, EJ Network, New Haven Office of City Plan, Health Dept, EJ Network,
AldermenAldermen Local GroupsLocal Groups
– Asthma InitiativeAsthma Initiative– Environment NortheastEnvironment Northeast– CT Fund for the EnvironmentCT Fund for the Environment
NESCAUMNESCAUM Yale UniversityYale University PSEG (Electric Utility)PSEG (Electric Utility) Congresswoman DeLauro’s OfficeCongresswoman DeLauro’s Office

New Haven HAP Risk Reduction StrategyNew Haven HAP Risk Reduction Strategy
Diesel vehiclesDiesel vehicles– Early adoption of ultra low sulfur diesel fuel for public & private Early adoption of ultra low sulfur diesel fuel for public & private
fleets;fleets;– school & transit bus retrofitsschool & transit bus retrofits– anti idling campaignanti idling campaign– construction equipment emission controlsconstruction equipment emission controls
Passenger vehiclesPassenger vehicles– VMT reduction effortsVMT reduction efforts
Stationary sourcesStationary sources– gasoline stations, energy efficiency efforts, renewablesgasoline stations, energy efficiency efforts, renewables
Indoor airIndoor air– Tools for Schools, indoor tobacco smoke outreachTools for Schools, indoor tobacco smoke outreach

Local HAP Inventory Development; Final ThoughtsLocal HAP Inventory Development; Final Thoughts
BenefitsBenefits– raised awareness at City Hall, and in local communityraised awareness at City Hall, and in local community– established City as key stakeholder in air pollution issuesestablished City as key stakeholder in air pollution issues– gave legitimacy to reduction measuresgave legitimacy to reduction measures– established emissions baseline to measure reductions againstestablished emissions baseline to measure reductions against
ConcernsConcerns– just how good is the inventory?just how good is the inventory?– modeling & monitoring needs remain unfulfilledmodeling & monitoring needs remain unfulfilled
New Haven’s Website:New Haven’s Website:– www.cityofnewhaven.com/govt/gov28.htmwww.cityofnewhaven.com/govt/gov28.htm

HAP Inventory Improvement NeedsHAP Inventory Improvement Needs
National reporting similar to criteria pollutantsNational reporting similar to criteria pollutants More widespread use of tox-weighted HAP More widespread use of tox-weighted HAP
inventoriesinventories Additional $$ for State & Local HAP inventory Additional $$ for State & Local HAP inventory
projectsprojects More source testing – improved speciation profilesMore source testing – improved speciation profiles