Embed Size (px)
Citation preview

Airline industry problems and prospects
Dr Peter MorrellDirector of Research
Seminar, Universidade Lusofóna, Lisbon12 December 2007
Dr Peter Morrell, Department of Air Transport 1
Presentation Outline
The elements of the jig-saw puzzleTrends in financial resultsIndustry charcateristics and problemsMajor constraintsTrends in load factorsFinancing?Traffic growth prospectsProductivity is the keyThe environmental challengeSummary of main points

Dr Peter Morrell, Department of Air Transport 2
The airline jig-saw puzzle
Efficiency improvement
Airline input costs
Distribution costs
Supply and costs
Air fares and rates
Total air transport demand
GDP / disposableIncome / trade
Efficiency improvement
Infrastructureconstraints
Internationalregulation
Profit / loss
Revenues
Productdevelopment
Aircraft/airportdevelopment
Informationtechnology

Dr Peter Morrell, Department of Air Transport 3
World scheduled airline financial results: US$
Dr Peter Morrell, Department of Air Transport 4
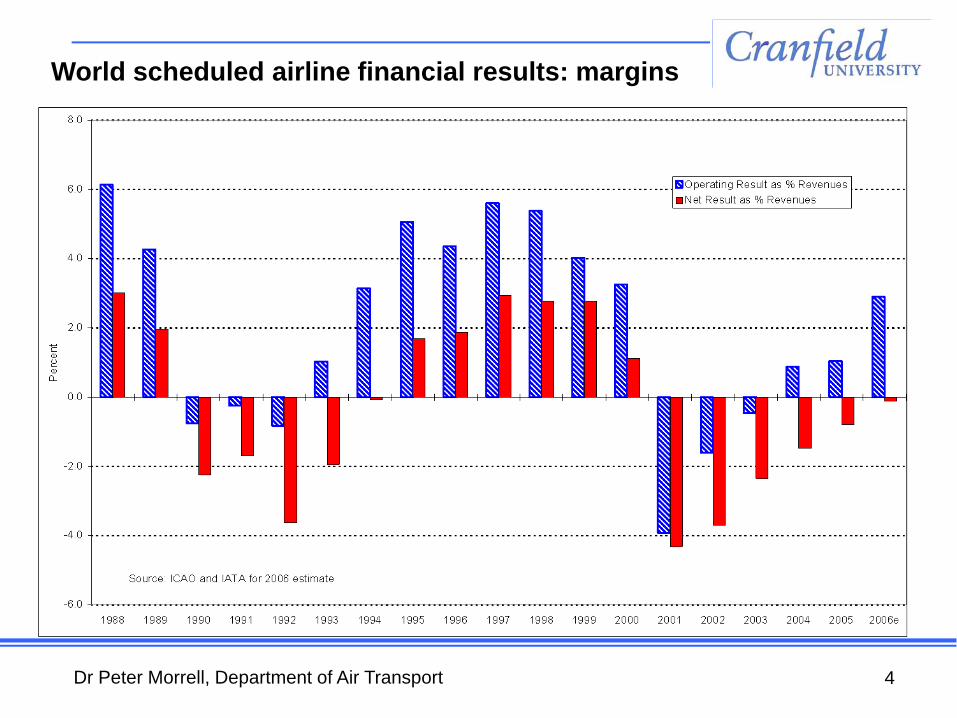
World scheduled airline financial results: margins

Dr Peter Morrell, Department of Air Transport 5
World scheduled airline financial results: margin by region
Dr Peter Morrell, Department of Air Transport 6
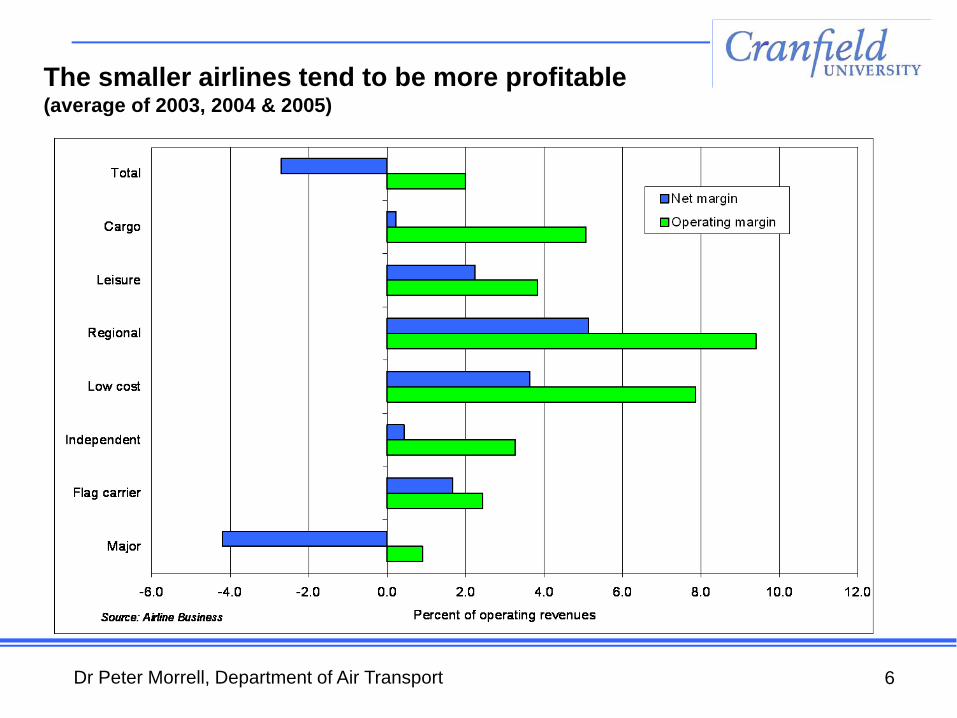
The smaller airlines tend to be more profitable(average of 2003, 2004 & 2005)

Dr Peter Morrell, Department of Air Transport 7
World scheduled airline return on invested capital by region

Dr Peter Morrell, Department of Air Transport 8
European airline profit margins: network
Dr Peter Morrell, Department of Air Transport 9
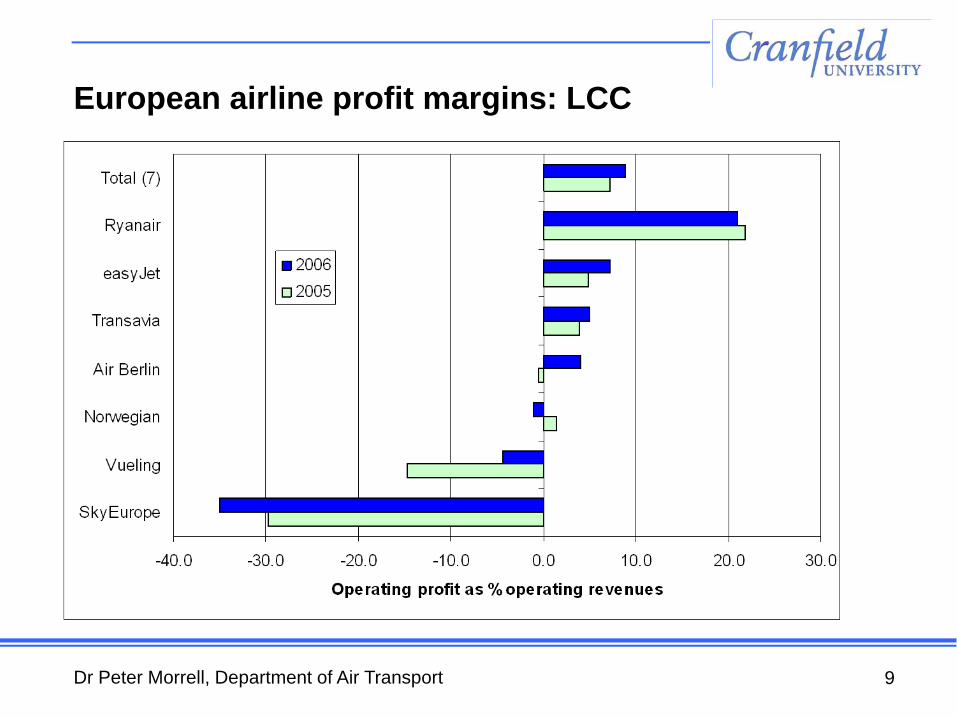
European airline profit margins: LCC
Dr Peter Morrell, Department of Air Transport 10
Airline Industry Characteristics
Strongly influenced by economic cyclesSeats cannot be storedHigh operating gearingHigh financial gearing and mobile assetsMany markets highly seasonalLarge number of customers worldwideLong aircraft ordering lead times
Dr Peter Morrell, Department of Air Transport 11
High Operational Gearing
Variable costs (escapable in short-term): approx. 40% of totalIndirect costs (escapable in medium-term): approx. 40%Fixed aircraft-related costs (escapable medium-term): approx. 20%
Dr Peter Morrell, Department of Air Transport 12
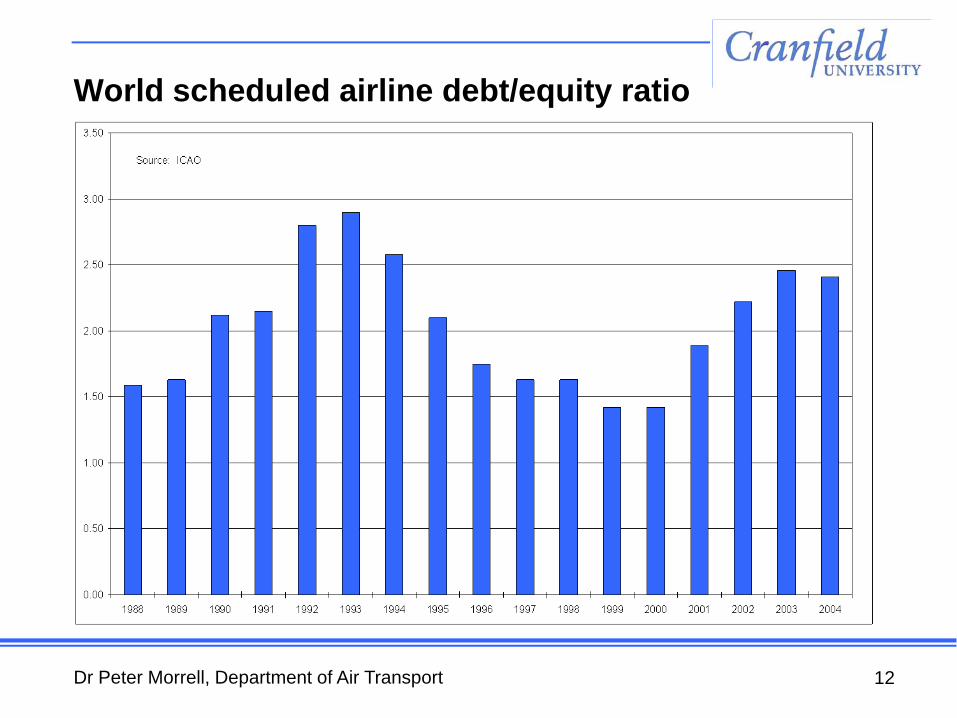
World scheduled airline debt/equity ratio

Dr Peter Morrell, Department of Air Transport 13
Breakeven Load Factor
Weight load factor required to equate total traffic revenues with total operating costs
= Weight load factor ÷ operating ratio
= costs/ATKs x RTKs/Revenues
= costs/ATKs ÷ Revenues/RTKs
= unit costs ÷ Yield
Dr Peter Morrell, Department of Air Transport 14
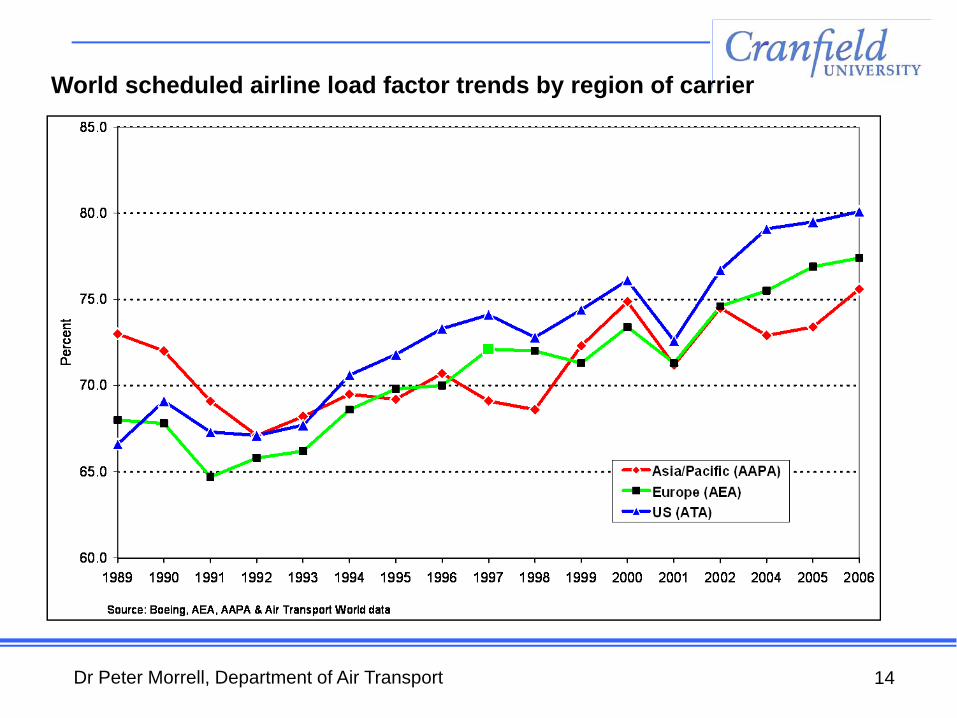
World scheduled airline load factor trends by region of carrier

Dr Peter Morrell, Department of Air Transport 15
World airlines: share of fuel in total costs

Dr Peter Morrell, Department of Air Transport 16
Constraints: Fuel prices
Limited impact of current high fuel prices on the world economy, and thus air traffic growth ratesSome reduction in demand from high fuel surcharges, but more than outweighed by low cost airline growthEra of $50-90 crude oil may lead to:Economical extracting of alternative (non-OPEC) suppliesEconomical application of known technologies extracting of alternative (non-OPEC) suppliesEconomical application of known technologies to engine and aircraft design for greater fuel efficiency

Dr Peter Morrell, Department of Air Transport 17
Environmental constraints
Local noise concerns: major airports attract housing and industryLocal air quality regulations: coming soon from Brussels; a condition for new (short) runway at London HeathrowClimate change: air transport currently only small contribution, but greater impact at cruise altitudeProposals for aircraft engine emissions trading and an emissions tax unlikely to impose excessive cost on industry: already coping well with fuel price escalationDifficult to achieve future fuel efficiency increase in excess of traffic growth rates: but laminar flying wing estimated to give 70% reduction in fuel burn per tonne-km vs existing aircraft

Dr Peter Morrell, Department of Air Transport 18
Sources of aircraft financing for Boeing deliveries
Dr Peter Morrell, Department of Air Transport 19
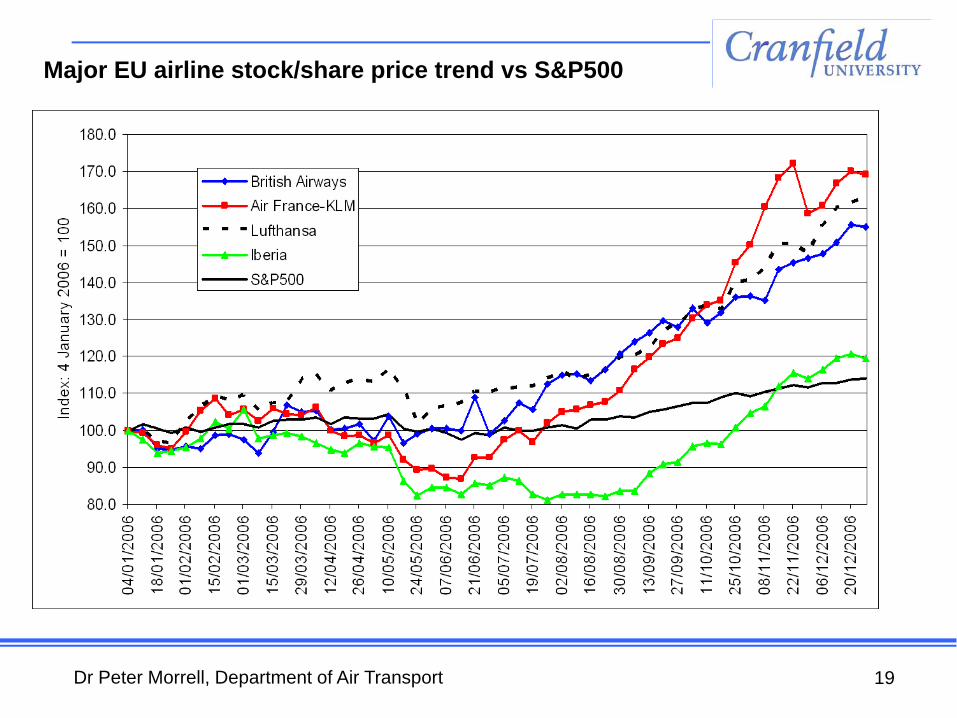
Major EU airline stock/share price trend vs S&P500

Dr Peter Morrell, Department of Air Transport 20
US Interest Rate Trends

Dr Peter Morrell, Department of Air Transport 21
Airline Industry Prospects
Long-term growth looks assured, unless environmental taxes/permits severeShort-term: next economic recession?Progress on liberalisation: US/EU?More cross-border mergers?Fuel prices remain high?

Dr Peter Morrell, Department of Air Transport 22
IATA Forecasts: short/medium term
Estimate 2005 % pa 2005-09Total international 6.7 5.6North Atlantic 5.0 5.3Trans Pacific 7.4 5.8Europe-Asia/Pacific 6.8 5.9Europe-Middle East 8.4 6.6Within Asia/Pacific 8.7 6.8Within Europe 5.7 5.1
Source: IATA Outlook, 31 October 2005 (latest available)
International passenger-kms

Dr Peter Morrell, Department of Air Transport 23
Aircraft Manufacturer Forecasts – Long-term (Passenger-kms)
Av. annual growth: 2004/05 to 2024/25
Airbus Boeing
Intra-Europe 4.1% 3.4%
Europe - North America
4.9% 4.6%
Asia - North America
6.3% 6.0%
Europe - Asia 5.9% 5.4%
Domestic China 8.7% 8.8%
Total World 5.3% 4.8%

Dr Peter Morrell, Department of Air Transport 24
Transforming the business
Investment in people and aircraft/equipmentImproved processesInnovation/new ideas
Increased productivity
Improved shareholder returns Better pay for employees More tax revenue for government
Lower air fares

Dr Peter Morrell, Department of Air Transport 25
Sources of productivity growthEconomies of scaleIncreased aircraft sizeLarger airlines? (mergers/alliances)More specialisationHigh passenger load factors
New technologyFaster aircraft / shorter turnroundsSimpler processesImproved aircraft/engines (eg B787/A350)e-commerce (e-ticket, web based distribution, CRM)RFID (bags/cargo), Self-service check-in, ACARS etcBiometrics
Lessons from Low Cost Carrier business model?

Dr Peter Morrell, Department of Air Transport 26
SAS Status 2002 Targets
2002 TargetAircraft utilisation (hrs/aircraft) 7.5 9Crew utilisation (hrs/pilot/year) 490 600Cabin crew utilisation (hrs/employee/year) 530 600Aircraft overnight stops per year 800 500Turnaround time (minutes) 40 30Ground service costs (change) - 10% to -15%Maintenance costs (change) - 10% to -15%

Dr Peter Morrell, Department of Air Transport 27
Channel shift: British Airways
0%
20%
40%
60%
80%
100%
2003/2004 2004/2005 2005/2006 2006/2007
% o
f B
oo
kin
gs
Ba.com Call Centers Online agents Traditional agents
Dr Peter Morrell, Department of Air Transport 28
Airline Outsourcing
Internal cost levels are uncompetitiveOther firms have expertise and/or economies of scale to be more efficient and cost effective (even allowing for their profit)Future investments more easily sustained by others (eg GDS firms, and other IT)Make sure there are now and will be in future competing firms bidding for your business

Dr Peter Morrell, Department of Air Transport 29
Negative factors for increased productivity
Lack of international standards in some areasNeed for increased securityAirport congestion:Limits to new runway construction; greater peaking in passenger terminal; surface access congestionAir Traffic Management:Congestion, too many centres, restrictive practicesEnvironmental:Noise curfews and operational restrictionsEmissions caps and/or taxes Trade unions?

Dr Peter Morrell, Department of Air Transport 30
IATA Industry priorities for 2006
Achieve 70% penetration of e-ticketing in BSPs by end 2006Secure commitment for use of CUSS at 15 new locationsAchieve savings of $1.3 billion in taxes, charges and fuel feesSecure $1.5 billion of fuel savings through operations, new routings and infrastructure improvementsLaunch seven new BSP/CASS operations
Dr Peter Morrell, Department of Air Transport 31
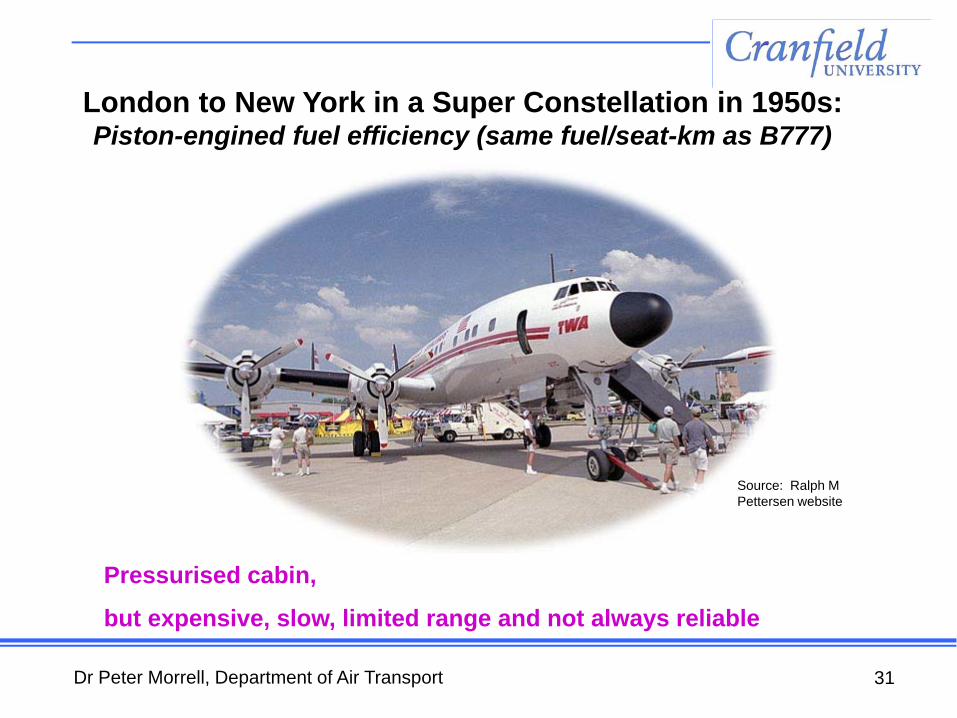
London to New York in a Super Constellation in 1950s:Piston-engined fuel efficiency (same fuel/seat-km as B777)
Source: Ralph M Pettersen website
Pressurised cabin,
but expensive, slow, limited range and not always reliable

Dr Peter Morrell, Department of Air Transport 32
Selected airlines: fuel efficiency in 2004Domestic and intra-EU routes
Marked advantage from higher load factors and seat density (LCCs and leisure) and larger aircraft (leisure)
Source: Morrell (2006)

Dr Peter Morrell, Department of Air Transport 33
Lower deck cargo capacities: selected long-haul passenger aircraft types
* Cargo only; **passengers, baggage and cargo

Dr Peter Morrell, Department of Air Transport 34
Fuel efficiency versus aircraft size by aircraft type

Dr Peter Morrell, Department of Air Transport 35
Capacity per flight: AEA member airlines: Intra-European routes
15 tonnes
128 seats
Dr Peter Morrell, Department of Air Transport 36
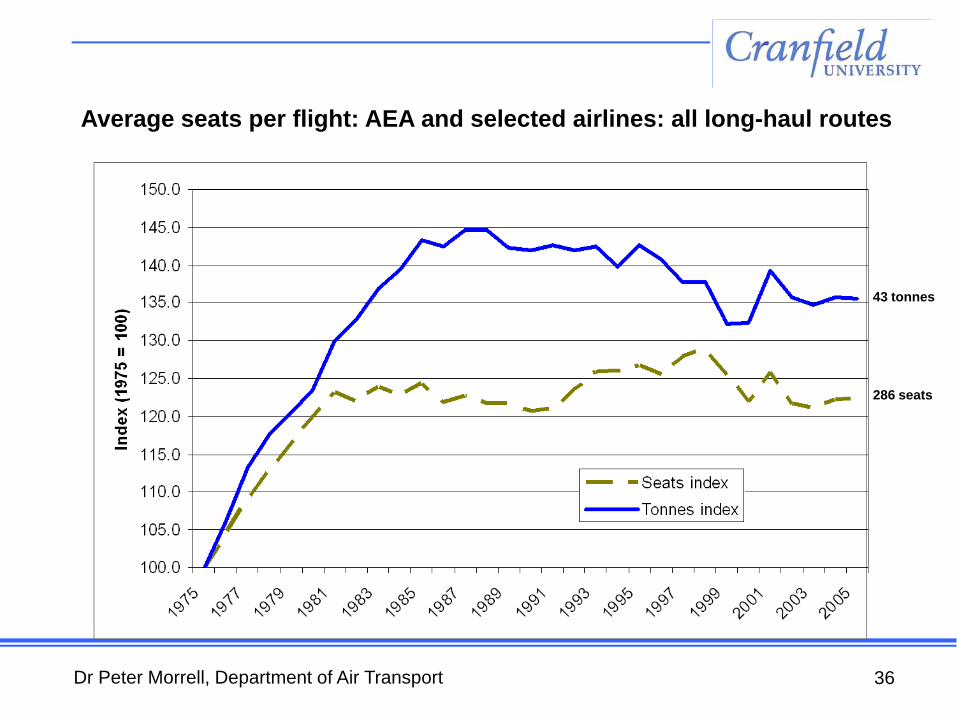
Average seats per flight: AEA and selected airlines: all long-haul routes
43 tonnes
286 seats
Dr Peter Morrell, Department of Air Transport 37
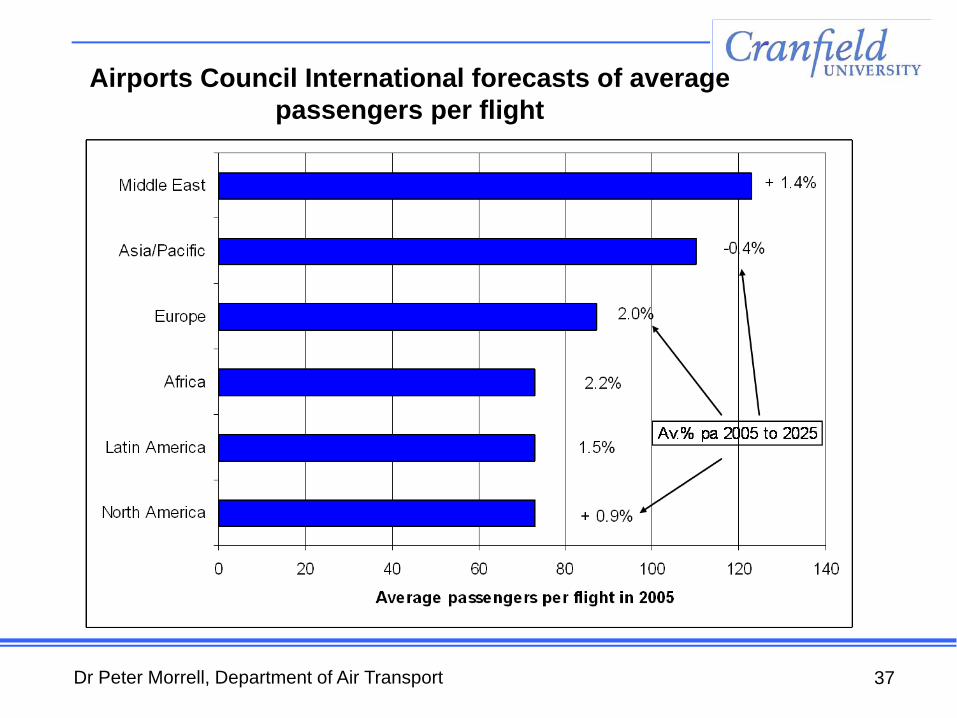
Airports Council International forecasts of average passengers per flight

Dr Peter Morrell, Department of Air Transport 38
Recent average aircraft size forecasts
Boeing: hardly any increase over next 20 yearsAirbus: +20% over next 20 yearsRolls-Royce: +0.6% pa over next 20 years (about 13% up overallFrankfurt/Main Airport: +1.2% pa from 2005 to 2020London Heathrow between 2000/01 and 2012/13Domestic: +1.0% paShort-haul: +1.3% paLong-haul: +1.7% pa

Dr Peter Morrell, Department of Air Transport 39
Summary of Main Points
Poor industry profitability and return on capitalHighly geared: large swings in profitsLonger-term traffic growth prospects goodContinued advances in productivity needed to keep costs in check:Lessons from LCC business model
but could be constrained by lack of airport and ATC capacityas environmental measures and taxes become more widespread