Embed Size (px)
Citation preview

OCEANOLOGICA ACTA ~ VOL. 22 - N” 5
Air-sea CO, fluxes in a coastal embayment affected by upwelling: physical versus biological control Marta ALVAREZa*, Emilio FERNANDEZb, Fiz F. Pl?REZa
a Instituto de 1nvest:igaciones Marinas (CSIC), C/ Eduardo Cabello N” 6, 36208, Vigo, Spain b Facultad de Ciencias, Universidad de Vigo, Campus Lagoas-Marcosende, 36200, Vigo, Spain
(Received 2 April 1998, revised 11 March 1999, accepted 28 April 1999)
Abstract - Water c’olumn pC0, and air-sea CO, fluxes were studied during an IS-month period (May 1994September 1995) in a coastal embayment affected by upwelling, located in the northwestern Iberian Peninsula (Ria de Vigo and adjacent shelf). Overall, the region acted as a net annual atmospheric CO, sink, with magnitude ranging from 0.54 mgC mm2 d-’ in the Ria estuary to 22 mgC mm2 d-’ offshore. During moderate upwelling and upwelling relaxation conditions the sampling area was a sink for atmospheric CO,. By contrast, during winter conditions and during intense upwelling the flux reversed towards the atmosphere. The relative influence of physical and biological processes on pC10, was evaluated using two different approaches: firstly, statistical analysis of physico-chemical correlations, and secondly, a thermodynamic analysis in the oce- anic CO, system. Both methods yielded consistent results, showing that the main pro’cesses controlling seasonal and spatial pC0, variability were the production and remineralization of organic matter, explaining ca. 70 % of the total variability. In the inner part of the embayment, air-sea CO, exchange was mainly modulated by CO, partial pressure gradient, whereas in the adjacent shelf, wind speed largely contributed to CO, fluxes between the ocean and the atmosphere. 0 1999 Ifremer / CNRS / IRD / Editions scientifiques et medicales Elsevier SAS
carbon dioxide I air-sea exchange I spatial-temporal variability I physical-biological control I northwestern Iberian Peninsula
Resume -- lkhanges air-ocean de CO, dans une baie cotiere affectee par l’upwelling : contrble physique et bio- logique. Le pC0, dans la colonne d’eau et les Cchanges de CO, entre l’air et l’eau ont Ctt CtudiCs durant 18 mois (mai 1994-septembre 1995) dans une baie affectee par l’upwelling au nord-ouest de la peninsule Iberique (Ria de Vigo et pla- teau continental adjacent). En moyenne annuelle, cette region est un puits de CO, atmosphtrique, le flux net air-mer variant de 0,54 a 22 mgC mm2 j-l. Durant les periodes d’upwelling mod&t ou de relaxation de l’upwelling, la zone CtudiCe se comporte comme un puits de CO, ; en revanche, durant l’hiver et lors d’evenements advectifs forts, cette zone devient une source de CO, pour l’atmosphere. L’influence relative des processus physiques et biologiques a CtC Cvaluee par deux approches differenms : une analyse statistique et une analyse physico-chimique a partir des relations thermodynamiques. Ces deux methodes conduisent a des resultats comparables et montrent que les processus principaux qui controlent la variabilite spatiale et saisonniere du pC0, sont la production et la remineralisation de la mat&e organique, qui expliquent 70 % de la variabilite totale. A l’indrieur de la baie, les Cchanges air-mer de CO, sont principalement modules par le gra- dient de pression partielle de CO,, tandis que sur le plateau continental, ils le sont par le coefficient d’echange. 0 1999 Ifremer / CNRS / IRD / Editions scientifiques et medicales Elsevier SAS
dioxyde de carbone I Cchange air-mer I variabilite spatiale-temporelle I contr8le physique-biologique I nord-ouest de la peninsule Iberique
* Correspondence and reprints: [email protected]
Oceanologica Acta (‘1999) 22, 5, 499-515 499 0 1999 lfremer I CNIRS I IRD / Editions scientifiques et medicales Elsevier SAS. Tqus droits r&erv&

I. INTRODUCTION
The relative importance of physical and biological pro- cesses in governing surface ocean pC0, is still a contro- versial issue in oceanography [7, 48, 52, 551. Fixation of dissolved CO, by marine phytoplankton leads to a con- current decrease in total inorganic carbon and pCO,, whilst pH increases and alkalinity suffers small changes. On the other hand, calcium carbonate production by ocean calcifying organisms changes both alkalinity and total inorganic carbon, however it can lead to an increase in surface pCOz. Physical processes such as the precipita- tion/evaporation budget, vertical entrainment and diffu- sion and horizontal advection and mixing can also control the CO, species distribution in the ocean. The preponder- ance of physico-chemical over biological conditions 17, 53, 641 or vice versa [13, 21, 56, 621 varies spatially and seasonally, being therefore dependent on the regions and seasons considered. However, separating and quantifying the contribution of these various processes was attempted by different authors [4, 6, 14, 251.
Coastal areas represent 8 % of the global oceanic area, and account for about 2.5 % of marine primary production [59, 651. These areas are considered as organic carbon deposi- tion and preservation zones and/or shelf-to-ocean expor- tation areas [59, 61, 651. In this connection, 3-8 % of the
annual atmospheric CO, concentration increase is esti- imated to be buried as organic carbon in coastal marine envi- ronments 13 11. However, the contribution of these areas is usually underestimated in global carbon models [l 1, 651.
This study was carried out in a coastal and estuarine area of the northwestern Iberian Peninsula (Ria of Vigo, $gure I) with the general aim of gaining understanding on the air-sea CO, flux in a coastal region affected by wind-driven upwelling [ 10, IS]. The Ria of Vigo is a coastal embayment in the western coast of Galicia (NW Spain) defined as a positive estuary, with the following pattern of inner positive circulation: the river discharge flows outwards at the surface balanced by a net inward flow at the lower levels [19]. The inner circulation and water exchange with the shelf are both affected by wind- driven upwelling which is common along the eastern boundary of the North Atlantic between 10” and 44” N [66]. Northerly winds cause upwelling of salty, cold North Atlantic Deep Water (NADW) from April to Octo- ber, although mainly in summer [ 18, 361. By contrast, southerly winds prevail from November to March gener- ating downwelling. During strong downwelling events water circulation can be reversed, and so oceanic coastal water flows into the Ria [l, 10, 161.
River discharge contributes to maintaining the inner pos- itive circulation within the Ria and the water column sta-
Figure 1. Map of the sampled stations.
500

AIR-SEA CO, FLUXES IN A COASTAL EMBAYMENT
bility, which determines water column resistance against the deforming effects of wind [ 11. The main tributary to the Ria of Vigo is the Verdugo River with an average run- off of 13.2 m3 s-l [4#6]. This river is characterized by very low alkalinity and calcium levels, which behave conser- vatively during estuarine mixing, and also by low levels of nutrient salts, which from late spring to autumn are mainly determined lby biological activity of the estuarine and benthic biota at the innermost part of the Ria (San Sim6n Bay) [37].
Besides the general aim already outlined, four main objectives were formulated in this investigation: i) to study the seasonal variability of the water column pCO,, ii) to analyse the estuarine-shelf gradient in pCO,, iii) to evaluate the influence of physical, chemical and biologi- cal factors on water column pC0, variability, iv) to quan- tify air-sea CO, fluxes in this area throughout a seasonal cycle.
2. MATERIAL AND METHODS
Four stations locateld along the central axis of the Ria of Vigo were sampled fortnightly from May 1994 to Sept- ember 1995 (figure .I). However, due to bad weather con- ditions in winter sorne samplings were missed, especially at station 11. Hereinafter both external stations consid- ered are located at the shelf, stations 11 and 13, and inter- nal stations are those located inside the Ria, stations 14 and 15.
Temperature, salinity and pressure were obtained with a SBE25 CTD probe. Salinity and density were calculated using the equations of Unesco [57]. The upwelling index (Iw) was calculated at 43” N 11” W (150 km off Cape Finisterre) following Bakun [5], using geostrophic winds derived from surface pressure charts (three times per day). The vectors were multiplied by 0.7 and cyclonically rotated 15” to estimate surface wind velocity. Negative values of Iw indicatle downwelling.
The flow of fresh water to the Ria of Vigo (Qr, in m3 s-‘) was calculated as in Rios et al. [46] using the drainage area and rainfall data.
Water samples were taken with 5-L Niskin bottles from three to eight depths (depending on the bathymetry) to determine nutrients (ammonium, nitrate and nitrite), dis- solved oxygen and chlorophyll a concentrations as well as alkalinity and pH.
Dissolved oxygen (ltmol kg-‘) was measured using Win- kler potentiometric titration, and chlorophyll a (Chl a) was determined fluorometrically after extraction with 90 % acetone overnight.
pH was measured with a combined glass electrode standardised with NBS buffer solutions of 7.413 and 4.008 pH. The electrode was then adapted to seawater ionic strength in natural seawater CO, free borax 4.4 pH buffer solution. Temperature was measured using a plati- num resistance thermometer and pH was finally referred to 15 “C (pH,,) according to PCrez and Fraga [38]. The accuracy of the analytical procedure used in this investi- gation was + 0.005 pH units.
Alkalinity was determined by potentiometric titration with HCl to a final pH of 4.44 according to Perez and Fraga [39], using a. Metrohm E-410 pH-meter with a separated glass elecltrode and a reference electrode con- nected to an automatic burette and an impulsomat. The electrode was standardised with NBS buffer solutions of 7.413 and 4.008 PH.. This method displayed an accuracy of ? 2 pmol kg-‘. On every station, alkalinity samples were taken from surface, intermediate and bottom waters.
Total inorganic carbon (TIC) and partial pressure of CO, (pC0,) were estimated from pH,, and alkalinity data using thermodynamic equations of the carbonate system [15] and the constants determined by Mehrbach et al. [33] and Weiss [63] with an accuracy of + 4 pm01 kg-’ and f 8 patm, respectively [27, 341. We used Mehrbach constants rather than more recent constants [50] since the temperature effect on pC0, obtained using Mehrbach constants is more consistent with the experimental val- ues [27, 35, 541. In order to verify this procedure, a com- parative experiment was performed between 3 January and 27 March 1994 in the South Atlantic where pC0, was determined directly and also calculated from pH,, and alkalinity using the above procedure [12, 471. The results were very similar with an average and standard deviation of 1 k 7 patm 1451.
The CO, air-sea exchange (mg mm2 d-‘) was calculated using the following equation:
F = 2.88. k S. (pCO,oc -pCO,at)
where k is the piston or transfer velocity (cm h-l), S is COZ seawater solubility (mol kg-’ atm-‘), pCO,oc is sur- face ocean CO, partial pressure, pCO,at is atmospheric CO2 partial pressure (both in patm) and 2.88 is a conver- sion factor.
Seasonal and inter-annual variations in the atmospheric pC0, are small when compared to pC0, variations in the
501

M. bLWAREZ et 4.
Figure 2. Temporai variability of upwelling index (1~) and temperature (“C) at the sampling stations. Points over the top axis represent sampling dates.
502

AIR-SEA CO, FLUIXES IN A COASTAL EMBAYMENT
ocean surface [3]. On the other hand, Keeling and Whorf [24] have reported the annual atmospheric molar fraction of CO, (xC02) at Mauna Loa Station, which were linear- ized by Perez et al. [40] according to the following equa- tion:
xC02at (ppm) = 279 + e 0.134 (y- Mop7
where y is the year. The lack of pCO,at data led us to use a constant pCO,at calculated as the mean pCO,at value of the two considered years (1994 and 1995) using the pre- vious equation and assuming a mean atmospheric pres- sure of 1 atm. Thus, pCO,at was assumed to be 357 patm.
The piston velocity, k, was calculated using the equa- tions derived from .those suggested by Liss and Mervilat [29] and proposed by Woolf and Thorpe [67], the former are more suitable given that the range of temperature in our data lies between 13 and 21 “C:
k = 0.17 U,, (~OO/SC)“~
U,, < U, for smootlh water regime.
k = (2.85 U,, -9.65) (6OO/Sc) 1’2
U,, > U, for rough water regime.
U, = 9.65 (2.85 - 0.17 (6OO/Sc) 1’6)-’
where SC is the Schmidt number (the ratio of the cine- matic viscosity of the water to the molecular diffusivity of the gas), and U,, is wind speed 10 m above the sea level (m s-l). The Schmidt number was calculated from its relation with temperature derived from data tabulated by AndriC et al. [3] obtained by Rios et al. [44]:
In (6OO/Sc) = -1.0687 + 0.05127 T r2 = 0.995
where SC is the Schmidt number and T is temperature (“C). Seawater CO, solubility was deduced from Weiss [631.
Wind speed data were obtained from two meteorological stations, located at Cape Finisterre (43” N, 11” W) and in the Ria of Vigo (42” 14’N, 8” 48’ W). Raw wind speed data were averaged daily. Wind speed data correspond- ing to the date of the survey as well as the dates previous and posterior were #squarely averaged to obtain the mean wind speed used for the calculation of the exchange coef- ficient equation. A shelf-Ria linear gradient (i.e. a linear gradient between the wind speed data from the Finisterre and the Ria of Vigo databases) was assumed during each survey. The estimated mean slope of this gradient was very similar to that obtained from wind speed data col- lected in the same area during a series of cruises carried out from June to December 1997.
3. RESULTS
3.1. Thermohaline characteristics
Figure 2 shows the temporal variability of the upwelling index and of temperature for the different stations. The temporal variability of fresh water flow and salinity are shown in figure 3. Vertical displacements of the 13 “C isotherm (figure 2), which defined approximately the upper limit of upwelled water in this area [16], are corre- lated with the displacements of the upwelling index, Iw, calculated from geostrophic winds. However, it is neces- sary to take into account that the inertia of coastal circu- lation to wind stress is about three days and the relaxation is even slower [32]. Therefore, the relationship between Iw and the vertical displacements of the 13 “C isotherm is not so straightforward. However, four hydrographic situ- ations can nevertheless be discerned throughout the sea- sonal cycle:
Winter conditions dominated from October 1994 through to February 1995 and were characterized by thermal and haline homogeneity of the water column due to strong vertical mixing. However several phenomena occurred in between. Thermal inversions maintained by the haline gradient were detected in stations 13, 14 and 15 during December 1995 (figure 2). During this period Iw was, as a mean, highly negative, leading to a flow towards the Ria of surface oceanic water saltier (35.7-35.8) and warmer (15-16 “C) than that flowing out of the Ria (14-15 “C and 34.2-34.6) (figures 2, 3). As the latter had a lower density it invaded the water column, giving rise to the thermal inversions detected in December 1995. In January 1995, a sharp change in wind regime caused an upwelling pulse of NADW, which was, however, retained at deep layers due to the restoring of previous conditions. In later Janu- ary and in February-March 1995 the water column was almost totally occupied by low salinity water at the inner stations due to high continental runoff (St. 14 and 15, figure 3) while at the external ones (St. 11 and 13, figure 3) cold and saltier water was detected. From March 1995 onwards, spring-summer conditions were estab- lished and upwelling/relaxation pulses succeed.
Moderate upwelling. Upwelled water, defined by the 13 “C isotherm, did not reach the surface layer (top 20 m), thus enabling thermal and haline gradients to develop, especially at the internal stations (14 and 15). June, late August and early September 1994 and March and early April 1995 were typical periods of this condi- tion (figures 2, 3). The limit between moderate and
503

rid. ALVAREZ et al.
Figure 3. Temporal variability of fresh water flow (Qr) and salinity at the sampling stations. Points over the top axis represent sampling date
AIR-SEA CO, FLUXES IN A COASTAL EMBAYMENT
intense upwelling conditions was established at Iw values of 1000 m3 s-l km-‘.
Intense upwelling. Temperature decreased in the whole water column, whereas salinity increased and the ther- mocline was eroded, thus subsurface waters reached the
surface layer. This situation took place in July and September 1994 and early June, and August 1995 Cfig~re~ 2, 3) at all th[e sampled stations. Generally, mod- erate and intense upwellings are intensified in the inner part of the Ria due to topographic interactions, upwelled water reaches higher levels than in the more external
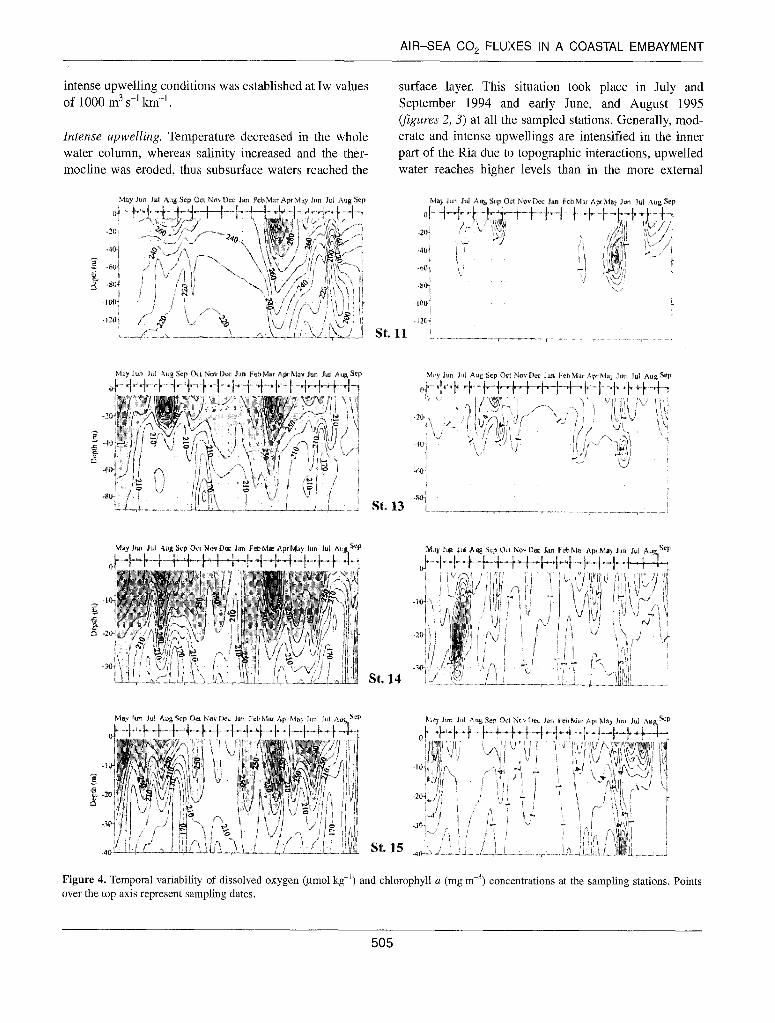
Figure 4. Temporal variability of dissolved oxygen (pm01 kg-‘) and chlorophyll a (mg me3) concentrations at the sampling stations. Points over the top axis represent sampling dates.
505

zones. In this sense, the isotherm of 13 “C was detected during late September 1994 at about 15 m depth at station I5 and at about 25 m at station 13.
Upwelling relaxation. Iw decreased in parallel to a reduc- tion in the strength of northerly winds. Surface circula- tion of less saline water flowing from the inner part of the Ria into the ocean is slowed down, and strong haline and thermal surface gradients developed due to reduced advection. May, early August 1994 and April, May, late June, July and September 1995 were examples of these conditions (figzlres 2, 3).
3.2. Chlorophyll a and dissolved oxygen concentra- tions
High chlorophylla concentrations (figure 4) were associated with upper layer stability and a shallow nutricline [I 61. These conditions were achieved during periods of moderate upwelling and after the first pulse of intense upwelling when photosynthetic organisms begin to develop as a response to favourable irradiance and nutrient conditions, as in the inner stations during June 1994 where Chl a concentrations from 3 to 4 mg mm3 were measured. Subsurface chlorophyll max- ima were usually related to relaxation periods such as at the end of June 1995 in stations 13,14 and 15. During theseperi- ods phytoplankton accumulated in the upper layer after an upwelling event due to the reduced ‘washout’ compared to their doubling times [l, 491. On the other hand, a high sub- surface chlorophyll maximum (17 mg mm31 at station 14 during early July 1994 was associated with an intense upwelling period. Variations in the upwelling index shown infigure 2 indicate that this survey was performed during a spin up period of the upwelling pulse, when the motion pat- tern of subsurface water advects sinking phytoplankton cells up to the surface [ 11. In winter (from November 1994 until February 1995) chlorophyll a concentration was low (0.5-3 mg m-3) throughout the water column.
Inner stations showed a high variability of dissolved oxy- gen concentration egure 4) with values higher than 260 pmol kg-’ in the surface layer in spring and summer when enhanced photosynthetic activity was expected to occur. In March and April 1995, the spring phytoplankton bloom took place and oxygen values were higher than 310 pmol kg-r figure 4, station 14, and 360 pmol kg-’ oxygen maxima). The same situation was observed at off- shore stations with values of around 300-340 ymol kg-‘. In winter and during intense upwelling, when low- oxygen water bodies reached the surface layer, the 260 pmol kg-’ oxygen isoline generally disappeared. By
contrast, during upwelling relaxations, oxygen concentra- tions in the whole water column rose due to the displace- ment of surface oxygen-rich waters to lower levels. Subsurface oxygen minima remained at the inner sta- tions during late August 1995 and early September 1995 due to advection of upwelled water aged on the shelf [ 161. At the external stations subsurface oxygen minima were identified in early November 1994 during winter conditions, and late June 1995 corresponding to a period of upwelling.
3.3. pco,
The temporal variability of seawater pC0, is shown in figure 5, where the 357 uatm isoline representing the mean atmospheric pC0, for the studied period is emphasized. The Ria of Vigo and adjacent shelf regions were sinks fer atmospheric CO, during most of the studied period except in winter (November 1994 to February 1995) and during some intense upwelling events (station 13 July 1994, station14 and 15 September 1994 and at stations 13, 14 and 15 in August 1995) when the flux reversed, and sea- water was a source of CO, to the atmosphere. Surface pC0, minima in May 1994 (220-260 patm), August 1994 (260-300 patm) and March-April 1995 (220-280 patm) corresponded with oxygen maxima at the surface.
Subsurface pC0, variability was influenced by upwelling/relaxation dynamics. Relaxations tended to decrease water column pC0, while upwellings bring high pC0, waters to the surface. In winter, pC0, was high (380-500 patm). A clear relationship was found between subsurface pC0, maxima (500-600 palm) and the previously commented oxygen subsurface minima.
3.4. pC0, variability: physical vs. biological control
With the aim of isolating the factors controlling the tem- poral variation of pCO,, two sets of analysis were per- formed. Firstly, a statistical analysis was undertaken revealing the relationship between pC0, and physical (temperature and salinity), chemical and biological (chlo- rophyll a and oxygen concentrations) variables. Second- ly, an analysis based on the thermodynamic relation- ships between pC0, and physico-chemical variables defining the seawater CO, system.
1) Figure 6 shows the relationship observed between pC0, and temperature, salinity, Chl a and dissolved oxy- gen concentration. A statistically significant linear rela- tionship was observed between pC0, and dissolved oxygen concentration when considering both surface and
506

AIR-SEA CO, FLUXES IN A COASTAL EMBAYMENT
water-column data. By contrast, pC0, and temperature, iour than Chl n, therefore despite the lack of correlation salinity or Chl a were not significantly related. Chl a is between pC0, and Chl a, the relationship between pC0, affected by sedimentation and grazing processes, thus it and oxygen points to biological activity as the main pro- is not considered a conservative parameter. On the other cess controlling pC0, distribution and, indirectly, air-sea hand, pC0, and oxygen have a more conservative behav- CO, fluxes.
Figure 5. Temporal variability of calculated pC0, (patm) at the sampling stations. Points over the top axis represent sampling dates. The emphasized isoline represents the mean atmospheric pC0, during the sampling period (357 patm).
507

- _______ _____--_____-_ --.
2) In order to evaluate the magnitude of the different pro- tion, organic matter and carbonate production I reminer- cesses affecting pC0, in our study area we followed the alization. In this case, the initial conditions are the mean methodology proposed by Sabine and Key 1511. Neglect- characteristics of the upwelled water during the sampled ing water mass mixing, pC0, for any water sample can period (tabk I). It was assumed that the water present in be generated by correcting for temperature change, dilu- the Ria is a mixture of subsurface upwelled water and
800
700
g- 600
q 500
cA
% 400 300
200 - "a) y.
100 I I I I I I
I i II. 29 30 31 32 33 34 35 36 10 12 14 16 18 20 22
Salinity Temperature ("C)
0 5 10 15 20 25 30
Chiorophyll z (mg. m")
r = 0.89 p<O.OOl
100 150 200 250 300 350 400 100 150 200 250 300 350 400
Oxygen (pmol. kg-‘) Oxygen (pmol. kg-‘)
Figure 6. Relationships between pC0, (patm) and water column (a) salinity, (b) temperature, (c) chloropbyil a, (d) dissolved oxygen concen- trations and (e) dissolved oxygen concentration at the surface layer.
508

AIR-SEA CO, FLUXES IN A COASTAL EMBAYMENT
water derived from continental runoff. pC0, for any sam- ple was predicted fmm the initial conditions (table I> by correcting the previously enumerated effects on the mean pC0, ‘of upwelled water. The variability not accounted for by this model can be attributed to the presence of additional water masses and/or air-sea exchange.
Table I. Initial conditions for the upwelled water in the Ria.
Parameter
Salinity Temperature (“C) Alkalinity (pmol/kg) TIC (pmol/kg) PCO,W~) AOU (pmol/kg) NO, (wo&d
Symbol
So TO
Alk.’ TIC”
PCO,O AOU’ NO,’
Value
35.71 12.34
2345 2140 423
49.8 10.24
Temperature correction. The heat-flux corrected values of pC0, (pCO,,) were calculated using the full set of equilibrium equations referred to in the ‘Material and methods’ section as a function of measured temperature (T), and the initial conditions for salinity, alkalinity and TIC (So, Alk’, TIC’ respectively, table I>.
PCO,, = f (T, So, .Alk’, TIC’).
Dilution correction. The addition or removal of water can be estimated from changes in salinity, but it must be taken into account that bolth Alk. and TIC are also proportion- ally diluted and that the river also contributes to Alk. and TIC, adding about 105 pmol/kg and 210 ymol/kg, respectively (J. Gago, pers. comm.). For calculating pC0, values corrected for heat and water flux (pC0, T s), TIC and Alk. should be also normalized to the initial value of salinity.
Alk., = Alk’ S / So + 105 (l- S / So)
TIC s = TIC’. S / So + 210 . (l- S / So)
pCO,, s = f (T, S, Alk.,, TIC,).
Organic matter correction. Biological activity in the area is estimated from changes in the Apparent Oxygen Utili- zation (AOU) concentration. The difference between the AOU measured at each point and the reference AOU is proportional to the biological uptake/regeneration using a stoichiometric -0,:C ratio or photosynthesis quotient (PQ), typically between 1.0 and 1.4 for marine organic matter production [26]. In this study we used a PQ = 1.36 according to Rios et al. [43] for phytoplankton of the Ria of Vigo. This PQ did not differ significantly from those calculated by Anderson [2] and Fraga et al. [20]. TIC is
also largely affected by these processes. In the case of alkalinity, Alks should be corrected for the uptake of one mole of H+ for every mole of nitrate (N) during photo- synthesis [X, 231, but the effect is much lower. Corrected Alk., TIC and pC0, for heat and water flux and biologi- cal processes were computed as:
Alk .s N = Alk, + (NO-N)
TIC s *ou = TIC s -. (AOUO-AOU) / PQ
pC0, T s AOU = f (7’7 S, Alk., iv, TIC, Aou).
Calcium carbonate correction. Carbonate precipitation/ dissolution affects Alk and TIC in a 2:l ratio. Corrected TIC and pC0, for heat and water flux, biological pro- cesses and carbonate precipitation/dissolution were com- puted as:
TIC s *ou Ca = TIC s *ou - 0.5 .(Alk. s N - Alk.)
Pco2T SAOUCa = f (T, S, Alk., TIC, Aou &.
Predicted pC0, (pC0, T s Aou Ca ) and that calculated from measured pH,, and alkalinity showed a highly sig- nificant relationship (3 = 0.88; p < 0.0001 for the whole water column and 2 = 0.57; p < 0.0001 considering sur- face data only).
Table II shows the percentage of pC0, variation explained by each process, which was calculated as the ratio between the variance of pC0, derived by each one and the total variance of pC0,. The main conclusion derived from these results is that biological activity was the main process modulating pC0, variability in the set of sampled stations. Temperature, dilution and calcium carbonate processes, also influenced pC0, variability, although to a lower extent considering both surface waters and the whole water column.
The temperature dependence of surface pC0, varied around 33 %, except at station 11 where it was as high as 67 %. Dilution processes explained only 0 to 3 % of the surface pC0, variability. In the outermost station temper- ature changes were about ten-fold those of salinity, explaining the high % attributed to thermal flux. Carbon- ate precipitation/dissolution reactions explained always less than 7 % of the surface pC0, changes. These reac- tions had their greatest influence on the surface pC0, variability of station 14.
3.5. Air-sea CO, fluxes
Figure 7 shows the ,spatio-temporal variability in air-sea CO, fluxes. The pattern of variability found at the inner stations (stations 14 and 15) differed from that found in the

IvI. ALVAREZ et al. ----_ --
Table II. Average PC&, standard deviation and percentage of pC02 variability explained by each process (92); considering surface and waier column as a whole. n represents the number of samples.
St. I1 St. 13 (IdO) (n=2,9)
Sk.14 (n=34)
St. 15 (n=33)
Surface total Column total (n=116) (n=468)
X pC0, j.Latm 321 326 319 345 329 389
SD patm 30 60 55 Xl 63 76
Organic matter Prod./ Remin. (%) 32.9 60.9 57.5 61.7 54.8 83.7
Thermal flux (% ) 65.6 33.3 33.1 32.6 35.6 3.4
Water flux (%) 0.2 3.0 3.1 2.7 3.2 0.9
CaCO, production/dissolution (%) 1.3 2.8 6.3 2.8 6.5 1.9
external ones (stations 13 and 1 I). In addition, the air-sea CO, exchange rate at the inner stations was about an order of magnitude lower than at the external ones. When the studied period was divided according to the four different hydrographic situations mentioned above (IU: intense upwelling; MU: moderate upwelling; R: upwelling relax- ation; WC: winter conditions), contrasting behaviours were found even for the same hydrographic situation.
Generally, during intense upwellings high CO, water reaches the surface, and a CO, flux to the atmosphere is established. In this connection, in winter when photosyn- thetic activity is low and mixing with subsurface water
causes surface pC0, to increase influxes of CO, to the atmosphere are generally reported. By contrast, a net CO,
flux into the ocean should be found when high photosyn- thetic activity is favoured as during moderate upwellings and relaxations of these events.
In more detail, initial pulses of intense upwelling advect CO,-rich waters to the surface, establishing a net flux to the atmosphere as seen at inner stations in late September 1994 and at stations 13, 14 and 15 in August 1995 (figure 7). However, there are some exceptions to this general rule. In July 1994 (intense upwelling period) sta- tion 13 was a CO, source, whereas station 11 acted as a
-tst.13
Figure 7. Temporal variability of the air-sea CO, flux magnititde (a) at the inner stations and (b) at the offshore stations; the seasonal cycle was
-100 III I I I I I I I I I I I I I grouped according to the hydrographic phases May&n Jut Aug SepOct NovDecJan FebMar Apr MayJun JW &g&p described in the text: IU: intense upwelling, MU:
-30 / , , I , MayJun JUI iug Sep
/ I I I I I I I 1 act NOI, Dee Jan Feb mar Apr May Jun JW
moderated upwelling, WC: winter conditions and UR: upwelling relaxation.
510

AIR-SEA CO, FLUXES IN A COASTAL EMBAYMENT
ferent annual periods. Mean net fluxes f standard deviation.
JUI-JUI L , Figure 8. Net CO, flux calculated for dif-
sink because the upwelled water did not reach the surface layer. Moreover, in June 1995, the air-sea CO, flux was directed towards the sea, reaching a maximum value of -68 and -55 mg me2d-’ at the external stations and -27 and -5 mg <mm2 d-’ at the inner ones. This fact can be attributed to an enhanced photosynthetic activity in a latter phase of the initial intense upwelling pulse and/or due to co,upling of the time scales characteristic of the upwelling process and phytoplankton growth rates.
There were no exceptions to the general behaviour as a CO, sink during moderate upwelling and periods of upwelling relaxatio’n, the whole region was a sink for CO,. Despite this, in wmter, fluxes are supposed to be directed towards thle atmosphere, as at the inner stations in late October, November and December 1994. How- ever, flux direction reversed in January and February 1995, probably due to an increase in photosynthetic activ- ity as a consequence of higher vertical stability and nutri- ent availability, both related to a higher runoff [ 161.
ative fluxes predominated for most of the seasons and sta- tions. The exception to this generalisation was winter, when fluxes were mainly positive, except in station 14; CO, also flowed towards the atmosphere in station 15 during autumn. In summer 1994 higher CO, influxes to the ocean were reported than in summer 1995. This fact can be attributed to a higher productivity during summer 1995, as indirectly suggested by surface dissolved oxygen concentrations and upper layer (20 m) integrated chlorophyll a averaged over summer 1994 (282 umol kg-’ and 47 mg rnm2) and summer 1995 (270 ~01 kg-’ and 39 mg m-2).
A stepwise, forced to zero, multiple regression was com- puted in order to ascertain the relative contribution of ApCO, and k.S on air-sea CO, flux on an annual scale. The results of these calculations (table Iv) indicated that wind speed through piston velocity modulated mainly the CO, air-sea exchange on the shelf, whilst inside the Ria, ApCO, was the principal factor affecting CO, exchange.
The magnitude of the net annual CO, flux will vary depending on the period chosen to perform the calcula- tion given that the seasonal cycle comprised two sum- mers. Thus, jigure 8 shows the net annual CO, flux calculated for different time periods together with its mean and standard deviation. The mean net annual CO, flux is negative in the four stations, ranging from -0.54 to -22 mg mm2 d-‘, indicating that the Ria of Vigo and adja- cent shelf behave as a CO, sink on annual time scales.
Table III. Mean seasonal air-sea CO, flux (mg mm2 d-l).
Sum. 94 Fall Winter Spring Sum. 95
St. 11 -27.1 -51.0 27.4 -34.3 -20.5 St. 13 -9.2 -15.6 2.1 -11.4 -2.0 St. 14 -4.8 -0.8 -1.6 -5.3 -5.0 St. 15 -2.3 0.9 0.5 -2.2 -0.4
4. DISCUSSION
Average seasonal air-sea fluxes calculated for each station The results presented in this paper clearly indicate that using the CO, fluxes infigure 7are shown in table III. Neg- the Ria of Vigo and adjacent shelf waters represent a net
511

B.A. ALVAREZ et al.
Table IV. Multiple R and percentage of variance explained by pCC$ gradient (ApCC&) and the exchange coefficient (k.S) on a stepwise, forced to zero, multiple regression between air-sea CO, flux and both variables in each station, (p < 0.001 in all cases).
Station
11
13
14
15
Variable Multiple R % variance explained
APCO, 0.075 13 k.S 0.844 71
APCO, 0.751 56 k.S 0.085 14
APCO, 0.629 40 k.S 0.110 15
APCO, 0.849 72 k.S 0.031 6
annual sink for atmospheric CO,, the magnitude of which varies spatially and temporally.
Few direct quantifications of air-sea CO2 fluxes on the northwestern Iberian Peninsula have been carried out so far [41]. Previous work indirectly estimated air-sea CO, exchange from box models 1421, showing that during upwelling periods, when primary production is high, the flux of CO, into the ocean can be 127 mg rnw2 d-‘, values of the same order as those found in this study in the shelf stations figllve 7). The same author calculated a flux to the atmosphere of 8.5 mg m-2 d-’ during the downwelling season, a value much higher than the maximum flux esti- mated for winter conditions for all the sampled stations (25-5 mg m-” d-l).
Distinct patterns of CO, flux variability were obtained between offshore and inner stations. Station 11 showed the highest mean annual CO, flux y-igure 8) and the lowest coefficient of variation. However, this result should be taken cautiously due to the lack of sampling in those peri- ods when CO2 is expected to flow towards the atmosphere. At station 11, less influenced by advective processes, sub- surface COz-enriched seawater did not reach the surface even during intense upwellings and therefore, the direc- tion of the CO2 flux would be mainly controlled by pho- tosynthetic activity in the upper mixed layer. On the other hand, the decreasing trend of the mean annual CO, flux towards the inner part of the Ria is indicative of the strong influence of wind speed on flux magnitude. Thus, varia- tions in this magnitude partly derive from the uncertainty in the parameterization of the gas transfer, as suggested by Lundberg [30] and Wanninkhof [60].
At station 15, the coefficient of the net annual flux vari- ability was 75 %, much higher than that found at the rest of the stations. In this connection, flux direction even slightly reversed when calculated between September
1994 and 1995 if?guf-e 8). This fact is related to the higher positive CO, fluxes detected in winter and during intense upwelling conditions. and also because the September to September period did not include summer 1994 when air to sea fluxes were maximum. These results are indicative of the importance of selecting an adequate spatial and temporal scale, and reveal the high interannual variability observed in air-sea CO, fluxes.
Station 14 stands out as the most intense atmospheric CO, sink (mean value -3.4 mg m-“d-j) inside the Ria of Vigo. This fact can be attributed to the elevated and neg- ative ApCO, values generally reported at this station as the COZ air-sea exchange at the imrer stations was mainly determined by the pC0, gradient (&Me IV). ApCO, was on average three-fold higher at station 14 than at station 15 (table il), suggesting that the net photosynthe- sis-respiration balance was considerably higher at station 14 than at the inner part of the Ria. Enhanced dissolved organic carbon concentrations have been measured in this zone [ 161. In addition, the Ria of Vigo supports an intense edible mussel culture which is responsible for the release of great amounts of detrital material to the water [9]~ Also, macrophyte populations decay in the inner part of the Ria in autumn. Heterotrophic processes are, therefore, likely to be of higher relevance at the most internal sta- tion (station 15) thus reducing the net CO, flux.
Annual primary production rates reported for the Rias ranged from 250 gC rn-‘yr-’ [58] to 350 gC m-2 yr-’ 14-21, and it has been estimated that about 1 % of the pho- tosynthetically fixed carbon is buried on coastal sedi- ments 1651. Therefore, between 6.9 and 9.6 mgC me2 d-r are thought to be buried in the sediments of the central zone of the Ria. This magnitude is slightly higher but of the same order of the net annual flux of CO, from the atmosphere to the Ria cfigure S), thus indicating that the studied system is likely to be in stationary state over the temporal and spatial scales evaluated in this investigation.
The statistical method used to quantify the effect of phys- ical and biological variables on pC0, has been previously used by different authors [28, 621. pC0, did not correlate with any other variable except dissolved oxygen concen- tration, pointing to organic matter production and rem- ineralization processes as the main control on pC0,. On short spatial scales chlorophyll a showed a significant correlation with pC0, in the North Atlantic [62]. How- ever, in the study presented here, the spatial scale was less than 50 km, the extended temporal period, 18 months, allowed an increasing effect of other factors influencing surface pC0, variability, such as advection of
512

deep, C02-rich water, air-sea CO, exchange and a potential time lag between grazing of phytoplankton bio- mass and its subsequent recycling to dissolved inorganic carbon. Surface dissolved oxygen maxima are expected to occur before minimum pC0, values as a consequence of the higher rate of 0, exchange across the surface [ 131. In this study, however, oxygen maxima and pC0, min- ima, or vice versa, were coincident, again showing the influence of biological activity on pC0, variability. The same conclusion was reached by different authors in diverse areas, such ;as the southeastern Bering Sea during spring 1980 [ 131, the North Atlantic [48], and the north- ern Indian Ocean during pre-monsoon [22].
The conclusions derived from the thermodynamic analysis were completely consistent with the statistical approach. In order of importa.nce, the processes modulating water column and surface pC0, variability were organic matter production/remineralisation, thermal and water fluxes and finally, carbonate precipitation/dissolution.
Salinity changes explained between a 0.9 and a 3.2 % of the pC0, variability considering the water column and the surface layer, respectively, whereas the calculated value for the global ocean is less than 10 % [54]. This discrep- ancy could be considered as contradictory because water flux in an estuary is much higher than in the open ocean. However, given the high productivity of these systems [17, 42, 581 the effect of photosynthetic TIC uptake on pC0, is expected to be about ten fold that caused by dilu- tion processes. The influence of thermal flux was always much higher than that attributed to dilution processes, especially in the surface layer of station 11. In this regard, we obtained similar values for the SpCO,/SS (considering
REFERENCES
AIR-SEA CO, FLUXES IN A COASTAL EMBAYMENT
proportional dilution in TIC and Alk.) and 6pC0,/6T rela- tionships, about 16.5 patm “C-’ or salinity units. Taking into account that surface seasonal thermal changes were wider than salinity variations (coefficients of variation equal to 11 % and 3 %, respectively), the former are expected to affect pC0, variability to a larger extent.
In conclusion, the Ria de Vigo and adjacent shelf consti- tute a net annual atmospheric sink for CO,, of which the magnitude varies seasonally and spatially, ranging between -0.54 and -22 mg mm2d-’ for the inner and the outermost parts of the Ria, respectively. pC0, variability is primarily controlled by biological activity. The CO, air-sea flux in the inner part of the estuary is mainly dominated by the air-sea CO, gradient and therefore by biological activity, whereas in the offshore region wind speed through piston velocity exerts a higher control on CO, exchange.
Acknowledgemenlts
The authors express their gratitude to the crew of B.O. Navaz from the Instituto Espanlol de Oceanografia, to R. Penin, M.V. Gonzalez and G. Casas for their help dur- ing sampling at se,a, M.V. Gonzalez, E. Nogueira, R. Penin, M.J. Pazd and T. Rellan who kindly made the data available. They also thank B. Martin for editorial com- ments, C. Souto for his valuable help and the anonymous reviewers for the suggestions which helped to improve this paper. This work was supported by the Comisidn Interministerial de Ciencia y Tecnologia (CICYT) under project AMB92-016’5.
[l] Alvarez-Salgado X.A., Rosen G., Perez EF., Figueiras F.G., Pazos Y., Nitroge:n cycling in an estuarine upwelling system, the Ria de Arousal (NW Spain) I, Short-time-scale patterns of hydrodynamic and biogeochemical circulation, Mar. Ecol. Progr. Ser. 135 (1996) 259-273.
[2] Anderson L.A., On the hydrogen and oxygen content of marine phytoplankton, Deep-Sea Res. 42 (1995) 1675-1680.
[3] AndriC C., Oudot C., Genthon C., Merlivat L., CO, fluxes in the Tropical Atlantic during FOCAL cruises, J. Geophys. Res. 91 (1986) 11741-11755.
[4] Bakker D.C.E., de Baar H.J.W., Bathmann U.V., Changes of carbon dioxide in surface waters during spring in the Southern Ocean Deep-Sea Res. II, 44 (1997) 91-127.
[5] Bakun A., Coastall upwelling indices, west coast of North America, NOAA tlechn. Rep. NMFS-671, 1973, 103.
[6] Bates N.R., Mich,aels A.F., Knap A.N., Seasonal and inter- annual variability of oceanic carbon dioxide species at the U.S. JGOFS Bermuda Atlantic Time-series Study (BATS) site, Deep-Sea Res. II, ,43 (1996) 347-383.
[7] Brewer P.G., What controls the variability of carbon dioxide in the surface ocean? A plea for complete information, in: Barton J.D., Brewer P.G., Chesselet R. (Eds.), Dynamic processes in the chemistry of the upper ocean, Plenum press, 1986, 246.
[8] Brewer P.G., Wong G.T.F., Bacon MX, Spencer D.W., An oceanic calcium problem, Earth Plan. Sci. Lett. 26 (1975) 81-87.
513

M. ALVAREZ et 31
[9] Cabanas J. I&%., Gonztiez J.J., Marifio J.: Perez A., Roman G., Estudio de1 mejill6n y su epifauna en 10s cultivos flotantes de la Ria de Arosa IlI: observaciones previas sobre la retenci6n de partfculas y la biodeposicidn de una batea, Bol. Inst. Espafi. Oceanogr. 5 (1979) 44-50.
[lo] Castro C.G., PCrez F.F., Alvarez-Salgado X.A., Roscln G., Rios A.F., Hydrographic conditions associated with the relaxation of an upwelling event off the Galician coast (NW Spain), 3. Geoph. Res. 99 (1994) 5135-5147.
ill] Cauwet G., El ciclo de1 carbon0 en 10s oceanos, Seminario de Quimica Marina 5 (1990) 47-58.
[12] Chipman D.W., pC0, surface, in: Recueil de don& par Le Groupe CITHER-2, Vol. 1. (Ed.) Lab. Phys. Oc. (96.Ol), Brest, France (1996) 167-l 80.
[13] Codispoti L.A., Friederick G.E., Iverson R.L., Hood D.W., Temporal changes in the inorganic carbon system of the soutl- eastern Bering Sea during Spring 1980, Nature 296 (1982) 296-242.
[14] Dandonneau Y., Sea-surface pressure of carbon dioxide in the eastern equatorial Pacific (August 1991 to October 1992): a multivariate analysis of physical and biological factors, Deep- Sea Res. II, 42 (1995) 349-364.
[15] Dickson A.G., An exact definition of total alkalinity and a pro- cedure for the estimation of alkalinity and inorganic total car- bon from titration data, Deep-Sea Res. 28 (198 1) 609-623.
j16] Doval M.D., Nogueira E., PCrez F.F.; Spatio-temporal variabi- lity of the thermohaline and biogeochemical properties and dissolved organic carbon in a coastal embayment affected by upwelling: the Ria de Vigo (NW Spain), J. Mar. Syst. 14 (1998) 135-150.
3171 Fraga F., Fotosintesis en la Ria de Yigo, Invest. Pesq. 40 (1976) 151-167.
[18] Fraga E, Upwelling off the Galician coast, Northwest Spain, in: Richards EA. (Ed.), Coast. Upwelling Ser. I AGU, Washington, D.C., 1981, 172-182.
[19] Fraga F., Margalef R., Las Rias Gallegas, in: Estudio y Explo- taci6n de1 mar en Galicia (Ed.), Univ. Santiago de Compostela, 1979, pp. 101-121.
[20] Fraga F., Rios A.F., PCrez F.F., Figueiras F.G., Theoretical limits of oxygen: carbon and oxygen: nitrogen ratios during photosynthesis and mineralisation of organic matter in the sea, Scientia Marina 62 (1998) 161-168.
[21] Gattuso J.P., Picho M., Frankignoulle M., Biological control of air-sea CO? fluxes: effect of photosynthetic and calcifying marine organisms and ecosystems, Mar. Ecol. Progr. Ser. 129 (1995) 307-312.
[22] George M.D., Dileep Kumar M., Naqvi S.W.A., Baerjee S., Narvekar RV., de Sousa S.N., Jayakumar D.A., A study of the carbon dioxide system in the northern Indian Ocean during premonsoon, Mar. Chem. 47 (1994) 243-254.
[V] Kanamori S., Ikegami H., Calcium-alkalinity relationship in the North Pacific, J. Oceanogr. Sot. Japan 38 (1982) 57-62.
1241 Keeling CD., Wharf T.P., Atmospheric CO2 records form sites in the SIO air sampling network, in: Trends: A compendium of
Data on Global Change, Carbon Dioxide Analysis Center. Oak Ridge National Laboratory, Oak Ridge, Tenn., 1991, USA.
[25] Landmm L.L., Gammon R.H., Feely R.A., Murphy P.P., KellLy K.C., Costa C.E., Weiss R.F., North Pacific Ocean CO, dis- equilibrium for spring through summer, 1985-1989,3, Geoph. Res. 101 (1996) 28539-28555.
[26] Laws E.A., Photosynthetic quotients, new production and net community production in the open ocean, Deep-Sea Res. I. 38 (1991) 143-167.
[27] Lee K., Miller0 F.J., Wanninkof R., The carbon dioxide system in the Atlantic Ocean, J. Geoph. Res. 102 (1997) 15693- 15707.
[28] Lefkvre N., AndriC C., Dandonneau Y.; pCO,, chemical pro- perties, and estimated new production in the equatorial Pacific in January-March 1991, J. Geophys. Res. 99 (1994) 12639- 12654.
[29] Liss P., Merlivat L., Air-sea exchange rates: Introduction and synthesis, in: Buat-MCnard P. (Ed.), The role of Air-sea Exchange in Geochemical Cycling, NATO Adv. Sci. Inst. Ser. 185, Reidel D., Publ. Co., Dordrecht, Holland, 1986, 113-127.
[30] Lundberg L., CO, air-sea exchange in the Nordic Seas, Ar, attempt to make an estimate based on data, Oceanol. Acta 17 (2) (1994) 159-175.
[31] Mackenzie ET., Global Carbon Cycle: some minor sinks for CO,, in: Flux of Organic Carbon by Rivers and Oceans, US Dep. Energy. Conf. 8009140 (1981) 360-384.
[32] McClain C.R., Chao S.Y., Atkinson L.P., Blanton J.O., De Castillejo F., Wind-driven upwelling in the vicinity of Cape Finisterre, Spain, J. Geophys. Res. 91 (1986) 8470-8486.
[33] Mehrbach C., Culberson C.H., Hawley J.E., Pytkowicz R.M., Measurements of the apparent dissociation constant of carbo- nic acid in seawater at atmospheric pressure, Limnol. Ocea- nogr. 18 (1973) X97-907.
[34] Miller0 EJ., The thermodynamics of the carbon dioxide sys- tem in the oceans, Geochim. Cosmochim. Acta 59 (1995) 661-677.
1351 Miller0 F.J., Byrne R.H., Wanninkhof R., Freely R., Clayton T., Murphy P., Lamb M.F., The internal consistency of CO, measurements in the equatorial Pacific, Mar. Chem. 44 (1993) 269-280.
[36] Mourifio C., Fraga F., Fern&&z F., Hidrografia de la Ria de Vigo 1979-1980, Cuademos da Area de Ciencias Marifias, Seminario de Estudos Galegos, 1 (1984) 91-103.
[37] PCrez F.F, Alvarez-Salgado X.A., Ros6n G., Rios A.F.. Carbo- nic-calcium system, nutrients and totai organic nitrogen in continental runoff to the Galician Rias Baixas, NW Spain, Oceanol. Acta 15 (1992) 595-602.
[38] P&ez F.F., Fraga F., The pH measurements in seawater on NBS scale, Mar. Chem. 21 (1987a) 315-327.
[39] P6ez F.F., Fraga F,, A precise and rapid analytical procedure for alkalinity determination, Mar. Chem. 21 (1987b) 169-182.
[40] PCrez EF, Rios A.F., Castro C.G., Ros6n G., Mixing anaiysis of nutrients, oxygen and dissolved inorganic carbon in the
514

AIR-SEA CO, FLUXES IN A COASTAL EMBAYMENT
upper and middle North Atlantic Ocean east of the Azores, .I. Mar. Syst. 16 (1998) 219-233.
[41] Perez F.F, Rfos A.F., Rosdn G., Sea surface carbon dioxide off the Iberian Peninsula (east North Atlantic Ocean), J. Mar. Syst. 19 (1999) 2746.
[42] Prego R., General1 aspects of carbon biogeochemistry in the Ria of Vigo, north-western Spain, Geochim. Cosmochim. Acta 57 (1993) 2041-2052.
[43] Rfos A..F., Fraga F., Perez F.F., Estimation of coefficients for the calculation of “NO”, “PO” and “Co”, starting from the elemental composition of natural phytoplankton, Scientia Marina 53 (1989) 779-784.
[44] Rfos A.F., Anderslon T.R., Perez F.F., The carbonic system dis- tribution and flux.es in the NE Atlantic during spring 1991, Progr. Oceanogr. 95 (1995) 295-314.
[45] Rfos A.F., Bingler L.S., Wallace D., Chipman D.W., Alvarez- Salgado X.A., Arlen L., Rosen G., Castro C.G., Johnson K., Carbon dioxide :results obtained during the R.V. Maurice Ewing cruise in the South Atlantic (WOCE Section A-17), Carbon dioxide Information Acquisition Center (CDIAC), Oak Ridge, TN, in press.
[46] Rfos A.F., Nombela A., Perez F.F., Rosen G., Fraga F., Calcu- lation of runoff to an estuary, Ria de Vigo, Scientia Marina, 56 (1992) 29-33.
1471 Rios A.F., Rosdn G., Surface pH, alkalinity and pCO* measurements, in: Recueil de donntes par Le Groupe CITHER-2, Vo1.3. (Ed.) Lab. Phys. Oc. (97-02), Brest, France, 1996,64-72.
[48] Robertson J.E., Watson A.J., Langdon C., Ling R.D., Wood J.W., Diurnal variation in surface pC0, and O2 at 60 “N, 20 “W in the North Atlantic, Deep-Sea Res. II, 40 (1993) 409-422.
[49] Rosen G., Perez F.F., Alvarez-Salgado X.A., Figueiras F.G., Variation of both thermohaline and chemical properties in an estuarine upwelling ecosystem: Rfa de Arousa, I, Time evolu- tion, Est. Coast. Shelf Sci. 41 (1995) 195-213.
[50] Roy R.N., Roy L.:N., Vogel K.M., Porter-Moore C., Pearson T., Good C.E., Miller0 F.J., Campbell D.M., The dissociation constants of carbonic acid in seawater at salinities 5 to 45 and temperatures 0 to 45 “C, Mar. Chem. 44 (1993) 249-267.
[51] Sabine CL. Key R.M., Controls offlO, in the South Pacific, Mar. Chem. 60 (1998) 95-110.
[52] Siegenthaler U., Sarmiento J.L., Atmospheric carbon dioxide and the ocean, Nature 365 (1993) 119-125.
[53] Takahashi T., Broecker W.S., Werner S.R., Brainbridge A., Carbonate chemistry of the surface waters of the worlds oceans, in: Goldlberg ED., Horibe Y., Saruhashi K., (Eds.), Isotope Marine Chemistry, Uchida Rokakuko, Tokyo, 1980, 291-326.
[54] Takahashi T., Olarfsson J., Goddard J.G., Chipman D.W., Sutherland S.C., Seasonal variation of CO, and nutrients in the high-latitude surfalce oceans: a comparative study, Glob. Bio- geoch. Cycles 7 (1993) 43-878.
[55] Taylor A.H., Watson A.J., Ainsworth M., Robertson J.E., Tur- ner D.R., A modelling investigation of the role of phytoplank- ton in the balance of carbon at the surface of the North Atlantic, Glob. Biogeoch. Cycles 5 (1991) 151-171.
[56] Taylor A.H., Watson A.J., Robertson J.E., The influence of the spring bloom on carbon dioxide and oxygen concentrations in the surface waters ‘of the northeast Atlantic during 1989, Deep- Sea Res. 39 (1992) 137-152.
[57] UNESCO La escala de salinidades practicas de 1978 y la ecua- cidn intemacional de1 estado de1 agua de mar de 1980, Docu- mentos tecnicos de la Unesco sobre ciencias de1 mar 36 (1984) l-21.
[58] Varela M., Fuentes J.M., Penas E., Cabanas J.M., Production primaria de las Rias Baizas de Galicia, Cuadernos da Area de Ciencias Marinas, Seminario de Estudios Galegos 1 (1984) 173-182.
[59] Walsh J.J., How much shelf production reaches the deep sea? in: Berger W.H., Smetacek VS., Wefer G. (Eds.), Productivity of the ocean: present and past, John Wiley and Sons Ltd. S. Bernhard, Dahlem Konferenzen, 1989, 175-191.
[60] Wanninkhof R., Relationship between wind speed and gas exchange over the ocean, J. Mar. Res. 97 (1992) 7373-7382.
[61] Watson A.J., Robertson J.E. Ling R.D., Air-sea exchange of CO, and its relation to primary production, in: Wollast R., Mackenzie ET., Chou L. (Eds), Interactions of C, N, P and S Biogeochemical Cycles and Global Change, NATO AS1 Series, Vol. 14, Springer-Verlag, 1993, 233-257.
[62] Watson A.J., Robinson C., Robertson J.E., Williams P.J., Fas- ham M.R., Spatial variability in the sink for atmospheric car- bon dioxide in the North Atlantic, Nature 350 (1991) 50-53.
[63] Weiss R.F., Carbon dioxide in water and seawater: the solubi- lity of a non-ideal gas, Mar. Chem. 2 (1974) 203-215.
[64] Weiss R.F., Jahnke R.A., Keeling C.D., Seasonal effects of temperature and salinity on the partial pressure of CO, in sea water, Nature 300 (1982) 300-5 11.
[65] Wollast R., The coastal organic carbon cycle: fluxes, sources, and sinks, in: Mantoura R.F.C., Martin J.-M., Wollast R. (Ed.), Ocean margin processes in Global Change, John Wiley and Sons Ltd., 1991,365-381.
[66] Wooster W.S., Bakun A., Mclain D.R., The seasonal upwelling cycle along the eastern boundary of the North Atlantic, J. Mar. Res. 34 (1976) 131-141.
[67] Woolf D.K., Thorpe S.A., Bubbles and the air-sea exchange of gases in near-saturation conditions, J. Mar. Res. 49 (1991) 435-466.
515