Embed Size (px)
Citation preview

1Report on Air Quality and the State of Public Health in Southern China
Department of Community MedicineSchool of Public HealthThe University of Hong Kong
AJ Hedley1
SM McGhee1 HK Lai1
J Chau1
1. Department of Community Medicine, School of Public Health, The University of Hong Kong2. Guangzhou No.12 Hospital
PYK Chau1 KWY Chung1 CQ Jiang2
CM Wong1
This study was commissioned by Civic Exchange and funded by the Rockefeller Brothers Foundation

2Report on Air Quality and the State of Public Health in Southern China
Addresses for correspondence
Department of Community Medicine,
School of Public Health,
University of Hong Kong Faculty of Medicine
5/F William M.K. Mong Block
21 Sassoon Road,
Hong Kong Tel: (852) 2819 9280
Fax:(852) 2855 9528
http://www.hku.hk/cmd/
Acknowledgements
The authors would like to thank the following organizations/ people in support of producing this report:
• Civic Exchange
• Rockefeller Brothers Foundation for their funding support of the project
• Hospital Authority for providing public hospitalisation data
• Dr. Li Fang of the Women and Children’s Hospital in Guangzhou for advice on collecting data for the Pearl
River Delta

3Report on Air Quality and the State of Public Health in Southern China
Table of Contents
Page No.
Abbreviation list 6
1. Background 7
2. Objectives 7
3. Data and methods 8
3.1. Overview
3.2. Air pollutant data
3.3. Excess risks
3.4. The annual cost of respiratory and cardiovascular diseases
3.5. The attributable cost of health care due to air pollution
3.6. Combining the effects of four air pollutants
4. Validation 20
4.1. Total cost based on estimates of PM10
derived from satellite remote-sensing
4.2. Unit health care cost between the PRD and HK
4.3. Estimating utilisation
5. Findings 22
5.1. Annual attributable deaths, bed-days, doctor visits
5.2. Direct health care costs
5.3. Indirect health care costs
5.4. Sum of health care costs
5.5. Comparison of costs between PRD and HK
5.6 Total cost based on estimates of PM10
derived from satellite remote-sensing
6. Sensitivity Analyses 24
6.1. Total cost based on simple summation of the effect of all 4 pollutants
6.2. Total cost based on other methods of adjusting the summation of the effect
of all 4 criteria pollutants
6.3. Direct and indirect health care cost based on different estimations of health
care utilization and costs data
6.4. Total cost based on mean income and median income in HK and MSAR
7. Discussion 25
References 30

4Report on Air Quality and the State of Public Health in Southern China
List of Tables
Table 3.1 Excess risks (%) per 10 µg/m3 change of different air pollutants 10
Table 3.2 Parameter list for direct and indirect health care cost in Pearl
River Delta (PRD)
35
Table 3.3 Parameter list for direct and indirect health care cost in MSAR
(M)
37
Table 3.4 Parameter list for direct and indirect health care cost in Hong
Kong (HK)
40
Table 3.5 Parameter list for comparison between 9 prefectures in Pearl
River Delta (PRD) and Hong Kong (HK)
43
Table 3.6 List of assumptions adopted in the study 45
Table 4.1 Total cost due to PM10
concentrations from 9 monitoring stations
in PRD and satellite remote sensing
48
Table 5.1 Estimated attributable deaths, hospital bed days and outpatient
visits in PRD and MSAR for 2006 pollution levels
49
Table 5.2 Estimated attributable deaths, hospital bed days and outpatient
visits in Hong Kong, three estimates
51
Table 5.3 Annual direct, indirect and total health care costs for Air Pollution
in the PRD, Macao and Hong Kong based on differences between
average 2006 and WHO guidelines/US EPA standard air pollutant
levels
52
Table 5.4 Costs per one million population for air pollution in the PRD,
Macao, and Hong Kong based on differences between average
2006 and WHO guidelines/US EPA standard air pollutant levels
53
Table 6.1 Sensitivity analysis on combination of 4 air pollutants 54
Table 6.2 Sensitivity analysis on WHO guideline values 56
Table 6.3 Sensitivity analysis on effects of PRD air data on the HK model 57
Table 6.4 Sensitivity analysis on total numbers of bed-days in private hos-
pitals in PRD
57
Table 6.5 Sensitivity analysis on proportion of hospital inpatients for each
disease in PRD
58
Table 6.6 Sensitivity analysis on average cost per bed-day in public hospi-
tals
58
Table 6.7 Sensitivity analysis on average cost of an inpatient episode in
Shenzhen
59
Table 6.8 Sensitivity analysis on number of hospital inpatients for employed
population
59
Table 6.9 Sensitivity analysis on mean and median monthly income in HK
and MSAR
59

5Report on Air Quality and the State of Public Health in Southern China
List of Figures
Figure 3.1 Thirteen air pollution monitoring stations in Guangdong Prov-
ince, three monitoring stations in HKSAR in PRDRAQmn, and two
monitoring stations in MSAR.
9
Figure 3.2 Monthly average air pollution levels averaged from 9 monitoring
stations in Guangdong 10 in Hong Kong and 2 in MSAR
10
Figure 3.3 Method for combining pollutant effects based on correlation
between PM10
, NO2 and SO
2 at monitoring stations
21
Figure 5.1 Total monthly costs due to 4 air pollutants in PRD, MSAR and HK
in 2004
23
Appendices
Appendix 1 Detailed tables on direct and indirect health care cost due to air
pollution
61
Appendix 2 Summary on health care costs due to air pollution including
malignant neoplasms
83
Appendix 3 Proxy geographic locations of 9 monitoring stations for sensitivity
analysis based on satellite remote sensing information.
88
Appendix 4 Surrounding appearance of the monitoring stations in Jiangmen,
Shenzhen, Zhongshan, and Zhuhai.
89
Appendix 5 Annual average concentration (in µg/m3) of each pollutant in nine
prefectures of Pearl River Delta, MSAR and Hong Kong
90

6Report on Air Quality and the State of Public Health in Southern China
Abbreviation list
A&E Accident and Emergency
AOD Aerosol optical depth
API Air Pollution Index
DG Dongguan
EPD Environmental Protection Department
FS Foshan
GDP Gross Domestic Product
GOPC General Outpatient Clinics
GP General Practitioners
GZ Guangzhou
HA Hospital Authority
HK Hong Kong
HZ Huizhou
ICD-9 International Classification of Disease, Revision 9
JM Jiangmen
LOS
M
MSAR
Lengths of stay
MSAR
MSAR Special Administrative Region
NO2
Nitrogen dioxide
O3
Ozone
PM10
Particulate matters with aerodynamic diameter smaller than 10µm
PRD Pearl River Delta
PRDRAQmn Pearl River Delta Regional Air Quality Monitoring Network
PYLL Person-years of life lost
RSP Respirable suspended particulates (or PM10
)
SAR Special Administrative Region
SO2
Sulphur dioxide
SOPC Specialty Outpatient Clinics
SZ Shenzhen
WHO World Health Organisation
ZH Zhuhai
ZQ Zhaoqing
ZS Zhongshan

7Report on Air Quality and the State of Public Health in Southern China
1. Background
Hong Kong (HK) is an island with many outlying islands in the South China Sea. Its subtropical weather brings abun-
dant rainfall and tropical cyclones in the summer season. The land is mainly covered by hills and mountains in an area
of 1092 km2. The population is about 6.9 million with GNP of HK$215,456 per capita in 2006.
Pearl River Delta (PRD) is a part of Guangdong (GD) Province which consists of nine prefectures and two Special
Administrative Regions (SARs). Those prefectures are Guangzhou (GZ), Shenzhen (SZ), Zhuhai (ZH), Dongguan (DG),
Zhongshan (ZS), Foshan (FS), Huizhou (HZ), Jiangmen (JM), Zhaoqing (ZQ) and the two SARs are Hong Kong (HK) and
MSAR (MSAR). PRD is closely connected to HK in terms of geographic areas, industrial development, communications
and transport and even ambient air quality. The number of motor vehicles transporting goods passing through Sha
Tau Kok or Lok Ma Chau (from Mainland China to HK) has increased by 35% since 1983 (Census and Statistics Depart-
ment 1984-2005). Energy production and consumption in Guangdong has increased by 382% and 253% respectively
from 1990 to 2004, and both continue to increase by about 20% each year (Bureau of Health of Guangdong Munici-
pality 2007).
MSAR, a part of China’s territory, is located in the PRD on the southeastern coast of Mainland China. The territory, with
an area of 28.6 km2, comprises the MSAR Peninsula, Taipa Island, Coloane Island and the reclaimed area Cotai. MSAR
has developed industries such as textiles, electronics and toys, as well as having built up a world class tourist industry
with wide choices of hotels, sports facilities, restaurants and casinos. MSAR's economy is closely linked to that of HK
and Guangdong province. It provides support to financial and banking services, staff training, transport and commu-
nications (MSAR Government Tourist Office website, 2008).
Air pollution has created a new disease burden on our health and health care system. In 2002, the short term health
impact and costs due to air pollution were reported by the Department of Community Medicine, University of Hong
Kong (Environmental Protection Department, 2002). Some studies have demonstrated that trans-boundary air pol-
lution problems should be assessed in terms of the spatial influences and sources of major emission (Mukerjee et al
2001; Watson and Chow 2001; Smith et al 2001 and Mukerjee 2002). Evaluating the air quality in Southern China and
its impact on health and health care costs is seen as an essential step in assessing the effectiveness of air pollution
control policies in the region.
This report describes the development of a model for estimating the health burden due to air pollution in PRD by
incorporating health effect estimates (i.e. the excess risks) from daily time-series studies of air pollution and estimat-
ing the avoidable impact of air pollution, in terms of health care utilization, deaths and the community costs, for
exceedances of the WHO guideline values and US EPA standards.
2. Objectives
The objectives of the project are:
• To estimate the direct costs of health care utilization due to air pollution attributable diseases in PRD including
MSAR and HK
• To estimate the indirect costs of health care utilization due to air pollution in these communities
• To compare the health care costs between PRD, MSAR and HK.

8Report on Air Quality and the State of Public Health in Southern China
3. Data and methods
3.1 Overview
We developed a model for estimating the health burden due to air pollution using health care and mortality data
from PRD together with measurements of air pollutants from these regions in 2006 and incorporating health effect
estimates (i.e. the excess risks) from daily time-series air pollution studies conducted in HK. The previous model for HK
was also re-worked to make it directly comparable with the PRD model.
We incorporated into the model the monthly average pollutant concentrations for HK, MSAR and the nine Guang-
dong prefectures thus creating 11 specific costing models. The following is a summary of the procedures we used:
• We searched for the relevant data for Guangdong, the nine prefectures in the PRD area and MSAR, including
demographic profiles, mortality rates, hospital admissions and outpatient visits in the public and private sectors,
self care data, productivity loss data and costs data through the internet as well as from sources of expert advice
(personal communications with Dr. Jiang and Dr. Li).
• We estimated the annual burden of air pollution attributable diseases, including direct health care costs and
productivity losses due to hospital admissions and premature deaths.
• We included two main categories of diseases, cardiovascular diseases and respiratory diseases, attributable to
air pollution. We also included malignant neoplasms as an additional analysis for the models on the nine pre-
fectures and HK (see appendix 2) but not for the MSAR model since there was no data available on malignant
neoplasms alone in MSAR.
• We applied the monthly average values in exceedance of both the WHO guideline values and the US EPA stand-
ards and resulting excess risks for four air pollutants (NO2, SO
2, RSP, O
3) which were then applied to the total
annual burden of diseases to estimate the burden of disease attributable to exceedance of the air pollution
guidelines.
• We the estimated the excess costs of health care utilisation and productivity losses attributable to each of the
four air pollutants and total annual air pollution pattern for the 11 geographic areas.
• We performed a wide range of sensitivity analyses to take account of uncertainties in the estimates of the air
pollutant, health care utilisation and cost data.
3.2 Air pollutant data
In our cost estimation, we used the individual stations for each prefecture to present different population exposures
that varied spatially across PRD region. Prefecture-specific analyses of the cost of health burden were based on the
following air pollution data in each PRD prefecture, MSAR and HK.
PRD: In Guangdong Province, four air pollutants including respirable suspended particulates (PM10
), nitrogen
dioxide (NO2), sulphur dioxide (SO
2), and ozone (O
3), are measured by the Pearl River Delta Regional Air Quality
Monitoring Network (PRDRAQmn), which was jointly established by the Guangdong Provincial Environmental
Protection Monitoring Centre and the Environmental Protection Department of Hong Kong Special Adminis-

9Report on Air Quality and the State of Public Health in Southern China
trative Region (HKSAR). It came into operation on 30 November 2005. Currently, daily data from the Mainland
monitoring stations are not available in the PRDRAQmn but monthly average values can be obtained from their
annual report (PRDRAQmn 2006). All estimation of this study is based on the 2006 monitoring results from
PRDRAQmn.
PRDRAQmn comprises 16 monitoring stations: 13 stations located in 9 prefectures of the Guangdong Province
and 3 stations located in the HKSAR (Figure 3.1). We selected one station in each prefecture as representative.
Among the 13 stations in the Mainland, 4 stations were not included in this study (Figure 3.1), namely Tianhu,
Luhu, Jinguowan and Shunde Dangxiao stations. The average of the monthly average data from these stations
was used to represent the province-wide monthly estimates (Figure 3.2).
MSAR: For MSAR, we used the monthly average values of 2 monitoring stations from Direcção dos Serviços Mete-
orológicos e Geofísicos (the meteorological office in MSAR), including High density Resident (Macao) station and
Ambient station (MSAR Air Quality Index website, 2008). The other two stations in MSAR, High density Resident
(Taipa) station and Roadside station were excluded due to incomplete data for all four pollutants and the road-
side type. The average of the monthly data from the two selected stations represented the city-wide monthly
estimates (Figure 3.2).
HK: For HK, instead of using the data from the three monitoring stations in the PRDRAQmn annual report, we
used the monthly average values of 10 general monitoring stations from the Environmental Protection Depart-
ment’s annual report (Air Science Group, Environmental Protection Department, 2006). These 10 monitoring
stations are located neither by the roadside nor in the countryside and the stations in Causeway Bay, Central,
Mongkok, and Tap Mun were excluded. The average of the monthly data from these stations represented city-
wide monthly estimates (Figure 3.2).
Figure 3.1: Thirteen air pollution monitoring stations in Guangdong Province, three monitoring stations in HKSAR in PRDRAQ, and two
monitoring stations in MSAR. Five PRDRAQmn stations (x) are excluded from this study.
City Monitoring Station
Regional Monitoring Station

10Report on Air Quality and the State of Public Health in Southern China
Figure 3.2: Monthly average air pollution levels from 9 monitoring stations in Pearl River Delta (PRD), 10 in Hong Kong (HK) and 2 in MSAR (M)
3.3 Excess risks
The excess risks per 10 µg/m3 change in each pollutant (PM10
, NO2, SO
2 and O
3) for all natural causes of mortality (ICD-
9 001-799), hospitalization of patients with cardiovascular diseases (ICD-9 390-459) and respiratory diseases (ICD-9
460-519) and general practice consultations with respiratory diseases were derived from daily time-series studies
(Table 3.1).
Table 3.1: Excess risks (%) [95% C.I.] per 10 µg/m3 change of different air pollutants
PM10
NO2
SO2
O3
Mortality*:
All natural causes 0.24 [0.01, 0.46] 0.64 [0.36, 0.91] 1.36 [0.93, 1.78] -0.11 [-0.37, 0.16]
Hospitalisation*:
Cardiovascular diseases 0.37 [0.18, 0.57] 0.73 [0.48, 0.98] 1.08 [0.72, 1.44] 0.24 [0.01, 0.47]
Respiratory diseases 0.50 [0.28, 0.71] 0.54 [0.27, 0.80] 0.76 [0.34, 1.18] 0.55 [0.31, 0.79]
Private hospital outpatient/
Private General Practitioners†:
Respiratory diseases 3.28 [2.52, 4.05] 3.42 [-0.62, 7.63] 0.68 [-3.03, 4.54] 1.50 [-1.18, 4.26]
Note: * derived from Wong CM et al 2002; †derived from Wong TW et al 2002.

11Report on Air Quality and the State of Public Health in Southern China
3.4 The annual cost of respiratory and cardiovascular diseases
The attributable cost of disease due to air pollution was estimated by applying the excess risks to the annual burden
of disease and its monetary value to obtain the attributable health-related costs for air pollution in each prefecture,
MSAR and HK. The health costs include deaths, inpatient hospitalisations and outpatient consultations. The magni-
tude of these costs indicate the loss to quality of life and pain and suffering related to air pollution but the full value of
these intangible costs is not reflected in the monetary costs presented. These health costs were calculated by apply-
ing the excess risks to the total numbers of deaths, hospital bed-days and outpatient visits to obtain the attributable
costs. The remainder of this section describes how the attributable health care utilisation and productivity losses
were estimated and valued in order to identify the minimum financial loss to the population through paying for extra
health care due to air pollution.
The monetary costs comprised two components: the direct and indirect health care costs. The direct health care
costs were the cost of illnesses and the indirect costs were the productivity losses due to hospital admissions
and premature deaths. Tables 3.2, 3.3 and 3.4 show the parameters used in calculating the direct and indirect
health care costs. All costs were based on or adjusted to the year 2004. Table 3.6 shows the list of assumptions
adopted in this study.
3.4.1 Cost of illness
PRD: The direct health care costs due to two main groups of diseases, cardiovascular and respiratory diseases,
were estimated for year 2004 for the nine prefectures in PRD. The classifications of disease categories were made
by the Bureau of Health of Guangzhou Municipality. Inpatient and outpatient costs in the public and private hos-
pitals were included in the calculation of direct health care costs in the PRD. The outpatient costs were calculated
as number of outpatient visits multiplied by the unit cost of a visit. The unit cost included the costs of operating
and staffing the premises, registration, drugs, investigations and treatment. Similarly, the inpatient costs were cal-
culated as the number of episodes multiplied by the average number of bed-days in an episode and the average
bed-day cost. The bed-day cost included the “hotel” costs, (bed, food, cleaning, electricity etc), and the cost of hos-
pital staff, drugs, investigations and treatment.
MSAR: The health care costs due to respiratory and cardiovascular diseases in MSAR were estimated for
2004 in a similar way. The classifications of disease categories were made by the Department of Health,
Government of the MSAR. Only two hospitals, S. Januario Hospital (a public hospital) and Kiang Wu Hospi-
tal (a private hospital) were considered in the model since the third hospital in MSAR, MSAR University of
Science and Technology Hospital, provides Chinese medicine. Episodes in the public and private hospitals,
visits to emergency services (A&E) in public and private hospitals, to public and private hospital out-patient
departments, to public health care centres, to other establishments providing health care under the public
and private sectors, to private clinics and to private centres for auxiliary diagnostic examinations were
included in the calculation of direct health care costs in MSAR. The computation methods and the assump-
tions used are specified in the next section.
HK: The health care costs due to respiratory and cardiovascular diseases in Hong Kong in 2004 were estimated in
a similar way to compare these with the output of the models for the nine prefectures. The classifications of dis-
ease categories were made by ICD-9. Episodes in public and private hospitals, visits to accident and emergency
departments (A&E), to specialist (SOPC) and general outpatient clinics (GOPC) and to private general practition-
ers (GP) were included in the calculation of direct health care costs in Hong Kong. The computation methods

12Report on Air Quality and the State of Public Health in Southern China
and the assumptions used are specified below.
3.4.1.1 Public hospitals inpatients
For all the PRD, MSAR and Hong Kong models, the cost per inpatient episode was calculated by multiplying the
average cost per bed-day with the mean number of bed-days in an episode - the length of stay (LOS). The annual
cost of public hospital episodes was calculated by multiplying the cost per inpatient episode by the annual
number of episodes.
Cost per inpatient episode
Mean length of stay (LOS) per episode
PRD: The mean LOS for episodes due to the two main diseases were obtained from the Guangzhou (GZ) Health
Statistical yearbook (廣州市衛生局, 2004) but we had no data on LOS for the other prefectures except Shen-
zhen. We assumed that the GZ LOS applied to all prefectures in the PRD. We used the data on LOS for Shenzhen
in the sensitivity analysis (Table 6.7)
MSAR: Mean LOS due to the two main diseases were obtained from the Department of Health Statistical year-
book 2004 (Department of Health, Government of MSAR). There were no separate figures for males and females
and therefore the overall mean LOS was used.
HK: Mean LOS due to the two main diseases in acute general and chronic infirmary hospitals for males and females
were obtained from the HA inpatient database for the year 2002 and assumed to apply to 2004.
Average costs per bed-day
PRD: Average costs per bed-day in non-profit general hospitals in all prefectures of PRD were obtained (廣東衛
生信息網 2003; 佛山市衛生信息網 2005; 中山市衛生局 2004) and assumed to be the same for all public hos-
pitals and for all diseases. The average costs per bed-day in each prefecture in 2003 were adjusted to 2004 prices
using the Guangdong prices as a guide to the inflation rate.
MSAR: Average costs per bed-day in the public hospital in MSAR were not available. We assumed the costs were
the same as that of Hong Kong acute general hospitals since the mean LOS for the two diseases in MSAR were
comparable to those in Hong Kong.
HK: Average costs per bed-day in acute general and chronic infirmary hospitals in Hong Kong for the year 2000
were obtained from the HA (Hospital Authority, 2000) and were assumed to be the same for both genders and
for the two main diseases. These were adjusted by the deflation rate to 2004 prices (Census and Statistics Depart-
ment, 2005).
Number of inpatient episodes per year
PRD: The annual numbers of inpatient episodes for all diseases in four prefectures (GZ, ZH, ZS, FS) and GD prov-
ince were obtained (廣州市衛生局, 2004; 珠海市統計信息網 2006; 中山市衛生局 2004; 佛山市衛生信息網
2005; 廣東衛生信息網 2003) in 2004.
The annual episodes for all diseases in the other five prefectures within GD province were estimated by multiply-

13Report on Air Quality and the State of Public Health in Southern China
ing the number of episodes in GD by the proportion of the GD population in each prefecture.
The proportion of all inpatient episodes which were attributable to the two main diseases in all eight prefectures
was taken to be the same as that reported for Guangzhou public inpatient episodes (廣州市衛生局, 2004).
MSAR: The annual numbers of inpatient episodes in S. Januario Hospital for the two main diseases were obtained
from the Department of Health Statistical yearbook 2004 (Department of Health, Government of MSAR).
HK: The annual numbers of inpatient episodes in Hong Kong for the two main diseases, in males and females
and in acute general and chronic infirmary hospitals were obtained from the Hospital Authority (HA) clinical
database for the year 2002 and were assumed to apply also to 2004.
3.4.1.2 Private hospitals inpatients
PRD: The annual episodes for all diseases in the nine prefectures were estimated by multiplying the number of
private hospital episodes in GD (廣東衛生信息網 2003) by the proportion of the GD population in each prefec-
ture. The cost was estimated in the same way as for public hospital costs using the numbers of private hospital
episodes in each prefecture and assuming that the other parameters (LOS and bed-day cost) were the same as
in public hospitals.
MSAR: The annual episodes for Kiang Wu Hospital were estimated by deducting the annual inpatient episodes
for S. Januario Hospital (Department of Health, Government of Macau) from the total annual in-patient episodes
for the two hospitals, S. Januario Hospital and Kiang Wu Hospital (Statistics and Census Service, 2005a). The cost
was estimated in the same way as for public hospital costs using the numbers of private hospital episodes and
assuming that the other parameters (LOS and bed-day cost) were the same as in public hospitals.
HK: The relative proportion of total annual bed-days in public and private sectors in HK was obtained from the
Hospital Authority Annual Report (Hong Kong Hospital Authority 2001) and used to calculate the number of
bed-days in private hospitals as below:
Total number of bed-days in public hospitals * (Proportion of the number of bed-days in private sector /
Proportion of the number of bed-days in public sector)
These 2001 data were assumed to apply to 2004. All other parameters were assumed to be the same as for
public acute hospitals.
3.4.1.3 Public hospital outpatients (PRD), public hospital outpatients and other outpatient visits (MSAR) and public outpatient visits (HK)
Cost per outpatient visit
PRD: The average costs per outpatient visit in non-profit general hospitals were obtained for the year 2003
for the nine prefectures in the PRD (廣東衛生信息網 2003). The average costs per visit included hospital
outpatient visits and A&E visits and were assumed to be the same for cardiovascular and respiratory dis-
eases. They were adjusted to 2004 prices using Guangdong prices (中華人民公和國國家統計局, 2005) as a
guide to the inflation rate.

14Report on Air Quality and the State of Public Health in Southern China
MSAR: The average costs per outpatient visit in the public hospital (S. Januario Hospital), public health
care centres and other public establishments providing health care were not available. We assumed that
they would be the same as those in HK. Since there were no separate utilization figures for general and
specialist clinic visits in MSAR, the average of the costs per GOPC and SOPC visits in HK was used. The
average costs per A&E visit in S. Januario Hospital were also not available and assumed to be the same as
that in HK.
HK: Public outpatient costs included attendances to GOPC, SOPC and A&E clinics. The cost per visit in the GOPC in
2000 was obtained from the HA (Hong Kong Hospital Authority 2002) and the Department of Health (Health and
Welfare Bureau 2000). The cost per visit in SOPC in 2000 was obtained from the HA and was applied to all visits
in Medicine and Surgery clinics. The average cost per visit in A&E in 2000 was obtained from the HA (HA costing
exercise 2000). The above costs per visit were assumed to be the same for the two diseases and for both males and
females and were adjusted by deflation to 2004 prices.
Number of visits per year
PRD: The annual numbers of outpatient visits in three prefectures (GZ, ZS, FS) and GD province were obtained
(廣州市衛生局, 2004; 中山市衛生局 2004, 佛山市衛生信息網 2005, 廣東衛生信息網 2005). The proportions
of the number of visits due to the two diseases were assumed to be the same as for inpatient episodes in GZ.
The annual numbers of visits in the other six prefectures were estimated in the same way as described in section
3.3.1.1 (number of episodes per year) above.
MSAR: The annual numbers of outpatient visits in the public hospital (S. Januario Hospital) due to the two
diseases were obtained from the Department of Health Statistical yearbook 2004 (Department of Health,
Government of MSAR). The annual numbers of outpatient visits in public health care centres and other public
establishments providing health care were estimated based on the Health Care Survey in 2004 (Statistics
and Census Service, 2005a), where it provided data on the number of consultations of primary health care
by specialty including the two main diseases and proportions of health care establishments of public and
private sectors. The proportion of health care establishments in the public sector (3.2%) was applied to the
numbers of consultations for the two main diseases. The total annual number of outpatient visits in the A&E
department in S. Januario Hospital was obtained from the Department of Health Statistical yearbook 2004
(Department of Health, Government of MSAR). The proportions of the A&E visits due to the two main disease
groups were assumed to be the same as for inpatient episodes in the hospital.
HK: The total numbers of A&E, SOPC (in the Department of Medicine and Surgery under the HA) and GOPC visits
(under the Department of Health and the HA) in year 2004 was obtained from the Census and Statistics Depart-
ment in Hong Kong (Census and Statistics 2005). The proportions of the visits due to the two main disease
groups were assumed to be the same as for HA inpatient episodes.
3.4.1.4 Private hospital outpatient (PRD), private hospital outpatients and other outpatient visits (MSAR) and private general practitioner visits (HK)
Average cost per visit
PRD: The average costs per outpatient visit in the private hospitals in the nine prefectures were not avail-
able and therefore they were assumed to be the same as those for non-profit general hospitals in the

15Report on Air Quality and the State of Public Health in Southern China
relevant prefectures.
MSAR: The average costs per outpatient visit in the A&E department in Kiang Wu Hospital were not available and
assumed to be the same as that in HK. The average costs per outpatient visit in other private clinics, private centres for
auxiliary diagnostic examinations and other private establishments providing health care were also not available and
assumed to be the same as the mean consultation fee for a visit to a private general practitioner (GP) in HK.
HK: The mean consultation fee for a visit to a private GP was obtained from the Harvard Household Survey car-
ried out in 1998 (McGhee et al., 1998). It was adjusted to 2004 prices and assumed to be the same for all visits.
Number of visits per year
PRD: The annual numbers of private hospital outpatient visits for all diseases in Guangdong province in 2003 were
obtained (廣東衛生信息網 2003) and assumed to apply to 2004. The annual numbers of visits for all diseases in the
nine prefectures within GD province were estimated by multiplying the numbers of visits in GD by the proportion
of the GD population in each prefecture. We assumed that the proportions of diseases (inpatients and outpatients)
in the 8 prefectures were the same as for GZ inpatient episodes.
MSAR: The total annual number of outpatient visits in the A&E department in Kiang Wu Hospital was estimated by
deducting the annual number of outpatient visits in the A&E department in S. Januario Hospital (Department of
Health, Government of Macau) from the total annual number of visits to all emergency services (Statistics and Census
Service, 2005a). The proportions of the A&E visits due to the two main disease groups were assumed to be the same as
for inpatient episodes in the hospital. The total annual number of outpatient visits in other clinics, centres for auxiliary
diagnostic examinations and other establishments providing health care in the private sector was estimated from
the Health Care Survey in 2004 (Statistics and Census Service, 2005a), which provided data on the annual number of
consultations of primary health care for respiratory diseases and the proportion of primary health care establishments
in the private sector (96.8%).
HK: The proportion of respondents making a GP visits due to cold, flu or fever in the past two weeks and the
average number of visits were obtained from the 6134 respondents in the Harvard Household Survey (McGhee
SM et al 1998). These were applied to the HK population in 2004 and used to estimate the annual number of GP
visits due to respiratory diseases.
3.4.2 Productivity losses
The attributable productivity losses due to morbidity and premature mortality due to air pollution were estimated as the indirect
health care costs. We included losses due to attributable inpatient episodes for the two main diseases and due to attributable
deaths for any cause. These losses applied only to the working population aged from 15 to 64 years old.
The productivity losses due to attendance at public and private hospital outpatient clinics were not calculated for the nine
prefectures, MSAR or HK as there were no official data or related data on time off work for outpatient visits in the PRD.
3.4.2.1 Productivity loss due to inpatient episodes
The costs of productivity loss due to inpatient episodes were estimated for public and private hospitals. Productivity
losses for the duration of episodes were calculated by multiplying the mean LOS for each of the two main diseases by
the annual number of episodes for the working population for each disease and by an estimated daily income derived
from the reported mean yearly income for PRD (Statistics Bureau of Guangdong Province 2005) or a calculated mean

16Report on Air Quality and the State of Public Health in Southern China
yearly income for MSAR and Hong Kong.
Mean LOS
PRD: The mean LOS in public and private hospitals in the PRD for those aged 15 to 64 were taken to be the same
as for all ages and calculated as described in sections 3.3.1.1 (cost per inpatient episode) and 3.3.1.2 above.
MSAR: The mean LOS in public and private hospitals in MSAR for those aged 15 to 64 to be the same as for all ages
and calculated as described in sections 3.3.1.1 (cost per inpatient episode) and 3.3.1.2 above.
HK: The mean LOS for those aged 15 to 64 in acute general and chronic infirmary hospitals in Hong Kong for the
two main diseases, in males and females were obtained from the HA clinical database for the year 2002 and were
assumed to apply also to 2004.
Annual number of episodes
PRD: The annual numbers of public and private hospital episodes for the two main diseases for those aged 15
to 64 we also assumed to be the same as for all ages and calculated as in sections 3.3.1.1 (number of episodes per
year) and 3.3.1.2 (number of episodes per year) above.
The proportions of the population aged 15 to 64 in seven prefectures, but not DG and JM, were obtained (中
山市統計局 2005b; 佛山市統計局 2005a; 廣州市統計局 2005b; 惠州市統計局 2005b; 深圳市統計局 2005;
珠海市統計局 2005b; 肇慶市統計局 2005b). For DG and JM, the proportion of this age group in Guangdong
province was used instead (廣東統計信息網 2005).
The registered urban unemployment rates in the nine prefectures were obtained from the government official
website or the Bureau of Statistics in each prefecture.
The annual numbers of inpatient episodes for employed people due to the two main diseases were obtained by
multiplying the annual numbers of hospital episodes for all ages by the proportion of the population aged 15 to
64 and by the reciprocal of the urban unemployment rate in 2004.
MSAR: The annual numbers of public and private hospital episodes for the two main diseases for those aged
15 to 64 were estimated by applying the proportion of all discharge episodes in S. Januario Hospital aged 15
to 64 as derived from the Department of Health Statistical yearbook 2004 (Department of Health, Govern-
ment of MSAR) to the total annual numbers of episodes for the two main diseases (Department of Health,
Government of MSAR). These figures were then multiplied by the labour force rate (Statistics and Census
Service, 2005b and 2007a) and the employment rate in the year 2004 obtained from the Employment Survey
2004 (Statistics and Census Service, 2005b).
HK: The number of inpatient episodes for the group aged 15 to 64 was obtained from the HA clinical database
in the year 2002. It was then multiplied by the labour force rate and the employment rate in the year 2004
obtained from the Women and Men in Hong Kong Key Statistics (Census and Statistics Department 2007).
Mean annual income
PRD: The mean annual income of workers in the nine prefectures in 2004 was obtained from the Guangdong
Statistical Yearbook (Bureau of Health of Guangzhou Municipality 2005).

17Report on Air Quality and the State of Public Health in Southern China
MSAR: The mean monthly income of 219,143 employed persons in MSAR by gender was estimated by using
the middle values of sixteen monthly income categories and the number of employed persons in each category
obtained from the Employment Survey 2004 (Statistics and Census Service, 2005b). In estimating the mean
monthly income for employed persons in MSAR, those employed persons with unknown monthly earnings
were assumed to earn the overall median monthly income of employed population (Statistics and Census Serv-
ice, 2008). The mean annual incomes were estimated from the mean monthly incomes multiplied by 12. The
estimated mean monthly and annual incomes for employed persons (males and females) in the MSAR currency
(MOP) were translated to the Hong Kong (HK) currency. The exchange rate is around MOP$103 = HK$100 in the
past five years (Yahoo website 2008).
HK: The mean monthly income of 3,276,500 employed persons in Hong Kong by gender was estimated by using
the middle values of twelve monthly income categories and the number of employed persons in each category
obtained from the Women and Men in Hong Kong Key Statistics (Census and Statistics Department 2007). The
mean annual income was estimated from the mean monthly incomes multiplied by 12.
3.4.2.2 Productivity losses due to premature deaths
Productivity losses due to premature death as a short-term effect of air pollution were estimated for those who died
aged 15 to 64 in 2004 by calculating first the person years of life lost for each death under 65 years and using this with
average earnings to calculate the productivity losses.
PRD:
Number of deaths under age 65
The number of deaths in males (females) between ages 15 to 64 in each prefecture was estimated by multiplying
the population in 2004 by the proportion of males (females), by the proportion of persons aged 15 to 64 and by the
death rate (for any cause, both genders and aged 15 to 64) for each of the nine prefectures respectively. However,
the death rates for the nine prefectures were available for all ages only and therefore the Hong Kong death rates for
persons aged 15 to 64 were used (known death database from the Census and Statistics Department for the year
2004). Thus it has been assumed that the death rates for males and females aged 15 to 64 for the nine prefectures
were the same as those in Hong Kong.
The proportions of males and females in seven prefectures but not Dongguan and Jiangmen, was obtained for
2005 from published reports (中山市統計局 2005b; 佛山市統計局 2005a; 廣州市統計局 2005a; 惠州市統計
局 2005a; 深圳市統計局 2005; 珠海市統計局 2005a; 肇慶市統計局 2005a). For Dongguan and Jiangmen, the
proportions of males and females in Guangdong province was used instead (廣東統計信息網 2005) and were
assumed to apply to 2004. The proportion of the population in the age group 15 to 64 years in seven prefectures
was obtained as described in section 3.3.2.1 above. For the two remaining prefectures, Dongguan and Jiang-
men, this proportion was assumed to be the same as for Guangdong province.
Average person-years of life lost (PYLL) under 65
The average PYLL per death for males and females incurred between age 15 and 64 years in each prefecture was
assumed to be the same as the corresponding PYLL per death in Hong Kong because there was no comparable
data for PRD. The PYLL per death in Hong Kong was calculated as the PYLL for all who died aged 15 to 64 divided
by the number of decedents aged 15 to 64 in Hong Kong.
18Report on Air Quality and the State of Public Health in Southern China
Therefore, the PYLL per death in Hong Kong was calculated as:
PYLL for all deaths aged 15 to 64 in Hong Kong / Number of deaths aged 15 to 64 in Hong Kong
The PYLL due to death before 65 years in each prefecture was estimated by multiplying the number of deaths
under 65 years in each prefecture (reference) by the average PYLL per death
The productivity losses due to premature death as a short-term effect for males and females in the nine
prefectures in the PRD were estimated by multiplying the average PYLL for those who died aged 15 to
64 by the reciprocal of the urban unemployment rate in 2004 (Statistics Bureau of Guangdong Prov-
ince, 2004) and by the relevant mean annual income in 2004 (Statistics Bureau of Guangdong Province
2005).
MSAR: The productivity loss due to premature deaths for all natural causes in MSAR was calculated by mul-
tiplying person-years of life lost for those aged 15 to 64 who died before 65 in 2004 with the labour force
rate (Statistics and Census Service, 2005b and 2007a), the employment rate (Statistics and Census Service,
2005b), and the annual mean incomes for males and females (converted from the estimated mean monthly
income (Statistics and Census Service, 2005b)) respectively. The exact age at deaths for each premature
death was not available, we therefore assumed these deaths incurred in the middle of the age range at
deaths (i.e. 27 for the range 15 to 39 years and 52 for 40 to 64 years) that were available from the Demo-
graphic Statistics 2004 (Statistics and Census Service, 2005c). Person-years of life lost were calculated by
subtracting these approximated age at death from 65 for these premature deaths.
HK: The productivity loss due to premature deaths for all natural causes in Hong Kong was calculated by
multiplying person-years of life lost for those aged 15 to 64 who died before 65 in 2004 (calculated from the
known death database in the Census and Statistics Department) with the labour force rate (Census and Statis-
tics Department, 2007), the employment rate (Census and Statistics Department, 2007), and the annual mean
incomes for males and females (converted from the estimated mean monthly income (Census and Statistics
Department, 2007)) respectively. Person-years of life lost were calculated by subtracting the age at death from
65 for each death which was obtained from the database on all deaths in 2004 provided by the Census and Sta-
tistics Department. The death pattern in 2002 was assumed to be the same as in 2004.
3.5 The attributable cost of health care due to air pollution
The annual burdens of the two main diseases were translated to monthly costs by dividing the total costs of illness and
productivity losses by 12. The attributable cost was estimated by assuming that the whole population was exposed
to the monthly ambient air pollution level in the relevant prefecture, MSAR or Hong Kong. With 100% exposure, the
attributable risk can be represented by the excess risk. The relevant attributable risk per 10 µg/m3 is labelled here as
the “health effect estimate”. This was multiplied by the monthly cost and the difference between the actual monthly
concentration and a reference value as below to give the health care cost of air pollution (CAP):

19Report on Air Quality and the State of Public Health in Southern China
CAP = Monthly Cost * (Concentration – Reference level) * Health effect estimates
Where:
“Monthly Cost” is derived as above from the annual cost of illness, and productivity loss derived from the public hos-
pital admissions, public hospital out-patient, private hospital admissions, private hospital outpatients, and premature
deaths. Cardiovascular and respiratory morbidity and mortality were included and annual costs were translated to a
monthly cost after summation.
“Concentration” represents the monthly average air pollutant concentration if it exceeds the relevant Air Quality
Guideline (US EPA 2006, WHO 2006).
“Reference level” represents the air quality level or threshold below which no pollution related health outcomes are
attributed and hence no costs incurred. These are based on guideline values from US EPA (2006) for ozone and WHO
(WHO 2006) for the other pollutants (references).
“Health-effect estimates” are the attributable risk estimates per unit of pollutant derived from the excess risk esti-
mates which come from time-series models (Wong CM et al 2002, Wong TW et al, 2002). The time-series models are
concentration-response functions that describe the number of avoidable adverse health outcomes per unit change
in ambient air pollutant concentrations.
For example in 2004, the annual burden of cardiovascular and respiratory diseases in Guangzhou among all
the public hospital inpatients are estimated as RMB 693,221,797 and RMB 522,599,655 respectively. The excess
risks for hospitalisation per 10 µg/m3 of NO2 are 0.73% and 0.54% obtained from Hong Kong time series stud-
ies (see Table 3.1). If the average NO2 level in Guangzhou in one month is 92 µg/m3
(WHO guideline: annual
average is 40 µg/m3), the burden of cardiovascular and respiratory disease for public hospital inpatients in
that month which is avoidable by compliance with the WHO guideline is:
We have applied a strict dichotomous decision rule. If the average NO2 level in Guangzhou in one month is below 40 µg/
m3 , the pollutant concentration of NO
2 is regarded as zero (WHO guideline: annual average is 40 µg/ m3). The avoidable
burden of cardiovascular and respiratory diseases for public hospital inpatients in that month is:
Guideline values for air pollutants
Monthly average levels of PM10, NO2, SO2 and O3 in each prefecture of the PRD, Hong Kong, and Macao were compared with the annual (or the longest averaging time) average values in the WHO Air Quality Guidelines
= RMB 3,415,775
(92 – 40)693,221,797
12
100.0073
522,599,655
12 (92 – 40)
0.0054
10
0693,221,797
12
100.0073
522,599,655
12 0
0.0054
10
= RMB 0

20Report on Air Quality and the State of Public Health in Southern China
for annual average levelsi (PM10: 20 µg/ m3; NO2: 40 µg/m3; SO2: 20 µg/m3) and the US EPA Air Quality 8 hour standard for O3: 40 µg/m3.ii, iii The purpose of deducting the guideline or standard (“reference level”) from the observed ambient level ( “concentration”) in the calculation is to contrast the health impacts of a poor air quality level with those of an arbitrary better or good air quality standard. The WHO guidelines and US EPA standards are to be regarded as safer levels but recent studies in adolescents indicate that concentrations below these levels are still strongly associated with significant negative health impacts.iv In our analysis it was assumed that when the air pollution level is below the guideline no health and productivity costs are incurred, but alternate (ie lower) baseline levels have been included in the sensitivity analysis.
3.6 Combining the effects of four air pollutants
This method was based on the previous air pollution and cost study (Hedley et al 2006). Using 1 to represent the 100%
contribution of PM10
, we first obtained the correlation between PM10
and NO2 then calculated the proportional varia-
tion of NO2 explained by PM
10 and subtracted this from 1. We then obtained and subtracted the correlation between
NO2 and SO
2 adjusted by PM
10 and that between PM
10 and NO
2 adjusted by SO
2 (Figure 3.3). For our main estimate we
assumed that only the contribution of PM10
and O3 were 100%, so the total number of avoidable health events associ-
ated with air pollution (T1) was estimated on the basis of partial correlation adjustment method (Figure 3.3):
4. Validation
4.1 Total cost based on estimates of PM10 derived from satellite remote-sensing
To assess whether the monthly average of air pollution levels recorded by the PRDRAQmn were consistent with that
recorded by other methods of air pollution measurements, we compared the monthly PM10
data recorded by the 9
monitoring stations in Guangdong with the satellite inferred concentration of PM10
derived from the 1-km resolution
satellite remote-sensing information of the aerosol optical depth (AOD) (IENV 2006).
The calculation of the inferred concentration was based on a linear regression model with the 2006 monthly average
PM10
levels reported by HK EPD as dependent variable and the 2006 monthly average AOD values obtained from the
HK monitoring station’s geographic locations as independent variable. To ensure the regression model produces a
reasonable prediction range of PM10
levels for PRD monitoring station, we used the HK station, which has maximum
and minimum PM10
levels most similar to that recorded in the PRD stations. In this study, Causeway Bay roadside sta-
tion was used.
i. World Health Organization. (2006). Air quality guidelines global update 2005: particulate matter, ozone, nitrogen dioxide and
sulfur dioxide. World Health Organization. Regional Office for Europe.
ii. US EPA (2006). Air Quality Criteria for Ozone and Related Photochemical Oxidants. (EPA 600/R-05/004 aF) Vol I, Chapter 7.
iii. The WHO annual standard was used for PM10
and SO2. Since there is no WHO annual standard for O
3, the US EPA air quality 8
hour (CHECK AGAINST STANDARD REWRITE )standard was used..
iv. Gauderman WJ, Vora H, McConnell R, Berhane K, Gilliland F, Thomas D, Lurmann F, Avol E, Kunzli N, Jerrett M, Peters J.
(2007). Effect of exposure to traffic on lung development from 10 to 18 years of age: a cohort study. Lancet. 2007 Feb
17; 369:571-577.

21Report on Air Quality and the State of Public Health in Southern China
Inferred PM10
= 40.52 + 233.46*(AOD)
The regression model (R2 = 0.72) was then used to predict the PM10
levels at each PRD monitoring station by using the
monthly average AOD values obtained from each PRD station’s proxy geographic location (Appendix 3).
It must be noted that Satellite data can only serve as a validation but cannot be used to estimate the cost since it only
infers PM10
levels but not the other criteria pollutants which are associated with the health effects.
Table 4.1 shows the total cost due to PM10
based on 9 monitoring stations in Guangdong and satellite remote-
sensing.
4.2 Unit health care cost between the PRD and HK
The average cost per bed-day in the 9 prefectures was RMB578 and in HK was $2,727, which was 4.7 times higher.
The average cost per public outpatient visit in PRD was RMB 98 and for HK was $462, which was also 4.7 times
higher for HK. Table 3.5 shows the parameter list for comparison between 9 prefectures in PRD and HK.
4.3 Estimating utilisation
In Table 3.5, some of the inpatient utilisation data is estimated as indicated and some is real data taken from local pub-
lications. A validation of calculating the data using our estimation method and comparing with the real data for those
prefectures where we have this is shown in Table 3.5, section 4. It confirms that our estimation method has probably
Cost estimation based on T1 adjustment method represents the main results in this report.
T1 = PM10
+ 0.41NO2+ 0.84SO
2 + O
3.
PM10
NO2
(41%)
SO2
(84%)
(1-[0.768]2) = 0.41 NO2
(1-[0.67]2 - [0.39]2) = 0.84 SO2
Correlation between NO2 and PM10
Partial correlation between NO2 and SO2 adjusted by PM10
Partial correlation betwen PM10 and SO2 adjusted by NO2
Figure 3.3: Method for combining pollutant effects based on correlation between PM10
, NO2 and SO
2 at monitoring stations

22Report on Air Quality and the State of Public Health in Southern China
under-estimated the real data and thus is a conservative estimation resulting in an underestimate of the PRD costs.
5. Findings
5.1 Annual attributable deaths, bed-days, doctor visits
The annual attributable number of deaths in the whole region (PRD + HK + Macao) was 9,519 of which 8,944 (94%)
were in the 9 prefectures of the PRD (Tables 5.1 and 5.2) with the largest numbers in GZ (3,306) and FS (1,926). The
attributable annual number of bed days at 400,303 for PRD plus Macao (Table 5.1) was ten times the number in Hong
Kong (Table 5.2).
5.2 Direct health care costs
The currency used in the PRD is the Renminbi (RMB) and in MSAR is the Macao Pataca (MOP). Costs are shown both in
their original currency units (except for MSAR currency which is already translated to HK$ in the model at an exchange
rate of MOP$103=HK$100). Costs were adjusted to parity with Hong Kong by multiplying by the ratio of PRD or Macao
to Hong Kong GDP per capita. The tables include both but the adjusted costs are most appropriate for comparison
with Hong Kong.
The estimated annual direct health care costs for the PRD and each of the nine prefectures, Macao, and Hong Kong are
shown in part one of Table 5.3. The unadjusted direct costs for the population in the PRD for all 4 pollutants is RMB 993
million, for Hong Kong is HK$ 839 million and for Macao is HK$ 7 million. The adjusted direct costs for the PRD are RMB
3.8 billion compared to HK’s cost of HK$ 0.8 billion; a 4- to 5-fold difference.
5.3 Indirect health care costs i.e. productivity loss
The unadjusted annual indirect costs of lost productivity are shown in part two of Table 5.3 as RMB 761 million for
all 4 pollutants in the PRD, HK$ 258 million in Hong Kong and HK$ 10 million in Macau. Adjusted figures show that
productivity loss for the PRD is about 11 times that of Hong Kong.
5.4 Sum of health care costs
The unadjusted sum of the annual health care costs and productivity loss due to the health detriment caused by air pollution
was RMB 1.8 billion for PRD, HK$ 1.1 billion for Hong Kong and HK$ 18 million for Macao (Table 5.3, part three). After adjust-
ment for relative differences in GDP per capita, the PRD cost was RMB 6.7 billion, seven times that of Hong Kong. Adjusted costs
in PRD prefectures ranged from RMB 119 million in Zhuhai to RMB 2.4 billion in Guangzhou.
5.5 Comparison of costs between PRD, MSAR and HK
Since the population sizes were different in the PRD, MSAR and Hong Kong, costs were scaled to obtain the costs per
1 million population. The estimated annual direct health care costs per one million population in each of the nine
prefectures in PRD, MSAR and Hong Kong are shown in part one of Table 5.4. The average adjusted costs per 1 million
population in the PRD were RMB 115 million for direct costs and RMB 95 million for lost productivity with just over
half the sum of RMB 210 million per 1 million population (Table 5.4, part three) due to direct costs. For MSAR, the pro-
ductivity loss makes up a larger part (59%) of the sum of HK$ 38 million per million population and the HK costs per
million population are HK$ 162 million with 76% due to direct costs of health care.

23Report on Air Quality and the State of Public Health in Southern China
Figure 5.1: Total monthly costs due to 4 air pollutants in PRD, MSAR and HK in 2004

24Report on Air Quality and the State of Public Health in Southern China
The monthly costs due to the 4 air pollutants in PRD, MSAR and HK are shown in Figure 5.1.
5.6 Total cost based on estimates of PM10 derived from satellite remote-sensing
After using the estimates of PM10
concentrations derived from satellite remote-sensing data, the total cost for the
burden of disease due to PM10
increased 14% for PRD. Shenzhen, Zhuhai, Jiangmen, and Zhongshan increased by
more than 50% (53% to 234%), Zhaoqing increased 31%, and the rest (Guangzhou, Foshan, Huizhou, Dongguan)
changed less than 15% (-14% to 8%) (Table 4.1).
6. Sensitivity Analyses
6.1 Total cost based on simple summation of the effect of all 4 pollutants
Air pollutants are inter-correlated, i.e. the high level of one pollutant could be associated with a high level of
another pollutant. We have evidence from studies in Hong Kong and elsewhere that each of the criteria pol-
lutants is likely to have at least some independent effect. The procedure which we used for summation has
face validity and has been peer reviewed (Hedley et al 2008). We have called it T1 in this report. As a sensitivity
analysis, we compared the results of T1 with the total cost based on a simple summation of the effects of all 4
pollutants (T2) i.e. a possible maximum effect. After using T2, the total cost for the burden of disease due to all 4
pollutants increased, as expected, from $1.8 billion for PRD, $1.1 billion for HK and $16 million for MSAR to $2.1
billion, $1.4 billion and $20 million respectively (Table 6.1).
6.2 Total cost based on other methods of adjusting the summation of the effect of all 4 criteria pollutants
To assess the impact of other methods of adjusting the summation, we compared the original estimate (T1) with the
total costs obtained by seven alternative adjusted summations using (i) SO2 as the dominant pollutant instead of PM
10
(T3), (ii) NO2 as the dominant pollutant (T4); (iii) the single pollutant with the greatest impact (excess risk * pollutant
reduction) (T5), (iv) PM10
plus O3 only (T6), (v) the single pollutant (among PM
10, SO
2 and NO
2) with the greatest impact
together with O3 (T7) and (vi) SO
2 alone (T8). The only one which made a lot of difference was T6 which reduced the
PRD costs to $0.9 billion, HK to $0.8 billion and MSAR to $10 million.
6.3 Direct and indirect health care cost based on different estimations of health care utilization andcosts data
Some of our estimates of health care utilization and costs in the PRD are inevitably uncertain. To assess the effects
of varying one parameter at a time, we performed sensitivity analyses by using different calculation methods for the
values of some selected parameters to examine the effect on the estimation of direct and indirect cost due to all 4
pollutants as shown in Tables 6.4 to 6.8. The selected parameters are:
(i) Total bed-days of private hospitals of 9 prefectures in PRD(Table 6.4)
(ii) Proportion of number of hospital inpatients of each disease of 9 prefectures in PRD(Table 6.5)
(iii) Average cost per bed-day in public hospital of 9 prefectures in PRD(Table 6.6)

25Report on Air Quality and the State of Public Health in Southern China
(iv) Average cost of an inpatient episode in Shenzhen (Table 6.7).
(v) Number of hospital inpatient episodes among the employed population in PRD (Table 6.8)
6.4 Total cost based on mean income and median income in HK and MSAR
In our main models for the nine prefectures in PRD, MSAR and HK, mean income was used to estimate the pro-
ductivity loss due to hospital episodes and premature deaths. Mean income was used in the models because
only mean income for the nine prefecture in PRD was available from the internet. The Census and Statistics
Department in HK and the Statistics and Census Service in MSAR reported median monthly employment earn-
ings only. We therefore calculated the mean income in HK and MSAR for consistency and comparison to 9
models for PRD. To see the effect on the total cost by changing from mean income to median income for both
the HK and MSAR models, a further sensitivity analysis is shown in Table 6.9.
7. Discussion
The emergence of China as the world’s factory for almost all popular consumer goods and domestic and commercial equip-
ment has been fuelled by very high consumption of fossil fuels which give rise to complex pollutant mixtures which cause
acute and long term injury to health. Although the consumption of energy in relation to GDP has fallen, and particularly
the consumption of coal which has been a principal source of particulates and SO2 during the past 25 years, oil consump-
tion has increased and China is still regarded as an inefficient energy intensive economy. Recognition of the external costs
should be a driver of policy directed at air quality controls and health protection. In 1997 the World Bank Report Clear Water,
Blue Skies estimated that the total external costs of air and water pollution amounted to 7.7% of China’s GDP.
Health gains from social and economic development will be compromised if population health is eroded by the
multisystem effects of a ubiquitous hazard such as high ambient air pollution levels. The reasons for urgent action
to achieve pollution abatement include the preservation of the aesthetic value of the environment, protection of
ecology, and most importantly protection of sensitive cell systems and tissues in the cardiovascular and pulmonary
organs, growth and development of the developing foetus.
The findings of this study are indicative of an iceberg of disease with very many residents of the region suffering
health detriment sufficient to make them consult a doctor, many having such serious conditions that they are admit-
ted as inpatients and of these, a large number dying prematurely. These estimates of doctor visits, hospital bed days
and deaths are important markers of pain, suffering and impaired loss of life. The monetary estimates which we have
made of the cost of the associated health care only represents a small part of the real cost of this health impairment.
This report has used a conservative approach to the estimation of excess community costs due to air pollution by
taking the WHO guideline/US EPA standard levels as reference values. In reality, the relationship between air pol-
lution and harm to health is a continuum, and there are no known thresholds for air pollutants below which zero
health effects occur. While this level of air pollution reduction will not avoid all costs of air pollution it would provide
a reasonable target to aim for in the short term. Furthermore, the monetary valuation of the costs has not included
the value of any intangible costs such as pain and suffering or value of lives lost. The estimation of productivity loss is
based only on years of life lost due to deaths resulting from high air pollution. It does not include the harm and result-
ing premature deaths incurred as a result of longer-term exposures such as those experienced by children growing
up in Hong Kong, Macao and the PRD in recent years.
There are a variety of methods to adjust the monetary value of health costs across the region to obtain parity for

26Report on Air Quality and the State of Public Health in Southern China
comparisons. We have chosen to use the ratio of per capita GDPs partly because of the easy availability of GDP esti-
mates for each area in which we were interested and because it represents well the difference between the relatively
wealthy areas of Hong Kong and Macao and the mainland prefectures.
The adjusted annual costs of air pollution per capita in the PRD are about a third higher than those in Hong Kong, while the
costs for Guangzhou are twice, and for Foshan are almost four times those in Hong Kong. This reflects the high air pollution
levels and risks to individuals in these prefectures, particularly from very high reported sulphur dioxide levels. This pollutant
has been found to be strongly associated with mortality and cardiovascular disease in previous studies, and causes a the heavy
burden of health care costs that these prefectures will continue to bear until air pollution levels are significantly reduced.
We believe that the application of Hong Kong risk estimates, which are comparable to those in other Chinese cities
obtained using exactly the same methodological protocol, is a valid and necessary approach to estimating the burden
of pollutant related disease in the PRD. To date, there is no specific information on the relationship of pollutant concen-
trations and health outcome in PRD. However, in a study with three Asian countries and Hong Kong, there appeared to
a positively linear dose-response relationship between all natural mortality and pollutants. Factors which will lead to
variations in the burden of disease and health costs in different prefectures include the absolute determinant of life-time
health experience and life expectancy.
The air pollution studies in HK from which the risk estimates are derived were based on analyses of millions
of hospital admissions and over one hundred thousand deaths. The findings are comparable to risk estimates
obtained by similar methodology in other geographic regions in Europe, Canada and the US. The main differ-
ence is that the excess risks per 10µg/m3 for gaseous pollutants, NO2 and SO
2, are larger in Hong Kong (and also
in Shanghai and Wuhan) than in the West. The opposite holds for PM effects. In this survey we have considered
carefully the validity of the analytical procedures we have used to study the PRD population. Population based
studies in Hong Kong over a twenty year period have examined the short and intermediate term impact of pol-
lution on the health and health care utilization of both children and adults. Time series studies based on Poisson
regression were used to examine the relationship between daily pollutant concentrations and health outcomes.
Four substantive studies determined the relative risks for primary care (doctor visits), secondary care (hospital
admissions) and mortality (all natural causes) and three of them are published in high quality international jour-
nals while the fourth is accessible from the HKEPD web site.
There are a number of limitations in this study due to lack of data. The main areas in which data is lacking, the assumptions
made to compensate for this lack and the subsequent implications of the estimates are described here.
1. Since the average pollution level in PRD was much higher than that in HK, we would expect their risk of illness
to be higher. This might affect the risk per unit of pollutant but we do not have data on this risk for PRD. We have
therefore applied the risk estimates derived from HK to the pollution levels in the PRD. The health costs due to air
pollution might therefore be underestimated if the risk per unit of pollutant in PRD is higher than in HK. Neverthe-
less, we assume that the mortality and morbidity coefficients from Hong Kong, as the only best available source in
Southern China, are applicable to the PRD and MSAR populations
2. Since we have had to estimate some components of the burden of illness and/or the related costs, the costs
reported here may not exactly correspond to the actual monetary costs for each of the prefectures if these could
be estimated. Also the amount of variation that would actually occur might be under-represented since we have
often assumed that estimated values were the same in each prefecture. However, they should give a reasonable
comparison of the relative costs where the main components which differ between prefectures are air pollution
levels and populations size.

27Report on Air Quality and the State of Public Health in Southern China
3. The length of stay in hospital for each illness episode was assumed to be the same in the other 8 prefectures
as it was in GZ. Actually, the population age distribution varies between prefectures as can be seen in Table 3.4
and HK data from the HA in 2002 (Hong Kong Hospital Authority, 2002) shows that older people tend to have a
longer mean LOS. Therefore, if the inpatient population reflects the population age proportions then for those
prefectures whose population is older than GZ we may have under-estimated the costs and for those whose
population is younger, we may have over-estimated the costs.
4. For previous valuations of productivity loss we have used median earnings which are lower than mean
earnings. However PRD only reports mean earnings and so, for comparability, we had to use the mean
for HK. This will make the HK estimate for productivity loss higher than previous estimates. We had to
estimate mean monthly employment earnings for HK since the Census and Statistics Department only
reports median monthly employment earnings. We did this by taking the mid point of each earning band
and multiplying by the number of people in each band and dividing the sum for all bands by the number
of employed people.
5. As shown in the validation section, where we were able to validate our estimates, we found that they all tended
to under-estimate the costs for PRD.
Some of the findings from the model are of interest and could be further validated. For example, the number
of episodes in a public or private hospital are expressed per 1 million population in Table 3.4. A comparison
of the utilisation pattern in the 9 prefectures with HK shows that HK public hospital utilisation is higher than
all the 9 prefectures except Zhongshan for respiratory diseases. HK private hospital utilisation is substantially
higher than the 9 prefectures being up to 4.6 times higher for cardiovascular diseases and 5.9 times higher for
respiratory diseases.
Private sector outpatient utilisation in HK was very much higher than that in the PRD whereas in the public sector, the
utilisation in the prefectures with real data was higher than HK. Therefore, people seem to use the public sector much
more than the private sector in the PRD.
Although the air pollution levels in Macau are as high as in Hong Kong, the utilization was relatively low resulting in low
monetary values for the health impacts. The population in Macau is a bit younger than the Hong Kong population but that
does not fully account for the difference. It is possible that some utilization data is not recorded, that there is a greater use of
Chinese medicine which we have not accounted for or that residents travel elsewhere for their health care.
The 14% increase of the total cost after using satellite inferred PM10
data was mainly due to the large increase
(>50%) in Shenzhen, Zhuhai, Jiangmen, and Zhongshan. We believe that the large difference is due to these four
monitoring stations being located in a relatively clean environment. Shenzhen station located inside a big park,
Zhuhai station located inside a University surrounded by clean environment, Jiangmen station located inside a
lake area, and Zhongshan station located inside an ecological park (Appendix 6). As a result, their recorded PM10
levels were lowered and hence may not reflect the exposure of the majority of the general population who live
in the urban area.
The proxy geographic locations are determined by map overlaying based on the PRDRAQmn annual report
2006. Although there may be errors in approximating the exact locations in this method, the AOD values of
the proxy locations appear to reflect a better estimate of PM10
level of the surrounding area of the monitoring
station. The large difference between the recorded levels and the inferred levels of PM10
indicates that these
monitors’ measurements might not adequately represent the nearby area. All of these real measurements

28Report on Air Quality and the State of Public Health in Southern China
show a large reduction from the inferred PM10
levels, indicating that these monitoring stations are likely to
greatly under-estimate the average air pollution level of the whole prefecture. Their representativeness is thus
in some doubt.
The estimates of costs here are conservative in that many health outcomes are not included. However although
under-estimation of health effects may arise because of incomplete epidemiological information and the use of short
term risk estimates from time series analyses compared with cohort studies, some over-estimation may occur through
double counting of outcomes by treating each of the criteria pollutants as independent risks.
In our sensitivity analyses there was little variation among all estimates based on different combinations of pollut-
ants. The combination of PM10
and O3, suggested by the WHO Working Group (2003), gave the lowest estimate for
deaths and overall costs but was likely to under-estimate the community burden (Hedley et al 2006). There are many
ways to estimate the costs of a pollutant mixture. Using just the effect of PM10
effect or PM10
+O3 is common (Wong
EY et al 2004, Medina S et al 2004, Ontario Medical Association 2005). However, local data is important in estimating
the avoidable health impacts and their costs, particularly data on the sources of pollutants, their composition and
the health effects. An intervention study demonstrated the benefits gained from reducing SO2 (Hedley et al 2002).
A series of Asian time series studies on air pollution also identified the importance of health effects due to gaseous
pollutants. Taking these gaseous pollutants into account is important in Asian countries. In this study we have not
considered the toxicity of different compositions of particles or effect modification such as by smoking. In general,
our approach is conservative.
The number of inpatient and outpatient episodes varied among prefectures. This may be a data problem or a
real difference due to accessibility of medical facilities in cities, or other socio-economic differences between 9
prefectures.
In this study, the direct medical costs and cost of lost productivity in Hong Kong were $0.8billion and $0.3billion
respectively, a total of $1.1 billion per year. This corresponds to our previous estimate based on visibility where the
benefits of achieving air pollutant levels equivalent to the better visibility were also around $1 billion. Although, we
consider that Hong Kong should aim for more stringent levels of pollutant control, equivalent in our previous study
of the good visibility levels, we acknowledge that this target may be less feasible for the PRD in the immediate future.
However, this should be the longer term goal and we should see the costs reported here as an interim estimate of the
benefits achievable by air pollution control.
Data limitations
The following are the main data limitations we encountered in the study:
• Lack of comprehensive data for the 9 prefectures in the PRD and what data is available tends to be publicly avail-
able on websites and accuracy and reliability are difficult to determine.
• Lack of any data for many of the prefectures except Guangzhou and Shenzhen. Thus many assumptions with no
validation had to be made.
• Daily air pollution data is not available. Therefore we could only apply the daily time-series coefficients to monthly
air pollution levels. On the other hand, there is no local data on long term health effects. As we know that risk
estimates from cohort study are larger than that from time-series, this is further evidence that our approach will
not over-estimate the costs.

29Report on Air Quality and the State of Public Health in Southern China
• Lack of pollutant data other than the criteria air pollutants. Metal species, VOCs, CO were not taken into account
yet in our estimation as these unmeasured are not available today yet. Nevertheless, this is still in line with our
approach – a conservative approach not to over-estimate.
• No data on health care utilization and costs in the private sectors except the number of inpatient and outpatient
episodes in Guangdong province. Our estimates of unit costs on private health care sector are based on the
public hospitals which may subject to some bias.
• No data on time-off work per outpatient visit in Guangdong province. Thus productivity losses due to air pollu-
tion were underestimated.
• Only median incomes for males and females are reported by the Census and Statistics Department in
Hong Kong, the mean annual incomes were therefore the best estimates based on our own calculation.
• Lack of precise data for health care utilization and costs. For example, the unit costs for different diseases catego-
ries, females and males, different types of hospitals and different age groups were assigned the same values.
• No data on the costs of self medication. Only the percentage of sick persons who self medicated in China was found,
but the mean costs of self medication could not be found. Thus the health care costs were underestimated.

30Report on Air Quality and the State of Public Health in Southern China
References
Air Science Group, Environmental Protection Department. (2006). Annual Air Quality Statistics 2006. (www.epd.gov.hk/epd/)
Census and Statistics Department. (1984-2005). Hong Kong Annual Digest of Hong Kong, 1984-2005. Hong Kong
Printer, Hong Kong Government of Special Administration Region.
Census and Statistics Department. (2007). Women and Men in Hong Kong Key Statistics. 2007 Edition. Hong Kong
Printer, Hong Kong Government of Special Administration Region.
Department of Health, Government of MSAR Special Administrative Region. Department of Health statistical year-
book. 二零零四年度統計資料. (www.ssm.gov.mo/design/statistic/c_statistic_fs.htm)
Environmental Protection Department. (2002). Environmental Hong Kong 2002. (www.epd.gov.hk/epd/english/
resources_pub/publications/pub_reports_ap.html)
Gauderman WJ, Vora H, McConnell R, Berhane K, Gilliland F, Thomas D, Lurmann F, Avol E, Kunzli N, Jerrett M, Peters
J. (2007). Effect of exposure to traffic on lung development from 10 to 18 years of age: a cohort study. Lancet.
2007 Feb 17;369:571-577.
Health and Welfare Bureau.(2000). Lifelong Investment in Health: Consultation Document on Health Care Reform.
Hong Kong: Government Printing. 2000
Hedley AJ, McGhee SM, Barron B, Chau P, Chau J, Thach TQ, Wong TW, Loh C, Wong CM. (2008) Air pollution: costs and
paths to a solution in hong kong. Understanding the connection between visibility, air pollution and health costs in
pursuit of accountability, environmental justice and health protection. Journal of Toxicology and Environmental
Health (in press). An earlier version is available at (website)
Hedley, A.J., Wong, C.M., Thach, T.Q., Ma, S.L.S., Lam, T.H., and Anderson, H.R. (2002). Cardiorespiratory and all-cause mor-
tality after restrictions on sulphur content of fuel in Hong Kong: an intervention study. Lancet 360: 1646-52.
Hong Kong Hospital Authority. (2001). Hospital Authority Annual Report 2000-2001. Hong Kong: Hong Kong Hospital
Authority. (www.ha.org.hk/hesd/nsapi/?MIval=ha_view_template&group=AHA&Area=ANR&Subj=R01&ustamp=2
006%2d05%2d18+15%3a41%3a16%2e893)
Hong Kong Hospital Authority. (2002). Hong Kong Hospital Authority Costing Exercise 2002. Personal communication
with Hospital Authority.
Institute for the Environment (IENV), the Hong Kong University of Science and Technology (HKUST). (2006). Satellite
Informatics System for Surface Particulate Matter Distribution. Monthly Average of SEC(Dry) on Year 2006. (envf.
ust.hk/itf-si/index.py). Accessed on 1st November 2007.
MSAR Air Quality Index website. (2008). (www.smg.gov.mo/ccaa/iqa/e_iqa.htm)
MSAR Government Tourist Office website. (2008). (www.MSARtourism.gov.mo/en/info/info.php)
31Report on Air Quality and the State of Public Health in Southern China
McGhee S.M., Bacon-Shone, J., Hung, J., Ma, S.K., Brudevold, C., and Hedley, A.J. (1998). Household Survey report 1998.
Report prepared for Harvard University. Department of Community Medicine and Social Sciences Research
Centre, The University of Hong Kong.
Mukerjee S, Shadwick DS, Smith LA, Somerville MC, Dean KE, Bowser JJ. (2001). Techniques to assess cross-border air
pollution and application to a US-Mexico border region. Sci Total Environ. 2001 Aug 10;276(1-3):205-24.
Mukerjee S. (2002). Communication strategy of transboundary air pollution findings in a US-Mexico Border XXI pro-
gram project. Environ Manage. 2002 Jan;29(1):34-56.
Smith LA, Mukerjee S, Monroy GJ, Keene FE. (2001). Preliminary assessments of spatial influences in the Ambos Nogales
region of the US-Mexican border. Sci Total Environ. 2001 Aug 10;276(1-3):83-92.
Statistics and Census Service (DSEC), Government of Macao Special Administrative Region website. (2008). 2007
Macao in figures. (www.dsec.gov.mo/e_index.html)
Statistics and Census Service (DSEC), Government of Macao Special Administrative Region. (2007a). Demographic
Statistics 2006.
Statistics and Census Service (DSEC), Government of Macao Special Administrative Region. (2005c). Demographic
Statistics 2004.
Statistics and Census Service (DSEC), Government of Macao Special Administrative Region. (2005b). Employment
survey 2004. (www.dsec.gov.mo/index.asp?src=/english/html/e_employment.html)
Statistics and Census Service (DSEC), Government of Macao Special Administrative Region. (2005a). Health statistics
2004. (www.dsec.gov.mo/index.asp?src=/english/html/e_social.html)
Statistics Bureau of Guangdong Province. (2005). Guangdong Statistical Yearbook 2005. Total wages and average
wage of staff and workers by city. (www.gdstats.gov.cn/tjkw/gdtjnj/2005/table/05/5_e.htm)
US EPA (2006). Air Quality Criteria for Ozone and Related Photochemical Oxidants. (EPA 600/R-05/004 aF) Vol I, Chapter 7.
Watson JG, Chow JC. (2001). Source characterization of major emission sources in the imperial and Mexicali Valleys
along the US/Mexico border. Sci Total Environ. 2001 Aug 10;276(1-3):33-47.
Wong CM, McGhee SM, Yeung RYT, Thach TQ, Wong TW, Hedley AJ. (2002). Short term health impact and costs due to
road traffic-related air pollution. Final Report submitted to Environmental Protection Department (Tender Ref.
AS 00-378). Hong Kong Air Pollution and Health Joint Research Group, 2002.
Wong TW, Wun YT, Yu TS, Tam W, Wong CM, Wong AHS. (2002). Air pollution and general practice consultations for
respiratory illnesses. Journal of Epidemiology and Community Health 2002;56:949-950
World Health Organization. (2006). Air quality guidelines global update 2005 : particulate matter, ozone, nitrogen
dioxide and sulfur dioxide. World Health Organization. Regional Office for Europe.

32Report on Air Quality and the State of Public Health in Southern China
Yahoo website. (2008). International currency exchange rates. (hk.finance.yahoo.com/currency/convert?from=HKD&to
=MOP&amt=1&t=5y)
中山市統計局. (2005a). 2005年中山市國民經濟和社會發展統計公報. (www.zsstats.gov.cn/data_stats/qtsj/2004.htm)
中山市統計局. (2005b). 中山市2005年全國1%人口抽樣調查主要數據公報. (www.zsstats.gov.cn/data_stats/qtsj/
rk01.htm?phpsessid=c2d678d9f4d9716c512f43e73207de5f )
中山市衛生局. (2004). 2004年度醫療機構接診病人與醫療費用公布表. (www.zsws.gov.cn/document.jsp?docid=1823)
中華人民公和國國家統計局. (2005). 中國統計年鑒2005. 各地區居民消費價格分類指數2004. (210.72.32.6/cgi-bin/
bigate.cgi/b/g/g/[email protected]/tjsj/ndsj/2005/indexch.htm)
佛山市統計局. (2005a). 2005年佛山市國民經濟和社會發展統計公報. (www.fstjj.gov.cn/fsjjout/Web/Article/2006/04/
07/1052585325C148914.aspx)
佛山市統計局. (2005b). 佛山市2005年全國1%人口抽樣調查主要數據公報. (www.fstjj.gov.cn/fstjjout/Web/Article/
2006/04/11/0948418593C149449.aspx)
佛山市衛生信息網. (2005). 2005年第一季度至第四季度佛山市71所醫療機構業務工作量和醫療費用情況. (www.
fshealth.gov.cn/)
廣州市統計局. (2005a). 2005年廣州市國民經濟和社會發展統計公報. (www.gzstats.gov.cn/TJGB/QSNDTJGB/
2006320102936.htm)
廣州市統計局. (2005b). 廣州市2005年全國1%人口抽樣調查主要數據公報. (www.gzstats.gov.cn/tjgb/glpcgb/
2006614093440.htm)
廣州市衛生局. (2004). 廣州市衛生統計年鑒 2004. 廣州市衛生局編, 廣東科技出版社 ISBN: 7-5359-4073-0
廣東統計信息網. (2005a). 2005年廣東市國民經濟和社會發展統計公報. (210.76.64.38/tjgb/t20060223_35213.htm)
廣東統計信息網. (2005b). 廣東省2005年全國1%人口抽樣調查主要數據公報(第一號)(210.76.64.38/tjgb/
t20060320_36168.)
廣東衛生信息網. (2003). 2003年廣東省醫療業務統計報告. 2003年各市政府辦非營利性綜合醫院人員工作效益
情况. (www.gdhealth.net.cn/newslist/newslooks.php?id=148)
惠州市統計局. (2005a). 2005年惠州市國民經濟和社會發展統計公報. (www.hzsin.gov.cn/ReadNews.asp?NewsID=1923)
惠州市統計局. (2005b). 惠州市2005年全國1%人口抽樣調查主要數據公報. (www.hzsin.gov.cn/ReadNews.
asp?NewsID=1932)
東莞市統計局. 2005年東莞市國民經濟和社會發展統計公報. (tjj.dg.gov.cn/website/web2/showArticle.jsp?ArticleID
=934&columnid=112&parentcolumnid=114)
江門市統計局. 2005年江門市國民經濟和社會發展統計公報. (tjj.jiangmen.gov.cn/tjgb/tjgb2005.htm)

33Report on Air Quality and the State of Public Health in Southern China
珠海市統計信息網. 2006年統計年鑒. 衛生事業情况. (www.stats-zh.gov.cn/o_tjsj/osj_tjnj/2006nj13310e92ac6867.htm)
珠海市統計局. (2005a). 2005年珠海市國民經濟和社會發展統計公報 (www.stats-zh.gov.cn/o_tjgb/tjgb/2005.htm)
珠海市統計局. (2005b). 珠海市2005年全國1%人口抽樣調查主要數據公報. (www.stats-zh.gov.cn/o_pcgb/pcgb/
bf1_0601.htm)
深圳市統計局. (2004). 2004年深圳市主要統計指標人均水平. (www.sztj.com/pub/sztjpublic/tjsj/tjnb/)
深圳市統計局. 深圳市2005年全國1%人口抽樣調查主要數據公報. (www.sztj.com/pub/sztjpublic/tjgb/pcgb/rkpcgb/
t20060518_6044.html)
肇慶市統計局. (2005a). 2005年肇慶市國民經濟和社會發展統計公報. (www.zhaoqing.gov.cn/zwgk/tjxx/tjxx_tjgb/
t20060412_52244.htm)
肇慶市統計局. (2005b). 肇慶市2005年全國1%人口抽樣調查主要數據公報 (www.zhaoqing.gov.cn/zwgk/tjxx/tjxx_
tjgb/t20060412_52245.htm)

34Tables

35Report on Air Quality and the State of Public Health in Southern China
Tabl
e 3.
2: P
aram
eter
list
for d
irect
and
indi
rect
hea
lth c
are
cost
in P
earl
Rive
r Del
ta (P
RD)
Pub
lic h
osp
ital
inp
atie
nts
GZ
SZZ
HFS
JMZQ
HZ
DG
ZS
1. C
ost
per
ep
iso
de
(a
) Mea
n L
OS
(day
s)
C
ardi
ovas
cula
r dis
ease
s16
.4Sa
me
as G
Z
Resp
irato
ry d
isea
ses
10.0
(b
) Ave
rag
e co
st/ b
ed-d
ay (R
MB
)80
4 58
9 60
2 52
7 64
3 44
5 60
2 5
26
463
2. N
o. o
f ep
iso
des
C
ardi
ovas
cula
r dis
ease
s 5
2,57
5 5
,952
9
,080
4
5,31
3 1
3,89
5 1
4,20
2 1
0,56
8 5
,838
2
1,97
5
Re
spira
tory
dis
ease
s 6
5,00
1 7
,360
1
1,22
8 5
6,03
4 1
7,18
2 1
7,56
2 1
3,06
8 7
,219
2
7,17
4
Pub
lic h
osp
ital
ou
tpat
ien
ts
1. A
vera
ge
cost
per
vis
it (R
MB
)13
6 12
6 11
6 7
6 9
3 73
1
22
70
67
2. N
o. o
f vis
its
C
ardi
ovas
cula
r dis
ease
s 3
,967
,038
3
00,5
12
156
,820
3
,248
,605
7
01,5
87
717
,093
5
33,6
07
294
,751
1
,303
,208
Re
spira
tory
dis
ease
s 4
,905
,612
3
71,6
11
193
,922
4
,017
,203
8
67,5
78
886
,753
6
59,8
55
364
,487
1
,611
,538
Priv
ate
ho
spit
al in
pat
ien
ts
1. C
ost
per
ep
iso
de
(a
) Mea
n L
OS
(day
s)
C
ardi
ovas
cula
r dis
ease
s16
.4Sa
me
as G
Z
Resp
irato
ry d
isea
ses
10.0
(b
) Ave
rag
e co
st/ b
ed-d
ay (R
MB
)80
.458
960
252
764
344
560
252
646
3
2. N
o. o
f ep
iso
des
C
ardi
ovas
cula
r dis
ease
s88
919
910
442
346
558
735
319
516
8
Re
spira
tory
dis
ease
s1,
099
246
128
523
575
437
241
208
Priv
ate
ho
spit
al o
utp
atie
nts
1. A
vera
ge
cost
per
vis
it (R
MB
)13
612
611
676
9373
122
7067
2. N
o. o
f vis
its
Re
spira
tory
dis
ease
s52
,758
11,8
106,
163
25,0
9527
,573
28,1
8220
,971
11,5
849,
973
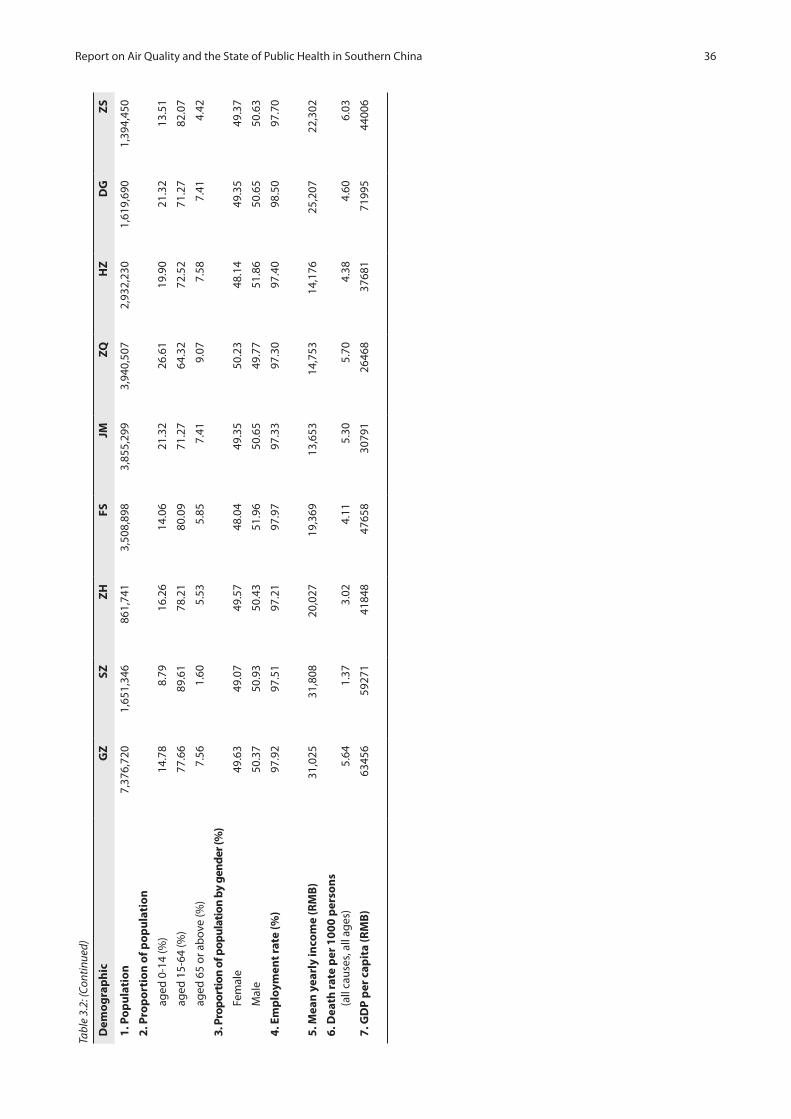
36Report on Air Quality and the State of Public Health in Southern China
Tabl
e 3.
2: (C
ontin
ued)
Dem
og
rap
hic
GZ
SZZ
HFS
JMZQ
HZ
DG
ZS
1. P
op
ula
tio
n 7
,376
,720
1
,651
,346
8
61,7
41
3,5
08,8
98
3,8
55,2
99
3,9
40,5
07
2,9
32,2
30
1,6
19,6
90
1,3
94,4
50
2. P
rop
ort
ion
of p
op
ula
tio
n
ag
ed 0
-14
(%)
14.7
88.
7916
.26
14.0
621
.32
26.6
119
.90
21.3
213
.51
ag
ed 1
5-64
(%)
77.6
689
.61
78.2
180
.09
71.2
764
.32
72.5
271
.27
82.0
7
ag
ed 6
5 or
ab
ove
(%)
7.56
1.60
5.53
5.85
7.41
9.07
7.58
7.41
4.42
3. P
ropo
rtio
n of
pop
ulat
ion
by g
ende
r (%
)
Fe
mal
e 49
.63
49.0
749
.57
48.0
449
.35
50.2
348
.14
49.3
549
.37
M
ale
50.3
750
.93
50.4
351
.96
50.6
549
.77
51.8
650
.65
50.6
3
4. E
mp
loym
ent r
ate
(%)
97.9
297
.51
97.2
197
.97
97.3
397
.30
97.4
098
.50
97.7
0
5. M
ean
yea
rly
inco
me
(RM
B)
31,
025
31,
808
20,0
27
19,3
69
13,
653
14,7
53
14,1
76
25,
207
22,
302
6. D
eath
rate
per
100
0 p
erso
ns
(a
ll ca
uses
, all
ages
)5.
641.
373.
024.
115.
30
5.70
4.
384.
60
6.03
7. G
DP
per
cap
ita
(RM
B)
6345
659
271
4184
847
658
3079
126
468
3768
171
995
4400
6

37Report on Air Quality and the State of Public Health in Southern China
Table 3.3: Parameter list for direct and indirect cost in MSAR (M)
Public hospital inpatients All ages Aged 15-64
1. Cost per episode
(a) Mean LOS (days)
Cardiovascular diseases
Female and male 5.27 —
Respiratory diseases
Female and male 8.24 —
(b) Average cost/ bed-day (HK$) 2,911 —
2. No. of episodes
Cardiovascular diseases
Female and male 572 —
Respiratory diseases
Female and male 839 —
Public hospital outpatients and other outpatients
1. Average cost per visit (HK$)
(a) S. Januario Hospital 366 —
(b) Public health care centres and other establishments providing health care 366 —
(c) Accident and Emergency in S. Januario Hospital 531 —
2. No. of visits
(a) S. Januario Hospital
Cardiovascular diseases 10,888 —
Respiratory diseases 4,623 —
(b) Public health care centres and other establishments providing health care
Cardiovascular diseases 148 —
Respiratory diseases 35 —
(c) Accident and Emergency in S. Januario Hospital
All reasons 154,622 —
Cardiovascular diseases 5,805 —
Respiratory diseases 8,515 —

38Report on Air Quality and the State of Public Health in Southern China
Private hospital inpatients All ages Aged 15-64
1. Cost per episode
(a) Mean LOS (days)
Cardiovascular diseases
Female and male 5.27 —
Respiratory diseases
Female and male 8.24 —
(b) Average cost/ bed-day (HK$) 2,911 —
2. No. of episodes
Cardiovascular diseases
Female and male 1,173 —
Respiratory diseases
Female and male 1,508 —
Private hospital outpatients and other outpatients
1. Average cost/ visit (HK$)
(a) Accident and Emergency in Kiang Wu Hospital 531 —
(b) Private clinics, centres for auxiliary diagnostic examinations and other establishments providing health care
152 —
2. No. of visits
(a) Accident and Emergency in Kiang Wu Hospital
All reasons 112,361 —
Cardiovascular diseases 4,218 —
Respiratory diseases 6,187 —
(b) Private clinics, centres for auxiliary diagnostic examinations and other establishments providing health care
Respiratory diseases 1,069 —
Table 3.3 (Continued)

39Report on Air Quality and the State of Public Health in Southern China
Demographic
1. Population 462,637 347,684
2. Employment rate (%)
Overall 95.1 —
Female 96.0 —
Male 94.4 —
3. Mean monthly income
Overall (MOP$) 7,605
Female (MOP$) 6,303 —
Male (MOP$) 8,779 —
Overall (HK$) 7,384
Female (HK$) 6,120
Male (HK$) 8,523
4. Median monthly income
Overall (MOP$) 5,167
Overall (HK$) 5,017
5. Labour force rate (%)
Overall — 62.0
Female — 56.4
Male — 68.2
6. Total person-years of life loss (Premature death for persons aged 15 to 64 who died before 65)
Female — 2,199
Male — 3,985
7. Death rate aged 15 to 64 (per 1000 population)
Female — 0.8439
Male — 1.8764
8. GDP per capita (MOP) 181,580 —
Note: “—“indicates no information obtained or used in the estimation
Table 3.3 (Continued)

40Report on Air Quality and the State of Public Health in Southern China
Table 3.4: Parameter list for direct and indirect cost in Hong Kong(HK)
Public hospital inpatients All ages Aged 15-64
1. Cost per episode
(a) Mean LOS (days)
Cardiovascular diseases
i. Acute General
Female 5.2 4.4
Male 5.1 3.9
ii. Chronic Infirmary
Female 19.7 22.4
Male 21.4 16.0
Respiratory diseases
i. Acute General
Female 5.6 4.3
Male 5.4 3.8
ii. Chronic Infirmary
Female 17.1 14.0
Male 16.1 9.6
(b) Average cost/ bed-day ($)
i. Acute General 2,911 —
ii. Chronic Infirmary 2,542 —
2. No. of episodes
Cardiovascular diseases
i. Acute General
Female 60,592 18,031
Male 62,908 25,341
ii. Chronic Infirmary
Female 7,003 903
Male 6,173 1,454
Respiratory diseases
i. Acute General
Female 43,595 12,481
Male 67,384 20,842
ii. Chronic Infirmary
Female 5,605 436
Male 10,612 1,529

41Report on Air Quality and the State of Public Health in Southern China
Table 3.4: (Continued)
Public hospital outpatients All ages Aged 15-64
1. Average cost per visit
(a) General Outpatient Clinic
i. Department of Health 204 —
ii. Hospital Authority 281 —
(b) Special Outpatient Clinic 613 —
(c) Accident and Emergency 531 —
2. No. of visits
(a) General Outpatient Clinic
Cardiovascular diseases
i. Department of Health 92,644 —
ii. Hospital Authority 712,632 —
Respiratory diseases
i. Department of Health 99,811 —
ii. Hospital Authority 767,762 —
(b) Special Outpatient Clinic
Cardiovascular diseases
i. Medicine 222,805 —
ii. Surgery 101,035 —
Respiratory diseases
i. Medicine 240,041 —
ii. Surgery 108,851 —
(c) Accident and Emergency
Cardiovascular diseases 276,593 —
Respiratory diseases 297,991 —
Private hospital inpatients All ages Aged 15-64
1. Total numbers of bed-days
Cardiovascular diseases 61,971 10,503
Respiratory diseases 59,828 15,061
2. Average cost/ bed-day ($) 2,911 —
Private General Practitioner Visit
1. Average cost/ visit ($) 152 —
2. No. of visits
Respiratory diseases 25,561,431 —

42Report on Air Quality and the State of Public Health in Southern China
Table 3.4: (Continued)
Demographic
1. Population 6,783,500 —
2. Employment rate (%)
Female 94.4 —
Male 92.2 —
3. Mean monthly income ($)
Female 12,751.58 —
Male 17,207.85 —
4. Labour force rate (%)
Female — 51.9
Male — 81.8
5. Total person-years of life loss (Premature death for persons aged 15 to 64 who died before 65)
Female — 40,665
Male — 75,028
6. Death rate aged 15 to 64 (per 1000 population)
Female — 0.9814
Male — 2.2614
7. Deflation rate (%)
Year 1999 4.0 —
Year 2000 3.8 —
Year 2001 1.6 —
Year 2002 3.0 —
Year 2003 2.6 —
Year 2004 0.4 —
8. GDP per capita 190,448 —
Note: “—“indicates no information obtained or used in the estimation

43Report on Air Quality and the State of Public Health in Southern China
Tabl
e 3.
5: P
aram
eter
list
for c
ompa
rison
bet
wee
n 9
pref
ectu
res i
n Pe
arl R
iver
Del
ta (P
RD) a
nd H
ong
Kong
(HK)
Dem
og
rap
hic
GZ
SZZ
HFS
JMZQ
HZ
DG
ZS
HK
1. P
op
ula
tio
n7,
376,
720
1,65
1,34
6 8
61,7
41
3,50
8,89
8 3,
855,
299
3,94
0,50
7 2,
932,
230
1,61
9,69
0 1,
394,
450
6,78
3,50
0
2. P
rop
ort
ion
of p
op
ula
tio
n
A
ged
0-14
(%)
14.7
88.
7916
.26
14.0
621
.32^
26.6
119
.90
21.3
2^13
.51
14.8
2
A
ged
15-6
4 (%
)77
.66
89.6
178
.21
80.0
971
.27^
64.3
272
.52
71.2
7^82
.07
73.1
1
A
ged
65 o
r ab
ove
(%)
7.56
1.60
5.53
5.85
7.41
^9.
077.
587.
41^
4.42
12.0
7
3. M
ean
yea
rly
inco
me
(RM
B /
HK
$) 3
1,02
5 3
1,80
8 20
,027
19
,369
1
3,65
3 14
,753
14
,176
2
5,20
7 2
2,30
2 F:
605
,943
M: 9
55,9
46
4. G
DP
per
cap
ita
(RM
B /
HK
$)63
,456
59,2
7141
,848
47,6
5830
,791
26,4
6837
,681
71,9
9544
,006
190,
448
Pub
lic h
osp
ital
inp
atie
nts
1. M
ean
LO
S (d
ays)
C
ardi
ovas
cula
r dis
ease
s16
.412
.9
Re
spira
tory
dis
ease
s10
.011
.1
2. A
vera
ge
cost
/ b
ed-d
ay (R
MB
/ H
K$)
804
589
602
527
643
445
602
526
46
3 A
cute
:2,9
11
CR:
2,5
42
3. N
o. o
f epi
sode
s@ (p
er 1
mill
ion
popu
lati
on)
C
ardi
ovas
cula
r dis
ease
s 7
,127
* 3
,604
+
10,
537#
12,
914#
3,6
04+
3,6
04+
3,6
04+
3,6
04+
15,
759#
20,1
48*
Re
spira
tory
dis
ease
s8,
812*
4,
457+
13
,030
# 1
5,96
9# 4,
457+
4,
457+
4,
457+
4,
457+
1
9,48
8#18
,751
*
4. N
o. o
f ep
iso
des
@ (w
ho
le p
op
ula
tio
n)
C
ardi
ovas
cula
r dis
ease
s52
,575
*26
,587
+5,
952+
9,08
0#
3,1
06+
45,3
13#
12,6
46+
13,8
95+
14,2
02+
10,5
68+
5,83
8+21
,975
#
5,02
6+20
,148
*
Re
spira
tory
dis
ease
s65
,001
*32
,877
+7,
360+
11,2
28#
3,84
1+
56,0
34#
15,6
39+
17,1
82+
17,5
62+
13,0
68+
7,21
9+27
,174
#
6,21
5+18
,751
*

44Report on Air Quality and the State of Public Health in Southern China
Tabl
e 3.
5: (c
ontin
ued)
Pub
lic h
osp
ital
ou
tpat
ien
tsG
ZSZ
ZH
FSJM
ZQH
ZD
GZ
SH
K
1. A
vera
ge
cost
per
vis
it (R
MB
/ H
K$)
136
126
116
76
93
73
122
70
67
G
OPC
: 243
SO
PC: 6
13
A&
E: 5
31
2. N
o. o
f vis
its@
(per
1 m
illio
n p
op
ula
tio
n)
C
ardi
ovas
cula
r dis
ease
s53
7,77
8# 1
81,9
80+
181
,980
+
925
,819
# 1
81,9
80+
181
,980
+
181
,980
+
181
,980
+
934,
568#
207,
225*
Re
spira
tory
dis
ease
s66
5,01
3# 2
25,0
35+
225
,035
+
1,14
4,86
2# 2
25,0
35+
225
,035
+
225
,035
+
225
,035
+
665,
013#
223,
256*
Priv
ate
ho
spit
al in
pat
ien
ts
1. T
ota
l no.
of b
ed-d
ays
@
(per
1 m
illio
n p
op
ula
tio
n)
C
ardi
ovas
cula
r dis
ease
s1,
976
9,13
5*
Re
spira
tory
dis
ease
s1,
490
8,82
0*
Priv
ate
ho
spit
al o
utp
atie
nts
1. N
o. o
f vis
its@
(per
1 m
illio
n p
op
ula
tio
n)
Re
spira
tory
dis
ease
s5,
784
3,76
8,17
7
An
nu
al a
vera
ge
air
po
lluta
nt c
on
cen
trat
ion
(µ
g/m
3 )
1. P
M10
8960
4111
570
7910
394
4155
2. N
O2
4961
4079
3750
3456
5057
3. S
O2
7327
5110
837
6721
7459
23
4. O
345
3948
3837
4754
5445
32
^ in
dica
tes
no d
ata
avai
lab
le a
nd G
uang
dong
dat
a w
as u
sed
inst
ead
* th
e no
. of e
pis
odes
/vis
its a
re re
al d
ata
# th
e no
. of e
pis
odes
/vis
its fo
r all
dise
ases
wer
e ob
tain
ed a
nd th
e no
. of e
pis
ode/
visi
ts fo
r eac
h di
seas
e w
ere
estim
ated
by
the
pro
por
tion
of e
ach
dise
ase
in G
Z+
the
no. o
f ep
isod
es/v
isits
for a
ll di
seas
es w
ere
estim
ated
by
GD
num
ber
of e
pis
odes
for a
ll di
seas
es a
djus
ted
by p
opul
atio
n si
ze in
eac
h p
refe
ctur
e an
d th
e p
rop
ortio
n of
eac
h di
seas
e in
GZ
@ ne
wly
add
ed p
aram
eter
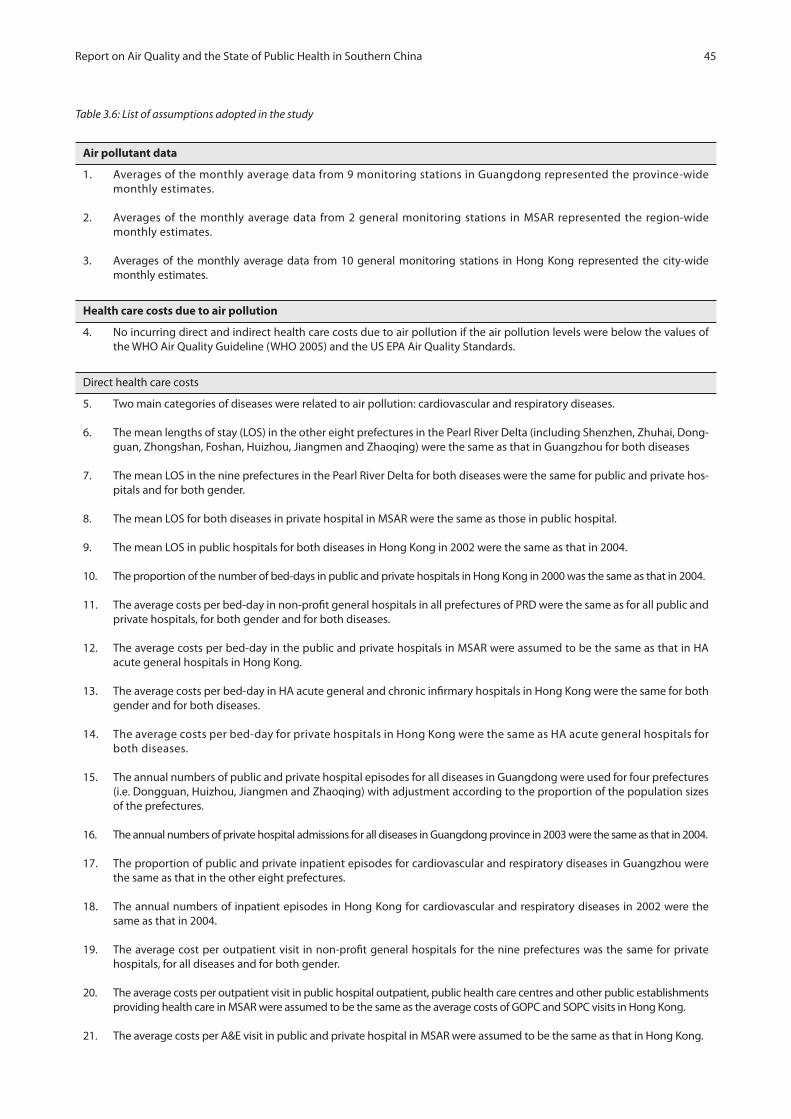
45Report on Air Quality and the State of Public Health in Southern China
Table 3.6: List of assumptions adopted in the study
Air pollutant data
1. Averages of the monthly average data from 9 monitoring stations in Guangdong represented the province-wide monthly estimates.
2. Averages of the monthly average data from 2 general monitoring stations in MSAR represented the region-wide monthly estimates.
3. Averages of the monthly average data from 10 general monitoring stations in Hong Kong represented the city-wide monthly estimates.
Health care costs due to air pollution
4. No incurring direct and indirect health care costs due to air pollution if the air pollution levels were below the values of the WHO Air Quality Guideline (WHO 2005) and the US EPA Air Quality Standards.
Direct health care costs
5. Two main categories of diseases were related to air pollution: cardiovascular and respiratory diseases.
6. The mean lengths of stay (LOS) in the other eight prefectures in the Pearl River Delta (including Shenzhen, Zhuhai, Dong-guan, Zhongshan, Foshan, Huizhou, Jiangmen and Zhaoqing) were the same as that in Guangzhou for both diseases
7. The mean LOS in the nine prefectures in the Pearl River Delta for both diseases were the same for public and private hos-pitals and for both gender.
8. The mean LOS for both diseases in private hospital in MSAR were the same as those in public hospital.
9. The mean LOS in public hospitals for both diseases in Hong Kong in 2002 were the same as that in 2004.
10. The proportion of the number of bed-days in public and private hospitals in Hong Kong in 2000 was the same as that in 2004.
11. The average costs per bed-day in non-profit general hospitals in all prefectures of PRD were the same as for all public andprivate hospitals, for both gender and for both diseases.
12. The average costs per bed-day in the public and private hospitals in MSAR were assumed to be the same as that in HA acute general hospitals in Hong Kong.
13. The average costs per bed-day in HA acute general and chronic infirmary hospitals in Hong Kong were the same for bothgender and for both diseases.
14. The average costs per bed-day for private hospitals in Hong Kong were the same as HA acute general hospitals for both diseases.
15. The annual numbers of public and private hospital episodes for all diseases in Guangdong were used for four prefectures (i.e. Dongguan, Huizhou, Jiangmen and Zhaoqing) with adjustment according to the proportion of the population sizes of the prefectures.
16. The annual numbers of private hospital admissions for all diseases in Guangdong province in 2003 were the same as that in 2004.
17. The proportion of public and private inpatient episodes for cardiovascular and respiratory diseases in Guangzhou were the same as that in the other eight prefectures.
18. The annual numbers of inpatient episodes in Hong Kong for cardiovascular and respiratory diseases in 2002 were the same as that in 2004.
19. The average cost per outpatient visit in non-profit general hospitals for the nine prefectures was the same for privatehospitals, for all diseases and for both gender.
20. The average costs per outpatient visit in public hospital outpatient, public health care centres and other public establishments providing health care in MSAR were assumed to be the same as the average costs of GOPC and SOPC visits in Hong Kong.
21. The average costs per A&E visit in public and private hospital in MSAR were assumed to be the same as that in Hong Kong.

46Report on Air Quality and the State of Public Health in Southern China
22. The average costs per outpatient visit in private clinics, private centres for auxiliary diagnostic examinations and other private establishments providing health care in MSAR were assumed to be the same as the cost of a private general prac-titioner (GP) visit in Hong Kong.
23. The average costs per visit in GOPC, SOPC, A&E and private GP in Hong Kong were the same for all diseases and for both gender.
24. The annual numbers of public hospital outpatient visits for all diseases in Guangdong were used for six prefectures (i.e. Shenzhen, Zhuhai, Dongguan, Huizhou, Jiangmen and Zhaoqing) with adjustment according to the proportion of the population sizes of the prefectures.
25. The proportions of the number of public hospital outpatient visits due to cardiovascular and respiratory diseases in the nine prefectures were the same as those for the number of public hospital inpatient episodes in Guangzhou.
26. The annual numbers of private hospital outpatient visits for all diseases in Guangdong province in 2003 were the same as that in 2004.
27. The annual numbers of private hospital outpatient visits for all diseases in Guangdong were used for nine prefectures with adjustment according to the proportion of the population sizes of the prefectures.
28. The proportions of the number of private hospital outpatient visits due to respiratory diseases in the nine prefectures were assumed to be the same as those for the number of public hospital inpatient episodes in Guangzhou.
29. The annual numbers of outpatient visits in public health care centres and other establishments providing health care in MSAR for the two diseases were estimated by the total numbers of outpatient visits adjusted by the proportion of primary health care establishments which were in the public sector.
30. The proportions of A&E visits due to cardiovascular and respiratory diseases in public and private hospitals in MSAR were the same as the public inpatient admissions.
31. The annual number of outpatient visits in private clinics, centres for auxiliary diagnostic examinations and other estab-lishments providing health care in MSAR for the respiratory diseases was estimated by the total number of outpatient visits adjusted by the proportion of primary health care establishments which were in the private sector.
32. The proportions of GOPC, SOPC and A&E visits due to cardiovascular and respiratory diseases in Hong Kong were the same as the public inpatient admissions.
33. Costs of outpatient visits due to cardiovascular diseases were included only for attendances to public hospital outpatients (PRD), public hospital outpatients and other public outpatient clinics (MSAR) and public outpatient clinics (HK). No such costs were assumed to have incurred for visits to private hospital outpatient (PRD), private outpatient clinics except A&E visit in Kiang Wu Hospital (MSAR) and private general practitioners (HK).
34. Excess risks for private GP visits in Hong Kong were applied also to public outpatient visits in Hong Kong and to public and private outpatient visits in PRD and MSAR.
Indirect health care costs (productivity losses)
34. The proportions of the population who aged 15 to 64 in the nine prefectures were the labour force population for the nine prefectures.
35. The proportions of the population who aged 15 to 64 by gender in Dongguan and Jiangmen were the same as that in Guangdong province.
36. The registered urban unemployment rates in the nine prefectures were the same as the real unemployment rates.
37. In estimating the mean monthly income for employed persons in MSAR, those employed persons with unknown monthly earnings were assumed to earn the overall median monthly income of employed population.
38. The annual numbers of public and private hospital episodes for the two main diseases for those aged 15 to 64 in MSAR were estimated by applying the proportion of all discharge episodes in S. Januario Hospital aged 15 to 64 to the total annual numbers of episodes.
39. Productivity losses due to premature deaths were incurred only for the labour force population (aged 15-64) who died before 65 in 2004.

47Report on Air Quality and the State of Public Health in Southern China
40. In estimating the number of premature deaths, the death rates of the nine prefectures were the same as that in Hong Kong. The average person-years of life lost (PYLL) per death of the nine prefectures was also the same as in Hong Kong.
41. In estimating the PYLL for each death in MSAR, deaths were assumed to have incurred in the middle of the age range at deaths (i.e. 27 for the range 15 to 39 years and 52 for 40 to 64 years). Person-years of life lost were calculated by subtract-ing these approximated age at death from 65 for these premature deaths.
42. The death pattern (age structure of all deaths) in Hong Kong in 2002 was the same as that in 2004.
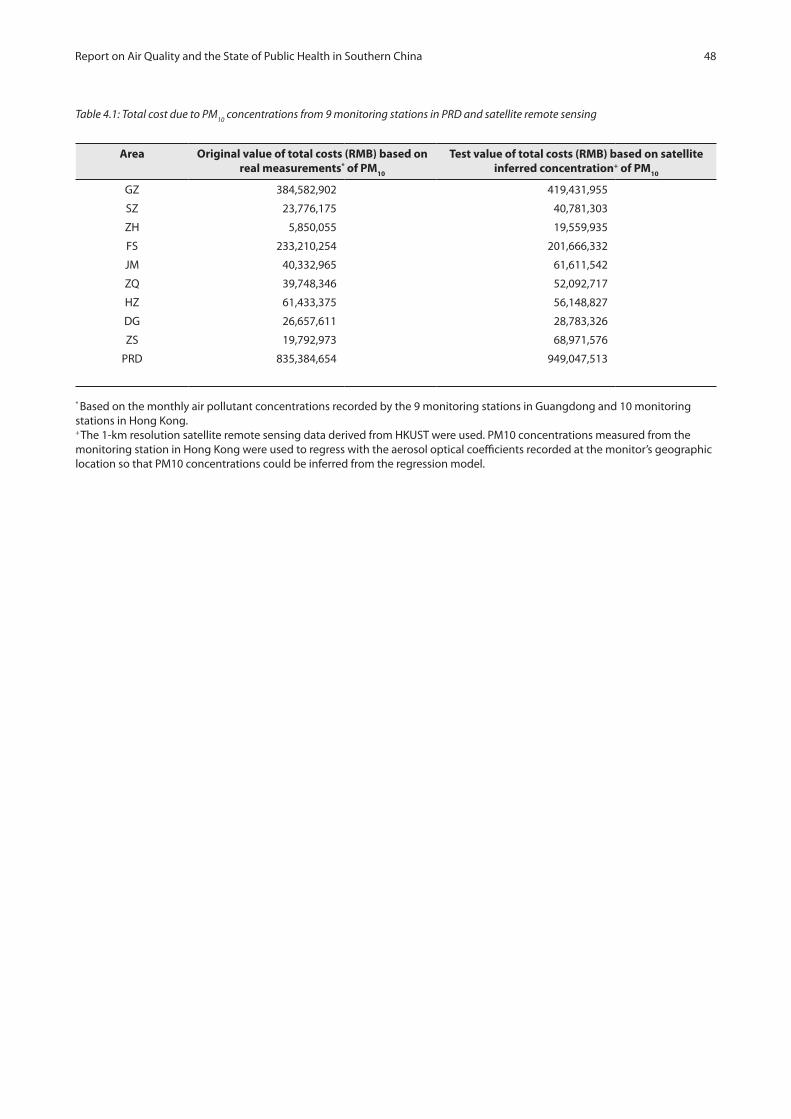
48Report on Air Quality and the State of Public Health in Southern China
Table 4.1: Total cost due to PM10
concentrations from 9 monitoring stations in PRD and satellite remote sensing
Area Original value of total costs (RMB) based on real measurements* of PM10
Test value of total costs (RMB) based on satellite inferred concentration+ of PM10
GZ 384,582,902 419,431,955
SZ 23,776,175 40,781,303
ZH 5,850,055 19,559,935
FS 233,210,254 201,666,332
JM 40,332,965 61,611,542
ZQ 39,748,346 52,092,717
HZ 61,433,375 56,148,827
DG 26,657,611 28,783,326
ZS 19,792,973 68,971,576
PRD 835,384,654 949,047,513
* Based on the monthly air pollutant concentrations recorded by the 9 monitoring stations in Guangdong and 10 monitoring stations in Hong Kong.+ The 1-km resolution satellite remote sensing data derived from HKUST were used. PM10 concentrations measured from the monitoring station in Hong Kong were used to regress with the aerosol optical coefficients recorded at the monitor’s geographiclocation so that PM10 concentrations could be inferred from the regression model.

49Report on Air Quality and the State of Public Health in Southern China
Tabl
e 5.
1: E
stim
ated
att
ribut
able
dea
ths,
hos
pita
l bed
day
s and
out
patie
nt v
isits
in P
RD a
nd M
SAR
for 2
006
pollu
tion
leve
ls
PR
DW
ho
leM
SAR
GZ
SZZ
HFS
JMZQ
HZ
DG
ZS
PR
D
1. D
eath
s
Ann
ual d
eath
s (a
ll ca
uses
, all
ages
)41
,605
2,26
22,
602
14,4
2220
,433
22,4
6112
,843
7,45
18,
409
132,
488
1,53
3
A
ttrib
uted
to P
M10
689
2213
329
245
318
256
132
422,
046
20
A
ttrib
uted
to N
O2
240
300
360
014
40
7654
904
3
A
ttrib
uted
to S
O2
2,99
922
110
1,72
647
21,
436
1754
344
67,
771
7
A
ttrib
uted
to O
30
00
00
00
00
00
A
ttrib
uted
to a
ll 4
pollu
tant
s3,
306
5210
51,
926
642
1,58
327
162
043
98,
944
27
2. B
ed-d
ays
in h
osp
ital
Ann
ual b
ed d
ays f
or c
ardi
ovas
cula
r dis
ease
876,
810
100,
876
150,
618
750,
070
235,
504
240,
703
179,
104
98,9
4136
3,14
52,
995,
771
9,19
6
A
ttrib
uted
to P
M1
22,3
851,
493
1,17
026
,365
4,35
75,
255
5,50
02,
709
2,82
272
,056
181
A
ttrib
uted
to N
O2
5,76
11,
546
021
,355
01,
757
01,
156
2,65
134
,226
22
A
ttrib
uted
to S
O2
50,1
8976
35,
043
71,2
874,
324
12,2
1819
35,
723
15,2
9616
5,03
633
A
ttrib
uted
to O
31,
052
028
90
040
460
234
443
63,
127
0
A
ttrib
uted
to a
ll 4
pollu
tant
s67
,957
2,76
85,
695
95,0
017,
989
16,6
436,
265
8,33
417
,193
227,
845
217
Ann
ual b
ed d
ays f
or re
spira
tory
dis
ease
661,
000
76,0
6011
3,56
056
5,57
017
7,57
018
1,49
013
5,05
074
,600
273,
820
2,25
8,72
019
,339
A
ttrib
uted
to P
M10
16,8
751,
126
882
19,8
803,
285
3,96
24,
147
2,04
32,
128
54,3
2838
0
A
ttrib
uted
to N
O2
4,34
31,
166
016
,102
01,
325
087
21,
999
25,8
0746
A
ttrib
uted
to S
O2
37,8
3657
53,
802
53,7
523,
260
9,21
214
64,
315
11,5
3312
4,43
169
A
ttrib
uted
to O
379
30
218
00
305
454
259
329
2,35
80
A
ttrib
uted
to a
ll 4
pollu
tant
s51
,231
2,08
74,
294
71,6
336,
024
12,5
484,
724
6,28
412
,964
171,
789
456
Att
ribut
able
bed
day
s11
9,18
84,
854
9,98
916
6,63
414
,012
29,1
9110
,988
14,6
1830
,156
399,
630
673

50Report on Air Quality and the State of Public Health in Southern China
PR
DW
ho
leM
SAR
GZ
SZZ
HFS
JMZQ
HZ
DG
ZS
PR
D
3. O
utp
atie
nt v
isit
s
Ann
ual o
utp
atie
nt v
isits
for
card
iova
scul
ar d
isea
se3,
967,
038
300,
512
156,
820
3,24
8,60
570
1,58
771
7,09
353
3,60
729
4,75
11,
303,
208
11,2
23,2
2121
,059
A
ttrib
uted
to P
M10
897,
820
39,4
2710
,802
1,01
2,26
511
5,06
013
8,77
214
5,26
971
,542
89,7
652,
520,
722
3,66
5
A
ttrib
uted
to N
O2
122,
105
21,5
830
433,
299
024
,525
016
,139
44,5
7066
2,22
123
3
A
ttrib
uted
to S
O2
142,
972
1,43
03,
306
194,
397
8,11
022
,918
363
10,7
3534
,561
418,
792
47
A
ttrib
uted
to O
329
,753
01,
882
00
7,52
911
,206
6,39
79,
774
66,5
410
A
ttrib
uted
to a
ll 4
pollu
tant
s1,
097,
733
49,4
7815
,460
1,35
3,21
112
1,87
317
5,60
815
6,78
093
,574
146,
844
3,21
0,56
13,
800
Ann
ual o
utp
atie
nt v
isits
for
resp
irato
ry d
isea
se4,
958,
370
383,
421
200,
085
4,04
2,29
889
5,15
191
4,93
568
0,82
637
6,07
11,
621,
511
14,0
72,6
6820
,429
A
ttrib
uted
to P
M10
1,12
2,17
850
,305
13,7
821,
259,
580
146,
805
177,
058
185,
348
91,2
8011
1,69
03,
158,
026
3,55
5
A
ttrib
uted
to N
O2
152,
619
27,5
370
539,
162
031
,291
020
,592
55,4
5682
6,65
722
6
A
ttrib
uted
to S
O2
178,
700
1,82
54,
218
241,
891
10,3
4829
,241
463
13,6
9743
,002
523,
385
46
A
ttrib
uted
to O
337
,188
02,
401
00
9,60
714
,297
8,16
212
,161
83,8
160
A
ttrib
uted
to a
ll 4
pollu
tant
s1,
372,
047
63,1
2819
,726
1,68
3,82
515
5,49
722
4,05
720
0,03
411
9,39
018
2,71
04,
020,
414
3,68
6
Att
ribut
able
out
patie
nt v
isits
2,46
9,78
011
2,60
635
,186
3,03
7,03
627
7,37
039
9,66
535
6,81
421
2,96
332
9,55
47,
230,
974
7,48
6
Sour
ce: M
ISSI
NG
Tabl
e 5.
1 (c
ontin
ued)

51Report on Air Quality and the State of Public Health in Southern China
Table 5.2: Estimated attributable deaths, hospital bed days and outpatient visits in Hong Kong, three estimates
Current analysis Previous estimate based on visibility6
Average to Better visibility
Average to Good visibility
Year 2006 pollutant data
Year 2004 pollutant data
1. Deaths
Annual deaths (non-accidental causes, all ages) 34,619 31,872 31,872
Attributed to PM10
290 281 348
Attributed to NO2
371 545 860
Attributed to SO2
126 127 752
Attributed to O3
na 0 0
Attributed to all 4 pollutants 548 769 1,583
2. Bed days in hospital
Annual bed days for cardiovascular disease 968,301 507,404 507,404
Attributed to PM10
12,492 6,892 8,551
Attributed to NO2
11,850 9,902 15,609
Attributed to SO2
2,797 1,602 9,505
Attributed to O3
0 2,489 4,027
Attributed to all 4 pollutants 19,701 16,758 30,686
Annual bed days for respiratory disease 934,808 546,955 546,955
Attributed to PM10
12,060 10,040 12,456
Attributed to NO2
11,440 7,895 12,447
Attributed to SO2
2,701 1,215 7,210
Attributed to O3
0 6,148 9,948
Attributed to all 4 pollutants 19,019 19,568 33,521
Attributable bed days 38,720 36,326 64,207
3. Outpatient visits
Annual outpatient visits for cardiovascular disease
1,405,709 1,105,440 1,105,440
Attributed to PM10
160,769 83,054 103,040
Attributed to NO2
80,593 67,369 106,204
Attributed to SO2
2,557 2,745 16,289
Attributed to O3
0 21,822 35,311
Attributed to all 4 pollutants 195,960 129,426 201,082
Annual outpatient visits for respiratory disease 27,075,887 26,590,693 26,590,693
Attributed to PM10
3,096,635 3,138,011 3,893,135
Attributed to NO2
1,552,328 2,382,818 3,756,402
Attributed to SO2
49,251 52,996 314,498
Attributed to O3
0 802,986 1,299,336
Attributed to all 4 pollutants 3,774,461 4,668,001 7,080,920
Attributable outpatient visits 3,970,421 4,797,427 7,282,002

52Report on Air Quality and the State of Public Health in Southern China
5.3
: Ann
ual d
irect
, ind
irect
and
tota
l hea
lth ca
re co
sts f
or A
ir Po
llutio
n in
the
PRD
, Mac
ao a
nd H
ong
Kong
bas
ed o
n di
ffere
nces
betw
een
aver
age
2006
and
WH
Ogu
idel
ines
/US
EPA
stan
dard
airp
ollu
tant
leve
ls
PR
D (R
MB
)H
K$
GZ
SZZ
HFS
JMZQ
HZ
DG
ZS
PR
D s
um
PR
D a
vera
ge
Mac
aoH
on
g K
on
g
1. D
irec
t hea
lth
car
e co
st p
er y
ear
du
e to
air
po
lluti
on
PM10
312,
822,
039
13,0
71,3
984,
207,
688
201,
826,
066
29,7
38,4
87
27,4
06,4
64
47,0
92,9
99
14,2
73,5
41
16,4
73,7
13
666
,912
,396
74
,101
,377
5,
329,
038
658
,933
,852
NO
267
,668
,455
7,43
6,11
22,
611,
099
92,1
09,2
61
2,48
4,17
6 5,
531,
644
104,
930
3,5
88,0
10
11,
971,
007
193
,504
,695
21
,500
,522
1,
237,
642
352
,862
,905
SO2
105,
985,
112
1,28
1,58
2 5,
729,
644
91,0
28,9
07
6,57
5,55
2 1
1,97
1,48
3 9
29,3
62
6,31
3,16
9 16
,199
,963
24
6,01
4,77
3 2
7,33
4,97
5 86
7,72
7 2
3,63
6,01
0
O3
19,2
03,0
431,
332,
879
1,6
20,1
61
4,47
2,40
9 1,
657,
237
2,3
12,3
50
4,14
9,74
0 1,
533,
506
3,44
8,94
2 39
,730
,267
4
,414
,474
24
1,14
9 1
5,32
2,53
2
Tota
l 4
pol
luta
nts#
448,
796,
644
18,5
29,6
1211
,711
,301
32
0,52
7,55
3 37
,937
,700
4
2,04
2,83
4 52
,066
,424
22
,581
,193
38
,438
,738
99
2,63
1,99
7 11
0,29
2,44
4 6,
806,
511
838
,784
,424
Ad
just
ed†
1,34
6,95
5,73
6 59
,538
,855
53
,297
,501
1,
280,
872,
706
234,
651,
655
302,
515,
247
263,
155,
071
59,7
33,9
12
166,
354,
150
3,76
7,07
4,83
3 41
8,56
3,87
0 7,
353,
095
838
,784
,424
2. In
dir
ect h
ealt
h c
are
cost
per
yea
r d
ue
to a
ir p
ollu
tio
n
PM10
71,7
60,8
6210
,704
,776
1,64
2,36
631
,384
,188
10,5
94,4
7712
,341
,881
14,3
40,3
7612
,384
,070
3,31
9,26
016
8,47
2,25
818
,719
,140
4,51
3,33
113
4,58
8,14
4
NO
237
,013
,123
14,5
25,7
992,
203,
171
33,3
87,3
912,
063,
067
5,85
2,57
376
,012
7,21
8,76
65,
529,
159
107,
869,
061
11,9
85,4
512,
425,
504
174,
624,
362
SO2
304,
154,
674
12,2
48,8
5013
,964
,079
157,
947,
326
22,3
30,8
0354
,860
,746
3,21
8,00
950
,073
,298
32,8
73,8
5865
1,67
1,64
472
,407
,960
4,90
0,56
161
,327
,567
O3
312,
269
39,8
1154
,846
83,4
9320
,670
37,2
0645
,574
46,1
3099
,011
739,
011
82,1
123,
949
65,8
60
Tota
l 4
pol
luta
nts
342,
738,
438
26,9
89,1
9914
,330
,339
177,
832,
265
30,2
18,8
7960
,861
,669
17,1
20,2
4257
,451
,464
33,2
99,2
6876
0,84
1,76
484
,537
,974
9,62
8,20
725
7,76
5,14
8
Ad
just
ed†
1,02
8,64
7,41
186
,720
,976
65,2
16,6
0371
0,64
2,47
818
6,90
9,32
943
7,92
4,40
586
,529
,443
151,
976,
060
144,
111,
687
2,89
8678
392
322,
075,
377
10,4
01,3
8225
7,76
5,14
8
3. T
ota
l hea
lth
car
e co
st p
er y
ear
du
e to
air
po
lluti
on
PM10
384,
582,
902
23,7
76,1
755,
850,
055
233,
210,
254
40,3
32,9
65
39,
748,
346
61,4
33,3
75
26,6
57,6
11
19,7
92,9
73
835,
384,
654
92,8
20,5
17
9,84
2,36
8 79
3,52
1,99
6
NO
210
4,68
1,57
921
,961
,911
4,81
4,27
012
5,49
6,65
1 4,
547,
243
11,
384,
217
180
,942
1
0,80
6,77
6 1
7,50
0,16
6 3
01,3
73,7
55
33,
485,
973
3,66
3,14
6 52
7,48
7,26
7
SO2
410,
139,
786
13,5
30,4
3119
,693
,723
248,
976,
233
28,9
06,3
55
66,8
32,2
29
4,14
7,37
1 56
,386
,467
49
,073
,822
89
7,68
6,41
7 99
,742
,935
5,
768,
288
84,9
63,5
77
O3
19,5
15,3
121,
372,
690
1,67
5,00
74,
555,
902
1,67
7,90
7 2,
349,
556
4,19
5,31
4 1,
579,
636
3,54
7,95
3 40
,469
,277
4,
496,
586
245,
098
15,3
88,3
92
Tota
l 4
pol
luta
nts
791,
535,
082
45,5
18,8
1126
,041
,640
498,
359,
818
68,1
56,5
79
102,
904,
503
69,1
86,6
66
80,0
32,6
57
71,7
38,0
05
1,75
3,47
3,76
1 19
4,83
0,41
8 16
,434
,718
1,
096,
549,
572
Ad
just
ed†
2,37
5,60
3,14
7 14
6,25
9,83
1 11
8,51
4,10
4 1,
991,
515,
184
421,
560,
983
740,
439,
653
349,
684,
514
211,
709,
972
310,
465,
837
6,66
5,75
3,22
5 74
0,63
9,24
7 17
,754
,477
1,
096,
549,
572
† D
irect
cos
t adj
uste
d by
ratio
of G
DPs
# Th
e su
mm
atio
n al
low
ed fo
r cor
rela
tion
bet
wee
n th
e p
ollu
tant
sv
Sour
ce: H
KU D
epar
tmen
t of C
omm
unit
y M
edic
ine
v.
The
tota
l for
all
4 p
ollu
tant
s w
as c
alcu
late
d by
the
adju
sted
sum
mat
ion
(T1)
met
hod
outl
ined
in th
e fu
ll H
KU re
por
t.

53Report on Air Quality and the State of Public Health in Southern China
Tabl
e 5.
4: C
osts
per
one
mill
ion
popu
latio
n fo
r air
pollu
tion
in th
e PR
D, M
acao
, and
Hon
g Ko
ng b
ased
on
diffe
renc
esbe
twee
nav
erag
e20
06an
dW
HO
guid
elin
es/U
SEP
Ast
anda
rdai
rpol
luta
ntle
vels
PR
D (R
MB
)H
K$
GZ
SZZ
HFS
JMZQ
HZ
DG
ZS
PR
D s
um
*P
RD
av
erag
eM
acao
Ho
ng
Ko
ng
1. D
irec
t hea
lth
car
e co
st p
er y
ear
du
e to
air
po
lluti
on
PM10
42,
932,
067
7,91
5,60
2 4
,882
,744
5
7,51
8,36
2 7
,713
,666
6
,955
,060
1
6,06
0,47
2 8
,812
,514
1
1,81
3,77
1 1
64,6
04,2
60
18,
289,
362
11,
518,
832
97,
137,
739
NO
2 9
,330
,714
4
,503
,061
3
,029
,995
2
6,25
0,19
6 6
44,3
54
1,4
03,7
90
35,
785
2,2
15,2
45
8,5
84,7
52
55,
997,
892
6,2
21,9
88
2,6
75,1
90
52,
017,
823
SO2
15,
259,
409
776
,083
6
,648
,773
2
5,94
2,30
6 1
,705
,588
3
,038
,056
3
16,9
47
3,8
97,7
64
11,
617,
457
69,
202,
384
7,6
89,1
54
1,8
75,6
11
3,4
84,3
38
O3
2,6
59,0
29
807
,147
1
,880
,089
1
,274
,591
4
29,8
60
586
,815
1
,415
,216
9
46,7
90
2,4
73,3
35
12,
475,
872
1,3
85,8
75
521
,249
2
,258
,794
Tota
l 4
pol
luta
nts#
62,
234,
593
11,
220,
914
13,
590,
101
91,
347,
071
9,8
40,4
04
10,
669,
397
17,
756,
596
13,
941,
676
27,
565,
519
258
,166
,270
2
8,68
5,14
1 1
4,71
2,42
2 1
23,6
50,6
85
Ad
just
ed†
186
,782
,240
3
6,05
4,74
3 6
1,84
7,81
9 3
65,0
35,6
06
60,
864,
710
76,
770,
641
89,
745,
713
36,
879,
842
119
,297
,321
1,0
33,2
78,6
34 1
14,8
08,7
37
15,
893,
875
123
,650
,685
2. In
dir
ect h
ealt
h c
are
cost
per
yea
r d
ue
to a
ir p
ollu
tio
n
PM10
9,72
8,01
86,
482,
455
1,90
5,87
08,
944,
172
2,74
8,03
03,
132,
054
4,89
0,60
47,
645,
951
2,38
0,33
647
,857
,490
5,31
7,49
99,
755,
663
19,8
40,5
16
NO
25,
017,
558
8,79
6,33
92,
556,
651
9,51
5,06
453
5,12
51,
485,
234
25,9
234,
456,
881
3,96
5,11
836
,353
,893
4,03
9,32
15,
242,
780
25,7
42,5
17
SO2
41,2
31,6
967,
417,
494
16,2
04,4
9645
,013
,371
5,79
2,23
613
,922
,256
1,09
7,46
130
,915
,359
23,5
74,7
8518
5,16
9,15
420
,574
,350
10,5
92,6
699,
040,
697
O3
42,3
3224
,108
63,6
4623
,795
5,36
19,
442
15,5
4328
,481
71,0
0428
3,71
131
,523
8,53
59,
709
Tota
l 4
pol
luta
nts#
46,4
62,1
7316
,343
,758
16,6
29,5
2050
,680
,375
7,83
8,27
115
,445
,137
5,83
8,64
235
,470
,654
23,8
79,8
5821
8,58
8,38
724
,287
,599
20,8
11,5
8037
,998
,842
Ad
just
ed†
139,
445,
094
52,5
15,3
2775
,680
,051
202,
525,
830
48,4
81,1
5011
1,13
4,02
529
,509
,773
93,8
30,3
3810
3,34
6,61
585
6,46
8,20
495
,163
,134
22,4
82,8
1537
,998
,842
3. T
ota
l hea
lth
car
e co
st p
er y
ear
du
e to
air
po
lluti
on
PM10
52,
660,
085
14,
398,
058
6,7
88,6
14
66,
462,
534
10,
461,
696
10,
087,
115
20,
951,
076
16,
458,
465
14,
194,
108
212
,461
,750
2
3,60
6,86
1 21
,274
,495
11
6,97
8,25
5
NO
2 1
4,34
8,27
2 1
3,29
9,40
0 5
,586
,646
3
5,76
5,26
1 1
,179
,479
2
,889
,024
6
1,70
8 6
,672
,126
1
2,54
9,87
0 9
2,35
1,78
5 1
0,26
1,30
9 7,
917,
969
77,7
60,3
40
SO2
56,
491,
105
8,1
93,5
77
22,
853,
269
70,
955,
677
7,4
97,8
24
16,
960,
312
1,4
14,4
08
34,
813,
123
35,
192,
242
254
,371
,539
2
8,26
3,50
4 12
,468
,280
12
,525
,035
O3
2,7
01,3
61
831
,255
1
,943
,735
1
,298
,385
4
35,2
21
596
,257
1
,430
,759
9
75,2
70
2,5
44,3
39
12,
756,
583
1,4
17,3
98
529,
784
2,26
8,50
3
Tota
l 4
pol
luta
nts#
108
,696
,766
2
7,56
4,67
2 3
0,21
9,62
1 1
42,0
27,4
45
17,
678,
675
26,
114,
534
23,
595,
238
49,
412,
330
51,
445,
377
476
,754
,657
5
2,97
2,74
0 35
,524
,002
16
1,64
9,52
8
Ad
just
ed†
326
,227
,334
8
8,57
0,07
0 13
7,52
7,87
0 5
67,5
61,4
35
109
,345
,860
18
7,90
4,66
6 11
9,25
5,48
6 13
0,71
0,18
0 22
2,64
3,93
6 1,
889,
746,
837
209
,971
,871
3
8,37
6,69
0 1
61,6
49,5
28
* Pe
r 9 m
illio
n p
opul
atio
n †
Dire
ct c
ost a
djus
ted
by ra
tio o
f GD
Ps#
The
sum
mat
ion
allo
wed
for c
orre
latio
n b
etw
een
the
pol
luta
ntsvi
Sour
ce: H
KU D
epar
tmen
t of C
omm
unit
y M
edic
ine
vi
The
tota
l for
all
4 p
ollu
tant
s w
as c
alcu
late
d by
the
adju
sted
sum
mat
ion
(T1)
met
hod
outl
ined
in th
e fu
ll H
KU re
por
t.

54Report on Air Quality and the State of Public Health in Southern China
Table 6.1: Sensitivity analysis on combination of 4 air pollutants
Baseline model
Test model Area Original value of total costs (RMB/ HK$) based on T1
Test value of total costs (RMB/ HK$)
T11 T22 GZ 791,535,082 918,919,579
SZ 45,518,811 60,641,207
ZH 26,041,640 32,033,055
FS 498,359,818 612,239,040
JM 68,156,579 75,464,469
ZQ 102,904,503 120,314,348
HZ 69,186,666 69,957,001
DG 80,032,657 95,430,489
ZS 71,738,005 89,914,915
PRD 1,753,473,761 2,074,914,103
M 16,434,718 19,518,900
HK 1,096,549,572 1,421,361,232
T11 T33 GZ 791,535,082 800,539,342
SZ 45,518,811 42,634,348
ZH 26,041,640 28,009,202
FS 498,359,818 497,661,120
JM 68,156,579 67,486,916
ZQ 102,904,503 107,689,436
HZ 69,186,666 62,460,146
DG 80,032,657 84,774,901
ZS 71,738,005 75,464,643
PRD 1,753,473,761 1,766,720,054
M 16,434,718 15,810,245
HK 1,096,549,572 962,172,379
T11 T44 GZ 791,535,082 608,709,866
SZ 45,518,811 44,419,465
ZH 26,041,640 23,950,594
FS 498,359,818 424,061,444
JM 68,156,579 46,458,080
ZQ 102,904,503 82,142,184
HZ 69,186,666 35,746,137
DG 80,032,657 66,938,763
ZS 71,738,005 66,958,254
PRD 1,753,473,761 1,399,384,786
M 16,434,718 12,761,949
HK 1,096,549,572 971,618,460
1 T1 = PM10
+ 0.41(NO2) + 0.84(SO
2) + O
3
2 T2 = PM10
+ SO2+ NO
2+ O
3
3 T3 = SO2 + 0.88 PM
10 + 0.31 NO
2 + O
3
4 T4 = NO2 + 0.75 SO
2 + 0.46 PM
10 + O
3

55Report on Air Quality and the State of Public Health in Southern China
Table 6.1: (Continued)
Baseline model
Test model Area Original value of total costs (RMB/ HK$) based on T1
Test value of total costs (RMB/ HK$)
T11 T55 GZ 791,535,082 432,752,076
SZ 45,518,811 27,605,117
ZH 26,041,640 20,472,158
FS 498,359,818 265,025,808
JM 68,156,579 43,370,771
ZQ 102,904,503 67,413,910
HZ 69,186,666 61,433,375
DG 80,032,657 56,386,467
ZS 71,738,005 49,247,741
PRD 1,753,473,761 1,023,707,421
M 16,434,718 10,367,050
HK 1,096,549,572 793,521,996
T11 T66 GZ 791,535,082 432,752,076
SZ 45,518,811 27,605,117
ZH 26,041,640 20,472,158
FS 498,359,818 265,025,808
JM 68,156,579 43,370,771
ZQ 102,904,503 67,413,910
HZ 69,186,666 61,433,375
DG 80,032,657 56,386,467
ZS 71,738,005 49,247,741
PRD 1,753,473,761 1,023,707,421
M 16,434,718 10,367,050
HK 1,096,549,572 793,521,996
T11 T77 GZ 791,535,082 452,267,388
SZ 45,518,811 28,977,807
ZH 26,041,640 22,147,165
FS 498,359,818 269,581,710
JM 68,156,579 45,048,678
ZQ 102,904,503 69,763,465
HZ 69,186,666 65,628,688
DG 80,032,657 57,966,103
ZS 71,738,005 52,621,775
PRD 1,753,473,761 1,064,002,779
M 16,434,718 10,612,148
HK 1,096,549,572 808,910,388
5 T5 = Max (PM10
, NO2, SO
2, O
3)
6 T6 = PM10
+ O3
7 T7 =Max (PM10
, NO2, SO
2) + O
3
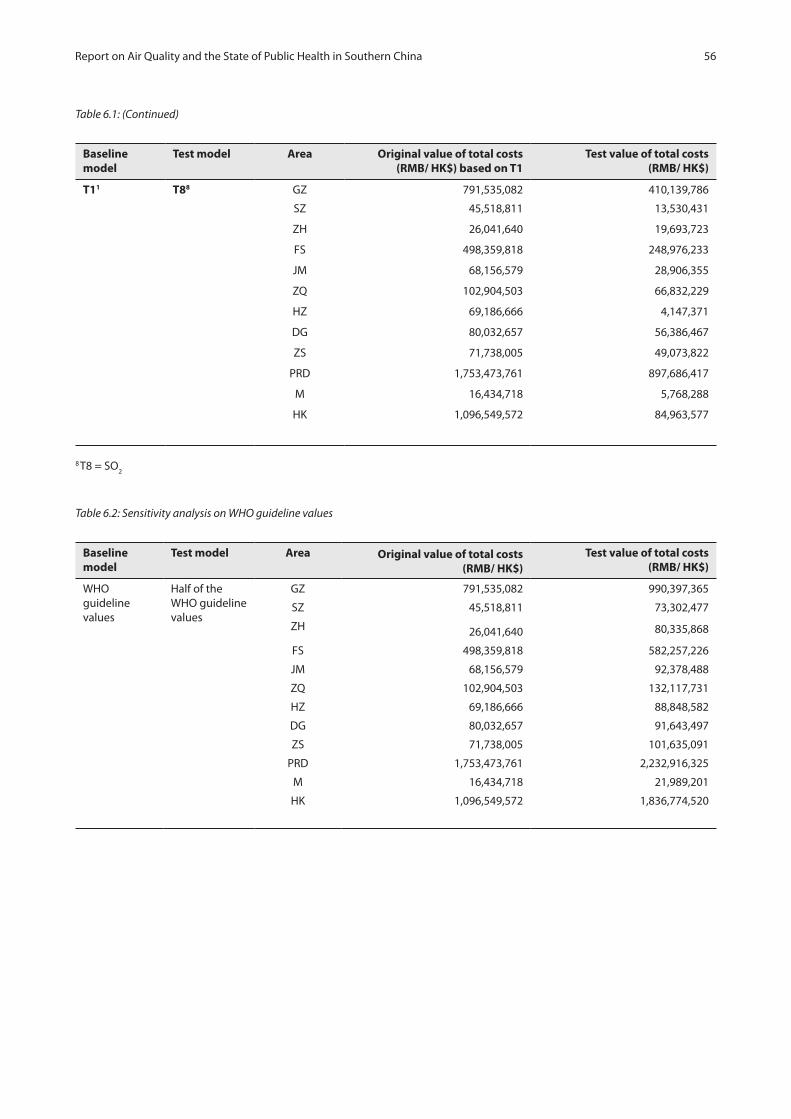
56Report on Air Quality and the State of Public Health in Southern China
Table 6.1: (Continued)
Baseline model
Test model Area Original value of total costs (RMB/ HK$) based on T1
Test value of total costs (RMB/ HK$)
T11 T88 GZ 791,535,082 410,139,786
SZ 45,518,811 13,530,431
ZH 26,041,640 19,693,723
FS 498,359,818 248,976,233
JM 68,156,579 28,906,355
ZQ 102,904,503 66,832,229
HZ 69,186,666 4,147,371
DG 80,032,657 56,386,467
ZS 71,738,005 49,073,822
PRD 1,753,473,761 897,686,417
M 16,434,718 5,768,288
HK 1,096,549,572 84,963,577
8 T8 = SO2
Table 6.2: Sensitivity analysis on WHO guideline values
Baseline model
Test model Area Original value of total costs (RMB/ HK$)
Test value of total costs (RMB/ HK$)
WHO guideline values
Half of the WHO guideline values
GZ 791,535,082 990,397,365
SZ 45,518,811 73,302,477
ZH 26,041,640 80,335,868
FS 498,359,818 582,257,226
JM 68,156,579 92,378,488
ZQ 102,904,503 132,117,731
HZ 69,186,666 88,848,582
DG 80,032,657 91,643,497
ZS 71,738,005 101,635,091
PRD 1,753,473,761 2,232,916,325
M 16,434,718 21,989,201
HK 1,096,549,572 1,836,774,520

57Report on Air Quality and the State of Public Health in Southern China
Table 6.3: Sensitivity analysis on effects of PRD air data on the HK model
Baseline model
Test model PRD air data Original value of total costs (RMB/ HK$)
Test value of total costs (RMB/ HK$)
Use the PRD air pollutant data for the PRD model
Use the PRD air pollutant data for the HK model
GZ 791,535,082 3,180,133,914
SZ 45,518,811 1,451,612,478
ZH 26,041,640 1,547,808,579
FS 498,359,818 4,924,640,968
JM 68,156,579 1,702,588,005
ZQ 102,904,503 2,729,923,423
HZ 69,186,666 2,114,783,662
DG 80,032,657 3,123,971,517
ZS 71,738,005 1,737,214,637
PRD 1,753,473,761 2,428,517,864
Table 6.4: Sensitivity analysis on total numbers of bed-days in private hospitals in PRD
Baseline model
Test model Area Original value of direct costs (RMB/ HK$)
Test value of direct costs (RMB/ HK$)
See note9 See note10 GZ 191,719,590 195,643,993
SZ 6,115,978 6,228,298
ZH 8,423,809 8,800,742
FS 151,900,619 156,854,107
JM 16,143,201 16,492,682
ZQ 20,775,630 21,207,170
HZ 14,893,215 15,170,018
DG 11,563,138 11,821,557
ZS 23,003,155 23,839,414
PRD 444,538,335 456,057,982
HK 191,719,590 195,643,993
9Average LOS for 2 main diseases in public General hospitals in Guangzhou * Total numbers of private hospital inpatients in Guangdong * Proportion of population of each prefecture to Guangdong.10The proportions of number of bed-days in public and private sectors in Hong Kong (HA Annual Report 2000/01) were applied to the 9 prefectures in PRD.
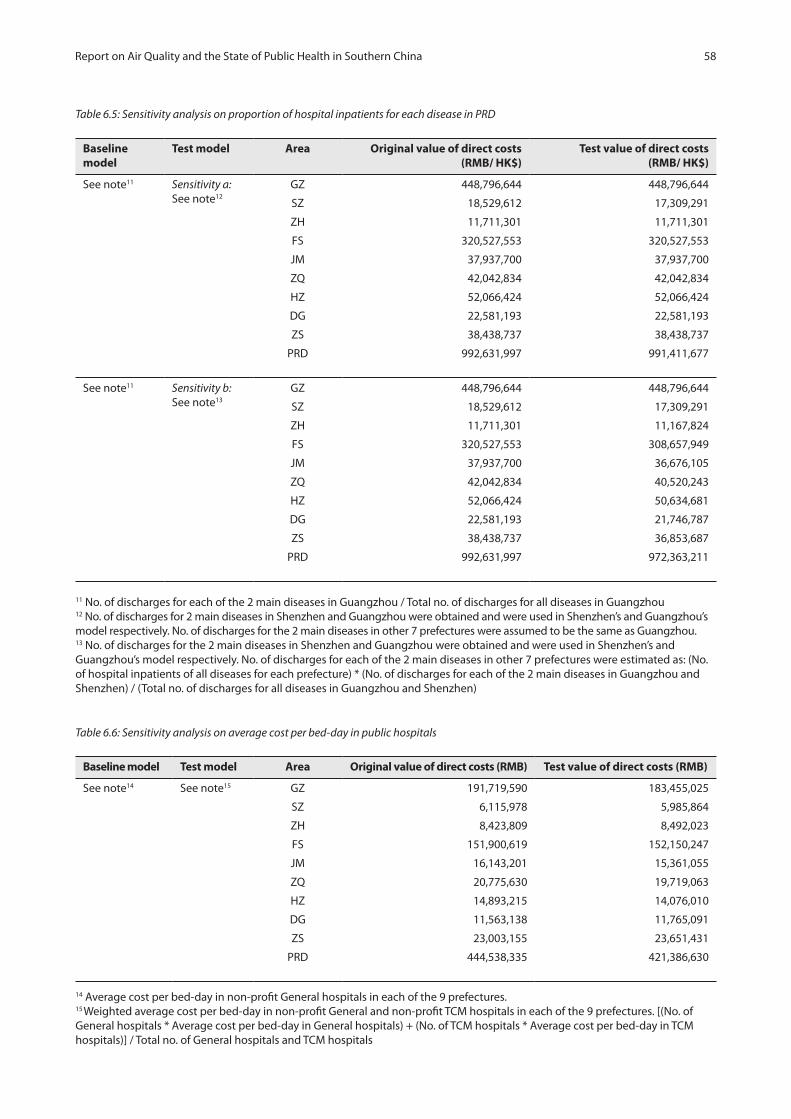
58Report on Air Quality and the State of Public Health in Southern China
Table 6.5: Sensitivity analysis on proportion of hospital inpatients for each disease in PRD
Baseline model
Test model Area Original value of direct costs (RMB/ HK$)
Test value of direct costs (RMB/ HK$)
See note11 Sensitivity a:See note12
GZ 448,796,644 448,796,644
SZ 18,529,612 17,309,291
ZH 11,711,301 11,711,301
FS 320,527,553 320,527,553
JM 37,937,700 37,937,700
ZQ 42,042,834 42,042,834
HZ 52,066,424 52,066,424
DG 22,581,193 22,581,193
ZS 38,438,737 38,438,737
PRD 992,631,997 991,411,677
See note11 Sensitivity b:See note13
GZ 448,796,644 448,796,644
SZ 18,529,612 17,309,291
ZH 11,711,301 11,167,824
FS 320,527,553 308,657,949
JM 37,937,700 36,676,105
ZQ 42,042,834 40,520,243
HZ 52,066,424 50,634,681
DG 22,581,193 21,746,787
ZS 38,438,737 36,853,687
PRD 992,631,997 972,363,211
11 No. of discharges for each of the 2 main diseases in Guangzhou / Total no. of discharges for all diseases in Guangzhou12 No. of discharges for 2 main diseases in Shenzhen and Guangzhou were obtained and were used in Shenzhen’s and Guangzhou’s model respectively. No. of discharges for the 2 main diseases in other 7 prefectures were assumed to be the same as Guangzhou.13 No. of discharges for the 2 main diseases in Shenzhen and Guangzhou were obtained and were used in Shenzhen’s and Guangzhou’s model respectively. No. of discharges for each of the 2 main diseases in other 7 prefectures were estimated as: (No. of hospital inpatients of all diseases for each prefecture) * (No. of discharges for each of the 2 main diseases in Guangzhou and Shenzhen) / (Total no. of discharges for all diseases in Guangzhou and Shenzhen)
Table 6.6: Sensitivity analysis on average cost per bed-day in public hospitals
Baseline model Test model Area Original value of direct costs (RMB) Test value of direct costs (RMB)
See note14 See note15 GZ 191,719,590 183,455,025
SZ 6,115,978 5,985,864
ZH 8,423,809 8,492,023
FS 151,900,619 152,150,247
JM 16,143,201 15,361,055
ZQ 20,775,630 19,719,063
HZ 14,893,215 14,076,010
DG 11,563,138 11,765,091
ZS 23,003,155 23,651,431
PRD 444,538,335 421,386,630
14 Average cost per bed-day in non-profit General hospitals in each of the 9 prefectures.15 Weighted average cost per bed-day in non-profit General and non-profit TCM hospitals in each of the 9 prefectures. [(No. ofGeneral hospitals * Average cost per bed-day in General hospitals) + (No. of TCM hospitals * Average cost per bed-day in TCM hospitals)] / Total no. of General hospitals and TCM hospitals

59Report on Air Quality and the State of Public Health in Southern China
Table 6.7: Sensitivity analysis on average cost of an inpatient episode in Shenzhen
Baseline model
Test model Area Original value of direct costs (RMB)
Test value of direct costs (RMB)
See note16 See note17 SZ 6,115,978 5,331,697
16Average LOS for 2 main diseases in GZ * Average cost per bed-day in non-profit General hospitals in SZ17 Average cost per discharge episode for 2 main diseases in SZ
Table 6.8: Sensitivity analysis on number of hospital inpatients for employed population aged 15 to 64 in 9 prefectures of PRD
Baseline model
Test model Area Original value of productivity loss on hospital episodes (RMB)
Test value of productivity loss on hospital episodes (RMB)
See note18 See note19 GZ 7,802,316 2,805,903
SZ 429,358 132,034
ZH 463,717 165,738
FS 6,692,409 2,343,789
JM 417,292 161,982
ZQ 726,228 315,088
HZ 373,659 139,666
DG 704,860 275,489
ZS 1,469,016 503,032
PRD 19,078,855 6,842,721
18 No. of episodes of the 2 main diseases (all ages)* Proportion of the population aged 15-64 * Employment rate19 No. of episodes of the 2 main diseases (all ages) * Proportion of hospital inpatients aged 15-59 for each disease in GZ * Employment rate
Table 6.9: Sensitivity analysis on use of mean and median monthly income for males and females in HK and MSAR
Baseline model
Test model Area Original value of total costs based on T1 (HK$)
Test value of total costs ( HK$)
See note20 See note21 HK 1,096,549,572 1,002,939,112
M 16,434,718 13,033,032
20 Mean monthly income for males and females 21 Median monthly income for males and females (HK); for overall (M)

60Appendices

61Appendices
Tabl
e A
.1.1
a: E
stim
ates
of u
nit c
ost,
freq
uenc
y of
hea
lth se
rvic
e ut
ilisa
tion
and
tota
l dire
ct h
ealth
car
e co
st p
er 1
0 µg
/m3 c
hang
e ai
r pol
luta
nt(s
) in
Gua
ngzh
ou
Hea
lth
car
e co
st (R
MB
) per
yea
r d
ue
to a
ir p
ollu
tio
n
Co
st (R
MB
) per
ep
iso
de/
vis
itTo
tal n
o. o
f ep
iso
des
/ vis
its
per
yea
r
PM
10N
O2
SO2
O3
All
4 p
ollu
tan
ts
by
adju
sted
su
mm
atio
n (T
1)
AB
C =
A *
B *
ER
(a) H
osp
ital
inp
atie
nts
—Pu
blic
C
ardi
ovas
cula
r dis
ease
s13
,185
52,5
7517
,804
,824
6,
916,
043
39,8
67,1
86
1,40
0,30
8 55
,529
,146
Re
spira
tory
dis
ease
s8,
040
65,0
0118
,138
,563
3,
856,
785
21,1
49,6
08
2,41
9,20
1 39
,904
,717
Co
st fo
r it
em (a
):35
,943
,387
10
,772
,828
61
,016
,794
3,
819,
509
95,4
33,8
62
(b) H
osp
ital
inp
atie
nts
—Pr
ivat
e
C
ardi
ovas
cula
r dis
ease
s13
,185
889
301,
051
116,
939
674,
089
23,6
77
938,
907
Re
spira
tory
dis
ease
s8,
040
1,09
930
6,75
4 65
,225
35
7,67
6 40
,913
67
4,85
7
Co
st fo
r it
em (b
):60
7,80
5 18
2,16
4 1,
031,
765
64,5
90
1,61
3,76
5
(c) H
osp
ital
ou
tpat
ien
ts a
nd
A
&E
visi
ts—
Pub
lic
C
ardi
ovas
cula
r dis
ease
s13
63,
967,
038
122,
840,
881
25,2
17,0
36
19,5
35,9
19
6,81
1,40
5 15
6,40
1,44
2
Re
spira
tory
dis
ease
s13
64,
905,
612
151,
904,
181
31,1
83,2
11
24,1
57,9
82
8,42
2,93
6 19
3,40
4,93
8
Co
st fo
r it
em (c
):27
4,74
5,06
2 56
,400
,247
43
,693
,901
15
,234
,341
34
9,80
6,38
0
(d) H
osp
ital
ou
tpat
ien
ts—
Priv
ate
Re
spira
tory
dis
ease
s13
652
,758
1,52
5,78
6 31
3,21
7 24
2,65
2 84
,603
1,9
42,6
36
Co
st fo
r it
em (d
):1,
525,
786
313,
217
242,
652
84,6
03
1
,942
,636
Tota
l dir
ect h
ealt
h c
are
cost
:31
2,82
2,03
967
,668
,455
105,
985,
112
19,2
03,0
4344
8,79
6,64
4
Ap
pen
dix
1: D
etai
led
tab
les
on d
irec
t an
d in
dir
ect h
ealt
h c
are
cost
due
to a
ir p
ollu
tion

62Appendices
Tabl
e A
.1.1
b: P
rodu
ctiv
ity lo
ss (P
L) d
ue to
per
10
µg /m
3 ch
ange
in a
ir po
lluta
nt(s
) lev
el in
Gua
ngzh
ou
PL
(RM
B) p
er y
ear
du
e to
air
po
lluti
on
PL
(RM
B) p
er
epis
od
e p
er y
ear
Tota
l no.
of
emp
loye
d
epis
od
es/
per
son
s-ye
ars
of
life
loss
per
yea
PM
10N
O2
SO2
O3
All
4 p
ollu
tan
ts
by
adju
sted
su
mm
atio
n (T
1)
AB
C =
A *
B *
ER
(a) H
osp
ital
inp
atie
nts
- Pu
blic
C
ardi
ovas
cula
r dis
ease
s1,
394
39,9
801,
431,
450
556,
028
3,20
5,19
3 11
2,58
0 4,
464,
364
Re
spira
tory
dis
ease
s85
049
,430
1,45
8,28
2 31
0,07
3 1,
700,
360
194,
496
3,20
8,21
1
Co
st fo
r it
em (a
):2,
889,
732
866,
101
4,90
5,55
4 30
7,07
6 7,
672,
575
(b) H
osp
ital
inp
atie
nts
- Pr
ivat
e
C
ardi
ovas
cula
r dis
ease
s1,
394
676
24,2
03
9,40
2 54
,195
1,
904
75,4
85
Re
spira
tory
dis
ease
s85
083
624
,662
5,
244
28,7
56
3,28
9 54
,256
Co
st fo
r it
em (b
):48
,866
14
,645
82
,951
5,
193
129,
741
(c) P
rem
atu
re d
eath
Fe
mal
e31
,025
22,6
09,2
4711
,870
,081
98,2
81,0
12—
22,6
09,2
47
M
ale
31,0
2546
,213
,018
24,2
62,2
9720
0,88
5,15
8—
46,2
13,0
18
Co
st fo
r it
em (c
):68
,822
,264
36,1
32,3
7729
9,16
6,17
0—
334,
936,
122
Tota
l pro
du
ctiv
ity
loss
(in
dir
ect h
ealt
h c
are
cost
):
71,7
60,8
6237
,013
,123
304,
154,
674
312,
269
342,
738,
438
Tota
l dir
ect a
nd
ind
irec
t hea
lth
car
e co
st:
3
84,5
82,9
02
10
4,68
1,57
9 4
10,1
39,7
86
19,
515,
312
791,
535,
082

63Appendices
Tabl
e A
.1.2
a: E
stim
ates
of u
nit c
ost,
freq
uenc
y of
hea
lth se
rvic
e ut
ilisa
tion
and
tota
l dire
ct h
ealth
car
e co
st p
er 1
0 µg
/m3
chan
ge in
air
pollu
tant
(s) i
n Sh
enzh
en
Hea
lth
car
e co
st (R
MB
) per
yea
r d
ue
to a
ir p
ollu
tio
n
Co
st (R
MB
) per
ep
iso
de/
vis
itTo
tal n
o. o
f ep
iso
des
/ vis
its
per
yea
r
PM
10N
O2
SO2
O3
All
4 p
ollu
tan
ts
by
adju
sted
su
mm
atio
n (T
1)
AB
C =
A *
B *
ER
(a) H
osp
ital
inp
atie
nts
—Pu
blic
C
ardi
ovas
cula
r dis
ease
s9,
663
5,95
2
849,
348
860
,610
507,
222
1
09,2
66
1,7
37,5
30
Re
spira
tory
dis
ease
s5,
892
7,36
0
865,
440
480
,021
269,
135
1
88,8
07
1,4
77,1
29
Co
st fo
r it
em (a
):
1
,714
,787
1,3
40,6
31
77
6,35
7
298
,072
3
,214
,658
(b) H
osp
ital
inp
atie
nts
—Pr
ivat
e
C
ardi
ovas
cula
r dis
ease
s9,
663
199
2
8,39
9
28,7
76
1
6,96
0 3
,653
58
,097
Re
spira
tory
dis
ease
s5,
892
246
2
8,93
7
16,0
50
8,9
99
6,
313
49,3
90
Co
st fo
r it
em (b
):
57,
336
44
,826
25,
959
9,
966
1
07,4
86
(c) H
osp
ital
ou
tpat
ien
ts a
nd
A
&E
visi
ts—
Pub
lic
C
ardi
ovas
cula
r dis
ease
s12
630
0,51
2
4,9
64,7
64
2
,658
,585
210,
583
450,
302
6,68
1,97
6
Re
spira
tory
dis
ease
s12
637
1,61
1
6,1
39,3
93
3
,287
,587
260,
406
556,
841
8,26
2,88
5
Co
st fo
r it
em (c
):11
,104
,157
5,
946,
172
470,
990
1,00
7,14
3 14
,944
,862
(d) H
osp
ital
ou
tpat
ien
ts—
Priv
ate
Re
spira
tory
dis
ease
s12
611
,810
195
,118
1
04,4
84
8,27
6
1
7,69
7
262,
605
Co
st fo
r it
em (d
):
1
95,1
18
104
,484
8,
276
17,
697
26
2,60
5
Tota
l dir
ect h
ealt
h c
are
cost
: 1
3,07
1,39
8
7,4
36,1
12
1,28
1,58
2
1,33
2,87
9
18,
529,
612
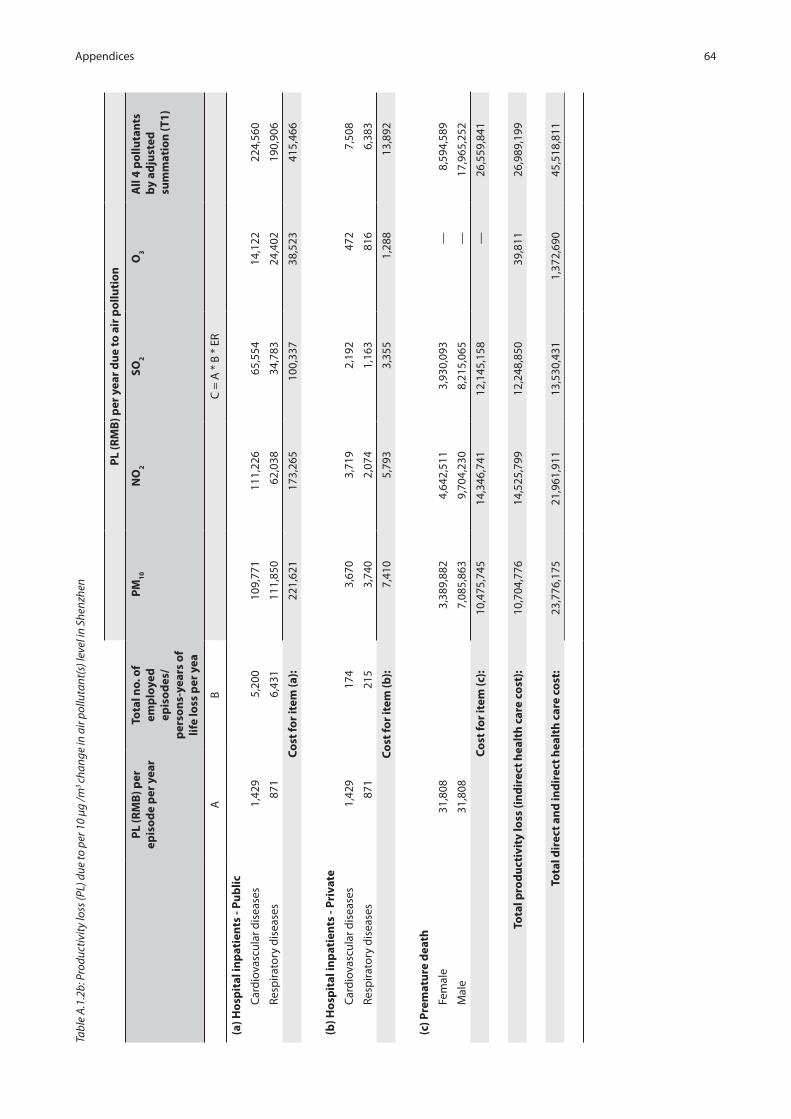
64Appendices
Tabl
e A
.1.2
b: P
rodu
ctiv
ity lo
ss (P
L) d
ue to
per
10
µg /m
3 ch
ange
in a
ir po
lluta
nt(s
) lev
el in
She
nzhe
n
PL
(RM
B) p
er y
ear
du
e to
air
po
lluti
on
PL
(RM
B) p
er
epis
od
e p
er y
ear
Tota
l no.
of
emp
loye
d
epis
od
es/
per
son
s-ye
ars
of
life
loss
per
yea
PM
10N
O2
SO2
O3
All
4 p
ollu
tan
ts
by
adju
sted
su
mm
atio
n (T
1)
AB
C =
A *
B *
ER
(a) H
osp
ital
inp
atie
nts
- Pu
blic
C
ardi
ovas
cula
r dis
ease
s1,
429
5,20
0 1
09,7
71
111
,226
6
5,55
4 1
4,12
2 2
24,5
60
Re
spira
tory
dis
ease
s87
16,
431
111
,850
6
2,03
8 3
4,78
3 2
4,40
2 1
90,9
06
Co
st fo
r it
em (a
): 2
21,6
21
173
,265
1
00,3
37
38,
523
415
,466
(b) H
osp
ital
inp
atie
nts
- Pr
ivat
e
C
ardi
ovas
cula
r dis
ease
s1,
429
174
3,6
70
3,7
19
2,1
92
472
7
,508
Re
spira
tory
dis
ease
s87
121
5 3
,740
2
,074
1
,163
8
16
6,3
83
Co
st fo
r it
em (b
): 7
,410
5
,793
3
,355
1
,288
1
3,89
2
(c) P
rem
atu
re d
eath
Fe
mal
e31
,808
3,38
9,88
24,
642,
511
3,93
0,09
3—
8,59
4,58
9
M
ale
31,8
087,
085,
863
9,70
4,23
08,
215,
065
—17
,965
,252
Co
st fo
r it
em (c
):10
,475
,745
14,3
46,7
4112
,145
,158
—26
,559
,841
Tota
l pro
du
ctiv
ity
loss
(in
dir
ect h
ealt
h c
are
cost
):
10,7
04,7
7614
,525
,799
12,2
48,8
5039
,811
26,9
89,1
99
Tota
l dir
ect a
nd
ind
irec
t hea
lth
car
e co
st:
23,
776,
175
21,
961,
911
13,
530,
431
1,3
72,6
90
45,
518,
811

65Appendices
Tabl
e A
.1.3
a: E
stim
ates
of u
nit c
ost,
freq
uenc
y of
hea
lth se
rvic
e ut
ilisa
tion
and
tota
l dire
ct h
ealth
car
e co
st p
er 1
0 µg
/m3
chan
ge in
air
pollu
tant
(s) i
n Zh
uhai
Hea
lth
car
e co
st (R
MB
) per
yea
r d
ue
to a
ir p
ollu
tio
n
Co
st (R
MB
) per
ep
iso
de/
vis
itTo
tal n
o. o
f ep
iso
des
/ vis
its
per
yea
r
PM
10N
O2
SO2
O3
All
4 p
ollu
tan
ts
by
adju
sted
su
mm
atio
n (T
1)
AB
C =
A *
B *
ER
(a) H
osp
ital
inp
atie
nts
—Pu
blic
C
ardi
ovas
cula
r dis
ease
s9,
878
9,08
068
5,85
5 69
8,41
2 3,
115,
947
287,
019
3,87
6,61
9
Re
spira
tory
dis
ease
s6,
023
11,2
2869
8,85
0 38
9,55
2 1,
653,
343
495,
958
2,74
3,33
2
Co
st fo
r it
em (a
):1,
384,
705
1,08
7,96
5 4,
769,
290
782,
976
6,61
9,95
0
(b) H
osp
ital
inp
atie
nts
—Pr
ivat
e
C
ardi
ovas
cula
r dis
ease
s9,
878
104
7,84
4 7,
988
35,6
37
3,28
3 44
,337
Re
spira
tory
dis
ease
s6,
023
128
7,99
3 4,
455
18,9
09
5,67
2 31
,376
Co
st fo
r it
em (b
):15
,837
12
,443
54
,547
8,
955
75,7
13
(c) H
osp
ital
ou
tpat
ien
ts a
nd
A
&E
visi
ts—
Pub
lic
C
ardi
ovas
cula
r dis
ease
s11
615
6,82
0
1,23
3,42
6
663,
779
39
8,00
1
363
,914
2,20
3,81
0
Re
spira
tory
dis
ease
s11
619
3,92
2
1,52
5,24
6
820,
825
49
2,16
5
450
,014
2,72
5,21
6
Co
st fo
r it
em (c
):2,
758,
672
1,48
4,60
4 89
0,16
6 81
3,92
8 4,
929,
027
(d) H
osp
ital
ou
tpat
ien
ts—
Priv
ate
Re
spira
tory
dis
ease
s11
66,
163
48,
474
2
6,08
7
15,
642
14,3
02
86,
611
Co
st fo
r it
em (d
):
4
8,47
4
26,
087
1
5,64
2
14
,302
8
6,61
1
Tota
l dir
ect h
ealt
h c
are
cost
:
4,20
7,68
8
2,
611,
099
5,72
9,64
4 1
,620
,161
1
1,71
1,30
1

66Appendices
Tabl
e A
.1.3
b: P
rodu
ctiv
ity lo
ss (P
L) d
ue to
per
10
µg /m
3 ch
ange
in a
ir po
lluta
nt(s
) lev
el in
Zhu
hai
PL
(RM
B) p
er y
ear
du
e to
air
po
lluti
on
PL
(RM
B) p
er
epis
od
e p
er y
ear
Tota
l no.
of
emp
loye
d
epis
od
es/
per
son
s-ye
ars
of
life
loss
per
yea
PM
10N
O2
SO2
O3
All
4 p
ollu
tan
ts
by
adju
sted
su
mm
atio
n (T
1)
AB
C =
A *
B *
ER
(a) H
osp
ital
inp
atie
nts
- Pu
blic
C
ardi
ovas
cula
r dis
ease
s90
06,
903
47,5
00
48,3
69
215,
799
19,8
78
268,
480
Re
spira
tory
dis
ease
s54
98,
536
48,4
00
26,9
79
114,
504
34,3
48
189,
993
Co
st fo
r it
em (a
):95
,899
75
,348
33
0,30
3 54
,226
45
8,47
3
(b) H
osp
ital
inp
atie
nts
- Pr
ivat
e
C
ardi
ovas
cula
r dis
ease
s90
079
543
553
2,46
8 22
7 3,
071
Re
spira
tory
dis
ease
s54
998
554
309
1,31
0 39
3 2,
173
Co
st fo
r it
em (b
):1,
097
862
3,77
8 62
0 5,
244
(c) P
rem
atu
re d
eath
Fe
mal
e20
,027
506,
862
697,
616
4,47
0,46
5—
4,54
8,07
5
M
ale
20,0
271,
038,
508
1,42
9,34
59,
159,
533
—9,
318,
547
Co
st fo
r it
em (c
):1,
545,
370
2,12
6,96
113
,629
,998
—13
,866
,622
Tota
l pro
du
ctiv
ity
loss
(in
dir
ect h
ealt
h c
are
cost
):
1,64
2,36
62,
203,
171
13,9
64,0
7954
,846
14,3
30,3
39
Tota
l dir
ect a
nd
ind
irec
t hea
lth
car
e co
st:
5,
850,
055
4,81
4,27
0
19,
693,
723
1,
675,
007
26,
041,
640

67Appendices
Tabl
e A
.1.4
a: E
stim
ates
of u
nit c
ost,
freq
uenc
y of
hea
lth se
rvic
e ut
ilisa
tion
and
tota
l dire
ct h
ealth
car
e co
st p
er 1
0 µg
/m3
chan
ge in
air
pollu
tant
(s) i
n Fo
shan
Hea
lth
car
e co
st (R
MB
) per
yea
r d
ue
to a
ir p
ollu
tio
n
Co
st (R
MB
) per
ep
iso
de/
vis
itTo
tal n
o. o
f ep
iso
des
/ vis
its
per
yea
r
PM
10N
O2
SO2
O3
All
4 p
ollu
tan
ts
by
adju
sted
su
mm
atio
n (T
1)
AB
C =
A *
B *
ER
(a) H
osp
ital
inp
atie
nts
—Pu
blic
C
ardi
ovas
cula
r dis
ease
s8,
640
45,3
1313
,761
,414
11
,169
,974
37
,279
,141
38
3,67
5 50
,039
,256
Re
spira
tory
dis
ease
s5,
268
56,0
3414
,022
,142
6,
230,
259
19,7
80,5
69
662,
977
33,8
55,2
03
Co
st fo
r it
em (a
):27
,783
,556
17
,400
,233
57
,059
,709
1,
046,
652
83,8
94,4
59
(b) H
osp
ital
inp
atie
nts
—Pr
ivat
e
C
ardi
ovas
cula
r dis
ease
s8,
640
423
128,
419
104,
236
347,
881
3,58
0 46
6,95
6
Re
spira
tory
dis
ease
s5,
268
523
130,
852
58,1
39
184,
588
6,18
7 31
5,93
0
Co
st fo
r it
em (b
):25
9,27
0 16
2,37
5 53
2,46
9 9,
767
782,
886
(c) H
osp
ital
ou
tpat
ien
ts a
nd
A
&E
visi
ts—
Pub
lic
C
ardi
ovas
cula
r dis
ease
s76
3,24
8,60
5
77,
432,
538
3
3,21
5,72
6
14,
898,
391
1,52
2,06
1 1
05,0
87,6
96
Re
spira
tory
dis
ease
s76
4,01
7,20
3
95,
752,
539
4
1,07
4,33
6
18,
423,
247
1,88
2,17
0 1
29,9
50,7
15
Co
st fo
r it
em (c
): 1
73,1
85,0
77
74,2
90,0
62
33,3
21,6
39
3,40
4,23
2 23
5,03
8,41
1
(d) H
osp
ital
ou
tpat
ien
ts—
Priv
ate
Re
spira
tory
dis
ease
s76
25,0
95
598
,163
256,
590
11
5,08
9
11,
758
81
1,79
7
Co
st fo
r it
em (d
):
598
,163
256,
590
11
5,08
9
11,
758
81
1,79
7
Tota
l dir
ect h
ealt
h c
are
cost
:
201,
826,
066
9
2,10
9,26
1
91,
028,
907
4,47
2,40
9 3
20,5
27,5
53

68Appendices
Tabl
e A
.1.4
b: P
rodu
ctiv
ity lo
ss (P
L) d
ue to
per
10
µg /m
3 ch
ange
in a
ir po
lluta
nt(s
) lev
el in
Fos
han
PL
(RM
B) p
er y
ear
du
e to
air
po
lluti
on
PL
(RM
B) p
er
epis
od
e p
er y
ear
Tota
l no.
of
emp
loye
d
epis
od
es/
per
son
s-ye
ars
of
life
loss
per
yea
PM
10N
O2
SO2
O3
All
4 p
ollu
tan
ts
by
adju
sted
su
mm
atio
n (T
1)
AB
C =
A *
B *
ER
(a) H
osp
ital
inp
atie
nts
- Pu
blic
C
ardi
ovas
cula
r dis
ease
s87
035
,555
1,08
7,62
3 88
2,81
0 2,
946,
328
30,3
23
3,95
4,81
4
Re
spira
tory
dis
ease
s53
143
,966
1,10
8,22
9 49
2,40
4 1,
563,
342
52,3
98
2,67
5,71
9
Co
st fo
r it
em (a
):2,
195,
852
1,37
5,21
4 4,
509,
670
82,7
21
6,63
0,53
4
(b) H
osp
ital
inp
atie
nts
- Pr
ivat
e
C
ardi
ovas
cula
r dis
ease
s87
033
210
,149
8,
238
27,4
95
283
36,9
06
Re
spira
tory
dis
ease
s53
141
010
,342
4,
595
14,5
89
489
24,9
69
Co
st fo
r it
em (b
):20
,491
12
,833
42
,083
77
2 61
,875
(c) P
rem
atu
re d
eath
Fe
mal
e19
,369
9,17
7,19
910
,068
,085
48,2
63,4
78—
53,8
46,4
35
M
ale
19,3
6919
,990
,646
21,9
31,2
5910
5,13
2,09
4—
117,
293,
422
Co
st fo
r it
em (c
):29
,167
,845
31,9
99,3
4315
3,39
5,57
3—
171,
139,
857
Tota
l pro
du
ctiv
ity
loss
(in
dir
ect h
ealt
h c
are
cost
):
31,3
84,1
8833
,387
,391
157,
947,
326
83,4
9317
7,83
2,26
5
Tota
l dir
ect a
nd
ind
irec
t hea
lth
car
e co
st:
2
33,2
10,2
54
12
5,49
6,65
1
248,
976,
233
4,
555,
902
498,
359,
818

69Appendices
Tabl
e A
.1.5
a: E
stim
ates
of u
nit c
ost,
freq
uenc
y of
hea
lth se
rvic
e ut
ilisa
tion
and
tota
l dire
ct h
ealth
car
e co
st p
er 1
0 µg
/m3
chan
ge in
air
pollu
tant
(s) i
n Ji
angm
en
Hea
lth
car
e co
st (R
MB
) per
yea
r d
ue
to a
ir p
ollu
tio
n
Co
st (R
MB
) per
ep
iso
de/
vis
itTo
tal n
o. o
f ep
iso
des
/ vis
its
per
yea
r
PM
10N
O2
SO2
O3
All
4 p
ollu
tan
ts
by
adju
sted
su
mm
atio
n (T
1)
AB
C =
A *
B *
ER
(a) H
osp
ital
inp
atie
nts
—Pu
blic
C
ardi
ovas
cula
r dis
ease
s10
,541
13,8
952,
696,
073
392,
041
2,96
5,93
6 18
1,61
8 5,
529,
814
Re
spira
tory
dis
ease
s6,
427
17,1
822,
747,
153
218,
668
1,57
3,74
6 31
3,82
9 4,
472,
582
Co
st fo
r it
em (a
):5,
443,
226
610,
709
4,53
9,68
2 49
5,44
7 10
,002
,396
(b) H
osp
ital
inp
atie
nts
—Pr
ivat
e
C
ardi
ovas
cula
r dis
ease
s10
,541
465
90,1
47
13,1
08
99,1
70
6,07
3 18
4,89
7
Re
spira
tory
dis
ease
s6,
427
575
91,8
55
7,31
1 52
,620
10
,493
14
9,54
7
Co
st fo
r it
em (b
):18
2,00
1 20
,420
15
1,79
0 16
,566
33
4,44
3
(c) H
osp
ital
ou
tpat
ien
ts a
nd
A
&E
visi
ts—
Pub
lic
C
ardi
ovas
cula
r dis
ease
s93
701,
587
10,
595,
074
814
,207
8
27,8
42
503
,198
1
2,12
7,48
3
Re
spira
tory
dis
ease
s93
867,
578
13,
101,
794
1,0
06,8
42
1,0
23,7
03
622
,251
1
4,99
6,76
1
Co
st fo
r it
em (c
): 2
3,69
6,86
8 1
,821
,049
1
,851
,545
1
,125
,449
2
7,12
4,24
4
(d) H
osp
ital
ou
tpat
ien
ts—
Priv
ate
Re
spira
tory
dis
ease
s93
27,5
73 4
16,3
92
31,
999
32,
535
19,
776
476
,616
Co
st fo
r it
em (d
): 4
16,3
92
31,
999
32,
535
19,
776
476
,616
Tota
l dir
ect h
ealt
h c
are
cost
: 2
9,73
8,48
7 2
,484
,176
6
,575
,552
1
,657
,237
3
7,93
7,70
0

70Appendices
Tabl
e A
.1.5
b: P
rodu
ctiv
ity lo
ss (P
L) d
ue to
per
10
µg /m
3 ch
ange
in a
ir po
lluta
nt(s
) lev
el in
Jian
gmen
PL
(RM
B) p
er y
ear
du
e to
air
po
lluti
on
PL
(RM
B) p
er
epis
od
e p
er y
ear
Tota
l no.
of
emp
loye
d
epis
od
es/
per
son
s-ye
ars
of
life
loss
per
yea
PM
10N
O2
SO2
O3
All
4 p
ollu
tan
ts
by
adju
sted
su
mm
atio
n (T
1)
AB
C =
A *
B *
ER
(a) H
osp
ital
inp
atie
nts
- Pu
blic
C
ardi
ovas
cula
r dis
ease
s61
39,
639
108,
839
15,8
26
119,
733
7,33
2 22
3,23
6
Re
spira
tory
dis
ease
s37
412
,246
110,
901
8,82
8 63
,531
12
,669
18
0,55
6
Co
st fo
r it
em (a
):21
9,74
0 24
,654
18
3,26
5 20
,001
40
3,79
1
(b) H
osp
ital
inp
atie
nts
- Pr
ivat
e
C
ardi
ovas
cula
r dis
ease
s61
332
23,
639
529
4,00
3 24
5 7,
464
Re
spira
tory
dis
ease
s37
439
93,
708
295
2,12
4 42
4 6,
037
Co
st fo
r it
em (b
):21
9,74
0 24
,654
18
3,26
5 20
,001
40
3,79
1
(c) P
rem
atu
re d
eath
Fe
mal
e13
,653
3,38
0,29
166
4,35
67,
219,
214
—9,
716,
817
M
ale
13,6
536,
987,
099
1,37
3,23
214
,922
,197
—20
,084
,770
Co
st fo
r it
em (c
):10
,367
,390
2,03
7,58
922
,141
,411
—29
,801
,587
Tota
l pro
du
ctiv
ity
loss
(in
dir
ect h
ealt
h c
are
cost
):
10,5
94,4
772,
063,
067
22,3
30,8
0320
,670
30,2
18,8
79
Tota
l dir
ect a
nd
ind
irec
t hea
lth
car
e co
st:
40,
332,
965
4,54
7,24
3
28,
906,
355
1,
677,
907
68,
156,
579

71Appendices
Tabl
e A
.1.6
a: E
stim
ates
of u
nit c
ost,
freq
uenc
y of
hea
lth se
rvic
e ut
ilisa
tion
and
tota
l dire
ct h
ealth
car
e co
st p
er 1
0 µg
/m3
chan
ge in
air
pollu
tant
(s) i
n Zh
aoqi
ng
Hea
lth
car
e co
st (R
MB
) per
yea
r d
ue
to a
ir p
ollu
tio
n
Co
st (R
MB
) per
ep
iso
de/
vis
itTo
tal n
o. o
f ep
iso
des
/ vis
its
per
yea
r
PM
10N
O2
SO2
O3
All
4 p
ollu
tan
ts
by
adju
sted
su
mm
atio
n (T
1)
AB
C =
A *
B *
ER
(a) H
osp
ital
inp
atie
nts
—Pu
blic
C
ardi
ovas
cula
r dis
ease
s7,
291
14,2
022,
241,
360
793,
718
5,20
0,32
8 23
1,95
4 7,
167,
014
Re
spira
tory
dis
ease
s4,
446
17,5
622,
283,
825
442,
711
2,75
9,32
9 40
0,80
8 5,
183,
981
Co
st fo
r it
em (a
):4,
525,
185
1,23
6,42
9 7,
959,
657
632,
762
12,3
50,9
95
(b) H
osp
ital
inp
atie
nts
—Pr
ivat
e
C
ardi
ovas
cula
r dis
ease
s7,
291
475
74,9
43
26,5
39
173,
880
7,75
6 23
9,63
9
Re
spira
tory
dis
ease
s4,
446
587
76,3
63
14,8
03
92,2
62
13,4
02
173,
333
Co
st fo
r it
em (b
):15
1,30
6 41
,342
26
6,14
2 21
,157
41
2,97
2
(c) H
osp
ital
ou
tpat
ien
ts a
nd
A
&E
visi
ts—
Pub
lic
C
ardi
ovas
cula
r dis
ease
s73
717,
093
9
,987
,274
1,8
69,1
01
1,64
5,80
8
72
8,69
4
12,8
64,7
78
Re
spira
tory
dis
ease
s73
886,
753
12
,350
,194
2,3
11,3
17
2,03
5,19
5
90
1,09
8
15,9
08,4
96
Co
st fo
r it
em (c
):
22,
337,
468
4
,180
,417
3,6
81,0
02
1,62
9,79
2
28
,773
,274
(d) H
osp
ital
ou
tpat
ien
ts—
Priv
ate
Re
spira
tory
dis
ease
s73
28,1
82
3
92,5
05
7
3,45
7
64,
681
28,
638
505
,592
Co
st fo
r it
em (d
):
3
92,5
05
7
3,45
7
64,
681
28,
638
505
,592
Tota
l dir
ect h
ealt
h c
are
cost
:
27,4
06,4
64
5
,531
,644
11,
971,
482
2,
312,
350
42
,042
,834

72Appendices
Tabl
e A
.1.6
b: P
rodu
ctiv
ity lo
ss (P
L) d
ue to
per
10
µg /m
3 ch
ange
in a
ir po
lluta
nt(s
) lev
el in
Zha
oqin
g
PL
(RM
B) p
er y
ear
du
e to
air
po
lluti
on
PL
(RM
B) p
er
epis
od
e p
er y
ear
Tota
l no.
of
emp
loye
d
epis
od
es/
per
son
s-ye
ars
of
life
loss
per
yea
PM
10N
O2
SO2
O3
All
4 p
ollu
tan
ts
by
adju
sted
su
mm
atio
n (T
1)
AB
C =
A *
B *
ER
(a) H
osp
ital
inp
atie
nts
- Pu
blic
C
ardi
ovas
cula
r dis
ease
s66
38,
888
127,
526
45,1
60
295,
882
13,1
97
407,
780
Re
spira
tory
dis
ease
s40
410
,991
129,
942
25,1
89
156,
997
22,8
05
294,
952
Co
st fo
r it
em (a
):25
7,46
8 70
,349
45
2,87
9 36
,002
70
2,73
1
(b) H
osp
ital
inp
atie
nts
- Pr
ivat
e
C
ardi
ovas
cula
r dis
ease
s66
329
74,
264
1,51
0 9,
893
441
13,6
35
Re
spira
tory
dis
ease
s40
436
74,
345
842
5,24
9 76
3 9,
862
Co
st fo
r it
em (b
):8,
609
2,35
2 15
,143
1,
204
23,4
97
(c) P
rem
atu
re d
eath
Fe
mal
e14
,753
4,03
1,29
51,
929,
509
18,1
58,0
54—
20,0
75,1
59
M
ale
14,7
538,
044,
510
3,85
0,36
436
,234
,671
—40
,060
,282
Co
st fo
r it
em (c
):12
,075
,804
5,77
9,87
254
,392
,725
—60
,135
,441
Tota
l pro
du
ctiv
ity
loss
(in
dir
ect h
ealt
h c
are
cost
):
12,3
41,8
815,
852,
573
54,8
60,7
4637
,206
60,8
61,6
69
Tota
l dir
ect a
nd
ind
irec
t hea
lth
car
e co
st:
39
,748
,346
11,
384,
217
6
6,83
2,22
9
2,34
9,55
6 10
2,90
4,50
3

73Appendices
Tabl
e A
.1.7
a: E
stim
ates
of u
nit c
ost,
freq
uenc
y of
hea
lth se
rvic
e ut
ilisa
tion
and
tota
l dire
ct h
ealth
car
e co
st p
er 1
0 µg
/m3
chan
ge in
air
pollu
tant
(s) i
n H
uizh
ou
Hea
lth
car
e co
st (R
MB
) per
yea
r d
ue
to a
ir p
ollu
tio
n
Co
st (R
MB
) per
ep
iso
de/
vis
itTo
tal n
o. o
f ep
iso
des
/ vis
its
per
yea
r
PM
10N
O2
SO2
O3
All
4 p
ollu
tan
ts
by
adju
sted
su
mm
atio
n (T
1)
AB
C =
A *
B *
ER
(a) H
osp
ital
inp
atie
nts
—Pu
blic
C
ardi
ovas
cula
r dis
ease
s9,
858
10,5
683,
202,
538
12,6
75
375,
043
354,
207
3,87
6,97
8
Re
spira
tory
dis
ease
s6,
011
13,0
683,
263,
214
7,07
0 19
9,00
0 61
2,05
7 4,
045,
330
Co
st fo
r it
em (a
):6,
465,
752
19,7
45
574,
043
966,
265
7,92
2,30
8
(b) H
osp
ital
inp
atie
nts
—Pr
ivat
e
C
ardi
ovas
cula
r dis
ease
s9,
858
353
107,
081
424
12,5
40
11,8
43
129,
632
Re
spira
tory
dis
ease
s6,
011
437
109,
110
236
6,65
4 20
,465
13
5,26
1
Co
st fo
r it
em (b
):21
6,19
1 66
0 19
,194
32
,308
26
4,89
3
(c) H
osp
ital
ou
tpat
ien
ts a
nd
A
&E
visi
ts—
Pub
lic
C
ardi
ovas
cula
r dis
ease
s12
253
3,60
7 1
7,75
6,12
7
37,
139
147,
689
1,
384,
584
1
9,27
9,99
7
Re
spira
tory
dis
ease
s12
265
9,85
5 2
1,95
7,10
4
45,
926
182,
631
1,
712,
167
2
3,84
1,51
1
Co
st fo
r it
em (c
): 3
9,71
3,23
1
83,
066
330,
320
3,
096,
752
4
3,12
1,50
8
(d) H
osp
ital
ou
tpat
ien
ts—
Priv
ate
Re
spira
tory
dis
ease
s12
220
,971
697
,825
1,
460
5,
804
54,
415
75
7,71
4
Co
st fo
r it
em (d
):
6
97,8
25
1,46
0
5,8
04
54,
415
75
7,71
4
Tota
l dir
ect h
ealt
h c
are
cost
: 4
7,09
2,99
9
104,
930
929,
362
4,
149,
740
5
2,06
6,42
4

74Appendices
Tabl
e A
.1.7
b: P
rodu
ctiv
ity lo
ss (P
L) d
ue to
per
10
µg /m
3 ch
ange
in a
ir po
lluta
nt(s
) lev
el in
Hui
zhou
PL
(RM
B) p
er y
ear
du
e to
air
po
lluti
on
PL
(RM
B) p
er
epis
od
e p
er y
ear
Tota
l no.
of
emp
loye
d
epis
od
es/
per
son
s-ye
ars
of
life
loss
per
yea
PM
10N
O2
SO2
O3
All
4 p
ollu
tan
ts
by
adju
sted
su
mm
atio
n (T
1)
AB
C =
A *
B *
ER
(a) H
osp
ital
inp
atie
nts
- Pu
blic
C
ardi
ovas
cula
r dis
ease
s63
77,
465
146,
162
578
17,1
17
16,1
66
176,
943
Re
spira
tory
dis
ease
s38
89,
231
148,
931
323
9,08
2 27
,934
18
4,62
6
Co
st fo
r it
em (a
):29
5,09
3 90
1 26
,199
44
,100
36
1,56
9
(b) H
osp
ital
inp
atie
nts
- Pr
ivat
e
C
ardi
ovas
cula
r dis
ease
s63
725
04,
887
19
572
541
5,91
6
Re
spira
tory
dis
ease
s38
830
94,
980
11
304
934
6,17
3
Co
st fo
r it
em (b
):9,
867
30
876
1,47
5 12
,090
(c) P
rem
atu
re d
eath
Fe
mal
e14
,176
4,42
8,15
423
,688
1,00
6,73
5—
5,28
3,52
3
M
ale
14,1
769,
607,
262
51,3
932,
184,
199
—11
,463
,061
Co
st fo
r it
em (c
):14
,035
,416
75,0
813,
190,
934
—16
,746
,584
Tota
l pro
du
ctiv
ity
loss
(in
dir
ect h
ealt
h c
are
cost
):
14,3
40,3
7676
,012
3,21
8,00
945
,574
17,1
20,2
42
Tota
l dir
ect a
nd
ind
irec
t hea
lth
car
e co
st:
61,
433,
375
18
0,94
2
4,
147,
371
4,
195,
314
69,
186,
666

75Appendices
Tabl
e A
.1.8
a: E
stim
ates
of u
nit c
ost,
freq
uenc
y of
hea
lth se
rvic
e ut
ilisa
tion
and
tota
l dire
ct h
ealth
car
e co
st p
er 1
0 µg
/m3
chan
ge in
air
pollu
tant
(s) i
n D
ongg
uan
Hea
lth
car
e co
st (R
MB
) per
yea
r d
ue
to a
ir p
ollu
tio
n
Co
st (R
MB
) per
ep
iso
de/
vis
itTo
tal n
o. o
f ep
iso
des
/ vis
its
per
yea
r
PM
10N
O2
SO2
O3
All
4 p
ollu
tan
ts
by
adju
sted
su
mm
atio
n (T
1)
AB
C =
A *
B *
ER
(a) H
osp
ital
inp
atie
nts
—Pu
blic
C
ardi
ovas
cula
r dis
ease
s8,
622
5,83
81,
379,
601
600,
508
2,91
1,39
9 17
7,43
8 4,
248,
823
Re
spira
tory
dis
ease
s5,
257
7,21
91,
405,
739
334,
944
1,54
4,80
8 30
6,60
6 3,
147,
311
Co
st fo
r it
em (a
):2,
785,
340
935,
452
4,45
6,20
8 48
4,04
3 7,
396,
134
(b) H
osp
ital
inp
atie
nts
—Pr
ivat
e
C
ardi
ovas
cula
r dis
ease
s8,
622
195
46,1
29
20,0
79
97,3
46
5,93
3 14
2,06
5
Re
spira
tory
dis
ease
s5,
257
241
47,0
03
11,1
99
51,6
53
10,2
52
105,
235
Co
st fo
r it
em (b
):93
,132
31
,278
14
8,99
9 16
,185
24
7,30
0
(c) H
osp
ital
ou
tpat
ien
ts a
nd
A
&E
visi
ts—
Pub
lic
C
ardi
ovas
cula
r dis
ease
s67
294,
751
5
,006
,855
1,1
51,7
58
75
0,45
8
45
4,01
0
6,
563,
470
Re
spira
tory
dis
ease
s67
364,
487
6
,191
,442
1,4
24,2
56
92
8,01
1
56
1,42
5
8,
116,
342
Co
st fo
r it
em (c
): 1
1,19
8,29
7
2,5
76,0
15
1,67
8,46
9
1,01
5,43
5
14,
679,
812
(d) H
osp
ital
ou
tpat
ien
ts—
Priv
ate
Re
spira
tory
dis
ease
s67
11,5
84
1
96,7
72
4
5,26
5
29,
493
17,
843
25
7,94
8
Co
st fo
r it
em (d
):
1
96,7
72
4
5,26
5
29,
493
17,
843
25
7,94
8
Tota
l dir
ect h
ealt
h c
are
cost
: 1
4,27
3,54
1
3,5
88,0
10
6,31
3,16
9
1,53
3,50
6
22,
581,
193

76Appendices
Tabl
e A
.1.8
b: P
rodu
ctiv
ity lo
ss (P
L) d
ue to
per
10
µg /m
3 ch
ange
in a
ir po
lluta
nt(s
) lev
el in
Don
ggua
n
PL
(RM
B) p
er y
ear
du
e to
air
po
lluti
on
PL
(RM
B) p
er
epis
od
e p
er y
ear
Tota
l no.
of
emp
loye
d
epis
od
es/
per
son
s-ye
ars
of
life
loss
per
yea
PM
10N
O2
SO2
O3
All
4 p
ollu
tan
ts
by
adju
sted
su
mm
atio
n (T
1)
AB
C =
A *
B *
ER
(a) H
osp
ital
inp
atie
nts
- Pu
blic
C
ardi
ovas
cula
r dis
ease
s1,
133
4,09
812
7,22
4 55
,378
26
8,48
3 16
,363
39
1,81
7
Re
spira
tory
dis
ease
s69
15,
068
129,
634
30,8
88
142,
459
28,2
75
290,
238
Co
st fo
r it
em (a
):25
6,85
8 86
,265
41
0,94
2 44
,637
68
2,05
5
(b) H
osp
ital
inp
atie
nts
- Pr
ivat
e
C
ardi
ovas
cula
r dis
ease
s1,
133
137
4,25
4 1,
852
8,97
7 54
7 13
,101
Re
spira
tory
dis
ease
s69
116
94,
334
1,03
3 4,
763
945
9,70
4
Co
st fo
r it
em (b
):8,
588
2,88
4 13
,740
1,
493
22,8
05
(c) P
rem
atu
re d
eath
Fe
mal
e25
,207
3,95
1,28
12,
324,
614
16,1
87,9
47—
18,5
02,2
48
M
ale
25,2
078,
167,
342
4,80
5,00
233
,460
,669
—38
,244
,355
Co
st fo
r it
em (c
):12
,118
,623
7,12
9,61
649
,648
,616
—56
,746
,603
Tota
l pro
du
ctiv
ity
loss
(in
dir
ect h
ealt
h c
are
cost
):
12,3
84,0
707,
218,
766
50,0
73,2
9846
,130
57,4
51,4
64
Tota
l dir
ect a
nd
ind
irec
t hea
lth
car
e co
st:
26,
657,
611
1
0,80
6,77
6
56,
386,
467
1,
579,
636
80,
032,
657
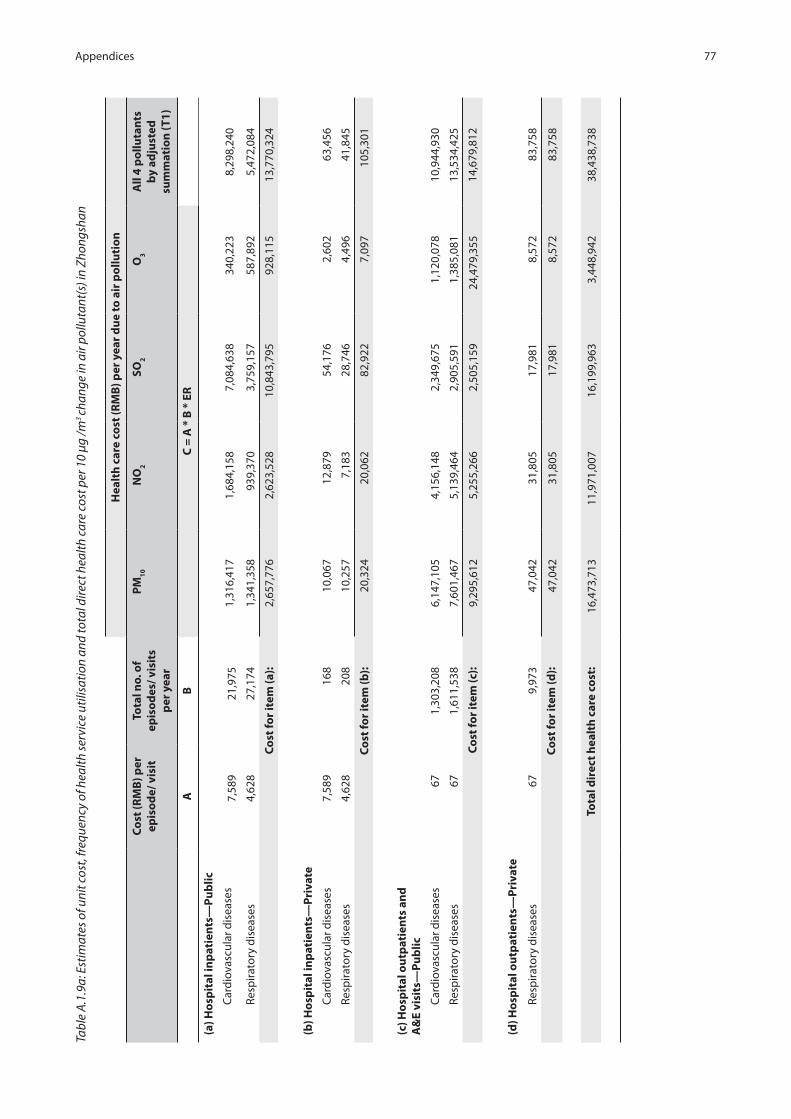
77Appendices
Tabl
e A
.1.9
a: E
stim
ates
of u
nit c
ost,
freq
uenc
y of
hea
lth se
rvic
e ut
ilisa
tion
and
tota
l dire
ct h
ealth
car
e co
st p
er 1
0 µg
/m3
chan
ge in
air
pollu
tant
(s) i
n Zh
ongs
han
Hea
lth
car
e co
st (R
MB
) per
yea
r d
ue
to a
ir p
ollu
tio
n
Co
st (R
MB
) per
ep
iso
de/
vis
itTo
tal n
o. o
f ep
iso
des
/ vis
its
per
yea
r
PM
10N
O2
SO2
O3
All
4 p
ollu
tan
ts
by
adju
sted
su
mm
atio
n (T
1)
AB
C =
A *
B *
ER
(a) H
osp
ital
inp
atie
nts
—Pu
blic
C
ardi
ovas
cula
r dis
ease
s7,
589
21,9
751,
316,
417
1,68
4,15
8 7,
084,
638
340,
223
8,29
8,24
0
Re
spira
tory
dis
ease
s4,
628
27,1
741,
341,
358
939,
370
3,75
9,15
7 58
7,89
2 5,
472,
084
Co
st fo
r it
em (a
):2,
657,
776
2,62
3,52
8 10
,843
,795
92
8,11
5 13
,770
,324
(b) H
osp
ital
inp
atie
nts
—Pr
ivat
e
C
ardi
ovas
cula
r dis
ease
s7,
589
168
10,0
67
12,8
79
54,1
76
2,60
2 63
,456
Re
spira
tory
dis
ease
s4,
628
208
10,2
57
7,18
3 28
,746
4,
496
41,8
45
Co
st fo
r it
em (b
):20
,324
20
,062
82
,922
7,
097
105,
301
(c) H
osp
ital
ou
tpat
ien
ts a
nd
A
&E
visi
ts—
Pub
lic
C
ardi
ovas
cula
r dis
ease
s67
1,30
3,20
8
6,1
47,1
05
4
,156
,148
2,3
49,6
75
1,
120,
078
1
0,94
4,93
0
Re
spira
tory
dis
ease
s67
1,61
1,53
8
7,6
01,4
67
5
,139
,464
2,9
05,5
91
1,
385,
081
1
3,53
4,42
5
Co
st fo
r it
em (c
):
9,2
95,6
12
5
,255
,266
2,50
5,15
9
24,
479,
355
1
4,67
9,81
2
(d) H
osp
ital
ou
tpat
ien
ts—
Priv
ate
Re
spira
tory
dis
ease
s67
9,97
3
4
7,04
2
31,
805
17
,981
8,57
2
83,
758
Co
st fo
r it
em (d
):
4
7,04
2
31,
805
17
,981
8,57
2
83,
758
Tota
l dir
ect h
ealt
h c
are
cost
: 1
6,47
3,71
3
11,9
71,0
07
16,
199,
963
3,
448,
942
3
8,43
8,73
8

78Appendices
Tabl
e A
.1.9
b: P
rodu
ctiv
ity lo
ss (P
L) d
ue to
per
10
µg /m
3 ch
ange
in a
ir po
lluta
nt(s
) lev
el in
Zho
ngsh
an
PL
(RM
B) p
er y
ear
du
e to
air
po
lluti
on
PL
(RM
B) p
er
epis
od
e p
er y
ear
Tota
l no.
of
emp
loye
d
epis
od
es/
per
son
s-ye
ars
of
life
loss
per
yea
PM
10N
O2
SO2
O3
All
4 p
ollu
tan
ts
by
adju
sted
su
mm
atio
n (T
1)
AB
C =
A *
B *
ER
(a) H
osp
ital
inp
atie
nts
- Pu
blic
C
ardi
ovas
cula
r dis
ease
s1,
002
17,6
2013
9,36
9 17
8,30
2 75
0,05
3 36
,019
87
8,53
7
Re
spira
tory
dis
ease
s86
821
,789
142,
010
99,4
51
397,
983
62,2
40
579,
331
Co
st fo
r it
em (a
):28
1,37
9 27
7,75
4 1,
148,
036
98,2
60
1,45
7,86
8
(b) H
osp
ital
inp
atie
nts
- Pr
ivat
e
C
ardi
ovas
cula
r dis
ease
s1,
002
135
1,06
6 1,
363
5,73
6 27
5 6,
718
Re
spira
tory
dis
ease
s86
816
71,
086
760
3,04
3 47
6 4,
430
Co
st fo
r it
em (b
):2,
152
2,12
4 8,
779
751
11,1
48
(c) P
rem
atu
re d
eath
Fe
mal
e22
,302
990,
334
1,71
2,45
310
,346
,929
—10
,383
,861
M
ale
22,3
022,
045,
395
3,53
6,82
821
,370
,114
—21
,446
,390
Co
st fo
r it
em (c
):3,
035,
729
5,24
9,28
131
,717
,044
—31
,830
,251
Tota
l pro
du
ctiv
ity
loss
(in
dir
ect h
ealt
h c
are
cost
):
3,31
9,26
05,
529,
159
32,8
73,8
5899
,011
33,2
99,2
68
Tota
l dir
ect a
nd
ind
irec
t hea
lth
car
e co
st:
19,
792,
973
1
7,50
0,16
6
49,
073,
822
3,
547,
953
71,
738,
005

79Appendices
Tabl
e A
.1.1
0a: E
stim
ates
of u
nit c
ost,
freq
uenc
y of
hea
lth se
rvic
e ut
ilisa
tion
and
tota
l dire
ct h
ealth
car
e co
st p
er 1
0 µg
/m3
chan
ge in
air
pollu
tant
(s) i
n M
SAR
Hea
lth
car
e co
st (H
K$)
per
yea
r d
ue
to a
ir p
ollu
tio
n
Co
st (H
K$)
per
ep
iso
de/
vis
itTo
tal n
o. o
f ep
iso
des
/ vis
its
per
yea
r
PM
10N
O2
SO2
O3
All
4 p
ollu
tan
ts
by
adju
sted
su
mm
atio
n (T
1)
AB
C =
A *
B *
ER
(a) H
osp
ital
inp
atie
nts
—Pu
blic
C
ardi
ovas
cula
r dis
ease
s
Fem
ale
and
Mal
e15
,339
572
172,
227
68,9
3197
,164
7,70
328
9,81
0
Re
spira
tory
dis
ease
s
Fem
ale
and
Mal
e23
,983
839
533,
768
116,
942
156,
811
40,4
8675
3,92
2
Co
st fo
r it
em (a
):70
5,99
518
5,87
325
3,97
548
,189
1,04
3,73
2
(b) H
osp
ital
inp
atie
nts
—Pr
ivat
e
C
ardi
ovas
cula
r dis
ease
s15
,339
1,17
335
3,18
614
1,35
719
9,25
415
,797
594,
313
Re
spira
tory
dis
ease
s23
,983
1,50
895
9,38
321
0,18
928
1,84
972
,769
1,35
5,08
2
Co
st fo
r it
em (b
):1,
312,
569
351,
546
481,
103
88,5
661,
949,
395

80Appendices
Tabl
e A
.1.1
0a: (
cont
inue
d)
Hea
lth
car
e co
st (H
K$)
per
yea
r d
ue
to a
ir p
ollu
tio
n
Co
st (H
K$)
per
ep
iso
de/
vis
itTo
tal n
o. o
f ep
iso
des
/ vis
its
per
yea
r
PM
10N
O2
SO2
O3
All
4 p
ollu
tan
ts
by
adju
sted
su
mm
atio
n (T
1)
AB
C =
A *
B *
ER
(c) P
ub
lic h
osp
ital
an
d o
ther
o
utp
atie
nt v
isit
s
S. J
anua
rio H
osp
ital
Car
diov
ascu
lar
dise
ases
1,23
8,60
6
Resp
irato
ryD
isea
ses
1,08
2,77
4
Car
diov
ascu
lar
dise
ases
261,
987
Resp
irato
ryD
isea
ses
229,
025
Car
diov
ascu
lar
Dis
ease
s49
,631
Resp
irato
ryD
isea
ses
43,3
86
Car
diov
ascu
lar
dise
ases
39,0
58
Resp
irato
ryD
isea
ses
34,1
44
Car
diov
ascu
lar
dise
ases
1,42
6,76
9
Resp
irato
ryD
isea
ses
1,24
7,26
3
Ca
rdio
vasc
ular
dis
ease
s36
610
,888
Re
spira
tory
dis
ease
s36
64,
623
Pub
lic h
ealt
h ca
re c
entr
es a
nd
othe
r est
ablis
hmen
ts
Ca
rdio
vasc
ular
dis
ease
s36
614
8
Re
spira
tory
dis
ease
s36
635
A&
E in
S. J
anua
rio H
osp
ital
Car
diov
ascu
lar d
isea
ses
531
5,80
5
Re
spira
tory
dis
ease
s53
18,
515
Co
st fo
r it
em (c
):2,
321,
380
491,
012
93,0
1773
,203
2,67
4,03
2
(d) H
osp
ital
ou
tpat
ien
ts—
Priv
ate
Car
diov
ascu
lar
Dis
ease
s38
9,51
3
Resp
irato
ryD
isea
ses
599,
581
Car
diov
ascu
lar
Dis
ease
s82
,389
Resp
irato
ryD
isea
ses
126,
822
Car
diov
ascu
lar
Dis
ease
s15
,608
Resp
irato
ryD
isea
ses
24,0
25
Car
diov
ascu
lar
Dis
ease
s12
,283
Resp
irato
ryD
isea
ses
18,9
07
Car
diov
ascu
lar
Dis
ease
s44
8,68
6
Resp
irato
ryD
isea
ses
690,
666
A&
E in
Kia
ng W
u H
osp
ital
Ca
rdio
vasc
ular
dis
ease
s53
14,
218
Re
spira
tory
dis
ease
s53
16,
187
Priv
ate
clin
ics,
cen
tres
for a
uxili
ary
diag
nost
ic e
xam
inat
ions
and
oth
er
esta
blis
hmen
ts
Re
spira
tory
dis
ease
s15
21,
069
Co
st fo
r it
em (d
): 9
59,0
94
209,
211
39,6
33
31,1
90
1,13
9,35
2
Tota
l dir
ect h
ealt
h c
are
cost
: 5
,329
,038
1
,237
,642
8
67,7
27
241
,149
6
,806
,511

81Appendices
A.1
.10b
: Pro
duct
ivity
loss
(PL)
due
to p
er 1
0 µg
/m3
chan
ge in
air
pollu
tant
(s) l
evel
in M
SAR
PL
(HK
$) p
er y
ear
du
e to
air
po
lluti
on
PL
(HK
$) p
er
epis
od
e p
er y
ear
Tota
l no.
of
emp
loye
d
epis
od
es/
per
son
s-ye
ars
of
life
loss
per
yea
PM
10N
O2
SO2
O3
All
4 p
ollu
tan
ts
by
adju
sted
su
mm
atio
n (T
1)
AB
C =
A *
B *
ER
(a) H
osp
ital
inp
atie
nts
- Pu
blic
C
ardi
ovas
cula
r dis
ease
s1,
279
198
4,97
31,
990
2,80
622
28,
368
Re
spira
tory
dis
ease
s2,
000
290
15,4
123,
377
4,52
81,
169
21,7
69
Co
st fo
r it
em (a
):20
,385
5,36
77,
334
1,39
130
,137
(b) H
osp
ital
inp
atie
nts
- Pr
ivat
e
C
ardi
ovas
cula
r dis
ease
s24
32,
140
10,1
984,
082
5,75
345
617
,161
Re
spira
tory
dis
ease
s24
34,
302
27,7
026,
069
8,13
82,
101
39,1
27
Co
st fo
r it
em (b
):37
,900
10,1
5113
,891
2,55
756
,288
(c) P
rem
atu
re d
eath
Fe
mal
e73
,440
1,19
14,
455,
045
2,40
9,98
64,
879,
336
—9,
541,
782
M
ale
102,
276
2,56
6
Co
st fo
r it
em (c
):3,
035,
729
5,24
9,28
131
,717
,044
—31
,830
,251
Tota
l pro
du
ctiv
ity
loss
(in
dir
ect h
ealt
h c
are
cost
):
4,45
5,04
52,
409,
986
4,87
9,33
6—
9,54
1,78
2
Tota
l dir
ect a
nd
ind
irec
t hea
lth
car
e co
st:
9
,842
,368
3,
663,
146
5,76
8,28
8
2
45,0
98
16,
434,
718

82Appendices
Tabl
e A
.1.1
1a: E
stim
ates
of u
nit c
ost,
freq
uenc
y of
hea
lth se
rvic
e ut
ilisa
tion
and
tota
l dire
ct h
ealth
car
e co
st p
er 1
0 µg
/m3
chan
ge in
air
pollu
tant
(s) i
n H
ong
Kong
Hea
lth
car
e co
st (H
K$)
per
yea
r d
ue
to a
ir p
ollu
tio
n
Co
st (H
K$)
per
ep
iso
de/
vis
itTo
tal n
o. o
f ep
iso
des
/ vis
its
per
yea
r
PM
10N
O2
SO2
O3
All
4 p
ollu
tan
ts
by
adju
sted
su
mm
atio
n (T
1)
AB
C =
A *
B *
ER
(a) H
osp
ital
inp
atie
nts
—Pu
blic
Car
diov
ascu
lar d
isea
ses
i.
Acu
te G
ener
al
Fem
ale
15,1
6460
,592
11,8
53,9
21
11,4
39,7
24
2,80
3,29
6 34
9,14
9 19
,248
,125
Mal
e14
,844
62,9
0812
,047
,171
11
,626
,221
2,
848,
997
354,
841
19,5
61,9
20
ii.
Chr
onic
Infir
mar
y
Fem
ale
50,0
707,
003
4,52
3,71
2 4,
365,
645
1,06
9,79
8 13
3,24
3 7,
345,
500
Mal
e54
,289
6,17
34,
323,
566
4,17
2,49
3 1,
022,
467
127,
348
7,02
0,50
8
Resp
irato
ry d
isea
ses
i.
Acu
te G
ener
al
Fem
ale
16,2
7043
,595
12,3
65,9
01
6,53
2,53
7 1,
522,
840
617,
671
16,9
41,0
99
Mal
e15
,746
67,3
8418
,498
,280
9,
772,
090
2,27
8,03
2 92
3,98
1 25
,342
,365
ii.
Chr
onic
Infir
mar
y4,
234,
605
2,23
7,01
652
1,48
521
1,51
75,
801,
345
Fem
ale
43,3
345,
605
7,58
4,80
6 4,
006,
827
934,
056
378,
858
10,3
91,0
70
Mal
e40
,996
10,6
1218
,498
,280
9,
772,
090
2,27
8,03
2 92
3,98
1 25
,342
,365
Co
st fo
r it
em (a
):75
,431
,961
54
,152
,554
13
,000
,972
3,
096,
606
111,
651,
930
(b) H
osp
ital
inp
atie
nts
—Pr
ivat
e
Car
diov
ascu
lar d
isea
ses
2,91
1 (p
er b
ed-d
ay)
61,9
71(b
ed-d
ays)
2,32
7,38
2 2,
246,
059
550,
395
68,5
51
3,77
9,15
0
Resp
irato
ry d
isea
ses
2,91
1 (p
er b
ed-d
ay)
59,8
28(b
ed-d
ays)
3,03
6,32
4 1,
604,
000
373,
918
151,
663
4,15
9,71
8
Co
st fo
r it
em (b
):5,
363,
706
3,85
0,05
9 92
4,31
3 22
0,21
4 7,
938,
868

83Appendices
Hea
lth
car
e co
st (H
K$)
per
yea
r d
ue
to a
ir p
ollu
tio
n
Co
st (H
K$)
per
ep
iso
de/
vis
itTo
tal n
o. o
f ep
iso
des
/ vis
its
per
yea
r
PM
10N
O2
SO2
O3
All
4 p
ollu
tan
ts
by
adju
sted
su
mm
atio
n (T
1)
AB
C =
A *
B *
ER
(c) A
ccid
ent a
nd
Em
erg
ency
Vis
it
Car
diov
ascu
lar d
isea
ses
531
276,
593
16,7
85,6
11
8,56
0,94
7 28
1,94
0 34
8,57
3 20
,881
,001
Resp
irato
ry d
isea
ses
531
297,
991
18,0
84,1
63
9,22
3,23
0 30
3,75
2 37
5,53
9 22
,496
,378
Co
st fo
r it
em (c
):34
,869
,774
17
,784
,177
58
5,69
2 72
4,11
1 43
,377
,379
(d) S
pec
ial O
utp
atie
nt C
linic
Vis
it
Car
diov
ascu
lar d
isea
ses
i.
Med
icin
e61
322
2,80
515
,628
,869
7,
970,
989
262,
511
324,
552
19,4
42,0
36
ii.
Sur
gery
613
101,
035
7,08
7,22
4 3,
614,
605
119,
041
147,
174
8,81
6,38
1
Resp
irato
ry d
isea
ses
i.
Med
icin
e61
324
0,04
116
,837
,935
8,
587,
633
282,
819
349,
659
20,9
46,0
92
ii.
Sur
gery
613
108,
851
7,63
5,49
9 3,
894,
234
128,
250
158,
560
9,49
8,42
6
Co
st fo
r it
em (d
)47
,189
,528
24
,067
,461
79
2,62
1 97
9,94
5 58
,702
,934
(e) G
ener
al O
utp
atie
nt C
linic
Vis
it
Car
diov
ascu
lar d
isea
ses
i.
Dep
artm
ent o
f Hea
lth
204
92,6
642,
156,
359
1,09
9,78
0 36
,219
44
,779
2,
682,
472
ii.
Hos
pita
l Aut
horit
y28
171
2,63
222
,873
,434
11
,665
,840
38
4,19
5 47
4,99
3 28
,454
,146
Resp
irato
ry d
isea
ses
i.
Dep
artm
ent o
f Hea
lth
204
99,8
112,
323,
177
1,18
4,86
0 39
,021
48
,243
2,
889,
991
ii.
Hos
pita
l Aut
horit
y28
176
7,76
224
,642
,947
12
,568
,322
41
3,91
6 51
1,73
9 30
,655
,389
Co
st fo
r it
em (e
):51
,995
,917
26
,518
,801
87
3,35
2 1,
079,
756
64,6
81,9
97
(f) P
riva
te G
ener
al P
ract
itio
ner V
isit
Resp
irato
ry d
isea
ses
152
25,5
61,4
3144
4,08
2,96
5 22
6,48
9,85
4 7,
459,
061
9,22
1,90
0 55
2,43
1,31
6
Co
st fo
r it
em (f
):44
4,08
2,96
5 22
6,48
9,85
4 7,
459,
061
9,22
1,90
0 55
2,43
1,31
6
To
tal d
irec
t hea
lth
car
e co
st:
658,
933,
852
352,
862,
904
23,6
36,0
11
15,3
22,5
32
838,
784,
424
Tabl
e A
.1.1
1a: (
cont
inue
d)

84Appendices
A.1
.11b
: Pro
duct
ivity
loss
(PL)
due
to p
er 1
0 µg
/m3
chan
ge in
air
pollu
tant
(s) l
evel
in H
ong
Kong
PL
(HK
$) p
er y
ear
du
e to
air
po
lluti
on
PL
(HK
$) p
er
epis
od
e p
er y
ear
Tota
l no.
of
emp
loye
d
epis
od
es/
per
son
s-ye
ars
of
life
loss
per
yea
PM
10N
O2
SO2
O3
All
4 p
ollu
tan
ts
by
adju
sted
su
mm
atio
n (T
1)
AB
C =
A *
B *
ER
(a) H
osp
ital
inp
atie
nts
—Pu
blic
Car
diov
ascu
lar d
isea
ses
i.
Acu
te G
ener
al
Fem
ale
1,82
49,
351
220,
005
212,
317
52,0
286,
480
357,
238
Mal
e2,
195
13,1
3937
2,08
735
9,08
687
,994
10,9
6060
4,18
7
i.
Chr
onic
Infir
mar
y
Fem
ale
9,37
446
856
,635
54,6
5613
,393
1,66
891
,962
Mal
e9,
074
754
88,2
5985
,175
20,8
722,
600
143,
313
Resp
irato
ry d
isea
ses
ii.
Acu
te G
ener
al
Fem
ale
2,44
46,
471
275,
734
145,
662
33,9
5613
,773
377,
752
Mal
e2,
144
10,8
0640
3,95
821
3,39
949
,747
20,1
7855
3,41
7
ii.
Chr
onic
Infir
mar
y
Fem
ale
7,89
222
631
,104
16,4
313,
830
1,55
442
,612
Mal
e5,
408
793
74,7
5239
,489
9,20
63,
734
102,
409
Co
st fo
r it
em (a
):1,
522,
534
1,12
6,21
627
1,02
660
,945
2,27
2,89
0

85Appendices
A.1
.11b
: (c
ontin
ued)
PL
(HK
$) p
er y
ear
du
e to
air
po
lluti
on
PL
(HK
$) p
er
epis
od
e p
er y
ear
Tota
l no.
of
emp
loye
d
epis
od
es/
per
son
s-ye
ars
of
life
loss
per
yea
PM
10N
O2
SO2
O3
All
4 p
ollu
tan
ts
by
adju
sted
su
mm
atio
n (T
1)
AB
C =
A *
B *
ER
(b) H
osp
ital
inp
atie
nts
—Pr
ivat
e
Car
diov
ascu
lar d
isea
ses
500
(per
day
)9,
960
64,2
2461
,980
15,1
881,
892
104,
286
Resp
irato
ry d
isea
ses
500
(per
day
)6,
946
60,5
2431
,973
7,45
33,
023
82,9
17
Co
st fo
r it
em (b
):12
4,74
893
,953
22,6
424,
915
187,
203
(c) P
rem
atu
re D
eath
Fe
mal
e15
3,01
9 (p
er y
ear)
21,0
8927
,005
,092
35,2
24,6
5712
,398
,190
—51
,861
,681
M
ale
206,
494
(per
yea
r)61
,304
105,
935,
769
138,
179,
536
48,6
35,7
08—
203,
443,
374
Co
st fo
r it
em (c
):13
2,94
0,86
117
3,40
4,19
361
,033
,898
—25
5,30
5,05
5
Tota
l pro
du
ctiv
ity
loss
:13
4,58
8,14
417
4,62
4,36
261
,327
,567
65,8
6025
7,76
5,14
8
Tota
l dir
ect a
nd
ind
irec
t co
st:
793,
521,
996
527,
487,
267
84,9
63,5
7715
,388
,392
1,09
6,54
9,57
2

86Appendices
Tabl
e A
.2.1
: Cos
t sum
mar
y of
dire
ct a
nd in
dire
ct h
ealth
car
e co
st fo
r who
le p
opul
atio
n in
PRD
and
HK
(incl
udin
g m
alig
nant
neo
plas
ms)
PR
D (R
MB
)H
K$
GZ
SZZ
HFS
JMZQ
HZ
DG
ZS
Wh
ole
PR
DO
vera
ll 9
pre
fect
ure
sH
K
1. D
irec
t hea
lth
car
e co
st p
er y
ear
du
e to
air
po
lluti
on
PM
1074
,410
,645
3,32
5,72
31,
867,
269
51,9
04,9
928,
960,
231
7,81
3,54
212
,241
,929
4,45
6,81
04,
577,
157
169,
558,
299
18,8
39,8
1116
7,19
4,34
1
N
O2
21,9
19,2
232,
562,
190
1,86
1,29
432
,109
,275
1,00
0,03
72,
117,
589
36,8
871,
491,
630
4,48
2,09
867
,580
,222
7,50
8,91
410
7,62
0,27
8
SO
212
0,34
7,49
21,
437,
064
7,41
6,48
610
1,97
3,64
77,
186,
781
13,1
86,6
491,
038,
407
6,86
7,26
217
,926
,075
277,
379,
863
30,8
19,9
8525
,288
,523
O
38,
093,
355
590,
751
654,
871
1,99
4,38
982
7,93
41,
111,
414
1,86
7,85
378
5,26
81,
625,
430
17,5
51,2
651,
950,
141
7,44
1,96
6
Tota
l 4
pol
luta
nts*
192,
582,
775
6,17
4,10
69,
515,
119
152,
722,
047
16,2
35,0
7620
,869
,953
14,9
97,1
6811
,622
,146
23,0
98,1
5044
7,81
6,54
049
,757
,393
240,
002,
981
2. In
dir
ect h
ealt
h c
are
cost
per
yea
r d
ue
to a
ir p
ollu
tio
n
PM
1071
,792
,017
14,5
78,1
991,
696,
407
31,4
07,6
7810
,596
,884
12,3
44,7
0114
,343
,608
12,3
86,8
833,
322,
265
172,
468,
644
19,1
63,1
8313
4,60
8,73
5
N
O2
37,0
49,4
3112
,331
,598
2,86
1,31
333
,444
,621
2,06
4,11
75,
855,
571
76,0
507,
222,
441
5,54
0,69
910
6,44
5,84
111
,827
,316
174,
663,
286
SO
230
4,15
4,67
410
3,69
217
,075
,247
157,
947,
326
22,3
30,8
0354
,860
,746
3,21
8,00
950
,073
,298
32,8
73,8
5864
2,63
7,65
471
,404
,184
61,3
27,5
67
O
331
2,26
937
,007
,455
34,9
6483
,493
20,6
7037
,206
45,5
7446
,130
99,0
1137
,686
,773
4,18
7,41
965
,860
Tota
l 4
pol
luta
nts*
342,
784,
479
26,9
94,6
5317
,247
,717
177,
879,
220
30,2
21,7
1760
,865
,718
17,1
23,4
9057
,455
,785
33,3
07,0
0476
3,87
9,78
384
,875
,531
257,
801,
698
3. T
ota
l hea
lth
car
e co
st p
er y
ear
du
e to
air
po
lluti
on
PM
1014
6,20
2,66
217
,903
,923
3,56
3,67
783
,312
,670
19,5
57,1
1520
,158
,244
26,5
85,5
3716
,843
,693
7,89
9,42
234
2,02
6,94
338
,002
,994
301,
803,
076
N
O2
58,9
68,6
5314
,893
,788
4,72
2,60
665
,553
,895
3,06
4,15
57,
973,
159
112,
937
8,71
4,07
110
,022
,797
174,
026,
063
19,3
36,2
2928
2,28
3,56
4
SO
242
4,50
2,16
61,
540,
756
24,4
91,7
3325
9,92
0,97
329
,517
,584
68,0
47,3
954,
256,
415
56,9
40,5
6150
,799
,933
920,
017,
517
102,
224,
169
86,6
16,0
89
O
38,
405,
624
37,5
98,2
0668
9,83
52,
077,
883
848,
604
1,14
8,62
01,
913,
427
831,
398
1,72
4,44
255
,238
,038
6,13
7,56
07,
507,
826
Tota
l 4
pol
luta
nts*
535,
367,
253
33,1
68,7
5926
,762
,836
330,
601,
267
46,4
56,7
9381
,735
,671
32,1
20,6
5869
,077
,931
56,4
05,1
541,
211,
696,
323
134,
632,
925
497,
804,
679
* A
ll 4
pol
luta
nts
by a
djus
ted
sum
mat
ion
(T1)
Ap
pen
dix
2: C
ost s
umm
ary
tab
le o
n h
ealt
h c
are
cost
s d
ue to
air
pol
luti
on in
clud
ing
mal
ign
ant n
eop
lasm
s

87Appendices
Tabl
e A
.2.2
: Co
st su
mm
ary
of d
irect
and
indi
rect
hea
lth c
are
cost
per
one
mill
ion
popu
latio
n in
PRD
and
HK
(incl
udin
g m
alig
nant
neo
plas
ms)
PR
D (R
MB
)H
K$
GZ
SZZ
HFS
JMZQ
HZ
DG
ZS
Wh
ole
PR
DO
vera
ll 9
pre
fect
ure
sH
K
1. D
irec
t hea
lth
car
e co
st p
er y
ear
du
e to
air
po
lluti
on
PM
1011
,540
,368
2,01
3,94
72,
166,
824
14,7
92,3
912,
324,
134
1,98
2,87
74,
174,
955
2,75
1,64
43,
282,
410
45,0
29,5
515,
003,
283
24,6
47,2
09
N
O2
5,50
7,97
01,
551,
577
2,15
9,88
19,
150,
814
259,
393
537,
390
12,5
8092
0,93
53,
214,
241
23,3
14,7
812,
590,
531
15,8
65,0
07
SO
219
,378
,255
870,
238
8,60
6,22
329
,061
,445
1,86
4,13
13,
346,
435
354,
135
4,23
9,86
212
,855
,301
80,5
76,0
258,
952,
892
3,72
7,94
6
O
32,
400,
691
357,
739
759,
931
568,
381
214,
752
282,
048
637,
008
484,
826
1,16
5,64
36,
871,
018
763,
446
1,09
7,06
9
Tota
l 4
pol
luta
nts*
32,4
77,0
613,
738,
832
11,0
41,5
3343
,524
,220
4,21
1,10
75,
296,
261
5,11
4,59
57,
175,
537
16,5
64,3
4512
9,14
3,49
014
,349
,277
35,3
80,4
06
2. In
dir
ect h
ealt
h c
are
cost
per
yea
r d
ue
to a
ir p
ollu
tio
n
PM
1011
,134
,245
6,48
3,92
51,
968,
581
17,0
74,2
782,
748,
654
3,13
2,77
04,
890,
320
7,64
7,68
82,
382,
491
57,4
62,9
536,
384,
773
19,8
43,5
52
N
O2
9,30
9,96
38,
800,
809
3,32
0,38
618
,443
,375
535,
398
1,48
5,99
425
,933
4,45
9,15
13,
973,
394
50,3
54,4
025,
594,
934
25,7
48,2
55
SO
248
,974
,737
7,41
7,49
419
,814
,824
87,7
34,9
155,
792,
236
13,9
22,2
561,
097,
379
30,9
15,3
5923
,574
,785
239,
243,
986
26,5
82,6
659,
040,
697
O
392
,627
24,1
0840
,574
23,7
955,
361
9,44
215
,289
28,4
8171
,004
310,
681
34,5
209,
709
Tota
l 4
pol
luta
nts*
56,1
82,7
3516
,347
,061
20,0
14,9
6698
,357
,185
7,83
9,00
715
,446
,164
5,83
8,04
035
,473
,322
23,8
85,4
0627
9,38
3,88
631
,042
,654
38,0
04,2
31
3. T
ota
l hea
lth
car
e co
st p
er y
ear
du
e to
air
po
lluti
on
PM
1022
,674
,613
8,49
7,87
24,
135,
405
31,8
66,6
695,
072,
788
5,11
5,64
79,
065,
276
10,3
99,3
315,
664,
902
102,
492,
504
11,3
88,0
5644
,490
,761
N
O2
14,8
17,9
3410
,352
,386
5,48
0,26
627
,594
,189
794,
790
2,02
3,38
438
,513
5,38
0,08
67,
187,
635
73,6
69,1
838,
185,
465
41,6
13,2
62
SO
268
,352
,992
8,28
7,73
228
,421
,048
116,
796,
360
7,65
6,36
717
,268
,690
1,45
1,51
435
,155
,221
36,4
30,0
8631
9,82
0,01
135
,535
,557
12,7
68,6
43
O
32,
493,
317
381,
847
800,
505
592,
175
220,
114
291,
490
652,
297
513,
307
1,23
6,64
67,
181,
699
797,
967
1,10
6,77
8
Tota
l 4
pol
luta
nts*
88,6
59,7
9620
,085
,893
31,0
56,5
0014
1,88
1,40
512
,050
,114
20,7
42,4
2510
,952
,635
42,6
48,8
5940
,449
,750
408,
527,
377
45,3
91,9
3173
,384
,636
* A
ll 4
pol
luta
nts
by a
djus
ted
sum
mat
ion
(T1)

88Appendices
Appendix 3: Proxy geographic locations of 9 monitoring stations for sensitivity analysis based on satellite remote sensing information
Table A.3.1: Proxy geographic locations of 9 monitoring stations for sensitivity analysis based on satellite remote sensing information
Monitoring stations Address Sampling Height
Above Ground
Proxy Geographic Locations
lat lon
Wanqingsha (Guangzhou) Wanqingsha Secondary School, Nansha 13 m 12 m 22.80 113.50
Liyuan (Shenzhen) Shennan Zhong Road, Shenzhen City 38 m 12 m 22.59 114.10
Tangjia (Zhuhai) Building No. 1, Rong Yuan, Zhongshan University Tangjia
24 m 19 m 22.35 113.60
Huijingcheng (Foshan) No. 127, Fenjiang Nan Road, Changcheng Area
24 m 14 m 23.05 113.10
Donghu (Jiangmen) Inside Donghu Park, Jiangmen City 17.5 m 5 m 22.60 113.10
Chengzhong (Zhaoqing) No. 17, Qintian Road, Zhaoqing City 21 m 16 m 23.10 112.50
Xiapu (Huizhou) No. 4 Xiabuhengjiang Road No. 3. Huicheng Area
49 m 20 m 23.10 114.45
Haogang (Dongguan) Haogang Primary School, Nancheng Qu, Dongguan City
18 m 14 m 23.05 113.75
Zimaling Park (Zhongshan)
Zimaling Park, Zhongshan City 45 m 7 m 22.50 113.45
* Approximate locations are determined by map overlaying technique based on PRDRAQmn annual report (2006)

89Appendices
Zhongshan (Zimaling Park)
www.chinese-tourism.net/China_Travel/a4/9994.html
Zhuhai (Tangjia)
ucmi.bokee.com/4619053.html
Appendix 4: Surrounding appearance of the monitoring stations in Jiangmen, Shenzhen, Zhongshan, and Zhuhai.
Jiangmen (Donghu)
www.jiangmen.gov.cn/lyz/lyjd/llp/t20060508_48056.html
Shenzhen (Liyuen)
www.book-hotel.cn/date/art/178.html
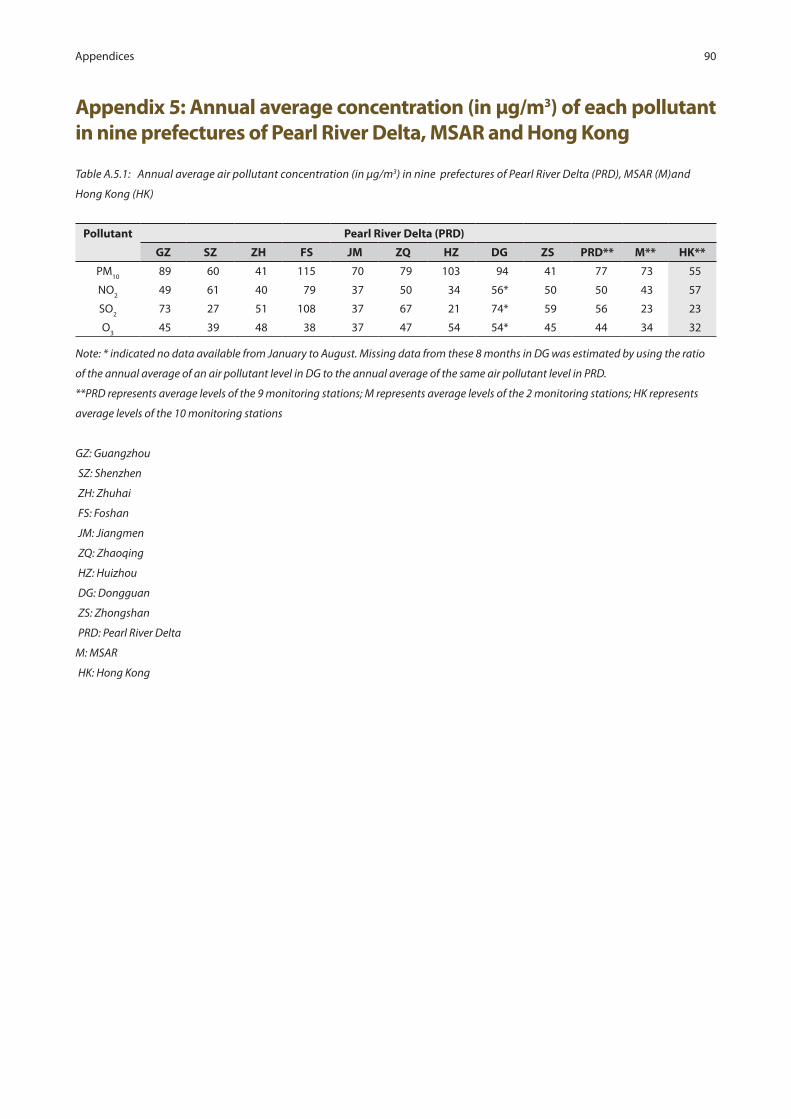
90Appendices
Table A.5.1: Annual average air pollutant concentration (in µg/m3) in nine prefectures of Pearl River Delta (PRD), MSAR (M)and
Hong Kong (HK)
Pollutant Pearl River Delta (PRD)
GZ SZ ZH FS JM ZQ HZ DG ZS PRD** M** HK**
PM10
89 60 41 115 70 79 103 94 41 77 73 55
NO2
49 61 40 79 37 50 34 56* 50 50 43 57
SO2
73 27 51 108 37 67 21 74* 59 56 23 23
O3
45 39 48 38 37 47 54 54* 45 44 34 32
Note: * indicated no data available from January to August. Missing data from these 8 months in DG was estimated by using the ratio
of the annual average of an air pollutant level in DG to the annual average of the same air pollutant level in PRD.
**PRD represents average levels of the 9 monitoring stations; M represents average levels of the 2 monitoring stations; HK represents
average levels of the 10 monitoring stations
GZ: Guangzhou
SZ: Shenzhen
ZH: Zhuhai
FS: Foshan
JM: Jiangmen
ZQ: Zhaoqing
HZ: Huizhou
DG: Dongguan
ZS: Zhongshan
PRD: Pearl River Delta
M: MSAR
HK: Hong Kong
Appendix 5: Annual average concentration (in µg/m3) of each pollutant in nine prefectures of Pearl River Delta, MSAR and Hong Kong
![· [ymxpp \opvk]g s wxynyp o[^nyp lpr bpny [s\^xyu xp wyqp] lf]g n[kwy]xfw 7o^wki jxpyoxk]kukj ^ ukqoyny bpvympuk p\]g \myt xkly[\wf\vym \vymk *n[kwy]xy\]g+ s h]s](https://img.pdfslide.net/doc/110x75/5c90c8a909d3f2213e8cc3a2/-ymxpp-opvkg-s-wxynyp-onyp-lpr-bpny-sxyu-xp-wyqp-lfg-nkwyxfw-7owki.jpg)


![Nrud; ,tuJ VO ftpijj; njhFjpfs; gzp GupfpwhH. Nguhrpupau; fh. … · - 84-jha;t PL • Xf];l; 201 ehd;fUJfpNwd;. nghJj;jsj;j pYk;nghJ kf;f s;jsj;j pYk;,ilawhky;,aq;f pte;j Gyikahsu;](https://img.pdfslide.net/doc/110x75/606f14069e5f5534931d0266/nrud-tuj-vo-ftpijj-njhfjpfs-gzp-gupfpwhh-nguhrpupau-fh-84-jhat-pl-a.jpg)