Embed Size (px)
Citation preview

AJ LUCAS GROUP LIMITEDFINANCIAL REPORT
YE
AR
EN
DE
D 3
0 J
UN
E 2
00
8F
or p
erso
nal u
se o
nly

1 Directors’ report
15 income statements
16 statements of recogniseD income anD expense
17 Balance sheets
18 statements of cash flows
19 notes to the financial statements
52 Directors’ Declaration
53 inDepenDent auDitor’s report
54 australian stock exchange aDDitional information
55 Directory
For
per
sona
l use
onl
y

1 LUCAS GROUP
ALLAN CAMPbELL BCom LLB ExECUTIvE ChAIRMAN AND CEO. AGE 52. DIRECTOR SINCE 1995.
After qualifying as a lawyer, Mr Campbell worked for several leading investment banks initially in Australia followed
by ten years in London and New York. During this period he was given responsibility for corporate advisory and
recovery where he gained valuable hands on experience for the turn around of distressed companies.
Mr Campbell acquired Lucas in 1995, commenced the Company on a path and listed the Company on the
Australian Securities Exchange in 1999. Subsequently, he has been responsible for the Company’s strategic
direction and has established its position as one of the leading provider of mining and infrastructure services in
Australia.
IAN STUART-RObERTSON AAIQS ExECUTIvE DIRECTOR. AGE 59. DIRECTOR SINCE 1995.
Mr Stuart-Robertson is a qualified quantity surveyor with nearly 40 years experience in civil and building
construction. He has previously served as a director of several construction companies and been responsible for the
delivery of many major projects. He also has considerable expertise in project cost reporting systems and makes a
vital contribution to the Group in his role as chairman of the tender review committee.
He is also a non-executive director of quantity surveyors, John Hollis & Partners.
ANDREw LUkAS Be NON-ExECUTIvE DIRECTOR. AGE 61. DIRECTOR SINCE 1995.
Mr Lukas is a qualified civil engineer. He joined Lucas in 1975 after working in the engineering and construction of
pipelines in USA and Australia for the Williams group of companies.
He pioneered the development of horizontal directional drilling in Australia and is an authority on this
technology as well as pipelines. He is also a leading proponent of directional drilling in coal seam gas extraction.
He is an executive committee member and past president of the Australian Pipeline Industry Association (APIA),
a director and immediate past president of the International Pipeline and Offshore Contractors Association (IPLOCA).
Mr Lukas was appointed Chief Executive Officer of Sydney Gas Limited on 19 March 2008 following which he
ceased executive duties at AJ Lucas.
MARTIN GREEN FCA INDEPENDENT NON-ExECUTIvE DIRECTOR, ChAIRMAN OF AUDIT COMMITTEE. AGE 63. DIRECTOR SINCE 1999.
Mr Green is a Fellow of the Institute of Chartered Accountants and an official liquidator of the Supreme Court of
NSW. He has been in public practice for 36 years, mainly specialising in business recovery and insolvency. He has
substantial business and finance experience at senior levels.
He is currently a principal at Ferrier Green Krejci Silvia Chartered Accountants, a former honorary director/
treasurer of the National Trust of Australia (NSW) and has served at various times in many public roles and
capacities.
Mr Green also serves as Chairman of the Company’s Audit Committee.
GARRy O’MEALLy BSc Be INDEPENDENT NON-ExECUTIvE DIRECTOR, MEMbER OF AUDIT COMMITTEE. AGE 72. DIRECTOR SINCE 1999.
Mr O’Meally has over 40 years experience in the oil and gas industries, mainly with Australian Gas Light Company
where he served as general manager of AGL Gas Companies and later of AGL Petroleum. He was also general
manager of Queensland and Northern Territory for Santos Limited and has consulted to many energy companies.
He was previously president of the Australian Gas Association, councillor and Queensland chairman of the
Australian Petroleum Production and Exploration Association and an executive manager of the Australian Pipeline
Industry Association. Mr O’Meally’s knowledge of the energy industries has been vitally important in the Group’s
expansion into its coal seam gas activities.
Directors’ reportThe Board of directors have pleasure in presenting their report together with the financial report of AJ Lucas Group Limited (the Company) and the
consolidated entity, being the Company and its controlled entities (the Group), for the year ended 30 June 2008 and the auditor’s report thereon.
DirectorsThe Directors of AJ Lucas Group Limited at any time during or since the end of the financial year are as follows:
For
per
sona
l use
onl
y

A yEAR OF MILESTONES 2
company secretaryMr Nicholas Swan MA, ACA, MBA, was appointed as company secretary on 15 November 2001. He has also served as the company secretary of several
listed public companies as well as of a responsible entity for managed investment schemes.
Directors’ meetingsThe number of directors’ meetings (including meetings of committees of directors) held during the financial year, during the period of each director’s
tenure, and number of such meetings attended by each of the directors is:
Board of Directors audit committeeheld attended held attended
Allan Campbell 12 12 — —
Ian Stuart-Robertson 12 11 — —
Andrew Lukas 12 6 — —
Martin Green 12 12 2 2
Garry O’Meally 12 12 2 2
corporate governance statementThe Board of directors is responsible for the corporate governance of the Group. This statement outlines the main corporate governance practices. Unless
otherwise stated, these practices were in place for the entire year.
bOARD OF DIRECTORSThe directors of the Company are accountable to shareholders for the proper management of the business and affairs of the Company.
The key responsibilities of the Board are to:
• establishandmonitorthecorporatestrategiesoftheCompany;
• ensurepropercorporategovernance;
• monitortheperformanceofmanagement;
• ensurethatappropriateriskmanagementsystems,internalcontrols,reportingsystemsandcomplianceframeworksareinplaceandoperating
effectively;
• monitorfinancialresults;
• approvedecisionsconcerninginvestments,acquisitionsanddividends;and
• complywithreportingandotherrequirementsofthelaw.
The Board’s role and responsibilities are documented in a written Board charter.
COMPOSITION OF ThE bOARDThe constitution of the Company requires between three and ten directors. Currently there are five with a majority non-executives.
Directors are appointed for their industry-specific expertise and commercial acumen. The Board believes that all the directors can make, and do make,
quality and independent judgements in the best interests of the Company. While the chairman is also the chief executive officer, his contribution to the
Company is considered vital to direct the strategy of the Company as well as its management. The directors are able to obtain independent advice at the
expense of the Company.
There is no nomination committee. Instead, the Board assesses the performance of individual directors and the Board as a whole.
EThICAL AND RESPONSIbLE DECISION MAkINGThe Company has a code of conduct to guide the directors and key executives. It includes disclosure of conflicts of interest and use of information not
otherwise publicly known or available. Any director with an interest in matters being considered by the Board must take no part in decisions relating to
those matters.
TRADING IN COMPANy SECURITIESThe Company has a share trading policy prohibiting directors, senior management and their associates from trading in the Company’s securities other
than in certain nominated periods (between two and thirty days following the release of the half yearly and annual results and the annual general
meeting) and at such other times as the Board permits. Such persons must obtain prior approval before conducting any trade.
INTEGRITy IN FINANCIAL REPORTINGThe Board has established an audit committee which provides assistance to the Board in fulfilling its corporate governance and oversight responsibilities
in relation to the Company’s financial reporting, internal control systems, risk management systems, regulatory compliance and external audit.
The committee must have at least two members. All members must be independent non-executive directors. At least one member must have
financial expertise and some members shall have an understanding of the industry in which the Company operates.
The principal roles of the committee are to:
• assesswhethertheaccountingmethodsandstatutoryreportingappliedbymanagementareconsistentandcomplywithaccountingstandardsand
applicablelawsandregulations;
• makerecommendationsontheappointmentoftheexternalauditors,assesstheirperformanceandindependenceandensurethatmanagement
respondstoauditfindingsandrecommendations;
For
per
sona
l use
onl
y

3 LUCAS GROUP
• discusstheadequacyandeffectivenessoftheCompany’sinternalcontrolsystemsandpoliciestoassessandmanagebusinessrisksanditslegal
andregulatorycomplianceprogrammes;and
• ensureeffectivemonitoringoftheCompany’scompliancewithitscodesofconductandBoardpolicystatements.
The audit committee meets with the external auditors at least twice a year. The committee is authorised to seek information from any employee or
external party and obtain legal or other professional advice.
TIMELy AND bALANCED DISCLOSUREThe Company has established policies and procedures designed to ensure compliance with Australian Securities Exchange (ASX) listing rules disclosure
requirements so that investors have equal and timely access to all material information. The Company also posts all information disclosed to the ASX on
its website.
CLEAR COMMUNICATION wITh ShAREhOLDERSThe Company has a communications strategy to promote effective communication with shareholders. The company secretary has been nominated
as the person responsible for communications with the ASX. This role includes responsibility for ensuring compliance with the continuous disclosure
requirements in the ASX listing rules.
RISk IDENTIFICATION AND MANAGEMENTThe Board has established policies on risk management. The systems of internal financial controls have been determined by senior management and
are designed to provide reasonable but not absolute protection against fraud, material mis-statement or loss. The chief executive officer and chief
financial officer provide representation to the audit committee and the Board on the risk management, compliance and control systems for the Group.
ENCOURAGE ENhANCED PERFORMANCEThe performance of committees, individual directors and key executives is evaluated regularly by the Board.
There has been no formal performance evaluation of the Board, directors or committees during the reporting period. The Board informally evaluates
its performance and that of the individual directors and committees on a regular basis. The Board believes that the individuals on the Board have made
quality and independent judgements in the best interests of the Company on all relevant issues during the reporting period. There has been a formal
performance evaluation of all key executives (other than the executive directors) during the reporting period.
RECOGNISE ThE INTERESTS OF ALL STAkEhOLDERSThe Company has established various codes of conduct to guide compliance with legal and other obligations to stakeholders and the community at
large. These include ethical and work standards, employment practices including occupational health and safety and employment opportunities, and
environmental protection. The Company’s compliance and that of its employees is monitored through internal review.
principal activitiesAJ Lucas Group is a diversified infrastructure and mining services and construction group specialising in providing services to the water and wastewater,
oil and gas, resources and property sectors.
The Group has in excess of 1,100 employees and a client base principally comprising State and local governments and major corporations.
The Group is structured into three principal business segments:
Drilling: Australia’s foremost provider of drilling services to the coal and coal seam gas industries for the degasification of coal mines and the recovery
and commercialisation of coal seam gas and associated services. The Group is also the market leader in the trenchless installation of conduits and pipes
using horizontal directional drilling.
Pipelines: Australia’s market-leading provider for the engineering and installation of pipelines including hydrostatic testing.
Construction and infrastructure: provision of construction and civil engineering services together with facilities management.
review anD results of operations OvERvIEw OF ThE CONSOLIDATED ENTITyThe consolidated entity recorded a net profit of $13,468,000 (2007: $6,396,000). A summary of the results is set out in the following table:
Summary of financial results
2008$’000
2007$’000
Total revenue 424,301 216,369EBITDA 37,412 14,907EBIT 25,961 5,941Profit before tax 20,408 4,178Net profit attributable to members 13,468 6,396Total assets 229,899 150,948Net assets 65,160 30,438
Basic earnings per share 24.5¢ 11.9 ¢
For
per
sona
l use
onl
y
A yEAR OF MILESTONES 4
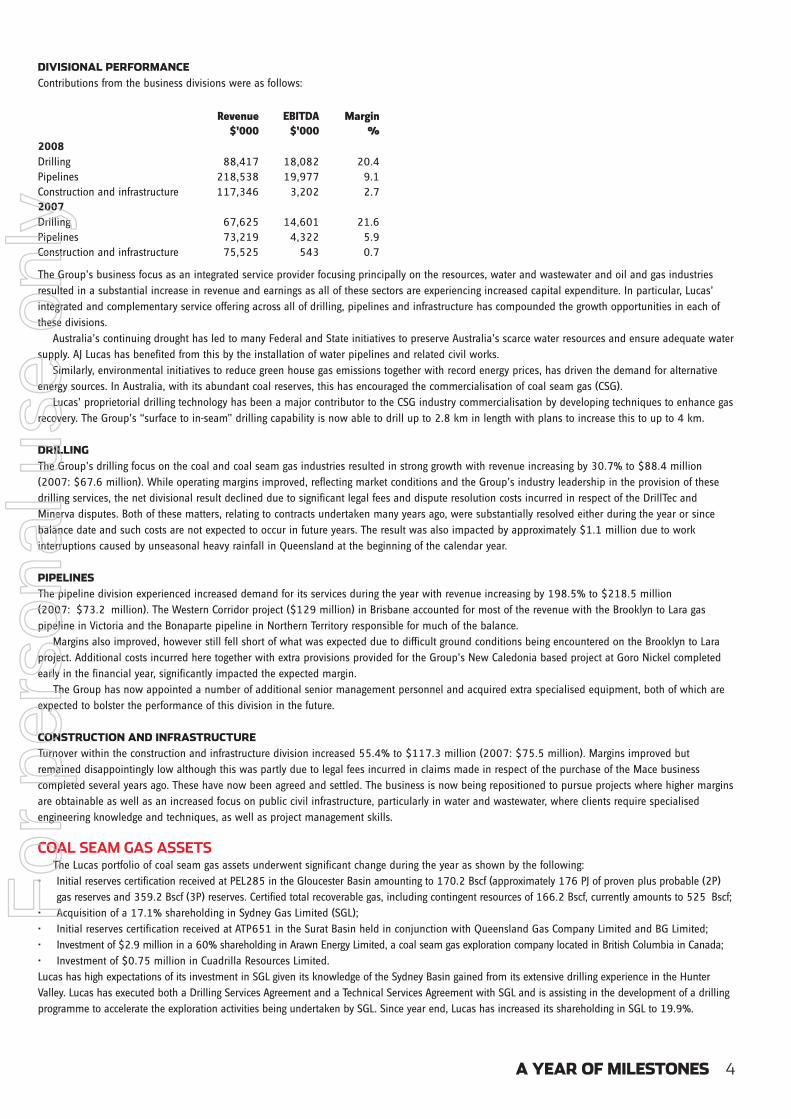
DIvISIONAL PERFORMANCEContributions from the business divisions were as follows:
revenue $’000
eBitDa $’000
margin %
2008Drilling 88,417 18,082 20.4Pipelines 218,538 19,977 9.1Construction and infrastructure 117,346 3,202 2.72007Drilling 67,625 14,601 21.6Pipelines 73,219 4,322 5.9Construction and infrastructure 75,525 543 0.7
The Group’s business focus as an integrated service provider focusing principally on the resources, water and wastewater and oil and gas industries
resulted in a substantial increase in revenue and earnings as all of these sectors are experiencing increased capital expenditure. In particular, Lucas’
integrated and complementary service offering across all of drilling, pipelines and infrastructure has compounded the growth opportunities in each of
these divisions.
Australia’s continuing drought has led to many Federal and State initiatives to preserve Australia’s scarce water resources and ensure adequate water
supply. AJ Lucas has benefited from this by the installation of water pipelines and related civil works.
Similarly, environmental initiatives to reduce green house gas emissions together with record energy prices, has driven the demand for alternative
energy sources. In Australia, with its abundant coal reserves, this has encouraged the commercialisation of coal seam gas (CSG).
Lucas’ proprietorial drilling technology has been a major contributor to the CSG industry commercialisation by developing techniques to enhance gas
recovery. The Group’s “surface to in-seam” drilling capability is now able to drill up to 2.8 km in length with plans to increase this to up to 4 km.
DRILLING The Group’s drilling focus on the coal and coal seam gas industries resulted in strong growth with revenue increasing by 30.7% to $88.4 million
(2007: $67.6 million). While operating margins improved, reflecting market conditions and the Group’s industry leadership in the provision of these
drilling services, the net divisional result declined due to significant legal fees and dispute resolution costs incurred in respect of the DrillTec and
Minerva disputes. Both of these matters, relating to contracts undertaken many years ago, were substantially resolved either during the year or since
balance date and such costs are not expected to occur in future years. The result was also impacted by approximately $1.1 million due to work
interruptions caused by unseasonal heavy rainfall in Queensland at the beginning of the calendar year.
PIPELINESThe pipeline division experienced increased demand for its services during the year with revenue increasing by 198.5% to $218.5 million
(2007: $73.2 million). The Western Corridor project ($129 million) in Brisbane accounted for most of the revenue with the Brooklyn to Lara gas
pipeline in Victoria and the Bonaparte pipeline in Northern Territory responsible for much of the balance.
Margins also improved, however still fell short of what was expected due to difficult ground conditions being encountered on the Brooklyn to Lara
project. Additional costs incurred here together with extra provisions provided for the Group’s New Caledonia based project at Goro Nickel completed
early in the financial year, significantly impacted the expected margin.
The Group has now appointed a number of additional senior management personnel and acquired extra specialised equipment, both of which are
expected to bolster the performance of this division in the future.
CONSTRUCTION AND INFRASTRUCTURETurnover within the construction and infrastructure division increased 55.4% to $117.3 million (2007: $75.5 million). Margins improved but
remained disappointingly low although this was partly due to legal fees incurred in claims made in respect of the purchase of the Mace business
completed several years ago. These have now been agreed and settled. The business is now being repositioned to pursue projects where higher margins
are obtainable as well as an increased focus on public civil infrastructure, particularly in water and wastewater, where clients require specialised
engineering knowledge and techniques, as well as project management skills.
coal seam gas assetsThe Lucas portfolio of coal seam gas assets underwent significant change during the year as shown by the following:
• InitialreservescertificationreceivedatPEL285intheGloucesterBasinamountingto170.2Bscf(approximately176PJofprovenplusprobable(2P)
gasreservesand359.2Bscf(3P)reserves.Certifiedtotalrecoverablegas,includingcontingentresourcesof166.2Bscf,currentlyamountsto525 Bscf;
• Acquisitionofa17.1%shareholdinginSydneyGasLimited(SGL);
• InitialreservescertificationreceivedatATP651intheSuratBasinheldinconjunctionwithQueenslandGasCompanyLimitedandBGLimited;
• Investmentof$2.9millionina60%shareholdinginArawnEnergyLimited,acoalseamgasexplorationcompanylocatedinBritishColumbiainCanada;
• Investmentof$0.75millioninCuadrillaResourcesLimited.
Lucas has high expectations of its investment in SGL given its knowledge of the Sydney Basin gained from its extensive drilling experience in the Hunter
Valley. Lucas has executed both a Drilling Services Agreement and a Technical Services Agreement with SGL and is assisting in the development of a drilling
programme to accelerate the exploration activities being undertaken by SGL. Since year end, Lucas has increased its shareholding in SGL to 19.9%.
For
per
sona
l use
onl
y

5 LUCAS GROUP
At Gloucester Basin, exploration activity continues with a number of pilot production wells now in testing with gas flow rates recently averaging in
excess of 1 million cubic feet per day. The project has been awarded Major Project Status in New South Wales and commercialisation initiatives are
well underway, including work on a pipeline to Hexham. Lucas expects to be shipping gas to market by end 2009/beginning 2010.
The Lucas Group also expanded its exploration activities in unconventional hydrocarbons overseas to Canada and Europe, through its investments in
Arawn Energy and Cuadrilla Resources. The Group has a very positive view on the prospects for unconventional hydrocarbons, particularly shale gas in
Europe and, to this end, has taken formative steps to position itself in this sector.
investments for future performanceThe consolidated entity acquired plant and equipment totalling $34,818,000 (2007: $15,810,000) during the year including $11,221,000 from the
purchase of the Capricorn Weston Drilling Group. The capital expenditure largely reflects substantial investment in additional capacity to sustain the
rapid growth of the Group’s drilling and pipeline activities.
In August 2008, the Group completed the acquisition of Mitchell Drilling for a purchase consideration of $150 million. Mitchell Drilling is the largest
specialist drilling company for the coal seam gas industry in Queensland and complements Lucas Drilling’s coal seam gas market position in New South
Wales. The combined entity has 88 rigs making the Group the largest provider of drilling services to the coal and coal seam gas industries in Australia.
review of financial conDitionCAPITAL STRUCTUREThe Company’s capital structure is managed in a manner to maximise the return to shareholders subject to consideration of the financing risk of the
business and the cash flows generated from operations. No shares were issued by the Company during the year other than arising from the conversion
of convertible notes, the exercise of management rights, and deferred consideration for the acquisition of McDermott Drilling Pty Limited.
Subsequent to year end, the Company has purchased the business of Mitchell Drilling for $150 million. This was funded out of an institutional
placement of $29.5 million, a $15 million equity placement to the vendor, deferred consideration of $15 million and the balance from bank
borrowings. At the same time, all of the Group’s borrowing facilities were renegotiated and their terms extended.
CASh FLOwS FROM OPERATIONSNet cash flow generated from operations during the year amounted to $50,070,000, a 420% increase over the previous year (2007: $9,602,000). The
increased cash flow reflects the change in business mix to a greater proportion of higher margin drilling work and the growth in Group consolidated
revenue.
IMPACT OF LEGISLATION AND OThER ExTERNAL REqUIREMENTSThere were no changes in environmental or other legislative requirements during the year that have significantly impacted the results or operations of
the Group.
DiviDenDsDividends paid or declared by the Company since the end of the previous year were:
DeclareD anD paiD During the year 2008
cents
per share
total amount $’000
franked/
unfranked
Date of
paymentFinal 2007 2.5 1,362 100% franked 28 Sept 2007Interim 2008 3.5 1,911 100% franked 28 Mar 2008
3,273
DeclareD after enD of year
After the balance sheet date, the directors have declared a 2008 final ordinary dividend as follows:
cents per share
total amount $’000
franked/ unfranked
Date of payment
4.5 3,038 15% franked 29 Sept 2008
The financial effect of this dividend has not been brought to account in the financial statements for the year ending 30 June 2008 and will be
recognised in the 2009 financial report.
state of affairsIn the opinion of the Directors, there were no significant changes in the state of affairs of the Group during the financial year under review.
environmental regulations anD native titleAs infrastructure engineers, meeting stringent environmental and land use regulations, including native title issues, are an important element of our
work. Lucas is committed to identifying environmental risks and engineering solutions to avoid, minimise or mitigate them. We work closely with all
levels of government, landholders, Aboriginal land councils and other bodies to ensure our activities have minimal or no effect on land use and areas
For
per
sona
l use
onl
y

A yEAR OF MILESTONES 6
of environmental, archaeological or cultural importance. One of the key benefits of directional drilling is its ability to avoid or substantially mitigate
environmental impact.
Group policy requires all operations to be conducted in a manner that will preserve and protect the environment.
At PEL285 in the Gloucester Basin, the Group holds together with its joint venture partner, two bore licence certificates under the Water Act 1912, for
the drainage of water from the production wells.
The directors are not aware of any significant environmental incidents, or breaches of environmental regulations during or since the end of the year.
events subsequent to reporting DateOn 23 July 2008, the Company purchased the business of Mitchell Drilling, the largest specialist drilling company for the coal seam gas industry in
Queensland. The purchase price of $150 million was funded by a $15 million equity placement to the vendor, with the balance out of an equity
placement to institutional shareholders of $29.5 million, deferred consideration of $15 million and increased borrowing facilities. At the same time, the
Group’s bank facilities have been renegotiated and their terms extended.
Subsequent to year-end, the directors have declared a final ordinary dividend of 4.5¢ per share, franked to 15%.
Other than these matters, there has not arisen in the interval between the end of the financial year and the date of this report any item, transaction
or event of a material or unusual nature likely, in the opinion of the directors of the Company, to affect significantly the operations of the Group, the
results of those operations, or the state of affairs of the Group, in future financial years.
likely DevelopmentsThe Group has successfully established itself as the leading service provider in each of its chosen activities. Its strategy of being an integrated service
provider to the resources water and wastewater, oil and gas and property sectors presents many opportunities to leverage its service offering.
The coal seam gas industry is expected to experience significant growth in preparation for the proposed export of LNG through Gladstone, AJ Lucas
is the only company with the full service capability to provide technical services, drilling and management services, well head completions, work overs,
well services, gas gathering systems through to pipelines to market. This gives the Group a significant strategic advantage over all its competitors. The
acquisition of Mitchell Drilling strengthens this capability through adding additional capacity, customer contacts, drilling expertise and management
depth. The Group will continue to invest in additional plant and equipment to provide it with the extra capacity to service the expected increase in
demand from the coal seam gas producers.
The complementary nature of the Group’s activities will also be drawn upon to undertake civil works for the infrastructure works to be undertaken
by the pipeline division. Partnering with selected entities through joint ventures and alliances, and the development and application of innovative
technology and practices, are expected to create opportunities to apply the Group’s civil works expertise.
The Group also intends to restructure its coal seam gas interests to provide investor transparency to their underlying value. The form of this
restructuring is yet to be determined but will relieve the Group of any direct funding obligation, in particular in respect to Gloucester Basin, as the
investment projects move into their commercialisation stage.
The Group will however, continue to investigate direct investment opportunities in the water and wastewater sectors, initially based on the water
being produced from the dewatering of coal seam gas properties where the Group is drilling. The Group will also pursue investment opportunities in
unconventional hydrocarbons (shale gas), sustainable energies (geothermal and tidal) and other technologies being developed to reduce green house
gas emissions by carbon geosequestration.
Further information about likely developments in the operations of the Group and the expected results of those operations in future financial years
has not been included in this report because disclosure of the information would be likely to result in unreasonable prejudice to the Group.
other DisclosuresUNISSUED ShARES UNDER RIGhTS OR OPTIONSAt the date of this report, unissued shares of the Company under rights or options are:
Expiry date exercise price number of shares28 May 2009 — 24,00030 June 2010 — 369,18330 June 2010 — 369,18326 November 2011 $1.10 550,00031 August 2012 — 1,119,06323 November 2012 $2.11 250,000
All rights and options expire on the earlier of their expiry date, termination of the employee’s employment and cessation of the officer’s service.
The rights or options do not entitle the holders to participate in any share issue of the Company.
ShARES ISSUED ON ExERCISE OF RIGhTSDuring or since the end of the financial year, the Company issued ordinary shares as result of the exercise of rights:
number of sharesamount paid
on each share474,333 $Nil
There were no amounts unpaid on the shares issued.
For
per
sona
l use
onl
y

7 LUCAS GROUP
Directors’ shareholDings anD other interestsThe relevant interest of each director and their director-related entities in the shares and options over shares issued by the Company, as notified by the
directors to the Australian Securities Exchange in accordance with Section 205G(1) of the Corporations Act 2001, at the date of this report are:
ordinary shares
options issued under management
rights planAllan Campbell 10,140,083 360,000Ian Stuart-Robertson 1,386,750 220,000Andrew Lukas 6,204,833 220,000Martin Green 125,000 —Garry O’Meally 219,180 —
inDemnification anD insurance of officers anD auDitorsINDEMNIFICATIONThe Company has agreed to indemnify all directors and officers of the Company against all liabilities including expenses to another person or entity
(other than the Company or a related body corporate) that may arise from their position as directors or officers of the Group, except where the liability
arises out of conduct involving a lack of good faith.
No indemnity has been provided to the auditors of the Company.
INSURANCE PREMIUMSSince the end of the previous financial year, the Company has paid premiums in respect of Directors’ and Officers’ liability and legal expenses insurance
contracts for the year ended 30 June 2008 and, since the end of the financial year, the Company has paid or agreed to pay premiums in respect of
Directors’ and Officers’ insurance for the year ending 30 June 2009.
non-auDit servicesDuring the year, KPMG, the Company’s auditor, has performed certain other services in addition to their statutory duties.
The Board has considered the non-audit services provided during the year by the auditor and in accordance with written advice provided by
resolution of the audit committee, is satisfied that the provision of those non-audit services during the year by the auditor is compatible with, and did
not compromise, the auditor independence requirements of the Corporations Act 2001 for the following reasons:
• allnon-auditservicesweresubjecttothecorporategovernanceproceduresadoptedbytheCompanyandhavebeenreviewedbytheaudit
committeetoensuretheydonotimpacttheintegrityandobjectivityoftheauditor;and
• thenon-auditservicesprovideddonotunderminethegeneralprinciplesrelatingtoauditorindependenceassetoutinAPES110‘CodeofEthics
for Professional Accountants’, as they did not involve reviewing or auditing the auditor’s own work, acting in a management or decision-making
capacity for the Company, acting as an advocate for the Company or jointly sharing risks and rewards.
Payments to the auditor of the Company, KPMG, and its related practices for non-audit services provided during the year, as set out in note 5 in the
notes to the financial statements, amounted to $353,701 (2007: $92,939).
leaD auDitor’s inDepenDence DeclarationThe Lead auditor’s independence declaration is set out on page 14 and forms part of the Directors’ Report for the financial year ended 30 June 2008.
rounDing offThe Company is of a kind referred to in ASIC 98/100 dated 10 July 1998 and, in accordance with that Class Order, amounts in the Directors’ Report
and the financial report are rounded off to the nearest thousand dollars, unless otherwise stated.
For
per
sona
l use
onl
y

A yEAR OF MILESTONES 8
remuneration report - auDiteDThis remuneration report, which forms part of the Directors’ Report, outlines the remuneration policy for directors and senior management of the
Company and the Group.
REMUNERATION PhILOSOPhy The key principle of the Company’s executive remuneration policy is to set remuneration at a level that will attract and retain qualified and experienced
personnel and motivate and reward them to achieve strategic objectives and improve business results.
Remuneration is structured to reward employees for increasing shareholder value. This is achieved by providing a fixed remuneration component
together with short and long term performance-based incentives.
Through creating goal congruence between directors, executives and shareholders, it is hoped to maximise shareholder value.
AJ Lucas aims to set fixed annual remuneration at market median levels for jobs of comparable size and responsibility using established job
evaluation methods and to provide incentives to enable top performers to be remunerated at the upper end of the market, subject always to the
performance of the Group.
The aim of the incentive plans is to drive performance to successfully implement annual business plans and increase shareholder value.
The remuneration for executives and staff is reviewed annually, using a formal performance appraisal process and market data derived from
independent surveys of people with similar competencies and responsibilities.
REMUNERATION STRUCTURERemuneration packages include a mix of fixed and variable remuneration and short and long-term incentives.
FIxED REMUNERATIONFixed remuneration consists of base remuneration which is calculated on a total cost basis and includes any fringe benefit tax charges related to
employee benefits including motor vehicles as well as employer contributions to superannuation.
INCENTIvE bASED REMUNERATIONIncentive based remuneration includes short-term and long-term incentives and is designed to reward executive directors and senior executives for
meeting or exceeding their financial objectives.
All incentive remuneration is subject to the Group achieving certain performance criteria including most importantly a minimum level of profit.
Subject to these performance criteria being met, the short-term incentives (STI) may be received as cash or ordinary shares in the Company subject to a
minimum percentage being taken in shares. The STI shares vest in equal tranches at the end of each of the first and second year after being granted.
The long-term incentive (LTI) is only available to be taken in ordinary shares and vests after three years subject to the recipient still being employed
by the Group at that time.
RELATIONShIP OF REMUNERATION TO COMPANy PERFORMANCEIn considering the Group’s performance and benefits for shareholder wealth, executive management has regard to the following indices in respect of the
current financial year and the previous two financial years.
30 Jun 2008 30 Jun 2007 30 Jun 2006
Revenue ($’000) $424,301 $216,369 $171,232
Net profit attributable to equity holders of the Company ($’000) $13,468 $6,396 $3,030
Earnings per share 24.5¢ 11.9¢ 5.9¢Dividend per share 6.0¢ 0.0¢ 0.0¢Share price at balance date $6.27 $2.00 $0.87Share price appreciation 314% 230% (32.6)%
The overall level of key management personnel compensation takes into account the performance of the Group over a number of years. Over the past
four years, the Group’s profit from ordinary activity after income tax has grown at an average rate per annum of over 79%. During the same period, the
average increase in key management’s compensation has grown by approximately 12% per annum.
For
per
sona
l use
onl
y

9 LUCAS GROUP
Details of the nature and amount of each major element of remuneration of each director of the Company and each of the five named highest paid
executives of the Company and Group and other key management personnel are as per the table set out below:
ShORT-TERMPOST
EMPLOyMENTShARE bASED
PAyMENTSproportion of remuneration performance
related %
Value of options and rights as proportion of remuneration
%
salary/ fees
$
cash Bonus
$
non-monetary benefits (1)
$
total
$
superannuation benefits
$
Value of options and rights (2)
$
total
$Executive directors
Allan Campbell2008 425,000 — — 425,000 — 58,483 483,483 — 12.1
2007 393,883 — — 393,883 — 12,476 406,359 — 3.1
Ian Stuart-Robertson2008 336,711 — — 336,711 20,271 36,455 393,437 — 9.32007 252,554 — 12,138 264,692 20,271 7,486 292,449 — 2.6
Non-executive directors
Andrew Lukas (3) 2008 172,915 — 23,972 196,887 12,176 36,455 245,518 14.82007 254,255 — 4,440 258,695 21,345 7,486 287,526 — 2.6
Martin Green2008 45,000 — — 45,000 — — 45,000 — —2007 45,000 — — 45,000 — 40,500 85,500 — 47.4
Garry O’Meally2008 45,000 — — 45,000 — — 45,000 — —2007 45,000 — — 45,000 — 40,500 85,500 — 47.4
Executive officersIan RedfernGeneral Manager Construction
2008 303,183 — — 303,183 26,143 132,823 462,149 21.8 28.72007 249,327 — 5,693 255,020 12,686 10,000 277,706 — 3.6
Kevin LesterGeneral Manager Pipelines
2008 286,020 — 24,021 310,041 19,782 85,674 415,498 14.6 20.62007 268,665 111,167 968 380,800 18,620 — 399,420 27.8 —
Mark Summergreene (4) 2008 232,737 — — 232,737 21,906 78,822 333,465 16.7 23.6Chief Financial Officer 2007 219,914 37,381 6,629 263,924 16,503 — 280,427 13.3 —Brian Burden Chief Estimator
2008 228,211 — — 228,211 18,021 77,108 323,340 16.7 23.72007 203,252 — 2,257 205,509 17,062 — 222,571 — —
Brett Tredinnick 2008 199,057 — 7,978 207,035 17,810 70,185 295,030 16.8 23.8General Manager, Drilling
Mark Tonkin
General Manager
2008 218,548 — — 218,548 17,223 50,341 286,112 11.1 17.62007 181,355 — 1,844 183,199 16,200 — 199,399 — —
FormerTim Herlihy (4)
Chief Financial Officer
2007 104,415 — 20,261 124,676 10,000 — 134,676 — —
OThER bENEFITSThe remuneration policy provides that directors and senior executives may obtain loans from the Group. All such loans are made at commercial rates
and therefore do not represent a benefit to the recipient or attract fringe benefit tax. No loan amounts have been written down as the balances are
considered fully collectible.
SERvICE AGREEMENTS All executive directors and senior executives are employed under a standard AJ Lucas contract. The service contract outlines the components of
remuneration but does not prescribe how remunerations levels are modified year to year. Remuneration levels are reviewed every year to take into
account cost of living changes, any change in the scope of the role performed and any changes required to meet the principles of the remuneration
policy.
The service contracts are unlimited in term. All contracts can be terminated without notice by the Company with compensation, if any, payable to the
employee in accordance with the law or by negotiated agreement.
NON-ExECUTIvE DIRECTORS The remuneration of the non-executive directors, currently each $45,000 per annum, is determined by the Board within the aggregate amount
approved by shareholders. No additional remuneration is paid for serving on any sub-committee of the Board.
In recognition that the amount of the individual fees paid to non-executive directors is less than generally paid to persons in such roles in
comparable sized companies, the Company has in the past periodically awarded them shares under its Deferred Share Plan. Such shares vest from the
date of issue but cannot be disposed of until the earlier of 10 years from the date of issue or the date their service with AJ Lucas ceases.
For
per
sona
l use
onl
y

A yEAR OF MILESTONES 10
Details of the nature and amount of each major element of remuneration of each director of the Company and each of the five named highest paid
executives of the Company and Group and other key management personnel are as per the table set out below:
ShORT-TERMPOST
EMPLOyMENTShARE bASED
PAyMENTSproportion of remuneration performance
related %
Value of options and rights as proportion of remuneration
%
salary/ fees
$
cash Bonus
$
non-monetary benefits (1)
$
total
$
superannuation benefits
$
Value of options and rights (2)
$
total
$Executive directors
Allan Campbell2008 425,000 — — 425,000 — 58,483 483,483 — 12.1
2007 393,883 — — 393,883 — 12,476 406,359 — 3.1
Ian Stuart-Robertson2008 336,711 — — 336,711 20,271 36,455 393,437 — 9.32007 252,554 — 12,138 264,692 20,271 7,486 292,449 — 2.6
Non-executive directors
Andrew Lukas (3) 2008 172,915 — 23,972 196,887 12,176 36,455 245,518 14.82007 254,255 — 4,440 258,695 21,345 7,486 287,526 — 2.6
Martin Green2008 45,000 — — 45,000 — — 45,000 — —2007 45,000 — — 45,000 — 40,500 85,500 — 47.4
Garry O’Meally2008 45,000 — — 45,000 — — 45,000 — —2007 45,000 — — 45,000 — 40,500 85,500 — 47.4
Executive officersIan RedfernGeneral Manager Construction
2008 303,183 — — 303,183 26,143 132,823 462,149 21.8 28.72007 249,327 — 5,693 255,020 12,686 10,000 277,706 — 3.6
Kevin LesterGeneral Manager Pipelines
2008 286,020 — 24,021 310,041 19,782 85,674 415,498 14.6 20.62007 268,665 111,167 968 380,800 18,620 — 399,420 27.8 —
Mark Summergreene (4) 2008 232,737 — — 232,737 21,906 78,822 333,465 16.7 23.6Chief Financial Officer 2007 219,914 37,381 6,629 263,924 16,503 — 280,427 13.3 —Brian Burden Chief Estimator
2008 228,211 — — 228,211 18,021 77,108 323,340 16.7 23.72007 203,252 — 2,257 205,509 17,062 — 222,571 — —
Brett Tredinnick 2008 199,057 — 7,978 207,035 17,810 70,185 295,030 16.8 23.8General Manager, Drilling
Mark Tonkin
General Manager
2008 218,548 — — 218,548 17,223 50,341 286,112 11.1 17.62007 181,355 — 1,844 183,199 16,200 — 199,399 — —
FormerTim Herlihy (4)
Chief Financial Officer
2007 104,415 — 20,261 124,676 10,000 — 134,676 — —
Amounts disclosed for remuneration of key management persons exclude insurance
premiums of $18,595 (2007: $22,884) paid by the Group in respect of directors’
and officers’ liability insurance contracts which cover current and former directors and
officers of the Company and its controlled entities, This amount has not been allocated
to the individuals covered by the insurance policy as the directors believe that no
reasonable basis for such allocation exists.
(1) Non-monetary benefits comprise benefits subject to FBT.
(2) The fair value of the options has been calculated using a Black-Scholes pricing
model and allocated to each reporting period evenly over the period from grant
date to vesting date. The value disclosed is the portion of the fair value of the rights
allocated to this reporting period.
The following factors and assumptions were used in determining the fair value of
options and rights issued during the year on grant date:
Grant date 24 Nov 2006 31 Aug 2007 23 Nov 2007Expiry date 24 Nov 2011 31 Aug 2012 23 Nov 2012Share price on grant date $1.08 $2.11 $3.40Exercise price $1.10 — $2.11Volatility 44% 49% - 56% 51%Risk free interest rate 5.7% 6.2% - 6.3% 6.4%Dividend yield 4.8% 2.8% 2.2%Fair value per options or rights $0.25 $1.88 - $2.05 $1.70
(3) Mr Lukas ceased to serve as an executive of the Company on 19 March 2008 and
became a non-executive director from that date.
(4) Mr Herlihy resigned on 31 December 2006.
Mr Summergreene was appointed Chief Financial Officer in his place from 1
January 2007.
For
per
sona
l use
onl
y

11 LUCAS GROUP
RIGhTS AND OPTIONS OvER EqUITy INSTRUMENTS GRANTED AS COMPENSATION Details of rights and options that were granted to each key management person that vested during the reporting period are as follows:
grant date
number of options or
rights granted during 2008
fair value per option or
right at grant date
$
exercise price
per option or right
$
expiry date
number of
options or rights vested during
2008DirectorsAS Campbell 23 Nov 2007 110,000 1.70 2.11 23 Nov 2012 110,000I Stuart-Robertson 23 Nov 2007 70,000 1.70 2.11 23 Nov 2012 70,000AJ Lukas 23 Nov 2007 70,000 1.70 2.11 23 Nov 2012 70,000ExecutivesI Redfern 31 Aug 2007 34,239 2.05 — 30 Jun 2010 34,239
31 Aug 2007 34,239 1.97 — 30 Jun 2011 —31 Aug 2007 61,333 1.88 — 31 Aug 2012 —
K Lester 31 Aug 2007 20,543 2.05 — 30 Jun 2010 20,54331 Aug 2007 20,543 1.97 — 30 Jun 2011 —31 Aug 2007 48,271 1.88 — 31 Aug 2012 —
M Summergreene 31 Aug 2007 18,900 2.05 — 30 Jun 2010 18,90031 Aug 2007 18,900 1.97 — 30 Jun 2011 —31 Aug 2007 44,409 1.88 — 31 Aug 2012 —
B Burden 31 Aug 2007 18,489 2.05 — 30 Jun 2010 18,48931 Aug 2007 18,489 1.97 — 30 Jun 2011 —31 Aug 2007 43,444 1.88 — 31 Aug 2012 —
B Tredinnick 31 Aug 2007 16,829 2.05 — 30 Jun 2010 16,28931 Aug 2007 16,829 1.97 — 30 Jun 2011 —31 Aug 2007 39,544 1.88 — 31 Aug 2012 —
M Tonkin 31 Aug 2007 10,742 2.05 — 30 Jun 2010 10,74231 Aug 2007 10,742 1.97 — 30 Jun 2011 —31 Aug 2007 35,869 1.88 — 31 Aug 2012 —
grant date
number of
options granted during 2007
fair value per option at
grant date $
exercise price
per options $
expiry date
number of
options vested during 2007
DirectorsAS Campbell 24 Nov 2006 250,000 0.25 1.10 24 Nov 2011 —AJ Lukas 24 Nov 2006 150,000 0.25 1.10 24 Nov 2011 —I Stuart-Robertson 24 Nov 2006 150,000 0.25 1.10 24 Nov 2011 —
During the financial year, 250,000 options over unissued ordinary shares in the Company were issued to the executive directors as approved by
shareholders at the 2007 Annual General Meeting. These options vest immediately on grant but may not be exercised prior to the third anniversary of
the grant date. No options or rights have been granted since the end of the financial year.
ExERCISE OF RIGhTS AND OPTIONS GRANTED AS COMPENSATIONDuring the reporting period, the following shares were issued on the exercise of rights and options previously granted as compensation to key
management persons:
2008 2007number
of sharesamount paid
$/sharenumber
of sharesamount paid
$/shareDirectorsAS Campbell — — 83,333 —AJ Lukas — — 83,333 —ExecutivesK Lester 180,000 — — —
There are no amounts unpaid on the shares issued as a result of the exercise of the rights or options.
For
per
sona
l use
onl
y

A yEAR OF MILESTONES 12
ANALySIS OF ShARE-bASED PAyMENTS GRANTED AS REMUNERATION Details of the vesting profile of the options and rights granted as remuneration to each director of the Company and each of the named executives is
detailed below:
options and rights
granted Vested in year
forfeited in
year 1
financial years in which
options or rights vest
Value yet to vest
number Date min2 max3
Directors % % $ $AS Campbell 250,000 24 Nov 2006 — — 2010 — 1,292,500
110,000 23 Nov 2007 100 — 2008 — —I Stuart-Robertson 150,000 24 Nov 2006 — — 2010 — 775,500
70,000 23 Nov 2007 100 — 2008 — —AJ Lukas 150,000 24 Nov 2006 — — 2010 — 775,500
70,000 23 Nov 2007 100 — 2008 — —
Company and consolidated entity executives
I Redfern 34,239 31 Aug 2007 100 — 2008 — —34,239 31 Aug 2007 — — 2009 — 214,67961,333 31 Aug 2007 — — 2010 — 384,558
K Lester 20,543 31 Aug 2007 100 — 2008 — —20,543 31 Aug 2007 — — 2009 — 128,80548,271 31 Aug 2007 — — 2010 — 302,659
M Summergreene 18,900 31 Aug 2007 100 — 2008 — —18,900 31 Aug 2007 — — 2009 — 118,50344,409 31 Aug 2007 — — 2010 — 278,444
B Burden 18,489 31 Aug 2007 100 — 2008 — —18,489 31 Aug 2007 — — 2009 — 115,92643,444 31 Aug 2007 — — 2010 — 272,394
B Tredinnick 16,829 31 Aug 2007 100 — 2008 — —16,829 31 Aug 2007 — — 2009 — 105,51839,544 31 Aug 2007 — — 2010 — 241,671
M Tonkin 10,742 31 Aug 2007 100 — 2008 — —10,742 31 Aug 2007 — — 2009 — 67,35235,869 31 Aug 2007 — — 2010 — 224,899
(1) The % forfeited in the year represents the reduction from the maximum number of options available to vest due to the performance hurdle not
being achieved.
(2) The minimum value of options and rights yet to vest is $nil as the performance criteria may not be met and consequently the right may not vest.
(3) The maximum value of options and rights yet to vest is not determinable as it depends on the market price of shares of AJ Lucas Group on the ASX
on the date the option or rights is exercised. The maximum values presented above are based on the closing share price at 30 June 2008 of $6.27
less the exercise price.
For
per
sona
l use
onl
y

13 LUCAS GROUP
ANALySIS OF MOvEMENTS IN OPTIONS AND RIGhTS The movement during the reporting period, by value, of options and rights over ordinary shares of the Company held by each Company director and
each of the named executives is detailed below:
(i) granted in year
$
(ii) Value of options and rights exercised in year
$
(iii) lapsed in year
$DirectorsAS Campbell 187,000 — —I Stuart-Robertson 119,000 — —AJ Lukas 119,000 — —
— —
ExecutiveI Redfern 252,947 — —K Lester 173,332 360,000 —M Summergreene 159,467 — —B Burden 156,001 — —B Tredinnick 141,995 — —M Tonkin 110,617 — —
(i) The value of options and rights is their fair value calculated at grant date using a Black-Scholes pricing model. The total value of the options and
rights is included in the table above. This amount is allocated to remuneration over the vesting period.
(ii) The value of the options and rights is calculated as the market price of the Company’s shares on the Australian Securities Exchange as at close of
trading on the date the options or rights were exercised after deducting the price paid to exercise the options and rights.
(iii) The value of the options and rights that lapsed during the year represents the benefits foregone and is calculated at the date of the option or right
lapses using a Black-Scholes pricing model assuming the performance hurdle has not been met. No options or rights lapsed in the year.
Signed in accordance with a resolution of the directors pursuant to s.298 (2) of the Corporations Act 2001.
Allan Campbell, Director
Dated at Sydney, this 25th day of September 2008.
For
per
sona
l use
onl
y

A yEAR OF MILESTONES 14
leaD auDitor’s inDepenDence Declaration unDer section 307c of the corporations act 2001To the directors of AJ Lucas Group Limited
I declare that, to the best of my knowledge and belief, in relation to the audit for the financial year ended 30 June 2008 there have been:
• nocontraventionsoftheauditorindependencerequirementsassetoutintheCorporationsAct2001inrelationtotheaudit;and
• nocontraventionsofanyapplicablecodeofprofessionalconductinrelationtotheaudit.
KPMG
Neil Cameron Smith
Partner
Sydney
25 September 2008
For
per
sona
l use
onl
y

15 LUCAS GROUP
aJ lucas group limiteD anD its controlleD entities
income statements for the year enDeD 30 June 2008The accompanying notes are an integral part of these consolidated financial statements.
consolidated company
note2008
$’0002007
$’0002008
$’0002007
$’000Revenue 2 424,301 216,369 1,500 —
Total revenue 424,301 216,369 1,500 —
Material costs (124,587) (65,779) — —
Sub-contractor costs (116,734) (75,272) — —
Employee expenses (80,627) (34,707) — —
Plant and other construction costs (55,404) (16,380) — —
Depreciation and amortisation expenses 4 (11,451) (8,966) — —
Debt recovery and legal costs (6,500) (3,615) — —
Impairment of assets 4 — (3,422) — (1,786)
Profit on acquisition of business 30 — 2,723 — —
Other expenses (3,037) (5,010) (93) (620)
Results from operating activities 25,961 5,941 1,407 (2,406)
Financial income 3 1,322 781 6,591 386
Financial expenses 3 (6,875) (2,544) (5,078) (1,055)
Net financing (costs)/income 3 (5,553) (1,763) 1,513 (669)
Profit/(loss) before income tax 20,408 4,178 2,920 (3,075)
Income tax (expense)/benefit 6 (6,940) 2,218 799 1,866
Profit/(loss) attributable to equity holders of the company 24 13,468 6,396 3,719 (1,209)
Earnings per share:
Basic earnings per share (cents) 7 24.5 11.9
Diluted earnings per share (cents) 7 24.0 11.8
For
per
sona
l use
onl
y

A yEAR OF MILESTONES 16
statements of recogniseD income anD eXpense for the year enDeD 30 June 2008The accompanying notes are an integral part of these consolidated financial statements.
consolidated company
note2008
$’0002007
$’0002008
$’0002007
$’000Exchange differences on translation of foreign operations 24 274 306 — —
Income and expense recognised directly in equity 274 306 — —
Profit/(loss) for the year 24 13,468 6,396 3,719 (1,209)
Total recognised income and expense for the year 24 13,742 6,702 3,719 (1,209)
For
per
sona
l use
onl
y

17 LUCAS GROUP
balance sheets as at 30 June 2008The accompanying notes are an integral part of these consolidated financial statements.
consolidated company
note2008
$’0002007
$’0002008
$’0002007
$’000Current assets
Cash and cash equivalents 8 16,612 18,222 5,519 13,512
Trade and other receivables 9 56,912 28,261 6,064 4,189
Construction work in progress 10 40,685 53,418 — —
Other 11 1,717 435 184 —
Total current assets 115,926 100,336 11,767 17,701
Non-current assets
Trade and other receivables 9 — — 49,889 31,795
Property, plant and equipment 12 55,986 30,921 — —
Investments 13 26,156 63 26,879 1,260
Exploration assets 14 4,100 6,175 — —
Intangible development assets 15 15,452 1,046 — —
Other intangible assets 16 12,279 6,805 2,061 2,061
Deferred tax assets 17 — 5,602 8,405 10,126
Total non-current assets 113,973 50,612 87,234 45,242
Total assets 229,899 150,948 99,001 62,943
Current liabilities
Trade and other payables 18 83,074 66,319 632 84
Interest-bearing loans and borrowings 19 19,996 10,706 4,500 —
Income tax payable 20 114 75 — —
Provisions 21 8,550 2,702 — —
Total current liabilities 111,734 79,802 5,132 84
Non-current liabilities
Trade and other payables 18 — — 29,361 16,217
Interest-bearing loans and borrowings 19 51,036 37,181 18,226 24,188
Deferred tax liabilities 17 1,221 — — —
Provisions 21 748 3,527 — —
Total non-current liabilities 53,005 40,708 47,587 40,405Total liabilities 164,739 120,510 52,719 40,489
Net assets 65,160 30,438 46,282 22,454
Equity
Issued capital 24 54,037 30,655 54,118 30,736
Reserves 24 2,236 1,091 — —
Retained earnings/(accumulated losses) 24 8,887 (1,308) (7,836) (8,282)
Total equity 24 65,160 30,438 46,282 22,454
aJ lucas group limiteD anD its controlleD entities
For
per
sona
l use
onl
y

A yEAR OF MILESTONES 18
statements of cash flows for the year enDeD 30 June 2008The accompanying notes are an integral part of these consolidated financial statements.
consolidated company
note2008
$’0002007
$’0002008
$’0002007
$’000Cash flows from operating activities
Cash receipts from customers 450,877 200,553 66 —
Cash payments to suppliers and employees (394,407) (187,970) (277) (100)
Cash generated from operations 56,470 12,583 (211) (100)
Interest received 547 60 465 —
Income taxes paid (72) (497) — —
Interest and other costs of finance paid (6,875) (2,544) (4,112) (1,172)
Net cash from operating activities 29(b) 50,070 9,602 (3,858) (1,272)
Cash flows from investing activities
Proceeds from sale of plant and equipment 1,018 457 — —
Payment for investment in other entities (27,858) — (25,243) —
Loans to controlled entities — — (8,574) —
Repayment of loans by controlled entities — — — 5,532
Payments for plant and equipment (21,472) (5,953) — —
Exploration and evaluation expenditure (12,513) (2,676) — —
Loans to related entity (1,578) (1,608) (1,578) (1,608)
Repayment of loan to related entity 292 — 263 —
Acquisition of subsidiary net of cash acquired (9,993) (3,198) — —
Net cash from investing activities (72,104) (12,978) (35,132) 3,924
Cash flows from financing activities
Proceeds of borrowings -other 41,690 4,004 22,626 —
Repayment of borrowings - other (6,413) (147) — —
Loans from controlled entities — — 13,144 —
Deferred payment for acquistion (625) _ — —
Dividends paid (3,273) _ (3,273) —
Proceeds from issue of convertible notes — 24,188 — 24,188
Repayment of convertible notes (1,500) (10,000) (1,500) (10,000)
Payment of finance lease liabilities (4,659) (3,521) — —
Net cash from financing activities 25,220 14,524 30,997 14,188
Net increase/(decrease) in cash and cash equivalents 3,186 11,148 (7,993) 16,840
Cash and cash equivalents at beginning of the year 12,559 1,411 13,512 (3,328)
Cash and cash equivalents at end of the year 29(a) 15,745 12,559 5,519 13,512
For
per
sona
l use
onl
y

19 LUCAS GROUP
notes to the financial statements
Page Note content19 1 Significant accounting policies
25 2 Segment reporting
26 3 Financial income and expense
26 4 Other expenses
26 5 Auditor’s remuneration
27 6 Income tax
27 7 Earnings per share
28 8 Cash and cash equivalents
28 9 Trade and other receivables
28 10 Construction work in progress
28 11 Other current assets
29 12 Property, plant and equipment
29 13 Investments
29 14 Exploration assets
30 15 Intangible development assets
30 16 Other intangible assets
31 17 Deferred tax assets and liabilities
33 18 Trade and other payables
33 19 Interest-bearing loans and liabilities
35 20 Current tax liabilities
36 21 Provisions
36 22 Operating leases
36 23 Employee benefits
38 24 Capital and reserves
39 25 Financial instruments
44 26 Interests in joint ventures
45 27 Consolidated entities
45 28 Contingencies
46 29 Reconciliation of cash flows from operating activities
47 30 Acquisition of subsidiary
48 31 Key management personnel disclosures
50 32 Non-key management personnel disclosures
51 33 Deed of cross guarantee
51 34 Events subsequent to balance date
1. significant accounting policies
AJLucasGroupLimited(the‘Company’)isacompanydomiciledin
Australia. The address of the Company’s registered office is 157 Church
Street Ryde, NSW 2112. The consolidated financial report of the Company
for the financial year ended 30 June 2008 comprises the Company and
itssubsidiaries(togetherreferredtoasthe‘Group’)andtheGroup’s
interest in associates and jointly controlled entities. The Group is primarily
involved in construction, civil engineering and commercialisation of coal
seam gas reserves (see note 2).
The accounting policies set out below have been applied consistently
to all periods presented in these consolidated financial statements, and
have been applied consistently by all entities in the Group.
Certain comparative amounts have been reclassified to conform with
the current year’s presentation.
STATEMENT OF COMPLIANCEThe financial report is a general purpose financial report which has
been prepared in accordance with Australian Accounting Standards
(‘AASBs’)(includingAustralianInterpretations)adoptedbytheAustralian
AccountingStandardsBoard(‘AASB’)andtheCorporationsAct2001.The
consolidated financial report of the Group and the financial report of the
CompanycomplywithInternationalFinancialReportingStandards(‘IFRSs’)
and interpretations adopted by the International Accounting Standards
Board(‘IASB’).
The financial statements were approved by the Board of Directors on
25 September 2008.
bASIS OF MEASUREMENTThe consolidated financial statements have been prepared on the
historical cost basis.
FUNCTIONAL AND PRESENTATION CURRENCyThe financial report is presented in Australian dollars which is the
Company’s functional currency and the functional currency of the majority
of the Group. The Company is of a kind referred to in ASIC Class Order
98/100 dated 10 July 1998 (updated by CO 05/641 effective 28 July
2005 and CO 06/51 effective 31 January 2006) and in accordance with
that Class Order, amounts in the financial report and Director’s Report
have been rounded off to the nearest thousand dollars, unless otherwise
stated.
USE OF ESTIMATES AND JUDGMENTSThe preparation of financial statements requires management to make
judgements, estimates and assumptions that affect the application of
accounting policies and the reported amount of assets, liabilities, income
and expenses. Actual results may differ from these estimates. Estimates
and underlying assumptions are reviewed on an ongoing basis. Revisions
to accounting estimates are recognised in the period in which the estimate
is revised and in any future periods affected.
In particular, information about significant areas of estimation
uncertainty and critical judgements in applying accounting policies that
have the most significant effect on the amount recognised in the financial
statements are described in the following notes:
• Note10–constructionworkinprogress
• Note15-intangibledevelopmentassets
• Note16–otherintangibleassets
• Note21–provisions
bASIS OF CONSOLIDATIONASSOCIATES: Associates are those entities in which the Group has
significant influence, but not control, over the financial and operating
For
per
sona
l use
onl
y

A yEAR OF MILESTONES 20
policies. Significant influence is presumed to exist when the Group holds
between 20 and 50 percent of the voting power of another entity.
Associates are accounted for using the equity method (equity
accounted investees) and are initially recognised at cost. The Group’s
investment includes goodwill identified on acquisition, net of any
accumulated impairment losses. The consolidated financial statements
include the Group’s share of income and expenses and equity movements
of equity accounted investees, after adjustments to align the accounting
policies with those of the Group, from the date that significant influence
commences to the date that significant influence ceases. Where the
Group’s share of losses exceeds its interest in an equity accounted
investee, the carrying amount of that interest (including any long-term
investments) is reduced to nil and the recognition of further losses is
discontinued except to the extent that the Group has an obligation or has
made payments on behalf of the investee.
SUbSIDIARIES: Subsidiaries are entities controlled by the Group.
Control exists when the Company has the power, directly or indirectly, to
govern the financial and operating policies of an entity so as to obtain
benefits from its activities. In assessing control, potential voting rights that
presently are exercisable or convertible are taken into account. The financial
statements of subsidiaries are included in the consolidated financial
statements from the date that control commences until the date that control
ceases. The accounting policies of subsidiaries have been changed when
necessary to align them with the policies adopted by the Group.
JOINTLy CONTROLLED OPERATIONS, ASSETS AND ENTITIES: The interest of the Company and of the Group in joint ventures and jointly
controlled assets are brought to account by recognising in its financial
statements the assets it controls, the liabilities that it incurs, the expenses
it incurs and its share of income that it earns from the sale of goods or
services by the joint venture.
TRANSACTIONS ELIMINATED ON CONSOLIDATION: Intragroup
balances, and any unrealised gains and losses or income and expenses
arising from intragroup transactions, are eliminated in preparing
the consolidated financial statements. Unrealised gains arising from
transactions with equity accounted investees are eliminated against the
investment to the extent of the Group’s interest in the investee. Unrealised
losses are eliminated in the same way as unrealised gains, but only to the
extent that there is no evidence of impairment.
FOREIGN CURRENCyFOREIGN CURRENCy TRANSACTIONS: Transactions in foreign
currencies are translated to the respective functional currencies of the
Group’s entities at exchange rates at the dates of the transactions.
Monetary assets and liabilities denominated in foreign currencies at the
reporting date are retranslated to the functional currency at the foreign
exchange rate at that date. The foreign currency gain or loss on monetary
items is the difference between amortised cost in the functional currency
at the beginning of the period, adjusted for effective interest and payments
during the period, and the amortised cost in foreign currency translated
at the exchange rate at the end of the period. Non-monetary assets and
liabilities denominated in foreign currencies that are measured at fair
value are retranslated to the functional currency at the exchange rate at
the date that the fair value was determined. Foreign currency differences
arising on retranslation are recognised in profit or loss.
FOREIGN OPERATIONS: The assets and liabilities of foreign operations
are translated to Australian dollars at exchange rates at the reporting date.
The income and expenses of foreign operations are translated to Australian
dollars at exchange rates at the dates of the transactions.
Foreign currency differences are recognised directly in equity. Since 1
January 2004, the Group’s date of transition to AASBs, such differences
havebeenrecognisedintheforeigncurrencytranslationreserve(‘FCTR’).
When a foreign operation is disposed of, in part or in full, the relevant
amount in the FCTR is transferred to profit or loss.
Foreign exchange gains and losses arising from a monetary item
receivable from or payable to a foreign operation, the settlement of which
is neither planned nor likely in the foreseeable future, are considered to
form part of the net investment in a foreign operation and are recognised
directly in equity in the FCTR.
FINANCIAL INSTRUMENTSNON-DERIvATIvE FINANCIAL INSTRUMENTS: Non-derivative
financial instruments comprise trade and other receivables, cash and cash
equivalents, loans and borrowings, and trade and other payables.
Non-derivative financial instruments are recognised initially at fair
value plus, for instruments not at fair value through profit or loss, any
directly attributable transaction costs. Subsequent to initial recognition,
non-derivative financial instruments are measured as described below.
A financial instrument is recognised if the Group becomes a party
to the contractual provisions of the instrument. Financial assets are
derecognised if the Group’s contractual rights to the cash flows from
the financial assets expire or if the Group transfers the financial asset
to another party without retaining control or substantially all risks and
rewards of the asset. Regular way purchases and sales of financial assets
are accounted for at trade date, i.e., the date that the Group commits itself
to purchase or sell the asset. Financial liabilities are derecognised if the
Group’s obligations specified in the contract expire or are discharged or
cancelled.
Cash and cash equivalents comprise cash balances and call deposits.
Bank overdrafts that are repayable on demand and form an integral part of
the Group’s cash management are included as a component of cash and
cash equivalents for the purpose of the statement of cash flows.
Non-derivative financial instruments are measured at amortised cost
using the effective interest method, less any impairment losses.
available-for-sale financial assets
The Group’s investments in equity securities are classified as available-
for-sale financial assets. Subsequent to initial recognition, they are
measured at fair value and changes therein, other than impairment
losses are recognised directly in a separate component of equity. When
an investment is derecognised, the cumulative gain or loss in equity is
transferred to profit or loss.
COMPOUND FINANCIAL INSTRUMENTS: Compound financial
instruments issued by the Group comprise convertible notes that can be
converted to share capital at the option of the holder, and the number of
shares to be issued does not vary with changes in their fair value.
The liability component of a compound financial instrument is
recognised initially at the fair value of a similar liability that does not
have an equity conversion option. The equity component is recognised
initially at the difference between the fair value of the compound financial
instrument as a whole and the fair value of the liability component. Any
directly attributable transaction costs are allocated to the liability and
equity components in proportion to their initial carrying amounts.
Subsequent to initial recognition, the liability component of a
compound financial instruments is measured at amortised cost using the
effective interest method, unless it is designated at fair value through profit
or loss. The equity component of a compound financial instruments is not
remeasured subsequent to initial recognition.
For
per
sona
l use
onl
y

21 LUCAS GROUP
Interest, dividends, losses and gains relating to the financial liability
are recognised in the profit or loss. Distributions to the equity holders are
recognised against equity, net of any tax benefit.
ShARE CAPITALOrdinary shares: Incremental costs directly attributable to issue of
ordinary shares and share options are recognised as a deduction from
equity, net of any related income tax benefit.
Dividends: Dividends are recognised as a liability in the period in
which they are declared.
LEASED ASSETSLeases in terms of which the Group assumes substantially all the risks
and rewards of ownership are classified as finance leases. Upon initial
recognition, the leased asset is measured at an amount equal to the lower
of its fair value and the present value of the minimum lease payments.
Subsequent to initial recognition, the asset is accounted for in accordance
with the accounting policy applicable to that asset.
Other leases are operating leases and the leased assets are not
recognised on the Group’s balance sheet.
REvENUESERvICES RENDERED: Revenue from services rendered is recognised
in the income statement in proportion to the stage of completion of the
transaction at the balance sheet date. The stage of completion is assessed
by reference to surveys of work performed.
CONSTRUCTION CONTRACTS: Contract revenue includes the initial
amount agreed in the contract plus any variations in contract work, claims
and incentive payments to the extent that it is probable that they will
result in revenue and can be measured reliably. As soon as the outcome
of a construction contract can be estimated reliably, contract revenue and
expenses are recognised in the income statement in proportion to the
stage of completion of the contract.
The stage of completion is assessed by reference to an assessment
of total labour hours and other costs incurred to date as a percentage of
estimated total costs for each contract, unless an alternative measurement
method provides a more accurate indication of the stage of completion.
When the outcome of a construction contract cannot be estimated
reliably, contract revenue is recognised only to the extent of contract costs
incurred that are likely to be recoverable. An expected loss on a contract is
recognised immediately in the income statement.
ASSET SALES: The net proceeds of asset sales are recognised at the
date an unconditional contract of sale is signed.
The gain or loss on disposal is calculated as the difference between the
carrying amount of the asset at the time of disposal and the net proceeds
on disposal and is recognised in other income.
LEASE PAyMENTSPayments made under operating leases are recognised in the income
statement on a straight-line basis over the term of the lease.
Minimum lease payments made under finance leases are apportioned
between the finance expense and the reduction of the outstanding liability.
The finance expense is allocated to each period during the lease term so
as to produce a constant periodic rate of interest on the remaining balance
of the liability.
FINANCE INCOME AND ExPENSESFinance income comprises interest income on funds invested, dividend
income and foreign currency gains that are recognised in the income
statement. Interest income is recognised as it accrues, using the effective
interest method. Dividend income is recognised in profit or loss on the
date that the Group’s right to receive payment is established, which in the
case of quoted securities is the ex-dividend date.
Finance expenses comprise interest expense on borrowings, unwinding
of the discount on provisions and deferred consideration, foreign currency
losses and impairment losses recognised on financial assets that are
recognised in the income statement. All borrowing costs are recognised in
the income statement using the effective interest method.
INCOME TAxIncome tax in the income statement comprises current and deferred tax.
Income tax is recognised in the income statement except to the extent
that it relates to items recognised directly in equity, in which case it is
recognised in equity.
Current tax is the expected tax payable on the taxable income for the
year, using tax rates enacted or substantially enacted at the balance sheet
date, and any adjustment to tax payable in respect of previous years.
Deferred tax is recognised using the balance sheet liability method,
providing for temporary differences between the carrying amounts of
assets and liabilities for financial reporting purposes and the amounts
used for taxation purposes. The following temporary differences are
not provided for: the initial recognition of goodwill and other assets or
liabilities that affect neither accounting nor taxable profit, and differences
relating to investments in subsidiaries to the extent that they will probably
not reverse in the foreseeable future. Deferred tax is measured at the tax
rates that are expected to be applied to the temporary differences when
they reverse, based on the laws that have been enacted or substantially
enacted by the reporting date. Deferred tax assets and liabilities are offset
if there is a legally enforceable right to offset current tax liabilities and
assets, and they relate to income taxes levied by the same authority on the
same taxable entity, or on different tax entities, but they intend to settle
current tax liabilities and assets on a net basis or their tax assets and
liabilities will be realised simultaneously.
A deferred tax asset is recognised only to the extent that it is probable
that future taxable profits will be available against which the asset can be
utilised. Deferred tax assets are reduced to the extent that it is no longer
probable that the related tax benefit will be realised.
Additional income taxes that arise from the distribution of dividends
are recognised at the same time as the liability to pay the related dividend
is recognised.
TAx CONSOLIDATION: The Company and its wholly-owned Australian
resident entities have formed a tax-consolidated group and are therefore
taxed as a single entity. The head entity within the tax-consolidated group
is AJ Lucas Group Limited.
Current tax expense/income, deferred tax liabilities and deferred tax
assets arising from temporary differences of the members of the tax-
consolidated group are recognised in the separate financial statements
of the members of the tax-consolidated group using the group allocation
approach.
Any current tax liabilities (or assets) and deferred tax assets arising
from unused tax losses of the subsidiaries is assumed by the head
entity in the tax-consolidated group and are recognised by the Company
as amounts payable (receivable) to/(from) other entities in the tax-
consolidated group in conjunction with any tax funding arrangement
amounts (refer below). Any difference between these amounts is
recognised by the Company as an equity contribution or distribution.
The Company recognises deferred tax assets arising from unused
tax losses of the tax-consolidated group to the extent that it is probable
that future taxable profits of the tax-consolidated group will be available
against which the asset can be utilised.
For
per
sona
l use
onl
y

A yEAR OF MILESTONES 22
Any subsequent period adjustments to deferred tax assets arising from
unused tax losses as a result of revised assessments of the probability of
recoverability is recognised by the head entity only.
NATURE OF TAx FUNDING ARRANGEMENTS AND TAx ShARING ARRANGEMENTS: The head entity, in conjunction with other members
of the tax-consolidated group, has entered into a tax funding arrangement
which sets out the funding obligations of members of the tax-consolidated
group in respect of tax amounts. The tax funding arrangements require
payments to/from the head entity equal to the current tax liability (asset)
assumed by the head entity and any tax-loss deferred tax asset assumed
by the head entity, resulting in the head entity recognising an inter-entity
receivable (payable) equal in amount to the tax liability (asset) assumed.
The inter-entity receivable (payable) are at call.
Contributions to fund the current tax liabilities are payable as per
the tax funding arrangement and reflect the timing of the head entity’s
obligation to make payments for tax liabilities to the relevant tax
authorities.
The head entity in conjunction with other members of the tax-
consolidated group, has also entered into a tax sharing agreement. The
tax sharing agreement provides for the determination of the allocation of
income tax liabilities between the entities should the head entity default
on its tax payment obligations. No amounts have been recognised in
the financial statements in respect of this agreement as payment of any
amounts under the tax sharing agreement is considered remote.
EARNINGS PER ShARETheGrouppresentsbasicanddilutedearningspershare(‘EPS’)datafor
its ordinary shares. Basic EPS is calculated by dividing the profit or loss
attributable to ordinary shareholders of the Company by the weighted
average number of ordinary shares outstanding during the period. Diluted
EPS is determined by adjusting the profit or loss attributable to ordinary
shareholders and the weighted average number of ordinary shares
outstanding for the effects of all dilutive potential ordinary shares, which
comprise convertible notes and share options granted to employees.
SEGMENT REPORTINGA segment is a distinguishable component of the Group that is engaged
either in providing related products or services (business segment), or in
providing products or services within a particular economic environment
(geographical segment), which is subject to risks and rewards that are
different from those of other segments. The Group’s primary format for
segment reporting is based on business segments. The business segments
are determined based on the Group’s management and internal reporting
structure.
Segment results, assets and liabilities include items directly attributable
to a segment as well as those that can be allocated on a reasonable basis.
CONSTRUCTION wORk IN PROGRESSConstruction work in progress represents the gross unbilled amount
expected to be collected from customers for contract work performed to
date. It is measured at cost plus profit recognised to date less progress
billings and recognised losses. Cost includes all expenditure related
directly to specific projects and an allocation of fixed and variable
overheads incurred in the Group’s contract activities based on normal
operating capacity.
If payments received from customers exceed the income recognised,
then the difference is presented as deferred income in the balance sheet.
INvESTMENTSInvestments in controlled entities are carried at cost. Cost includes the
purchase price of the entity as well as directly attributable costs associated
with the acquisition. Directly attributable costs are capitalised only once
there is written agreement to acquire the entity.
PROPERTy, PLANT AND EqUIPMENTRECOGNITION AND MEASUREMENT: Items of property, plant and
equipment are measured at cost less accumulated depreciation and
impairment losses. The cost of property, plant and equipment at 1 January
2004, the date of transition to AASBs, was determined by reference to its
fair value at that date.
Cost includes expenditures that are directly attributable to the
acquisition of the asset. The cost of self-constructed assets includes the
cost of materials, direct labour, the initial estimate, where relevant, of
the costs of dismantling and removing the items and restoring the site on
which they are located, an appropriate proportion of production overheads
and any other costs directly attributable to bringing the asset to a working
condition for its intended use. Purchased software that is integral to
the functionality of the related equipment is capitalised as part of that
equipment. Borrowing costs related to the acquisition or construction of
qualifying assets are recognised in profit or loss as incurred.
When parts of an item of property, plant and equipment have different
useful lives, they are accounted for as separate items (major components)
of property, plant and equipment.
LEASED ASSETS: Leases in terms of which the Group assumes
substantially all the risks and rewards of ownership are classified as
finance leases. Finance leases are stated at an amount equal to the
lower of fair value and the present value of minimum lease payments at
inception of the lease, less accumulated depreciation and impairment
losses.
SALE OF NON-CURRENT ASSETS: The net gain or loss on disposal is
included in the income statement at the date control of the asset passes to
the buyer, usually when an unconditional contract for sale is signed.
The gain or loss on disposal is calculated as the difference between the
carrying amount of the asset at the time of disposal and the net proceeds
on disposal (including incidental costs).
SUbSEqUENT COSTS: The cost of replacing part of an item of
property, plant and equipment is recognised in the carrying amount of the
item if it is probable that the future economic benefits embodied within
the part will flow to the Group and its cost can be measured reliably. The
costs of the day-to-day servicing of property, plant and equipment are
recognised in profit or loss as incurred.
DEPRECIATIONDepreciation is charged to the income statement on a straight-line basis
over the estimated useful lives of each part of an item of plant and
equipment commencing from the time the asset is ready for use.
The estimated useful lives in the current and comparative periods are
as follows:
plant and equipment yearsPlant and equipment 4-10
Motor vehicles 7
Office equipment 4-8
Computer equipment 3-4
Leased plant and equipment 4-10
The residual value, the useful life and the depreciation method applied
to an asset are reassessed at least annually.
For
per
sona
l use
onl
y

23 LUCAS GROUP
INTANGIbLE ASSETSGOODwILL: Goodwill and negative goodwill arise on the acquisition of
subsidiaries and joint ventures.
Acquisitions: Goodwill represents the excess of the cost of the
acquisition over the Group’s interest in the net fair value of the identifiable
assets, liabilities and contingent liabilities of the acquiree. When the excess
is negative (negative goodwill), it is recognised immediately in the income
statement.
Subsequent measurement: Following initial recognition, goodwill
stated at cost less any accumulated impairment losses. In respect of
equity accounted investees, the carrying amount of goodwill is included in
the carrying amount of the investment.
RESEARCh AND DEvELOPMENT: Expenditure on research activities,
undertaken with the prospect of gaining new scientific or technical
knowledge and understanding, is recognised in the income statement as
an expense as incurred.
Development activities involve a plan or design for the production
of new or substantially improved products or processes. Development
expenditure is capitalised only if development costs can be measured
reliably, the product or process is technically and commercially feasible,
future economic benefits are probable and the Group intends to and has
sufficient resources to complete development and to use or sell the asset.
The expenditure capitalised includes the cost of materials, direct labour
and overhead costs that are directly attributable to preparing the asset for
its intended use. Borrowing costs related to the development of qualifying
assets are recognised in profit or loss as incurred. Other development
expenditure is recognised in profit or loss as incurred.
Capitalised development expenditure is stated at cost less accumulated
amortisation and impairment losses.
CUSTOMER RELATIONShIPS AND CUSTOMER CONTRACTS: Customer relationship and customer contracts intangibles that are
acquired by the Group that have finite lives are measured at cost less
accumulated amortisation and impairment losses.
OThER INTANGIbLE ASSETS: Other intangible assets that are
acquired by the Group are stated at cost less accumulated amortisation
and impairment losses.
SUbSEqUENT ExPENDITURE: Subsequent expenditure on capitalised
intangible assets is capitalised only when it increases the future economic
benefits embodied in the specific asset to which it relates. All other
expenditure is recognised in the income statement as incurred.
AMORTISATION: Amortisation is charged to the income statement
on a systematic basis over the estimated useful lives of intangible assets
unless such lives are indefinite. Goodwill and intangible assets with an
indefinite useful life are systematically tested for impairment at each
balance sheet date. Other intangible assets are amortised from the date
they are available for use. The estimated useful lives in the current and
comparative periods are as follows:
yearsOther development costs 5
Customer intangibles 5
ExPLORATION AND EvALUATION ASSETSExploration and evaluation costs, including the costs of acquiring licences,
are capitalised as exploration and evaluation assets on an area of interest
basis. Costs incurred before the Group has obtained legal rights to explore
an area are recognised in the income statement.
Exploration and evaluation assets are only recognised if the rights of
the area of interest are current and either:
(i) the expenditures are expected to be recouped through successful
developmentandexploitationoftheareaofinterest;or
(ii) activities in the area of interest have not at the reporting date, reached
a stage which permits a reasonable assessment of the existence or
otherwise of economically recoverable reserves and active and significant
operations in, or in relation to, the area of interest are continuing.
Exploration and evaluation assets are assessed for impairment if:
(i) sufficient data exists to determine technical feasibility and commercial
viability;and
(ii) facts and circumstances suggest that the carrying amount exceeds
the recoverable amount. For the purposes of impairment testing,
exploration and evaluation assets are allocated to cash-generating
units to which the exploration activity relates. The cash generating unit
shall not be larger than the area of interest.
When the area of interest enters the development phase, the
accumulated exploration and evaluation is transferred to gas assets in
development.
GAS ASSETSASSETS IN DEvELOPMENT: When the technical and commercial
feasibility of an undeveloped gas field in an area of interest has been
demonstrated, the field enters the development phase. The costs of the
area of interest field assets in the development phase are separately
accounted for as assets and include past exploration and evaluation
costs, development drilling and other surface and subsurface expenditure,
surface plant and equipment and any associated land and buildings.
When commercial operations commences, the accumulated costs are
transferred to gas producing assets.
PRODUCING ASSETS: The costs of gas assets in production are
separately accounted for as assets and include past exploration and
evaluation costs, pre-production development costs and ongoing costs of
continuing to develop resources for production and to expand or replace
plant and equipment and any associated land and buildings. These costs
will be subject to depreciation and depletion and also tested annually for
impairment.
IMPAIRMENTFINANCIAL ASSETS: A financial asset is assessed at each reporting
date to determine whether there is any objective evidence that it is
impaired. A financial asset is considered to be impaired if objective
evidence indicates that one or more events have had a negative effect on
the estimated future cash flows of that asset.
Individually significant financial assets are tested for impairment on a
individual basis. The remaining financial assets are assessed collectively in
groups that share similar credit risk characteristics.
All impairment losses are recognised in the income statement. An
impairment loss is reversed if the reversal can be related objectively to an
event occurring after the impairment loss was recognised.
NON-FINANCIAL ASSETS: The carrying amounts of the Group’s non-
financial assets, other than construction work in progress and deferred tax
assets, are reviewed at each reporting date to determine whether there is
anyindicationofimpairment.Ifanysuchindicationexists;thentheasset’s
recoverable amount is estimated. For goodwill and intangible assets that
have indefinite lives or that are not yet available for use, recoverable
amount is estimated at each reporting date.
For
per
sona
l use
onl
y

A yEAR OF MILESTONES 24
The recoverable amount of an asset or cash-generating unit is the
greater of its value in use and its fair value less costs to sell. In assessing
value in use, the estimated future cash flows are discounted to their
present value using a pre-tax discount rate that reflects current market
assessments of the time value of money and the risks specific to the asset.
For the purpose of impairment testing, assets are grouped together into
the smallest group of assets that generates cash inflows from continuing
use that are largely independent of the cash inflows of other assets or
groups of assets (“the cash generating unit”). The goodwill acquired in a
business combination, for the purpose of impairment testing, is allocated
to cash generating units that are expected to benefit from the synergies of
the combination.
An impairment loss is recognised if the carrying amount of an asset or
its cash-generating unit exceeds its recoverable amount. A cash-generating
unit is the smallest identifiable asset group that generates cash flows that
largely are independent from other assets and groups. Impairment losses
are recognised in profit or loss. Impairment losses recognised in respect
of cash-generating units are allocated first to reduce the carrying amount
of any goodwill allocated to the units and then to reduce the carrying
amount of the other assets in the unit (group of units) on a pro rata basis.
An impairment loss in respect of goodwill is not reversed. In respect of
other assets, impairment losses recognised in prior periods are assessed at
each reporting date for any indications that the loss has decreased or no
longer exists. An impairment loss is reversed if there has been a change in
the estimates used to determine the recoverable amount. An impairment
loss is reversed only to the extent that the asset’s carrying amount does
not exceed the carrying amount that would have been determined, net of
depreciation or amortisation, if no impairment loss had been recognised.
EMPLOyEE bENEFITSDEFINED CONTRIbUTION SUPERANNUATION FUNDS: Obligations
for contributions to defined contribution superannuation funds are
recognised as an expense in profit or loss when they are due.
OThER LONG-TERM EMPLOyEE bENEFITS: The Group’s net
obligation in respect of long-term employee benefits is the amount of
future benefit that employees have earned in return for their service
inthecurrentandpriorperiodsplusrelatedoncosts;thatbenefitis
discounted to determine its present value. The discount rate is the yield
at the reporting date on AA credit-rated bonds that have maturity dates
approximating the terms of the Group’s obligations. The calculation is
performed using the projected unit credit method. Any actuarial gains or
losses are recognised in the income statement in the period in which they
arise.
ShORT-TERM bENEFITS: Liabilities for employee benefits for wages,
salaries, annual leave and sick leave represent present obligations
resulting from employees’ services provided to reporting date and are
calculated at undiscounted amounts based on remuneration wage and
salary rates that the Group expects to pay as at reporting date including
related on-costs, such as workers compensation insurance and payroll tax.
Non-accumulating non-monetary benefits, such as medical care, housing,
cars and free or subsidised goods and services, are expensed based on the
net marginal cost to the Group as the benefits are taken by the employees.
ShARE-bASED PAyMENT TRANSACTIONS: The grant date fair value
of options granted to employees is recognised as an employee expense, with
a corresponding increase in equity, over the period in which the employees
become unconditionally entitled to the options. The amount recognised is
adjusted to reflect the actual number of share options that vest, except for
those that fail to vest due to market conditions not being met.
The fair value of the amount payable to employees in respect of share
appreciation rights, which are settled in cash, is recognised as an expense,
with a corresponding increase in liabilities, over the period in which the
employees become unconditionally entitled to payment. The liability is
re-measured at each reporting date and at settlement date. Any changes in
the fair value of the liability are recognised as personnel expense in profit
or loss.
PROvISIONS: A provision is recognised if, as a result of a past event,
the Group has a present legal or constructive obligation that can be
estimated reliably, and it is probable that an outflow of economic benefits
will be required to settle the obligation. Provisions are determined by
discounting the expected future cash flows at a pre-tax rate that reflects
current market assessments of the time value of money and the risks
specific to the liability.
GOODS AND SERvICES TAx: Revenue, expenses and assets are
recognised net of the amount of goods and services tax (GST), except
where the amount of GST incurred is not recoverable from the taxation
authority. In these circumstances, the GST is recognised as part of the cost
of acquisition of the asset or as part of the expense.
Receivables and payables are stated with the amount of GST included.
The net amount of GST recoverable from, or payable to, the ATO is
included as a current asset or liability in the balance sheet.
Cash flows are included in the statement of cash flows on a gross
basis. The GST components of cash flows arising from investing and
financing activities which are recoverable from, or payable to, the ATO are
classified as operating cash flows.
NEw STANDARDS AND INTERPRETATIONS NOT yET ADOPTED: The following standards, amendments to standards and interpretations
have been identified as those which may impact the entity in the period of
initial application. They are available for early adoption at 30 June 2008,
but have not been applied in preparing this financial report:
• RevisedAASB3BusinessCombinationschangestheapplicationof
acquisition accounting for business combinations and the accounting
for non-controlling (minority) interests. Key changes include: the
immediateexpensingofalltransactioncosts;measurementof
contingent consideration at acquisition date with subsequent changes
throughtheincomestatement;measurementofnon-controlling
(minority) interests at full fair value or the proportionate share of
thefairvalueoftheunderlyingnetassets;guidanceonissuessuch
asreacquiredrightsandvendorindemnities;andtheinclusionof
combinations by contract alone and those involving mutuals. The
revised standard becomes mandatory for the Group’s 30 June 2010
financial statements. The Group has not yet determined the potential
effect of the revised standard on the Group’s financial report.
• AASB8OperatingSegmentsintroducesthe“managementapproach”
to segment reporting. AASB 8, which becomes mandatory for the
Group’s 30 June 2010 financial statements, will require the disclosure
of segment information based on the internal reports regularly
reviewed by the Group’s Chief Operating Decision Maker in order to
assess each segment’s performance and to allocate resources to them.
Currently the Group presents segment information in respect of its
business and geographical segments (see note 2).
• RevisedAASB101PresentationofFinancialStatementsintroducesas
a financial statement (formerly “primary” statement) the “statement
of comprehensive income”. The revised standard does not change the
recognition, measurement or disclosure of transactions and events
that are required by other AASBs. The revised AASB 101 will become
mandatory for the Group’s 30 June 2010 financial statements. The
For
per
sona
l use
onl
y

25 LUCAS GROUP
Group has not yet determined the potential effect of the revised
standard on the Group’s disclosures.
• RevisedAASB123BorrowingCostsremovestheoptiontoexpense
borrowing costs and requires that an entity capitalise borrowing costs
directly attributable to the acquisition, construction or production
of a qualifying asset as part of the cost of that asset. The revised
AASB 123 will become mandatory for the Group’s 30 June 2010
financial statements and will constitute a change in accounting policy
for the Group. In accordance with the transitional provisions the
Group will apply the revised AASB 123 to qualifying assets for which
capitalisation of borrowing costs commences on or after the effective
date. The Group has not yet determined the potential effect of the
revised standard on future earnings.
• RevisedAASB127ConsolidatedandSeparateFinancialStatements
changes the accounting for investments in subsidiaries. Key changes
include: the remeasurement to fair value of any previous/retained
investment when control is obtained/lost, with any resulting gain or
lossbeingrecognisedinprofitorloss;andthetreatmentofincreases
in ownership interest after control is obtained as transactions with
equity holders in their capacity as equity holders. The revised
standard will become mandatory for the Group’s 30 June 2010
financial statements. The Group has not yet determined the potential
effect of the revised standard on the Group’s financial report.
• AASB2008-1AmendmentstoAustralianAccountingStandard-Share-
based Payment: Vesting Conditions and Cancellations changes the
measurement of share-based payments that contain non-vesting
conditions. AASB 2008-1 becomes mandatory for the Group’s 30 June
2010 financial statements. The Group has not yet determined the
potential effect of the amending standard on the Group’s financial report.
2. segment reporting
Segment information is presented in respect of the Group’s business and geographical segments. The primary format, business segment, is based on the
Group’s management and internal reporting structure.
Segment results, assets and liabilities include items directly attributable to a segment as well as those that can be allocated on a reasonable basis.
Unallocated items mainly comprise interest-earning assets and revenue, interest-bearing loans, borrowings and expenses, and corporate assets and
expenses. Inter-segment pricing is determined on an arms length basis.
Segment capital expenditure is the total cost incurred during the period to acquire segment assets that are expected to be used for more than one
period.
bUSINESS SEGMENTSThe Group comprises the following main business segments based on the Group’s reporting system:
Drilling Drilling services for degasification of underground coal mines, recovery and commercialisation
of coal seam gas and associated services and trenchless installation of pipes and conduits.
Pipelines Construction and installation of pipelines including hydrostatic testing.
Construction and infrastructure Construction and civil engineering, together with facilities management.
Drilling pipelinesconstruction & infrastructure
consolidated
2008 $’000
2007 $’000
2008 $’000
2007 $’000
2008 $’000
2007 $’000
2008 $’000
2007 $’000
Total segment revenue 88,417 67,625 218,538 73,219 117,346 75,525 424,301 216,369
Segment result 7,112 6,121 19,591 3,965 3,107 414 29,810 10,500Unallocated expenses (3,849) (4,559)Results from operating activities 25,961 5,941Net finance costs (5,553) (1,763)Profit before tax 20,408 4,178Income tax (expense)/benefit (6,940) 2,218
Net profit for the year 13,468 6,396
Depreciation and amortisation 10,970 8,480 386 357 95 129 11,451 8,966Impairment of plant and equipment — 500 — — — — — 500Impairment of intangibles — — — 1,786 — 993 — 2,779
Assets
Segment assets 134,233 65,995 59,489 50,586 29,282 28,662 223,004 145,243Unallocated assets 6,895 5,705
Total Assets 229,899 150,948
Liabilities
Segment liabilities 115,903 61,816 25,913 35,203 18,055 22,307 159,871 119,326Unallocated liabilities 4,868 1,184
Total Liabilities 164,739 120,510
Acquisitions of non-current assets 80,082 22,716 644 202 762 3 81,488 22,921
For
per
sona
l use
onl
y

A yEAR OF MILESTONES 26
SECONDARy REPORTING — GEOGRAPhICAL SEGMENTS Geographical segment revenue and assets are based on the respective geographical location of customers and assets.
australia asia/pacific consolidated2008
$’0002007
$’0002008
$’0002007
$’0002008
$’0002007
$’000Revenue from customers 421,421 190,333 2,880 26,034 424,301 216,367Other revenue — 2 — — — 2
Total revenue 421,421 190,335 2,880 26,034 424,301 216,369
Assets 226,902 148,939 2,997 2,009 229,899 150,948Acquisitions of non-current assets 79,271 22,921 2,217 — 81,488 22,921
3. financial income anD eXpenseconsolidated company
2008 $’000
2007 $’000
2008 $’000
2007 $’000
Interest income 1,173 446 1,091 386Dividend income — — 5,500 —Net foreign exchange gain 149 335 — —
Financial income 1,322 781 6,591 386
Interest expense 6,875 2,544 5,076 1,055Net foreign exchange loss — — 2 —
Financial expenses 6,875 2,544 5,078 1,055
Net financing (costs)/income (5,553) (1,763) 1,513 (669)
4. other eXpensesconsolidated company
2008 $’000
2007 $’000
2008 $’000
2007 $’000
Profit before income tax has been arrived at after charging the following items:Depreciation of property, plant and equipment 6,074 4,838 — —Amortisation of: —
Leased plant and equipment 2,605 2,121 — —Development expenditure 182 222 — —Contracts and customer relationships 2,590 1,785 — —
5,377 4,128 — —
Total depreciation and amortisation 11,451 8,966 — —
Movement in provision for doubtful debts — 143 — —Impairment of plant and equipment — 500 — —Impairment of intangible assets
Goodwill — 993 — —Impairment of pipeline rights — 1,786 — 1,786
Total impairment expense — 3,422 — 1,786
5. auDitor’s remunerationconsolidated company
2008 $
2007 $
2008 $
2007 $
Audit servicesAuditors of the Company — KPMG
Audit and review of financial reportsAustralia 347,990 244,850 17,500 17,500Overseas 7,120 4,866 — —
355,110 249,716 17,500 17,500Other services
Auditors of the Company — KPMGTaxation services 51,605 75,939 — —Other professional services 302,096 17,000 — —
353,701 92,939 — —
For
per
sona
l use
onl
y

27 LUCAS GROUP
6. income taXconsolidated company
2008 $’000
2007 $’000
2008 $’000
2007 $’000
Recognised in the income statementCurrent tax expense/(benefit)Current year 940 (2,731) (561) (242)Foreign tax losses not recognised in current year 1,019 — — —Prior years adjustments 75 (347) — (2)
2,034 (3,078) (561) (244)
Deferred tax expense/(benefit)Origination and reversal of temporary differences 4,906 2,664 (238) 182Utilisation of previously unrecognised tax losses — (1,804) — (1,804)
4,906 860 (238) (1,622)
Total income tax expense/(benefit) in income statement 6,940 (2,218) (799) (1,866)
Numerical reconciliation between tax benefit and pre-tax net profit/(loss)Profit/(loss) before tax 20,408 4,178 2,920 (3,075)Prima facie income tax expense/(benefit) calculated at 30% (2007:30%) 6,122 1,253 876 (923)Equity settled share based payments 446 — — —Non-deductible accounting interest on deferred purchase 99 — — —Non-deductible expenses 43 140 — 24Amortisation of customer contracts - non deductible 411 — — —Impairment of intangibles — 298 — —Impairment of pipeline rights — 536 — 536Foreign income taxable in Australia — — 257 226Expenses deductible in foreign country only at lower tax rate 323 49 — —Write-off of non-collectible intercompany loans — — — 77Foreign tax loss not carried forward 1,020 49 — —Research and development allowance (1,317) (1,576) — —Gain on acquisition — (816) — —Dividend received from subsidiaries not assessable — — (1,650) —Acquisition cost deductible for tax purposes (282) — (282) —Recognition of previously unrecognised tax losses — (1,804) — (1,804)
6,865 (1,871) (799) (1,864)
Income tax under/(over) provided in prior year 75 (347) — (2)
Income tax expense/(benefit) attributable to operating profit 6,940 (2,218) (799) (1,866)
7. earnings per share
Basic earnings per shareThe calculation of basic earnings per share at 30 June 2008 was based on the profit attributable to ordinary shareholders of $13,468,000 (2007: $6,396,000) and a weighted average number of shares outstanding of 54,892,487 calculated as follows:
consolidated2008
number2007
numberWeighted average number of ordinary shares (basic)Issued ordinary shares at 1 July 54,200,536 51,981,937Effect of shares issued 520,679 1,519,239Effect of exercise of management rights 171,272 169,291
Weighted average number of ordinary shares (basic) at 30 June 54,892,487 53,670,467
Diluted earnings per shareThe calculation of diluted earnings per share at 30 June 2008 was based on the profit attributable to ordinary shareholders of $15,655,000 (2007: $6,396,000) and a weighted average number of shares outstanding of 65,195,367 calculated as follows:
consolidated2008
$’0002007
$’000Profit attributable to ordinary shareholders (diluted)Profit attributable to ordinary shareholders 13,468 6,396Interest expense on convertible notes, net of tax 2,187 —
Profit attributable to ordinary shareholders (diluted) for the year ended 30 June 15,655 6,396
For
per
sona
l use
onl
y

A yEAR OF MILESTONES 28
2008 number
2007 number
Weighted average number of ordinary shares (diluted)Weighted average number of ordinary shares (basic) 54,892,487 53,670,467Effect of conversion of convertible notes 7,732,764 —Effect of share options on issue 2,570,116 646,993
Weighted average number of ordinary shares (diluted) at 30 June 65,195,367 54,317,460
The average market value of the Company’s shares for the purposes of calculating the dilutive effect of convertible notes was based on quoted market
prices for the period that the notes were outstanding.
8. cash anD cash equivalentsconsolidated company
2008 $’000
2007 $’000
2008 $’000
2007 $’000
Bank balances 16,612 18,222 5,519 13,512
9. traDe anD other receivablesconsolidated company
note
2008 $’000
2007 $’000
2008 $’000
2007 $’000
CurrentTrade debtors (net of impairment losses) 24 50,158 22,954 — 66Retentions 66 — — —Other receivables 163 755 — —Other loans 6,789 6,789 — —Impairment loss on other loans (6,789) (6,789) _ —Sundry debtors 461 429 _ —Loan to related entity 31 6,064 4,123 6,064 4,123
56,912 28,261 6,064 4,189
Non-current
Loans to controlled entities 32 — — 49,889 31,795
The amounts receivable from wholly owned entities are unsecured, interest free and payable on demand. The loan to the related party comprises a loan
made to Mr Campbell, the Company’s Chairman of the Board of Directors and Chief Executive Officer (see note 31).
10. construction work in progressconsolidated company
2008 $’000
2007 $’000
2008 $’000
2007 $’000
Construction work in progress 40,685 53,418 — —
Construction work in progress comprises:Contract costs incurred to date 585,528 296,367 — —Profit recognised to date 61,218 38,570 — —
646,746 334,937 — —
Less: progress billings (606,061) (281,519) — —
Net construction work in progress 40,685 53,418 — —
11. other current assetsconsolidated company
2008 $’000
2007 $’000
2008 $’000
2007 $’000
Prepayments 1,717 435 184 —
For
per
sona
l use
onl
y

29 LUCAS GROUP
12. property, plant anD equipment
leasehold improvements
$’000
land & buildings
$’000
plant & equipment
$’000
leased plant & equipment
$’000
capital works in progress
$’000
total
$’000Consolidated 2008At cost 24 4,306 45,316 31,235 2,750 83,631Accumulated depreciation/amortisation (10) (18) (18,678) (8,939) - (27,645)
14 4,288 26,638 22,296 2,750 55,986
Consolidated 2007At cost 105 — 32,284 18,850 2 51,241Accumulated depreciation/amortisation (81) — (13,704) (6,535) — (20,320)
24 — 18,580 12,315 2 30,921
RECONCILIATIONSReconciliations of the carrying amounts for each class of property, plant and equipment are set out below.
leasehold improvements
$’000
land & buildings
$’000
plant & equipment
$’000
leased plant & equipment
$’000
capital works in progress
$’000
total
$’000
Consolidated 2008
Carrying amount at 1 July 2007 24 — 18,580 12,315 2 30,921Additions 749 4,306 7,273 8,521 2,748 23,597Acquisitions through subsidiaries acquired — — 7,057 4,164 — 11,221Disposals (743) — (232) (99) — (1,074)Depreciation (16) (18) (6,040) — — (6,074)Amortisation — — — (2,605) — (2,605)
Carrying amount at 30 June 2008 14 4,288 26,638 22,296 2,750 55,986
Consolidated 2007Carrying amount at 1 July 2006 35 — 11,036 9,841 198 21,110Additions — — 3,773 2,376 (196) 5,953Acquisitions through subsidiaries acquired — — 9,236 621 — 9,857Disposals — — (354) (14) — (368)Depreciation (11) — (4,827) — — (4,838)Amortisation — — — (2,121) — (2,121)Impairment — — (500) — — (500)Transfer from non-current assets held for sale — — 216 1,612 — 1,828
Carrying amount at 30 June 2007 24 — 18,580 12,315 2 30,921
13. investmentsconsolidated company
2008 $’000
2007 $’000
2008 $’000
2007 $’000
Investments - listed entities 24,875 — 24,875 —Investments - other 1,240 22 2,004 1,260Deferred expenditure 41 41 — —
26,156 63 26,879 1,260
The investment in listed entities comprises an investment in Sydney Gas Limited, a company listed on the Australian Securities Exchange.
14. eXploration assetsconsolidated company
2008 $’000
2007 $’000
2008 $’000
2007 $’000
CostBalance at 1 July 6,175 3,819 — —Acquisitions 12,387 2,356 — —Transferred to development assets (14,462) — — —
Balance at 30 June 4,100 6,175 — —
For
per
sona
l use
onl
y

A yEAR OF MILESTONES 30
15. intangible Development assetsconsolidated
gas assets $’000
other $’000
total $’000
CostBalance at 30 June 2006 — 2,276 2,276Acquisitions — 92 92Balance at 30 June 2007 — 2,368 2,368
Acquisitions — 126 126Transferred from exploration assets 14,462 — 14,462Balance at 30 June 2008 14,462 2,494 16,956
Amortisation and impairment lossesBalance at 30 June 2006 — 1,140 1,140Amortisation for the year — 182 182Balance at 30 June 2007 — 1,322 1,322
Amortisation for the year — 182 182Balance at 30 June 2008 — 1,504 1,504
Carrying amountsAt 1 July 2006 — 1,136 1,136At 30 June 2007 — 1,046 1,046
At 1 July 2007 — 1,046 1,046At 30 June 2008 14,462 990 15,452
16. other intangible assetsconsolidated
customer relationships
$’000
goodwill
$’000
pipeline rights$’000
total
$’000CostBalance at 1 July 2006 — 5,432 1,786 7,218Acquisitions — through business combinations 4,758 — — 4,758Balance at 30 June 2007 4,758 5,432 1,786 11,976
Acquisitions — through business combinations 5,505 2,559 — 8,064Balance at 30 June 2008 10,263 7,991 1,786 20,040
Amortisation and impairment lossesBalance at 1 July 2006 — 607 — 607Amortisation for the year 1,785 — — 1,785Impairment loss — 993 1,786 2,779Balance 30 June 2007 1,785 1,600 1,786 5,171
Amortisation for the year 2,590 — — 2,590Balance at 30 June 2008 4,375 1,600 1,786 7,761
Carrying amountsAt 1 July 2006 — 4,825 1,786 6,611At 30 June 2007 2,973 3,832 — 6,805
At 1 July 2007 2,973 3,832 — 6,805At 30 June 2008 5,888 6,391 — 12,279
For
per
sona
l use
onl
y

31 LUCAS GROUP
16. other intangible assets (cont)company
goodwill
$’000
pipeline rights$’000
total
$’000CostBalance at 1 July 2006 2,061 1,786 3,847Balance at 30 June 2007 2,061 1,786 3,847
Balance at 30 June 2008 2,061 1,786 3,847
Amortisation and impairment lossesBalance at 1 July 2006 — — —Impairment loss — 1,786 1,786Balance at 30 June 2007 — 1,786 1,786
Balance at 30 June 2008 — 1,786 1,786
Carrying amountsAt 1 July 2006 2,061 1,786 3,847At 30 June 2007 2,061 — 2,061
At 1 July 2007 2,061 — 2,061At 30 June 2008 2,061 — 2,061
IMPAIRMENT TESTS FOR CASh GENERATING UNITS CONTAINING GOODwILLFor the purpose of impairment testing, goodwill is allocated to the Group’s operating divisions which represent the lowest level within the Group at
which the goodwill is monitored for internal management purposes.
The aggregate carrying amounts allocated to each unit are:
consolidated company2008
$’0002007
$’0002008
$’0002007
$’000Drilling 2,559 — — —Construction and infrastructure 3,832 3,832 2,061 2,061
6,391 3,832 2,061 2,061
The recoverable amount of the cash generating unit is based on value in use calculations using cash flow projections based on the following year’s budget
and plan extended over a period of 5 years. A pre-tax discount rate of 12.5% is applied adjusted for the risk of the industry in which each unit operates.
17. DeferreD taX assets anD liabilities
Recognised deferred tax assets and liabilities
Deferred tax assets and liabilities are attributable to the following:
assets liabilities net2008
$’0002007
$’0002008
$’0002007
$’0002008
$’0002007
$’000ConsolidatedConstruction work in progress — — (9,502) (6,110) (9,502) (6,110)Intangibles — — (266) (631) (266) (631)Intangible development costs — — (254) (274) (254) (274)Exploration, evaluation and development expenditure — — (5,118) (2,082) (5,118) (2,082)Convertible note issue cost — — (5) (244) (5) (244)Property, plant and equipment — 15 — — — 15Impairment of trade debtors 2,180 2,177 — — 2,180 2,177Provisions for employee benefits 1,650 974 — — 1,650 974Trade creditors 1,225 971 — — 1,225 971Other creditors and accruals 224 192 — — 224 192Unrealised foreign exchange differences 301 310 — — 301 310Tax value of loss carry-forwards recognised 8,344 10,304 — — 8,344 10,304
Tax assets/(liabilities) 13,924 14,943 (15,145) (9,341) (1,221) 5,602
Set off of tax (13,924) (9,341) 13,924 9,341 — —
Net tax assets/(liabilities) — 5,602 (1,221) — (1,221) 5,602
For
per
sona
l use
onl
y

A yEAR OF MILESTONES 32
assets liabilities net2008
$’0002007
$’0002008
$’0002007
$’0002008
$’0002007
$’000CompanyConvertible note issue cost — — (5) (244) (5) (244)Unrealised foreign exchange differences 276 276 — — 276 276Tax value of loss carry-forwards recognised 8,134 10,094 — — 8,134 10,094
Tax assets/(liabilities) 8,410 10,370 (5) (244) 8,405 10,126
Set off of tax (5) (244) 5 244 — —
Net tax assets/(liabilities 8,405 10,126 — — 8,405 10,126
Movement in temporary differences during the year:
consolidated company
Balance
01 Jul 07 $’000
recognised
in income $’000
utilisation of c/f tax
losses $’000
Balance
30 Jun 08 $’000
Balance
01 Jul 07 $’000
recognised
in income $’000
utilisation of c/f tax
losses $’000
Balance
30 Jun 08 $’000
2008Construction work in progress (6,110) (3,392) — (9,502) — — — —Intangibles (631) 365 — (266) — — — —Intangible development costs (274) 20 — (254) — — —Exploration, evaluation and development expenditure
(2,082) (3,036) — (5,118) — — — —
Convertible note issue cost (244) 239 — (5) (244) 239 — (5)Property, plant and equipment 15 (15) — — — — — —Doubtful debts impairment recognised 2,177 3 — 2,180 — — — —Provisions for employee benefits 974 676 — 1,650 — — — —Trade creditors 971 254 — 1,225 — — — —Other creditors and accruals 192 32 — 224 — — — —Unrealised foreign exchange differences 310 (9) — 301 276 — — 276Value of carried forward income tax losses recognised
10,304 — (1,960) 8,344 10,094 — (1,960) 8,134
5,602 (4,863) (1,960) (1,221) 10,126 239 (1,960) 8,405
consolidated company
Balance 01 Jul 06
$’000
acquired in business
combinations$’000
recognised
in income $’000
Balance
30 Jun 07 $’000
Balance
01 Jul 06 $’000
recognised
in income $’000
Balance
30 Jun 07 $’000
2007Construction work in progress (3,679) — (2,431) (6,110) — — —Intangibles — (1,167) 536 (631) — — —Intangible development costs (314) — 40 (274) — — —Exploration, evaluation and development expenditure
(962) — (1,120) (2,082) — — —
Convertible note issue cost (61) — (183) (244) (61) (183) (244)Plant and equipment 392 — (377) 15 — — —Doubtful debts impairment recognised 2,137 — 40 2,177 — — —Provisions for employee benefits 584 — 390 974 — — —Trade creditors 795 — 176 971 — — —Other creditors and accruals 58 — 134 192 — — —Unrealised foreign exchange differences 452 — (142) 310 276 — 276Tax value of loss carry-forwards recognised 5,199 — 5,105 10,304 4,989 5,105 10,094
4,601 (1,167) 2,168 5,602 5,204 4,922 10,126
Unrecognised deferred tax assets
As at 30 June 2008, the Group had not recognised deferred tax assets of $1,117,811 (2007: $116,565) in relation to foreign income tax losses.
The Company did not have any unrecognised deferred tax assets.
For
per
sona
l use
onl
y

33 LUCAS GROUP
18. traDe anD other payablesconsolidated company
2008 $’000
2007 $’000
2008 $’000
2007 $’000
CurrentTrade payables 60,048 31,506 376 —Other payables and accruals 23,026 34,813 256 84
83,074 66,319 632 84
Non-currentOther loans - controlled entities — — 29,361 16,217
Other than the loan from the Company’s Hong Kong subsidiary, the loans payable to controlled entities were interest free, unsecured and repayable on
demand.
19. interest-bearing loans anD liabilitiesconsolidated company
2008 $’000
2007 $’000
2008 $’000
2007 $’000
CurrentBank overdraft — secured 867 5,663 — —Other borrowings — unsecured 716 277 — —Other borrowings — secured 1,779 836 — —Deferred subsidiary acquisition consideration 3,250 1,250 — —Bank loans - secured 9,200 — 4,500 —Lease liabilities — secured 4,184 2,680 — —
19,996 10,706 4,500 —
Non-currentLease liabilities — secured 13,760 6,727 — —Other borrowings - secured 2,582 3,516 — —Deferred subsidiary acquisition consideration 5,476 2,750 — —Bank loans - secured 28,492 — 17,500 —Convertible notes — unsecured 726 24,188 726 24,188
51,036 37,181 18,226 24,188
Financing facilities
(a) The Group has access to the following lines of credit and bank guarantees
Bank overdraft - secured 8,500 5,500 8,500 5,500Other borrowings - secured 4,361 4,352 — —Lease liabilities - secured 29,501 11,546 — —Bank loan - secured 37,692 — 22,000 —
80,054 21,398 30,500 5,500
Total facilities utilised at balance date:Bank overdraft - secured 867 5,663 — —Less: Right of set off (867) (5,519) — —Net overdraft — 144 — —Other borrowings - secured 4,361 4,352 — —Lease liabilities - secured 17,944 9,407 — —Bank loan - secured 37,692 — 22,000 —
59,997 13,759 22,000 —
Total facilities not utilised at balance date:Bank overdraft - secured 8,500 5,356 8,500 5,500Other borrowings - secured — — — —Lease liabilities - secured 11,557 2,139 — —Bank loan - secured — — — —
20,057 7,495 8,500 5,500
For
per
sona
l use
onl
y

A yEAR OF MILESTONES 34
consolidated company2008
$’0002007
$’0002008
$’0002007
$’000
(b) Bond facilities provided by surety entities
Bank facilities in aggregate 50,000 40,000 — —Amount utilised 30,788 13,935 — —
Unused bond facilities 19,212 26,065 — —
Bank indemnity guarantee 5,084 3,084 3,557 1,557Amount utilised 4,381 2,123 — —Unused bond facilities 703 961 3,557 1,557
Bank standby letter of credit 2,900 2,900 2,900 2,900Amount utilised 2,900 — 2,900 —
Unused bond facilities — 2,900 — 2,900
Of the bonds utilised, $26,931,133 (2007: $9,660,573) are on projects which are yet to achieve practical completion.
LOANS AND DEbT REPAyMENT SChEDULETerms and conditions of outstanding loans were as follows:
nominal interest rate
%
finanicalyear of
maturity2008
$’0002007
$’000ConsolidatedBank overdraft 11.75 2009 867 5,663Secured bank loan 7.47 2009 - 2013 8,842 —Secured bank loan 7.35 2009 - 2013 4,550 —Secured bank loan 7.94 2009 - 2010 20,000 —Secured bank loan 7.82 2009 2,000 —Secured bank loan 10.85 2009 2,300 —Other borrowings - secured 10.25 2009 - 2012 4,265 4,004Other borrowings - secured 8.50 2009 96 252Other borrowings - unsecured 2.97 2009 716 277Deferred subsidiary acquisition consideration — 2009 - 2011 5,976 —Deferred subsidiary acquisition consideration 10.50 2009 - 2010 2,750 4,000Convertible notes 10.00 2010 726 24,188Financial lease liabilities Ave 9.50 2009 - 2012 17,944 9,407
71,032 47,791
CompanySecured bank loan 7.94 2009 - 2010 20,000 —Secured bank loan 7.82 2009 2,000 —Convertible notes 10.00 2010 726 24,188
22,726 24,188
All loans are denominated in Australian dollars.
bANk FACILITIESThe bank overdraft, bank loans, indemnity guarantee and standby letter of credit are all secured by a registered fixed and floating charge over all the
assets of the Group.
Subsequent to year-end, the Group’s bank facilities have been renegotiated as part of the acquisition of Mitchell Drilling. Refer to note 34 for further
information.
For
per
sona
l use
onl
y

35 LUCAS GROUP
19. interest-bearing loans anD liabilities (cont)
FINANCE LEASE FACILITIESThe Group’s lease liabilities are secured by the leased assets of $22,256,000 (2007: $12,315,000) which, in the event of default, revert to the lessor.
consolidated company2008
$’0002007
$’0002008
$’0002007
$’000Finance lease liabilitiesPayments
Within one year 5,518 3,304 — —Between one and five years 15,509 7,273 — —
21,027 10,577 — —
Less: interestWithin one year (1,334) (624) — —Between one and five years (1,749) (546) — —
(3,083) (1,170) — —
Total lease liabilities 17,944 9,407 — —
Lease liabilities provided for in the financial statements:Current 4,184 2,680 — —
Non-current 13,760 6,727 — —
Total lease liabilities 17,944 9,407 — —
The Group leases plant and equipment under finance leases expiring from one to four years. At the end of the lease terms, the Group has the option to
purchase the plant and equipment.
CONvERTIbLE NOTESIn June 2007, the Company issued 25,000,000 $1.00 unsecured redeemable convertible notes. The notes carry a fixed coupon of 10.0% per annum
and have a term of three years unless converted or redeemed beforehand. Interest is cumulative in the event that an interest payment is not made.
consolidated company2008
$’0002007
$’0002008
$’0002007
$’000Carrying amount at beginning of year 24,188 9,923 24,188 9,923Accreted interest capitalised — 77 — 77
Redemption of notes (1,500) (10,000) (1,500) (10,000)Conversion of notes (22,756) — (22,756) —Proceeds of issue of convertible notes — 25,000 — 25,000Transaction costs 794 (812) 794 (812)
Carrying amount at end of year 726 24,188 726 24,188
From 2 June 2008, note holders have the right to convert the notes into ordinary shares at a 15% discount to the volume weighted average sale price
of the shares over the 30 day period prior to conversion. Alternatively, if the Company decides to spin off and list its equity interests in coal seam gas
assets including the Gloucester Basin project, the notes are convertible into ordinary shares in the new company at a 15% discount to the Initial Public
Offering issue price. During the year, $22,756,459 of the notes were converted into ordinary shares at an average conversion price of $5.02 per share
and $1,500,000 of the notes were redeemed at a premium of 1.75%. The notes mature on 28 June 2010.
On or after 28 June 2008, the Company may redeem up to 50% of the notes. The Company’s right of redemption prevails over the conversion
rights of the holder. The notes carry no voting rights.
20. current taX liabilities
The current tax liability for the Group of $114,000 (2007: $75,000) represents the amount of income tax payable in respect of current and prior
financial periods.
For
per
sona
l use
onl
y

A yEAR OF MILESTONES 36
21. provisionsconsolidated company
note
2008 $’000
2007 $’000
2008 $’000
2007 $’000
CurrentEmployee benefits 23 4,751 2,702 — —Provision for contractual dispute 3,799 — — —
8,550 2,702 — —
Non-current Employee benefits 23 748 586 — —Provision for contractual dispute — 2,941 — —
748 3,527 — —
The provision for contractual dispute relates to a contract undertaken in Hong Kong in 2000 and 2001 and has been settled since year end.
22. operating leasesconsolidated company
2008 $’000
2007 $’000
2008 $’000
2007 $’000
Non-cancellable operating lease rentals are payable as follows:Less than one year 985 532 — —Between one and five years 1,164 226 — —
2,149 758 — —
The Group leases property under non-cancellable operating leases expiring from one to three years. The leases generally provide the Group with a right of
renewal. During the financial year, $1,109,000 (2007: $839,000) was recognised as an expense in the income statement in respect of operating leases.
23. employee benefitsconsolidated company
note
2008 $’000
2007 $’000
2008 $’000
2007 $’000
Provision for employee benefits, including on-costs:Current 21 4,751 2,702 — —Non-current 21 748 586 — —
5,499 3,288 — —
SUPERANNUATION PLANSBenefits provided under the superannuation funds to which the Group contributes are based on accumulated contributions and earnings for each
employee. The Group has a legal obligation to contribute to the funds in accordance with the Superannuation Guarantee Charge legislation. The amount
recognised as an expense for the financial year was $4,375,341 (2007: $1,968,683).
EMPLOyEE ShARE PLANThe Company has three employee incentive schemes approved by shareholders at the 2001, 2006 and 2007 annual general meetings. Total securities
granted but unissued under these schemes cannot exceed 15% of the total number of shares on issue.
A) MANAGEMENT RIGhTS PLAN: The management rights plan (MRP) is available to employees, non-executive directors and other persons at
the discretion of the Board. Nominated persons are granted rights to acquire shares in the Company. The issue of these rights can take the form of the
award of shares for no monetary consideration, traditional priced options or performance rights (which have no exercise price).
Each right is convertible to one ordinary share. There are no voting or dividend rights attaching to the rights nor are there voting rights attaching to
the unissued ordinary shares.
During the year, 250,000 (2007: 550,000) options were granted to the executive directors as approved by shareholders at the annual general
meeting held in November 2007. The options vest immediately but cannot be exercised for 3 years. The fair value of services received in return for the
share options granted was calculated using a Black-Scholes pricing model with the following inputs:
Grant date 23 Nov 2007 Expected volatility 51%Expiry date 23 Nov 2012 Risk free interest rate 6.4%Share price on grant date $3.40 Expected dividend yield 2.2%Exercise price $2.11 Fair Value at grant date $1.70
For
per
sona
l use
onl
y

37 LUCAS GROUP
23. employee benefits (cont)
Share based paymentsThe Company also issued rights to employees during the year under the terms of the Management Rights Plan. The rights were issued subject to the
Group achieving minimum performance criteria and the recipients complying with employment conditions. Generally, these rights vest in three tranches
commencing between one and three years after grant date and expiring two years after they vest. The fair value of the rights granted during the year
were:
Grant date 31 Aug 2007Expiry date 31 Aug 2012Share price on grant date $2.11Exercise price —Expected volatility 49% - 56%Risk free interest rate 6.2% - 6.3%Expected dividend yield 2.8%Fair value per right $1.88 - $2.05
During the year ended 30 June 2008, the Group recognised as an expense $1,494,000 (2007: $108,000) in relation to share based payments.
The fair value of the rights granted in previous years has been calculated using a Black-Scholes pricing model and allocated to each reporting period
evenly over the period from grant date to vesting date. The value disclosed is the portion of the fair value of the rights allocated to this reporting period.
The following factors and assumptions were used in determining the fair value of rights on grant date, for those share based payments granted in
previous years:
Grant date Nov 2006 June 2005 May 2004Expiry date Nov 2011 May 2009 May 2009Share price on grant date $1.08 $1.52 $1.66Exercise price $1.10 Nil NilExpected volatility 44% 39% 38%Risk free interest rate 5.7% 5.1% 5.6%Expected dividend yield 4.8% 5.6% 5.4%Fair value per right $0.25 $1.20 $1.29
Details of rights in aggregate over unissued ordinary shares at the beginning and ending of the reporting period and movements during the year are set
out below.
grant date
exercise date on or after
expiry date
number of rights at
beginning of year
rights issued
rights exercised
rights cancelled
number of rights at end of year
on issue Vested
Consolidated & Company 200728 May 2004 30 Jun 2004 28 May 2009 222,000 — (132,000) — 90,000 90,00028 May 2004 30 Jun 2005 28 May 2009 162,333 — (100,333) — 62,000 62,00028 May 2004 30 Jun 2006 28 May 2009 24,000 — (2,000) — 22,000 22,00027 June 2005 30 Jun 2005 28 May 2009 30,000 — — — 30,000 30,00027 June 2005 30 Jun 2006 28 May 2009 30,000 — — — 30,000 30,00027 June 2005 30 Jun 2007 28 May 2009 30,000 — — — 30,000 30,00024 Nov 2006 24 Nov 2009 24 Nov 2011 550,000 — — — 550,000 —31 Aug 2007 30 June 2010 30 June 2010 — 369,183 — — 369,183 369,18331 Aug 2007 30 June 2011 30 June 2011 — 369,183 — — 369,183 —31 Aug 2007 30 June 2012 31 Aug 2012 — 1,119,063 — — 1,119,063 —23 Nov 2007 23 Nov 2010 23 Nov 2012 — 250,000 — — 250,000 250,000
1,048,333 2,107,429 (234,333) — 2,921,429 883,183
b) DEFERRED ShARE PLAN: The deferred share plan (DSP) is available to chosen directors, including non-executives, and employees to allow
them to take a part of their annual remuneration in the form of shares in the Company. Shares vest from the date of issue but cannot be disposed of
until the earlier of 10 years from the date of issue or the date their employment or service with the Group ceases. No shares (2007: 100,000) were
issued during the year.
For
per
sona
l use
onl
y

A yEAR OF MILESTONES 38
C) EMPLOyEE ShARE ACqUISITION PLAN: The employee share acquisition plan (ESAP) is available to all eligible employees to acquire
ordinary shares in the Company for no consideration as a bonus component of their remuneration. The ESAP complies with current Australian tax
legislation, enabling permanent employees to have up to $1,000 of free shares per annum, in respect of an employee share scheme, excluded from
their assessable income.
Employees must have been employed by any entity within the Group for a minimum period of one year to be eligible. Shares issued under the ESAP
rank equally with other fully paid ordinary shares including full voting and dividend rights from the date they vest. No consideration for the shares is
receivable from the employees.
Shares are issued in the name of the participating employee and vest from the date of issue. However, they cannot be disposed of until the earlier of
3 years from the date of issue or the date their employment with the Group ceases. The Board has the discretion to vary this restriction. The ESAP has
no conditions that could result in a recipient forfeiting ownership of shares.
No shares were issued under this plan in either of the last two years and all shares previously issued under this plan were released from escrow in
previous years.
24. capital anD reserves
Reconciliation of movement in capital and reserves attributable to equity holders of the parent.
employee equity benefit reserve
$’000
translation reserve
$’000
share capital $’000
retained earnings/
(accumulated losses) $’000
total equity $’000
ConsolidatedBalance at 1 July 2006 704 — 29,236 (7,704) 22,236Total recognised income and expense — 306 — 6,396 6,702Issue of ordinary shares — — 1,419 — 1,419Equity settled share based payments 81 — — — 81
Balance at 30 June 2007 785 306 30,655 (1,308) 30,438
Balance at 1 July 2007 785 306 30,655 (1,308) 30,438Total recognised income and expense — 274 — 13,468 13,742Dividends to equity holders — — — (3,273) (3,273)Issue of ordinary shares — — 23,382 — 23,382Equity settled share based payments 871 — — — 871
Balance at 30 June 2008 1,656 580 54,037 8,887 65,160
CompanyBalance at 1 July 2006 — — 29,236 (7,073) 22,163Total recognised income and expense — — — (1,209) (1,209)Issue of ordinary shares — — 1,419 — 1,419Equity settled share based payments — — 81 — 81Balance at 30 June 2007 — — 30,736 (8,282) 22,454
Balance at 1 July 2007 — — 30,736 (8,282) 22,454Total recognised income and expense — — — 3,719 3,719Dividends to equity holders — — — (3,273) (3,273)Issue of ordinary shares — — 23,382 — 23,382Balance at 30 June 2008 — — 54,118 (7,836) 46,282
NATURE AND PURPOSE OF RESERvESEMPLOyEE EqUITy bENEFITS RESERvE: The employee equity benefits reserve represents expense associated with equity settled compensation
under the employee management rights plan.
TRANSLATION RESERvE: The translation reserve comprises all foreign currency differences arising from the translation of the financial statements
of foreign operations.
For
per
sona
l use
onl
y

39 LUCAS GROUP
24. capital anD reserves (cont)
ShARE CAPITAL - ORDINARy ShARES
company
2008 No. of Shares
2007 No. of Shares
Movements during the yearBalance at beginning of year 54,200,536 51,981,937Shares issued for business acquisition 285,550 1,333,333Exercise of rights under the Management Rights Plan 234,333 343,666Equity settled share based payments — 100,000Payment of fees and costs — 441,600Conversion of convertible notes 4,536,715 —
Balance at end of year 59,257,134 54,200,536
Holders of ordinary shares are entitled to receive dividends and, in the event of a winding up of the Company, to any proceeds of liquidation after all
creditors and other stockholders.
On a show of hands, every holder of ordinary shares present at a shareholder meeting in person or by proxy is entitled to one vote and upon a poll,
each share is entitled to one vote.
SUbSEqUENT EvENT: In July 2008, the Company issued 109,266 shares at $5.72 per share as the second instalment for the deferred
consideration for the acquisition of McDermott Drilling Pty Limited purchased in July 2006.
Also in July 2008, the Company issued 5,500,000 shares at $5.30 per share for cash to partially fund the acquisition of the business of Mitchell
Drilling. In August 2008, the Company issued 2,645,503 shares to the vendors of Mitchell Drilling at an issue price of $5.67 per share on settlement of
the acquisition.
In September 2008, the Company issued 240,000 shares for nil consideration following the exercise of management rights by employees.
DIvIDENDSDividends recognised by the Company during the current year are:
cents per share
total amount $’000
franked/ unfranked Date of payment
Final 2007 2.5 1,362 100% franked 28 September 2007Interim 2008 3.5 1,911 100% franked 28 March 2008
3,273
DIvIDEND NOT RECOGNISED AT yEAR ENDSince the year end, the directors have recommended of a final dividend of 4.5 cents (2007: 2.5 cents) per share franked to 15% payable on 29
September 2008. The declaration and subsequent payment of the dividend has no income tax consequences.
The financial effect of this dividend has not been brought to account in the financial statements for the financial year ended 30 June 2008 and will
be recognised in subsequent financial reports.
DIvIDEND FRANkING ACCOUNTAfter the payment of the dividend referred to above, the balance of franking credits available to shareholders of the Company for subsequent financial
years is $48,312 (2007: $1,738,000).
25. financial instruments
OvERvIEwThe Group’s activities expose it to the following risks from their use of financial instruments:
• Creditrisk;
• Liquidityrisk;and
• Marketrisk(includingcurrencyandinterestraterisks).
The Board of Directors has overall responsibility for the establishment and oversight of the risk management framework. The Board has established
the Risk Management Committee, which is responsible for developing and monitoring risk management policies. The committee reports regularly to the
Board of Directors on its activities.
For
per
sona
l use
onl
y
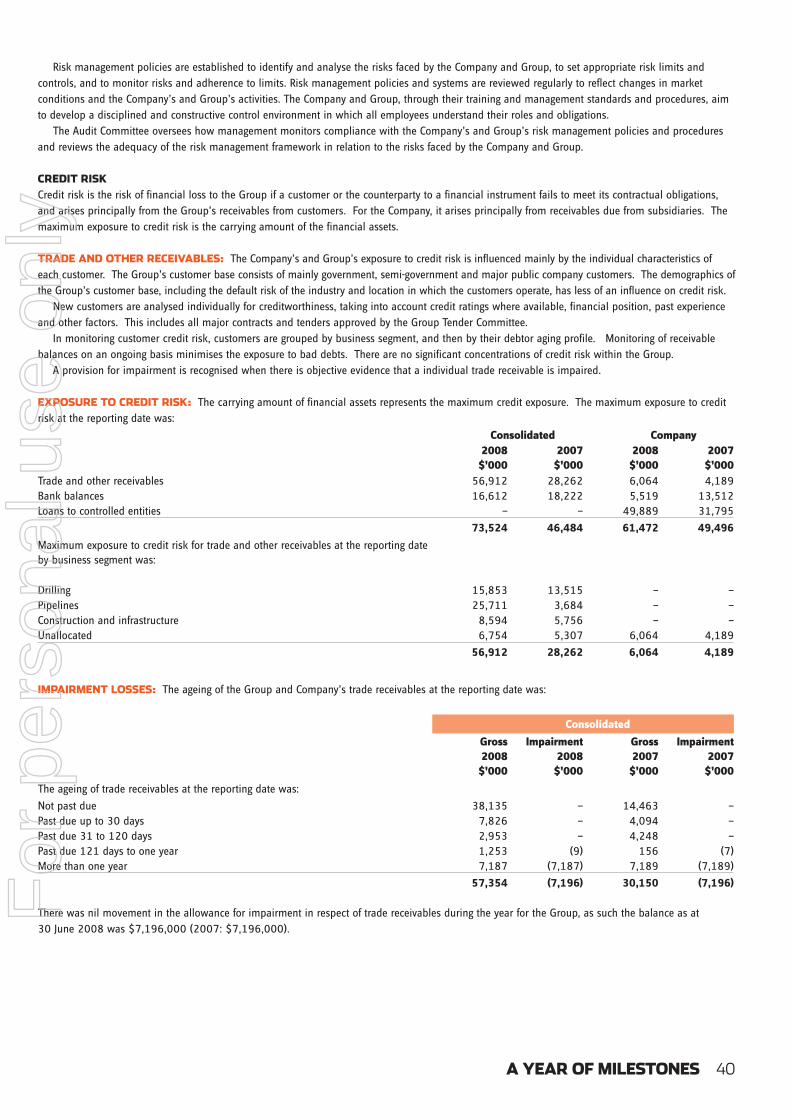
A yEAR OF MILESTONES 40
Risk management policies are established to identify and analyse the risks faced by the Company and Group, to set appropriate risk limits and
controls, and to monitor risks and adherence to limits. Risk management policies and systems are reviewed regularly to reflect changes in market
conditions and the Company’s and Group’s activities. The Company and Group, through their training and management standards and procedures, aim
to develop a disciplined and constructive control environment in which all employees understand their roles and obligations.
The Audit Committee oversees how management monitors compliance with the Company’s and Group’s risk management policies and procedures
and reviews the adequacy of the risk management framework in relation to the risks faced by the Company and Group.
CREDIT RISkCredit risk is the risk of financial loss to the Group if a customer or the counterparty to a financial instrument fails to meet its contractual obligations,
and arises principally from the Group’s receivables from customers. For the Company, it arises principally from receivables due from subsidiaries. The
maximum exposure to credit risk is the carrying amount of the financial assets.
TRADE AND OThER RECEIvAbLES: The Company’s and Group’s exposure to credit risk is influenced mainly by the individual characteristics of
each customer. The Group’s customer base consists of mainly government, semi-government and major public company customers. The demographics of
the Group’s customer base, including the default risk of the industry and location in which the customers operate, has less of an influence on credit risk.
New customers are analysed individually for creditworthiness, taking into account credit ratings where available, financial position, past experience
and other factors. This includes all major contracts and tenders approved by the Group Tender Committee.
In monitoring customer credit risk, customers are grouped by business segment, and then by their debtor aging profile. Monitoring of receivable
balances on an ongoing basis minimises the exposure to bad debts. There are no significant concentrations of credit risk within the Group.
A provision for impairment is recognised when there is objective evidence that a individual trade receivable is impaired.
ExPOSURE TO CREDIT RISk: The carrying amount of financial assets represents the maximum credit exposure. The maximum exposure to credit
risk at the reporting date was:
consolidated company2008
$’0002007
$’0002008
$’0002007
$’000Trade and other receivables 56,912 28,262 6,064 4,189Bank balances 16,612 18,222 5,519 13,512Loans to controlled entities — — 49,889 31,795
73,524 46,484 61,472 49,496
Maximum exposure to credit risk for trade and other receivables at the reporting date by business segment was:
Drilling 15,853 13,515 — —Pipelines 25,711 3,684 — —Construction and infrastructure 8,594 5,756 — —Unallocated 6,754 5,307 6,064 4,189
56,912 28,262 6,064 4,189
IMPAIRMENT LOSSES: The ageing of the Group and Company’s trade receivables at the reporting date was:
consolidatedgross 2008
$’000
impairment 2008
$’000
gross 2007
$’000
impairment 2007
$’000
The ageing of trade receivables at the reporting date was:
Not past due 38,135 — 14,463 —Past due up to 30 days 7,826 — 4,094 —Past due 31 to 120 days 2,953 — 4,248 —Past due 121 days to one year 1,253 (9) 156 (7)More than one year 7,187 (7,187) 7,189 (7,189)
57,354 (7,196) 30,150 (7,196)
There was nil movement in the allowance for impairment in respect of trade receivables during the year for the Group, as such the balance as at
30 June 2008 was $7,196,000 (2007: $7,196,000).
For
per
sona
l use
onl
y

41 LUCAS GROUP
25. financial instruments (cont)
IMPAIRMENT ALLOwANCE: Based on historic default rates, the Group believe that no impairment allowance is required for trade receivables not
past due.
The impairment allowance related to specific customers, identified as being in trading difficulties, or where specific debts are in dispute. The
impairment allowance does not include debts past due relating to customers with a good credit history, or where payments of amounts due under a
contract for such customers are delayed due to works in dispute and previous experience indicated that the amount will be paid in due course.
When the Group is satisfied that no recovery of the amount owing is possible, the amounts considered irrecoverable are written off against the
financial asset directly. At 30 June 2008, the Group has collective impairments on its trade receivables of $7,196,000 (2007: $7,196,000).
LIqUIDITy RISkLiquidity risk is the risk that the Group will not be able to meet its financial obligations as they fall due. Liquidity is managed to ensure, as far as
possible, that sufficient funds are available to meet liabilities when they fall due, under both normal and stressed conditions, without incurring
unacceptable losses or risking damage to the Group’s reputation.
The Group ensures that it has sufficient cash on demand to meet expected operational expenses, including the servicing of financial obligations, by
maintaining excess committed credit facilities of at least $5 million. The Group aims at maintaining flexibility in funding by keeping committed credit
lines available with a variety of counterparties, with a weighted average duration of at least three years. Refer Note 19 for details of lines of credit
available.
The following are the contractual maturities of financial liabilities, including estimated interest payments and excluding the impact of netting
arrangements:
contractual cash flowscarrying amount
total
6 months or less
6-12 months
1-2 years
2-5 years
more than 5 years
2008 $’000 $’000 $’000 $’000 $’000 $’000 $’000ConsolidatedTrade and other payables - unsecured 83,074 (83,074) (83,074) — — — —Bank overdraft - secured 867 (867) (867) — — — —Other borrowings - unsecured 716 (716) (716) — — — —Other borrowings - secured 4,361 (4,736) (2,013) (691) (1,383) (648) —Deferred subsidiary acquisition consideration 8,726 (9,250) (3,250) — (3,500) (2,500) —Bank loans - secured 37,692 (43,295) (2,376) (9,523) (21,725) (9,671) —Lease liabilities - secured 17,944 (21,027) (2,873) (2,645) (6,377) (9,132) —Convertible notes - unsecured 726 (892) (37) (37) (818) — —
154,106 (163,857) (95,206) (12,896) (33,803) (21,951) —
2008
CompanyTrade and other payables - unsecured 632 (632) (632) — — — —Bank loans - secured 22,000 (24,609) (732) (5,327) (18,550) — —Loans from subsidiaries - unsecured 29,361 (29,361) — — — — (29,361)Convertible notes - unsecured 726 (892) (37) (37) (818) — —
52,719 (55,494) (1,401) (5,364) (19,368) — (29,361)
contractual cash flowscarrying amount
total
6 months or less
6-12 months
1-2 years
2-5 years
more than 5 years
2007 $’000 $’000 $’000 $’000 $’000 $’000 $’000ConsolidatedTrade and other payables - unsecured 66,319 (66,319) (66,319) — — — —Bank overdraft - secured 5,663 (5,663) (5,663) — — — —Other borrowings - unsecured 277 (277) (277) — — — —Other borrowings - secured 4,352 (5,876) (1,027) (941) (1,165) (2,743) —Deferred subsidiary acquisition consideration 4,000 (4,000) (1,250) — (1,250) (1,500) —Lease liabilities - secured 9,407 (10,577) (1,751) (1,553) (3,091) (4,182) —Convertible notes - unsecured 24,188 (32,589) (1,288) (1,260) (2,527) (27,514) —
114,206 (125,301) (77,575) (3,754) (8,033) (35,939) —
2007
CompanyTrade and other payables - unsecured 84 (84) (84) — — — —Convertible notes - unsecured 24,188 (32,589) (1,288) (1,260) (2,527) (27,514) —Loans from subsidiaries - unsecured 16,217 (16,217) — — — — (16,217)
40,489 (48,890) (1,372) (1,260) (2,527) (27,514) (16,217)
For
per
sona
l use
onl
y

A yEAR OF MILESTONES 42
MARkET RISkMarket risk is the risk that changes in market prices, such as foreign exchange rates, interest rates and equity prices will affect the Group’s income
or the value of its holdings of financial instruments. The objective of market risk management is to manage and control market risk exposures within
acceptable parameters, while optimising the return.
CURRENCy RISk: The Group and the Company operate internationally and are exposed to currency risk on sales, purchases and borrowings that are
denominated in a currency other than the respective functional currencies of Group entities, primarily with respect to the US dollar, Euro, Hong Kong
dollar and Pacific francs.
The Group’s major foreign currency exposure relates to sales of services and purchases of raw materials, consumables and equipment. The Group
has certain investments in foreign operations whose net assets are exposed to foreign currency translation risk. Currency exposure arising from the net
assets of the Group’s foreign operations is managed primarily through borrowings denominated in the relevant foreign currencies.
Exposure to currency riskThe Group’s exposure to foreign currency risk at balance date was as follows, based on notional amounts in Australian dollars (in thousands):
euro usD xpf nZD hkD
2008
ConsolidatedTrade receivables — 9 — — —Trade payables (4,956) (724) (64) (12) —
Net balance sheet exposure (4,956) (715) (64) (12) —
2007
ConsolidatedTrade receivables — 15 — 1 1,840Trade payables (4,002) (1,637) (5,256) — (3)
Net balance sheet exposure (4,002) (1,622) (5,256) 1 1,837
Sensitivity analysisAt 30 June 2008, had the Australian dollar weakened/strengthen by 10% against the respective foreign currencies with all other variables held
constant, the Group post-tax profit and equity would have been $575,000 higher/$575,000 lower had the Australian dollar weakened/strengthened
against the respective currencies. The Company had no exposure to foreign currency risk at balance date.
The following significant exchange rates applied during the year:
average rate reporting date spot rate2008 2007 2008 2007
Euro 0.6102 0.6017 0.6055 0.6301USD 0.8968 0.7857 0.9583 0.8505XPF 70.36 68.08 71.6165 70.4302HKD 6.9897 6.1256 7.4380 6.6477NZD 1.1678 1.1476 1.2569 1.1001
INTEREST RATE RISk: The Group’s main interest rate risk arises from long-term borrowings. Borrowings issued at variable rates expose the Group
to cash flow interest rate risk. Borrowings at fixed rates expose the group to fair value interest rate risk.
consolidated company2008
$’0002007
$’0002008
$’0002007
$’000Fixed rate instrumentsFinancial assets 6,064 4,123 6,064 4,123Financial liabilities (17,420) (33,595) (726) (24,188)
(11,356) (29,472) 5,338 (20,065)
Variable rate instrumentsFinancial assets 16,612 18,222 5,519 13,512Financial liabilities (50,862) (10,292) (22,000) —
(34,250) 7,930 (16,481) 13,512
For
per
sona
l use
onl
y
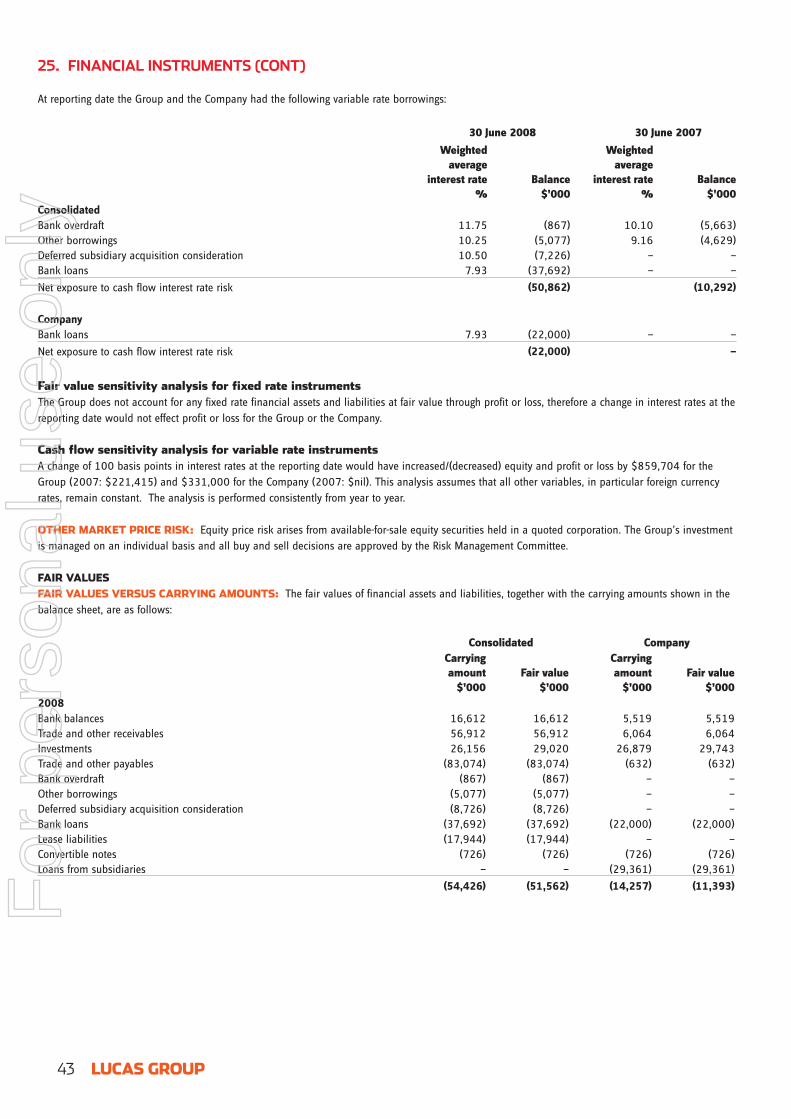
43 LUCAS GROUP
25. financial instruments (cont)
At reporting date the Group and the Company had the following variable rate borrowings:
30 June 2008 30 June 2007
weighted average
interest rate %
Balance $’000
weighted average
interest rate %
Balance $’000
ConsolidatedBank overdraft 11.75 (867) 10.10 (5,663)Other borrowings 10.25 (5,077) 9.16 (4,629)Deferred subsidiary acquisition consideration 10.50 (7,226) — —Bank loans 7.93 (37,692) — —
Net exposure to cash flow interest rate risk (50,862) (10,292)
CompanyBank loans 7.93 (22,000) — —
Net exposure to cash flow interest rate risk (22,000) —
Fair value sensitivity analysis for fixed rate instrumentsThe Group does not account for any fixed rate financial assets and liabilities at fair value through profit or loss, therefore a change in interest rates at the
reporting date would not effect profit or loss for the Group or the Company.
Cash flow sensitivity analysis for variable rate instrumentsA change of 100 basis points in interest rates at the reporting date would have increased/(decreased) equity and profit or loss by $859,704 for the
Group (2007: $221,415) and $331,000 for the Company (2007: $nil). This analysis assumes that all other variables, in particular foreign currency
rates, remain constant. The analysis is performed consistently from year to year.
OThER MARkET PRICE RISk: Equity price risk arises from available-for-sale equity securities held in a quoted corporation. The Group’s investment
is managed on an individual basis and all buy and sell decisions are approved by the Risk Management Committee.
FAIR vALUESFAIR vALUES vERSUS CARRyING AMOUNTS: The fair values of financial assets and liabilities, together with the carrying amounts shown in the
balance sheet, are as follows:
consolidated companycarrying amount
$’000
fair value
$’000
carrying amount
$’000
fair value
$’0002008Bank balances 16,612 16,612 5,519 5,519Trade and other receivables 56,912 56,912 6,064 6,064Investments 26,156 29,020 26,879 29,743Trade and other payables (83,074) (83,074) (632) (632)Bank overdraft (867) (867) — —Other borrowings (5,077) (5,077) — —Deferred subsidiary acquisition consideration (8,726) (8,726) — —Bank loans (37,692) (37,692) (22,000) (22,000)Lease liabilities (17,944) (17,944) — —Convertible notes (726) (726) (726) (726)Loans from subsidiaries — — (29,361) (29,361)
(54,426) (51,562) (14,257) (11,393)For
per
sona
l use
onl
y

A yEAR OF MILESTONES 44
consolidated companycarrying amount
$’000
fair value $’000
carrying amount
$’000
fair value $’000
2007Bank balances 18,222 18,222 13,512 13,512Trade and other receivables 30,906 30,906 66 66Investments 63 63 1,260 1,260Trade and other payables (66,319) (66,319) (84) (84)Bank overdraft (5,663) (5,663) — —Other borrowings (4,629) (4,629) — —Deferred subsidiary acquisition consideration (4,000) (4,000) — —Bank loans — — — —Lease liabilities (9,407) (9,407) — —Convertible notes (24,188) (24,188) (24,188) (24,188)Loans from subsidiaries — — (16,217) (16,217)
(65,015) (65,015) (25,651) (25,651)
The following methods and assumptions are used in estimating the fair values of financial instruments:
• Loansandborrowings,andfinanceleases–presentvalueoffutureprincipalandinterestcashflow,discountedatthemarketrateofinterestatthe
reporting date
• Tradeandotherreceivablesandpayables–carryingamountequalsfairvalue
26. interests in Joint ventures Joint venture name
principal activities
participation
interest
contribution to operating results of the
group2008
%2007
%2008
$’0002007
$’000Amec Spie Capag Lucas Engineering, design, procurement & construction of pipeline 50 50 121 157Lucas Molopo Exploration for methane gas 70 70 — —Eastern Pipeline Alliance Pipe laying and related construction activities 46.8 47.5 16,340 4,848
Included in the assets and liabilities of the Group are the following assets and liabilities employed in the joint ventures.
consolidated company2008
$’0002007
$’0002008
$’0002007
$’000Assets
Current assetsCash and cash equivalents 3,270 493 — —Trade and other receivables 15,079 40 — —Other 131 — — —Construction work in progress 5,615 28,791 — —
Total current assets 24,095 29,324 — —
Non-current assetsExploration assets 1,582 6,175 — —Intangible development assets 14,462 — — —
Total assets 40,139 35,499 — —
Liabilities
Current liabilitiesTrade and other payables 16,018 24,068 — —
Total liabilities 16,018 24,068 — —
The exploration and intangible development assets relates to the Group’s interests in the Gloucester and Surat Basins. The recoverability of their carrying
amounts is dependent of the successful development and commercial exploitation or sale of the respective area of interest.
For
per
sona
l use
onl
y

45 LUCAS GROUP
27. consoliDateD entities
The financial statements at 30 June 2008 include the following controlled entities. The financial years of all the controlled entities are the same as that
of the parent entity.
name of entity
country of
incorporation
ownership interest2008
%2007
%Parent entity
AJ Lucas Group Limited
Controlled entities
AJ Lucas Operations Pty Limited Australia 100 100AJ Lucas Plant & Equipment Pty Limited Australia 100 100AJ Lucas Drilling Pty Limited Australia 100 100AJ Lucas Pipelines Pty Limited Australia 100 100AJ Lucas Testing Pty Limited Australia 100 100Smart Electrical & Power Services Pty Limited Australia 100 100AJ Lucas Joint Ventures Pty Limited Australia 100 100Coastal Sand Technologies Pty Limited Australia 100 100AJ Lucas (Hong Kong) Limited Hong Kong 100 100Lucas Energy Pty Limited Australia 100 100AJ Lucas Coal Technologies Pty Limited Australia 100 100AJ Lucas (USA) Inc. USA 100 100Lucas Contract Drilling Pty Ltd Australia 100 100Wholly owned subsidiary of Lucas Contract Drilling Pty Ltd
McDermott Drilling Pty Ltd Australia 100 100Lucas Stuart Pty Limited Australia 100 100Wholly owned subsidiaries of Lucas Stuart Pty Ltd
Ketrim Pty Limited Australia 100 100Stuart Painting Services Pty Ltd Australia 100 100Lucas Stuart Projects Pty Ltd Australia 100 100
Jaceco Drilling Pty Ltd Australia 100 —Geosearch Drilling Service Pty Ltd Australia 100 —Arawn Energy Ltd Canada 60 —Lucas Energy (UK) Limited England 99 —257 Clarence Street Pty Limited Australia 100 —Lucas SARL New Caledonia 100 100
28. contingencies
Details of contingent liabilities and contingent assets where the probability of future payments/receipts is not considered remote are set out below, as
well as details of contingent liabilities and contingent assets, which although considered remote, the directors consider should be disclosed.
The directors are of the opinion that provisions are not required in respect of these matters, as it is not probable that a future sacrifice of economic
benefits will be required or the amount is not capable of reliable measurement.
CONTINGENT LIAbILITIES NOT CONSIDERED REMOTEThe Group has received a claim from a customer in relation to a construction contract which was completed by the Group in 2001. While liability is
not admitted, if defence against the claim is unsuccessful, claims could amount to $2,098,000 plus legal and rectification costs. Based on legal advice,
the directors do not expect the outcome of the action to have a material impact on the Group’s financial position.
CONTINGENT ASSETS NOT CONSIDERED REMOTEThe Group has claimed amounts from a previous customer in relation to works on a construction contract which was completed in 2003. Subsequent
to year-end, the Group was awarded contract sums, plus interest and costs in relation to the claim. Amounts recognised by the Group as being
receivable in relation to the claim are materially consistent with the contract sums and interest awarded. No amounts have been recognised by the
Group in relation to recovery of costs as the quantum is subject to court determination.
JOINT vENTURESUnder the joint venture agreements (see note 26) the relevant AJ Lucas Group company is jointly and severally liable for all the liabilities incurred by
the joint ventures. As at 30 June 2008, the assets of the joint venture were sufficient to meet such liabilities. The liabilities of the joint ventures not
included in the consolidated financial statements amounted to $18,187,000 (2007: $26,593,000).
For
per
sona
l use
onl
y

A yEAR OF MILESTONES 46
GUARANTEES AND SURETy bONDSBank guarantees and surety bonds are issued to third parties arising out of dealings in the normal course of business by controlled entities (see note 19).
INDEMNITIESIndemnities have been provided to directors and certain executive officers of the Company in respect of liabilities to third parties arising from their
positions, except where the liability arises out of conduct involving a lack of good faith. No monetary limit applies under these indemnities. There is no
known current exposure under these indemnities.
consolidated company2008
$’0002007
$’0002008
$’0002007
$’000Total estimated contingent liabilities 39,198 15,769 39,198 15,769
29. reconciliation of cash flows from operating activitiesconsolidated company
notes
2008 $’000
2007 $’000
2008 $’000
2007 $’000
(a) Reconciliation of cashFor the purposes of the statements of cash flows, cash includes cash at bank and on hand. Cash as at the end of the financial year as shown in the statements of cash flows is reconciled to the related items in the balance sheet as follows:
Cash assets 8 16,612 18,222 5,519 13,512Bank overdraft 19 (867) (5,663) — —
Total cash 15,745 12,559 5,519 13,512
(b) Cash flows from operating activitiesProfit/(loss) for the year 13,468 6,396 3,719 (1,209)Adjustments for: —
Interest on capitalised leases 1,193 767 — —Gain on sale of non-current assets (24) (87) — —Interest income receivable (626) — (626)Depreciation of plant and equipment 6,074 4,838 — —Impairment of plant and equipment — 500 — —Impairment of intangible assets — 2,779 — 1,786Impairment losses — 144 — —
Amortisation of:Leased assets 2,605 2,121 — —Intangibles 2,590 1,785 — —Development expenditure 182 222 — —
Borrowing cost for issue of convertible notes 794 — 794 —Share based payments — 473 — 339Discount on acquisition of subsidiary — (2,723) — —
Operating profit/(loss) before changes in working capital and provisions 26,256 17,215 3,887 916
Change in receivables (25,222) (6,453) 66 (66)Change in other current assets (655) 74 (184) 204Change in construction work in progress 12,733 (27,848) — —Change in payables 18,856 26,604 172 (180)Change in other liabilities 7,897 — — —Change in provisions for employee entitlements 2,211 1,339 — —Change in other provisions 858 (405) — —Change in loans to controlled entities — — (9,520) 2,776Change in tax balances 6,862 (924) 1,721 (4,922)Change in reserves 274 — — —
Net cash from operating activities 50,070 9,602 (3,858) (1,272)
(c) Non-cash financing and investment activities
During the year, the Group acquired plant and equipment with an aggregate fair value of $8,521,000 (2007: $2,376,000) by means of finance leases.
These purchases are not reflected in the Statements of Cash Flows.
(d) Financing arrangements
Refer note 19.
For
per
sona
l use
onl
y

47 LUCAS GROUP
30. acquisition of subsiDiary
2008On 10 August 2007, the Company acquired 100% of the issued capital of each of Jaceco Drilling Pty Limited and Geosearch Drilling Service Pty Limited
trading as a partnership known as Capricorn Weston Drilling Group, a Queensland based drilling group, for a purchase consideration of $21.0 million
including assumption of existing debt of $4.6 million. The consideration is payable in instalments with $10.0 million paid at settlement and the
balance payable over three years in annual instalments. The initial consideration was paid entirely out of borrowings. Deferred consideration has been
discounted using a market rate of interest for similar securities.
In the period to 30 June 2008, Capricorn Weston Drilling Group contributed net profit before interest and tax of $6.2 million. If the acquisition had
occurred on 1 July 2007, management estimates that consolidated revenue would have been $426.0 million and net profit before interest and tax
would have been $26.6 million.
The acquisition had the following effect on the Group’s assets and liabilities on acquisition date:
recognised values on acquisition
$’000
fair value adjustments
$’000
pre-acquisition carrying amounts
$’000Cash and cash equivalents 277 — 277Trade and other receivables 1,516 — 1,516Plant and equipment 11,221 1,567 9,654Other assets 627 — 627Intangibles 5,505 5,505 —Trade and other payables (479) — (479)Other financial liabilities (4,763) — (4,763)Provisions (216) — (216)Net identifiable assets and liabilities 13,688 7,072 6,616Goodwill on acquisition 2,559Consideration 16,247Less deferred consideration payable (5,977)Less debt funding (9,993)Net cash inflow 277
The consideration above includes acquisition costs of $182,000.
The Company commissioned an independent expert to conduct an analysis of the fair value of the plant and equipment and identifiable intangible
assets of Capricorn Weston Drilling Group on its acquisition. Following this analysis, the Company has determined a carrying value of $5.5 million for
customer contracts and relationships.
The goodwill recognised on the acquisition is attributable mainly to the skills and technical talent of the workforce of the acquired business and the
synergies expected to be achieved from integrating the company into the Group’s existing drilling business.
2007On 31 July 2006, the Company acquired McDermott Drilling Pty Limited, a New South Wales based drilling company, for a consideration of $8.0 million
of which $4.0 million was deferred and is payable in equal instalments on the first three anniversary dates after the date of acquisition. The initial
consideration was funded as to $1.0 million through the issue of 1,333,333 shares at an issue price of $0.75 cents per share, being a discount of 2.5%
to their market price at the date of purchase, with the balance by a combination of the Group’s resources and debt. The first two instalments of the
deferred consideration were paid on 31 July 2008. The final instalment is payable on 31 July 2009.
The acquisition had the following effect on the consolidated entity’s assets and liabilities on acquisition date:
Recognised values on acquisition
$’000
Fair value adjustments
$’000
Pre-acquisition carrying amounts
$’000Trade and other receivables 3,595 — 3,595Plant and equipment 9,858 4,981 4,877Other assets 1,628 — 1,628Intangibles 4,757 4,757 —Trade and other payables (1,063) — (1,063)Other financial liabilities (4,989) — (4,989)Deferred tax liability (1,167) (1,167) —Provisions (1,041) — (1,041)Net identifiable assets and liabilities 11,578 8,571 3,007Discount on acquisition (2,723)Consideration 8,855Less deferred consideration payable (4,000)Less consideration satisfied by the issue of shares (1,027)Less debt funding and other finance (3,499)Net cash inflow 329
For
per
sona
l use
onl
y

A yEAR OF MILESTONES 48
The consideration above includes acquisition costs of $855,000.
The Company has determined a carrying value of $4,757,000 for customer contracts and relationships based on an independent expert’s report.
31. key management personnel Disclosures
The following were key management personnel of the Group at any time during the reporting period and unless otherwise indicated were key
management personnel for the entire period.
ExECUTIvE DIRECTORS•AllanCampbell(ChairmanandChiefExecutiveOfficer)
•IanStuart-Robertson
NON-ExECUTIvE DIRECTORS•AndrewLukas
•MartinGreen
•GarryO’Meally
Mr Lukas was an Executive Director of the Group until 19 March 2008 when he was appointed Chief Executive Officer of Sydney Gas Limited following
which he became a Non-Executive Director.
ExECUTIvES•IanRedfern(ChiefOperatingOfficer)
•KevinLester(GeneralManager-Pipelines)
•MarkSummergreene(ChiefFinancialOfficer)
•BrianBurden(GeneralManager-ConstructionandInfrastructure)
•BrettTredinnick(GeneralManager-Drilling)
•MarkTonkin(GeneralManager-StrategyandPlanning)
kEy MANAGEMENT PERSONNEL COMPENSATIONThe key management personnel compensation is:
consolidated2008
$2007
$Short-term employee benefits 2,548,353 2,420,398Other long term benefits — —Post-employment benefits 153,332 132,687Share based payments 626,346 118,448
3,328,031 2,617,533
INDIvIDUAL DIRECTORS AND ExECUTIvES COMPENSATION DISCLOSURES Information regarding individual directors and executives compensation is provided in the Remuneration Report section of the Directors’ Report on
pages 8 to 13.
Apart from the details disclosed in this note, no director has entered into a material contract with the Company or the Group since the end of the
previous financial year and there were no material contracts involving directors’ interests existing at year-end.
LOANS TO kEy MANAGEMENT PERSONNEL AND ThEIR RELATED PARTIES (CONSOLIDATED)Details regarding loans outstanding at the reporting date to key management personnel and their related parties, where the individual’s aggregate loan
balance exceeds $100,000 at any time in the reporting period, are as follows:
Balance 1 July 2007
$
Balance 30 June 2008
$
interest payable in
the reporting period
$
highest balance
in period $
Allan Campbell 4,122,759 6,063,617 625,886 6,063,617
The loan is due for repayment by 30 June 2009 and is secured by a Deed of Guarantee and Indemnity. Interest is payable at 12.5% per annum.
For
per
sona
l use
onl
y
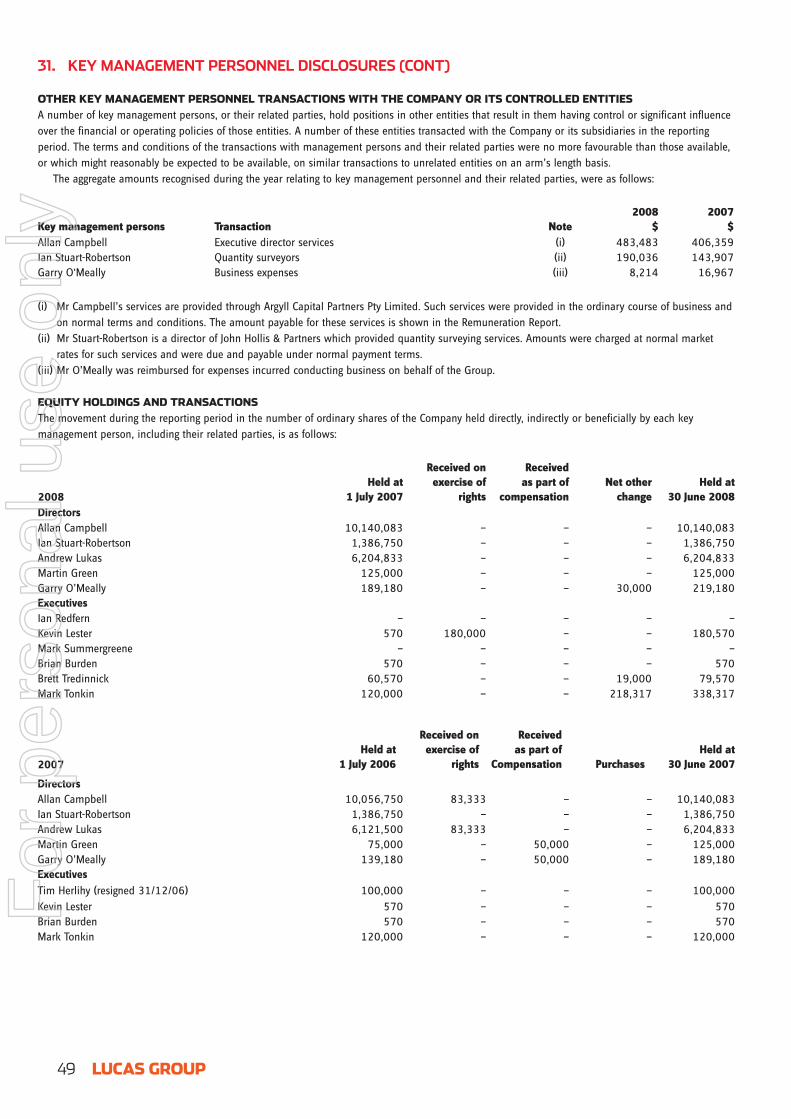
49 LUCAS GROUP
31. key management personnel Disclosures (cont)
OThER kEy MANAGEMENT PERSONNEL TRANSACTIONS wITh ThE COMPANy OR ITS CONTROLLED ENTITIESA number of key management persons, or their related parties, hold positions in other entities that result in them having control or significant influence
over the financial or operating policies of those entities. A number of these entities transacted with the Company or its subsidiaries in the reporting
period. The terms and conditions of the transactions with management persons and their related parties were no more favourable than those available,
or which might reasonably be expected to be available, on similar transactions to unrelated entities on an arm’s length basis.
The aggregate amounts recognised during the year relating to key management personnel and their related parties, were as follows:
key management persons
transaction
note
2008 $
2007 $
Allan Campbell Executive director services (i) 483,483 406,359Ian Stuart-Robertson Quantity surveyors (ii) 190,036 143,907Garry O'Meally Business expenses (iii) 8,214 16,967
(i) Mr Campbell’s services are provided through Argyll Capital Partners Pty Limited. Such services were provided in the ordinary course of business and
on normal terms and conditions. The amount payable for these services is shown in the Remuneration Report.
(ii) Mr Stuart-Robertson is a director of John Hollis & Partners which provided quantity surveying services. Amounts were charged at normal market
rates for such services and were due and payable under normal payment terms.
(iii) Mr O’Meally was reimbursed for expenses incurred conducting business on behalf of the Group.
EqUITy hOLDINGS AND TRANSACTIONSThe movement during the reporting period in the number of ordinary shares of the Company held directly, indirectly or beneficially by each key
management person, including their related parties, is as follows:
2008
held at
1 July 2007
received on exercise of
rights
received as part of
compensation
net other
change
held at
30 June 2008DirectorsAllan Campbell 10,140,083 — — — 10,140,083Ian Stuart-Robertson 1,386,750 — — — 1,386,750Andrew Lukas 6,204,833 — — — 6,204,833Martin Green 125,000 — — — 125,000Garry O’Meally 189,180 — — 30,000 219,180ExecutivesIan Redfern — — — — —Kevin Lester 570 180,000 — — 180,570Mark Summergreene — — — — —Brian Burden 570 — — — 570Brett Tredinnick 60,570 — — 19,000 79,570Mark Tonkin 120,000 — — 218,317 338,317
2007
held at
1 July 2006
received on exercise of
rights
received as part of
compensation
purchases
held at
30 June 2007
DirectorsAllan Campbell 10,056,750 83,333 — — 10,140,083Ian Stuart-Robertson 1,386,750 — — — 1,386,750Andrew Lukas 6,121,500 83,333 — — 6,204,833Martin Green 75,000 — 50,000 — 125,000Garry O’Meally 139,180 — 50,000 — 189,180ExecutivesTim Herlihy (resigned 31/12/06) 100,000 — — — 100,000
Kevin Lester 570 — — — 570Brian Burden 570 — — — 570Mark Tonkin 120,000 — — — 120,000
For
per
sona
l use
onl
y

A yEAR OF MILESTONES 50
OPTIONS AND RIGhTS OvER EqUITy INSTRUMENTS GRANTED AS COMPENSATIONThe movement during the reporting period in the number of rights or options over ordinary shares in the Company held directly, indirectly or
beneficially, by each key management person, including their related parties, is as follows:
2008
held at
1 July 2007
cancelled
exercised
granted as
compensation
held at
30 June 2008
Vested during
the year
Vested and exercisable at 30 June 2008
DirectorsAllan Campbell 250,000 — — 110,000 360,000 110,000 110,000Ian Stuart-Robertson 150,000 — — 70,000 220,000 70,000 70,000Andrew Lukas 150,000 — — 70,000 220,000 70,000 70,000ExecutivesIan Redfern 75,000 — — 129,811 204,811 34,239 109,239Kevin Lester 180,000 — (180,000) 89,357 89,357 20,543 20,543Mark Summergreene — — — 82,209 82,209 18,900 18,900Brian Burden 30,000 — — 80,422 110,422 18,489 48,489Brett Tredinnick — — — 73,202 73,202 16,829 16,829Mark Tonkin — — — 57,353 57,353 10,742 10,742
2007
held at
1 July 2006
cancelled
exercised
granted as
compensation
held at
30 June 2007
Vested during
the year
Vested and exercisable at 30 June 2007
DirectorsAllan Campbell 250,000 (166,667) (83,333) 250,000 250,000 — —Ian Stuart-Robertson — — — 150,000 150,000 — —Andrew Lukas 250,000 (166,667) (83,333) 150,000 150,000 — —ExecutivesIan Redfern 75,000 — — — 75,000 25,000 75,000Kevin Lester 180,000 — — — 180,000 — 180,000Brian Burden 30,000 — — — 30,000 — 30,000
32. non-key management personnel Disclosures
The Group has a related party relationship with its subsidiaries (see note 27) and joint ventures (see note 26). These entities trade with each other from
time to time on normal commercial terms.
Other than amounts owing to AJ Lucas (Hong Kong) Limited, on which interest is paid at 7.0% per annum, no interest is payable on inter-company
balances. The aggregate amounts included in the profit from ordinary activities before income tax that resulted from transactions between entities in the
Group are:
2008 $’000
2007 $’000
Interest expense 857 749
Receivables: Aggregated amount receivable from wholly owned entities of the Company:Coastal Sand Technologies Pty Limited 55 55
Less: Provision for doubtful loan (55) (55)
— —
AJ Lucas Joint Ventures Pty Limited 3,910 3,940AJ Lucas Operations Pty Limited 24,314 14,386Lucas Energy Pty Limited 15,047 4,552AJ Lucas Coal Technologies Pty Limited 4,731 7,669McDermott Drilling Pty Limited 1,846 1,207Smart Electrical & Power Services Pty Limited 14 14AJ Lucas (USA) Inc. 27 27
49,889 31,795
Payables: Aggregate amount payable to wholly owned entities of the Company:Lucas Stuart Pty Limited 14,643 5,537AJ Lucas (Hong Kong) Limited 12,337 10,680Geosearch Drilling Service Pty Limited 2,381 —
29,361 16,217
For
per
sona
l use
onl
y

51 LUCAS GROUP
33. DeeD of cross guarantee
On 16 June 2008, several of the entities in the Group entered into a Deed
of Cross Guarantee. Pursuant to ASIC Class Order 98/1418 (as amended)
dated 13 August 1998, the Group’s subsidiaries entering into the Deed
are relieved from the Corporations Act 2001 requirements to prepare, have
audited and lodge financial reports, and directors’ reports.
The effect of the Deed is that the Company guarantees to each creditor
payment in full of any debt in the event of winding up of any of the
subsidiaries under certain provisions of the Corporations Act 2001. If a
winding up occurs under other provisions of the Act, the Company will only
be liable in the event that after six months any creditor has not been paid
in full. The subsidiaries have also given similar guarantees in the event that
the Company is wound up.
The subsidiaries subject to the Deed are:
name of entityAJ Lucas Operations Pty Limited AJ Lucas Plant & Equipment Pty LimitedAJ Lucas Drilling Pty LimitedAJ Lucas Pipelines Pty LimitedAJ Lucas Testing Pty LimitedSmart Electrical & Power Services Pty LimitedAJ Lucas Joint Ventures Pty LimitedCoastal Sand Technologies Pty LimitedLucas Energy Pty LimitedAJ Lucas Coal Technologies Pty LimitedLucas Contract Drilling Pty LtdMcDermott Drilling Pty LtdLucas Stuart Pty Limited Ketrim Pty LimitedStuart Painting Services Pty LtdLucas Stuart Projects Pty LtdJaceco Drilling Pty LtdGeosearch Drilling Service Pty Ltd
A consolidated summarised income statement and consolidated balance
sheet, comprising the Company and controlled entities which are a party to
the Deed, after eliminating all transactions between parties to the Deed of
Cross Guarantee, at 30 June 2008 are set out as follows:
SUMMARISED INCOME STATEMENT AND RETAINED PROFITS
consolidated2008
$Profit before tax 21,793Income tax expense (6,940)Profit after tax 14,853Retained loss at beginning of the year (10,699)Dividends recognised during the year (3,273)Retained profits at end of year 881
Attributable to:Equity holders of the company 14,853Profit for the period 14,853
bALANCE ShEET
consolidated2008
$Current assetsCash and cash equivalents 16,448Trade and other receivables 56,847Construction work in progress 40,685Other 1,263
Total current assets 115,243
Non-current assetsDevelopment assets 15,452Exploration assets 4,750Investments 26,117Intangible assets 12,279Property, plant and equipment 53,861
Total non-current assets 112,459
Total assets 227,702
Current liabilitiesTrade and other payables 79,273Interest-bearing loans and borrowings 17,696Income tax payable 115Provisions 8,550
Total current liabilities 105,634
Non-current liabilitiesTrade and other payables 12,399Interest-bearing loans and borrowings 51,036Deferred tax liabilities 1,311Provisions 748
Total non-current liabilities 65,494
Total liabilities 171,128
Net assets 56,574
EquityIssued capital 54,118Reserves 1,575Retained earnings 881
Total equity 56,574
34. events subsequent to balance Date
On 23 July 2008, the Company purchased the business of Mitchell Drilling,
the largest specialist drilling company for the coal seam gas industry in
Queensland. The purchase price of $150 million was funded by a $15 million
equity placement to the vendor, with the balance out of an equity placement
to institutional shareholders of $29.5 million, deferred consideration of $15
million and increased borrowing facilities. At the same time, the Group’s bank
facilities have been renegotiated and their terms extended.
Subsequent to year-end, the directors have declared a final ordinary
dividend of 4.5¢ per share, franked to 15%.
Other than these matters, there has not arisen in the interval between the
end of the financial year and the date of this report any item, transaction or
event of a material or unusual nature likely, in the opinion of the directors of
the Company, to affect significantly the operations of the Group, the results of
those operations, or the state of affairs of the Group, in future financial years.
For
per
sona
l use
onl
y

A yEAR OF MILESTONES 52
Directors’ Declaration
1 In the opinion of the directors of AJ Lucas Group Limited (the Company):
(a) the financial statements and notes, set out on pages 15 to 51 and the Remuneration Report included in the Directors’ Report, set out on pages
8 to 13, are in accordance with the Corporations Act 2001, including:
(i) giving a true and fair view of the Company’s and the Group’s financial position as at 30 June 2008 and of their performance for the
financialyearendedonthatdate;and
(ii) complying with Australian Accounting Standards (including the Australian Accounting Interpretations) and the Corporations Regulations
2001;
(b) thefinancialreportalsocomplieswithInternationalFinancialReportingStandardsasdisclosedinnote1;and
(c) there are reasonable grounds to believe that the Company will be able to pay its debts as and when they become due and payable.
2 There are reasonable grounds to believe that the Company and the group entities identified in Note 33 will be able to meet any obligations or
liabilities to which they are or may become subject to by virtue of the Deed of Cross Guarantee between the Company and those group entities
pursuant to ASIC Class Order 98/1418.
3 The directors have been given the declarations required by Section 295A of the Corporations Act 2001 from the Chief Executive Officer and Chief
Financial Officer for the financial year ended 30 June 2008.
Signed in accordance with a resolution of the directors:
Allan Campbell
Director
25 September 2008
For
per
sona
l use
onl
y

53 LUCAS GROUP
inDepenDent auDitor’s report to the members of aJ lucas group limiteD
REPORT ON ThE FINANCIAL REPORTWe have audited the accompanying financial report of AJ Lucas
Group Limited (the Company), which comprises the balance sheets as
at 30 June 2008, and the income statements, statements of recognised
income and expense and cash flow statements for the year ended on that
date, a description of significant accounting policies and other explanatory
notes 1 to 34 set out on pages 15 to 51 and the Directors’ Declaration
set out on page 52 of the Group comprising the Company and the entities
it controlled at year end or from time to time during the financial year.
Directors’ responsibility for the financial report
The directors of the Company are responsible for the preparation and
fair presentation of the financial report in accordance with Australian
Accounting Standards (including the Australian Accounting Interpretations)
and the Corporations Act 2001. This responsibility includes establishing
and maintaining internal control relevant to the preparation and
fair presentation of the financial report that is free from material
misstatement,whetherduetofraudorerror;selectingandapplying
appropriateaccountingpolicies;andmakingaccountingestimatesthat
are reasonable in the circumstances. In note 1, the directors also state, in
accordance with Australian Accounting Standard AASB 101 Presentation
of Financial Statements, that the financial report, comprising the financial
statements and notes, complies with International Financial Reporting
Standards.
auDitor’s responsibility
Our responsibility is to express an opinion on the financial report
based on our audit. We conducted our audit in accordance with
Australian Auditing Standards. These Auditing Standards require that we
comply with relevant ethical requirements relating to audit engagements
and plan and perform the audit to obtain reasonable assurance whether
the financial report is free from material misstatement.
An audit involves performing procedures to obtain audit evidence
about the amounts and disclosures in the financial report. The procedures
selected depend on the auditor’s judgement, including the assessment
of the risks of material misstatement of the financial report, whether due
to fraud or error. In making those risk assessments, the auditor considers
internal control relevant to the entity’s preparation and fair presentation
of the financial report in order to design audit procedures that are
appropriate in the circumstances, but not for the purpose of expressing an
opinion on the effectiveness of the entity’s internal control. An audit also
includes evaluating the appropriateness of accounting policies used and
the reasonableness of accounting estimates made by the directors, as well
as evaluating the overall presentation of the financial report.
We performed the procedures to assess whether in all material
respects the financial report presents fairly, in accordance with the
Corporations Act 2001 and Australian Accounting Standards (including
the Australian Accounting Interpretations), a view which is consistent with
our understanding of the Company’s and the Group’s financial position
and of their performance.
We believe that the audit evidence we have obtained is sufficient and
appropriate to provide a basis for our audit opinion.
inDepenDence
In conducting our audit, we have complied with the independence
requirements of the Corporations Act 2001.
auDitor’s opinion
In our opinion:
(a) the financial report of AJ Lucas Group Limited is in accordance with
the Corporations Act 2001, including:
(i) giving a true and fair view of the Company’s and the Group’s
financial position as at 30 June 2008 and of their performance
fortheyearendedonthatdate;and
(ii) complying with Australian Accounting Standards (including the
Australian Accounting Interpretations) and the Corporations
Regulations 2001
(b) the financial report also complies with International Financial
Reporting Standards as disclosed in note 1.
REPORT ON ThE REMUNERATION REPORTWe have audited the Remuneration Report included within the Directors’
Report set out on pages 8 to 13 for the year ended 30 June 2008.
The directors of the Company are responsible for the preparation and
presentation of the Remuneration Report in accordance with Section 300A
of the Corporations Act 2001. Our responsibility is to express an opinion
on the Remuneration Report, based on our audit conducted in accordance
with auditing standards.
auDitor’s opinion
In our opinion, the Remuneration Report of AJ Lucas Group Limited
for the year ended 30 June 2008, complies with Section 300A of the
Corporations Act 2001.
KPMG
Neil Cameron Smith
Partner
Sydney,
25 September 2008
For
per
sona
l use
onl
y

A yEAR OF MILESTONES 54
australian stock eXchange aDDitional information
A) DISTRIbUTION OF ORDINARy ShAREhOLDERS (AS AT 31 AUGUST 2008)
number of security holders securities held
ordinary shares
redeemable convertible notes
1 - 1,000 870 —1,001 - 5,000 1,482 —5,001 - 10,000 500 —10,001 - 100,000 434 —100,001 and over 55 2
Total 3,341 2
32 shareholders held less than a marketable parcel of ordinary shares.
b) TwENTy LARGEST ORDINARy ShAREhOLDERS name
number of ordinary shares held
% of issued shares
Andial Holdings Pty Limited 13,990,000 20.72HSBC Custody Nominees (Australia) Limited 8,149,250 12.07National Nominees Limited 4,292,879 6.36Mitchell Drilling Contractors Pty Limited Trustee of Tanson Account 2,645,503 3.92Amalgamated Dairies Limited 2,154,000 3.19Forty Traders Limited 1,976,348 2.93Citicorp Nominees Pty Limited 1,453,617 2.15Viewjet Pty Limited 952,100 1.41Citycorp Nominees Pty Limited CFS Future Leaders Fund A/C 949,810 1.41Michael & Beverley McDermott <McDermott Drilling Superannuation A/C> 939,166 1.39Gwynvill Trading Pty Limited 809,363 1.20JP Morgan Nominees Australia Limited 779,082 1.18MLEQ Nominees Pty Limited Unpaid1 A/C 558,152 0.83Morgan Stanley Australia Securities (Nominee) Pty Limited No.1 A/C 504,546 0.75ANZ Nominees Limited 479,635 0.71Bond Street Custodians Limited Macquarie Smaller Companies A/C 456,695 0.68UBS Wealth Management Australia Nominees Pty Limited 395,390 0.59Fortis Clearing Nominees Pty Limited Settlement A/C 317,792 0.47Aust Executor Trustees NSW Limited Patriot Aust Share Fund A/C 300,000 0.44NZ Guardian Trust Company Limited 01035700 A/C 290,950 0.43
Total 42,394,278 62.83
C) SUbSTANTIAL ShAREhOLDERS
name
number of ordinary shares held
% of issued shares
Andial Holdings Pty Limited 17,490,000 25.91Amalgamated Dairies Group 4,230,438 6.27
ON-MARkET bUy bACkThere is no current on-market buy back.
UNqUOTED EqUITy SECURITIESAs at 31 August 2008, there were 2,921,429 rights over unissued ordinary shares in the Company.
REDEEMAbLE CONvERTIbLE NOTESThe following entities hold more than 20% of the redeemable convertible notes on issue.
Namenumber of notes held
% of notes
Auckland Medical Research Foundation 593,541 79.8C&N Hoffman <C&N Hoffman Super Fund A/C> 150,000 20.2
vOTING RIGhTSOrdinary shares - Refer to Note 24.
Redeemable convertible notes - Refer to Note 19.
Options and rights - Refer to Note 23.
For
per
sona
l use
onl
y

55 LUCAS GROUP
Directory
COMPANy SECRETARyNicholas Swan MA, ACA, MBA
REGISTERED OFFICE157 Church Street
RYDE NSW 2112
Tel +61 2 9809 6866
Fax +61 2 9807 6088
ShARE REGISTRyComputershare Investor Services Pty Limited
Level 5, 115 Grenfell Street
ADELAIDE SA 5000
GPO Box 1903
ADELAIDE SA 5001
Enquiries within Australia: 1300 556 161
Enquiries outside Australia: +61 3 9615 5970
Email: [email protected]
Website: www.computershare.com
STOCk ExChANGETheCompanyislistedontheAustralianStockExchangewiththecode‘AJL’.TheHomeExchangeisSydney.
AUDITORSKPMG
10 Shelley Street
Sydney NSW 2000
bANkERSANZ Bank
20 Martin Place
Sydney NSW 2000
qUALITy CERTIFIERS (AS/NZS ISO 9001:2000)Bureau Veritas
AUSTRALIAN bUSINESS NUMbER12 060 309 104
OThER INFORMATIONAJ Lucas Group Limited, incorporated and domiciled in Australia, is a publicly listed company limited by shares.
For
per
sona
l use
onl
y