Embed Size (px)
Citation preview
Algebra 1 Keystone Practice Module 2
1. Determine if y is a function of x.
2. Determine if y is a function of x.
3. Determine if y is a function of x.
4. Determine if y is a function of x.
5. The graph of a function is shown below.
Is 0 a value in the range of the function?
6. The graph of a function is shown below.
Is -2 a value in the range of the
function?
Algebra 1 Keystone Practice Module 2
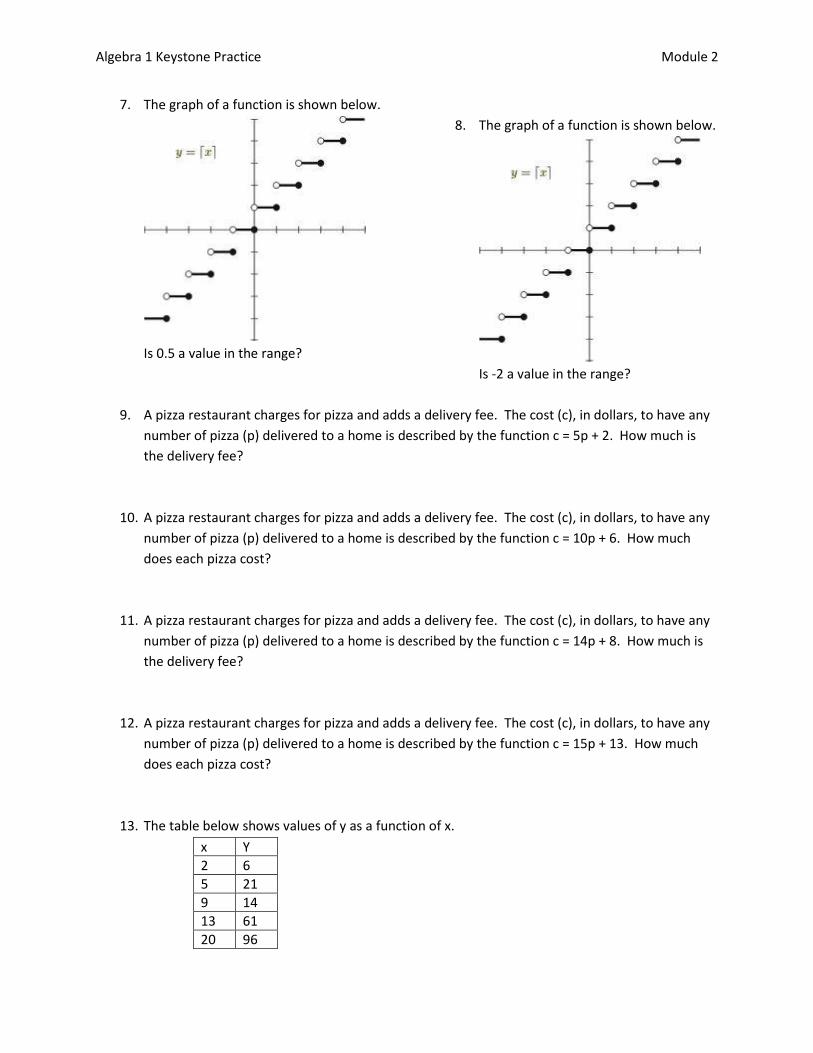
7. The graph of a function is shown below.
Is 0.5 a value in the range?
8. The graph of a function is shown below.
Is -2 a value in the range?
9. A pizza restaurant charges for pizza and adds a delivery fee. The cost (c), in dollars, to have any
number of pizza (p) delivered to a home is described by the function c = 5p + 2. How much is
the delivery fee?
10. A pizza restaurant charges for pizza and adds a delivery fee. The cost (c), in dollars, to have any
number of pizza (p) delivered to a home is described by the function c = 10p + 6. How much
does each pizza cost?
11. A pizza restaurant charges for pizza and adds a delivery fee. The cost (c), in dollars, to have any
number of pizza (p) delivered to a home is described by the function c = 14p + 8. How much is
the delivery fee?
12. A pizza restaurant charges for pizza and adds a delivery fee. The cost (c), in dollars, to have any
number of pizza (p) delivered to a home is described by the function c = 15p + 13. How much
does each pizza cost?
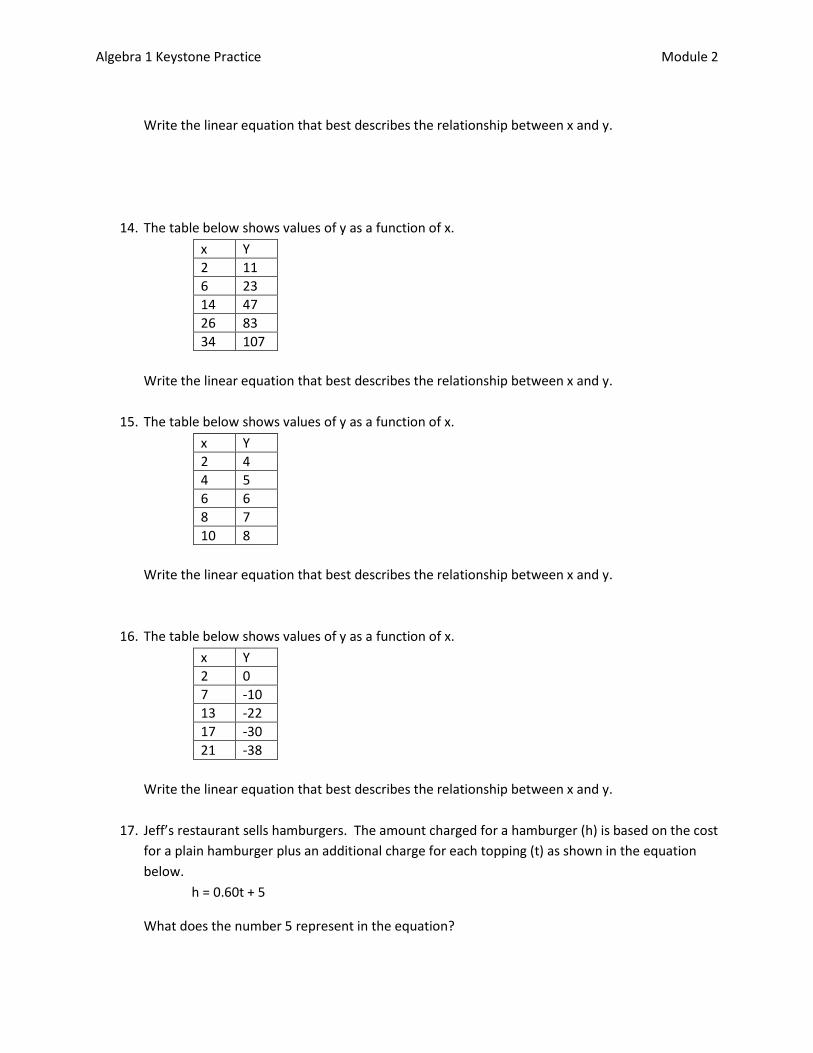
13. The table below shows values of y as a function of x.
x Y
2 6
5 21
9 14
13 61
20 96
Algebra 1 Keystone Practice Module 2
Write the linear equation that best describes the relationship between x and y.
14. The table below shows values of y as a function of x.
x Y
2 11
6 23
14 47
26 83
34 107
Write the linear equation that best describes the relationship between x and y.
15. The table below shows values of y as a function of x.
x Y
2 4
4 5
6 6
8 7
10 8
Write the linear equation that best describes the relationship between x and y.
16. The table below shows values of y as a function of x.
x Y
2 0
7 -10
13 -22
17 -30
21 -38
Write the linear equation that best describes the relationship between x and y.
17. Jeff’s restaurant sells hamburgers. The amount charged for a hamburger (h) is based on the cost
for a plain hamburger plus an additional charge for each topping (t) as shown in the equation
below.
h = 0.60t + 5
What does the number 5 represent in the equation?

Algebra 1 Keystone Practice Module 2
18. Jeff’s restaurant sells hamburgers. The amount charged for a hamburger (h) is based on the cost
for a plain hamburger plus an additional charge for each topping (t) as shown in the equation
below.
h = 0.80t + 5
What does the number 0.80 represent in the equation?
19. Jeff’s restaurant sells hamburgers. The amount charged for a hamburger (h) is based on the cost
for a plain hamburger plus an additional charge for each topping (t) as shown in the equation
below.
h = 0.60t + 5
What does the letter t represent in the equation?
20. Jeff’s restaurant sells hamburgers. The amount charged for a hamburger (h) is based on the cost
for a plain hamburger plus an additional charge for each topping (t) as shown in the equation
below.
h = 0.60t + 5
What does the number h represent in the equation?
21. A graph of a linear equation is shown below.
Write the equation that represents the graph above?

Algebra 1 Keystone Practice Module 2
22. A graph of a linear equation is shown below.
Write the equation that represents the graph above?
23. A graph of a linear equation is shown below.
Write the equation that represents the graph above?
24. A graph of a linear equation is shown below.
Write the equation that represents the graph above?

Algebra 1 Keystone Practice Module 2
25. The scatter plot below shows the sales (y) for ice cream based on temperature (x).
Determine the equation that best describes the line of best fit?
26. The scatter plot below shows the size of the plant (y) related to the age of the plant (x).
Determine the equation that best describes the line of best fit?
Algebra 1 Keystone Practice Module 2
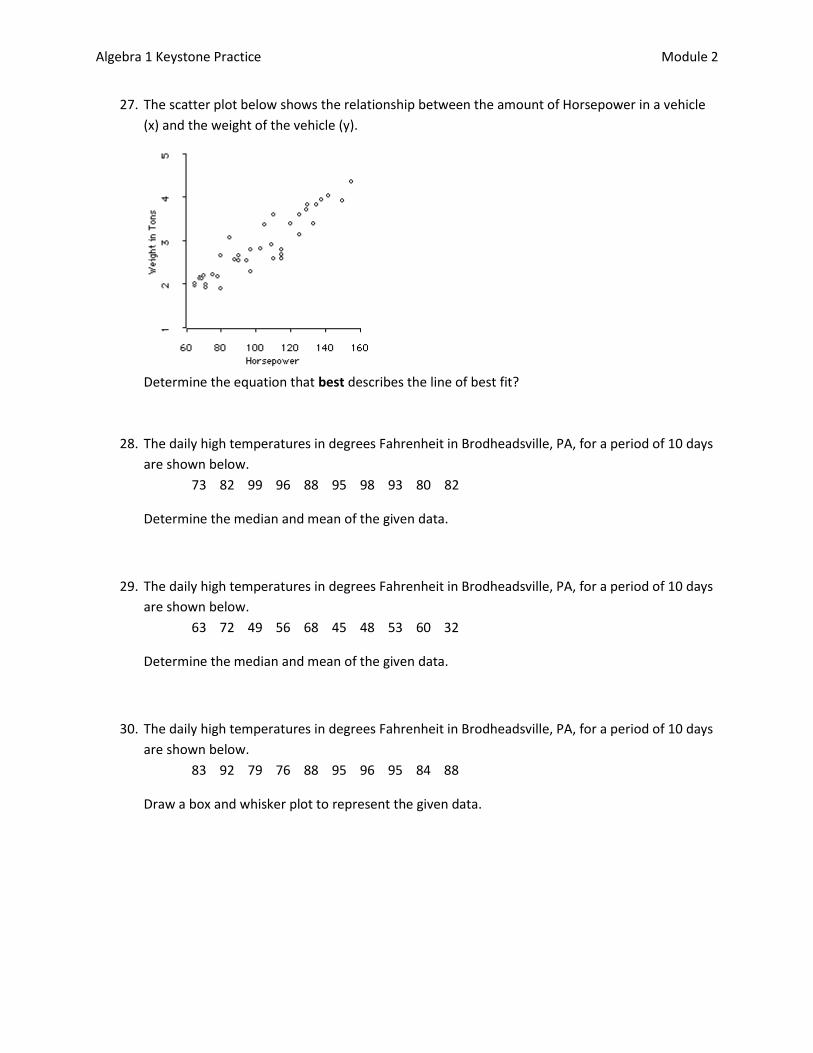
27. The scatter plot below shows the relationship between the amount of Horsepower in a vehicle
(x) and the weight of the vehicle (y).
Determine the equation that best describes the line of best fit?
28. The daily high temperatures in degrees Fahrenheit in Brodheadsville, PA, for a period of 10 days
are shown below.
73 82 99 96 88 95 98 93 80 82
Determine the median and mean of the given data.
29. The daily high temperatures in degrees Fahrenheit in Brodheadsville, PA, for a period of 10 days
are shown below.
63 72 49 56 68 45 48 53 60 32
Determine the median and mean of the given data.
30. The daily high temperatures in degrees Fahrenheit in Brodheadsville, PA, for a period of 10 days
are shown below.
83 92 79 76 88 95 96 95 84 88
Draw a box and whisker plot to represent the given data.

Algebra 1 Keystone Practice Module 2
31. The daily high temperatures in degrees Fahrenheit in Brodheadsville, PA, for a period of 10 days
are shown below.
63 72 49 56 68 45 48 53 60 32
Draw a box and whisker plot to represent the given data.
32. Vy asked 200 students to select their favorite sport and then recorded the results in the bar
graph below.
Vy will ask another 90 students to select their favorite sport. Based on the information in the
bar graph, how many more students of the next 90 asked will select basketball rather than
football as their favorite sport?
Algebra 1 Keystone Practice Module 2
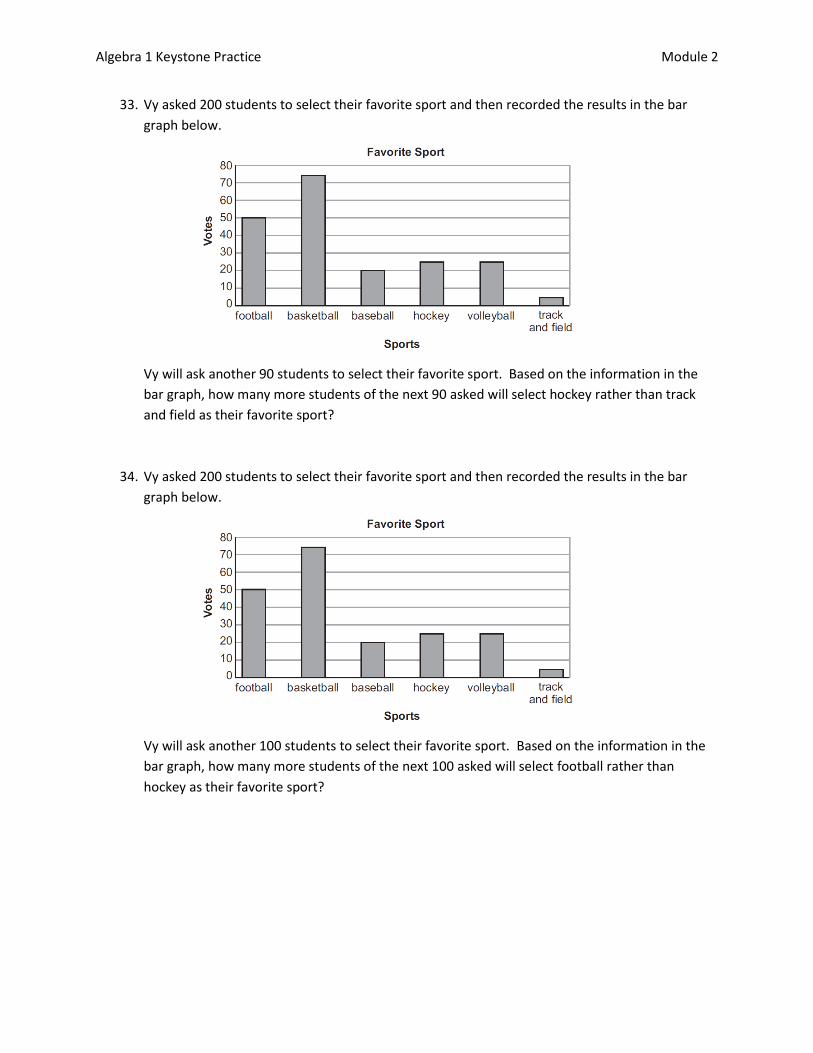
33. Vy asked 200 students to select their favorite sport and then recorded the results in the bar
graph below.
Vy will ask another 90 students to select their favorite sport. Based on the information in the
bar graph, how many more students of the next 90 asked will select hockey rather than track
and field as their favorite sport?
34. Vy asked 200 students to select their favorite sport and then recorded the results in the bar
graph below.
Vy will ask another 100 students to select their favorite sport. Based on the information in the
bar graph, how many more students of the next 100 asked will select football rather than
hockey as their favorite sport?
Algebra 1 Keystone Practice Module 2
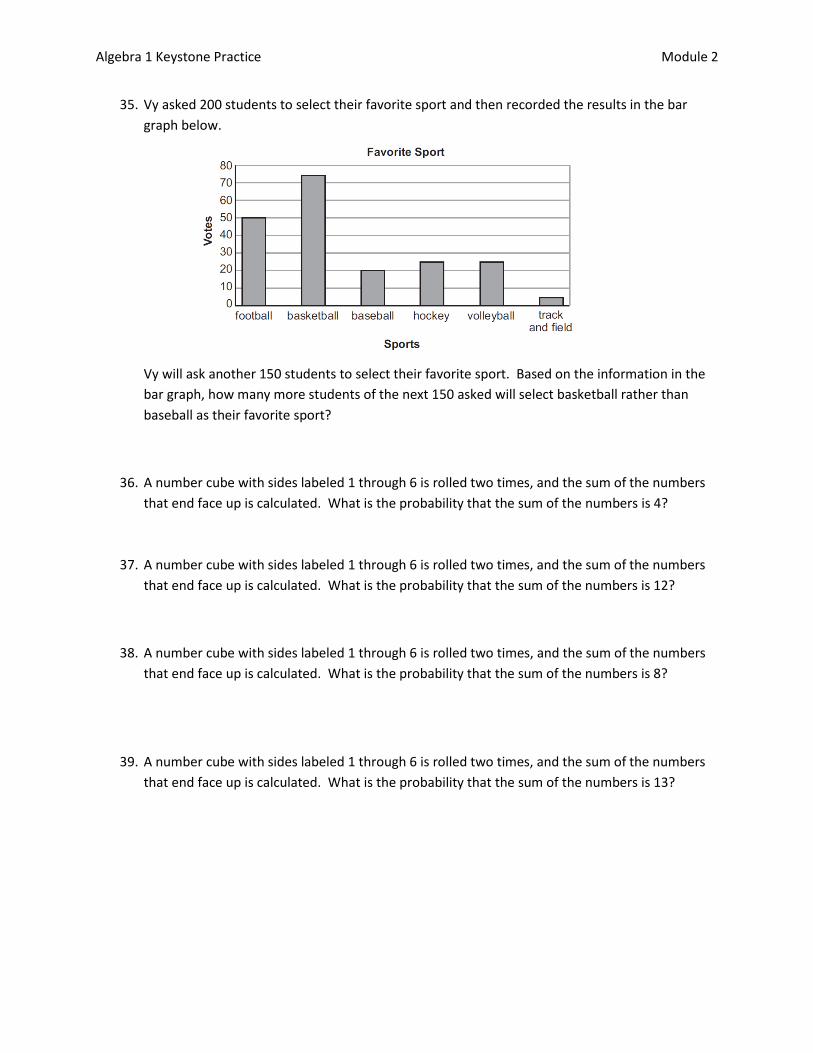
35. Vy asked 200 students to select their favorite sport and then recorded the results in the bar
graph below.
Vy will ask another 150 students to select their favorite sport. Based on the information in the
bar graph, how many more students of the next 150 asked will select basketball rather than
baseball as their favorite sport?
36. A number cube with sides labeled 1 through 6 is rolled two times, and the sum of the numbers
that end face up is calculated. What is the probability that the sum of the numbers is 4?
37. A number cube with sides labeled 1 through 6 is rolled two times, and the sum of the numbers
that end face up is calculated. What is the probability that the sum of the numbers is 12?
38. A number cube with sides labeled 1 through 6 is rolled two times, and the sum of the numbers
that end face up is calculated. What is the probability that the sum of the numbers is 8?
39. A number cube with sides labeled 1 through 6 is rolled two times, and the sum of the numbers
that end face up is calculated. What is the probability that the sum of the numbers is 13?

Algebra 1 Keystone Practice Module 2
Algebra 1 Keystone Open-ended questions
1. Hector’s family is on a car trip.
When they are 84 miles from home, Hector begins recording their distance driven (d), in miles, after
h hours in the table below.
Distance by Hour
Time in Hours (h) Distance in Miles (d)
0 58
1 143
2 228
3 313
The pattern continues.
A. Write an equation to find the distance driven (d), in miles, after a given number of hours (h).
B. Hector also kept track of the remaining gasoline. The equation shown below can be used to
find the gallons of gasoline remaining (g) after distance driven (d), in miles.
g = 15 -
Use the equation to find the missing values for gallons of gasoline remaining.

Algebra 1 Keystone Practice Module 2
C. Draw the graph of the line formed by the points in the table from Part B.
D. Explain why the slope of the line drawn in part C must be negative.
Algebra 1 Keystone Practice Module 2
2. The weight, in pounds, of each wrestler on the high school wrestling team at the beginning of the
season is listed below.
188 152 122 160 216 140
A. What is the median weight of the wrestlers?
B. What is the mean weight of the wrestlers?
C. Two more wrestlers join the team during the season. The addition of these wrestlers has
no effect on the mean weight of the wrestlers, but the median weight of the wrestlers
increases 3 pounds. Determine the weights of the two new wrestlers.


![Pennsylvania Keystone Algebra 1 Item Sampler 2016...Do not look ahead at the questions in Module 2 [or back at the questions in Module 1] of your exam materials . Keystone Algebra](https://img.pdfslide.net/doc/110x75/5ecb34f24f95a253675a470e/pennsylvania-keystone-algebra-1-item-sampler-2016-do-not-look-ahead-at-the-questions.jpg)