Embed Size (px)
Citation preview

All Other Plastics ProductManufacturing
1997 Economic Census
Manufacturing
Industry Series
1997Issued November 1999
EC97M-3261L
U.S. Department of CommerceEconomics and Statistics Administration
U.S. CENSUS BUREAU
The staff of the Manufacturing and Con-struction Division prepared this report.Judy M. Dodds, Assistant Chief for Cen-sus and Related Programs, was respon-sible for the overall planning, manage-ment, and coordination. KennethHansen, Chief, Manufactured DurablesBranch, assisted by Mike Brown, ReneeColey, Raphael Corrado, and MilbrenThomas, Section Chiefs, Michael Zampo-gna, Former Chief, Manufactured Nondu-rables Branch, assisted by Allen Fore-man, Robert Miller, Robert Reinard,and Nat Shelton, Section Chiefs, and TomLee, Robert Rosati, and Tom Flood,Special Assistants, performed the planningand implementation. Stephanie Angel,Brian Appert, Stanis Batton, Carol Bea-sley, Chris Blackburn, Larry Blum-berg, Vera Harris-Bourne, BrendaCampbell, Suzanne Conard, VanceDavis, Mary Ellickson, Matt Gaines,Merry Glascoe, Kay Hanks, KarenHarshbarger, Nancy Higgins, JamesHinckley, Walter Hunter, Jim Jamski,Evelyn Jordan, Robert Lee, John Line-han, Paul Marck, Keith McKenzie,Philippe Morris, Joanna Nguyen, BettyPannell, Joyce Pomeroy, Venita Powell,Cynthia Ramsey, Chris Savage,Aronda Stovall, Sue Sundermann, Tha-nos Theodoropoulos, Dora Thomas,Ann Truffa, Ronanne Vinson, KeeleyVoor, Denneth Wallace, Tempie Whit-tington, Lissene Witt, and MikeYamaner provided primary staff assis-tance.
Brian Greenberg, Assistant Chief forResearch and Methodology Programs,assisted by Stacey Cole, Chief, Manufac-turing Programs Methodology Branch, andRobert Struble, Section Chief, providedthe mathematical and statistical tech-niques as well as the coverage operations.Jeffrey Dalzell and Cathy Ritenour pro-vided primary staff assistance.
Mendel D. Gayle, Chief, Forms, Publica-tions, and Customer Services Branch,assisted by Julius Smith Jr. and BarutiTaylor, Section Chiefs, performed overall
coordination of the publication process.Kim Credito, Patrick Duck, ChipMurph, Wanda Sledd, and VeronicaWhite provided primary staff assistance.
The Economic Planning and CoordinationDivision, Lawrence A. Blum, AssistantChief for Collection Activities and ShirinA. Ahmed, Assistant Chief for Post-Collection Processing, assisted by DennisShoemaker, Chief, Post-Collection CensusProcessing Branch, Brandy Yarbrough,Section Chief, Sheila Proudfoot, RichardWilliamson, Andrew W. Hait, and Jenni-fer E. Lins, was responsible for develop-ing the systems and procedures for datacollection, editing, review, correction anddissemination
The staff of the National Processing Center,Judith N. Petty, Chief, performed mailoutpreparation and receipt operations, clericaland analytical review activities, data key-ing, and geocoding review.
The Geography Division staff developedgeographic coding procedures and associ-ated computer programs.
The Economic Statistical Methods and Pro-gramming Division, Charles P. PautlerJr., Chief, developed and coordinated thecomputer processing systems. Martin S.Harahush, Assistant Chief for Quinquen-nial Programs, assisted by Barbara Lam-bert and Christina Arledge were respon-sible for design and implementation of thecomputer systems. Gary T. Sheridan,Chief, Manufacturing and ConstructionBranch, Lori A. Guido and Roy A. Smith,Section Chiefs, supervised the preparationof the computer programs.
Computer Services Division, Debra Will-iams, Chief, performed the computer pro-cessing.
The staff of the Administrative and Cus-tomer Services Division, Walter C. Odom,Chief, performed planning, design, compo-sition, editorial review, and printing plan-ning and procurement for publications,Internet products, and report forms.Cynthia G. Brooks provided publicationcoordination and editing.
ACKNOWLEDGMENTS
All Other Plastics ProductManufacturing
1997 Economic Census
Manufacturing
Industry Series
1997Issued November 1999
EC97M-3261L
U.S. Department of CommerceWilliam M. Daley,
SecretaryRobert L. Mallett,
Deputy Secretary
Economicsand Statistics
AdministrationRobert J. Shapiro,Under Secretary for
Economic Affairs
U.S. CENSUS BUREAUKenneth Prewitt,
Director

Paula J. Schneider,Principal Associate Directorfor Programs
Frederick T. Knickerbocker,Associate Directorfor Economic Programs
Thomas L. Mesenbourg,Assistant Directorfor Economic Programs
William G. Bostic Jr.,Chief, Manufacturingand Construction Division
ECONOMICS
AND STATISTICS
ADMINISTRATION
Economicsand StatisticsAdministration
Robert J. Shapiro,Under Secretaryfor Economic Affairs
U.S. CENSUS BUREAU
Kenneth Prewitt,Director
William G. Barron,Deputy Director

CONTENTS
Introduction to the Economic Census 1.............................
Manufacturing 5.................................................
TABLES
1. Industry Statistics on NAICS Basis With Distribution Among1987 SIC~Based Industries: 1997 7.........................
2. Industry Statistics for Selected States: 1997 7.................
3. Detailed Statistics by Industry: 1997 8........................
4. Industry Statistics by Employment Size: 1997 9................
5. Industry Statistics by Industry and Primary Product ClassSpecialization: 1997 9.....................................
6a. Products Statistics: 1997 and 1992 10.........................
6b. Product Class Shipments for Selected States: 1997 and 1992 13.
7. Materials Consumed by Kind: 1997 and 1992 17................
APPENDIXES
A. Explanation of Terms A–1.....................................
B. NAICS Codes, Titles, and Descriptions B–1......................
C. Coverage and Methodology C–1................................
D. Geographic Notes ~~........................................
E. Metropolitan Areas ~~.......................................
F. Footnotes for Products Statistics and Materials Consumed byKind F–1...................................................
G. Comparability of Product Classes and Product Codes: 1997 to1992 G–1...................................................
~~ Not applicable for this report.
MANUFACTURINGmINDUSTRY SERIES NAICS 326199 iiiU.S. Census Bureau, 1997 Economic Census Nov. 18, 1999
Introduction to the Economic Census
PURPOSES AND USES OF THE ECONOMIC CENSUS
The economic census is the major source of facts aboutthe structure and functioning of the Nation’s economy. Itprovides essential information for government, business,industry, and the general public. Title 13 of the UnitedStates Code (Sections 131, 191, and 224) directs the Cen-sus Bureau to take the economic census every 5 years,covering years ending in 2 and 7.
The economic census furnishes an important part of theframework for such composite measures as the grossdomestic product estimates, input/output measures, pro-duction and price indexes, and other statistical series thatmeasure short-term changes in economic conditions. Spe-cific uses of economic census data include the following:
• Policymaking agencies of the Federal Government usethe data to monitor economic activity and assess theeffectiveness of policies.
• State and local governments use the data to assessbusiness activities and tax bases within their jurisdic-tions and to develop programs to attract business.
• Trade associations study trends in their own and com-peting industries, which allows them to keep their mem-bers informed of market changes.
• Individual businesses use the data to locate potentialmarkets and to analyze their own production and salesperformance relative to industry or area averages.
ALL-NEW INDUSTRY CLASSIFICATIONS
Data from the 1997 Economic Census are published pri-marily on the basis of the North American Industry Classi-fication System (NAICS), unlike earlier censuses, whichwere published according to the Standard Industrial Classi-fication (SIC) system. NAICS is in the process of beingadopted in the United States, Canada, and Mexico. Mosteconomic census reports cover one of the following NAICSsectors:
21 Mining22 Utilities23 Construction31-33 Manufacturing42 Wholesale Trade44-45 Retail Trade48-49 Transportation and Warehousing51 Information
52 Finance and Insurance53 Real Estate and Rental and Leasing54 Professional, Scientific, and Technical
Services55 Management of Companies and Enterprises56 Administrative and Support and Waste
Management and Remediation Services61 Educational Services62 Health Care and Social Assistance71 Arts, Entertainment, and Recreation72 Accommodation and Foodservices81 Other Services (except Public Administration)
(Not listed above are the Agriculture, Forestry, Fishing, andHunting sector (NAICS 11), partially covered by the censusof agriculture conducted by the U.S. Department of Agri-culture, and the Public Administration sector (NAICS 92),covered by the census of governments conducted by theCensus Bureau.)
The 20 NAICS sectors are subdivided into 96 subsectors(three-digit codes), 313 industry groups (four-digit codes),and, as implemented in the United States, 1170 industries(five- and six-digit codes).
RELATIONSHIP TO SIC
While many of the individual NAICS industries corre-spond directly to industries as defined under the SIC sys-tem, most of the higher level groupings do not. Particularcare should be taken in comparing data for retail trade,wholesale trade, and manufacturing, which are sectortitles used in both NAICS and SIC, but cover somewhat dif-ferent groups of industries. The industry definitions dis-cuss the relationships between NAICS and SIC industries.Where changes are significant, it will not be possible toconstruct time series that include data for points bothbefore and after 1997.
For 1997, data for auxiliary establishments (those func-tioning primarily to manage, service, or support the activi-ties of their company’s operating establishments, such asa central administrative office or warehouse) will not beincluded in the sector-specific reports. These data will bepublished separately.
GEOGRAPHIC AREA CODING
Accurate and complete information on the physicallocation of each establishment is required to tabulate thecensus data for the states, metropolitan areas (MAs), coun-ties, parishes, and corporate municipalities including cit-ies, towns, villages, and boroughs. Respondents were
INTRODUCTION 11997 ECONOMIC CENSUS
U.S. Census Bureau, 1997 Economic Census
required to report their physical location (street address,municipality, county, and state) if it differed from theirmailing address. For establishments not surveyed by mail(and those single-establishment companies that did notprovide acceptable information on physical location), loca-tion information from Internal Revenue Service tax formsis used as a basis for coding.
BASIS OF REPORTING
The economic census is conducted on an establishmentbasis. A company operating at more than one location isrequired to file a separate report for each store, factory,shop, or other location. Each establishment is assigned aseparate industry classification based on its primary activ-ity and not that of its parent company.
DOLLAR VALUES
All dollar values presented are expressed in current dol-lars; i.e., 1997 data are expressed in 1997 dollars, and1992 data, in 1992 dollars. Consequently, when makingcomparisons with prior years, users of the data shouldconsider the changes in prices that have occurred.
All dollar values are shown in thousands of dollars.
AVAILABILITY OF ADDITIONAL DATA
Reports in Print and Electronic Media
All results of the 1997 Economic Census are availableon the Census Bureau Internet site (www.census.gov) andon compact discs (CD-ROM) for sale by the Census Bureau.Unlike previous censuses, only selected highlights arepublished in printed reports. For more information, includ-ing a description of electronic and printed reports beingissued, see the Internet site, or write to U.S. CensusBureau, Washington, DC 20233-8300, or call CustomerServices at 301-457-4100.
Special Tabulations
Special tabulations of data collected in the 1997 Eco-nomic Census may be obtained, depending on availabilityof time and personnel, in electronic or tabular form. Thedata will be summaries subject to the same rules prohibit-ing disclosure of confidential information (including name,address, kind of business, or other data for individualbusiness establishments or companies) that govern theregular publications.
Special tabulations are prepared on a cost basis. Arequest for a cost estimate, as well as exact specificationson the type and format of the data to be provided, shouldbe directed to the Chief of the division named below, U.S.Census Bureau, Washington, DC 20233-8300. To discuss aspecial tabulation before submitting specifications, callthe appropriate division:
Manufacturing and Construction Division 301-457-4673Service Sector Statistics Division 301-457-2668
HISTORICAL INFORMATION
The economic census has been taken as an integratedprogram at 5-year intervals since 1967 and before that for1954, 1958, and 1963. Prior to that time, individual com-ponents of the economic census were taken separately atvarying intervals.
The economic census traces its beginnings to the 1810Decennial Census, when questions on manufacturing wereincluded with those for population. Coverage of economicactivities was expanded for the 1840 Decennial Censusand subsequent censuses to include mining and somecommercial activities. The 1905 Manufactures Census wasthe first time a census was taken apart from the regulardecennial population census. Censuses covering retail andwholesale trade and construction industries were added in1930, as were some covering service trades in 1933. Cen-suses of construction, manufacturing, and the other busi-ness service censuses were suspended during World WarII.
The 1954 Economic Census was the first census to befully integrated: providing comparable census data acrosseconomic sectors, using consistent time periods, con-cepts, definitions, classifications, and reporting units. Itwas the first census to be taken by mail, using lists offirms provided by the administrative records of other Fed-eral agencies. Since 1963, administrative records alsohave been used to provide basic statistics for very smallfirms, reducing or eliminating the need to send them cen-sus questionnaires.
The range of industries covered in the economic cen-suses expanded between 1967 and 1992. The census ofconstruction industries began on a regular basis in 1967,and the scope of service industries, introduced in 1933,was broadened in 1967, 1977, and 1987. While a fewtransportation industries were covered as early as 1963, itwas not until 1992 that the census broadened to includeall of transportation, communications, and utilities. Alsonew for 1992 was coverage of financial, insurance, andreal estate industries. With these additions, the economiccensus and the separate census of governments and cen-sus of agriculture collectively covered roughly 98 percentof all economic activity.
Printed statistical reports from the 1992 and earliercensuses provide historical figures for the study of long-term time series and are available in some large libraries.All of the census reports printed since 1967 are still avail-able for sale on microfiche from the Census Bureau.CD-ROMs issued from the 1987 and 1992 Economic Cen-suses contain databases including nearly all data pub-lished in print, plus additional statistics, such as ZIP Codestatistics, published only on CD-ROM.
2 INTRODUCTION 1997 ECONOMIC CENSUS
U.S. Census Bureau, 1997 Economic Census
SOURCES FOR MORE INFORMATION
More information about the scope, coverage, classifica-tion system, data items, and publications for each of theeconomic censuses and related surveys is published in theGuide to the 1997 Economic Census and Related Statisticsat www.census.gov/econguide. More information on themethodology, procedures, and history of the censuses willbe published in the History of the 1997 Economic Censusat www.census.gov/econ/www/history.html.
ABBREVIATIONS AND SYMBOLS
The following abbreviations and symbols are used withthe 1997 Economic Census data:
A Standard error of 100 percent or more.D Withheld to avoid disclosing data of individual
companies; data are included in higher leveltotals.
F Exceeds 100 percent because data includeestablishments with payroll exceeding rev-enue.
N Not available or not comparable.Q Revenue not collected at this level of detail for
multiestablishment firms.S Withheld because estimates did not meet
publication standards.
V Represents less than 50 vehicles or .05percent.
X Not applicable.Y Disclosure withheld because of insufficient
coverage of merchandise lines.Z Less than half the unit shown.a 0 to 19 employees.b 20 to 99 employees.c 100 to 249 employees.e 250 to 499 employees.f 500 to 999 employees.g 1,000 to 2,499 employees.h 2,500 to 4,999 employees.i 5,000 to 9,999 employees.j 10,000 to 24,999 employees.k 25,000 to 49,999 employees.l 50,000 to 99,999 employees.m 100,000 employees or more.p 10 to 19 percent estimated.q 20 to 29 percent estimated.r Revised.s Sampling error exceeds 40 percent.nec Not elsewhere classified.nsk Not specified by kind.– Represents zero (page image/print only).(CC) Consolidated city.(IC) Independent city.
INTRODUCTION 31997 ECONOMIC CENSUS
U.S. Census Bureau, 1997 Economic Census

This page is intentionally blank.
4 INTRODUCTION 1997 ECONOMIC CENSUS
U.S. Census Bureau, 1997 Economic Census
Manufacturing
SCOPE
The 1997 Economic Census – Manufacturing covers allmanufacturing establishments with one or more paidemployees. Manufacturing is defined as the mechanical,physical, or chemical transformation of materials or sub-stances into new products. The assembly of componentsinto new products is also considered manufacturing,except when it is appropriately classified as construction.
Establishments in the manufacturing sector are oftendescribed as plants, factories, or mills and typically usepower-driven machines and materials-handling equipment.Also included in the manufacturing sector are some estab-lishments that make products by hand, like custom tailorsand the makers of custom draperies. While manufacturerstypically do not sell to the public, some establishmentslike bakeries and candy stores that make products on thepremises may be included.
While logging and publishing are no longer in the scopeof manufacturing, data for these industries are included inthe manufacturing industry reports, but are not includedin the manufacturing state, summary, and other reports.
GENERAL
This report, from the 1997 Economic Census – Manufac-turing, is one of a series of 480 industry reports and 51geographic area reports, each of which provides statisticsfor individual industries or states, respectively. Seven ofthe industry reports are for industries no longer in themanufacturing sector but are included with manufacturingfor the 1997 census year. Also included for this sector areGeneral, Product, and Materials Consumed Summaryreports, a special report on Concentration Ratios in Manu-facturing, and data files on Location of ManufacturingPlants.
Each industry report presents data for a six-digit NorthAmerican Industry Classification System (NAICS) industry.A description of the particular NAICS industry may befound in Appendix B. These reports include such statisticsas number of establishments, employment, payroll, valueadded by manufacture, cost of materials consumed, valueof shipments, capital expenditures, etc. Explanations ofthese and other terms may be found in Appendix A. Theindustry reports also include data for states with 100employees or more in the industry.
State reports, which include the District of Columbia,present similar statistics at the ‘‘all manufacturing’’ levelfor each state and its metropolitan areas (MAs) with 250
employees or more, and for counties, consolidated cities,and places with 500 employees or more. The state reportsalso include six-digit NAICS level data for industries with100 employees or more in the state.
The General Summary report contains industry and geo-graphic area statistics summarized in one report. Itincludes higher levels of aggregation than the industryand state reports, as well as revisions to the data madeafter the release of the industry and state reports.
The Products and Materials Consumed reports summa-rize the products and materials data published in theindustry reports. The Product Summary report alsoincludes data from the Current Industrial Reports (CIR) anda special table with data for products that are primary tomore than one industry, which are not in the industryreports.
The Concentration Ratios report publishes data on thepercentage of value of shipments accounted for by the 4-,8-, 20-, and 50-largest companies for each manufacturingindustry. Also shown in this report are Hirschmann-Herfindahl Indexes for each industry.
The Location of Manufacturing data files contain statis-tics on the number of establishments for the three- andsix-digit NAICS industry by state, county, place, and ZIPCode by employment-size of the establishment.
GEOGRAPHIC AREAS COVERED
Statistics at the six-digit NAICS industry level are shownfor states and the District of Columbia in both the stateand industry reports for cells with 100 employees ormore.
The state reports also include data at the ‘‘all manufac-turing’’ level for a variety of geographies that meet theemployment criteria.
Data are available for the metropolitan areas (MAs) with250 employees or more. The term MA is a general termused to encompass all of the specifically defined metro-politan areas. A consolidated metropolitan statistical area(CMSA) is made up of two or more contiguous primarymetropolitan statistical areas (PMSAs) with a combinedpopulation of at least 1 million. A PMSA is a subdivision ofa CMSA that demonstrates very strong internal economicand social links separate from the ties to other portions ofthe CMSA. A metropolitan statistical area (MSA) is an inte-grated economic and social unit with a population of atleast 50,000. An MA is made up of one or more countiesmeeting standards of metropolitan character. In NewEngland, cities and towns, rather than counties, are the
MANUFACTURING 51997 ECONOMIC CENSUS
U.S. Census Bureau, 1997 Economic Census
component geographic units. Determination of the MAswas made by the Office of Management and Budget (OMB)as of June 30, 1997. The population estimates were fromthe 1990 Census of Population or a subsequent specialcensus. When applicable, the make-up of an MA isincluded in Appendix E. Changes to geographical bound-aries are noted in Appendix D.
The state reports include data for counties with 500employees or more. These are the primary divisions ofstates, except in Louisiana where they are called parishesand in Alaska where they are called boroughs and censusareas. Maryland, Missouri, Nevada, and Virginia have oneor more places that are independent of county organiza-tions. These places are treated as counties and places. Thecounties and places are defined as of January 1, 1997.
The state reports include data for places with 500employees or more. Places are typically cities, towns, andvillages. They may be incorporated municipalities, semi-independent municipalities, special economic urban areas(SEUAs), or other place equivalents.
The state reports also include data for consolidated cit-ies with 500 employees or more. Consolidated cities aremade up of separately incorporated municipalities.
COMPARABILITY OF THE 1992 AND 1997 CENSUSES
The adoption of the North American Industry Classifica-tion System (NAICS) has had a major impact on the compa-rability of data between the 1992 and 1997 censuses.Approximately half of the industries in the manufacturingsector of NAICS do not have comparable industries in theStandard Industrial Classification (SIC) system that wasused in the past. If industries are not comparable betweenthe two censuses, historic data are not shown. When appli-cable, Appendix G shows the product class and productcomparability between the two systems.
While most of the change affecting the manufacturingsector was change within the sector, some industries leftmanufacturing and others came into manufacturing.Prominent among those leaving manufacturing are loggingand portions of publishing. Prominent among the indus-tries coming into the manufacturing sector are bakeries,candy stores where candy is made on the premises, cus-tom tailors, makers of custom draperies, and tire retread-ing. Data for the industries coming into manufacturing aswell as those leaving manufacturing are included in themanufacturing industry report series for 1997. However,the state and summary reports only include data forindustries in the NAICS definition of manufacturing.
Another change resulting from the conversion to NAICSis that data for central administrative offices (CAOs) asso-ciated with manufacturing are not included along side themanufacturing data. This change affects data in the statereports and the general summary.
DISCLOSURE
In accordance with Federal law governing censusreports (Title 13 of the United States Code), no data arepublished that would disclose the operations of an indi-vidual establishment or company. However, the number ofestablishments classified in a specific industry or geogra-phy is not considered a disclosure, and may be releasedeven when other information is withheld.
The disclosure analysis for the industry statistics files isbased on the total value of shipments. When the totalvalue of shipments cannot be shown without disclosinginformation for individual companies, the complete line issuppressed except for capital expenditures. However, thesuppressed data are included in higher-level totals. A sepa-rate disclosure analysis is performed for capital expendi-tures that can be suppressed even though value of ship-ments data are published.
AVAILABILITY OF MORE FREQUENT ECONOMICDATA
The Census Bureau conducts the Annual Survey ofManufactures (ASM) in each of the 4 years between theeconomic censuses. The ASM is a probability-basedsample of approximately 58,000 establishments and col-lects many of the same industry statistics (includingemployment, payroll, value of shipments, etc.) as the eco-nomic census. However, there are selected statistics notincluded in the ASM. Among these are the number of com-panies and establishments, detailed product and materialsdata, and substate geographic data.
In addition to the ASM, the Census Bureau conducts aCurrent Industrial Reports (CIR) program. The CIR pub-lishes detailed product statistics for selected manufactur-ing industries at the U.S. level annually and, in somecases, monthly and/or quarterly. For the 1997 EconomicCensus – Manufacturing, the annual CIR data are includedin the Product Summary report.
The Census Bureau also conducts the monthly Manufac-turers’ Shipments, Inventories, and Orders (M3) program,which publishes detailed statistics for manufacturingindustries at the U.S. level.
6 MANUFACTURING 1997 ECONOMIC CENSUS
U.S. Census Bureau, 1997 Economic Census
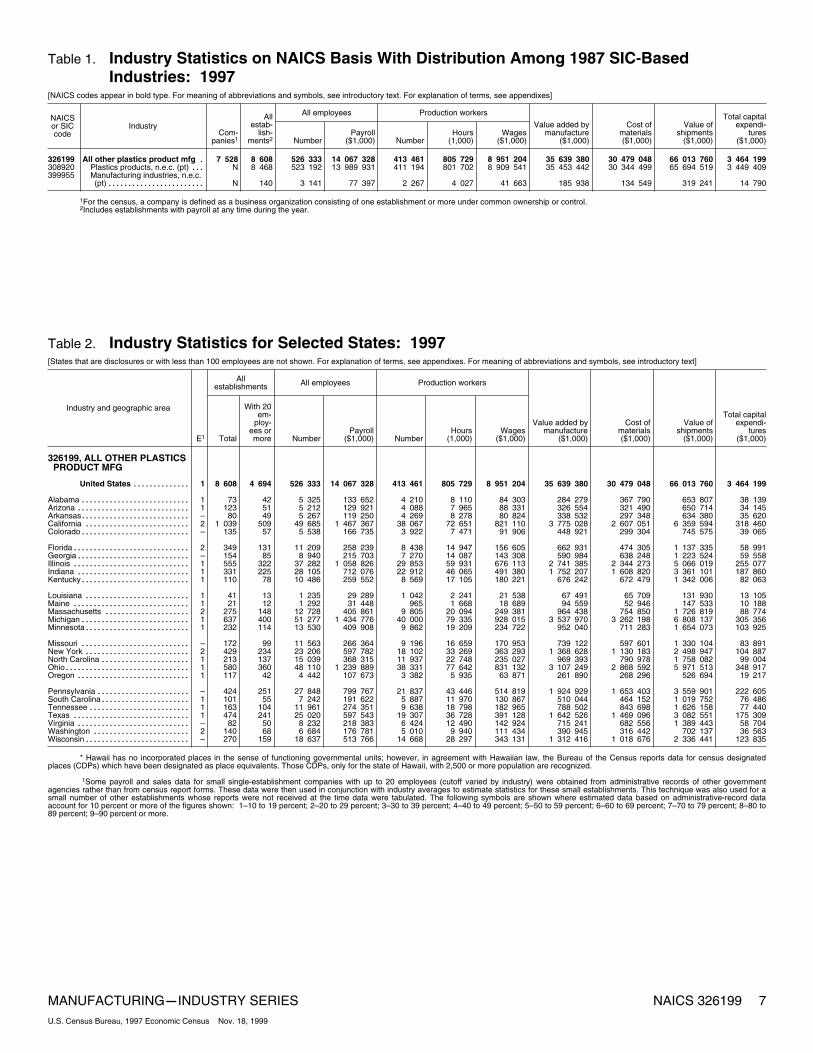
Table 1. Industry Statistics on NAICS Basis With Distribution Among 1987 SIC~BasedIndustries: 1997
[NAICS codes appear in bold type. For meaning of abbreviations and symbols, see introductory text. For explanation of terms, see appendixes]
NAICSor SICcode
Industry
All employees Production workers
Com~
panies1
Allestab~
lish~ments2 Number
Payroll($1,000) Number
Hours(1,000)
Wages($1,000)
Value added bymanufacture
($1,000)
Cost ofmaterials($1,000)
Value ofshipments
($1,000)
Total capitalexpendi~
tures($1,000)
326199 All other plastics product mfg 7 528. 8 608 526 333 14 067 328 413 461 805 729 8 951 204 35 639 380 30 479 048 66 013 760 3 464 199308920 Plastics products, n.e.c. (pt) N... 8 468 523 192 13 989 931 411 194 801 702 8 909 541 35 453 442 30 344 499 65 694 519 3 449 409399955 Manufacturing industries, n.e.c.
(pt) N........................ 140 3 141 77 397 2 267 4 027 41 663 185 938 134 549 319 241 14 790
1For the census, a company is defined as a business organization consisting of one establishment or more under common ownership or control.2Includes establishments with payroll at any time during the year.
Table 2. Industry Statistics for Selected States: 1997[States that are disclosures or with less than 100 employees are not shown. For explanation of terms, see appendixes. For meaning of abbreviations and symbols, see introductory text]
Industry and geographic area
Allestablishments All employees Production workers
E1 Total
With 20em~
ploy~ees ormore Number
Payroll($1,000) Number
Hours(1,000)
Wages($1,000)
Value added bymanufacture
($1,000)
Cost ofmaterials($1,000)
Value ofshipments
($1,000)
Total capitalexpendi~
tures($1,000)
326199, ALL OTHER PLASTICSPRODUCT MFG
United States 1.............. 8 608 4 694 526 333 14 067 328 413 461 805 729 8 951 204 35 639 380 30 479 048 66 013 760 3 464 199
Alabama 1........................... 73 42 5 325 133 652 4 210 8 110 84 303 284 279 367 790 653 807 38 139Arizona 1............................ 123 51 5 212 129 921 4 088 7 965 88 331 326 554 321 490 650 714 34 145Arkansas –........................... 80 49 5 267 119 250 4 269 8 278 80 824 338 532 297 348 634 380 35 620California 2.......................... 1 039 509 49 685 1 467 367 38 067 72 651 821 110 3 775 028 2 607 051 6 359 594 318 460Colorado –........................... 135 57 5 538 166 735 3 922 7 471 91 906 448 921 299 304 745 575 39 065
Florida 2............................. 349 131 11 209 258 239 8 438 14 947 156 605 662 931 474 305 1 137 335 58 991Georgia –............................ 154 85 8 940 215 703 7 270 14 087 143 308 590 984 638 248 1 223 524 59 558Illinois 1............................. 555 322 37 282 1 058 826 29 853 59 931 676 113 2 741 385 2 344 273 5 066 019 255 077Indiana 1............................ 331 225 28 105 712 076 22 912 46 065 491 380 1 752 207 1 608 820 3 361 101 187 860Kentucky 1........................... 110 78 10 486 259 552 8 569 17 105 180 221 676 242 672 479 1 342 006 82 063
Louisiana 1.......................... 41 13 1 235 29 289 1 042 2 241 21 538 67 491 65 709 131 930 13 105Maine 1............................. 21 12 1 292 31 448 965 1 668 18 689 94 559 52 946 147 533 10 188Massachusetts 2..................... 275 148 12 728 405 861 9 805 20 094 249 381 964 438 754 850 1 726 819 88 774Michigan 1........................... 637 400 51 277 1 434 776 40 000 79 335 928 015 3 537 970 3 262 198 6 808 137 305 356Minnesota 1.......................... 232 114 13 530 409 908 9 862 19 209 234 722 952 040 711 283 1 654 073 103 925
Missouri –........................... 172 99 11 563 266 364 9 196 16 659 170 953 739 122 597 601 1 330 104 83 891New York 2.......................... 429 234 23 206 597 782 18 102 33 269 363 293 1 368 628 1 130 183 2 498 947 104 887North Carolina 1...................... 213 137 15 039 368 315 11 937 22 748 235 027 969 393 790 978 1 758 082 99 004Ohio 1............................... 580 360 48 110 1 239 889 38 331 77 642 831 132 3 107 249 2 868 592 5 971 513 348 917Oregon 1............................ 117 42 4 442 107 673 3 382 5 935 63 871 261 890 268 296 526 694 19 217
Pennsylvania –....................... 424 251 27 848 799 767 21 837 43 446 514 819 1 924 929 1 653 403 3 559 901 222 605South Carolina 1...................... 101 55 7 242 191 622 5 887 11 970 130 867 510 044 464 152 1 019 752 76 486Tennessee 1......................... 163 104 11 961 274 351 9 638 18 798 182 965 788 502 843 698 1 626 158 77 440Texas 1............................. 474 241 25 020 597 543 19 307 36 728 391 128 1 642 526 1 469 096 3 082 551 175 309Virginia –............................ 82 50 8 232 218 383 6 424 12 490 142 924 715 241 682 556 1 389 443 58 704Washington 2........................ 140 68 6 684 176 781 5 010 9 940 111 434 390 945 316 442 702 137 36 563Wisconsin –.......................... 270 159 18 637 513 766 14 668 28 297 343 131 1 312 416 1 018 676 2 336 441 123 835
* Hawaii has no incorporated places in the sense of functioning governmental units; however, in agreement with Hawaiian law, the Bureau of the Census reports data for census designatedplaces (CDPs) which have been designated as place equivalents. Those CDPs, only for the state of Hawaii, with 2,500 or more population are recognized.
1Some payroll and sales data for small single~establishment companies with up to 20 employees (cutoff varied by industry) were obtained from administrative records of other governmentagencies rather than from census report forms. These data were then used in conjunction with industry averages to estimate statistics for these small establishments. This technique was also used for asmall number of other establishments whose reports were not received at the time data were tabulated. The following symbols are shown where estimated data based on administrative~record dataaccount for 10 percent or more of the figures shown: 1–10 to 19 percent; 2–20 to 29 percent; 3–30 to 39 percent; 4–40 to 49 percent; 5–50 to 59 percent; 6–60 to 69 percent; 7–70 to 79 percent; 8–80 to89 percent; 9–90 percent or more.
MANUFACTURINGmINDUSTRY SERIES NAICS 326199 7U.S. Census Bureau, 1997 Economic Census Nov. 18, 1999
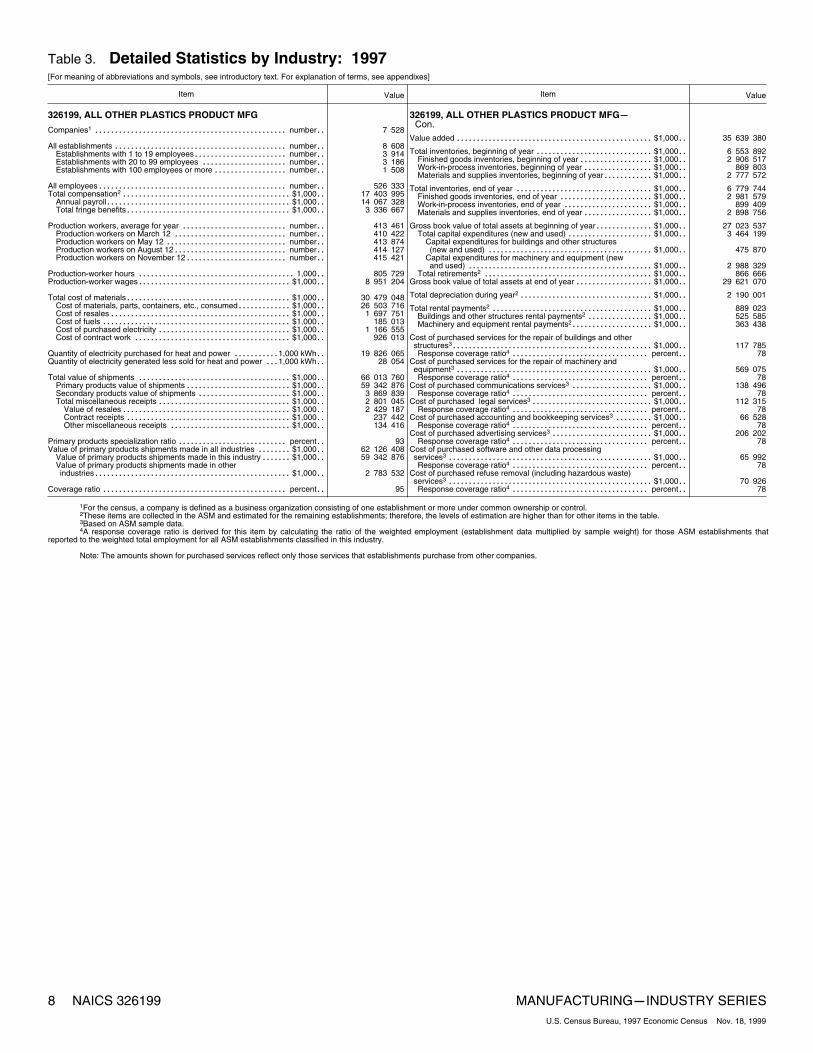
Table 3. Detailed Statistics by Industry: 1997[For meaning of abbreviations and symbols, see introductory text. For explanation of terms, see appendixes]
Item Value
326199, ALL OTHER PLASTICS PRODUCT MFG
Companies1 number.................................................. 7 528
All establishments number............................................. 8 608Establishments with 1 to 19 employees number......................... 3 914Establishments with 20 to 99 employees number....................... 3 186Establishments with 100 employees or more number.................... 1 508
All employees number................................................. 526 333Total compensation2 $1,000............................................ 17 403 995
Annual payroll $1,000................................................ 14 067 328Total fringe benefits $1,000........................................... 3 336 667
Production workers, average for year number............................ 413 461Production workers on March 12 number.............................. 410 422Production workers on May 12 number................................ 413 874Production workers on August 12 number.............................. 414 127Production workers on November 12 number........................... 415 421
Production~worker hours 1,000......................................... 805 729Production~worker wages $1,000........................................ 8 951 204
Total cost of materials $1,000........................................... 30 479 048Cost of materials, parts, containers, etc., consumed $1,000............... 26 503 716Cost of resales $1,000............................................... 1 697 751Cost of fuels $1,000................................................. 185 013Cost of purchased electricity $1,000................................... 1 166 555Cost of contract work $1,000......................................... 926 013
Quantity of electricity purchased for heat and power 1,000 kWh............. 19 826 065Quantity of electricity generated less sold for heat and power 1,000 kWh..... 28 054
Total value of shipments $1,000........................................ 66 013 760Primary products value of shipments $1,000............................ 59 342 876Secondary products value of shipments $1,000......................... 3 869 839Total miscellaneous receipts $1,000................................... 2 801 045
Value of resales $1,000............................................ 2 429 187Contract receipts $1,000........................................... 237 442Other miscellaneous receipts $1,000................................ 134 416
Primary products specialization ratio percent............................. 93Value of primary products shipments made in all industries $1,000.......... 62 126 408
Value of primary products shipments made in this industry $1,000......... 59 342 876Value of primary products shipments made in otherindustries $1,000................................................... 2 783 532
Coverage ratio percent................................................ 95
Item Value
326199, ALL OTHER PLASTICS PRODUCT MFGmCon.
Value added $1,000................................................... 35 639 380
Total inventories, beginning of year $1,000............................... 6 553 892Finished goods inventories, beginning of year $1,000.................... 2 906 517Work~in~process inventories, beginning of year $1,000................... 869 803Materials and supplies inventories, beginning of year $1,000.............. 2 777 572
Total inventories, end of year $1,000.................................... 6 779 744Finished goods inventories, end of year $1,000......................... 2 981 579Work~in~process inventories, end of year $1,000........................ 899 409Materials and supplies inventories, end of year $1,000................... 2 898 756
Gross book value of total assets at beginning of year $1,000................ 27 023 537Total capital expenditures (new and used) $1,000....................... 3 464 199
Capital expenditures for buildings and other structures(new and used) $1,000........................................... 475 870
Capital expenditures for machinery and equipment (newand used) $1,000................................................ 2 988 329
Total retirements2 $1,000............................................ 866 666Gross book value of total assets at end of year $1,000..................... 29 621 070
Total depreciation during year2 $1,000................................... 2 190 001
Total rental payments2 $1,000.......................................... 889 023Buildings and other structures rental payments2 $1,000.................. 525 585Machinery and equipment rental payments2 $1,000...................... 363 438
Cost of purchased services for the repair of buildings and otherstructures3 $1,000.................................................... 117 785Response coverage ratio4 percent.................................... 78
Cost of purchased services for the repair of machinery andequipment3 $1,000................................................... 569 075Response coverage ratio4 percent.................................... 78
Cost of purchased communications services3 $1,000...................... 138 496Response coverage ratio4 percent.................................... 78
Cost of purchased legal services3 $1,000................................ 112 315Response coverage ratio4 percent.................................... 78
Cost of purchased accounting and bookkeeping services3 $1,000........... 66 528Response coverage ratio4 percent.................................... 78
Cost of purchased advertising services3 $1,000........................... 206 202Response coverage ratio4 percent.................................... 78
Cost of purchased software and other data processingservices3 $1,000..................................................... 65 992Response coverage ratio4 percent.................................... 78
Cost of purchased refuse removal (including hazardous waste)services3 $1,000..................................................... 70 926Response coverage ratio4 percent.................................... 78
1For the census, a company is defined as a business organization consisting of one establishment or more under common ownership or control.2These items are collected in the ASM and estimated for the remaining establishments; therefore, the levels of estimation are higher than for other items in the table.3Based on ASM sample data.4A response coverage ratio is derived for this item by calculating the ratio of the weighted employment (establishment data multiplied by sample weight) for those ASM establishments that
reported to the weighted total employment for all ASM establishments classified in this industry.
Note: The amounts shown for purchased services reflect only those services that establishments purchase from other companies.
8 NAICS 326199 MANUFACTURINGmINDUSTRY SERIESU.S. Census Bureau, 1997 Economic Census Nov. 18, 1999
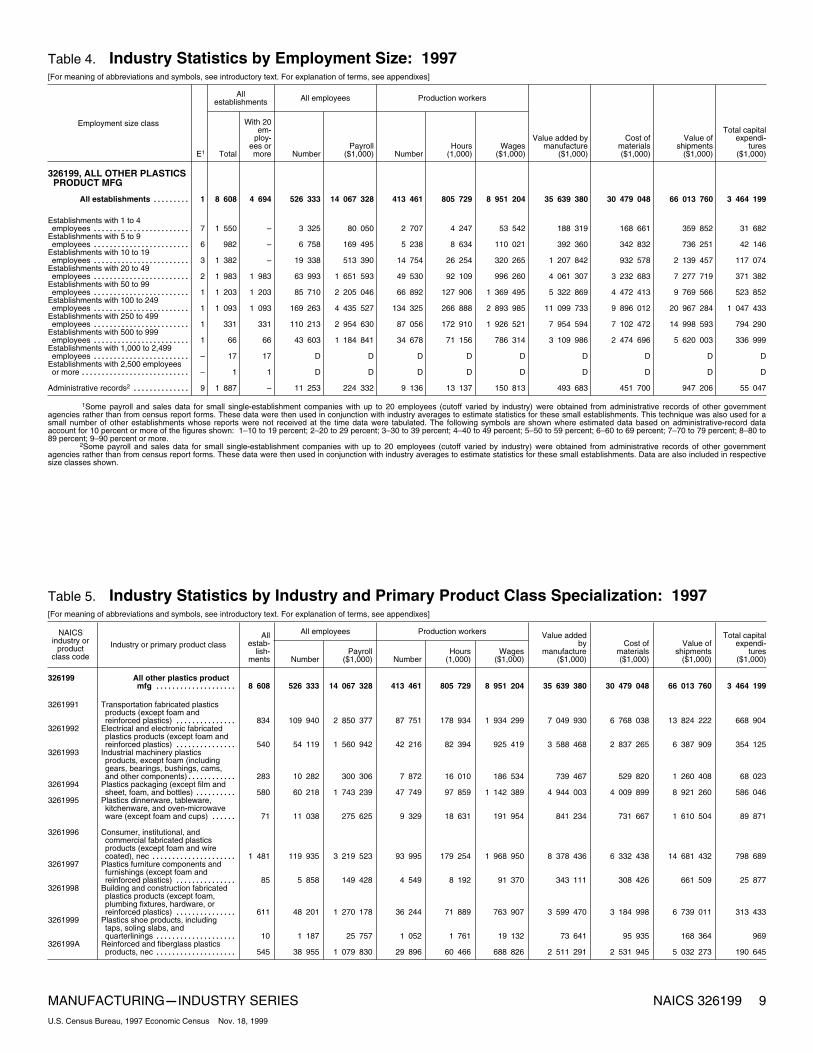
Table 4. Industry Statistics by Employment Size: 1997[For meaning of abbreviations and symbols, see introductory text. For explanation of terms, see appendixes]
Employment size class
Allestablishments All employees Production workers
E1 Total
With 20em~
ploy~ees ormore Number
Payroll($1,000) Number
Hours(1,000)
Wages($1,000)
Value added bymanufacture
($1,000)
Cost ofmaterials($1,000)
Value ofshipments
($1,000)
Total capitalexpendi~
tures($1,000)
326199, ALL OTHER PLASTICSPRODUCT MFG
All establishments 1......... 8 608 4 694 526 333 14 067 328 413 461 805 729 8 951 204 35 639 380 30 479 048 66 013 760 3 464 199
Establishments with 1 to 4employees 7........................ 1 550 – 3 325 80 050 2 707 4 247 53 542 188 319 168 661 359 852 31 682
Establishments with 5 to 9employees 6........................ 982 – 6 758 169 495 5 238 8 634 110 021 392 360 342 832 736 251 42 146
Establishments with 10 to 19employees 3........................ 1 382 – 19 338 513 390 14 754 26 254 320 265 1 207 842 932 578 2 139 457 117 074
Establishments with 20 to 49employees 2........................ 1 983 1 983 63 993 1 651 593 49 530 92 109 996 260 4 061 307 3 232 683 7 277 719 371 382
Establishments with 50 to 99employees 1........................ 1 203 1 203 85 710 2 205 046 66 892 127 906 1 369 495 5 322 869 4 472 413 9 769 566 523 852
Establishments with 100 to 249employees 1........................ 1 093 1 093 169 263 4 435 527 134 325 266 888 2 893 985 11 099 733 9 896 012 20 967 284 1 047 433
Establishments with 250 to 499employees 1........................ 331 331 110 213 2 954 630 87 056 172 910 1 926 521 7 954 594 7 102 472 14 998 593 794 290
Establishments with 500 to 999employees 1........................ 66 66 43 603 1 184 841 34 678 71 156 786 314 3 109 986 2 474 696 5 620 003 336 999
Establishments with 1,000 to 2,499employees –........................ 17 17 D D D D D D D D D
Establishments with 2,500 employeesor more –........................... 1 1 D D D D D D D D D
Administrative records2 9.............. 1 887 – 11 253 224 332 9 136 13 137 150 813 493 683 451 700 947 206 55 047
1Some payroll and sales data for small single~establishment companies with up to 20 employees (cutoff varied by industry) were obtained from administrative records of other governmentagencies rather than from census report forms. These data were then used in conjunction with industry averages to estimate statistics for these small establishments. This technique was also used for asmall number of other establishments whose reports were not received at the time data were tabulated. The following symbols are shown where estimated data based on administrative~record dataaccount for 10 percent or more of the figures shown: 1–10 to 19 percent; 2–20 to 29 percent; 3–30 to 39 percent; 4–40 to 49 percent; 5–50 to 59 percent; 6–60 to 69 percent; 7–70 to 79 percent; 8–80 to89 percent; 9–90 percent or more.
2Some payroll and sales data for small single~establishment companies with up to 20 employees (cutoff varied by industry) were obtained from administrative records of other governmentagencies rather than from census report forms. These data were then used in conjunction with industry averages to estimate statistics for these small establishments. Data are also included in respectivesize classes shown.
Table 5. Industry Statistics by Industry and Primary Product Class Specialization: 1997[For meaning of abbreviations and symbols, see introductory text. For explanation of terms, see appendixes]
NAICSindustry or
productclass code
Industry or primary product class
All employees Production workersAllestab~
lish~ments Number
Payroll($1,000) Number
Hours(1,000)
Wages($1,000)
Value addedby
manufacture($1,000)
Cost ofmaterials($1,000)
Value ofshipments
($1,000)
Total capitalexpendi~
tures($1,000)
326199 All other plastics productmfg 8 608.................... 526 333 14 067 328 413 461 805 729 8 951 204 35 639 380 30 479 048 66 013 760 3 464 199
3261991 Transportation fabricated plasticsproducts (except foam andreinforced plastics) 834............... 109 940 2 850 377 87 751 178 934 1 934 299 7 049 930 6 768 038 13 824 222 668 904
3261992 Electrical and electronic fabricatedplastics products (except foam andreinforced plastics) 540............... 54 119 1 560 942 42 216 82 394 925 419 3 588 468 2 837 265 6 387 909 354 125
3261993 Industrial machinery plasticsproducts, except foam (includinggears, bearings, bushings, cams,and other components) 283............ 10 282 300 306 7 872 16 010 186 534 739 467 529 820 1 260 408 68 023
3261994 Plastics packaging (except film andsheet, foam, and bottles) 580.......... 60 218 1 743 239 47 749 97 859 1 142 389 4 944 003 4 009 899 8 921 260 586 046
3261995 Plastics dinnerware, tableware,kitchenware, and oven~microwaveware (except foam and cups) 71...... 11 038 275 625 9 329 18 631 191 954 841 234 731 667 1 610 504 89 871
3261996 Consumer, institutional, andcommercial fabricated plasticsproducts (except foam and wirecoated), nec 1 481..................... 119 935 3 219 523 93 995 179 254 1 968 950 8 378 436 6 332 438 14 681 432 798 689
3261997 Plastics furniture components andfurnishings (except foam andreinforced plastics) 85............... 5 858 149 428 4 549 8 192 91 370 343 111 308 426 661 509 25 877
3261998 Building and construction fabricatedplastics products (except foam,plumbing fixtures, hardware, orreinforced plastics) 611............... 48 201 1 270 178 36 244 71 889 763 907 3 599 470 3 184 998 6 739 011 313 433
3261999 Plastics shoe products, includingtaps, soling slabs, andquarterlinings 10.................... 1 187 25 757 1 052 1 761 19 132 73 641 95 935 168 364 969
326199A Reinforced and fiberglass plasticsproducts, nec 545.................... 38 955 1 079 830 29 896 60 466 688 826 2 511 291 2 531 945 5 032 273 190 645
MANUFACTURINGmINDUSTRY SERIES NAICS 326199 9U.S. Census Bureau, 1997 Economic Census Nov. 18, 1999

Table 6a. Products Statistics: 1997 and 1992[Includes quantity and value of products of this industry produced by (1) establishments classified in this industry (primary) and (2) establishments classified in other industries (secondary). Transfers ofproducts of this industry from one establishment of a company to another establishment of the same company (interplant transfers) are also included. For meaning of abbreviations and symbols, seeintroductory text. For explanation of terms, see appendixes]
NAICSproduct
codeProduct
1997 1992
Product shipments Product shipmentsNumber ofcompanies
withshipments
of$100,000
or more
Quantity ofproduction
for allpurposes Quantity
Value($1,000)
Number ofcompanies
withshipments
of$100,000
or more
Quantity ofproduction
for allpurposes Quantity
Value($1,000)
326199 All other plastics products...... N................... X X 62 126 408 N X X N
3261991 Transportation fabricated plastics products(except foam and reinforced plastics) ..... N................... X X 13 140 173 N X X 8 167 794
32619911 Transportation fabricated plasticsproducts (except foam and reinforcedplastics)............................. N................... X X 12 025 675 N X X N
3261991111 Fabricated plastics components,housings, accessories, and parts formotor vehicles (except foam andreinforced plastics) ................. 728................... X X 10 742 933 661 X X 7 125 998
3261991121 Fabricated plastics components,housings, accessories, and parts foraircraft, space equipment and missiles(except foam and reinforced plastics) . 122................... X X 522 245 119 X X 429 780
3261991131 Fabricated plastics components,housings, accessories, and parts forother transportation equipment(except foam and reinforced plastics) . 226................... X X 760 497 184 X X 255 410
3261991Y Transportation fabricated plasticsproducts (except foam and reinforcedplastics), nsk ........................ N................... X X 1 114 498 N X X N
3261991YWV Transportation fabricated plasticsproducts (except foam and reinforcedplastics), nsk ...................... N................... X X 1 114 498 N X X 356 606
3261992 Electrical and electronic fabricated plasticsproducts (except foam and reinforcedplastics)............................... N................... X X 5 334 435 N X X 3 244 856
32619921 Electrical and electronic fabricatedplastics products (except foam andreinforced plastics) ................... N................... X X 4 768 598 N X X N
3261992111 Electrical and electronic fabricatedplastics products for office, computingand accounting machines, cashregisters, and data processingmachines (except foam and reinforcedplastics)........................... 264................... X X 1 093 597 254 X X 770 140
3261992121 Electrical and electronic fabricatedplastics products for household andcommercial appliances (except foamand reinforced plastics) ............. 302................... X X 1 418 494 237 X X 816 406
3261992131 Electrical and electronic fabricatedplastics products for communicationsequipment (except foam andreinforced plastics) ................. 190................... X X 641 629 145 X X 335 387
3261992191 Other electrical and electronicfabricated plastics products, includingwiring devices and parts (except foamand reinforced plastics) ............. 437................... X X 1 614 878 389 X X 1 034 212
3261992Y Electrical and electronic fabricatedplastics (except foam and reinforcedplastics), nsk ........................ N................... X X 565 837 N X X N
3261992YWV Electrical and electronic fabricatedplastics (except foam and reinforcedplastics), nsk ...................... N................... X X 565 837 N X X 288 711
3261993 Industrial machinery plastics products,except foam (including gears, bearings,bushings, cams, and other components) .. N................... X X 1 256 974 N X X 933 391
32619931 Industrial machinery plastics products,except foam (including gears, bearings,bushings, cams, and othercomponents) ........................ N................... X X 1 256 974 N X X N
3261993100 Industrial machinery plastics products,except foam (including gears,bearings, bushings, cams, and othercomponents) ...................... 496................... X X 1 256 974 452 X X 933 391
3261994 Plastics packaging (except film and sheet,foam, and bottles) ...................... N................... X X 8 375 122 N X X 6 048 659
32619941 Plastics packaging (except film and sheet,foam, and bottles) .................... N................... X X 7 648 230 N X X N
3261994111 Plastics pails and drums, more than 3gallons............................ 56................... X X 1 146 746 50 X X 684 497
3261994115 Plastics tubs (for food products)....... 36................... X X 550 788 46 X X 689 1343261994121 Plastics jars (for toilet goods,
cosmetics, and food products) ....... 43................... X X 242 247 53 X X 346 6753261994125 Plastics blister and bubble formed
packaging......................... 64................... X X 281 370 71 X X 268 0223261994131 Plastics shipping boxes and cases .... 75................... X X 460 293 78 X X 264 409
3261994135 Plastics food trays (baskets, shippingboxes, and cases) (except foam) ..... 62................... X X 582 454 59 X X 404 322
3261994141 Plastics pallets...................... 32................... X X 156 138 23 X X 38 7233261994145 Plastics nonpressure child~resistant
closures, for prescription products .... 10................... X X 86 093 9 X X 63 8663261994151 Plastics nonpressure child~resistant
closures, for all other products,including nonprescription products.... 20................... X X 189 189 30 X X 96 869
3261994155 Plastics nonpressure nonchild~resistantclosures, including dispensing andnondispensing ..................... 61................... X X 917 330 75 X X 864 854
See footnotes at end of table.
10 NAICS 326199 MANUFACTURINGmINDUSTRY SERIESU.S. Census Bureau, 1997 Economic Census Nov. 18, 1999
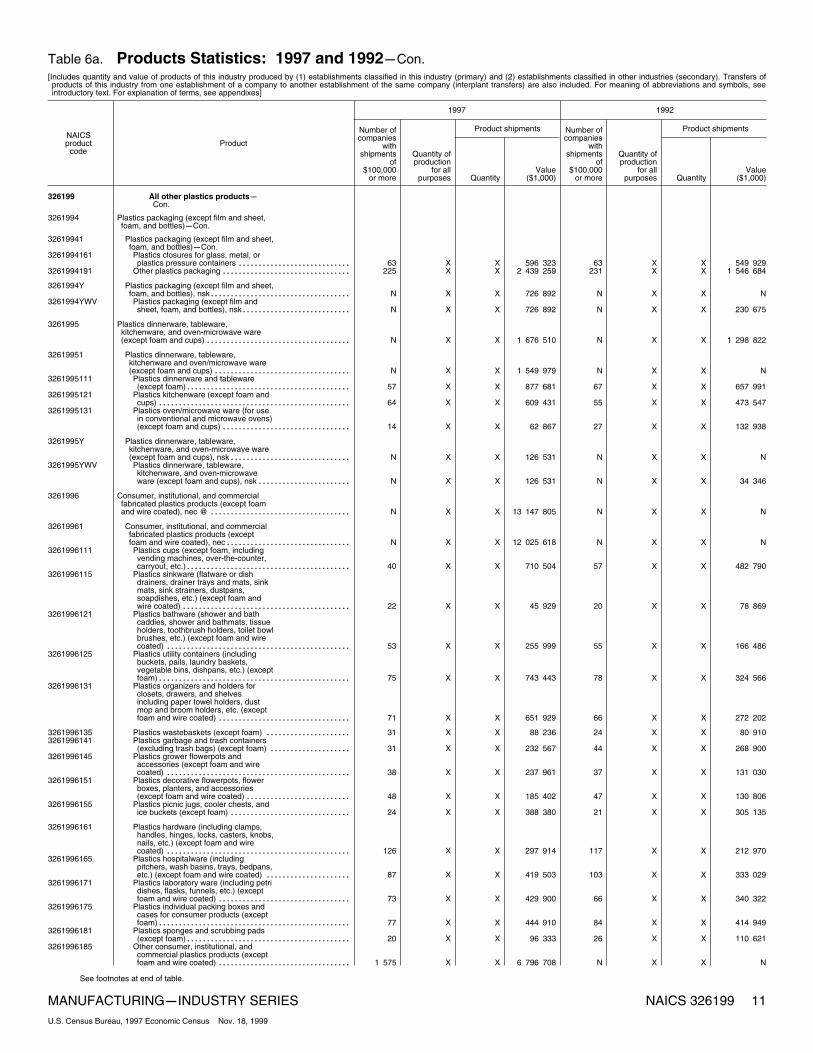
Table 6a. Products Statistics: 1997 and 1992mCon.[Includes quantity and value of products of this industry produced by (1) establishments classified in this industry (primary) and (2) establishments classified in other industries (secondary). Transfers ofproducts of this industry from one establishment of a company to another establishment of the same company (interplant transfers) are also included. For meaning of abbreviations and symbols, seeintroductory text. For explanation of terms, see appendixes]
NAICSproduct
codeProduct
1997 1992
Product shipments Product shipmentsNumber ofcompanies
withshipments
of$100,000
or more
Quantity ofproduction
for allpurposes Quantity
Value($1,000)
Number ofcompanies
withshipments
of$100,000
or more
Quantity ofproduction
for allpurposes Quantity
Value($1,000)
326199 All other plastics productsmCon.
3261994 Plastics packaging (except film and sheet,foam, and bottles)mCon.
32619941 Plastics packaging (except film and sheet,foam, and bottles)mCon.
3261994161 Plastics closures for glass, metal, orplastics pressure containers ......... 63................... X X 596 323 63 X X 549 929
3261994191 Other plastics packaging ............. 225................... X X 2 439 259 231 X X 1 546 684
3261994Y Plastics packaging (except film and sheet,foam, and bottles), nsk................ N................... X X 726 892 N X X N
3261994YWV Plastics packaging (except film andsheet, foam, and bottles), nsk........ N................... X X 726 892 N X X 230 675
3261995 Plastics dinnerware, tableware,kitchenware, and oven~microwave ware(except foam and cups) ................. N................... X X 1 676 510 N X X 1 298 822
32619951 Plastics dinnerware, tableware,kitchenware and oven/microwave ware(except foam and cups) ............... N................... X X 1 549 979 N X X N
3261995111 Plastics dinnerware and tableware(except foam)...................... 57................... X X 877 681 67 X X 657 991
3261995121 Plastics kitchenware (except foam andcups) ............................. 64................... X X 609 431 55 X X 473 547
3261995131 Plastics oven/microwave ware (for usein conventional and microwave ovens)(except foam and cups) ............. 14................... X X 62 867 27 X X 132 938
3261995Y Plastics dinnerware, tableware,kitchenware, and oven~microwave ware(except foam and cups), nsk........... N................... X X 126 531 N X X N
3261995YWV Plastics dinnerware, tableware,kitchenware, and oven~microwaveware (except foam and cups), nsk .... N................... X X 126 531 N X X 34 346
3261996 Consumer, institutional, and commercialfabricated plastics products (except foamand wire coated), nec @ ................ N................... X X 13 147 805 N X X N
32619961 Consumer, institutional, and commercialfabricated plastics products (exceptfoam and wire coated), nec............ N................... X X 12 025 618 N X X N
3261996111 Plastics cups (except foam, includingvending machines, over~the~counter,carryout, etc.)...................... 40................... X X 710 504 57 X X 482 790
3261996115 Plastics sinkware (flatware or dishdrainers, drainer trays and mats, sinkmats, sink strainers, dustpans,soapdishes, etc.) (except foam andwire coated) ....................... 22................... X X 45 929 20 X X 78 869
3261996121 Plastics bathware (shower and bathcaddies, shower and bathmats, tissueholders, toothbrush holders, toilet bowlbrushes, etc.) (except foam and wirecoated) ........................... 53................... X X 255 999 55 X X 166 486
3261996125 Plastics utility containers (includingbuckets, pails, laundry baskets,vegetable bins, dishpans, etc.) (exceptfoam)............................. 75................... X X 743 443 78 X X 324 566
3261996131 Plastics organizers and holders forclosets, drawers, and shelvesincluding paper towel holders, dustmop and broom holders, etc. (exceptfoam and wire coated) .............. 71................... X X 651 929 66 X X 272 202
3261996135 Plastics wastebaskets (except foam) .. 31................... X X 88 236 24 X X 80 9103261996141 Plastics garbage and trash containers
(excluding trash bags) (except foam) . 31................... X X 232 567 44 X X 268 9003261996145 Plastics grower flowerpots and
accessories (except foam and wirecoated) ........................... 38................... X X 237 961 37 X X 131 030
3261996151 Plastics decorative flowerpots, flowerboxes, planters, and accessories(except foam and wire coated) ....... 48................... X X 185 402 47 X X 130 806
3261996155 Plastics picnic jugs, cooler chests, andice buckets (except foam) ........... 24................... X X 388 380 21 X X 305 135
3261996161 Plastics hardware (including clamps,handles, hinges, locks, casters, knobs,nails, etc.) (except foam and wirecoated) ........................... 126................... X X 297 914 117 X X 212 970
3261996165 Plastics hospitalware (includingpitchers, wash basins, trays, bedpans,etc.) (except foam and wire coated) .. 87................... X X 419 503 103 X X 333 029
3261996171 Plastics laboratory ware (including petridishes, flasks, funnels, etc.) (exceptfoam and wire coated) .............. 73................... X X 429 900 66 X X 340 322
3261996175 Plastics individual packing boxes andcases for consumer products (exceptfoam)............................. 77................... X X 444 910 84 X X 414 949
3261996181 Plastics sponges and scrubbing pads(except foam)...................... 20................... X X 96 333 26 X X 110 621
3261996185 Other consumer, institutional, andcommercial plastics products (exceptfoam and wire coated) .............. 1 575................... X X 6 796 708 N X X N
See footnotes at end of table.
MANUFACTURINGmINDUSTRY SERIES NAICS 326199 11U.S. Census Bureau, 1997 Economic Census Nov. 18, 1999
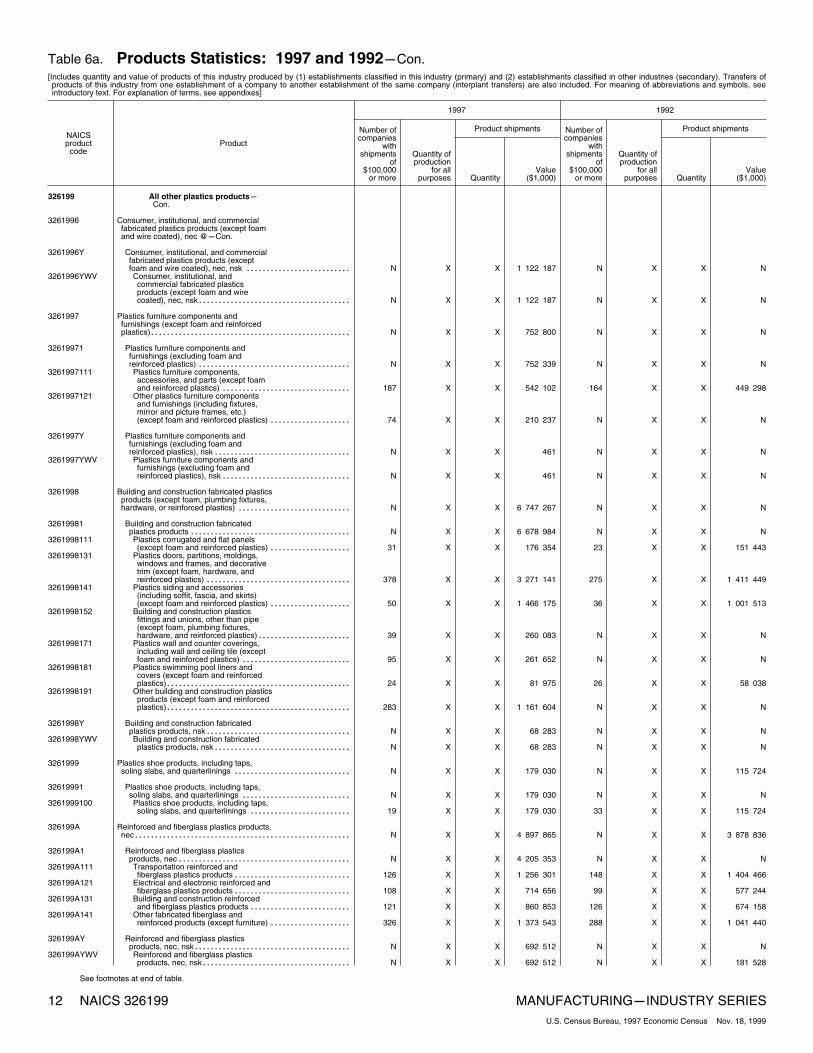
Table 6a. Products Statistics: 1997 and 1992mCon.[Includes quantity and value of products of this industry produced by (1) establishments classified in this industry (primary) and (2) establishments classified in other industries (secondary). Transfers ofproducts of this industry from one establishment of a company to another establishment of the same company (interplant transfers) are also included. For meaning of abbreviations and symbols, seeintroductory text. For explanation of terms, see appendixes]
NAICSproduct
codeProduct
1997 1992
Product shipments Product shipmentsNumber ofcompanies
withshipments
of$100,000
or more
Quantity ofproduction
for allpurposes Quantity
Value($1,000)
Number ofcompanies
withshipments
of$100,000
or more
Quantity ofproduction
for allpurposes Quantity
Value($1,000)
326199 All other plastics productsmCon.
3261996 Consumer, institutional, and commercialfabricated plastics products (except foamand wire coated), nec @mCon.
3261996Y Consumer, institutional, and commercialfabricated plastics products (exceptfoam and wire coated), nec, nsk ....... N................... X X 1 122 187 N X X N
3261996YWV Consumer, institutional, andcommercial fabricated plasticsproducts (except foam and wirecoated), nec, nsk................... N................... X X 1 122 187 N X X N
3261997 Plastics furniture components andfurnishings (except foam and reinforcedplastics)............................... N................... X X 752 800 N X X N
32619971 Plastics furniture components andfurnishings (excluding foam andreinforced plastics) ................... N................... X X 752 339 N X X N
3261997111 Plastics furniture components,accessories, and parts (except foamand reinforced plastics) ............. 187................... X X 542 102 164 X X 449 298
3261997121 Other plastics furniture componentsand furnishings (including fixtures,mirror and picture frames, etc.)(except foam and reinforced plastics) . 74................... X X 210 237 N X X N
3261997Y Plastics furniture components andfurnishings (excluding foam andreinforced plastics), nsk ............... N................... X X 461 N X X N
3261997YWV Plastics furniture components andfurnishings (excluding foam andreinforced plastics), nsk ............. N................... X X 461 N X X N
3261998 Building and construction fabricated plasticsproducts (except foam, plumbing fixtures,hardware, or reinforced plastics) ......... N................... X X 6 747 267 N X X N
32619981 Building and construction fabricatedplastics products ..................... N................... X X 6 678 984 N X X N
3261998111 Plastics corrugated and flat panels(except foam and reinforced plastics) . 31................... X X 176 354 23 X X 151 443
3261998131 Plastics doors, partitions, moldings,windows and frames, and decorativetrim (except foam, hardware, andreinforced plastics) ................. 378................... X X 3 271 141 275 X X 1 411 449
3261998141 Plastics siding and accessories(including soffit, fascia, and skirts)(except foam and reinforced plastics) . 50................... X X 1 466 175 36 X X 1 001 513
3261998152 Building and construction plasticsfittings and unions, other than pipe(except foam, plumbing fixtures,hardware, and reinforced plastics).... 39................... X X 260 083 N X X N
3261998171 Plastics wall and counter coverings,including wall and ceiling tile (exceptfoam and reinforced plastics) ........ 95................... X X 261 652 N X X N
3261998181 Plastics swimming pool liners andcovers (except foam and reinforcedplastics)........................... 24................... X X 81 975 26 X X 58 038
3261998191 Other building and construction plasticsproducts (except foam and reinforcedplastics)........................... 283................... X X 1 161 604 N X X N
3261998Y Building and construction fabricatedplastics products, nsk................. N................... X X 68 283 N X X N
3261998YWV Building and construction fabricatedplastics products, nsk............... N................... X X 68 283 N X X N
3261999 Plastics shoe products, including taps,soling slabs, and quarterlinings .......... N................... X X 179 030 N X X 115 724
32619991 Plastics shoe products, including taps,soling slabs, and quarterlinings ........ N................... X X 179 030 N X X N
3261999100 Plastics shoe products, including taps,soling slabs, and quarterlinings ...... 19................... X X 179 030 33 X X 115 724
326199A Reinforced and fiberglass plastics products,nec................................... N................... X X 4 897 865 N X X 3 878 836
326199A1 Reinforced and fiberglass plasticsproducts, nec ........................ N................... X X 4 205 353 N X X N
326199A111 Transportation reinforced andfiberglass plastics products .......... 126................... X X 1 256 301 148 X X 1 404 466
326199A121 Electrical and electronic reinforced andfiberglass plastics products .......... 108................... X X 714 656 99 X X 577 244
326199A131 Building and construction reinforcedand fiberglass plastics products ...... 121................... X X 860 853 126 X X 674 158
326199A141 Other fabricated fiberglass andreinforced products (except furniture) . 326................... X X 1 373 543 288 X X 1 041 440
326199AY Reinforced and fiberglass plasticsproducts, nec, nsk.................... N................... X X 692 512 N X X N
326199AYWV Reinforced and fiberglass plasticsproducts, nec, nsk.................. N................... X X 692 512 N X X 181 528
See footnotes at end of table.
12 NAICS 326199 MANUFACTURINGmINDUSTRY SERIESU.S. Census Bureau, 1997 Economic Census Nov. 18, 1999
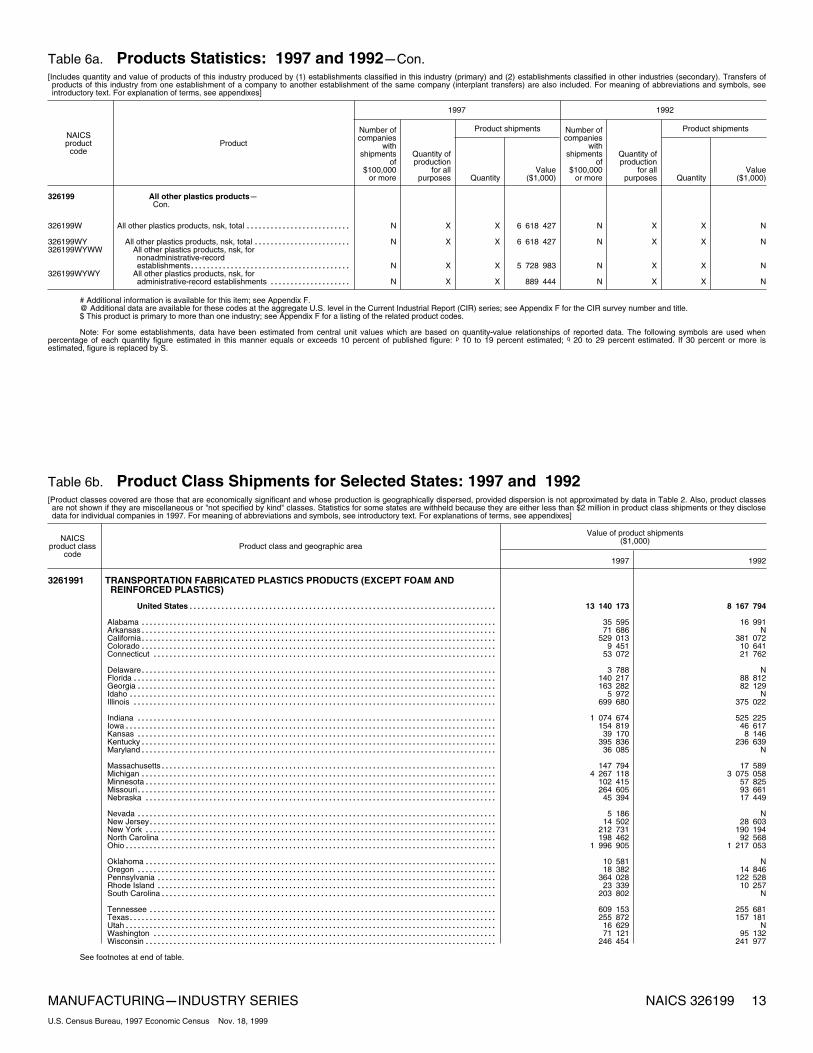
Table 6a. Products Statistics: 1997 and 1992mCon.[Includes quantity and value of products of this industry produced by (1) establishments classified in this industry (primary) and (2) establishments classified in other industries (secondary). Transfers ofproducts of this industry from one establishment of a company to another establishment of the same company (interplant transfers) are also included. For meaning of abbreviations and symbols, seeintroductory text. For explanation of terms, see appendixes]
NAICSproduct
codeProduct
1997 1992
Product shipments Product shipmentsNumber ofcompanies
withshipments
of$100,000
or more
Quantity ofproduction
for allpurposes Quantity
Value($1,000)
Number ofcompanies
withshipments
of$100,000
or more
Quantity ofproduction
for allpurposes Quantity
Value($1,000)
326199 All other plastics productsmCon.
326199W All other plastics products, nsk, total ....... N................... X X 6 618 427 N X X N
326199WY All other plastics products, nsk, total ..... N................... X X 6 618 427 N X X N326199WYWW All other plastics products, nsk, for
nonadministrative~recordestablishments..................... N................... X X 5 728 983 N X X N
326199WYWY All other plastics products, nsk, foradministrative~record establishments . N................... X X 889 444 N X X N
# Additional information is available for this item; see Appendix F.@ Additional data are available for these codes at the aggregate U.S. level in the Current Industrial Report (CIR) series; see Appendix F for the CIR survey number and title.$ This product is primary to more than one industry; see Appendix F for a listing of the related product codes.
Note: For some establishments, data have been estimated from central unit values which are based on quantity~value relationships of reported data. The following symbols are used whenpercentage of each quantity figure estimated in this manner equals or exceeds 10 percent of published figure: p 10 to 19 percent estimated; q 20 to 29 percent estimated. If 30 percent or more isestimated, figure is replaced by S.
Table 6b. Product Class Shipments for Selected States: 1997 and 1992[Product classes covered are those that are economically significant and whose production is geographically dispersed, provided dispersion is not approximated by data in Table 2. Also, product classesare not shown if they are miscellaneous or "not specified by kind" classes. Statistics for some states are withheld because they are either less than $2 million in product class shipments or they disclosedata for individual companies in 1997. For meaning of abbreviations and symbols, see introductory text. For explanations of terms, see appendixes]
NAICSproduct class
codeProduct class and geographic area
Value of product shipments($1,000)
1997 1992
3261991 TRANSPORTATION FABRICATED PLASTICS PRODUCTS (EXCEPT FOAM ANDREINFORCED PLASTICS)
United States 13 140 173............................................................................. 8 167 794
Alabama 35 595......................................................................................... 16 991 Arkansas 71 686......................................................................................... N California 529 013......................................................................................... 381 072 Colorado 9 451......................................................................................... 10 641 Connecticut 53 072...................................................................................... 21 762
Delaware 3 788......................................................................................... N Florida 140 217........................................................................................... 88 812 Georgia 163 282.......................................................................................... 82 129 Idaho 5 972............................................................................................ N Illinois 699 680........................................................................................... 375 022
Indiana 1 074 674.......................................................................................... 525 225 Iowa 154 819............................................................................................. 46 617 Kansas 39 170.......................................................................................... 8 146 Kentucky 395 836......................................................................................... 236 639 Maryland 36 085......................................................................................... N
Massachusetts 147 794.................................................................................... 17 589 Michigan 4 267 118......................................................................................... 3 075 058 Minnesota 102 415........................................................................................ 57 825 Missouri 264 605.......................................................................................... 93 661 Nebraska 45 394........................................................................................ 17 449
Nevada 5 186.......................................................................................... N New Jersey 14 502....................................................................................... 28 603 New York 212 731........................................................................................ 190 194 North Carolina 198 462.................................................................................... 92 568 Ohio 1 996 905............................................................................................. 1 217 053
Oklahoma 10 581........................................................................................ N Oregon 18 382.......................................................................................... 14 846 Pennsylvania 364 028..................................................................................... 122 528 Rhode Island 23 339..................................................................................... 10 257 South Carolina 203 802.................................................................................... N
Tennessee 609 153....................................................................................... 255 681 Texas 255 872............................................................................................ 157 181 Utah 16 629............................................................................................. N Washington 71 121...................................................................................... 95 132 Wisconsin 246 454........................................................................................ 241 977
See footnotes at end of table.
MANUFACTURINGmINDUSTRY SERIES NAICS 326199 13U.S. Census Bureau, 1997 Economic Census Nov. 18, 1999
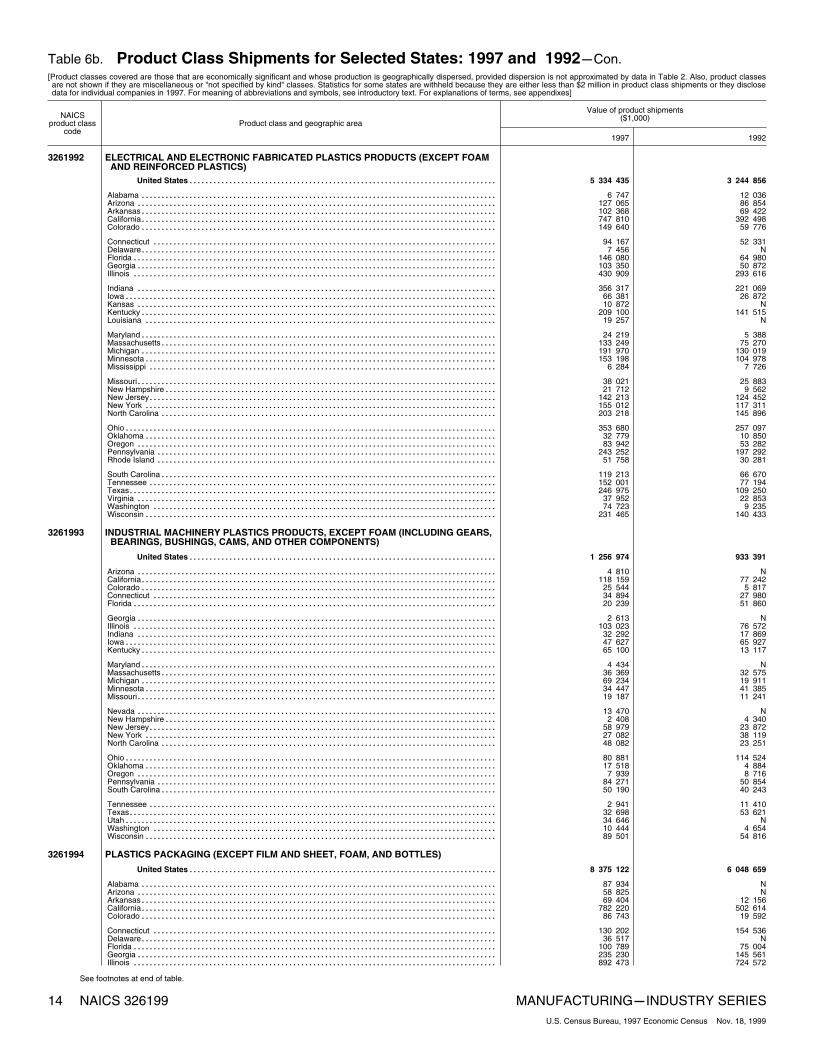
Table 6b. Product Class Shipments for Selected States: 1997 and 1992mCon.[Product classes covered are those that are economically significant and whose production is geographically dispersed, provided dispersion is not approximated by data in Table 2. Also, product classesare not shown if they are miscellaneous or "not specified by kind" classes. Statistics for some states are withheld because they are either less than $2 million in product class shipments or they disclosedata for individual companies in 1997. For meaning of abbreviations and symbols, see introductory text. For explanations of terms, see appendixes]
NAICSproduct class
codeProduct class and geographic area
Value of product shipments($1,000)
1997 1992
3261992 ELECTRICAL AND ELECTRONIC FABRICATED PLASTICS PRODUCTS (EXCEPT FOAMAND REINFORCED PLASTICS)
United States 5 334 435............................................................................. 3 244 856
Alabama 6 747......................................................................................... 12 036 Arizona 127 065.......................................................................................... 86 854 Arkansas 102 368......................................................................................... 69 422 California 747 810......................................................................................... 392 498 Colorado 149 640......................................................................................... 59 776
Connecticut 94 167...................................................................................... 52 331 Delaware 7 456......................................................................................... N Florida 146 080........................................................................................... 64 980 Georgia 103 350.......................................................................................... 50 872 Illinois 430 909........................................................................................... 293 616
Indiana 356 317.......................................................................................... 221 069 Iowa 66 381............................................................................................. 26 872 Kansas 10 872.......................................................................................... N Kentucky 209 100......................................................................................... 141 515 Louisiana 19 257........................................................................................ N
Maryland 24 219......................................................................................... 5 388 Massachusetts 133 249.................................................................................... 75 270 Michigan 191 970......................................................................................... 130 019 Minnesota 153 198........................................................................................ 104 978 Mississippi 6 284....................................................................................... 7 726
Missouri 38 021.......................................................................................... 25 883 New Hampshire 21 712................................................................................... 9 562 New Jersey 142 213....................................................................................... 124 452 New York 155 012........................................................................................ 117 311 North Carolina 203 218.................................................................................... 145 896
Ohio 353 680............................................................................................. 257 097 Oklahoma 32 779........................................................................................ 10 850 Oregon 83 942.......................................................................................... 53 282 Pennsylvania 243 252..................................................................................... 197 292 Rhode Island 51 758..................................................................................... 30 281
South Carolina 119 213.................................................................................... 66 670 Tennessee 152 001....................................................................................... 77 194 Texas 246 975............................................................................................ 109 250 Virginia 37 952.......................................................................................... 22 853 Washington 74 723...................................................................................... 9 235 Wisconsin 231 465........................................................................................ 140 433
3261993 INDUSTRIAL MACHINERY PLASTICS PRODUCTS, EXCEPT FOAM (INCLUDING GEARS,BEARINGS, BUSHINGS, CAMS, AND OTHER COMPONENTS)
United States 1 256 974............................................................................. 933 391
Arizona 4 810.......................................................................................... N California 118 159......................................................................................... 77 242 Colorado 25 544......................................................................................... 5 817 Connecticut 34 894...................................................................................... 27 980 Florida 20 239........................................................................................... 51 860
Georgia 2 613.......................................................................................... N Illinois 103 023........................................................................................... 76 572 Indiana 32 292.......................................................................................... 17 869 Iowa 47 627............................................................................................. 65 927 Kentucky 65 100......................................................................................... 13 117
Maryland 4 434......................................................................................... N Massachusetts 36 369.................................................................................... 32 575 Michigan 69 234......................................................................................... 19 911 Minnesota 34 447........................................................................................ 41 385 Missouri 19 187.......................................................................................... 11 241
Nevada 13 470.......................................................................................... N New Hampshire 2 408................................................................................... 4 340 New Jersey 58 979....................................................................................... 23 872 New York 27 082........................................................................................ 38 119 North Carolina 48 082.................................................................................... 23 251
Ohio 80 881............................................................................................. 114 524 Oklahoma 17 518........................................................................................ 4 884 Oregon 7 939.......................................................................................... 8 716 Pennsylvania 84 271..................................................................................... 50 854 South Carolina 50 190.................................................................................... 40 243
Tennessee 2 941....................................................................................... 11 410 Texas 32 698............................................................................................ 53 621 Utah 34 646............................................................................................. N Washington 10 444...................................................................................... 4 654 Wisconsin 89 501........................................................................................ 54 816
3261994 PLASTICS PACKAGING (EXCEPT FILM AND SHEET, FOAM, AND BOTTLES)
United States 8 375 122............................................................................. 6 048 659
Alabama 87 934......................................................................................... N Arizona 58 825.......................................................................................... N Arkansas 69 404......................................................................................... 12 156 California 782 220......................................................................................... 502 614 Colorado 86 743......................................................................................... 19 592
Connecticut 130 202...................................................................................... 154 536 Delaware 36 517......................................................................................... N Florida 100 789........................................................................................... 75 004 Georgia 235 230.......................................................................................... 145 561 Illinois 892 473........................................................................................... 724 572
See footnotes at end of table.
14 NAICS 326199 MANUFACTURINGmINDUSTRY SERIESU.S. Census Bureau, 1997 Economic Census Nov. 18, 1999
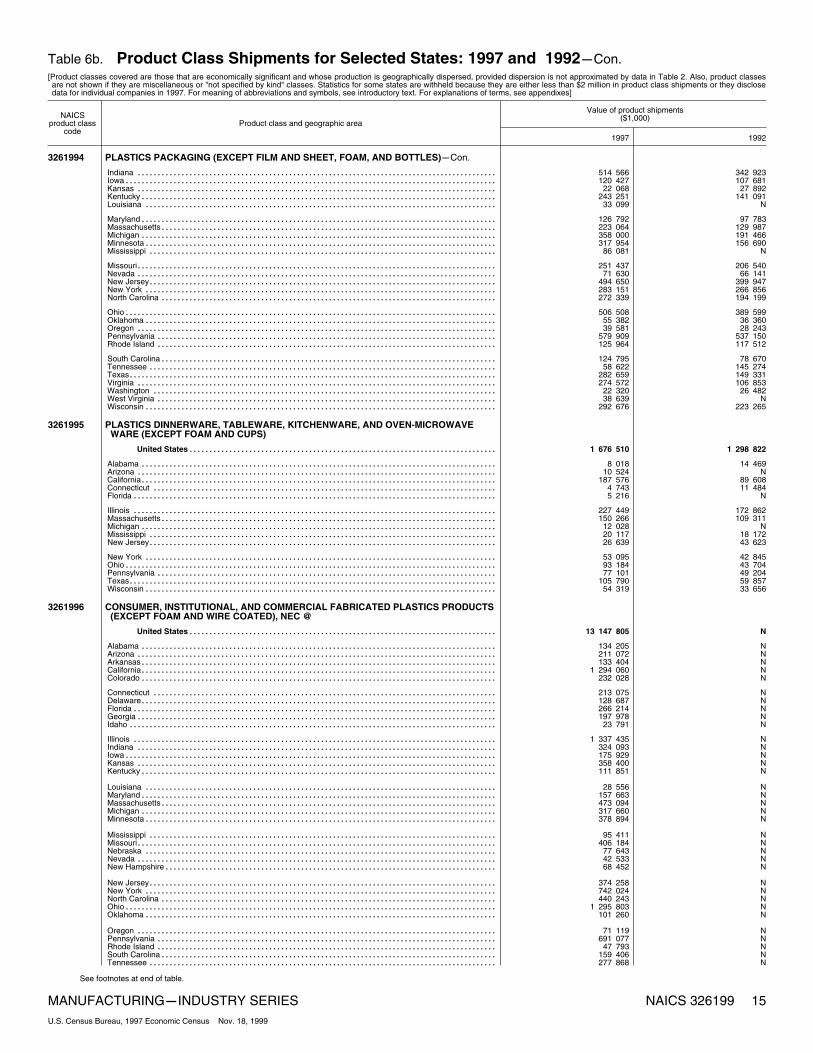
Table 6b. Product Class Shipments for Selected States: 1997 and 1992mCon.[Product classes covered are those that are economically significant and whose production is geographically dispersed, provided dispersion is not approximated by data in Table 2. Also, product classesare not shown if they are miscellaneous or "not specified by kind" classes. Statistics for some states are withheld because they are either less than $2 million in product class shipments or they disclosedata for individual companies in 1997. For meaning of abbreviations and symbols, see introductory text. For explanations of terms, see appendixes]
NAICSproduct class
codeProduct class and geographic area
Value of product shipments($1,000)
1997 1992
3261994 PLASTICS PACKAGING (EXCEPT FILM AND SHEET, FOAM, AND BOTTLES)mCon.
Indiana 514 566.......................................................................................... 342 923 Iowa 120 427............................................................................................. 107 681 Kansas 22 068.......................................................................................... 27 892 Kentucky 243 251......................................................................................... 141 091 Louisiana 33 099........................................................................................ N
Maryland 126 792......................................................................................... 97 783 Massachusetts 223 064.................................................................................... 129 987 Michigan 358 000......................................................................................... 191 466 Minnesota 317 954........................................................................................ 156 690 Mississippi 86 081....................................................................................... N
Missouri 251 437.......................................................................................... 206 540 Nevada 71 630.......................................................................................... 66 141 New Jersey 494 650....................................................................................... 399 947 New York 283 151........................................................................................ 266 856 North Carolina 272 339.................................................................................... 194 199
Ohio 506 508............................................................................................. 389 599 Oklahoma 55 382........................................................................................ 36 360 Oregon 39 581.......................................................................................... 28 243 Pennsylvania 579 909..................................................................................... 537 150 Rhode Island 125 964..................................................................................... 117 512
South Carolina 124 795.................................................................................... 78 670 Tennessee 58 622....................................................................................... 145 274 Texas 282 659............................................................................................ 149 331 Virginia 274 572.......................................................................................... 106 853 Washington 22 320...................................................................................... 26 482 West Virginia 38 639..................................................................................... N Wisconsin 292 676........................................................................................ 223 265
3261995 PLASTICS DINNERWARE, TABLEWARE, KITCHENWARE, AND OVEN~MICROWAVEWARE (EXCEPT FOAM AND CUPS)
United States 1 676 510............................................................................. 1 298 822
Alabama 8 018......................................................................................... 14 469 Arizona 10 524.......................................................................................... N California 187 576......................................................................................... 89 608 Connecticut 4 743...................................................................................... 11 484 Florida 5 216........................................................................................... N
Illinois 227 449........................................................................................... 172 862 Massachusetts 150 266.................................................................................... 109 311 Michigan 12 028......................................................................................... N Mississippi 20 117....................................................................................... 18 172 New Jersey 26 639....................................................................................... 43 623
New York 53 095........................................................................................ 42 845 Ohio 93 184............................................................................................. 43 704 Pennsylvania 77 101..................................................................................... 49 204 Texas 105 790............................................................................................ 59 857 Wisconsin 54 319........................................................................................ 33 656
3261996 CONSUMER, INSTITUTIONAL, AND COMMERCIAL FABRICATED PLASTICS PRODUCTS(EXCEPT FOAM AND WIRE COATED), NEC @
United States 13 147 805............................................................................. N
Alabama 134 205......................................................................................... N Arizona 211 072.......................................................................................... N Arkansas 133 404......................................................................................... N California 1 294 060......................................................................................... N Colorado 232 028......................................................................................... N
Connecticut 213 075...................................................................................... N Delaware 128 687......................................................................................... N Florida 266 214........................................................................................... N Georgia 197 978.......................................................................................... N Idaho 23 791............................................................................................ N
Illinois 1 337 435........................................................................................... N Indiana 324 093.......................................................................................... N Iowa 175 929............................................................................................. N Kansas 358 400.......................................................................................... N Kentucky 111 851......................................................................................... N
Louisiana 28 556........................................................................................ N Maryland 157 663......................................................................................... N Massachusetts 473 094.................................................................................... N Michigan 317 660......................................................................................... N Minnesota 378 894........................................................................................ N
Mississippi 95 411....................................................................................... N Missouri 406 184.......................................................................................... N Nebraska 77 643........................................................................................ N Nevada 42 533.......................................................................................... N New Hampshire 68 452................................................................................... N
New Jersey 374 258....................................................................................... N New York 742 024........................................................................................ N North Carolina 440 243.................................................................................... N Ohio 1 295 803............................................................................................. N Oklahoma 101 260........................................................................................ N
Oregon 71 119.......................................................................................... N Pennsylvania 691 077..................................................................................... N Rhode Island 47 793..................................................................................... N South Carolina 159 406.................................................................................... N Tennessee 277 868....................................................................................... N
See footnotes at end of table.
MANUFACTURINGmINDUSTRY SERIES NAICS 326199 15U.S. Census Bureau, 1997 Economic Census Nov. 18, 1999
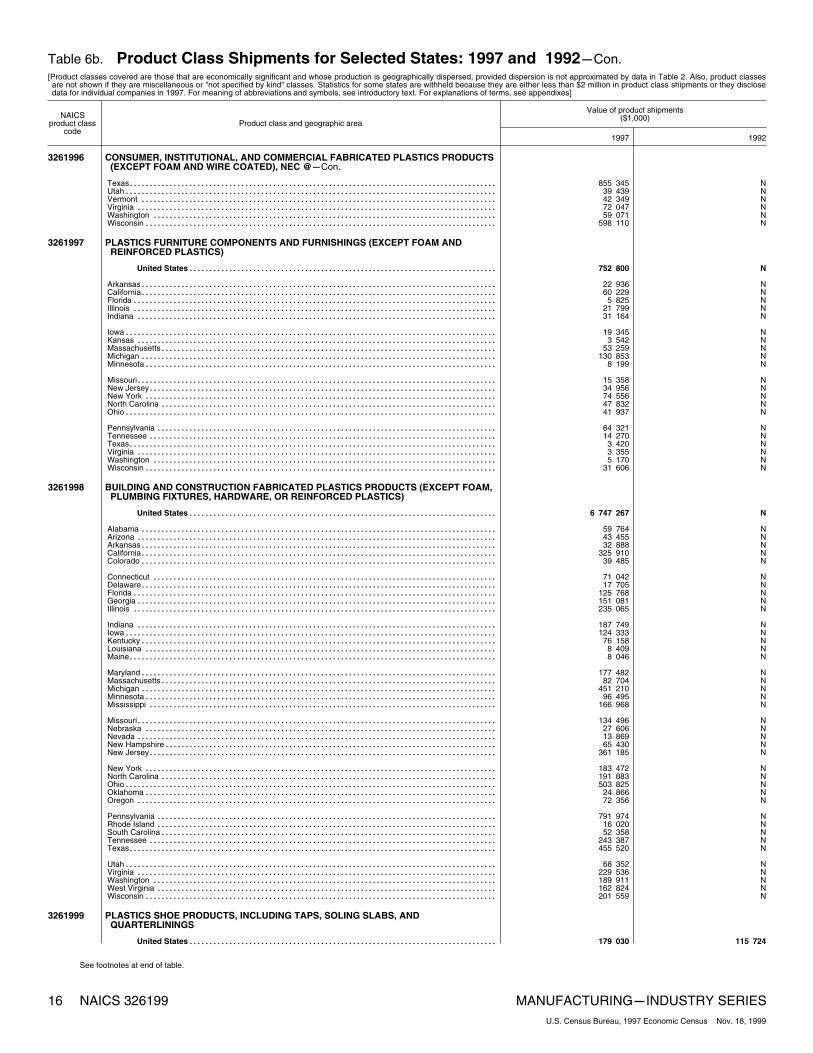
Table 6b. Product Class Shipments for Selected States: 1997 and 1992mCon.[Product classes covered are those that are economically significant and whose production is geographically dispersed, provided dispersion is not approximated by data in Table 2. Also, product classesare not shown if they are miscellaneous or "not specified by kind" classes. Statistics for some states are withheld because they are either less than $2 million in product class shipments or they disclosedata for individual companies in 1997. For meaning of abbreviations and symbols, see introductory text. For explanations of terms, see appendixes]
NAICSproduct class
codeProduct class and geographic area
Value of product shipments($1,000)
1997 1992
3261996 CONSUMER, INSTITUTIONAL, AND COMMERCIAL FABRICATED PLASTICS PRODUCTS(EXCEPT FOAM AND WIRE COATED), NEC @mCon.
Texas 855 345............................................................................................ N Utah 39 439............................................................................................. N Vermont 42 349......................................................................................... N Virginia 72 047.......................................................................................... N Washington 59 071...................................................................................... N Wisconsin 598 110........................................................................................ N
3261997 PLASTICS FURNITURE COMPONENTS AND FURNISHINGS (EXCEPT FOAM ANDREINFORCED PLASTICS)
United States 752 800............................................................................. N
Arkansas 22 936......................................................................................... N California 60 229......................................................................................... N Florida 5 825........................................................................................... N Illinois 21 799........................................................................................... N Indiana 31 164.......................................................................................... N
Iowa 19 345............................................................................................. N Kansas 3 542.......................................................................................... N Massachusetts 53 259.................................................................................... N Michigan 130 853......................................................................................... N Minnesota 8 199........................................................................................ N
Missouri 15 358.......................................................................................... N New Jersey 34 956....................................................................................... N New York 74 556........................................................................................ N North Carolina 47 832.................................................................................... N Ohio 41 937............................................................................................. N
Pennsylvania 64 321..................................................................................... N Tennessee 14 270....................................................................................... N Texas 3 420............................................................................................ N Virginia 3 355.......................................................................................... N Washington 5 170...................................................................................... N Wisconsin 31 606........................................................................................ N
3261998 BUILDING AND CONSTRUCTION FABRICATED PLASTICS PRODUCTS (EXCEPT FOAM,PLUMBING FIXTURES, HARDWARE, OR REINFORCED PLASTICS)
United States 6 747 267............................................................................. N
Alabama 59 764......................................................................................... N Arizona 43 455.......................................................................................... N Arkansas 32 888......................................................................................... N California 325 910......................................................................................... N Colorado 39 485......................................................................................... N
Connecticut 71 042...................................................................................... N Delaware 17 705......................................................................................... N Florida 125 768........................................................................................... N Georgia 151 081.......................................................................................... N Illinois 235 065........................................................................................... N
Indiana 187 749.......................................................................................... N Iowa 124 333............................................................................................. N Kentucky 76 158......................................................................................... N Louisiana 8 409........................................................................................ N Maine 8 046............................................................................................ N
Maryland 177 482......................................................................................... N Massachusetts 82 704.................................................................................... N Michigan 451 210......................................................................................... N Minnesota 96 495........................................................................................ N Mississippi 166 968....................................................................................... N
Missouri 134 496.......................................................................................... N Nebraska 27 606........................................................................................ N Nevada 13 869.......................................................................................... N New Hampshire 65 430................................................................................... N New Jersey 361 185....................................................................................... N
New York 183 472........................................................................................ N North Carolina 191 883.................................................................................... N Ohio 503 825............................................................................................. N Oklahoma 24 866........................................................................................ N Oregon 72 356.......................................................................................... N
Pennsylvania 791 974..................................................................................... N Rhode Island 16 020..................................................................................... N South Carolina 52 358.................................................................................... N Tennessee 243 387....................................................................................... N Texas 455 520............................................................................................ N
Utah 68 352............................................................................................. N Virginia 229 536.......................................................................................... N Washington 189 911...................................................................................... N West Virginia 162 824..................................................................................... N Wisconsin 201 559........................................................................................ N
3261999 PLASTICS SHOE PRODUCTS, INCLUDING TAPS, SOLING SLABS, ANDQUARTERLININGS
United States 179 030............................................................................. 115 724
See footnotes at end of table.
16 NAICS 326199 MANUFACTURINGmINDUSTRY SERIESU.S. Census Bureau, 1997 Economic Census Nov. 18, 1999
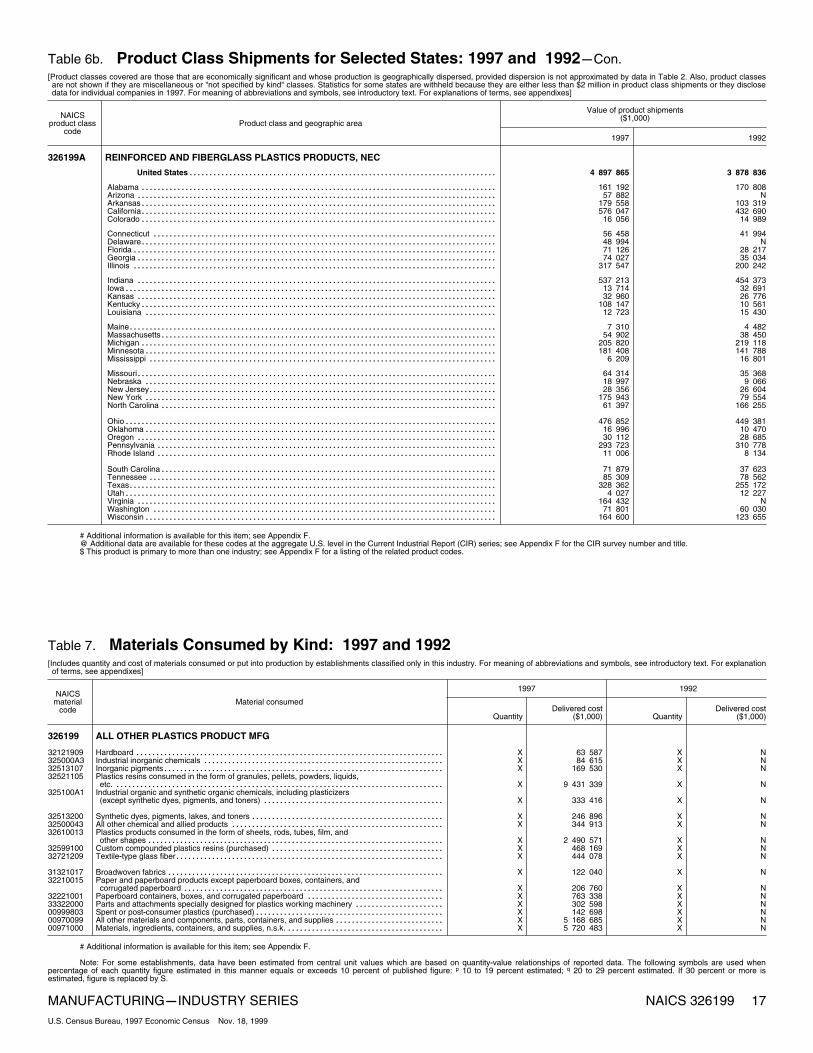
Table 6b. Product Class Shipments for Selected States: 1997 and 1992mCon.[Product classes covered are those that are economically significant and whose production is geographically dispersed, provided dispersion is not approximated by data in Table 2. Also, product classesare not shown if they are miscellaneous or "not specified by kind" classes. Statistics for some states are withheld because they are either less than $2 million in product class shipments or they disclosedata for individual companies in 1997. For meaning of abbreviations and symbols, see introductory text. For explanations of terms, see appendixes]
NAICSproduct class
codeProduct class and geographic area
Value of product shipments($1,000)
1997 1992
326199A REINFORCED AND FIBERGLASS PLASTICS PRODUCTS, NEC
United States 4 897 865............................................................................. 3 878 836
Alabama 161 192......................................................................................... 170 808 Arizona 57 882.......................................................................................... N Arkansas 179 558......................................................................................... 103 319 California 576 047......................................................................................... 432 690 Colorado 16 056......................................................................................... 14 989
Connecticut 56 458...................................................................................... 41 994 Delaware 48 994......................................................................................... N Florida 71 126........................................................................................... 28 217 Georgia 74 027.......................................................................................... 35 034 Illinois 317 547........................................................................................... 200 242
Indiana 537 213.......................................................................................... 454 373 Iowa 13 714............................................................................................. 32 691 Kansas 32 960.......................................................................................... 26 776 Kentucky 108 147......................................................................................... 10 561 Louisiana 12 723........................................................................................ 15 430
Maine 7 310............................................................................................ 4 482 Massachusetts 54 902.................................................................................... 38 450 Michigan 205 820......................................................................................... 219 118 Minnesota 181 408........................................................................................ 141 788 Mississippi 6 209....................................................................................... 16 801
Missouri 64 314.......................................................................................... 35 368 Nebraska 18 997........................................................................................ 9 066 New Jersey 28 356....................................................................................... 26 604 New York 175 943........................................................................................ 79 554 North Carolina 61 397.................................................................................... 166 255
Ohio 476 852............................................................................................. 449 381 Oklahoma 16 996........................................................................................ 10 470 Oregon 30 112.......................................................................................... 28 685 Pennsylvania 293 723..................................................................................... 310 778 Rhode Island 11 006..................................................................................... 8 134
South Carolina 71 879.................................................................................... 37 623 Tennessee 85 309....................................................................................... 78 562 Texas 328 362............................................................................................ 255 172 Utah 4 027............................................................................................. 12 227 Virginia 164 432.......................................................................................... N Washington 71 801...................................................................................... 60 030 Wisconsin 164 600........................................................................................ 123 655
# Additional information is available for this item; see Appendix F.@ Additional data are available for these codes at the aggregate U.S. level in the Current Industrial Report (CIR) series; see Appendix F for the CIR survey number and title.$ This product is primary to more than one industry; see Appendix F for a listing of the related product codes.
Table 7. Materials Consumed by Kind: 1997 and 1992[Includes quantity and cost of materials consumed or put into production by establishments classified only in this industry. For meaning of abbreviations and symbols, see introductory text. For explanationof terms, see appendixes]
NAICSmaterial
codeMaterial consumed
1997 1992
QuantityDelivered cost
($1,000) QuantityDelivered cost
($1,000)
326199 ALL OTHER PLASTICS PRODUCT MFG
32121909 Hardboard .......................................................... X................... 63 587 X N325000A3 Industrial inorganic chemicals ......................................... X................... 84 615 X N32513107 Inorganic pigments................................................... X................... 169 530 X N32521105 Plastics resins consumed in the form of granules, pellets, powders, liquids,
etc. ............................................................... X................... 9 431 339 X N325100A1 Industrial organic and synthetic organic chemicals, including plasticizers
(except synthetic dyes, pigments, and toners) .......................... X................... 333 416 X N
32513200 Synthetic dyes, pigments, lakes, and toners ............................. X................... 246 896 X N32500043 All other chemical and allied products .................................. X................... 344 913 X N32610013 Plastics products consumed in the form of sheets, rods, tubes, film, and
other shapes ....................................................... X................... 2 490 571 X N32599100 Custom compounded plastics resins (purchased) ........................ X................... 468 169 X N32721209 Textile~type glass fiber................................................ X................... 444 078 X N
31321017 Broadwoven fabrics .................................................. X................... 122 040 X N32210015 Paper and paperboard products except paperboard boxes, containers, and
corrugated paperboard .............................................. X................... 206 760 X N32221001 Paperboard containers, boxes, and corrugated paperboard ............... X................... 763 338 X N33322000 Parts and attachments specially designed for plastics working machinery ... X................... 302 598 X N00999803 Spent or post~consumer plastics (purchased)............................ X................... 142 698 X N00970099 All other materials and components, parts, containers, and supplies ........ X................... 5 168 685 X N00971000 Materials, ingredients, containers, and supplies, n.s.k. .................... X................... 5 720 483 X N
# Additional information is available for this item; see Appendix F.
Note: For some establishments, data have been estimated from central unit values which are based on quantity~value relationships of reported data. The following symbols are used whenpercentage of each quantity figure estimated in this manner equals or exceeds 10 percent of published figure: p 10 to 19 percent estimated; q 20 to 29 percent estimated. If 30 percent or more isestimated, figure is replaced by S.
MANUFACTURINGmINDUSTRY SERIES NAICS 326199 17U.S. Census Bureau, 1997 Economic Census Nov. 18, 1999
Appendix A.Explanation of Terms
BEGINNING- AND END-OF-YEAR INVENTORIES
Respondents were asked to report their beginning-of-year and end-of-year inventories at cost or market. Effec-tive with the 1982 Economic Census, this change to a uni-form instruction for reporting inventories was introducedfor all sector reports. Prior to 1982, respondents were per-mitted to value inventories using any generally acceptedaccounting method (FIFO, LIFO, market, to name a few).Beginning in 1982, LIFO users were asked to first reportinventory values prior to the LIFO adjustment and then toreport the LIFO reserve and the LIFO value after adjust-ment for the reserve.
Inventory Data by Stage of Fabrication
Total inventories and three detailed components (1) fin-ished goods, (2) work-in-process, and (3) materials, sup-plies, fuels, etc., were collected.
When using inventory data by stage of fabrication for‘‘all industries’’ and at the three-digit subsector level, itshould be noted that an item treated as a finished productby an establishment in one industry may be reported as araw material by an establishment in a different industry.For example, the finished-product inventories of a steelmill would be reported as raw materials by a stampingplant. Such differences are present in the inventory figuresby stage of fabrication shown for all publication levels.
COST OF MATERIALS
This term refers to direct charges actually paid or pay-able for items consumed or put into production during theyear, including freight charges and other direct chargesincurred by the establishment in acquiring these materials.It includes the cost of materials or fuel consumed,whether purchased by the individual establishment fromother companies, transferred to it from other establish-ments of the same company, or withdrawn from inventoryduring the year.
Included in this item are:
1. Cost of parts, components, containers, etc.—Includesall raw materials, semifinished goods, parts, contain-ers, scrap, and supplies put into production or used asoperating supplies and for repair and maintenanceduring the year.
2. Cost of products bought and sold in the same condi-tion.
3. Cost of fuels consumed for heat and power—Includesthe cost of materials or fuel consumed, whether pur-chased by the individual establishment from othercompanies, transferred to it from other establishmentsof the same company, or withdrawn from inventoryduring the year.
4. Cost of purchased electricity—The cost of purchasedelectric energy represents the amount actually usedduring the year for heat and power. In addition, infor-mation was collected on the quantity of electricenergy generated by the establishment and the quan-tity of electric energy sold or transferred to otherplants of the same company.
5. Cost of contract work—This term applies to workdone by others on materials furnished by the manu-facturing establishment. The actual cost of the mate-rial is to be reported on the cost of materials, parts,and containers line of this item. The term ‘‘ContractWork’’ refers to the fee a company pays to anothercompany to perform a service.
Specific Materials Consumed
In addition to the total cost of materials, which everyestablishment was required to report, information alsowas collected for most manufacturing industries on theconsumption of major materials used in manufacturing.The inquiries were restricted to those materials whichwere important parts of the cost of production in a par-ticular industry and for which cost information was avail-able from manufacturers’ records. If less than $25,000 ofa listed material was consumed by an establishment, thecost data could be reported in the ‘‘Cost of all other mate-rials...,’’ Census material code 00970099. Also, the cost ofmaterials for small establishments for which administra-tive records or short forms were used was imputed intothe ‘‘Materials not specified by kind,’’ Census materialscode 00971000.
Duplication in Cost of Materials and Value ofShipment
The aggregate of the cost of materials and value ofshipments figures for industry groups and for all manufac-turing industries includes large amounts of duplicationsince the products of some industries are used as materi-als by others. This duplication results, in part, from theaddition of related industries representing successive
APPENDIX A A–11997 ECONOMIC CENSUS
U.S. Census Bureau, 1997 Economic Census
stages in the production of a finished manufactured prod-uct. Examples are the addition of flour mills to bakeries inthe food group and the addition of pulp mills to papermills in the paper and allied products group of industries.Estimates of the overall extent of this duplication indicatethat the value of manufactured products exclusive of suchduplication (the value of finished manufactures) tends toapproximate two-thirds of the total value of productsreported in the survey.
Duplication of products within individual industries issignificant within a number of industry groups, e.g.,machinery and transportation industries. These industriesfrequently include complete machinery and their parts. Inthis case, the parts made for original equipment are mate-rials consumed for assembly plants in the same industry.
Even when no significant amount of duplication isinvolved, value of shipments figures are deficient as mea-sures of the relative economic importance of individualmanufacturing industries or geographic areas because ofthe wide variation in ratio of materials, labor, and otherprocessing costs of value of shipments, both amongindustries and within the same industry.
Before 1962, cost of materials and value of shipmentswere not published for some industries which includedconsiderable duplication. Since then, these data have beenpublished for all industries at the U.S. level and beginningin 1964, for all geographic levels.
COST OF PURCHASED SERVICES
Annual Survey of Manufactures (ASM) establishmentswere requested to provide information on the cost of pur-chased services for the repair of buildings and other struc-tures, the repair of machinery, communication services,legal services, accounting and bookkeeping services,advertising, software and other data processing services,and refuse removal. Each of these items reflects the costspaid directly by the establishment and excludes salariespaid to employees of the establishment for these services.
Included in the cost of purchased services for the repairof buildings and machinery are payments made for allmaintenance and repair work on buildings and equipment.Payments made to other establishments of the same com-pany and for repair and maintenance of any leased prop-erty also are included. Extensive repairs or reconstructionthat was capitalized is considered capital expendituresand is, therefore, excluded from this item. Repair andmaintenance costs provided by an owner as part of arental contract or incurred directly by an establishment inusing its own work force also are excluded.
Included in the cost of purchased advertising servicesare payments for printing, media coverage, and otheradvertising services and materials.
Included in the cost of purchased software and otherdata processing services are all purchases by the estab-lishment from other companies. Excluded are services pro-vided by other establishments of the same company (suchas by a separate data processing unit).
Included in the cost of purchased refuse removal ser-vices are all costs of refuse removal services paid by theestablishment, including costs for hazardous wasteremoval or treatment. Excluded are all costs included inrental payments or as capital expenditures.
Response Coverage Ratio
A response coverage ratio is a measure of the extent towhich respondents report for an item. The estimate ismade by calculating the ratio value of the weighted totalemployment data for all the ASM establishments thatreport the item to the weighted total employment data forall ASM establishments classified in an industry (reportersand non-reporters).
DEPRECIATION CHARGES FOR FIXED ASSETS
This item includes depreciation and amortizationcharged during the year against assets. Depreciationcharged against fixed assets acquired since the beginningof the year and against assets sold or retired during theyear are components of this category. Respondents wererequested to make certain that they did not report accu-mulated depreciation.
EMPLOYEES
This item includes all full-time and part-time employeeson the payrolls of operating manufacturing establishmentsduring any part of the pay period which included the 12thof the months specified on the report form. Included areall persons on paid sick leave, paid holidays, and paidvacations during these pay periods. Officers of corpora-tions are included as employees; proprietors and partnersof unincorporated firms are excluded. The ‘‘all employees’’number is the average number of production workers plusthe number of other employees in mid-March. The numberof production workers is the average for the payroll peri-ods including the 12th of March, May, August, and Novem-ber.
Production Workers
This item includes workers (up through the line-supervisor level) engaged in fabricating, processing,assembling, inspecting, receiving, storing, handling, pack-ing, warehousing, shipping (but not delivering), mainte-nance, repair, janitorial and guard services, product devel-opment, auxiliary production for plant’s own use (e.g.,power plant), recordkeeping, and other services closelyassociated with these production operations at the estab-lishment covered by the report. Employees above theworking-supervisor level are excluded from this item.
All Other Employees
This item covers nonproduction employees of themanufacturing establishment including those engaged infactory supervision above the line-supervisor level. It
A–2 APPENDIX A 1997 ECONOMIC CENSUS
U.S. Census Bureau, 1997 Economic Census
includes sales (including driver-salespersons), sales deliv-ery (highway truck drivers and their helpers), advertising,credit, collection, installation and servicing of own prod-ucts, clerical and routine office functions, executive, pur-chasing, financing, legal, personnel (including cafeteria,medical, etc.), professional, and technical employees. Alsoincluded are employees on the payroll of the manufactur-ing establishment engaged in the construction of majoradditions or alterations utilized as a separate work force.
FRINGE BENEFITS
Fringe benefits are divided into legally required expen-ditures and payments for voluntary programs. The legallyrequired portion consists primarily of Federal old age andsurvivors’ insurance, unemployment compensation, andworkers’ compensation. Payments for voluntary programsinclude all programs not specifically required by legisla-tion whether they were employer initiated or the result ofcollective bargaining. They include the employer portionof such plans as insurance premiums, premiums forsupplemental accident and sickness insurance, pensionplans, supplemental unemployment compensation, wel-fare plans, stock purchase plans on which the employerpayment is not subject to withholding tax, and deferredprofit-sharing plans. They exclude such items as company-operated cafeterias, in-plant medical services, free parkinglots, discounts on employee purchases, and uniforms andwork clothing for employees.
GROSS BOOK VALUE OF DEPRECIABLE ASSETS ATBEGINNING OF YEAR (BOY) AND END OF YEAR (EOY)
Total value of depreciable assets is collected on all cen-sus forms. It shows the value of depreciable assets for thebeginning of year and end of year. The data encompass allfixed depreciable assets on the books of establishments.The values shown (book value) represent the actual costof assets at the time they were acquired, including allcosts incurred in making the assets usable (such as trans-portation and installation). Included are all buildings,structures, machinery, and equipment (production, office,and transportation equipment) for which depreciationreserves are maintained. Excluded are nondepreciablecapital assets including inventories and intangible assets,such as timber and mineral rights.
The definition of fixed depreciable assets is consistentwith the definition of capital expenditures. For example,expenditures include actual capital outlays during the yearrather than the final value of equipment put in place andbuildings completed during the year. Accordingly, thevalue of assets at the end of the year includes the value ofconstruction in progress.
In addition, respondents were requested to make cer-tain that assets at the beginning of the year plus capitalexpenditures, less retirements, equaled assets at the endof the year.
NUMBER OF ESTABLISHMENTS AND COMPANIES
A separate report was required for each manufacturingestablishment (plant) with one employee or more. Anestablishment is defined as a single physical locationwhere manufacturing is performed. A company, on theother hand, is defined as a business organization consist-ing of one establishment or more under common owner-ship or control.
If the company operated at different physical locations,even if the individual locations were producing the sameline of goods, a separate report was requested for eachlocation. If the company operated in two or more distinctlines of manufacturing at the same location, a separatereport was requested for each activity.
An establishment not in operation for any portion ofthe year was requested to return the report form with theproper notation in the ‘‘Operational Status’’ section of theform. In addition, the establishment was requested toreport data on any employees, capital expenditures, inven-tories, or shipments from inventories during the year.
PAYROLL
This item includes the gross earnings of all employeeson the payrolls of operating manufacturing establishmentspaid in the calendar year. Respondents were told theycould follow the definition of payrolls used for calculatingthe Federal withholding tax. It includes all forms of com-pensation, such as salaries, wages, commissions, dis-missal pay, bonuses, vacation and sick leave pay, andcompensation in kind, prior to such deductions as employ-ees’ social security contributions, withholding taxes,group insurance, union dues, and savings bonds. The totalincludes salaries of officers of corporations; it excludespayments to proprietors or partners of unincorporatedconcerns. Also excluded are payments to members ofArmed Forces and pensioners carried on the active pay-rolls of manufacturing establishments.
The census definition of payrolls is identical to that rec-ommended to all Federal statistical agencies by the Officeof Management and Budget. It should be noted that thisdefinition does not include employers’ social security con-tributions or other nonpayroll labor costs, such as employ-ees’ pension plans, group insurance premiums, and work-ers’ compensation.
The ASM provides estimates of employers’ total supple-mental labor costs (those required by Federal and statelaws and those incurred voluntarily or as part of collectivebargaining agreements).
PRODUCT CODES AND CLASSES OF PRODUCTS
NAICS United States industries are identified by a six-digit code, in contrast to the four-digit SIC code. Thelonger code accommodates the large number of sectorsand allows more flexibility in designing subsectors. Each
APPENDIX A A–31997 ECONOMIC CENSUS
U.S. Census Bureau, 1997 Economic Census
product or service is assigned a ten-digit code. The prod-uct coding structure represents an extension by the Cen-sus Bureau of the six-digit industry classifications of themanufacturing and mining sectors. The classification sys-tem operates so that the industrial coverage is progres-sively narrower with the successive addition of digits. Thisis illustrated as follows:
NAICS level NAICS code Description
Industry . . . . . . . . . . 33461 Manufacturing and reproductionof magnetic and optical media
U.S. industry. . . . . . 334612 Reproduction of software
Product class . . . . . 3346120 Prerecorded compact disc (exceptsoftware), tape, and record repro-ducing
BLS link code . . . . . 3346120X
Product code . . . . . 3346120XXX
As in previous censuses, data were collected for mostindustries on the quantity and value of individual productsshipped. In the 1997 census program, information wascollected on the output of almost 10,000 individual prod-uct items.
In the new system, there are about 1,500 productclasses (seven-digit codes), about 6,000 census products(ten-digit codes), and an additional 3,700 CIR products(ten-digit codes). The ten-digit products are considered theprimary products of the industry with the same first sixdigits.
The list of products for which separate information wascollected was prepared after consultation with industryand government representatives. Comparability with pre-vious figures was given considerable weight in the selec-tion of product categories so that comparable 1992 infor-mation is presented for most products.
Typically, both quantity and value of shipments infor-mation were collected. However, if quantity was not sig-nificant or could not be reported by manufacturers, onlyvalue of shipments was collected.
Shipments include both commercial shipments andtransfers of products to other plants of the same com-pany. For industries in which a considerable portion of thetotal shipments is transferred to other plants of the samecompany, separate information on interplant transfers alsowas collected. Moreover, for products that are used to alarge degree within the same establishment as materialsor components in the fabrication of other products, totalproduction and often consumption of the item within theplant (quantity produced and consumed) was collected.Typically, the information on production also was collectedfor products for which there are significant differencesbetween total production and shipments in a given yearbecause of wide fluctuations in finished goods invento-ries. Other measures of output of products with long pro-duction cycles were used as appropriate and feasible.
PRIMARY PRODUCT CLASS CODE
This file presents selected statistics for establishmentsaccording to their degree of specialization in products pri-mary to their industry. This field contains either the six-digit North American Industrial Classification System(NAICS) industry code corresponding to all establishmentsin the industry, or the seven-digit NAICS product classcode for all establishments within the industry that arespecialized in a particular product class. Product class spe-cialization is determined by evaluating the ratio of thelargest primary product class shipments to total productshipments (primary plus secondary, excluding miscella-neous receipts) for the establishment.
PRODUCTION-WORKER HOURS
This item covers hours worked or paid for at the plant,including actual overtime hours (not straight-time equiva-lent hours). It excludes hours paid for vacations, holidays,or sick leave.
QUANTITY OF ELECTRIC ENERGY CONSUMED FORHEAT AND POWER
Data on the cost of purchased electric energy were col-lected on all census forms. However, data on the quantityof purchased electric energy were collected only on theAnnual Survey of Manufactures (ASM) form. In addition,information is collected on the quantity of electric energygenerated by the establishment and the quantity of elec-tric energy sold or transferred to other plants of the samecompany.
RENTAL PAYMENTS
Total rental payments are collected on all census forms.However, the breakdown between rental payments forbuildings and other structures and rental payments formachinery and equipment is collected only on the ASMforms. This item includes rental payments for the use ofall items for which depreciation reserves would be main-tained if they were owned by the establishment, e.g.,structures and buildings, and production, office, andtransportation equipment. Excluded are royalties andother payments for the use of intangibles and depletableassets and land rents where separable.
When an establishment of a multiestablishment com-pany was charged rent by another part of the same com-pany for the use of assets owned by the company, it wasinstructed to exclude that cost from rental payments.However, the book value (original cost) of these company-owned assets was to be reported as assets of the estab-lishment at the end of the year.
If there were assets at an establishment rented fromanother company and the rents were paid centrally by thehead office of the establishment, the company wasinstructed to report these rental payments as if they werepaid directly by the establishment.
A–4 APPENDIX A 1997 ECONOMIC CENSUS
U.S. Census Bureau, 1997 Economic Census
RETIREMENTS OF DEPRECIABLE ASSETS
Included in this item is the gross value of assets sold,retired, scrapped, destroyed, etc., during the calendaryear. When a complete operation or establishmentchanged ownership, the respondent was instructed toreport the value of the assets sold at the original cost asrecorded in the books of the seller. The respondent alsowas requested to report retirements of equipment orstructures owned by a parent company that the establish-ment was using as if it were a tenant.
TOTAL CAPITAL EXPENDITURES (NEW AND USED)
For establishments in operation and any known plantsunder construction, manufacturers were asked to reporttheir new and used expenditures for (1) permanent addi-tions and major alterations to manufacturing establish-ments and (2) machinery and equipment used for replace-ment and additions to plant capacity if they were of thetype for which depreciation accounts were ordinarily main-tained.
Totals for expenditures include the costs of assetsleased from nonmanufacturing concerns through capitalleases. New facilities owned by the Federal Governmentbut operated under contract by private companies andplant and equipment furnished to the manufacturer bycommunities and nonprofit organizations are excluded.Also excluded are expenditures for land and cost of main-tenance and repairs charged as current operatingexpenses.
For any equipment or structure transferred for the useof the reporting establishment by the parent company orone of its subsidiaries, the value at which it was trans-ferred to the establishment was to be reported. If anestablishment changed ownership during the year, thecost of the fixed assets (building and equipment) was tobe reported.
VALUE ADDED
This measure of manufacturing activity is derived bysubtracting the cost of materials, supplies, containers,fuel, purchased electricity, and contract work from thevalue of shipments (products manufactured plus receiptsfor services rendered). The result of this calculation isadjusted by the addition of value added by merchandisingoperations (i.e., the difference between the sales valueand the cost of merchandise sold without further manufac-ture, processing, or assembly) plus the net change in fin-ished goods and work-in-process between the beginning-and end-of-year inventories.
For those industries where value of production is col-lected instead of value of shipments, value added isadjusted only for the change in work-in-process invento-ries between the beginning and end of year. For those
industries where value of work done is collected, the valueadded does not include an adjustment for the change infinished goods or work-in-process inventories.
‘‘Value added’’ avoids the duplication in the figure forvalue of shipments that results from the use of productsof some establishments as materials by others. Valueadded is considered to be the best value measure avail-able for comparing the relative economic importance ofmanufacturing among industries and geographic areas.
VALUE OF SHIPMENTS
This item covers the received or receivable net sellingvalues, f.o.b. plant (exclusive of freight and taxes), of allproducts shipped, both primary and secondary, as well asall miscellaneous receipts, such as receipts for contractwork performed for others, installation and repair, sales ofscrap, and sales of products bought and sold without fur-ther processing. Included are all items made by or for theestablishments from material owned by it, whether sold,transferred to other plants of the same company, orshipped on consignment. The net selling value of productsmade in one plant on a contract basis from materialsowned by another was reported by the plant providing thematerials.
In the case of multiunit companies, the manufacturerwas requested to report the value of products transferredto other establishments of the same company at full eco-nomic or commercial value, including not only the directcost of production but also a reasonable proportion of ‘‘allother costs’’ (including company overhead) and profit.
In addition to the value for NAICS defined products,aggregates of the following categories of miscellaneousreceipts are reported as part of a total establishment’svalue of product shipments:
1. Reported contract work—Receipts for work or servicesthat a plant performed for others on their materials.
2. Value of resales—Sales of products brought and soldwithout further manufacture, processing, or assembly.
3. Other miscellaneous receipts—Such as repair work,installation, sales of scrap, etc.
Industry primary product value of shipments representsone of the three components of value of shipments. Thesecomponents are:
1. Primary products value of shipments.
2. Secondary product value of shipments.
3. Total miscellaneous receipts.
Primary product shipments is used in the calculations ofindustry specialization ratio and industry coverage ratio.The term ‘‘Value of primary products shipments made inthis industry’’ is used in this publication and refers to thesame data.
APPENDIX A A–51997 ECONOMIC CENSUS
U.S. Census Bureau, 1997 Economic Census
Duplication in Cost of Materials and Value ofShipment
The aggregate of the cost of materials and value ofshipments figures for industry groups and for all manufac-turing industries includes large amounts of duplicationsince the products of some industries are used as materi-als by others. This duplication results, in part, from theaddition of related industries representing successivestages in the production of a finished manufactured prod-uct. Examples are the addition of flour mills to bakeries inthe food group and the addition of pulp mills to papermills in the paper and allied products group of industries.Estimates of the overall extent of this duplication indicatethat the value of manufactured products exclusive of suchduplication (the value of finished manufactures) tends toapproximate two-thirds of the total value of productsreported in the annual survey.
Duplication of products within individual industries issignificant within a number of industry groups, e.g.,machinery and transportation industries. These industriesfrequently include complete machinery and their parts. Inthis case, the parts made for original equipment are mate-rials consumed for assembly plants in the same industry.
Even when no significant amount of duplication isinvolved, value of shipments figures are deficient as mea-sures of the relative economic importance of individualmanufacturing industries or geographic areas because ofthe wide variation in ratio of materials, labor, and otherprocessing costs of value of shipments, both amongindustries and within the same industry.
Before 1962, cost of materials and value of shipmentswere not published for some industries which includedconsiderable duplication. Since then, these data have beenpublished for all industries at the U.S. level and beginningin 1964, for all geographic levels.
Specialization and Coverage Ratios
These items are not collected on the report forms butare derived from the data shown in Table 3. An establish-ment is classified in a particular industry if its shipmentsof primary products of that industry exceed in value itsshipments of the products of any other single industry.
An establishment’s shipments include those productsassigned to an industry (primary products), those consid-ered primary to other industries (secondary products), andreceipts for miscellaneous activities (merchandising, con-tract work, resales, etc.). Specialization and coverageratios have been developed to measure the relationship ofprimary product shipments to the data on shipments forthe industry shown in Tables 1a through 5 and data onproduct shipments shown in Tables 6a and 6b.
Specialization ratio represents the ratio of primaryproduct shipments to total product shipments (primaryand secondary, excluding miscellaneous receipts) for theestablishments classified in the industry.
Coverage ratio represents the ratio of primary productsshipped by the establishments classified in the industry tothe total shipments of such products that are shipped byall manufacturing establishments wherever classified.
A–6 APPENDIX A 1997 ECONOMIC CENSUS
U.S. Census Bureau, 1997 Economic Census

Appendix B.NAICS Codes, Titles, and Descriptions
326199 ALL OTHER PLASTICS PRODUCTMANUFACTURING
This U.S. industry comprises establishments primarilyengaged in manufacturing plastics products (except film,sheet, bags, profile shapes, pipes, pipe fittings, laminates,foam products, bottles, plumbing fixtures, and resilientfloor coverings).
The data published with NAICS code 326199 includethe following SIC industries:
3089 Plastics products, n.e.c. (pt)3999 Manufacturing industries, n.e.c. (pt)
This definition comes from the 1997 NAICS Manual.However, for this industry, the 1997 Economic Census –Manufacturing did not fully implement the conversion toNAICS. Data for NAICS industry 326199 include establish-ments primarily engaged in the manufacture of plastic fur-niture parts. The NAICS definitions will be fully imple-mented with the 2002 Economic Census.
APPENDIX B B–1MANUFACTURING—INDUSTRY SERIES
U.S. Census Bureau, 1997 Economic Census
Appendix C.Coverage and Methodology
MAIL/NONMAIL UNIVERSE
The manufacturing universe includes about 400,000establishments. This number includes those industries inthe North American Industry Classification System (NAICS)definition of manufacturing, but not those industries leav-ing the manufacturing sector in the classification change.The amounts of information requested from manufactur-ing establishments were dependent upon a number of fac-tors. The more important considerations were the size ofthe company and whether it was included in the annualsurvey of manufactures (ASM). The methods of obtaininginformation for the various subsets of the universe toarrive at the aggregate figures shown in the publicationare described below:
1. Small single-establishment companies not sent areport form.
Approximately 40 percent of the manufacturingestablishments were small single-establishment com-panies that were excused from filing a census report.Selection of these establishments was based on twofactors: annual payroll and our ability to assign thecorrect six-digit NAICS industry classification to theestablishment. For each four-digit Standard IndustrialClassification (SIC) industry code, an annual payrollcutoff was determined. These cutoffs were derived sothat the establishments with payroll less than the cut-off were expected to account for no more than 3 per-cent of the value of shipments for the industry. Gener-ally, all single-establishment companies with less than5 employees were excused, while all establishmentswith more than 20 employees were mailed forms.Establishments below the cutoff that could not bedirectly assigned a six-digit NAICS code were mailed aclassification report which requested information forassigning NAICS industry codes. Establishments belowthe cutoff that could be directly assigned a six-digitNAICS code were excused from filing any report. Forbelow cutoff establishments, information on thephysical location, payroll, and receipts was obtainedfrom the administrative records of other Federal agen-cies under special arrangements that safeguardedtheir confidentiality.
Estimates of data for these small establishmentswere developed using industry averages in conjunc-tion with the administrative information. The value ofshipments and cost of materials were not distributedamong specific products and materials for these
establishments but were included in the product andmaterial ‘‘not specified by kind’’ (nsk) categories.
The industry classification codes included in theadministrative-record files were assigned on the basisof brief descriptions of the general activity of theestablishment. As a result, an indeterminate numberof establishments were erroneously coded to a four-digit SIC industry and then erroneously re-coded to asix-digit NAICS industry. This was especially truewhenever there was a relatively fine line of demarca-tion between industries or between manufacturingand nonmanufacturing activity.
Sometimes the administrative-record cases hadonly two- or three-digit SIC group classification codesavailable in the files. For the 1997 Economic Census –Manufacturing, these establishments were sent aseparate classification form, which requested informa-tion on the products and services of the establish-ment. This form was used to code many of theseestablishments to the appropriate six-digit NAICSlevel. Establishments that did not return the classifica-tion form were coded later to those six-digit NAICSindustries identified as ‘‘All other’’ industries withinthe given subsector.
As a result of these situations, a number of smallestablishments may have been misclassified by indus-try. However, such possible misclassification has nosignificant effect on the statistics other than on thenumber of companies and establishments.
The total establishment count for individual indus-tries should be viewed as an approximation ratherthan a precise measurement. The counts for establish-ments with 20 employees or more are far more reli-able than the count of total number of establishments.
2. Establishments sent a report form.
The establishments covered in the mail canvasswere divided into three groups:
a. ASM sample establishments.
This group accounts for approximately 15 per-cent of all manufacturing establishments. The ASMpanel covers all the units of large manufacturingestablishments as well as a sample of the mediumand smaller establishments. The probability ofselection was proportionate to size. For more infor-mation, see the Description of the ASM SurveySample.
APPENDIX C C–1MANUFACTURING
U.S. Census Bureau, 1997 Economic Census

In an economic census year, the ASM report form(MA-1000) replaces the first page of the regularcensus form for those establishments included inthe ASM. In addition to information on employ-ment, payroll, and other items normally requestedon the regular census form, establishments in theASM sample were requested to supply additionalinformation on gross book value of assets andcapital expenditures. ASM establishments were alsorequested to provide information on retirements,depreciation, rental payments, and supplementallabor costs. For establishments not included in theASM, these additional items were estimated usingrelationships observed in the ASM establishmentdata. The census statistics for these variables are asum of the ASM establishment data and the esti-mated data for non-ASM establishments. ASMestablishments were also requested to provideinformation for selected purchased services. Thecensus statistics for the purchased service itemswere derived solely from the ASM establishments.See Appendix A, Explanation of Terms for an expla-nation of these items. The census part of the reportform is 1 of 220 versions containing product, mate-rial, and special inquiries. The diversity of manufac-turing activities necessitated the use of this manyforms to canvass the 480 manufacturing industries.Each form was developed for a group of relatedindustries.
Appearing on each form was a list of productsprimary to the group of related industries as wellas secondary products and miscellaneous servicesthat establishments classified in these industrieswere likely to perform. Respondents wererequested to identify the products, the value ofeach product, and, in many cases, the quantity ofthe product shipped during the survey year. Spacealso was provided for the respondent to describeproducts not specifically identified on the form.
The report form also contained a materials-consumed inquiry which varied from form to formdepending on the industries being canvassed. Therespondents were asked to review a list of materi-als generally used in their production processes.From this list, each establishment was requested toidentify those materials consumed during the sur-vey year, the cost of each, and, in certain cases, thequantity consumed. Once again, space was pro-vided for the respondent to describe significantmaterials not identified on the form.
A wide variety of special inquiries was includedto measure activities peculiar to a given industry,such as operations performed and equipment used.
b. Large and medium establishments (non-ASM).
Approximately 30 percent of all manufacturingestablishments were included in this group. A vari-able cutoff, based on administrative-record payrolldata and determined on an industry-by-industrybasis, was used to select those establishments thatwere to receive 1 of the 220 economic census –manufacturing regular forms. The first page,requesting establishment data for items such asemployment and payroll, was standard but did notcontain the detailed statistics included on the ASMform. The product, material, and special inquirysections supplied were based on the historicalindustry classification of the establishment.
c. Small single-establishment companies (non-ASM).
This group includes approximately 15 percent ofall manufacturing establishments. For those indus-tries where application of the variable cutoff foradministrative-record cases resulted in a large num-ber of small establishments being included in themail canvass, an abbreviated or short form wasused. These establishments received 1 of the 31versions of the short form, which requested sum-mary product and material data and totals but nodetails on employment, payroll, cost of materials,inventories, and capital expenditures.
Use of the short form has no adverse effect onpublished totals for the industry statistics becausethe same data were collected on the short form ason the long form. However, detailed information onproducts and materials consumed was not col-lected on the short form; thus, its use wouldincrease the value of the nsk categories.
INDUSTRY CLASSIFICATION OFESTABLISHMENTS
Each of the establishments covered in the 1997 Eco-nomic Census – Manufacturing was classified in 1 of 480industries (473 manufacturing industries and 7 formermanufacturing industries) in accordance with the industrydefinitions in the 1997 NAICS Manual. This is the first edi-tion of the NAICS Manual and it is a major change from the1987 SIC Manual that was used previously. Appendix A ofthe 1997 NAICS Manual notes the comparability betweenthe 1987 SIC and 1997 NAICS classification systems. Whenapplicable, Appendix G of this report shows the productclass and product comparability between the two systemsfor data in this report.
In the NAICS system, an industry is generally defined asa group of establishments that have similar productionprocesses. To the extent practical, the system uses supply-based or production-oriented concepts in defining indus-tries. The resulting group of establishments must be sig-nificant in terms of number, value added by manufacture,value of shipments, and number of employees.
C–2 APPENDIX C MANUFACTURING
U.S. Census Bureau, 1997 Economic Census
The coding system works in such a way that the defini-tions progressively become narrower with successiveadditions of numerical digits. In the manufacturing sectorfor 1997, there are 21 subsectors (three-digit NAICS), 86industry groups (four-digit NAICS), 184 NAICS industries(five-digit NAICS) that are comparable with Canadian andMexican classification, and 473 U.S. industries (six-digitNAICS). This represents an expansion of the four-digit SIC-based U.S. industries from 459 in 1987. Product classesand products of the manufacturing industries have beenassigned codes based on the industry from which theyoriginate. In the new system, there are about 1,500 prod-uct classes (seven-digit codes), about 6,000 census prod-ucts, and an additional 3,700 CIR products (ten-digitcodes). The ten-digit products are considered the primaryproducts of the industry with the same first six digits.These counts do not include the seven former manufactur-ing industries that are included in the 1997 Economic Cen-sus – Manufacturing.
For the 1997 Economic Census – Manufacturing, allestablishments were classified in particular industriesbased on the products they produced. If an establishmentmade products of more than one industry, it was classifiedin the industry with the largest product value. For 1997,there were no ‘‘resistance rules’’ or ‘‘frozen industries.’’
In ASM years, establishments included in the ASMsample with certainty weights are reclassified by industryonly if the change in the primary activity from the prioryear is significant or if the change has occurred for 2 suc-cessive years. This procedure prevents reclassificationwhen there are minor shifts in product mix.
In ASM years, establishments included in the ASMsample with noncertainty weight are not shifted from oneindustry classification to another. They are retained in theindustry where they were classified in the base censusyear. However, in the following census year, these ASMplants are allowed to shift from one industry to another.
The results of these rules covering the switching ofplants from one industry classification to another are thatsome industries comprise different mixes of establish-ments in different survey years. Hence, comparisonsbetween prior-year and current-year published totals, par-ticularly at the six-digit NAICS level, should be viewedwith caution. This is particularly true for the comparisonbetween the data shown for a census year versus the datashown for the previous ASM year.
As previously noted, the small establishments that mayhave been misclassified by industry are usuallyadministrative-record cases whose industry codes wereassigned on the basis of incomplete descriptions of thegeneral activity of the establishment. Such possible mis-classifications have no significant effect on the statisticsother than on the number of companies and establish-ments.
Establishments frequently make products classifiedboth in their industry (primary products) and other indus-tries (secondary products). Industry statistics (employ-ment, payroll, value added by manufacture, value of ship-ments, etc.) reflect the activities of the establishmentswhich may make both primary and secondary products.Product statistics, however, represent the output of allestablishments without regard for the classification of theproducing establishment. For this reason, when relatingthe industry statistics, especially the value of shipments,to the product statistics, the composition of the industry’soutput should be considered.
The extent to which industry and product statistics maybe matched with each other is measured by the primaryproduct specialization ratio and the coverage ratio. Theprimary product specialization ratio is the proportion ofindustry shipments accounted for by the primary productsof establishments classified in the industry. The coverageratio is the proportion of product shipments accounted forby establishments classified in the industry.
ESTABLISHMENT BASIS OF REPORTING
The economic census – manufacturing is conducted onan establishment basis. A company operating at morethan one location is required to file a separate report foreach location or establishment. The ASM also is conductedon an establishment basis, but separate reports are filedfor just those establishments selected in the sample. Com-panies engaged in distinctly different lines of activity atone location are requested to submit separate reports ifthe plant records permit such a separation and if theactivities are substantial in size.
In 1997, as in earlier years, a minimum size limit wasset for inclusion of establishments in the census. All estab-lishments employing one person or more at any time dur-ing the census year are included. The same size limitationhas applied since 1947 in censuses and annual surveys ofmanufactures. In the 1939 and earlier censuses, establish-ments with less than $5,000 value of products wereexcluded. The change in the minimum size limit in 1947does not appreciably affect the historical comparability ofthe census figures except for data on number of establish-ments for a few industries.
The 1997 Economic Census – Manufacturing excludesdata for central administrative offices (CAOs). Thesewould include separately operated administrative offices,warehouses, garages, and other auxiliary units that ser-vice manufacturing establishments of the same company.These data are published in a separate report series.
DESCRIPTION OF THE ASM SURVEY SAMPLE
The annual survey of manufactures (ASM) sample isdrawn for the second survey year after a census. The mostrecent sample was drawn for the 1994 survey year basedon the 1992 Census of Manufactures. This sample will bein place through the 1998 ASM.
APPENDIX C C–3MANUFACTURING
U.S. Census Bureau, 1997 Economic Census
In 1992, there were approximately 370,000 individualmanufacturing establishments. For sample efficiency andcost considerations, the 1992 manufacturing populationwas partitioned into two components for developing esti-mates within the ASM; a mail stratum and a nonmail stra-tum.
Mail stratum. The mail stratum of the survey is com-prised of larger single-location manufacturing companiesand all manufacturing establishments of multiunit compa-nies (companies that operate at more than one physicallocation). Approximately 230,000 of the 370,000 estab-lishments in the 1992 census were assigned to the mailstratum. On an annual basis, the mail stratum is supple-mented with larger, newly active single-location compa-nies identified from a list provided by the Internal RevenueService (IRS) and new manufacturing locations of multiunitcompanies identified from the Census Bureau’s CompanyOrganization Survey (COS).
For the 1994 survey, a new sample of approximately58,000 individual establishments was selected from themail stratum assembled from the 1992 census. Supple-mental samples representing both 1993 and 1994 births(newly active establishments that were not included in the1992 census) were also selected. Establishments selectedfor the sample are mailed an ASM survey questionnaire foreach year through 1998.
The 1994-98 ASM sample design is similar to the oneused since 1984. Companies in the 1992 Census of Manu-factures with manufacturing shipments of at least $500million were defined as company certainties. For theselarge companies, each manufacturing establishment isincluded in the mail sample. For the 1994-98 sample,there are approximately 650 certainty companies collec-tively accounting for over 18,000 establishments.
For the remaining portion of the mail component of thesurvey, the establishment was defined as the sample unit.All establishments with 250 employees or more weredefined as employment certainties. In addition, all estab-lishments producing products in SIC 3571 (ElectronicComputers) were defined as certainties. Across these threearbitrary certainty classes, there were approximately25,000 establishments included in the sample with cer-tainty. Collectively, these certainty establishmentsaccounted for approximately 80 percent of the total valueof shipments in the 1992 Census of Manufactures.
Smaller establishments in the remaining portion of themail stratum were sampled with probabilities rangingfrom .02 to 1.00. The initial probabilities of selectionassigned to these establishments were proportionate to ameasure-of-size determined for each establishment. Themeasure-of-size was a function of the establishment’s1992 industry classification, its 1992 product class data,and the historical variability of the year-to-year estimatesof the product class estimates. For each product class(1,755) and four-digit industry (459), a desired reliability
constraint was specified. Using a technique developed byDr. James R. Chromy of the Research Triangle Institute, theinitial establishment probabilities were optimized suchthat the expected sample satisfied all industry and prod-uct class reliability constraints while the sample size wasminimized. This technique reduces the likelihood ofselecting nonrepresentative samples for individual productclasses or industries.
This method of assigning probabilities based on prod-uct class shipments is motivated by our primary desire toproduce reliable estimates of both product class andindustry shipments. The high correlation between ship-ments and employment, value-added, and other generalstatistics assures that these variables will also be well rep-resented by the sample. The actual sample selection pro-cedure uses an independent chance of selection method(Poisson sampling) which permits us to prevent smallestablishments from being selected in consecutivesamples without introducing a bias into the survey esti-mates.
Nonmail component. The initial nonmail component ofthe survey was comprised of approximately 140,000small, single-establishment companies that were tabulatedas administrative records in the 1992 Census of Manufac-tures. The nonmail stratum is also supplemented annuallyusing the list of newly active single-location companiesprovided by the Internal Revenue Service (IRS) and payrollcutoffs. Companies with payroll below the payroll cutoffare added to the nonmail stratum. For this portion of thepopulation, sampling is not used. The data for this groupare estimated based on selected information obtainedannually from the administrative records of the IRS andSocial Security Administration (SSA). This administrativeinformation, which includes payroll, total employment,industry classification, and physical location, is obtainedunder conditions which safeguard the confidentiality ofboth tax and census records.
DESCRIPTION OF THE ASM ESTIMATINGPROCEDURE
Most of the ASM estimates derived for the mail stratumare computed using a difference estimator. At the estab-lishment level, there is a strong correlation between thecurrent-year data values and the corresponding 1992(base) data values. Therefore, within the mailed stratum,for each item at each level of aggregation, an estimate ofthe ‘‘difference’’ between the current year and the baseyear is computed from sample cases and added to the cor-responding base-year values. For the 1993-1997 ASM esti-mates, the 1992 Census of Manufactures values serve asthe base year. For the 1998 ASM, the base will be updatedto be the 1997 Economic Census – Manufacturing.
Due to the positive year-to-year correlation, estimatesderived using this methodology are generally more reli-able than comparable estimates developed from the cur-rent sample data alone. Estimates for the capital expendi-tures variables are not generated using the difference
C–4 APPENDIX C MANUFACTURING
U.S. Census Bureau, 1997 Economic Census
estimator because the year-to-year correlations are consid-erably weaker. The standard linear estimator is used forthese variables.
For the nonmail stratum, estimates for payroll andemployment are directly tabulated from theadministrative-record data provided by IRS and SSA. Esti-mates of data other than payroll and employment aredeveloped from industry averages. Although the nonmailstratum contains approximately 170,000 individual estab-lishments in 1994, it accounts for less than 2 percent ofthe estimate for total value of shipments at the totalmanufacturing level.
Corresponding estimates for the mail and nonmail com-ponents are combined to produce the estimates includedin this publication.
QUALIFICATIONS OF THE ASM DATA
The estimates developed from the sample are apt todiffer somewhat from the results of a survey covering allcompanies in the sample lists but otherwise conductedunder essentially the same conditions as the actual samplesurvey. The estimates of the magnitude of the samplingerrors (the difference between the estimates obtained andthe results theoretically obtained from a comparable,complete-coverage survey) are provided by the standarderrors of estimates.
The particular sample selected for the ASM is one ofmany similar probability samples that, by chance, mighthave been selected under the same specifications. Each ofthe possible samples would yield somewhat different setsof results, and the standard errors are measures of thevariation of all the possible sample estimates around thetheoretically comparable, complete-coverage values.
Estimates of the standard errors have been computedfrom the sample data for selected ASM statistics in thisreport. They are represented in the form of relative stand-ard errors (the standard errors divided by the estimatedvalues to which they refer).
In conjunction with its associated estimate, the relativestandard error may be used to define confidence intervals(ranges that would include the comparable, complete-coverage value for specified percentages of all the pos-sible samples).
The complete-coverage value would be included in therange:
From one standard error below to one standard errorabove the derived estimate for about two-thirds of allpossible samples.
From two standard errors below to two standarderrors above the derived estimate for about 19 out of20 of all possible samples.
From three standard errors below to three standarderrors above the derived estimate for nearly allsamples.
An inference that the comparable, complete-surveyresult would be within the indicated ranges would be cor-rect in approximately the relative frequencies shown.Those proportions, therefore, may be interpreted as defin-ing the confidence that the estimates from a particularsample would differ from complete-coverage results by asmuch as one, two, or three standard errors, respectively.
For example, suppose an estimated total is shown at50,000 with an associated relative standard error of2 percent, that is, a standard error of 1,000 (2 percent of50,000). There is approximately 67 percent confidencethat the interval 49,000 to 51,000 includes the complete-coverage total, about 95 percent confidence that the inter-val 48,000 to 52,000 includes the complete-coveragetotal, and almost certain confidence that the interval47,000 to 53,000 includes the complete-coverage total.
In addition to the sample errors, the estimates are sub-ject to various response and operational errors: errors ofcollection, reporting, coding, transcription, imputation fornonresponse, etc. These operational errors also wouldoccur if a complete canvass were to be conducted underthe same conditions as the survey. Explicit measures oftheir effects generally are not available. However, it isbelieved that most of the important operational errorswere detected and corrected during the Census Bureau’sreview of the data for reasonableness and consistency.The small operational errors usually remain. To someextent, they are compensating in the aggregated totalsshown. When important operational errors were detectedtoo late to correct the estimates, the data were suppressedor were specifically qualified in the tables.
As derived, the estimated standard errors included partof the effect of the operational errors. The total errors,which depend upon the joint effect of the sampling andoperational errors, are usually of the order of size indi-cated by the standard error, or moderately higher. How-ever, for particular estimates, the total error may consider-ably exceed the standard errors shown. Any figures shownin the tables in this publication having an associated stan-dard error exceeding 15 percent may be combined withhigher level totals, creating a broader aggregate, whichthen may be of acceptable reliability.
DATA FROM THE CURRENT INDUSTRIAL REPORTS(CIR)
The CIR program provides product statistics forselected manufacturing industries at the U.S. level annu-ally and, in some cases, monthly and/or quarterly. Whendetail product data are collected in the CIR, they are notalso collected in the census. However, the annual CIR dataare included in the census Product Summary report.
The CIR program uses a unified data collection, pro-cessing, and publication system. The Census Bureauupdates the survey panels for most reports annually andreconciles the estimates to the results of the broader-based annual survey of manufactures and the economic
APPENDIX C C–5MANUFACTURING
U.S. Census Bureau, 1997 Economic Census
census – manufacturing. The economic census – manufac-turing provides a complete list of all producers of theproducts covered by the CIR program and serves as theprimary source for CIR sampling. Where a small number ofproducers exist, CIR surveys cover all known producers ofa product. However, when the number of producers islarge, cutoff and random sampling techniques are used.Surveys are continually reviewed and modified to providethe most up-to-date information on products produced.While the CIR program includes both mandatory and vol-untary surveys, the annual data are mandatory.
DUPLICATION IN COST OF MATERIALS AND VALUEOF SHIPMENTS
Data for cost of materials and value of shipmentsinclude varying amounts of duplication, especially athigher levels of aggregation. This is because the productsof one establishment may be the materials of another. Thevalue added statistics avoid this duplication and are, formost purposes, the best measure for comparing the rela-tive economic importance of industries and geographicareas.
VALUE OF INDUSTRY SHIPMENTS COMPARED WITHVALUE OF PRODUCT SHIPMENTS
The 1997 Economic Census – Manufacturing showsvalue of shipments data for industries and products. In theindustry statistics tables and files, these data representthe total value of shipments of all establishments classi-fied in a particular industry. The data include the ship-ments of the products classified in the industry (primaryto the industry), products classified in other industries(secondary to the industry), and miscellaneous receipts(repair work, sale of scrap, research and development,installation receipts, and resales). Value of product ship-ments shown in the products statistics tables and filesrepresent the total value of all products shipped that areclassified as primary to an industry regardless of the clas-sification of the producing establishment.
C–6 APPENDIX C MANUFACTURING
U.S. Census Bureau, 1997 Economic Census

Appendix D.Geographic Notes
Not applicable for this report.
APPENDIX D D–11997 ECONOMIC CENSUS
U.S. Census Bureau, 1997 Economic Census

Appendix E.Metropolitan Areas
Not applicable for this report.
APPENDIX E E–11997 ECONOMIC CENSUS
U.S. Census Bureau, 1997 Economic Census
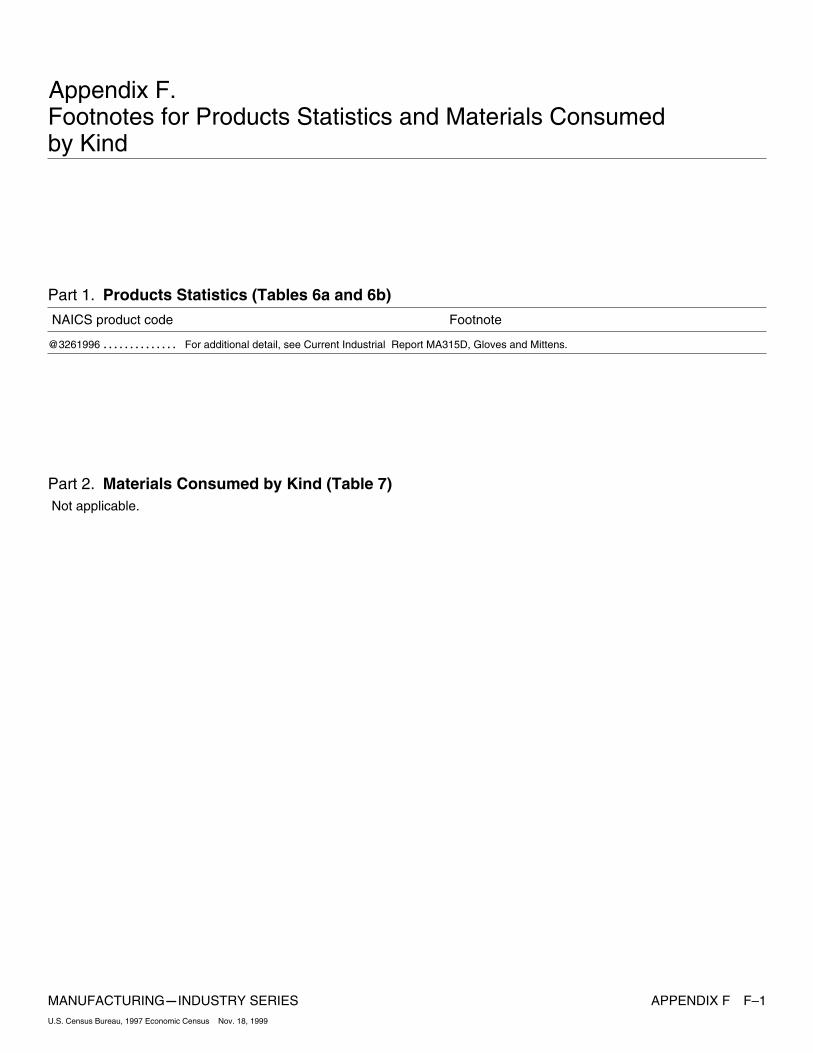
Appendix F.Footnotes for Products Statistics and Materials Consumedby Kind
Part 1. Products Statistics (Tables 6a and 6b)
NAICS product code Footnote
@3261996 For additional detail, see Current Industrial Report MA315D, Gloves and Mittens...............
Part 2. Materials Consumed by Kind (Table 7) Not applicable.
MANUFACTURINGmINDUSTRY SERIES APPENDIX F F–1U.S. Census Bureau, 1997 Economic Census Nov. 18, 1999
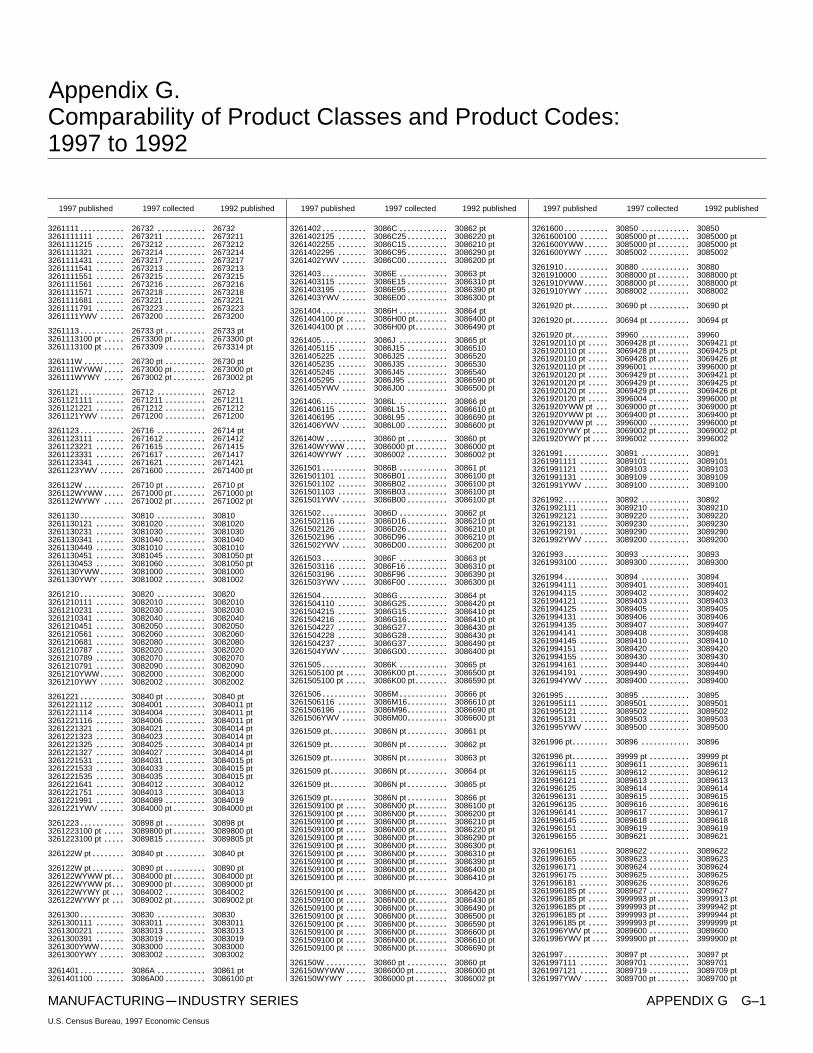
Appendix G.Comparability of Product Classes and Product Codes:1997 to 1992
1997 published 1997 collected 1992 published
3261111 26732........... 26732............
3261111111 2673211....... 2673211..........
3261111215 2673212....... 2673212..........
3261111321 2673214....... 2673214..........
3261111431 2673217....... 2673217..........
3261111541 2673213....... 2673213..........
3261111551 2673215....... 2673215..........
3261111561 2673216....... 2673216..........
3261111571 2673218....... 2673218..........
3261111681 2673221....... 2673221..........
3261111791 2673223....... 2673223..........
3261111YWV 2673200...... 2673200..........
3261113 26733 pt........... 26733 pt..........
3261113100 pt 2673300 pt..... 2673300 pt........
3261113100 pt 2673309..... 2673314 pt..........
326111W 26730 pt.......... 26730 pt..........
326111WYWW 2673000 pt..... 2673000 pt........
326111WYWY 2673002 pt..... 2673002 pt........
3261121 26712........... 26712............
3261121111 2671211....... 2671211..........
3261121221 2671212....... 2671212..........
3261121YWV 2671200...... 2671200..........
3261123 26716........... 26714 pt............
3261123111 2671612....... 2671412..........
3261123221 2671615....... 2671415..........
3261123331 2671617....... 2671417..........
3261123341 2671621....... 2671421..........
3261123YWV 2671600...... 2671400 pt..........
326112W 26710 pt.......... 26710 pt..........
326112WYWW 2671000 pt..... 2671000 pt........
326112WYWY 2671002 pt..... 2671002 pt........
3261130 30810........... 30810............
3261130121 3081020....... 3081020..........
3261130231 3081030....... 3081030..........
3261130341 3081040....... 3081040..........
3261130449 3081010....... 3081010..........
3261130451 3081045....... 3081050 pt..........
3261130453 3081060....... 3081050 pt..........
3261130YWW 3081000...... 3081000..........
3261130YWY 3081002...... 3081002..........
3261210 30820........... 30820............
3261210111 3082010....... 3082010..........
3261210231 3082030....... 3082030..........
3261210341 3082040....... 3082040..........
3261210451 3082050....... 3082050..........
3261210561 3082060....... 3082060..........
3261210681 3082080....... 3082080..........
3261210787 3082020....... 3082020..........
3261210789 3082070....... 3082070..........
3261210791 3082090....... 3082090..........
3261210YWW 3082000...... 3082000..........
3261210YWY 3082002...... 3082002..........
3261221 30840 pt........... 30840 pt..........
3261221112 3084001....... 3084011 pt..........
3261221114 3084004....... 3084011 pt..........
3261221116 3084006....... 3084011 pt..........
3261221321 3084021....... 3084014 pt..........
3261221323 3084023....... 3084014 pt..........
3261221325 3084025....... 3084014 pt..........
3261221327 3084027....... 3084014 pt..........
3261221531 3084031....... 3084015 pt..........
3261221533 3084033....... 3084015 pt..........
3261221535 3084035....... 3084015 pt..........
3261221641 3084012....... 3084012..........
3261221751 3084013....... 3084013..........
3261221991 3084089....... 3084019..........
3261221YWV 3084000 pt...... 3084000 pt........
3261223 30898 pt........... 30898 pt..........
3261223100 pt 3089800 pt..... 3089800 pt........
3261223100 pt 3089815..... 3089805 pt..........
326122W pt 30840 pt........ 30840 pt..........
326122W pt 30890 pt........ 30890 pt..........
326122WYWW pt 3084000 pt... 3084000 pt........
326122WYWW pt 3089000 pt... 3089000 pt........
326122WYWY pt 3084002... 3084002..........
326122WYWY pt 3089002 pt... 3089002 pt........
3261300 30830........... 30830............
3261300111 3083011....... 3083011..........
3261300221 3083013....... 3083013..........
3261300391 3083019....... 3083019..........
3261300YWW 3083000...... 3083000..........
3261300YWY 3083002...... 3083002..........
3261401 3086A........... 30861 pt............
3261401100 3086A00....... 3086100 pt..........
1997 published 1997 collected 1992 published
3261402 3086C........... 30862 pt............
3261402125 3086C25....... 3086220 pt..........
3261402255 3086C15....... 3086210 pt..........
3261402295 3086C95....... 3086290 pt..........
3261402YWV 3086C00...... 3086200 pt..........
3261403 3086E........... 30863 pt............
3261403115 3086E15....... 3086310 pt..........
3261403195 3086E95....... 3086390 pt..........
3261403YWV 3086E00...... 3086300 pt..........
3261404 3086H........... 30864 pt............
3261404100 pt 3086H00 pt..... 3086400 pt........
3261404100 pt 3086H00 pt..... 3086490 pt........
3261405 3086J........... 30865 pt............
3261405115 3086J15....... 3086510..........
3261405225 3086J25....... 3086520..........
3261405235 3086J35....... 3086530..........
3261405245 3086J45....... 3086540..........
3261405295 3086J95....... 3086590 pt..........
3261405YWV 3086J00...... 3086500 pt..........
3261406 3086L........... 30866 pt............
3261406115 3086L15....... 3086610 pt..........
3261406195 3086L95....... 3086690 pt..........
3261406YWV 3086L00...... 3086600 pt..........
326140W 30860 pt.......... 30860 pt..........
326140WYWW 3086000 pt..... 3086000 pt........
326140WYWY 3086002..... 3086002 pt..........
3261501 3086B........... 30861 pt............
3261501101 3086B01....... 3086100 pt..........
3261501102 3086B02....... 3086100 pt..........
3261501103 3086B03....... 3086100 pt..........
3261501YWV 3086B00...... 3086100 pt..........
3261502 3086D........... 30862 pt............
3261502116 3086D16....... 3086210 pt..........
3261502126 3086D26....... 3086210 pt..........
3261502196 3086D96....... 3086210 pt..........
3261502YWV 3086D00...... 3086200 pt..........
3261503 3086F........... 30863 pt............
3261503116 3086F16....... 3086310 pt..........
3261503196 3086F96....... 3086390 pt..........
3261503YWV 3086F00...... 3086300 pt..........
3261504 3086G........... 30864 pt............
3261504110 3086G25....... 3086420 pt..........
3261504215 3086G15....... 3086410 pt..........
3261504216 3086G16....... 3086410 pt..........
3261504227 3086G27....... 3086430 pt..........
3261504228 3086G28....... 3086430 pt..........
3261504237 3086G37....... 3086490 pt..........
3261504YWV 3086G00...... 3086400 pt..........
3261505 3086K........... 30865 pt............
3261505100 pt 3086K00 pt..... 3086500 pt........
3261505100 pt 3086K00 pt..... 3086590 pt........
3261506 3086M........... 30866 pt............
3261506116 3086M16....... 3086610 pt..........
3261506196 3086M96....... 3086690 pt..........
3261506YWV 3086M00...... 3086600 pt..........
3261509 pt 3086N pt......... 30861 pt..........
3261509 pt 3086N pt......... 30862 pt..........
3261509 pt 3086N pt......... 30863 pt..........
3261509 pt 3086N pt......... 30864 pt..........
3261509 pt 3086N pt......... 30865 pt..........
3261509 pt 3086N pt......... 30866 pt..........
3261509100 pt 3086N00 pt..... 3086100 pt........
3261509100 pt 3086N00 pt..... 3086200 pt........
3261509100 pt 3086N00 pt..... 3086210 pt........
3261509100 pt 3086N00 pt..... 3086220 pt........
3261509100 pt 3086N00 pt..... 3086290 pt........
3261509100 pt 3086N00 pt..... 3086300 pt........
3261509100 pt 3086N00 pt..... 3086310 pt........
3261509100 pt 3086N00 pt..... 3086390 pt........
3261509100 pt 3086N00 pt..... 3086400 pt........
3261509100 pt 3086N00 pt..... 3086410 pt........
3261509100 pt 3086N00 pt..... 3086420 pt........
3261509100 pt 3086N00 pt..... 3086430 pt........
3261509100 pt 3086N00 pt..... 3086490 pt........
3261509100 pt 3086N00 pt..... 3086500 pt........
3261509100 pt 3086N00 pt..... 3086590 pt........
3261509100 pt 3086N00 pt..... 3086600 pt........
3261509100 pt 3086N00 pt..... 3086610 pt........
3261509100 pt 3086N00 pt..... 3086690 pt........
326150W 30860 pt.......... 30860 pt..........
326150WYWW 3086000 pt..... 3086000 pt........
326150WYWY 3086000 pt..... 3086002 pt........
1997 published 1997 collected 1992 published
3261600 30850........... 30850............
3261600100 3085000 pt....... 3085000 pt........
3261600YWW 3085000 pt...... 3085000 pt........
3261600YWY 3085002...... 3085002..........
3261910 30880........... 30880............
3261910000 3088000 pt....... 3088000 pt........
3261910YWW 3088000 pt...... 3088000 pt........
3261910YWY 3088002...... 3088002..........
3261920 pt 30690 pt......... 30690 pt..........
3261920 pt 30694 pt......... 30694 pt..........
3261920 pt 39960......... 39960............
3261920110 pt 3069428 pt..... 3069421 pt........
3261920110 pt 3069428 pt..... 3069425 pt........
3261920110 pt 3069428 pt..... 3069426 pt........
3261920110 pt 3996001..... 3996000 pt..........
3261920120 pt 3069429 pt..... 3069421 pt........
3261920120 pt 3069429 pt..... 3069425 pt........
3261920120 pt 3069429 pt..... 3069426 pt........
3261920120 pt 3996004..... 3996000 pt..........
3261920YWW pt 3069000 pt... 3069000 pt........
3261920YWW pt 3069400 pt... 3069400 pt........
3261920YWW pt 3996000... 3996000 pt..........
3261920YWY pt 3069002 pt.... 3069002 pt........
3261920YWY pt 3996002.... 3996002..........
3261991 30891........... 30891............
3261991111 3089101....... 3089101..........
3261991121 3089103....... 3089103..........
3261991131 3089109....... 3089109..........
3261991YWV 3089100...... 3089100..........
3261992 30892........... 30892............
3261992111 3089210....... 3089210..........
3261992121 3089220....... 3089220..........
3261992131 3089230....... 3089230..........
3261992191 3089290....... 3089290..........
3261992YWV 3089200...... 3089200..........
3261993 30893........... 30893............
3261993100 3089300....... 3089300..........
3261994 30894........... 30894............
3261994111 3089401....... 3089401..........
3261994115 3089402....... 3089402..........
3261994121 3089403....... 3089403..........
3261994125 3089405....... 3089405..........
3261994131 3089406....... 3089406..........
3261994135 3089407....... 3089407..........
3261994141 3089408....... 3089408..........
3261994145 3089410....... 3089410..........
3261994151 3089420....... 3089420..........
3261994155 3089430....... 3089430..........
3261994161 3089440....... 3089440..........
3261994191 3089490....... 3089490..........
3261994YWV 3089400...... 3089400..........
3261995 30895........... 30895............
3261995111 3089501....... 3089501..........
3261995121 3089502....... 3089502..........
3261995131 3089503....... 3089503..........
3261995YWV 3089500...... 3089500..........
3261996 pt 30896......... 30896............
3261996 pt 39999 pt......... 39999 pt..........
3261996111 3089611....... 3089611..........
3261996115 3089612....... 3089612..........
3261996121 3089613....... 3089613..........
3261996125 3089614....... 3089614..........
3261996131 3089615....... 3089615..........
3261996135 3089616....... 3089616..........
3261996141 3089617....... 3089617..........
3261996145 3089618....... 3089618..........
3261996151 3089619....... 3089619..........
3261996155 3089621....... 3089621..........
3261996161 3089622....... 3089622..........
3261996165 3089623....... 3089623..........
3261996171 3089624....... 3089624..........
3261996175 3089625....... 3089625..........
3261996181 3089626....... 3089626..........
3261996185 pt 3089627..... 3089627..........
3261996185 pt 3999993 pt..... 3999913 pt........
3261996185 pt 3999993 pt..... 3999942 pt........
3261996185 pt 3999993 pt..... 3999944 pt........
3261996185 pt 3999993 pt..... 3999999 pt........
3261996YWV pt 3089600.... 3089600..........
3261996YWV pt 3999900 pt.... 3999900 pt........
3261997 30897 pt........... 30897 pt..........
3261997111 3089701....... 3089701..........
3261997121 3089719....... 3089709 pt..........
3261997YWV 3089700 pt...... 3089700 pt........
MANUFACTURINGmINDUSTRY SERIES APPENDIX G G–1U.S. Census Bureau, 1997 Economic Census
1997 published 1997 collected 1992 published
3261998 30898 pt........... 30898 pt..........
3261998111 3089801....... 3089801..........
3261998131 3089803....... 3089803..........
3261998141 3089804....... 3089804..........
3261998152 3089816....... 3089805 pt..........
3261998171 pt 3089817 pt..... 3089806........
3261998171 pt 3089817 pt..... 3089807........
3261998181 3089818....... 3089808..........
3261998191 pt 3089819 pt..... 3089802........
3261998191 pt 3089819 pt..... 3089809........
3261998YWV 3089800 pt...... 3089800 pt........
3261999 30899........... 30899............
3261999100 3089900....... 3089900..........
326199A 3089A........... 3089A............
326199A111 3089A11....... 3089A11..........
326199A121 3089A12....... 3089A12..........
326199A131 3089A14....... 3089A14..........
326199A141 3089A18....... 3089A18..........
326199AYWV 3089A00...... 3089A00..........
326199W pt 30890 pt........ 30890 pt..........
326199W pt 39990 pt........ 39990 pt..........
326199WYWW pt 3089000 pt... 3089000 pt........
326199WYWW pt 3999000 pt... 3999000 pt........
326199WYWY pt 3089002 pt... 3089002 pt........
326199WYWY pt 3999002 pt... 3999002 pt........
3262111 30111........... 30111............
3262111112 3011112....... 3011112..........
3262111115 3011115....... 3011115..........
3262111YWV 3011100...... 3011100..........
3262113 30112........... 30112............
3262113111 3011211....... 3011211..........
3262113212 3011212....... 3011212..........
3262113221 3011221....... 3011221..........
3262113222 3011222....... 3011222..........
3262113231 3011231....... 3011231..........
3262113232 3011232....... 3011232..........
3262113YWV 3011200...... 3011200..........
3262117 30117........... 30117............
3262117100 3011700....... 3011700..........
3262119 30118........... 30118............
3262119100 3011800....... 3011800..........
326211B 30119........... 30119............
326211B100 pt 3011900 pt..... 3011900........
326211B100 pt 3011900 pt..... 3011921........
326211B100 pt 3011900 pt..... 3011922........
326211B100 pt 3011900 pt..... 3011925........
326211D 3011A.......... 3011A............
326211D139 3011A39....... 3011A39..........
326211D152 3011A52....... 3011A52..........
326211DYWV 3011A00...... 3011A00..........
326211F 3011C........... 3011C............
326211F121 3011C21....... 3011C21..........
326211F123 3011C23....... 3011C23..........
326211F127 pt 3011C27 pt..... 3011C25........
326211F127 pt 3011C27 pt..... 3011C29........
326211FYWV 3011C00...... 3011C00..........
326211H 3011D.......... 3011D............
326211H111 3011D11....... 3011D11..........
326211H231 3011D31....... 3011D31..........
326211H239 3011D39....... 3011D39..........
326211HYWV 3011D00...... 3011D00..........
326211W 30110.......... 30110............
326211WYWW 3011000..... 3011000..........
326211WYWY 3011002..... 3011002..........
1997 published 1997 collected 1992 published
3262120 75340........... 75340............
3262120100 7534000 pt....... 7534000 pt........
3262120YWW 7534000 pt...... 7534000 pt........
3262120YWY 7534002...... 7534000 pt..........
3262201 30521........... 30521............
3262201141 3052141....... 3052141..........
3262201143 3052143....... 3052143..........
3262201151 pt 3052151 pt..... 3052145........
3262201151 pt 3052151 pt..... 3052149........
3262201YWV 3052100...... 3052100..........
3262202 30522........... 30522............
3262202125 3052225....... 3052225..........
3262202231 3052231....... 3052231..........
3262202245 pt 3052245 pt..... 3052241........
3262202245 pt 3052245 pt..... 3052251........
3262202245 pt 3052245 pt..... 3052289........
3262202YWV 3052200...... 3052200..........
3262203 3052A........... 3052A............
3262203101 3052A01....... 3052A01..........
3262203105 3052A02....... 3052A02..........
3262203YWV 3052A00...... 3052A00..........
3262204 3052B........... 3052B............
3262204100 3052B00....... 3052B00..........
3262205 3052C........... 3052C............
3262205100 3052C00....... 3052C00..........
3262206 3052D........... 3052D............
3262206101 3052D01....... 3052D01..........
3262206105 3052D02....... 3052D02..........
3262206YWV 3052D00...... 3052D00..........
3262207 3052F........... 3052F............
3262207125 pt 3052F25 pt..... 3052F10........
3262207125 pt 3052F25 pt..... 3052F20........
3262207145 pt 3052F45 pt..... 3052F30........
3262207145 pt 3052F45 pt..... 3052F40........
3262207YWV 3052F00...... 3052F00..........
3262208 3052G........... 3052G............
3262208125 pt 3052G25 pt..... 3052G10.......
3262208125 pt 3052G25 pt..... 3052G20.......
3262208145 pt 3052G45 pt..... 3052G30.......
3262208145 pt 3052G45 pt..... 3052G40.......
3262208YWV 3052G00...... 3052G00..........
326220W 30520.......... 30520............
326220WYWW 3052000..... 3052000..........
326220WYWY 3052002..... 3052002..........
3262911 30611........... 30611............
3262911100 3061100....... 3061100..........
3262912 30612........... 30612............
3262912100 3061200....... 3061200..........
3262913 30613........... 30613............
3262913100 3061300....... 3061300..........
3262914 30614........... 30614............
3262914100 3061400....... 3061400..........
3262915 30615........... 30615............
3262915100 3061500....... 3061500..........
3262916 30616........... 30616............
3262916100 3061600....... 3061600..........
3262917 30617........... 30617............
3262917100 3061700....... 3061700..........
326291W 30610.......... 30610............
326291WYWW 3061000..... 3061000..........
326291WYWY 3061002..... 3061002..........
1997 published 1997 collected 1992 published
3262991 30693........... 30693............
3262991111 3069317....... 3069317..........
3262991115 3069323....... 3069323..........
3262991121 3069351....... 3069351..........
3262991125 3069368....... 3069368..........
3262991231 3069373....... 3069373..........
3262991235 3069374....... 3069374..........
3262991241 3069375....... 3069375..........
3262991245 3069377....... 3069377..........
3262991251 3069382....... 3069382..........
3262991255 3069383....... 3069383..........
3262991261 3069384....... 3069384..........
3262991YWV 3069300...... 3069300..........
3262993 30694 pt........... 30694 pt..........
3262993121 3069422....... 3069421 pt..........
3262993131 3069423....... 3069423..........
3262993141 3069424....... 3069425 pt..........
3262993151 3069427....... 3069426 pt..........
3262993YWV 3069400 pt...... 3069400 pt........
3262994 30696........... 30696............
3262994111 3069615....... 3069615..........
3262994121 3069651....... 3069651..........
3262994131 3069661....... 3069661..........
3262994YWV 3069600...... 3069600..........
3262995 pt 3069F pt......... 30695..........
3262995 pt 3069F pt......... 30698..........
3262995131 3069F31....... 3069831..........
3262995151 pt 3069F41 pt..... 3069851........
3262995151 pt 3069F41 pt..... 3069861........
3262995181 pt 3069F81 pt..... 3069500........
3262995181 pt 3069F81 pt..... 3069871........
3262995YWV 3069F00...... 3069800..........
3262996 30699........... 30699............
3262996100 3069900....... 3069900..........
3262997 3069C........... 3069C............
3262997111 3069C11....... 3069C11..........
3262997115 3069C12....... 3069C12..........
3262997125 3069C15....... 3069C15..........
3262997131 3069C16....... 3069C16..........
3262997135 3069C17....... 3069C17..........
3262997137 3069C14....... 3069C14..........
3262997141 3069C23....... 3069C23..........
3262997145 3069C24....... 3069C24..........
3262997151 3069C30....... 3069C30..........
3262997155 3069C44....... 3069C44..........
3262997YWV 3069C00...... 3069C00..........
3262998 3069D pt........... 3069D pt..........
3262998111 3069D41....... 3069D41..........
3262998121 3069D42....... 3069D42..........
3262998YWV 3069D00 pt...... 3069D00 pt........
3262999 3069E........... 3069E............
3262999111 3069E13....... 3069E13..........
3262999115 3069E19....... 3069E19..........
3262999121 3069E20....... 3069E20..........
3262999125 3069E21....... 3069E21..........
3262999131 3069E22....... 3069E22..........
3262999135 3069E23....... 3069E23..........
3262999141 3069E28....... 3069E28..........
3262999145 3069E26....... 3069E26..........
3262999151 3069E27....... 3069E27..........
3262999155 3069E29....... 3069E29..........
3262999YWV 3069E00...... 3069E00..........
326299W 30690 pt.......... 30690 pt..........
326299WYWW 3069000 pt..... 3069000 pt........
326299WYWY 3069002 pt..... 3069002 pt........
G–2 APPENDIX G MANUFACTURINGmINDUSTRY SERIESU.S. Census Bureau, 1997 Economic Census

EC97M-3261L 1997 All Other Plastics Product Manufacturing 1997 Economic Census Manufacturing Industry Series U S C E N S U S B U R E A U