Embed Size (px)
Citation preview

Brace et al
Altered visual processing in a rodent model of Attention Deficit
Hyperactivity Disorder
Louise R. Brace1, Igor Kraev1, Claire L. Rostron1, Michael G Stewart1, Paul G Overton2 and
Eleanor J Dommett3*
1 Department of Life, Health and Chemical Sciences, The Open University, Milton Keynes.
MK7 6AA. UK.
2 Department of Psychology, University of Sheffield, Western Bank, Sheffield. S10 2TN. UK.
3 Department of Psychology, Institute of Psychiatry, Psychology and Neuroscience, King’s
College London, London. SE5 8AF. UK.
* Corresponding Author
Department of Psychology,
Institute of Psychiatry, Psychology and Neuroscience,
King’s College London,
Capital House,
Guy's Campus,
42 Weston Street,
London.
SE1 3QD.
UK.
Email: [email protected]
Tel: 0207 848 6928
Abstract
1
Brace et al
A central component of Attention Deficit Hyperactivity Disorder (ADHD) is increased
distractibility, which is linked to the superior colliculus (SC) in a range of species, including
humans. Furthermore, there is now mounting evidence of altered collicular functioning in
ADHD and it is proposed that a hyper-responsive SC could mediate the main symptoms of
ADHD, including distractibility. In the present study we have provided a systematic
characterisation of the SC in the most commonly used and well-validated animal model of
ADHD, the spontaneously hypertensive rat (SHR). We examined collicular-dependent
orienting behaviour, local field potential (LFP) and multiunit responses to visual stimuli in
the anaesthetised rat and morphological measures in the SHR in comparison to the Wistar
Kyoto (WKY) and Wistar (WIS). We found that the SHR remain responsive to a repeated
visual stimulus for more presentations than control strains and have longer response duration.
In addition, LFP and multiunit activity within the visually responsive superficial layers of the
SC showed the SHR to have a hyper-responsive SC relative to control strains, which could
not be explained by altered functioning of the retinocollicular pathway. Finally, examination
of collicular volume, neuron and glia densities and glia:neuron ratio revealed that the SHR
had a reduced ratio relative to the WKY which could explain the increased responsiveness. In
conclusion, this study demonstrates strain-specific changes in the functioning and structure of
the SC in the SHR, providing convergent evidence that the SC might be dysfunctional in
ADHD.
Keywords: Superior colliculus; Spontaneously Hypertensive Rat; Distractibility; Orienting
2

Brace et al
1. Introduction
Attention deficit hyperactivity disorder (ADHD) is the most common neurodevelopmental
disorder, affecting 8–12% of children (Biederman and Faraone, 2005), with symptoms often
persisting into adulthood (Spencer et al., 2002). It is characterised by difficulty with attention,
impulsivity and hyperactivity. A central component of ADHD is an increase in distractibility
(Douglas, 1983, Thorley, 1984), which has long been considered one of the most common
symptoms of ADHD (Barkley and Ullman, 1975) and features in the inattentive and
combined presentations of ADHD under DSM-5 (APA, 2013).
Behavioural evidence suggests that distractibility is intimately linked with the superior
colliculus (SC), a subcortical structure that is highly conserved across species (Ingle, 1973).
The SC is involved in detecting and responding to novel, unexpected and salient stimuli
across a range of modalities (Dean et al., 1989). In particular, it is responsible for orienting
head and eye movements (Grantyn et al., 2004) and covert attention towards such stimuli
(Rizzolatti et al., 1987). Work in a range of species has shown that collicular lesions cause a
decrease in distractibility (Sprague and Meikle, 1965, Goodale et al., 1978, Milner et al.,
1978) whilst removal of prefrontal cortex inhibitory control of the colliculus leads to an
increase in distractibility in humans (Gaymard et al., 2003). This suggests that the SC
remains important in the neural basis of distractibility in humans.
Although many theories have been proposed about the underlying neural basis of ADHD, it is
still poorly understood (Biederman, 2005). Theories include frontal cortex deficits (Barkley
et al., 1992) and/or alterations in monoamine transmission, particularly dopaminergic
function (Wender, 1973). However, several lines of evidence support a role for the SC in
ADHD. Firstly, people with ADHD have difficulty inhibiting saccades (Klein et al., 2003,
3

Brace et al
O'Driscoll et al., 2005) and shifts in covert attention (Swanson et al., 1991), consistent with
collicular dysfunction (Ignashchenkova et al., 2004, Katyal et al., 2010, Robinson and Bucci,
2014). Secondly, collicular dysfunction has been reported in rodent models of ADHD. For
example, in the spontaneously hypertensive rat (SHR), the most commonly used rodent
model of ADHD, altered height dependency of air righting reflexes has been found (Dommett
and Rostron, 2011) which is linked to collicular dysfunction (Pellis et al., 1989, Pellis et al.,
1991, Yan et al., 2010). More recently, orienting behaviour to a repeated visual stimulus has
been shown to be increased in the SHR (Robinson and Bucci, 2014). In addition, in the New
Zealand Genetically Hypertensive (GH) rat, a proposed, but as yet not widely validated
model of ADHD, increased responsiveness to whole field light flashes has been found in the
superficial layers of the colliculus (Clements et al., 2014). Thirdly, amphetamine which is
used to treat ADHD, decreases the responsiveness of cells in the superficial layers of the
colliculus to visual stimuli in healthy rats (Gowan et al., 2008) and the New Zealand GH rat
(Clements et al., 2014). It also reduces distractibility in healthy rats (Agmo et al., 1997) and
humans both with (Brown and Cooke, 1994, Spencer et al., 2001) and without ADHD
(Halliday et al., 1990). Finally, the colliculus is known to modulate ascending dopaminergic
systems (Dommett et al., 2005) via a direct connection from the colliculus to midbrain
dopaminergic neurons (Coizet et al., 2003, Comoli et al., 2003) and, therefore, alterations in
collicular functioning could cause the dopaminergic abnormalities seen in ADHD (Solanto,
2002, Viggiano et al., 2003a, Viggiano et al., 2003b, Sagvolden et al., 2005).
In light of the mounting evidence supporting a role for the SC in ADHD, we conducted a
detailed characterisation of the SC, focusing on the visually-responsive superficial layers, in
the SHR model of ADHD. Despite previous studies suggestive of a collicular abnormality in
ADHD, no study to date has utilised evidence from behavioural, physiological and
morphological techniques within a validated animal model. Specifically, we hypothesized
4

Brace et al
that the SHR would show increased responsiveness to visual stimuli both at a behavioural
level on an orienting task and at neuronal level in the colliculus. Furthermore, we
hypothesized that there would be changes in the underlying morphology (collicular volume,
cell densities and neuron-glia ratio) of the colliculus.
2. Methods and materials
2.1 Animals
All experiments were conducted with the authority of the appropriate UK Home Office
Licenses and adhered to guidelines set out in the Animals [Scientific Procedures] Act (1986),
EU Directive 2010/63/EU, and the "Guide for the care and use of Laboratory Animals” (NIH
publication, 8th ed, The National Academies Press, Washington, 2011). Adult male rats
(Harlan Laboratories Ltd, Bicester, UK) aged 15-20 weeks at the start of testing were housed
within the Biomedical Resource Unit (BRU) at the Open University. All rats were housed in
groups of three (of the same strain) within scantainers held at a constant temperature of 21-23
°C. The holding room was on a 12:12hr reverse light/dark cycle with lights off at 8am. Rats
were given one week to habituate to the BRU prior to use in any experimental procedures.
All procedures were carried out in the dark phase and therefore at the time when rats are most
active. Food and water were available ad libitum throughout. The importance of an
appropriate control strain for the SHR is widely recognised (Sagvolden et al., 2009), and as
such, we selected both the Wistar Kyoto (WKY), the normotensive control commonly used
but also shown to have some abnormal behaviours in itself (Drolet et al., 2002, van den
Bergh et al., 2006), and the Wistar (WIS) as an outbred albino control strain. The sample
sizes and weight in grams at start of data collection for the different experimental procedure
for the three strains is shown in Table 1.
5

Brace et al
Table 1 The division of animals across the different experimental procedures giving their weight in grams (mean ± SEM) and sample size. Note that animals used for behavioural testing were also used for electrophysiology experiments, but the animals used for the morphological measures were solely used for this purpose. The total number of animals used was therefore 115.
Despite the animals of each strain being the same age at the start of the data collection phases
for each of the experimental procedures, there were significant differences in weight between
strains for the behavioural (F(2)=8.39; p=0.002) and physiological measures (F(2)=28.19;
p=0.0005). In both cases, post hoc (Tukey HSD) analysis revealed that the only significant
differences were between the WIS and the WKY (behaviour p=0.002; physiological
p=0.0005) and the WIS and the SHR (behaviour p=0.026; physiological p=0.0005), with the
WIS weighing more than both other strains. There was no significant difference in weight
between the strains for the morphological procedures (volume F(2)=3.14; p=0.092; cell
densities and ratios F(2)=1.33; p=0.311).
2.2 Behavioural testing
Distractibility was measured using an orienting task with a visual stimulus, examining initial
responses and subsequent habituation of the response to the visual stimulus (Clements et al.,
2014, Robinson and Bucci, 2014). All testing was carried out between the hours of 9am and
5pm in a dimly red-lit room in the presence of white noise and with careful removal of
olfactory cues from testing equipment between test sessions to remove any extraneous cues
that could affect behaviour. Prior to testing, animals were habituated to the experimenter with
daily handling for one week. In addition, they were habituated to the testing space, a circular
plastic arena (2.5 m diameter) with a centrally located light (green LED, 20 mcd) sealed
within a clear Perspex cylinder, for two days prior to testing. On each habituation day the
animal was placed in the arena for 15 minutes with the stimulus light remaining off for the
entire period. Testing began on the third day with the animal placed in the arena and the
6

Brace et al
video camera started (Samsung VP-HMX20C). After 5 minutes, the light was remotely
switched on for a period of 5 seconds. This was repeated for a total ten stimulus presentations
with an inter stimulus interval of 5 minutes. Order of testing was counterbalanced by strain
and the remote control of the paradigm meant that the experimenter was not present in the
room during testing and therefore could not influence behaviour.
Offline video analysis was used to determine whether an animal had oriented to the stimulus.
An animal was deemed to have oriented if it physically interacted with the stimulus casing,
oriented its head towards the stimulus or stared at the stimulus. Once it was determined
whether the animal had responded, it was possible to calculate the percentage of animals of
each strain that responded for each of the ten consecutive stimulus presentations. The
comparison of interest was between strains and therefore a survival analysis was used to
assess whether any difference in responsiveness across repeated stimulus presentation was
significant. We examined whether there were any strain differences in the median survival
time i.e. the number of stimulus presentations before which 50% of those rats initially
responding showed habituation. In addition to whether a response occurred, the duration of
any response to the stimulus during the 5 seconds in which it was on was measured for each
of the ten stimuli and expressed as a percentage of that time. As well as examining behaviour
within the 5 seconds while the stimulus was on, the 5 second pre- and post-stimulus periods
were also examined to assess whether the animals were affected by the stimulus when it was
not actually on. That is, if their behaviour was a general behaviour directed towards the
stimulus object rather than the actual sensory stimulus (i.e. the light), that is a result of
arousal rather than attention. The duration data was checked for normality using the
Kolmogorov–Smirnov test and then repeated measures ANOVA with STIMULUS
PRESENTATION as the within-subjects factor and STRAIN as the between-subjects factor
was conducted using the percentage of overall time distracted by the stimulus as the
7

Brace et al
dependent variable. Where Mauchly’s test of sphericity was significant in the ANOVAs, the
degrees of freedom were adjusted using Greenhouse–Geisser correction (Greenhouse and
Geisser, 1959).
In order to ensure that the measure of orienting was not confounded by locomotor activity
differences between the three strains, locomotor activity was measured using automated
Activity Monitoring Chambers (Med-Associates, Middlesex, UK). As with the visual
response task, testing was conducted over three consecutive days. On the first two days,
animals were habituated to the locomotor chambers for 15 minutes each day before an
assessment of locomotor activity during a 30 minute (with 5 minute bins) period on the third
day. The following measurements were used for analysis (i) “distance travelled” - the total
horizontal distance moved in cm; (ii) “average velocity” - average horizontal velocity in
cm/min; (iii) “vertical activity”- the number of continuous vertical beam breaks indicating
rearing and (iv) “stereotypic activity”- the number of partial-body movements that occurred
within a defined space, such as grooming, head-weaving or scratching movements. This
locomotor testing took place within 7 days of the orienting task. All variables were checked
for normality using the Kolmogorov-Smirnov test and repeated measures ANOVA with
TIME as the within-subjects factor and STRAIN as the between-subjects factor was used to
analyse locomotor activity for the four different measures. As with the main behavioural data,
where Mauchly’s test of sphericity was significant in the ANOVAs, the degrees of freedom
were adjusted using Greenhouse–Geisser correction (Greenhouse and Geisser, 1959).
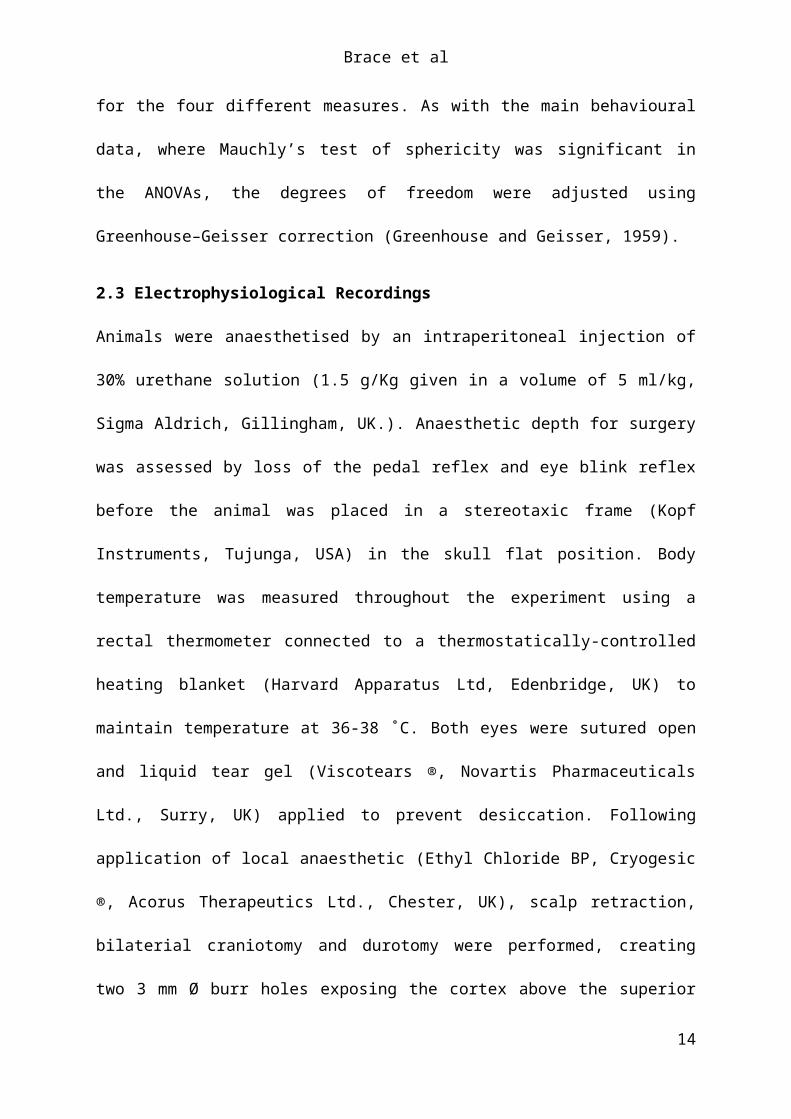
2.3 Electrophysiological Recordings
Animals were anaesthetised by an intraperitoneal injection of 30% urethane solution (1.5
g/Kg given in a volume of 5 ml/kg, Sigma Aldrich, Gillingham, UK.). Anaesthetic depth for
surgery was assessed by loss of the pedal reflex and eye blink reflex before the animal was
placed in a stereotaxic frame (Kopf Instruments, Tujunga, USA) in the skull flat position.
8

Brace et al
Body temperature was measured throughout the experiment using a rectal thermometer
connected to a thermostatically-controlled heating blanket (Harvard Apparatus Ltd,
Edenbridge, UK) to maintain temperature at 36-38 ˚C. Both eyes were sutured open and
liquid tear gel (Viscotears ®, Novartis Pharmaceuticals Ltd., Surry, UK) applied to prevent
desiccation. Following application of local anaesthetic (Ethyl Chloride BP, Cryogesic ®,
Acorus Therapeutics Ltd., Chester, UK), scalp retraction, bilaterial craniotomy and durotomy
were performed, creating two 3 mm Ø burr holes exposing the cortex above the superior
colliculus (right:-6.3 mm AP to Bregma, and +2 mm ML to the midline; left: -6.3 mm AP to
Bregma; and +3.5 mm ML to the midline) to allow for simultaneous recordings from both
SCs. In addition, two trepanned holes (1 mm Ø) were created anterior to the SC burr holes at
specific stereotaxic co-ordinates for electroencephalographic (EEG) recordings (+1 mm
anterior, +2 mm lateral; and -4mm posterior, +3mm lateral, relative to Bregma, Devonshire et
al., 2009). Differential and active EEG electrodes (loop-tipped silver wire, 0.2 mm Ø;
Intracel) were placed ~1 mm subcranially into the rostral and caudal trepanned holes,
respectively to obtain continuous EEG information. Finally, respiration rate was recorded
using a three-axis accelerometer IC (ADXL330KCPZ, Analog Devices, Norwood, MA,
USA), device attached to the animal’s lateral abdomen (Devonshire et al., 2009). Both EEG
and respiration rate were used to monitor the animal during the recordings and used offline to
confirm there were no differences in anaesthetic depth between the three strains.
Tungsten electrodes (Parylene-C-insulated; 2 MΩ, A-M Systems Inc., Carlsborg, WA, USA)
were positioned directly above the superficial layers of the SC at the coordinates stated above
at a depth of – 2.0 mm from the brain surface. The electrodes were then gradually lowered
during presentation of a light stimulus (green LED flashing at 0.5 Hz, 10 ms duration, 20 mcd
positioned 5 mm anterior to the contralateral eye) until a strong light response was detected in
both the audio feed from the recording (NL120, The Neurolog System, Digitimer,
9

Brace et al
Hertfordshire, UK) and visual feed via Spike2 (CED, Cambridge, UK.). Once the electrodes
were positioned in the superficial layers, the animal was left in the dark for a further 25
minutes to adapt to the darkness before actual recordings began. Visual responses from 150
stimulations were then recorded at 5 different stimulus intensities (from minimum to
maximum light: 4, 8, 12, 16 and 20 mcd) for offline analysis. Extracellular low frequency
(local field potential; LFP) and high-frequency (multi-unit activity) was amplified (gain
10,000 and 1000, respectively), band-pass filtered (LFP: 0.1–500 Hz, multi-unit activity:
500–10 kHz) (Logothetis, 2008), digitized at 11 kHz and recorded to PC using a 1401+ data
acquisition system (Cambridge Electronic Design Systems, Cambridge, UK), running Spike2
software (Cambridge Electronic Design, Cambridge, UK) and saved for offline analysis.
To check that the depth of anaesthesia was comparable in the three strains during testing, the
dominant EEG frequency was obtained using a power spectrum analysis (Spike2) for the
period within which the 150 stimulations where presented. The respiration rate per minute
was calculated during the first and last 30 seconds of this period and then used to calculate an
average rate per minute over the whole recording period. Based on the EEG frequency bands,
all animals were found to be in stage III-4 (Guedel, 1920), with a dominant EEG frequency of
1-2 Hz during recordings, and were found to have comparable respiration rates using a One-
Way ANOVA (F (2) =3.52; p=0.098) following confirmation of normality of data with a
Kolmogorov–Smirnov test.
Collicular recordings were analyzed offline using Spike2, custom-made Excel macros (Peter
Furness, Sheffield University) and SPSS. All analyses were performed on averaged data
where averages were constructed from the full 5 minute period (150 stimulations) for each of
the five stimulus intensities. The main comparison of interest was between responses in the
three strains across the range of flash intensities. For LFP data a waveform average was
created in Spike2 (1-ms bins, 1 s duration, 0.1 s offset) for each intensity. The waveform
10

Brace et al
average was exported into the custom-made macro and a response was deemed to have
occurred if the voltage trace exceeded a pre-determined threshold after stimulus onset, but not
before 20 ms post stimulus. The latter requirement was used to avoid any stimulus-related
artifacts; collicular LFP responses to light flash stimuli in dark-adapted rats have been
reported to have an average onset latency in excess of 27 ms (Dyer and Annau, 1977, Gowan
et al., 2008). The threshold for change was set at ±1.96 standard deviations from the mean
baseline (i.e. within 95% confidence levels). This threshold was used to assess three
parameters: onset latency, peak-to-peak amplitude and duration. Onset latency was obtained
by recording the time after stimulus presentation (and at least 20 ms) at which the voltage
trace exceeded the threshold. Response duration was determined by obtaining the time, post-
stimulus, when the voltage trace returned to within baseline levels (i.e. ±1.96 standard
deviations of the pre-stimulation mean) and consistently stayed below this value for 10 ms or
10 bins. The time between onset latency and the response finishing was then used to calculate
duration. Finally, peak-to-peak amplitude was defined as the voltage difference between the
maximum positive peak and the maximum negative peak in the response period defined by
the significant deviation from baseline. For the multiunit activity, similar measures were
utilised following initial extraction of ‘spikes’ from the high-frequency data by thresholding.
Peri-stimulus time histograms (PSTHs; 1-ms bins, 1 s duration, 0.1 s offset) were constructed
from the trial-by-trial spike counts within Spike2 and the 100 ms pre-stimulus period was
defined as baseline activity. A light response was deemed to have occurred if, post stimulus,
the activity rose above 1.96 standard deviations of the mean for at least 5 ms (5 consecutive
bins), the first of which was labelled as the onset of a response. The duration was calculated
by measuring when the response fell back to within the baseline levels for at least 10 ms (10
consecutive bins), the first of which was labelled as the end of the response. Duration was
then given as the difference between onset latency and the response ending. The amplitude
11

Brace et al
was recorded as the peak value of the response minus the mean baseline value. Prior to
statistical analysis all data were deemed normally distributed using the Kolmogorov–Smirnov
test. Repeated measures ANOVAs with STRAIN as the between-subjects factor and
STIMULUS INTENSITY as the within-subjects factor were used. As with the behavioural
data, where Mauchly’s test of sphericity was significant in the ANOVAs, the degrees of
freedom were adjusted using Greenhouse–Geisser correction (Greenhouse and Geisser,
1959).
2.4 Histology
Site reconstruction: Following electrophysiological recordings, animals were transcardially
perfused with physiological saline followed by 4% paraformaldehyde in phosphate buffered
fixative. The brains were the placed in fixative for 24 hours before being transferred to 20%
sucrose for a further 36 hours. They were then frozen to -18 C in isopentane (WWR
International, Lutterworth, UK) and cut into 50 µm coronal sections using a cryostat
(CM1900, Leica, Milton Keynes, UK) with the cutting chamber held at -20 C. The slices
were dehydrated with alcohol and Nissl stained with cresyl violet (0.5%) (Sigma Aldrich,
Gillingham, UK), before cover-slipping for histological verification of recording sites, which
were subsequently plotted onto reconstructed sections from Paxinos and Watson (Paxinos
and Watson, 1998) to confirm location of recording in the superficial layers of the colliculus.
Collicular volume and cell counts: Animals were given a terminal i.p. dose of sodium
pentobarbitone (Animalcare, York, UK) before being trancardially perfused and the brain
sectioned as described above. For volume analysis of the whole brain and the SC the
Cavalieri principle was used; the first 50 µm section was taken from every 1-in-5 series of
sections throughout the brain were used. For the cell counts, beginning at a random starting
point (between slices 1-5), every 5th section was collected for cell count analysis. For both
measures the slices were dehydrated with alcohol and Nissl stained with cresyl violet (0.5%,
12

Brace et al
Sigma Aldrich, Gillingham, UK) before cover-slipping for analysis. Images were captured
using a Microfibre digital camera attached to a Nikon Eclipse 80i microscope (Nikon UK
LTD, Kingston-upon-Thames, UK). For volume analysis, images of the section and an
appropriate scale bar were taken at x1 magnification (Nikon Plan UW, 1x/0.04, WD 3.2) and
exported to a freely available reconstruction programme (Reconstruct version 1.1.0.1
http://synapses.clm.utexas.edu/). The whole brain as well as the complete superficial layers of
the SC, as defined by Paxinos and Watson (Paxinos and Watson, 1998), were then outlined
throughout the slices using the Reconstruct programme. The multiplication of the cut surface
area by the known distance in thickness (250 µm) was calculated to provide the estimated
volume of the examined objects i.e. the whole brain and the superficial layers of the
colliculus. Factors such as the physical size of the animal influence the maximum brain size
(Raz et al., 1998) and it has therefore been suggested that comparing solely volumes of
intracranial structures between groups would not provide reliable data (Knutson et al., 2001).
As such, the volume fraction of the SC within the reference volume (the whole brain) was
calculated, to give a proportion of the structure (i.e. superficial layers) within the whole brain
structure. These data were confirmed as having a normal distribution using the Kolmogorov–
Smirnov test before analysis was conducted using a One-Way ANOVA to analyse strain
differences. For cell counts, the images were taken at x40 magnification (Nikon Plan Flor,
40x/0.75, DIC M, WD 0.72). Contours were drawn at low magnification (x1; Nikon Plan
UW, 1x/0.04, WD 3.2) around the region of interest i.e. the superficial layers of the SC, as
defined by Paxinos and Watson (1998). The stereologically unbiased Optical Fractionator
method on the Stereo-Investigator software (MBF Biosciences, Magdeburg, Germany) was
used to obtain an estimate of the total number of cells in the region of interest, as it is not
influenced by the size, shape, spatial orientation, and spatial distribution of the cells studied.
Nuclei from different cell types were differentiated based on morphological criteria of shape
13
Brace et al
and relative size (see Figure 1). Neurons were identified by their generally larger shape and
non-spherical outline, as well as a pale and uniformly Nissl-stained cytoplasm with a well-
marked nucleolus. Glial nuclei were identified by being generally smaller in size, ovoid shape
with the absence of stained cytoplasm, the presence of a thicker nuclear membrane, and more
heterogeneous chromatin within the nucleus (Cotter et al., 2002). Although we cannot
definitively distinguish between glial types, on the basis of their appearance we believe that
the large majority are astrocytes.
Figure 1 Examples of cresyl violet stained neuronal and glial cells in the superior colliculus at x40 magnification, differentiated based on specific morphological criteria. N: neuron; G: glia. Scale bar = 10µm.
14
Brace et al
3. Results
3.1 The SHR showed less habituation and longer duration responses to visual stimuli.
The vast majority of animals (100% SHR, 100% WKY and 88% WIS) responded to the
visual stimulus on the first presentation, as expected for a novel stimulus. However, although
the percentage of animals responding for the three strains decreased with repeated stimulus
presentation, the rate at which the responding decreased differed between strains (Figure 2A),
with 66.67% of SHR still responding to the final stimulus presentation in comparison to just
11.11% of WKY and none of the WIS. The survival analysis showed a significant difference
in median survival time between strains (U(2)=28.96; p<0.001), with post-hoc analysis
revealing that the SHR (median survival time = 10.00) was significantly more likely to
respond for longer than the WIS (median survival time = 8.31; U(1)=26.39; p<0.001) and
WKY (median survival time = 8.37; U(1) 27.33; p<0.001). There was no significant
difference between the WIS and WKY (U(1)=0.044; p=0.835). In the 5 second periods either
side of the stimulus light being on, animals were not responsive to the stimulus object and
this remained the case for all stimulus presentations.
In terms of response duration, all three strains spent a similar amount of time responding to
the stimulus during the first presentation (Figure 2B; SHR 67.56±8.97% of total time or
2.88±0.45 s; WIS 52.50±9.13% or 2.63±0.48 s; WKY 54.89±6.19% or 2.74±0.31 s).
Repeated measures ANOVA with STIMULUS PRESENTATION as the within-subjects
factor and STRAIN as the between-subjects factor was conducted using the percentage of
overall time responding to the stimulus as the dependent variable. There was a significant
main effect of STIMULUS PRESENTATION (F (5.67, 130.55)=13.38; p<0.001), with all
animals spending significantly less time responding to the stimulus with repeated stimulus
15

Brace et al
presentation, with significant decreases in response duration compared to the first stimulus
beginning at the second stimulus (F (1, 23) =6.82; p=0.016). By the final stimulus there was a
highly significant difference in the duration of their response (F (1, 23) =70.29; p<0.001)
relative to the first stimulus presentation. There was also a significant main effect of STRAIN
(F (2, 23) =56.05; p<0.001), with post hoc tests showing that the SHR spent significantly
more time responding to the stimulus than the WIS (p<0.001) and the WKY (p<0.001). There
was no significant STIMULUS PRESENTATION x STRAIN interaction (F (11.35, 130.55)
=0.627; p=0.808).
Figure 2 The percentage of animals responding to consecutive light flashes (A) and the duration of responses as a percentage of the five second period in which the light was on (B). The SHR showed greater duration responses and continued to respond for a greater number of stimulus presentations. A representative key is shown in part A.
Repeated measures ANOVA with TIME as the within-subjects factor and STRAIN as the
between-subjects factor was used to analyse locomotor activity for the four different
measures (distance travelled, vertical activity, average velocity and stereotypic activity;
Figure 3) in order to be sure that locomotor activity did not confound measures of distractible
behaviour. There was no main effect of STRAIN for average velocity (F(2, 23)=0.66;
p=0.528) or stereotypic activity (F(2, 23)=0.44; p=0.650). However, there was a main effect
of STRAIN for distance travelled (F(2, 23)=4.10; p=0.030), with post hoc (Tukey HSD)
analysis revealing that there was a trend towards the WKY moving significantly less distance
than the WIS (p=0.052) and SHR (p=0.056), and no significant difference between the WIS
and SHR (p=0.994). There was also a main effect of STRAIN on vertical activity (F(2,
23)=4.12; p=0.029), with post hoc (Tukey HSD) analysis showing that the SHR were
significantly more vertically active than WKY (p=0.023) but not the WIS (p=0.480). There
were no significant differences between WIS and WKY (p=0.265). As may be expected for
locomotor activity in a confined space, there was a main effect of TIME, with parameters
decreasing with increasing time within the chamber as the environment became familiar
16

Brace et al
through exploration, for distance travelled (F (5, 115)=67.46; p<0.001), stereotypic activity
(F(5, 115)=31.57; p<0.001) and vertical activity (F(3.07, 70.71)=11.02; p<0.001). There was
no main effect of TIME on average velocity (F(3.63, 83.41)=2.38; p=0.064). There were no
significant TIME x STRAIN interactions for average velocity (F(7.25, 83.41)=1.02;
p=0.423), stereotypic activity (F(5, 115)=1.63; p=0.125) and vertical activity (F(6.15,
70.71)=2.08; p=0.070). There was a TIME x STRAIN interaction for the distance travelled
(F(10, 115)=5.15; p<0.001). Restricted ANOVAs revealed this significant interaction to be
due to differences between the WIS and the other two strains in the first ten minutes with the
WIS showing a greater decrease during this period.
Figure 3 Locomotor activity for all three strains. There was a main effect of time and strain on distance travelled (A) and vertical activity (C) but not on average velocity (B). For stereotypic activity (D) there was a main effect of time but not strain.
3.2 The SHR is more likely to show multiunit visual responses to weaker stimuli and
have delayed onset of responses.
Eighty-six visual responses were recorded from the superficial layers of the SC (Figure 4); 32
were recorded in Opticum (Op), (12 SHR; 10 WIS; 10 WKY), 53 were recorded in
Superficial Grey (SuG) (15 SHR; 20 WIS; 18 WKY) and 1 was recorded from Zonal Layer
(Zo) (WKY). Chi-square analysis showed there was no significant association between strain
and the superficial layer from which recordings were made (χ2(4)= 2.81; p=0.590).
Figure 4 Reconstructed plots of recording sites in the superficial layers of the SC for SHR (black circles), WKY (grey circles) and WIS (grey triangles). Plots are collapsed onto three sections through the colliculus (Paxinos and Watson, 1998) with position relative to Bregma given. There was no significant association between the layer recorded from and strains.
The percentage of animals showing responses at each of the five stimulus intensities is shown
by strain in Table 2. Chi-square analysis showed that there was no significant association
between strain and the likelihood of a response at any of the stimulus intensities for LFP
responses, indicating all three strains were equally responsive in terms of LFP responses. By
17

Brace et al
contrast, the likelihood of showing a multiunit activity response was significantly associated
with strain for 4, 8 and 12 mcd stimuli. Restricted Fisher’s Exact tests revealed that the SHR
was more likely to respond than the WIS at all three intensities (4 mcd p=0.003; 8 mcd
p=0.006; 12 mcd p=0.005) and more likely than the WKY to respond to the lowest two
intensities (4 mcd p=0.018; 8 mcd p=0.025; 12 mcd p=0.237). There were no differences
between the WIS and the WKY at any intensity (4 mcd p=0.589; 8 mcd p=0.606; 12 mcd
p=0.181).
Table 2 Responsiveness to the five different stimulus intensities used for whole field light flashes. There were no differences in responsiveness of strains for local field potential responses but for multiunit activity responses, the SHR were more responsive at lower intensities.
Local field potential responses: In order to analyse the impact of stimulus intensity on onset
latency, peak-to-peak amplitude and duration, data from the animals that responded to the
highest three stimulus intensities were analysed (SHR n=25; WKY n=23; WIS n=23) using
repeated measures ANOVA with STIMULUS INTENSITY as the within-subjects factor and
STRAIN as the between-subjects factor. These analyses revealed a significant main effect of
STIMULUS INTENSITY (F(1.73, 117.59)=27.62; p<0.001) for onset latency, with
significant decreases between each consecutive stimulus intensity (12-16 mcd: F(1, 6)=10.09;
p=0.002), 16-20 mcd: F(1)=52.11; p<0.001), but no significant main effect of STRAIN (F(2,
68)=0.32; p=0.730) or STIMULUS INTENSITY x STRAIN interaction (F (3.46,
117.59)=2.23; p=0.080) (Figure 5B). Similar patterns were found for peak-to-peak amplitude
with a significant main effect of STIMULUS INTENSITY (F(1.11, 75.71)=33.47; p<0.001),
with significant increases between each consecutive stimulus intensity (12-16 mcd: F(1,
68)=23.16; p<0.001), 16-20 mcd: F(1)=34.41; p<0.001), but no significant main effect of
STRAIN (F(2, 68)=0.006; p=0.994) or STIMULUS INTENSITY x STRAIN interaction (F
(2.23, 75.71)=1.40; p=0.252) (Figure 5C). The duration of the responses is shown in Figure
5D. Unlike the other parameters, there was no significant main effect of STIMULUS
18

Brace et al
INTENSITY (F(2, 136)=0.81; p=0.447), but there was a significant main effect of STRAIN
(F(2, 68)=6.07; p=0.004). Post hoc (Tukey HSD) analysis revealed that the WKY had a
significantly longer response duration in comparison to the SHR (p=0.013) and WIS
(p=0.007). There was no significant STIMULUS INTENSITY x STRAIN interaction (F(4,
136)=0.52; p=0.734).
Figure 5 Example of a local field potential visual response recorded in the superficial layers of the superior colliculus with a 20 mcd stimulus in an SHR, with the stimulus presented at time zero (grey line) (A). The relationship between local field potential response parameters and stimulus intensity is shown for onset latency (B), peak-to-peak amplitude (C) and duration (D). A representative key is shown in B.
Multiunit activity responses: As with the LFP responses, in order to analyse the impact of
stimulus intensity on stimulus parameters of onset latency, peak amplitude and duration, data
from the animals that responded to the highest three stimulus intensities were analysed (SHR
n=27; WIS n=22; WKY n=26) using repeated measures ANOVA with STIMULUS
INTENSITY as the within-subjects factor and STRAIN as the between-subjects factor. For
onset latency, there was a significant main effect of STIMULUS INTENSITY (F(1.43,
109.59)=59.79; p<0.001), with significant decreases in latency with each consecutive
increase in stimulus intensity (12-16 mcd: F(1, 72)=20.90; p<0.001, 16-20 mcd: F(1,
72)=133.31; p<0.001). However, there was also a significant main effect of STRAIN (F(2,
72)=4.06; p=0.021). Post hoc (Tukey HSD) analysis showed that the SHR had a significantly
greater onset latency in comparison to the WKY (p=0.022). There was no significant
STIMULUS INTENSITY x STRAIN interaction (F(2.85, 102.59)=0.56; p=0.637) (Figure
6B). For peak amplitude there was a significant main effect of STIMULUS INTENSITY
(F(1.68, 120.68)=130.15; p<0.001), with significant increases in amplitude with each
consecutive stimulus intensity (12-16 mcd: F(1, 72)=59.00; p<0.001, 16-20 mcd: F(1,
72)=167.75; p<0.001), but no significant main effect of STRAIN (F(2, 72)=1.26; p=0.298).
There was however a significant STIMULUS INTENSITY x STRAIN interaction (F(3.35,
19

Brace et al
120.68)=3.79; p=0.010) for this parameter. Restricted ANOVAs indicated that this
interaction was due to the SHR having a greater amplitude responses at the 12 and 16 mcd
intensity but not at the 20 mcd intensity (Figure 6C). The duration of the responses is shown
in Figure 6D. Unlike the duration of the LFP response, there was a significant effect of
stimulus intensity (F (1.59, 114.57)=38.01; p<0.001), with consecutive increases in stimulus
intensity associated with significant increases in response duration (12-16 mcd: F(1, 72)=
40.43; p<0.001, 16-20 mcd: F(1, 72)=37.06; p<0.001). There was also a significant main
effect of STRAIN F(2, 72)=5.27; p=0.007), with post hoc (Tukey HSD) analyses revealing
only one significant difference - the WKY had a longer response duration than the WIS
(p=0.005). There was no significant STIMULUS INTENSITY x STRAIN interaction
(F(3.18, 114.57)=0.44; p=0.740).
Figure 6 Example multiunit visual responses recorded in the superficial layers of the superior colliculus of an SHR at the 12 mcd intensity The top trace shows a raster plot with a line for each trial whilst the lower trace is a histogram (1 ms bins) of spike activity with the stimulus presented at time zero (grey line) (A). The relationship between multiunit response parameters and stimulus intensity is shown for onset latency (B), peak-to-peak amplitude (C) and duration (D). A representative key is shown in B.
3.3 There were no significant differences in collicular volume fraction or cell densities
but glia:neuron ratio varied with strain.
Despite there being no significant differences in body weight between the three strains for
these experiments, analysis of whole brain volume using a One-Way ANOVA revealed a
significant difference between the three strains (F(2)=6.77; p=0.016), making it necessary to
normalise collicular measures to whole brain volume. A One-Way ANOVA using volume
fraction to assess the volume of the superficial layers of the SC revealed that there was no
significant difference (F(2)=1.04 p=0.392) between the strains (Figure 7A). There were also
no significant differences in number (Figure 7B F(2)=0.58; p=0.57) or the density of neurons
(Figure 7C F(2)=1.40; p=0.279) between the strains. There was a significant difference in the
20

Brace et al
number of glia (Figure 7B F(2)=4.23; p=0.037) with post hoc (Tukey HSD) tests revealing
that the SHR had significantly fewer glia than the WKY (p=0.038) but not the WIS
(p=0.126). There was no significant difference between the WIS and WKY (p=0.853). When
density of glia was considered, therefore taking into account the differing brain absolute
volumes, there was no significant difference between strains (Figure 7C F(2)=0.56; p=0.582).
There was, however, a significant difference between strains in terms of the glia:neuron ratio
(Figure 7D; F(2)=3.80; p=0.048). Post hoc (Tukey HSD) tests revealed that the SHR had a
significantly lower ratio than the WKY (p=0.047) but not the WIS (p=0.167). There was no
significant difference between the WIS and WKY (p=0.825).
Figure 7 There was no significant difference between the three strains in terms of superficial collicular volume fraction (A). Whilst there was a significant strain difference for number of glia, but not neurons (B), this was not present when taking into account absolute volume differences by using cell densities (C). However, the SHR had a significantly lower glia:neuron ration than the WKY (D) * p<0.05. A representative key for C and D is shown in C.
4. Discussion
The finding that the male SHR used in the current studies were more responsive than both
WKY and WIS rats to a visual stimulus, and that they fail to habituate to repeated
presentation, is in line with a previous study using a similar orienting task in female SHR
(Robinson and Bucci, 2014). Therefore, despite other recorded sex differences in SHR
behaviour (Berger and Sagvolden, 1998, Ferguson et al., 2003, Dervola et al., 2012, Johansen
et al., 2014), increased responsiveness on an orienting task appears common to both sexes. It
noteworthy that the SHR have been found to show reduced habituation (Hendley et al., 1985)
and increased locomotor activity at some ages (Bayless et al., 2015) when compared to WKY
and alterations in either of these could have confounded our results. However, activity during
the periods immediately before and after the visual stimulus and patterns of activity in the
21

Brace et al
locomotor activity monitoring chambers does not support this and, therefore, we suggest that
neither of these factors confounded our results.
Also in line with previous studies (Gowan et al., 2008, Clements et al., 2014) we recorded
complex LFP responses in the superficial layers of the SC in response to whole field light
flashes. These LFP responses had an onset latency that varied from 58-80 ms in the SHR, 55-
80 ms in the WKY and 53-77 ms in the WIS, with the fastest latencies for all strains at the
higher intensity stimulus, consistent with other studies (Dyer and Annau, 1977, Clements et
al., 2014). Similarly, the peak-to-peak amplitude at the highest stimulus intensity (105-135
µV; see Figure 3) was in line with previous work (Clements et al., 2014). The duration of the
LFP response at the highest intensity for the SHR (mean = 223 ms) and WIS (mean =229 ms)
rats was also consistent with previous studies (Gowan et al., 2008, Clements et al., 2014),
although the duration of response in WKY (mean = 372 ms) was significantly longer than the
other two strains. Interestingly, there were no significant differences between the SHR and
both the WIS and WKY for any parameters for the LFP responses, which suggests that the
SHR did not differ from control strains in terms of the visual information entering the
colliculus, which would likely be seen in a change to the LFP response, as the LFP response
is best described as representing ‘peri-synaptic activity’, which includes post-synaptic
potentials (Logothetis, 2008, Ekstrom, 2010). This finding is in direct contrast to the results
of a similar study on the New Zealand GH rat, which is also a proposed, but not yet widely-
validated, model of ADHD. Clements et al. (Clements et al., 2014) found increased visual
LFPs in the GH rat at a range of stimulus intensities. Although we did not find increased LFP
responses in the SHR, we did find that the SHR were more likely to produce a multiunit
response than both control strains for lower stimulus intensities. Furthermore, the amplitude
of the response tended to be greater in the SHR at moderate intensities. It is likely that a
ceiling effect prevented this remaining at the higher intensities. SHR responses also showed
22

Brace et al
delayed onset latency, relative to both other strains. These multiunit responses are partially
consistent with Clements et al. (Clements et al., 2014) because they also reported an increase
in multiunit responses in the GH rat, however, they found reduced latency (albeit peak rather
than onset). The selective increase in spiking (mulitiunit) activity rather than LFP responses
in the SHR suggests that any alteration to function is confined to the SC itself rather than
being the result of these local changes combined with an alteration in afferent driving as may
be the case in the GH rat. Furthermore, a delayed response onset is consistent with ADHD
being a developmental disorder because it is known that during development transmission
within the retinocollicluar pathway increases in speed, giving quicker onset latencies within
the SC as this system develops (Reece and Lim, 1998, Crognale et al., 2001). It is also in line
with the observation of significantly longer saccade latencies in visually guided saccades
(Mahone et al., 2009, Goto et al., 2010), memory guided saccades (Goto et al., 2010),
prosaccades (Klein et al., 2003, Munoz et al., 2003), and antisaccades (Munoz et al., 2003,
Feifel et al., 2004, Karatekin, 2006) that has been reported in children with ADHD.
Critically, using recent theories about how specific motor activities are selected, it is possible
speculate that in the present study the observed behavioural differences between SHR and the
control strains could be directly underpinned by the increased multiunit activity found in the
SC. It has been suggested that the SC, amongst other structures, is capable of specifying
actions by putting ‘bids’ into the central selection device, thought to be the basal ganglia
(Redgrave et al., 1999). There are a number of routes in which information can travel from
the superficial layers of the SC to basal ganglia nuclei (Redgrave et al., 2010). For example,
the superficial SC innervates areas of the thalamus that provide the major afferents to the
striatum and subthalamic nucleus (STN). These same basal ganglia nuclei can also receive
information from the superficial layers via the deep layers of the SC (Takada et al., 1985,
Feger et al., 1994, Van der Werf et al., 2002). In addition, the superficial layers also have a
23

Brace et al
direct tecto-nigral pathway to midbrain dopaminergic cells which provide an important input
to the basal ganglia (Comoli et al., 2003). The deeper layers of the SC also have a direct
connection to the STN (Tokuno et al., 1994, Coizet et al., 2009) which can convey
information from the superficial SC to the STN. Therefore, heightened activity within the SC
may have the effect of strengthening the bid to the basal ganglia and increasing the likelihood
of the bid ‘winning’ over competing action choices and generating an output, such as
orienting towards a stimulus (Grantyn et al., 2004). Such an increased tendency to respond
would result in an increase in distractibility.
We found no difference in the volume fraction of the superficial layers of the SC or in the cell
density of neurons and glia within these layers. However, we did find a significant difference
in the glia:neuron ratio, with the SHR having a lower ratio, meaning that there were fewer
glia for the number of neurons present than in the WKY. This is supported by the cell count
data, although it must be recognised that cell count data alone is limited when there are
differences in absolute brain volume. Although these findings are preliminary and warrant
further investigation, it is possible to speculate about why they may occur in the SHR and
how they could contribute to the increased sensory responsiveness found in the SHR.
Glial cells fulfil a broad range of functions and astrocytes in particular participate in a
number of interactions that are central to the development, function, and repair of the CNS
(Theodosis et al., 2008). They control synapse formation and modulating synaptic activity,
responding to and modulating neural activity and responding to sensory stimuli (Herculano-
Houzel, 2014). Glia:neuron ratios have received significant attention in recent years and there
is now evidence that the ratio increases with the size of neurons rather than the size of the
brain as originally believed (Herculano-Houzel, 2014). Two main theories have been
suggested as to why the ratio would increase with neuron size. Firstly, it has suggested that
24

Brace et al
increased neuronal size means increased metabolic demands (Hawkins and Olszewski, 1957),
however, data do not support an energy demand model (Herculano-Houzel, 2011). Secondly,
it is suggested that the proliferation of glial cells which takes place during postnatal
development (Brizzee, 1964), gives rise to a relatively uniform density of glial cells across
the brain, the glia:neuron density being largely determined by size (and hence density) of
neurons in each structure. A lower ratio in the SHR could therefore suggest smaller neuronal
cells in the superficial layers of the colliculus in this strain, which should be investigated in
future, along with determining ratio by volume, which is often deemed more useful than a
count ratio (Herculano-Houzel, 2014). Another possibility is that normal development,
featuring postnatal proliferation of glial cells in the second and third postnatal weeks in rat
(Bandeira et al., 2009), is delayed or deficient in the SHR, which is in line with the modelled
condition being a developmental disorder. Although this is the first study to report differences
in glia:neuron ratio in the SHR and the technique used in the present study does not allow us
to discriminate between types of glia, alterations in astrocytic function has been purported to
be critical in ADHD (Todd and Botteron, 2001, Killeen et al., 2013), with reduced neural
energy available, which would be in line with a decrease in glia:neuron ratio. In addition, the
psychostimulants used in the treatments of the disorder have been found to increase astrocyte
activation (Bahcelioglu et al., 2009, Narita et al., 2009). A reduction in glia:neuron ratio may
reduce energy available for neuronal responses, but it is also likely to impact directly on
glutamatergic neurotransmission within the colliculus. One possible way in which it could do
this is via Group II mGluR2/3 which have been found to be present on astrocytes within the
superficial SC (Cirone et al., 2002a, Cirone et al., 2002b). Activation of these receptors is
known to modulate visual responsiveness. Therefore, if fewer receptors are present due to
reduced glial cells then, visual responsiveness may be altered. Petralia et al. (Petralia et al.,
1996) found that mGluR3 are located at synapse wrappings on glial cells and function to
25

Brace et al
enhance the efficiency of glutamate conversion to glutamine and therefore to terminate
glutamate transmission. If there are few glial cells and therefore mGluR3 receptors fulfilling
this function then it is plausible that enhanced visual responses would be found. Certainly
expression of these receptors in the colliculus of the SHR should be further investigated.
5. Conclusion
In summary, the present study has demonstrated increased distractible behaviour in the SHR
model of ADHD, with reference to two control strains. In addition, we have proposed a
plausible physiological basis for this behaviour in the form of increased collicular visual
responsiveness. The exact cause of this increased responsiveness has yet to be determined,
however, the current study points towards a role for glial-mediated effects.
Acknowledgments
The authors would like to thank Steve Walters, Agata Stramek and Karen Evans for their
technical support and care of the animals and Jackie Brown and Paul Gabbott for advice and
guidance on histological techniques. This work was supported by a PhD studentship provided
by the Biomedical Research Network at the Open University. The funder was not involved in
the study design; data collection, analysis and interpretation of data or in the writing this
report.
Financial Disclosures
This work was supported by a PhD studentship provided by the Biomedical Research
Network at the Open University.
References
26
Brace et al
Agmo A, Belzung C, Rodriguez C (1997) A rat model of distractibility: effects of drugs modifying dopaminergic, noradrenergic and GABAergic neurotransmission. J Neural Transm 104:11-29.
APA (2013) Diagnostic and statistical manual of mental disorders. Washington, DC Bahcelioglu M, Gozil R, Take G, Elmas C, Oktem H, Kadioglu D, Calguner E, Erdogan D,
Sargon MF, Yazici AC, Tas M, Bardakci Y, Senol S (2009) Dose-related immunohistochemical and ultrastructural changes after oral methylphenidate administration in cerebrum and cerebellum of the rat. The world journal of biological psychiatry : the official journal of the World Federation of Societies of Biological Psychiatry 10:531-543.
Bandeira F, Lent R, Herculano-Houzel S (2009) Changing numbers of neuronal and non-neuronal cells underlie postnatal brain growth in the rat. Proceedings of the National Academy of Sciences of the United States of America 106:14108-14113.
Barkley RA, Grodzinsky G, DuPaul GJ (1992) Frontal lobe functions in attention deficit disorder with and without hyperactivity: a review and research report. Journal of abnormal child psychology 20:163-188.
Barkley RA, Ullman DG (1975) A comparison of objective measures of activity and distractibility in hyperactive and nonhyperactive children. Journal of abnormal child psychology 3:231-244.
Bayless DW, Perez MC, Daniel JM (2015) Comparison of the validity of the use of the spontaneously hypertensive rat as a model of attention deficit hyperactivity disorder in males and females. Behavioural brain research 286:85-92.
Berger DF, Sagvolden T (1998) Sex differences in operant discrimination behaviour in an animal model of attention-deficit hyperactivity disorder. Behavioural brain research 94:73-82.
Biederman J (2005) Attention-deficit/hyperactivity disorder: a selective overview. Biol Psychiatry 57:1215-1220.
Biederman J, Faraone SV (2005) Attention-deficit hyperactivity disorder. Lancet 366:237-248.
Brizzee KR (1964) Effects of Single and Fractionated Doses of Total Body X-Irradiation in Utero on Growth of the Brain and Its Parts. Nature 202:262-264.
Brown CS, Cooke SC (1994) Attention deficit hyperactivity disorder. Clinical features and treatment options. CNS Drugs 1:95-106.
Cirone J, Pothecary CA, Turner JP, Salt TE (2002a) Group I metabotropic glutamate receptors (mGluRs) modulate visual responses in the superficial superior colliculus of the rat. The Journal of physiology 541:895-903.
Cirone J, Sharp C, Jeffery G, Salt TE (2002b) Distribution of metabotropic glutamate receptors in the superior colliculus of the adult rat, ferret and cat. Neuroscience 109:779-786.
Clements KM, Devonshire IM, Reynolds JN, Overton PG (2014) Enhanced visual responses in the superior colliculus in an animal model of attention-deficit hyperactivity disorder and their suppression by D-amphetamine. Neuroscience 274:289-298.
Coizet V, Comoli E, Westby GW, Redgrave P (2003) Phasic activation of substantia nigra and the ventral tegmental area by chemical stimulation of the superior colliculus: an electrophysiological investigation in the rat. The European journal of neuroscience 17:28-40.
Coizet V, Graham JH, Moss J, Bolam JP, Savasta M, McHaffie JG, Redgrave P, Overton PG (2009) Short-latency visual input to the subthalamic nucleus is provided by the midbrain superior colliculus. The Journal of neuroscience : the official journal of the Society for Neuroscience 29:5701-5709.
27

Brace et al
Comoli E, Coizet V, Boyes J, Bolam JP, Canteras NS, Quirk RH, Overton PG, Redgrave P (2003) A direct projection from superior colliculus to substantia nigra for detecting salient visual events. Nature neuroscience 6:974-980.
Cotter D, Mackay D, Chana G, Beasley C, Landau S, Everall IP (2002) Reduced neuronal size and glial cell density in area 9 of the dorsolateral prefrontal cortex in subjects with major depressive disorder. Cerebral cortex 12:386-394.
Crognale MA, Page JW, Fuhrel A (2001) Aging of the chromatic onset visual evoked potential. Optometry and vision science : official publication of the American Academy of Optometry 78:442-446.
Dean P, Redgrave P, Westby GW (1989) Event or emergency? Two response systems in the mammalian superior colliculus. Trends in neurosciences 12:137-147.
Dervola KS, Roberg BA, Woien G, Bogen IL, Sandvik TH, Sagvolden T, Drevon CA, Johansen EB, Walaas SI (2012) Marine Omicron-3 polyunsaturated fatty acids induce sex-specific changes in reinforcer-controlled behaviour and neurotransmitter metabolism in a spontaneously hypertensive rat model of ADHD. Behavioral and brain functions : BBF 8:56.
Devonshire IM, Preston MJ, Dommett EJ, Murphy KL, Greenfield SA (2009) Design and evaluation of a low-cost respiratory monitoring device for use with anaesthetized animals. Laboratory animals 43:382-389.
Dommett E, Coizet V, Blaha CD, Martindale J, Lefebvre V, Walton N, Mayhew JE, Overton PG, Redgrave P (2005) How visual stimuli activate dopaminergic neurons at short latency. Science 307:1476-1479.
Dommett EJ, Rostron CL (2011) Abnormal air righting behaviour in the spontaneously hypertensive rat model of ADHD. Experimental brain research 215:45-52.
Douglas V (1983) In: Developmental Neuropsychiatry (M, R., ed), pp 280-329 New York: Guildford Press.
Drolet G, Proulx K, Pearson D, Rochford J, Deschepper CF (2002) Comparisons of behavioral and neurochemical characteristics between WKY, WKHA, and Wistar rat strains. Neuropsychopharmacology 27:400-409.
Dyer RS, Annau Z (1977) Flash evoked potentials from rat superior colliculus. Pharmacology, biochemistry, and behavior 6:453-459.
Ekstrom A (2010) How and when the fMRI BOLD signal relates to underlying neural activity: the danger in dissociation. Brain research reviews 62:233-244.
Feger J, Bevan M, Crossman AR (1994) The projections from the parafascicular thalamic nucleus to the subthalamic nucleus and the striatum arise from separate neuronal populations: a comparison with the corticostriatal and corticosubthalamic efferents in a retrograde fluorescent double-labelling study. Neuroscience 60:125-132.
Feifel D, Farber RH, Clementz BA, Perry W, Anllo-Vento L (2004) Inhibitory deficits in ocular motor behavior in adults with attention-deficit/hyperactivity disorder. Biol Psychiatry 56:333-339.
Ferguson SA, Gray EP, Cada AM (2003) Early behavioral development in the spontaneously hypertensive rat: a comparison with the Wistar-Kyoto and Sprague-Dawley strains. Behavioral neuroscience 117:263-270.
Gaymard B, Francois C, Ploner CJ, Condy C, Rivaud-Pechoux S (2003) A direct prefrontotectal tract against distractibility in the human brain. Annals of neurology 53:542-545.
Goodale MA, Foreman NP, Milner AD (1978) Visual orientation in the rat: a dissociation of deficits following cortical and collicular lesions. Exp Brain Res 31:445-457.
28

Brace et al
Goto Y, Hatakeyama K, Kitama T, Sato Y, Kanemura H, Aoyagi K, Sugita K, Aihara M (2010) Saccade eye movements as a quantitative measure of frontostriatal network in children with ADHD. Brain & development 32:347-355.
Gowan JD, Coizet V, Devonshire IM, Overton PG (2008) D-amphetamine depresses visual responses in the rat superior colliculus: a possible mechanism for amphetamine-induced decreases in distractibility. J Neural Transm 115:377-387.
Grantyn A, Moschovakis AK, Kitama T (2004) Control of orienting movements: role of multiple tectal projections to the lower brainstem. Progress in brain research 143:423-438.
Guedel A (1920) Signs of inhalational anesthesia. In: Inhalational Anesthesia A Fundamental Guide (AE., G., ed), pp 10-52 New York: Macmillan.
Halliday R, Gregory K, Naylor H, Callaway E, Yano L (1990) Beyond drug effects and dependent variables: the use of the Poisson-Erlang model to assess the effects of D-amphetamine on information processing. Acta Psychol (Amst) 73:35-54.
Hawkins A, Olszewski J (1957) Glia/nerve cell index for cortex of the whale. Science 126:76-77.
Hendley ED, Wessel DJ, Atwater DG, Gellis J, Whitehorn D, Low WC (1985) Age, sex and strain differences in activity and habituation in SHR and WKY rats. Physiology & behavior 34:379-383.
Herculano-Houzel S (2011) Scaling of brain metabolism with a fixed energy budget per neuron: implications for neuronal activity, plasticity and evolution. PloS one 6:e17514.
Herculano-Houzel S (2014) The glia/neuron ratio: how it varies uniformly across brain structures and species and what that means for brain physiology and evolution. Glia 62:1377-1391.
Ignashchenkova A, Dicke PW, Haarmeier T, Thier P (2004) Neuron-specific contribution of the superior colliculus to overt and covert shifts of attention. Nature neuroscience 7:56-64.
Ingle D (1973) Evolutionary perspectives on the function of the optic tectum. Brain, behavior and evolution 8:211-237.
Johansen EB, Fonnum F, Lausund PL, Walaas SI, Baerland NE, Woien G, Sagvolden T (2014) Behavioral changes following PCB 153 exposure in the spontaneously hypertensive rat - an animal model of Attention-Deficit/Hyperactivity Disorder. Behavioral and brain functions : BBF 10:1.
Karatekin C (2006) Improving antisaccade performance in adolescents with attention-deficit/hyperactivity disorder (ADHD). Experimental brain research 174:324-341.
Katyal S, Zughni S, Greene C, Ress D (2010) Topography of covert visual attention in human superior colliculus. Journal of neurophysiology 104:3074-3083.
Killeen PR, Russell VA, Sergeant JA (2013) A behavioral neuroenergetics theory of ADHD. Neuroscience and biobehavioral reviews 37:625-657.
Klein CH, Raschke A, Brandenbusch A (2003) Development of pro- and antisaccades in children with attention-deficit hyperactivity disorder (ADHD) and healthy controls. Psychophysiology 40:17-28.
Knutson B, Momenan R, Rawlings RR, Fong GW, Hommer D (2001) Negative association of neuroticism with brain volume ratio in healthy humans. Biol Psychiatry 50:685-690.
Logothetis NK (2008) What we can do and what we cannot do with fMRI. Nature 453:869-878.
Mahone EM, Mostofsky SH, Lasker AG, Zee D, Denckla MB (2009) Oculomotor anomalies in attention-deficit/hyperactivity disorder: evidence for deficits in response
29

Brace et al
preparation and inhibition. Journal of the American Academy of Child and Adolescent Psychiatry 48:749-756.
Milner AD, Foreman NP, Goodale MA (1978) Go-left go-right discrimination performance and distractibility following lesions of prefrontal cortex or superior colliculus in stumptail macaques. Neuropsychologia 16:381-390.
Munoz DP, Armstrong IT, Hampton KA, Moore KD (2003) Altered control of visual fixation and saccadic eye movements in attention-deficit hyperactivity disorder. Journal of neurophysiology 90:503-514.
Narita M, Asato M, Shindo K, Kuzumaki N, Suzuki T (2009) [Differences in neuronal toxicity and its molecular mechanisms between methamphetamine and methylphenidate]. Nihon shinkei seishin yakurigaku zasshi = Japanese journal of psychopharmacology 29:115-120.
O'Driscoll GA, Depatie L, Holahan AL, Savion-Lemieux T, Barr RG, Jolicoeur C, Douglas VI (2005) Executive functions and methylphenidate response in subtypes of attention-deficit/hyperactivity disorder. Biol Psychiatry 57:1452-1460.
Paxinos G, Watson C (1998) The Rat Brain Atlas in Stereotaxical Coordinates. Academic Press.
Pellis SM, Pellis VC, Morrissey TK, Teitelbaum P (1989) Visual modulation of vestibularly-triggered air-righting in the rat. Behavioural brain research 35:23-26.
Pellis SM, Whishaw IQ, Pellis VC (1991) Visual modulation of vestibularly-triggered air-righting in rats involves the superior colliculus. Behavioural brain research 46:151-156.
Petralia RS, Wang YX, Niedzielski AS, Wenthold RJ (1996) The metabotropic glutamate receptors, mGluR2 and mGluR3, show unique postsynaptic, presynaptic and glial localizations. Neuroscience 71:949-976.
Raz N, Dupuis JH, Briggs SD, McGavran C, Acker JD (1998) Differential effects of age and sex on the cerebellar hemispheres and the vermis: a prospective MR study. AJNR American journal of neuroradiology 19:65-71.
Redgrave P, Coizet V, Comoli E, McHaffie JG, Leriche M, Vautrelle N, Hayes LM, Overton P (2010) Interactions between the Midbrain Superior Colliculus and the Basal Ganglia. Frontiers in neuroanatomy 4.
Redgrave P, Prescott TJ, Gurney K (1999) The basal ganglia: a vertebrate solution to the selection problem? Neuroscience 89:1009-1023.
Reece LJ, Lim CH (1998) Onset of optic nerve conduction and synaptic potentials in superior colliculus of fetal rats studied in vitro. Brain research Developmental brain research 106:25-38.
Rizzolatti G, Riggio L, Dascola I, Umilta C (1987) Reorienting attention across the horizontal and vertical meridians: evidence in favor of a premotor theory of attention. Neuropsychologia 25:31-40.
Robinson AM, Bucci DJ (2014) Individual and combined effects of physical exercise and methylphenidate on orienting behavior and social interaction in spontaneously hypertensive rats. Behavioral neuroscience 128:703-712.
Sagvolden T, Johansen EB, Aase H, Russell VA (2005) A dynamic developmental theory of attention-deficit/hyperactivity disorder (ADHD) predominantly hyperactive/impulsive and combined subtypes. The Behavioral and brain sciences 28:397-419; discussion 419-368.
Sagvolden T, Johansen EB, Woien G, Walaas SI, Storm-Mathisen J, Bergersen LH, Hvalby O, Jensen V, Aase H, Russell VA, Killeen PR, Dasbanerjee T, Middleton FA, Faraone SV (2009) The spontaneously hypertensive rat model of ADHD--the importance of selecting the appropriate reference strain. Neuropharmacology 57:619-626.
30

Brace et al
Solanto MV (2002) Dopamine dysfunction in AD/HD: integrating clinical and basic neuroscience research. Behavioural brain research 130:65-71.
Spencer T, Biederman J, Wilens T, Faraone S, Prince J, Gerard K, Doyle R, Parekh A, Kagan J, Bearman SK (2001) Efficacy of a mixed amphetamine salts compound in adults with attention-deficit/hyperactivity disorder. Arch Gen Psychiatry 58:775-782.
Spencer TJ, Biederman J, Wilens TE, Faraone SV (2002) Overview and neurobiology of attention-deficit/hyperactivity disorder. J Clin Psychiatry 63 Suppl 12:3-9.
Sprague JM, Meikle TH, Jr. (1965) The Role Of The Superior Colliculus In Visually Guided Behavior. Exp Neurol 11:115-146.
Swanson JM, Posner M, Potkin S, Bonforte S, Youpa D, Fiore C, Cantwell D, Crinella F (1991) Activating tasks for the study of visual-spatial attention in ADHD children: a cognitive anatomic approach. Journal of child neurology 6 Suppl:S119-127.
Takada M, Itoh K, Yasui Y, Sugimoto T, Mizuno N (1985) Topographical projections from the posterior thalamic regions to the striatum in the cat, with reference to possible tecto-thalamo-striatal connections. Experimental brain research 60:385-396.
Theodosis D, Poulain D, Oliet S (2008) Activity-Dependent Structural and Functional Plasticity of Astrocyte-Neuron Interactions. Physiological Reviews 88:983-1008.
Thorley G (1984) Hyperkinetic syndrome of childhood: clinical characteristics. Br J Psychiatry 144:16-24.
Todd RD, Botteron KN (2001) Is attention-deficit/hyperactivity disorder an energy deficiency syndrome? Biol Psychiatry 50:151-158.
Tokuno H, Takada M, Ikai Y, Mizuno N (1994) Direct projections from the deep layers of the superior colliculus to the subthalamic nucleus in the rat. Brain research 639:156-160.
van den Bergh FS, Bloemarts E, Chan JS, Groenink L, Olivier B, Oosting RS (2006) Spontaneously hypertensive rats do not predict symptoms of attention-deficit hyperactivity disorder. Pharmacology, biochemistry, and behavior 83:380-390.
Van der Werf YD, Witter MP, Groenewegen HJ (2002) The intralaminar and midline nuclei of the thalamus. Anatomical and functional evidence for participation in processes of arousal and awareness. Brain research Brain research reviews 39:107-140.
Viggiano D, Ruocco LA, Sadile AG (2003a) Dopamine phenotype and behaviour in animal models: in relation to attention deficit hyperactivity disorder. Neuroscience and biobehavioral reviews 27:623-637.
Viggiano D, Vallone D, Ruocco LA, Sadile AG (2003b) Behavioural, pharmacological, morpho-functional molecular studies reveal a hyperfunctioning mesocortical dopamine system in an animal model of attention deficit and hyperactivity disorder. Neuroscience and biobehavioral reviews 27:683-689.
Wender PH (1973) Some speculations concerning a possible biochemical basis of minimal brain dysfunction. Annals of the New York Academy of Sciences 205:18-28.
Yan X, Okito K, Yamaguchi T (2010) Effects of superior colliculus ablation on the air-righting reflex in the rat. J Physiol Sci 60:129-136.
31

Brace et al
Measure StrainSHR WIS WKY
Orienting task and general activity 400±11(N=9)
448±10(N=8)
466±14(N=9)
Recordings of visual responses from superficial colliculus
396±6(N=27)
490±13(N=30)
400±9(N=29)
Morphology: Collicular volume 397±16(N=4)
485±29(N=4)
431±28(N=4)
Morphology: Collicular cell densities and ratios
414±16(N=6)
456±19(N=5)
410±28(N=6)
Table 1
Local Field Potential ResponsesStimulus intensity (mcd)
Percentage responding Strain – responsiveness associationSHR (n=27) WIS (n=30) WKY (n=29) χ2 (df=2) Significance
4 70.4 50.0 48.4 5.05 0.2828 75.9 73.3 61.3 1.75 0.41612 92.6 76.7 79.3 2.82 0.24416 100 96.7 96.6 0.99 0.62620 100 100 100 N/AMultiunit Activity ResponsesStimulus intensity (mcd)
Percentage of animals responding Strain – responsiveness associationSHR (n=27) WIS (n=30) WKY (n=29) χ2 (df=2) Significance
4 70.4 30.0 37.9 10.32 0.0068 75.9 43.3 51.7 9.24 0.01012 100 73.3 89.7 9.29 0.01016 100 93.3 96.6 1.88 0.39120 100 100 100 N/A
Table 2
32

Brace et al
Figure 1
Figure 2
Figure 3
33

Brace et al
Figure 4
34
Brace et al
Figure 5
Figure 6
35
Brace et al
Figure 7
36

Brace et al
37