Embed Size (px)
Citation preview
January 14, 2009
Alternate Level of Care in Canada
1 Introduction Most Canadians have never heard the phrase “alternate level of care,” or ALC. Yet since the mid-1980s, the public consciousness has embraced the idea that hospital beds are being occupied by patients who no longer need acute services, using limited, expensive resources while they wait to be discharged to a more appropriate setting. These non-acute hospital days are captured in hospitalization data as patients awaiting an alternate level of care (or ALC patients).
There is increasing concern that the ALC issue is growing and negatively affecting an already-taxed hospital system.1, 2 Some work has been done to improve continuity of care for patients as they transition out of acute care and into other parts of the health care system.3–5 In many cases, solutions to help reduce ALC stays in hospitals require collaboration from different sectors of the health care system, including community care and long-term care.1, 3–5
From a policy perspective, it is important to understand if the health care system has sufficient capacity to provide necessary care in the most appropriate setting. If capacity in community and long-term care is increased, will the overall cost to the health care system be reduced? Uncovering how ALC is being used in acute settings may inform discussions on these important health system questions.
This report is an initial look at the extent of the ALC challenge in hospitals. Understanding the patients who are most likely to be designated ALC and the type of care they are waiting for may help to improve care and reduce the ALC burden on acute hospitals. Although the ALC concept is also applied to other sectors such as rehabilitation facilities and hospital-based chronic care,1, 6 this report focuses only on ALC days that occur in acute care facilities.
2
How Is ALC Measured?
Standardized collection of ALC data was introduced in 1989 in an effort to isolate true acute cases in the Discharge Abstract Database (DAD).7 DAD guidelines state that ALC status depends on a medical decision that the patient does not require further acute care services. This decision must be made by an attending physician or authorized hospital designate and documented with a date on the patient’s chart.
In this report, ALC information is summarized in two ways: hospitalizations and days. ALC hospitalizations are those where at least one ALC day was recorded. Note that transfers between acute hospitals were considered part of a single hospitalization (see Technical Notes for additional detail). ALC days were calculated by summing the number of days spent in hospital that were designated as ALC.
Although individual patients may have had more than one hospitalization in a year, for simplicity, we use the terms “ALC patients” and “ALC hospitalizations” interchangeably.
2 Can the ALC Data Be Trusted? Despite data collection since 1989, the ALC measure has not been extensively used for comparative reporting, primarily because there have been concerns about data quality. Questions have been raised about the consistency with which patients are identified as ALC, as well as the point in the hospital stay when the ALC diagnosis is coded.
Our review of ALC data shows that the data quality, while not without limitations, is sufficient to paint a picture of ALC across the country and contribute to discussions on appropriate care for ALC patients. When reviewing the findings, it is helpful to understand the known limitations of the data. Notably, there is wide variation among hospitals on the proportions of ALC hospitalizations and days. Quebec data are not available in the DAD. In Manitoba, rehabilitation beds began to be systematically coded as ALC in 2006–2007. For this reason, we excluded Quebec and Manitoba hospitalizations from our analyses. Aside from these provinces, variation still exists; however, it is unclear to what extent this reflects real differences in patient care or differences in data collection. Some hospitals have extreme values. We found two types of hospitals that do not record ALC days: specialty elective surgical facilities and children’s hospitals. We would not expect a high use of ALC days in elective surgical facilities because patients are admitted for planned, specific procedures. In children’s hospitals, ALC data are not collected because the concept of ALC in children is not widely accepted. To address some of this known systematic variation, we excluded pediatric patients (refer to the Technical Notes for further details on exclusions). In addition, there are facilities with high proportions of ALC days. A small number report more than half of their days as ALC. Some of these facilities may have designated ALC units. These limitations prompted us to present many of our findings at an aggregate level.
3
Reabstraction studies, based on patient charts, show that the reliability of ALC coding is 100%.8 However, this finding does not tell us how accurately ALC is recorded in the chart to begin with. There is little concern about ALC being over-reported; there is greater concern that ALC may be under-reported. Health care providers indicate that knowing when a patient should be officially designated as ALC is difficult, thus potentially affecting the estimates for ALC days.1
One way of estimating under-reporting is to look at groups of patients whom we would expect to be ALC but have no ALC days reported. For example, we might expect patients with long stays who are eventually discharged to a non-acute facility (long-term care, rehabilitation) to be designated ALC. The data show that while most are ALC, others are not. In 2007–2008, if all of these patients were counted as ALC, an additional 5,616 hospitalizations (8% of the total) would be added to ALC counts.
While there are limitations, it is important to begin using and analyzing ALC data, which measure an important concept that can inform health care policy. CIHI is working collaboratively with hospitals and health regions to improve the data. As the data are used and explored, data quality and comparability are likely to improve.
3 The ALC Picture Hospitalization data show that ALC cases present a sizeable challenge for the hospital system. In 2007–2008, there were more than 74,000 ALC hospitalizations and more than 1.7 million ALC days outside of Quebec and Manitoba. To improve our ability to make meaningful comparisons, we removed obstetric patients as well as pediatric patients from the analysis because they had distinctive demographic profiles and few reported ALC days. For other exclusions, please see the Technical Notes.
ALC patients accounted for 5% of hospitalizations and 14% of hospital days in acute facilities. This means that, on any given day, almost 5,200 beds in acute care hospitals were occupied by ALC patients.
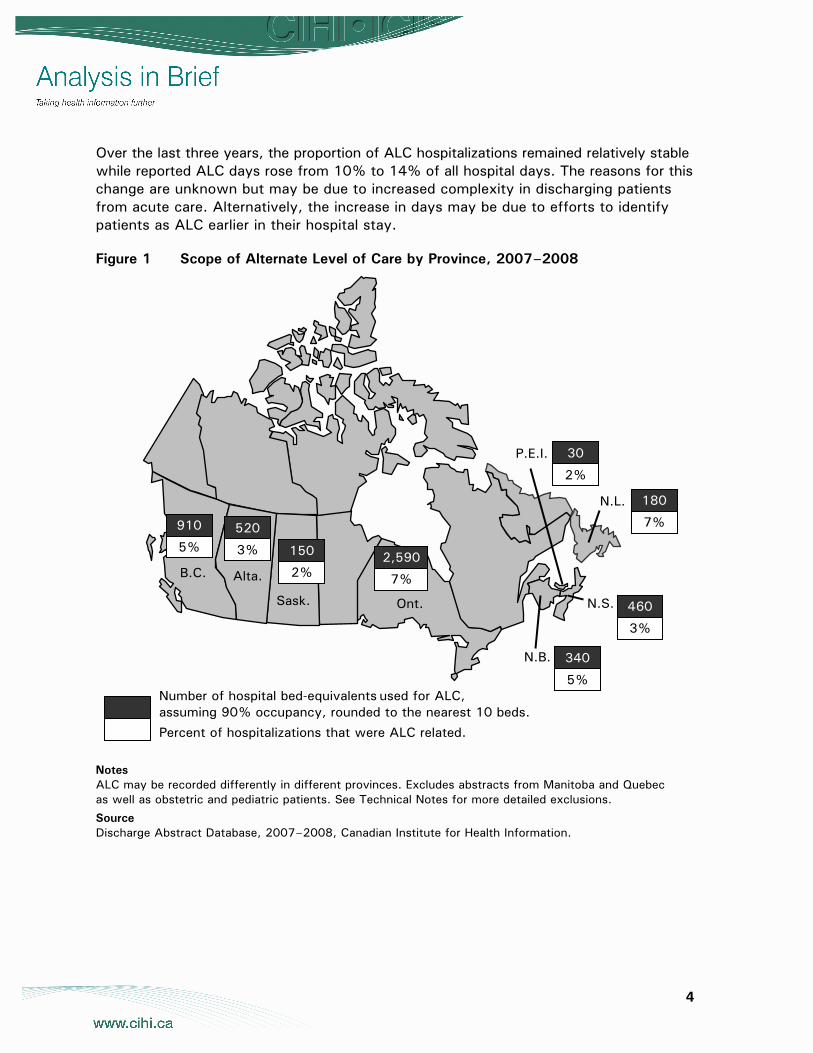
Of the provinces included in the analysis, Saskatchewan and Prince Edward Island had the lowest ALC rate in 2007–2008, at 2% of hospitalizations. On the higher end, 7% of hospitalizations in Ontario and Newfoundland and Labrador were ALC. The sources of this variation are not well understood. Differences in funding and available system capacity for different kinds of care may account for some of the variation. However, in addition to differences in patient care, ALC variation may arise from differences in documentation and data collection.
4
Over the last three years, the proportion of ALC hospitalizations remained relatively stable while reported ALC days rose from 10% to 14% of all hospital days. The reasons for this change are unknown but may be due to increased complexity in discharging patients from acute care. Alternatively, the increase in days may be due to efforts to identify patients as ALC earlier in their hospital stay.
Figure 1 Scope of Alternate Level of Care by Province, 2007–2008
Notes ALC may be recorded differently in different provinces. Excludes abstracts from Manitoba and Quebec as well as obstetric and pediatric patients. See Technical Notes for more detailed exclusions.
Source Discharge Abstract Database, 2007–2008, Canadian Institute for Health Information.
B.C. Alta.
Sask. Ont.
N.L.
P.E.I.
N.B.
N.S. 460
3%
340
5%
180
7%
30
2%
2,590
7%
150
2%
520
3%
910
5%
Number of hospital bed-equivalents used for ALC, assuming 90% occupancy, rounded to the nearest 10 beds.
Percent of hospitalizations that were ALC related.
5
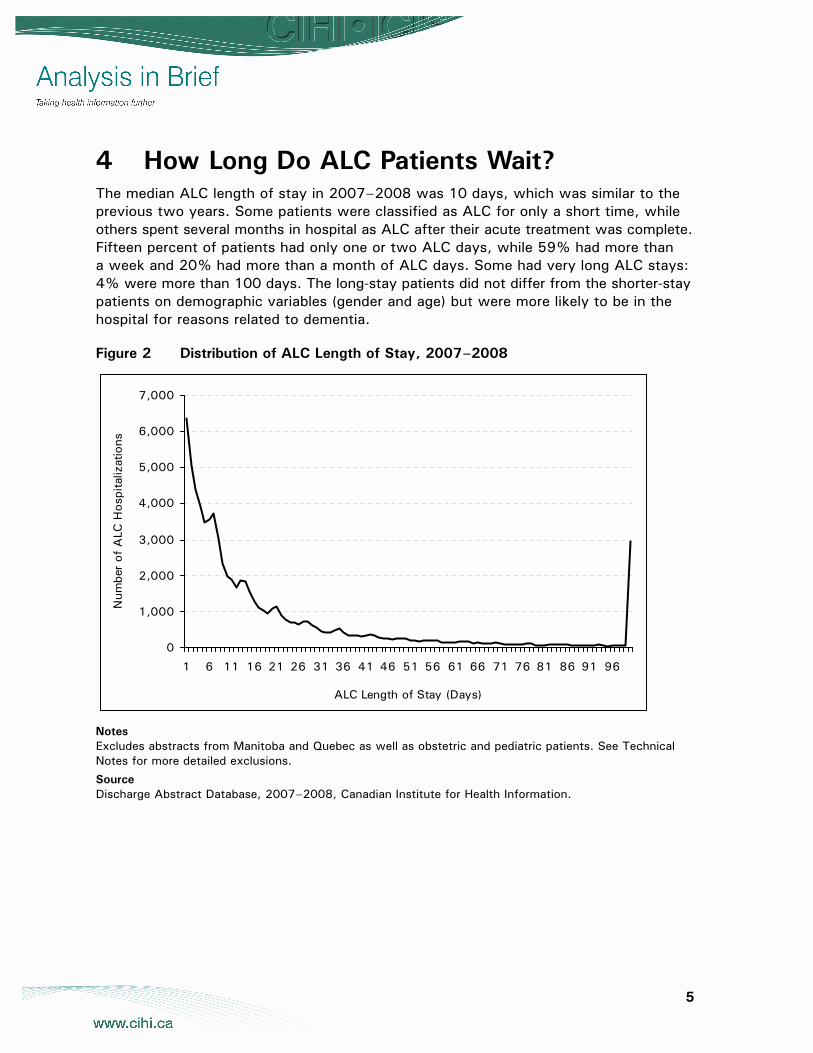
4 How Long Do ALC Patients Wait? The median ALC length of stay in 2007–2008 was 10 days, which was similar to the previous two years. Some patients were classified as ALC for only a short time, while others spent several months in hospital as ALC after their acute treatment was complete. Fifteen percent of patients had only one or two ALC days, while 59% had more than a week and 20% had more than a month of ALC days. Some had very long ALC stays: 4% were more than 100 days. The long-stay patients did not differ from the shorter-stay patients on demographic variables (gender and age) but were more likely to be in the hospital for reasons related to dementia.
Figure 2 Distribution of ALC Length of Stay, 2007–2008
0
1,000
2,000
3,000
4,000
5,000
6,000
7,000
1 6 11 16 21 26 31 36 41 46 51 56 61 66 71 76 81 86 91 96
ALC Length of Stay (Days)
Num
ber
of A
LC H
ospi
taliz
atio
ns
Notes Excludes abstracts from Manitoba and Quebec as well as obstetric and pediatric patients. See Technical Notes for more detailed exclusions.
Source Discharge Abstract Database, 2007–2008, Canadian Institute for Health Information.
6
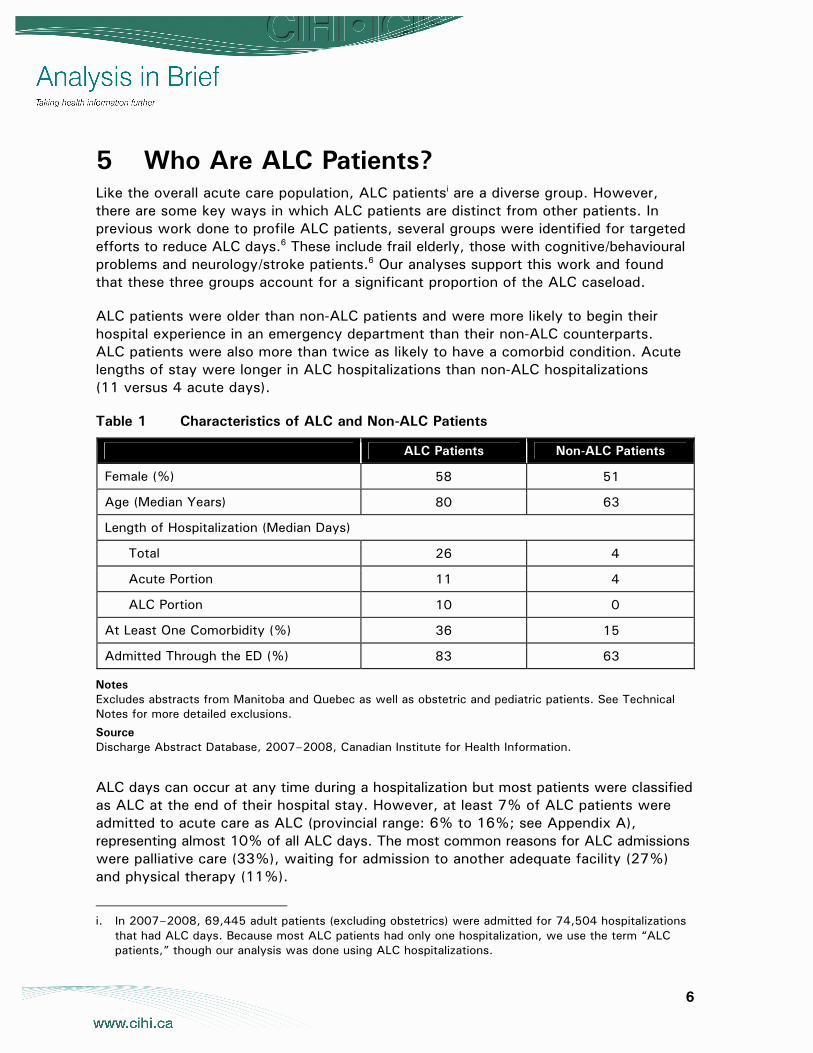
5 Who Are ALC Patients? Like the overall acute care population, ALC patientsi are a diverse group. However, there are some key ways in which ALC patients are distinct from other patients. In previous work done to profile ALC patients, several groups were identified for targeted efforts to reduce ALC days.6 These include frail elderly, those with cognitive/behavioural problems and neurology/stroke patients.6 Our analyses support this work and found that these three groups account for a significant proportion of the ALC caseload.
ALC patients were older than non-ALC patients and were more likely to begin their hospital experience in an emergency department than their non-ALC counterparts. ALC patients were also more than twice as likely to have a comorbid condition. Acute lengths of stay were longer in ALC hospitalizations than non-ALC hospitalizations (11 versus 4 acute days).
Table 1 Characteristics of ALC and Non-ALC Patients
ALC Patients Non-ALC Patients
Female (%) 58 51
Age (Median Years) 80 63
Length of Hospitalization (Median Days)
Total 26 4
Acute Portion 11 4
ALC Portion 10 0
At Least One Comorbidity (%) 36 15
Admitted Through the ED (%) 83 63
Notes Excludes abstracts from Manitoba and Quebec as well as obstetric and pediatric patients. See Technical Notes for more detailed exclusions.
Source Discharge Abstract Database, 2007–2008, Canadian Institute for Health Information.
ALC days can occur at any time during a hospitalization but most patients were classified as ALC at the end of their hospital stay. However, at least 7% of ALC patients were admitted to acute care as ALC (provincial range: 6% to 16%; see Appendix A), representing almost 10% of all ALC days. The most common reasons for ALC admissions were palliative care (33%), waiting for admission to another adequate facility (27%) and physical therapy (11%).
i. In 2007–2008, 69,445 adult patients (excluding obstetrics) were admitted for 74,504 hospitalizations
that had ALC days. Because most ALC patients had only one hospitalization, we use the term “ALC patients,” though our analysis was done using ALC hospitalizations.
7
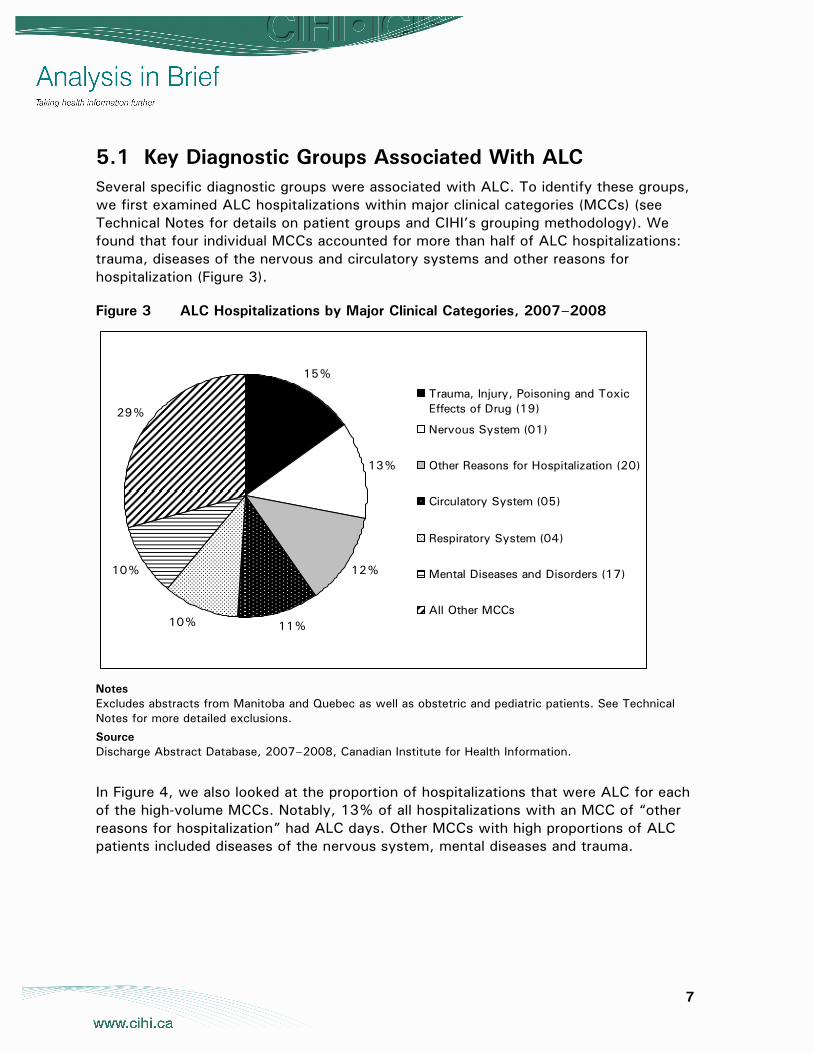
5.1 Key Diagnostic Groups Associated With ALC Several specific diagnostic groups were associated with ALC. To identify these groups, we first examined ALC hospitalizations within major clinical categories (MCCs) (see Technical Notes for details on patient groups and CIHI’s grouping methodology). We found that four individual MCCs accounted for more than half of ALC hospitalizations: trauma, diseases of the nervous and circulatory systems and other reasons for hospitalization (Figure 3).
Figure 3 ALC Hospitalizations by Major Clinical Categories, 2007–2008
15%
13%
12%
11%10%
10%
29%
Trauma, Injury, Poisoning and ToxicEffects of Drug (19)
Nervous System (01)
Other Reasons for Hospitalization (20)
Circulatory System (05)
Respiratory System (04)
Mental Diseases and Disorders (17)
All Other MCCs
Notes Excludes abstracts from Manitoba and Quebec as well as obstetric and pediatric patients. See Technical Notes for more detailed exclusions.
Source Discharge Abstract Database, 2007–2008, Canadian Institute for Health Information.
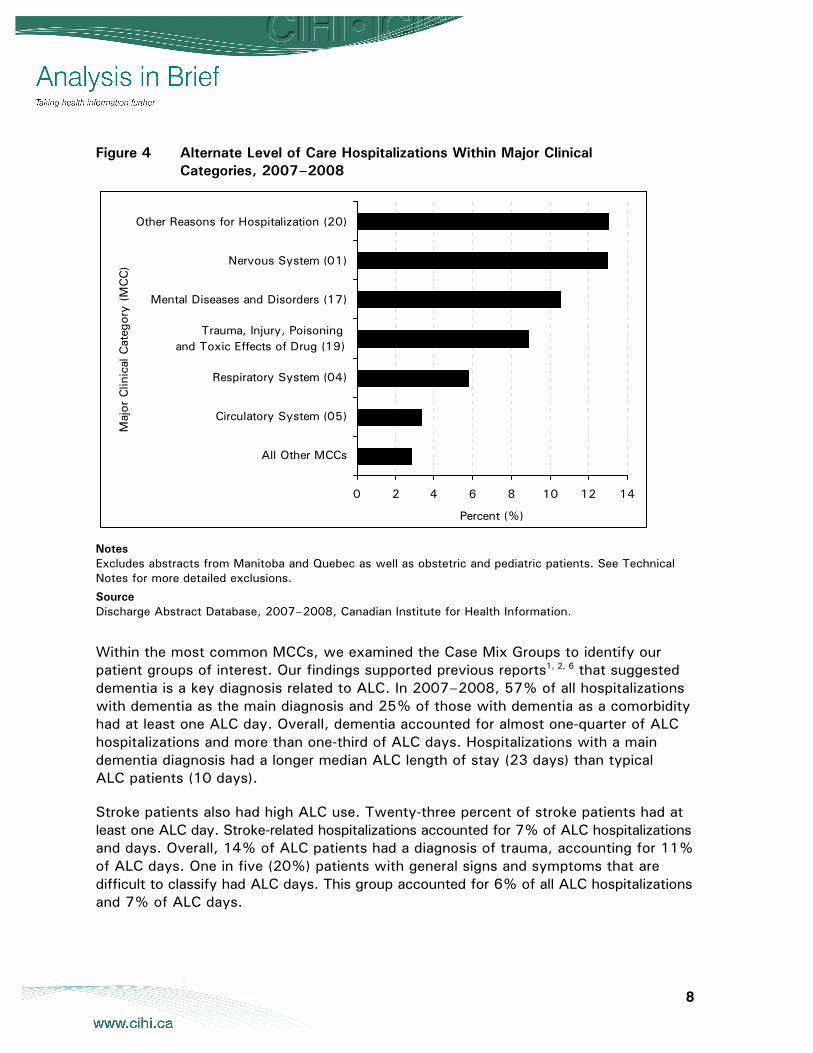
In Figure 4, we also looked at the proportion of hospitalizations that were ALC for each of the high-volume MCCs. Notably, 13% of all hospitalizations with an MCC of “other reasons for hospitalization” had ALC days. Other MCCs with high proportions of ALC patients included diseases of the nervous system, mental diseases and trauma.
8
Figure 4 Alternate Level of Care Hospitalizations Within Major Clinical Categories, 2007–2008
0 2 4 6 8 10 12 14
All Other MCCs
Circulatory System (05)
Respiratory System (04)
Trauma, Injury, Poisoning and Toxic Effects of Drug (19)
Mental Diseases and Disorders (17)
Nervous System (01)
Other Reasons for Hospitalization (20)
Maj
or C
linic
al C
ateg
ory
(MC
C)
Percent (%)
Notes Excludes abstracts from Manitoba and Quebec as well as obstetric and pediatric patients. See Technical Notes for more detailed exclusions.
Source Discharge Abstract Database, 2007–2008, Canadian Institute for Health Information.
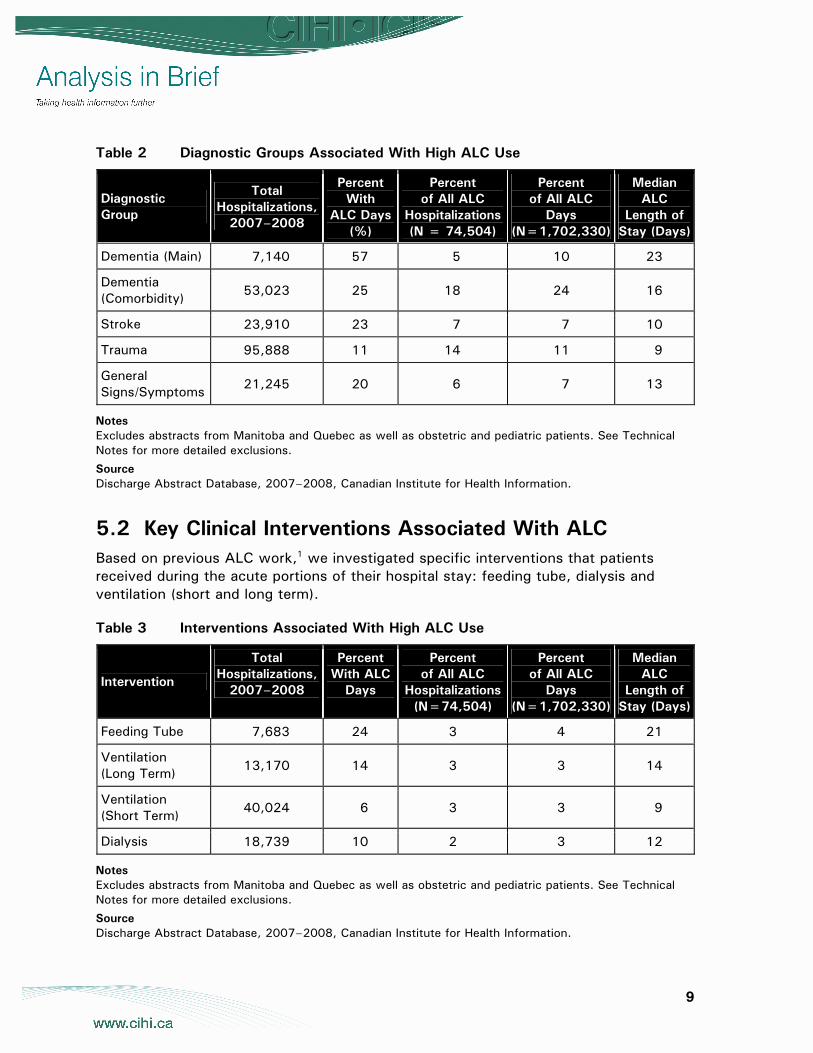
Within the most common MCCs, we examined the Case Mix Groups to identify our patient groups of interest. Our findings supported previous reports1, 2, 6 that suggested dementia is a key diagnosis related to ALC. In 2007–2008, 57% of all hospitalizations with dementia as the main diagnosis and 25% of those with dementia as a comorbidity had at least one ALC day. Overall, dementia accounted for almost one-quarter of ALC hospitalizations and more than one-third of ALC days. Hospitalizations with a main dementia diagnosis had a longer median ALC length of stay (23 days) than typical ALC patients (10 days).
Stroke patients also had high ALC use. Twenty-three percent of stroke patients had at least one ALC day. Stroke-related hospitalizations accounted for 7% of ALC hospitalizations and days. Overall, 14% of ALC patients had a diagnosis of trauma, accounting for 11% of ALC days. One in five (20%) patients with general signs and symptoms that are difficult to classify had ALC days. This group accounted for 6% of all ALC hospitalizations and 7% of ALC days.
9
Table 2 Diagnostic Groups Associated With High ALC Use
Diagnostic Group
Total Hospitalizations,
2007–2008
Percent With
ALC Days (%)
Percent of All ALC
Hospitalizations (N = 74,504)
Percent of All ALC
Days (N=1,702,330)
Median ALC
Length of Stay (Days)
Dementia (Main) 7,140 57 5 10 23
Dementia (Comorbidity) 53,023 25 18 24 16
Stroke 23,910 23 7 7 10
Trauma 95,888 11 14 11 9
General Signs/Symptoms 21,245 20 6 7 13
Notes Excludes abstracts from Manitoba and Quebec as well as obstetric and pediatric patients. See Technical Notes for more detailed exclusions.
Source Discharge Abstract Database, 2007–2008, Canadian Institute for Health Information.
5.2 Key Clinical Interventions Associated With ALC Based on previous ALC work,1 we investigated specific interventions that patients received during the acute portions of their hospital stay: feeding tube, dialysis and ventilation (short and long term).
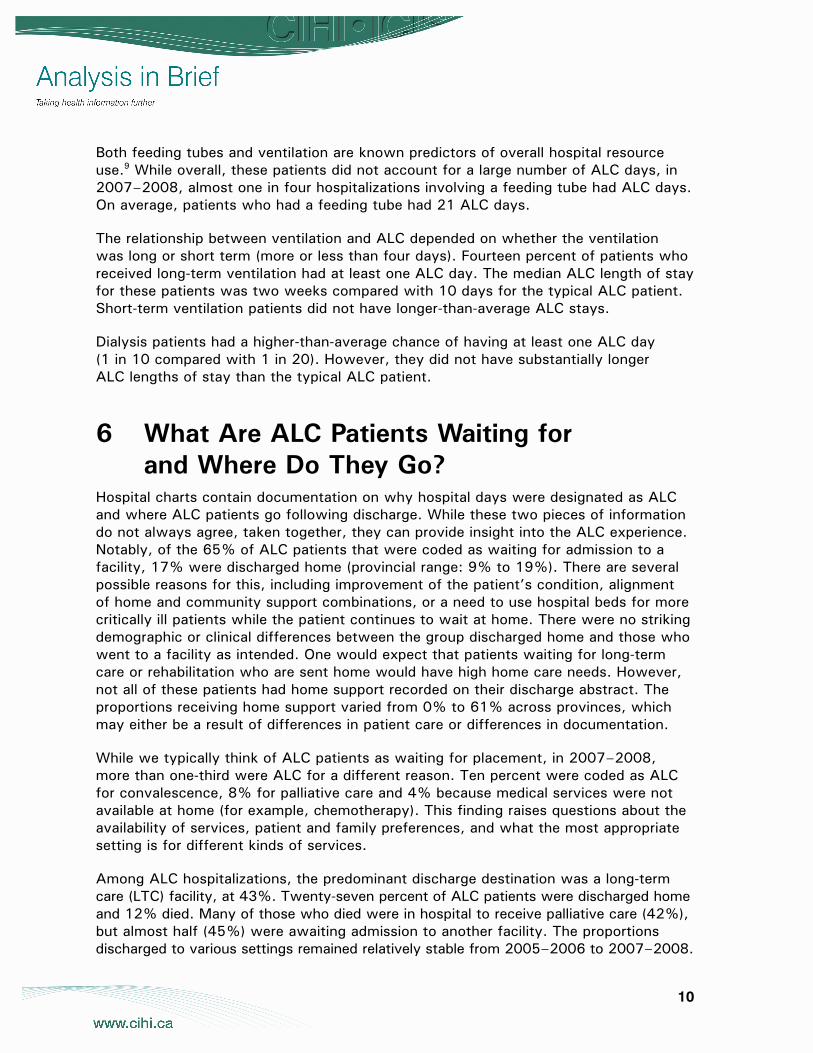
Table 3 Interventions Associated With High ALC Use
Intervention
Total Hospitalizations,
2007–2008
Percent With ALC
Days
Percent of All ALC
Hospitalizations (N=74,504)
Percent of All ALC
Days (N=1,702,330)
Median ALC
Length of Stay (Days)
Feeding Tube 7,683 24 3 4 21
Ventilation (Long Term) 13,170 14 3 3 14
Ventilation (Short Term) 40,024 6 3 3 9
Dialysis 18,739 10 2 3 12
Notes Excludes abstracts from Manitoba and Quebec as well as obstetric and pediatric patients. See Technical Notes for more detailed exclusions.
Source Discharge Abstract Database, 2007–2008, Canadian Institute for Health Information.
10
Both feeding tubes and ventilation are known predictors of overall hospital resource use.9 While overall, these patients did not account for a large number of ALC days, in 2007–2008, almost one in four hospitalizations involving a feeding tube had ALC days. On average, patients who had a feeding tube had 21 ALC days.
The relationship between ventilation and ALC depended on whether the ventilation was long or short term (more or less than four days). Fourteen percent of patients who received long-term ventilation had at least one ALC day. The median ALC length of stay for these patients was two weeks compared with 10 days for the typical ALC patient. Short-term ventilation patients did not have longer-than-average ALC stays.
Dialysis patients had a higher-than-average chance of having at least one ALC day (1 in 10 compared with 1 in 20). However, they did not have substantially longer ALC lengths of stay than the typical ALC patient.
6 What Are ALC Patients Waiting for and Where Do They Go?
Hospital charts contain documentation on why hospital days were designated as ALC and where ALC patients go following discharge. While these two pieces of information do not always agree, taken together, they can provide insight into the ALC experience. Notably, of the 65% of ALC patients that were coded as waiting for admission to a facility, 17% were discharged home (provincial range: 9% to 19%). There are several possible reasons for this, including improvement of the patient’s condition, alignment of home and community support combinations, or a need to use hospital beds for more critically ill patients while the patient continues to wait at home. There were no striking demographic or clinical differences between the group discharged home and those who went to a facility as intended. One would expect that patients waiting for long-term care or rehabilitation who are sent home would have high home care needs. However, not all of these patients had home support recorded on their discharge abstract. The proportions receiving home support varied from 0% to 61% across provinces, which may either be a result of differences in patient care or differences in documentation.
While we typically think of ALC patients as waiting for placement, in 2007–2008, more than one-third were ALC for a different reason. Ten percent were coded as ALC for convalescence, 8% for palliative care and 4% because medical services were not available at home (for example, chemotherapy). This finding raises questions about the availability of services, patient and family preferences, and what the most appropriate setting is for different kinds of services.
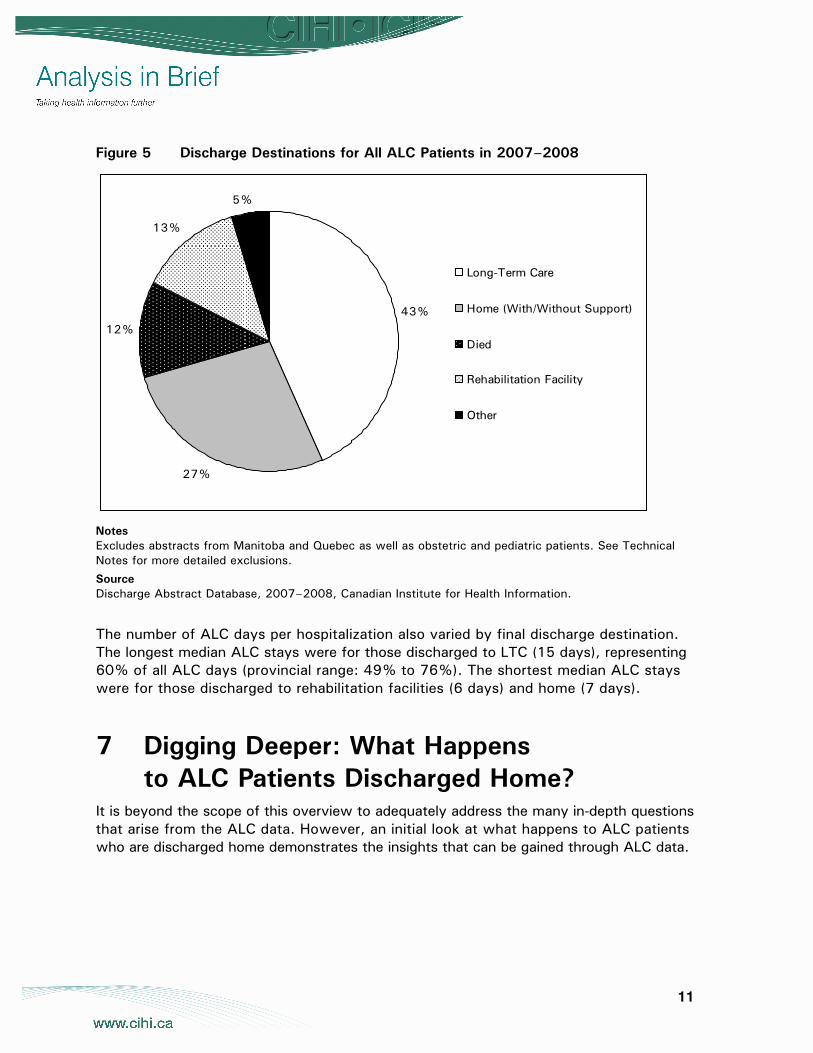
Among ALC hospitalizations, the predominant discharge destination was a long-term care (LTC) facility, at 43%. Twenty-seven percent of ALC patients were discharged home and 12% died. Many of those who died were in hospital to receive palliative care (42%), but almost half (45%) were awaiting admission to another facility. The proportions discharged to various settings remained relatively stable from 2005–2006 to 2007–2008.
11
Figure 5 Discharge Destinations for All ALC Patients in 2007–2008
43%
27%
12%
13%
5%
Long-Term Care
Home (With/Without Support)
Died
Rehabilitation Facility
Other
Notes Excludes abstracts from Manitoba and Quebec as well as obstetric and pediatric patients. See Technical Notes for more detailed exclusions.
Source Discharge Abstract Database, 2007–2008, Canadian Institute for Health Information.
The number of ALC days per hospitalization also varied by final discharge destination. The longest median ALC stays were for those discharged to LTC (15 days), representing 60% of all ALC days (provincial range: 49% to 76%). The shortest median ALC stays were for those discharged to rehabilitation facilities (6 days) and home (7 days).
7 Digging Deeper: What Happens to ALC Patients Discharged Home?
It is beyond the scope of this overview to adequately address the many in-depth questions that arise from the ALC data. However, an initial look at what happens to ALC patients who are discharged home demonstrates the insights that can be gained through ALC data.
12
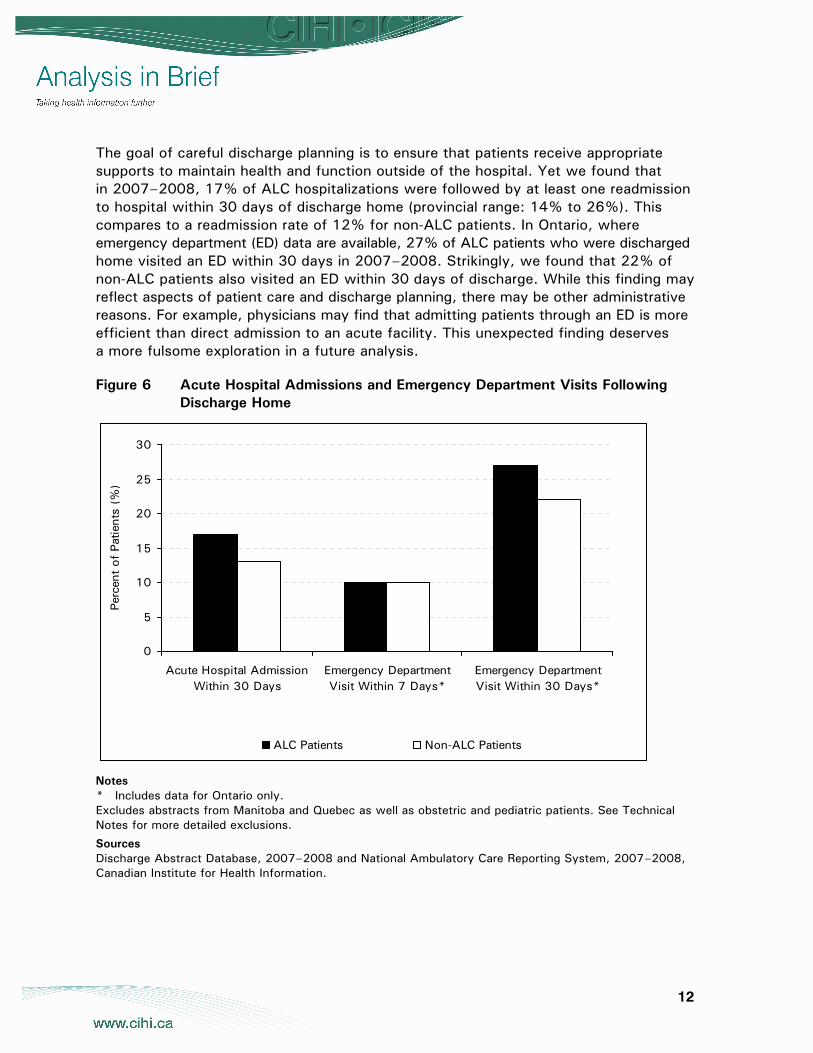
The goal of careful discharge planning is to ensure that patients receive appropriate supports to maintain health and function outside of the hospital. Yet we found that in 2007–2008, 17% of ALC hospitalizations were followed by at least one readmission to hospital within 30 days of discharge home (provincial range: 14% to 26%). This compares to a readmission rate of 12% for non-ALC patients. In Ontario, where emergency department (ED) data are available, 27% of ALC patients who were discharged home visited an ED within 30 days in 2007–2008. Strikingly, we found that 22% of non-ALC patients also visited an ED within 30 days of discharge. While this finding may reflect aspects of patient care and discharge planning, there may be other administrative reasons. For example, physicians may find that admitting patients through an ED is more efficient than direct admission to an acute facility. This unexpected finding deserves a more fulsome exploration in a future analysis.
Figure 6 Acute Hospital Admissions and Emergency Department Visits Following Discharge Home
0
5
10
15
20
25
30
Acute Hospital AdmissionWithin 30 Days
Emergency DepartmentVisit Within 7 Days*
Emergency DepartmentVisit Within 30 Days*
Perc
ent
of P
atie
nts
(%)
ALC Patients Non-ALC Patients
Notes * Includes data for Ontario only. Excludes abstracts from Manitoba and Quebec as well as obstetric and pediatric patients. See Technical Notes for more detailed exclusions.
Sources Discharge Abstract Database, 2007–2008 and National Ambulatory Care Reporting System, 2007–2008, Canadian Institute for Health Information.
13
8 Summary ALC is a considerable issue and accounts for a high number of hospitalizations and hospital days. The data, while not without limitations, both address and raise important questions about the health care system and transitions out of acute care.
What we know:
• ALC patients are a diverse group. However, some clinical diagnoses are associated with ALC status, such as dementia, stroke, trauma and general signs/symptoms. In addition, interventions such as feeding tubes, long-term ventilation and dialysis appear to be associated with high ALC use.
• Most ALC patients are waiting for placement and end up in an LTC or rehabilitation facility.
• Some patients who wait for placement end up going home.
• A substantial proportion of patients are ALC for reasons other than waiting for a bed. Some are admitted for ALC.
• Most patients are ALC for a short time, but some have long ALC stays.
• When ALC patients are discharged home, they have a higher likelihood of visiting an emergency department and being readmitted to hospital within 30 days of discharge than non-ALC patients.
What we don’t know:
• What are the main sources of provincial and facility variation in ALC? Is it mainly driven by differences in classifying and recording ALC cases or does it reflect key differences in patient care?
• Why are some patients ALC for three or more months?
• Why are some people admitted to a hospital for ALC?
• Why are patients discharged home when they are waiting for placement in LTC or rehabilitation facilities?
• Does the health care system have sufficient capacity to provide necessary care in the most appropriate setting—socially and clinically?
• Can specific strategies relieve the strain on staff and patients if ALC patients waiting for placement are transferred more quickly?
• Will increasing capacity in other sectors (for example, community services and post-acute facilities) required to support ALC patients reduce costs to the health care system?
14
Acknowledgements CIHI would like to acknowledge and thank the many individuals who contributed to the development of this report, including Jennifer Frood, Jin Huang, Jenny Lineker, Kathleen Morris and Jennifer Walker.
About CIHI The Canadian Institute for Health Information (CIHI) collects and analyzes information on health and health care in Canada and makes it publicly available. Canada’s federal, provincial and territorial governments created CIHI as a not-for-profit, independent organization dedicated to forging a common approach to Canadian health information. CIHI’s goal: to provide timely, accurate and comparable information. CIHI’s data and reports inform health policies, support the effective delivery of health services and raise awareness among Canadians of the factors that contribute to good health.
Production of this analysis is made possible by financial contributions from Health Canada and provincial and territorial governments. The views expressed herein do not necessarily represent the views of Health Canada or any provincial or territorial government.
15
Technical Notes
Data Sources Hospitalization data were obtained from CIHI’s Discharge Abstract Database (DAD). This database captures administrative, clinical and demographic information on inpatient events from acute care hospitals in Canada. Hospitalizations were selected based on a discharge date between April 1, 2007 and March 31, 2008.
Methodology Hospitalizations were identified as ALC-related if there were ALC days recorded at any point during the hospital stay.
To ensure that the general inpatient population was comparable to the ALC patients, we excluded:
• Quebec hospitals because Quebec data are not available in the DAD.
• Obstetric cases (MCC 13 and 14) because they have a different care pathway relative to the general hospital population.
To minimize known ALC coding inconsistencies, we also excluded:
• Data from Manitoba because rehabilitation beds were systematically coded as ALC for our time period. This practice is inconsistent with other provinces.
• Pediatric cases (younger than 17) because the concept of ALC status in children is not widely accepted and/or coded.
Because we used the health card number to link patient records, we excluded hospital records without a uniquely identifiable health card number (that is, the health card number was not submitted or patients were from out-of-country or under federal care).
Patients admitted under the ICD-10 code Z76 were excluded. Generally speaking, these are situations where a healthy person is accompanying a sick person, for example, a spousal relationship where a sick spouse is the caretaker for a well spouse.
The unit of analysis for this project was hospitalizations. To account for transfers from one acute hospital to another, individual abstracts were combined to build episodes of care (or hospitalizations). An abstract was considered a transfer if a) a transfer to/from an acute facility was indicated in the readmit abstract or in the previous abstract and b) admission to an acute facility occurred within 12 hours pre or post another acute care discharge. Overall, 4.5% of hospitalizations included more than one abstract.
16
When patient statistics were provided, data were taken from the admitting abstract of the hospitalization unless otherwise stated.
We estimated ALC under-reporting among patients discharged to a rehabilitation or long-term care bed using the following equation:
A / B x 100%, where:
A = Cases with a high probability of an ALC component. Specifically, number of acute hospitalizations with ALC LOS = 0 AND total LOS >30 days AND patient discharged to a rehabilitation, chronic care or nursing home institution or home for the aged.
B = Number of acute inpatient hospitalizations with total LOS >30 days AND patient discharged to a rehabilitation, chronic care or nursing home institution or home for the aged.
Hospitalizations were grouped according to Case Mix Groups (CMGs) and major clinical categories (MCCs). This methodology allowed us to identify the clinical issue determined to have been responsible for the greatest portion of the patient’s length of stay. See the CIHI website at www.cihi.ca for a full description of CMG+ methodology. When a hospitalization included more than one individual hospital record, the CMG/MCC for the hospitalization was determined by the CMG/MCC on the admitting abstract unless otherwise stated.
Hospitalizations were further grouped into diagnostic groups of particular interest to ALC-related questions. A hospitalization could fall into more than one category. Specifically:
• Stroke: CMG+ 025, 026, 028 on admitting record.
• Dementia: CMG+ 670 on admitting record.
• Dementia as comorbidity: ICD-10 code of G30.^^ or F00.^^ to F09.^^ at any point and not admitted as CMG+ 670.
• General signs/symptoms: CMG+ 800, 801, 811, 812 at any time.
• Trauma: diagnosis of trauma (available on request) in admitting record.
• Hip or knee replacement: Intervention code of 1V53^^ or 1VG53^^ at any time.
• Feeding tube: CMG+ flagged intervention of feeding tube at any time.
• Dialysis: CMG+ flagged intervention of dialysis at any time.
• Ventilation (long term): CMG+ flagged intervention of ventilation greater than 96 hours at any time.
• Ventilation (short term): CMG+ flagged intervention of ventilation less than 96 hours at any time.
17
The number of comorbidities was determined using the Charlson Comorbidity Index. This index was developed in the 1980s and is widely regarded as a useful tool for measuring comorbidity disease status.10
Final discharge destination was determined by the last abstract in the episode building and was grouped according to the following stepped methodology:
1. Discharge disposition was used to identify those who were discharged home (with or without support) or died in hospital.
2. Discharge disposition and transfer variables were used to identify those who were discharged/transferred to rehabilitation or long-term care.
In DAD, hospitals submit data only after the patient is discharged. Because ALC patients tend to have longer lengths of stay, we followed only discharges occurring in the first three-quarters of the fiscal year to look for acute care readmits within 30 days. Readmit to acute care was defined as the time from the final discharge to the next admit date.
Acute care data were also linked with unscheduled emergency department (ED) use in Ontario for 2007–2008 (captured in CIHI’s National Ambulatory Care Reporting System, or NACRS). Patients who were discharged from acute care alive in the first 11 months of the year in Ontario were followed to determine if they were seen in an Ontario ED within 7 and 30 days. Time to ED visit was defined as the time from final acute discharge to the registration time in an ED (see the CIHI website for details on NACRS). When more than one admit to the ED occurred in our time frame, only the first admit was counted.
18
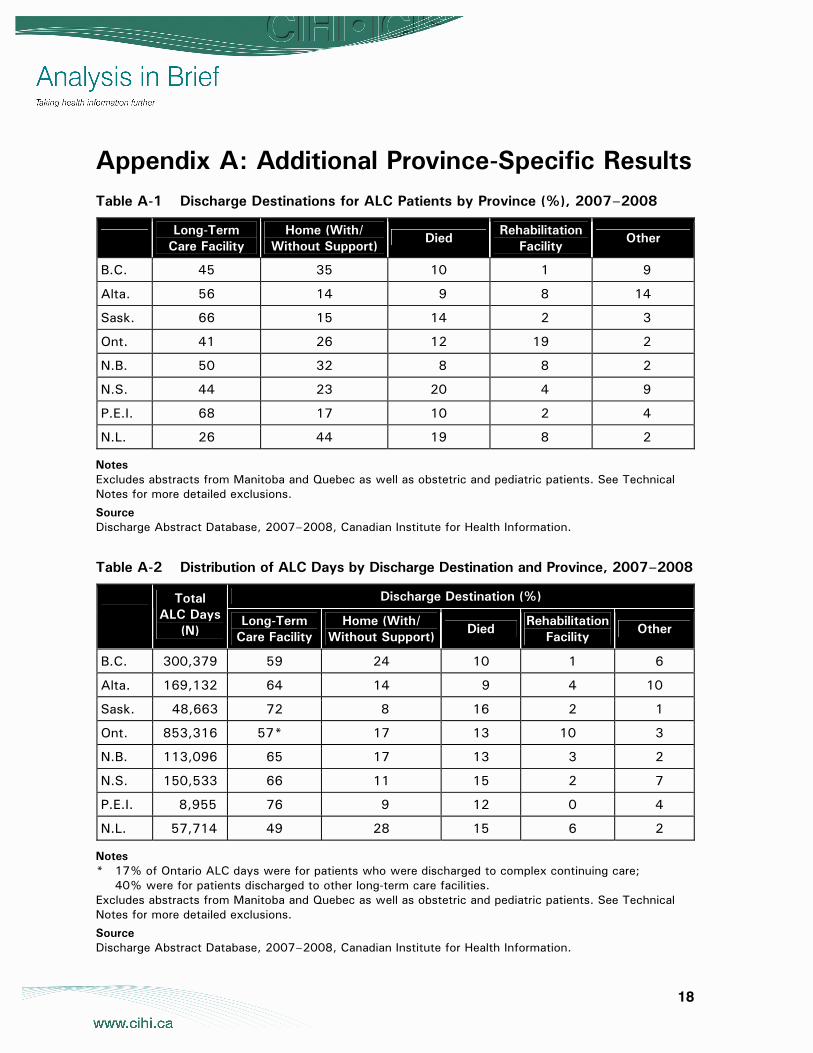
Appendix A: Additional Province-Specific Results Table A-1 Discharge Destinations for ALC Patients by Province (%), 2007–2008
Long-Term
Care Facility Home (With/
Without Support) Died
Rehabilitation Facility
Other
B.C. 45 35 10 1 9
Alta. 56 14 9 8 14
Sask. 66 15 14 2 3
Ont. 41 26 12 19 2
N.B. 50 32 8 8 2
N.S. 44 23 20 4 9
P.E.I. 68 17 10 2 4
N.L. 26 44 19 8 2
Notes Excludes abstracts from Manitoba and Quebec as well as obstetric and pediatric patients. See Technical Notes for more detailed exclusions.
Source Discharge Abstract Database, 2007–2008, Canadian Institute for Health Information.
Table A-2 Distribution of ALC Days by Discharge Destination and Province, 2007–2008
Discharge Destination (%) Total ALC Days
(N) Long-Term
Care Facility Home (With/
Without Support) Died
Rehabilitation Facility
Other
B.C. 300,379 59 24 10 1 6
Alta. 169,132 64 14 9 4 10
Sask. 48,663 72 8 16 2 1
Ont. 853,316 57* 17 13 10 3
N.B. 113,096 65 17 13 3 2
N.S. 150,533 66 11 15 2 7
P.E.I. 8,955 76 9 12 0 4
N.L. 57,714 49 28 15 6 2
Notes * 17% of Ontario ALC days were for patients who were discharged to complex continuing care;
40% were for patients discharged to other long-term care facilities. Excludes abstracts from Manitoba and Quebec as well as obstetric and pediatric patients. See Technical Notes for more detailed exclusions.
Source Discharge Abstract Database, 2007–2008, Canadian Institute for Health Information.
19
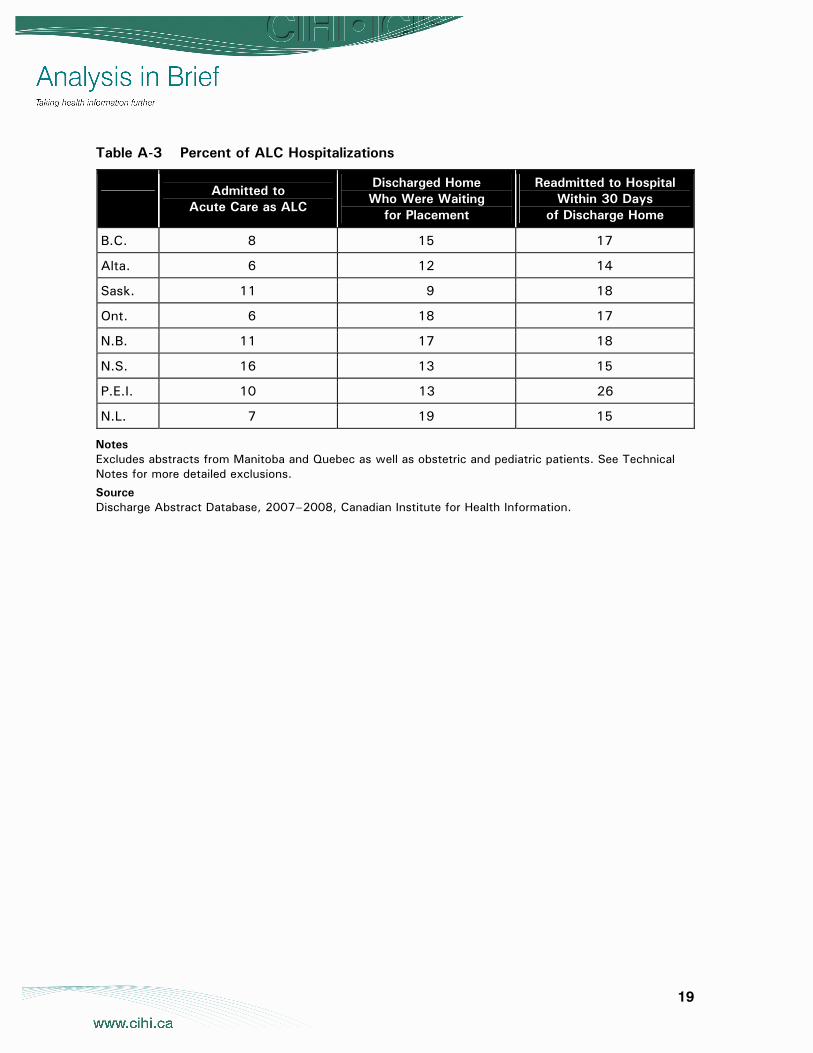
Table A-3 Percent of ALC Hospitalizations
Admitted to
Acute Care as ALC
Discharged Home Who Were Waiting
for Placement
Readmitted to Hospital Within 30 Days
of Discharge Home
B.C. 8 15 17
Alta. 6 12 14
Sask. 11 9 18
Ont. 6 18 17
N.B. 11 17 18
N.S. 16 13 15
P.E.I. 10 13 26
N.L. 7 19 15
Notes Excludes abstracts from Manitoba and Quebec as well as obstetric and pediatric patients. See Technical Notes for more detailed exclusions.
Source Discharge Abstract Database, 2007–2008, Canadian Institute for Health Information.
20
References 1. Ontario Association for Community Care Access Centres, Ontario Association
of Non-Profit Homes and Services for Seniors, Ontario Hospital Association, Ontario Long Term Care Association, Alternate Level of Care—Challenges and Opportunities. A Collaborative Position Paper (Toronto, Ont.: OHA, 2006), [online], cited October 31, 2008, from <http://www.oha.com/Client/OHA/ OHA_LP4W_LND_WebStation.nsf/resources/Alternate+Level+of+Care+-+Challenges+and+Opportunities/$file/Alternate_LevelofCare_May2006.pdf>.
2. A. Yassi et al., Caring for the Caregivers of “Alternate Level Care” (ALC) Patients: The Impact of Healthcare Organizational Factors in Nurse Health, Well Being, Recruitment and Retention in the South Fraser Health Region of British Columbia (Vancouver, B.C.: Occupational Health and Safety Agency for Healthcare in B.C., date unknown), [online], cited October 31, 2008, from <http://www.ohsah.bc.ca/ media/1-ALC-Final-Report.pdf>.
3. Centre for Healthcare Quality Improvement, The Flo Collaborative: Quality Transitions for Better Care [online], cited November 4, 2008, from <http://www.chqi.ca/ flo/flo_mn.html>.
4. H. MacLeod, B. Bell, K. Deane and C. Baker, “Creating Sustained Improvements in Patient Access and Flow: Experiences From Three Ontario Healthcare Institutions,” Healthcare Quarterly 11, 3 (2008): pp. 38–49.
5. C. Penney and E. Henry, “Improving Performance Management for Delivering Appropriate Care for Patients No Longer Needing Acute Hospital Care,” Journal of Health Services Research & Policy 13, Suppl. 1 (2008): pp. 30–34.
6. Toronto Central Local Health Integration Network ALC Task Group, Improving Transitions: An ALC Action Plan for the Toronto Central LHIN (Toronto, Ont.: Toronto Central LHIN, 2008).
7. Canadian Institute for Health Information, DAD Abstracting Manual, 2007–2008 (Ottawa, Ont.: CIHI, 2008).
8. Canadian Institute for Health Information, Data Quality of the Discharge Abstract Database Following the First-Year Implementation of ICD-10-CA/CCI. Final Report (Ottawa, Ont.: CIHI, 2004).
9. Canadian Institute for Health Information, CMG+ Tool Kit: Transitioning to the New CMG+ Grouping Methodology (and Associated Health Resource Indicators) (Ottawa, Ont.: CIHI, 2008).
10. V. Sundararajan et al., “New ICD-10 Version of the Charlson Comorbidity Index Predicted In-Hospital Mortality,” Journal of Clinical Epidemiology 57 (2004): pp. 1288–1294.