Embed Size (px)
Citation preview
Alternatives to the Grade Point Average 279
Alternatives to the Grade PointAverage for Ranking Students
Jeffrey A. MerminW. Garrett MitchenerJohn A. ThackerDuke UniversityDurham, NC 27708Ð[email protected]
Advisor: Greg Lawler
IntroductionThe customary ranking of students by grade point average (GPA) encour-
ages students to take easy courses, thereby contributing to grade inßation.Furthermore, many ties occur, especially when most grades are high. We con-sider several alternatives to the plain GPA ranking that attempt to eliminatethese problems while ranking students sensibly. Each is based on computinga revised GPA, called an ability score, for each student. We evaluate these alter-native methods within the context of the Þctitious ABC College, where gradesare inßated to the extreme that the average grade is A−.
• The standardized GPA replaces each grade by the number of standard devi-ations above or below the course mean. Students are then ordered by theaverage of their revised grades.
• The iterated adjusted GPA compares the average grade given in a course tothe average GPA of students taking it, thereby estimating how difÞcult thecourse is. It repeatedly adjusts the grades until average grade equals theaverage GPA and uses the corrected GPA to determine rank.
• The least-squares method assumes that the difference between two studentsÕgrades in a course is equal to the difference between their ability scores. Itthen sets up a large matrix of linear equations, with an optional handicapfor courses taken outside a studentÕs major, and solves for the ability scoreswith a least-squares algorithm.
TheUMAP Journal 19 (3) (1998) 279Ð298. c©Copyright 1998 byCOMAP, Inc. All rights reserved.Permission to make digital or hard copies of part or all of this work for personal or classroom useis granted without fee provided that copies are not made or distributed for proÞt or commercialadvantage and that copies bear this notice. Abstracting with credit is permitted, but copyrightsfor components of this work owned by others than COMAPmust be honored. To copy otherwise,to republish, to post on servers, or to redistribute to lists requires prior permission from COMAP.
280 The UMAP Journal 19.3
Anacceptable rankingmethodmust reward students for scoringwell, whiletaking into account the relative difÞculties of their courses. It must clearlydistinguish the top 10% of students. Preferably, the method should make al-lowances for the fact that students often earn lower grades in courses outsidetheir majors and should not discourage them from taking such courses.We used a small simulated student body to explore how the different meth-
ods work and to test the effects of changing a single grade. The least-squaresmethod gave the most intuitive and stable results, followed by the iteratedadjusted, the standardized, and Þnally the plain GPA. Under the least-squaresand iterated adjusted methods, when a certain studentÕs grade was changedin one course, that student and other students in that course changed positionbut most of the other students moved very little.Weuseda larger simulated student body, generatedbya computerprogram,
to compare the iterated adjusted and standardized algorithms. They agree onmost of students in the top decile, around 89% if plus and minus grades areincluded. They did not agree well with the plain GPA ranking, due to massiveties in the latter.All four methods are more reliable when plus and minus grades are in-
cluded, since a great deal of information is lost if only letter grades are given.We recommend the least-squares method, since it is not very sensitive to
small changes in grades and yields intuitive results. It can also be adapted toencourage well-roundedness of students, if the college chooses.However, if there are more than about 6,000 students, the least-squares
method can be prohibitively difÞcult to compute. In that case, we recommendthe iterated adjusted GPA, which is easier to calculate and is the best of theremaining methods.We recommend against the standardized GPA, because it does not properly
correct for course difÞculty,makes assumptions that are inappropriate for smallor specialized courses, and produces counterintuitive results. We also recom-mend against the plain GPA, because it assumes that all courses are graded onthe same scale and results in too many ties when grades are inßated.To avoid confusion, we use the following terminology: A class is a group
of students who all graduate at the same time, for example, the class of 1999.A course is a group of students being instructed by a professor, who assigns agrade to each student.
Assumptions and Hypotheses• It is possible to assign a single number, or Òability scoreÓ (this will be therevisedGPA), to each student, which indicates the studentÕs relative scholas-tic ability and, in particular, the studentÕs worthiness for the scholarship. Inother words, we can rank students.
• The rank should be transitive; that is, if X is ranked higher than Y, and Yis ranked higher than Z, then X should be ranked higher than Z. We can
Alternatives to the Grade Point Average 281
therefore completely order students by rank.
• The performances of an individual student in all courses are positively cor-related, since:
Ð There is a degree of general aptitude corresponding to the ability scorethat every student possesses.
Ð All instructors, while their grade averages may differ, rank studentswithin their courses according to similar criteria.
• While there may be a difference between grades in courses that reßects thestudentÕs aptitude for the particular subjects, this has only a small effect,because:
Ð Students select electives in a manner highly inßuenced by their skill atthe subjects available, that is, students tend to select courses at whichthey are most talented.
Ð All students should major in an area of expertise, so that they are mosttalented at courses within or closely related to their majors.
Ð The college may require courses that reßect its emphasis; even if the re-quired courses could be considered ÒunfairÓ because they are weightedtowards one subject (e.g., writing), that is the collegeÕs choice and highlyranked students must do well in such required courses.
• Not all courses have the same difÞculty. That is, it is easier to earn a highgrade in some courses than in others.
• The correspondence of grades to grade points is as follows: A=4.0, B=3.0,C=2.0, D=1.0, F=0.0. A plus following a grade raises the grade point byone-third, while a minus lowers it by the same amount (i.e., A−≈ 3.7, whileC+ ≈ 2.3).
• Students take a Þxed courseload for each semester for eight semesters.• The average grade given at ABC College is A−. Thus we assume that theaverage GPA of students is at least 3.5, the smallest number that rounds toan A−.• In general, X should be ranked ahead of Y (we write X > Y) if:
Ð X has better grades than Y, and
Ð X takes a more challenging courseload than Y, and
Ð X has a more well-rounded courseload (we recognize that this point isdebatable).
282 The UMAP Journal 19.3
Analysis of Problem and Possible Models
The Problem with Plain GPA RankingThe traditionalmethodof ranking students, commonly knownas the grade-
point average, or GPA, consists of taking the mean of the grade points that astudent earns in each course and then comparing these values to determine thestudentÕs class rank.The immediate problem with the plain GPA ranking is that it does not
sufÞciently distinguish between students. When the average grade is an A−,all above-average students within any class receive the same grade, A. Thus,with only four to six classes per semester, fully one sixth of the student bodycan be expected to earn a 4.0 or higher GPA.1 This makes it all but impossibleto distinguish between the Þrst and second deciles with anything resemblingreliability. Furthermore, any high-ranking student earning a below-averagegrade, for any reason, is brutally punished, dropping to the bottom of thesecond decile, if not farther. This is a result of the extremely high averagegrade; if the average grade were lower, there would be a margin for error fortop students.Unfortunately, the plain GPA exacerbates its own problems by encouraging
the grade inßation that makes it so useless. Since the plain GPA does notcorrect for course difÞculty, students may seek out courses in which it is easyto get a good grade. Faced with the prospect of declining enrollment and poorstudent evaluations, instructors who grade strictly may feel pressure to relaxtheir grading standards. Instructors who grade easily may be rewarded withhigh enrollment and excellent evaluations, potentially leading to promotion.The entire process may create a strong push towards grade inßation, since theplainGPApunishes both the student taking a difÞcult course and the instructorteaching it. Any system intended to replace the plain GPA should address thisproblem, so that grade inßation will be arrested and hopefully reversed.Another potential concern is that the plain GPA encourages specialization
by students. Since students tend toperformbetter in courses related to theirma-jors, the GPA rewards students who take as few courses outside their ÒcomfortzoneÓ as possible and punish students who attempt to expand their horizons.We note, however, that individual colleges may or may not regard this as aproblem; the relative values of specialization and well-roundedness are opento debate.
Three Possible SolutionsSeveralpotential alternatives toGPArankingdirectly comparegradeswithin
each course. Under such a system, the following considerations come into play:
1Repeated trials of the process described later yield this result.
Alternatives to the Grade Point Average 283
• It is not possible to compare students just to others in their own class. Stu-dents often take courses in which all other students belong to another class.
• We have to compute rankings separately each semester, because the pool ofstudents changes due to graduation and matriculation.
• It is not possible to take into account independent studies, because there isnobody to compare to.
• It is not possible to take into account pass/fail courses, because they do notassign relative grades.
We recognize three potential solutions to this problem. The following sectionsdescribe them in more detail.
• For the standardized GPA each student is given a revised GPA based on thestudentÕs gradeÕs position in the distribution of grades for each course.
• The iterated adjusted GPA attempts to correct for the varying difÞculties ofcourses. In theory, every grade given to a student should be approximatelyequal to the studentÕsGPA, so that the averagegradegiven in a course shouldbe about equal to the average GPA of students in that course. This schemerepeatedly adjusts all the grade points in each course until the average gradein every course equals the average GPA of the enrolled students.
• The least squares method assumes that, other things being equal, the differ-ence between two studentsÕ grades will be equal to the difference in theirability scores. It attempts to Þnd these ability scores by solving the systemof equations generated by each course (for example, if student X gets an Abut student Y gets a B, thenX−Y = 4.0−3.0 = 1.0). Since in any nontrivialpopulation this system has no solution, methods of least-squares approxi-mation are used to approximate these values. The students are then rankedaccording to ability score.
Standardized GPA
How It WorksThe standardized GPA is perhaps the simplest method and one most in
keeping with the deanÕs suggestion. In each course, we determine how manystandard deviations above or below the mean each studentÕs grade is. Thisstandard score becomes the studentÕs ÒgradeÓ for the class, the studentÕs stan-dard scores are averaged for a standardized GPA, and students are ranked bystandardized GPA. This is a quantiÞed version of the deanÕs suggestion to rankeach student as average, below average, or above average in each class, andthen combine the information for a ranking.
284 The UMAP Journal 19.3
Strengths• The standardized GPA is not much more difÞcult to calculate than the plainGPA measurement.
• Each course can be considered independently. Instead of waiting for allresults to come in, the registrar can calculate the standardized scores foreach course as grades come in, possibly saving time in sending grades out.
• The standard deviations do correct for differing course averages, for exam-ple, getting a B+ when the course average is a C+ looks better than gettingan A− when the course average is an A. At the same time, this methodcontinues to rank students in the order in which they scored in each course.Student X is thus always ranked above student Y if X and Y take similarcourses and X has better grades.
WeaknessesThe standardized GPA suffers frommany of the same problems as the plain
GPA.
• It does not reward students who have a more well-rounded courseload.Instead, students arepunishedseverely if theyperformat less than the courseaverage; for example, a student who takes a course outside his or her majoris likely to score worse than students majoring in the courseÕs subject.
• The plain GPAmakes no distinction between easy and difÞcult courses andthus encourages easy courses. The standardized GPA attempts to correctthis but ends up claiming that a low average grade is equivalent to a difÞcultcourse. This is not always true and has some interesting quirks:
Ð Higher-level coursesmay be populated only by students who excel bothin the subject of the course and in general, so only high grades are given.But if all grades are high, this method treats the course as easy!
Ð Thismethodboosts one studentÕs grade if theother students in the coursehave lower scores.
Ð Additionally, ability scores may be signiÞcantly raised by adding poorstudents to the course.
• The standardized GPA does not assume that instructors assign grades basedon a normal curve or to Þt any other prespeciÞed distribution. Not allinstructors grade on the normal curve or even on any curve. Some coursesmay require grades to Þt some other distribution in order to be fair, forexample, if all the students are extraordinarily talented.
• Themethod does not compensate for the skill of the students when decidingthe difÞculty of a course. A good studentwho takes courseswith other good
Alternatives to the Grade Point Average 285
students will look worse than a slightly less able student who takes coursesamong signiÞcantly less able students. The difÞculty of a course should bemeasured not only by the grades of its students but also by the aptitudes ofthose students.
ConsequencesGrading based on deviation from the mean fosters cutthroat competition
among students, since any studentÕs ability score may be signiÞcantly raisedby lowering the ability scores of other students.
Iterated Adjusted GPA
How it WorksRather than directly comparing students, this method compares courses.
Suppose that a course is unusually difÞcult. Then students should receivelower grades in that course relative to their others, so the average grade inthat course should be lower than the average GPA of all students enrolledin it. We should therefore be able to correct for courses that are unusuallydifÞcult by adding a small amount to the point value of every grade given inthat course. Likewise, we can correct for easy courses by subtracting a smallamount. Of course, once we have corrected everyoneÕs grades, their newGPAswill be different, andmost likely some courseswill need further correction. Theiterated adjusted GPA method makes ten corrections to all grades, then sortsstudents in order of corrected GPA. (Our numerical experiments show that teniterations are sufÞcient to bring the difference between the average GPA andthe average grade down to zero, to three decimal places.)
Strengths• This algorithm is fairly quick to compute, taking only a couple of minutesfor 1,000 students, 200 courses, and 6 courses per student.
• The computation is straightforward to explain and easily understood bynon-experts.
Weaknesses• All grades from all courses must be known in order to run the computation.• The corrected grades cannot be computed independently by students.
286 The UMAP Journal 19.3
• There is no guarantee that the corrected GPAs will be comparable acrosssemesters; to compute overall class rank at graduation, it will be necessaryto average ranks across semesters, rather than average corrected GPAs.
ConsequencesThis method systematically corrects for instructor bias in giving grades,
thus eliminating the tendency of students to select easy courses, and thereforemakes progress toward reversing grade inßation. The total correction madefor each course may be used as an indicator of the courseÕs grade bias.This algorithm tends to ÒpunishÓ students in courses where grades are
unusually high. If students score high in a course relative to their other grades,it could be because the course was easy or because the students put forth extraeffort. If the course was easy, then the punishment is due; if the difference wasdue to extra effort, then such effort is not typical of the students in questionand the punishment is arguably due.Although the correction can be applied to very small classes and indepen-
dent studies, strange things are likely to happen. If a student in an independentstudy gets a grade above his GPA, he is punished by the correction, and if hegets a lower grade, he is rewardedÑwhich is clearly undesirable. Using thesample data set presented later in Table 1, we experimented with indepen-dent studies and determined that they had minimal impact on the rank order.However, to avoid the possibility of such strange results, independent studiesshould be ignored in the computation.
The Least-Squares Algorithm
How It WorksThe least-squaresmethodassumes that thedifferencebetween twostudentsÕ
abilities will be reßected in the difference between their grades. Hence, if X andY take the same course, and get grades A and B, then we have a differenceX −Y = 4.0−3.0 = 1.0. We further assume that studentsmajoring innatural scienceÞelds perform better in natural science courses than in humanities courses, andvice versa, and that the difference is of approximately the same for all students;we call it HH . Hence, if, in the example above, students X and Y are taking amathematics course, but X ismajoring in physics andY ismajoring in literature,we have X − (Y +HH) = 1.0.
A course with N students generates N(N + 1)/2 such linear equations;the abilities of each student are the solution to the set of all such equationsfrom every course offered during the semester. In practice, these equationsnever have a solution. Hence, methods of least-squares approximation mustbe employed. The system is converted into the matrix equation Ax = b, whereA is the matrix of the coefÞcients of the left-hand side of each equation, x is the
Alternatives to the Grade Point Average 287
vector of the abilities of each student and the constant HH , and b is the right-hand side of each equation. Multiplication by the transpose of A yields theequation ATAx = AT b. This matrix equation has a one-dimensional solutionset, with nullspace equal to scalar multiples of (1 1 1 . . . 1 0)
T , where the 1scorrespond to the studentÕs abilities and the 0 to the constant HH . Thus, onestudentÕs ability score may be assigned arbitrarily, and the rest will then bewell determined. This arbitrary assignment will in no way affect the orderingof any two studentsÕ ability scores, or the magnitude of the difference betweentwo students. After these scores are determined, the difference between a 2.0and the median score is added to every studentÕs score, so that the scores willbe easily interpretable in terms of the plain GPA. These scores can be averagedover all eight semesters to produce a ranking at graduation.
Strengths• Least squares corrects for the difÞculty of every studentÕs courseload.• Least squares can reward students for carrying a well-rounded courseload.This secondstrength is extremelyßexible, anddeserves further enumeration.
Ð If a school wishes not to account for well-roundedness, the factor HH
may be omitted, with no consequence except that the ability scoreswill no longer consider the balance or specialization in each studentÕscourseload.
Ð If a schoolwishes to emphasize several areas of specialization rather thanjust two, it could do so by replacingHH with constants representing thedifÞculty of the transitions between each pair.
Ð Aschoolwanting to assure that certain emphasized courses (e.g., a fresh-man writing course) not unduly beneÞt students majoring in some de-partments could categorize such courses as belonging to every area ofspecialization, or to none.
Ð Similarly, if a schoolwishes todictate that certainde-emphasized courses(e.g., physical education) not reward students with a well-roundednesscorrection, it may also dictate that they be categorized in every area ofspecialization or in none.
Ð Other corrections may be made for students with special circumstances;for example, if a student double-majors in two different areas of spe-cialization, each well-roundedness correction might be replaced by theaverage of the two corrections from each of the studentÕs major areas.
WeaknessesThemostglaringweaknessof thismethod is that it involveshugeamountsof
computation and may severely tax computing resources at larger universities.
288 The UMAP Journal 19.3
For a student body of 6,000, with 120 courses of size 20 and each studenttaking 4 courses, we have 1,200× 21(21 + 1)/2 ≈ 250,000 pairs of grades. Thisresults in a sparse A with 250,000 rows, 6,000 columns, and only 4 nonzeroentries in each column (for the 4 courses that the student took). Then ATA has36,000,000 entries; at 4 bytes per entry, keeping it in memory requires 144 MB,barelywithin range of currentmedium-size computers. ComputingATA takeson the order of 250,000 × 6,0002 = 9 × 10¹² multiplications, computing AT btakes only about 1.5×10⁹multiplications, and solvingATAx = AT b takes about6,0003 = 2.2× 10¹¹ operations. Thus, the time to solve the system is about 1013
operations, which would take 50,000 sec ≈ 14 hr on a 200 MHz computer.The memory needed increases with the square of the number of students
and quickly becomes infeasible with this approach and current technology.
ConsequencesAn immediate consequence of changing to this ranking will be that, so long
as the average grade remains anA−, all ability scoreswill be tightly packed intoa range between about 1.0 and about 3.0; no student will appear to carry an Aaverage. This will likely result in instructors widening their grading scales, inorder to reward their best students, thus reducing grade inßation to somethingmore reasonable.
A Small Test PopulationWe postulate a minicollege, with 18 students (AÐR), that offers only the fol-
lowing courses: Math, Physics, Computer Science, Physical Education, Health,English, French, History, Philosophy, Psychology, and Music History.Math, Physics, and English are generally believed to be prohibitively difÞ-
cult courses, while Physical Education,Health, andMusicHistory are generallyconsidered to be very easy. StudentsÕ transcripts are listed inTable 1. Just look-ing at these transcripts, without analyzing them numerically, we Þnd that weshould have the following, which any valid ranking system must satisfy (recallthat X > Y means that X should be ranked above Y):
• A > B; C > D; and E > F, and so on, because A, C, etc., carry better gradesthan B, D, etc., in courseloads of similar difÞculty.
• O, D > J because O and D have slightly better grades than J in more difÞcultcourseloads.
• E > D because E has better grades in a more difÞcult courseload.We also recognize the following relationships as desirable:
• O > Q, R and P > R, because O and P have almost as good grades and muchmore difÞcult schedules.
Alternatives to the Grade Point Average 289
Table 1.Transcripts of the test population.
A star indicate the studentÕs major. ÒCPSÓ means Computer Science and ÒPhysEdÓ means
Physical Education.
Student Courses
A PhysEd 4.3, Health 4.0, *History 3.0, Math 2.3B PhysEd 4.3, Health 3.3, *Psychology 2.0, CPS 2.0C Math 4.0, *Physics 4.3, CPS 4.0, Philosophy 3.7D *Math 4.0, Physics 3.7, CPS 4.0, French 3.0E *Math 4.3, Physics 4.0, English 3.3, History 3.7F Physics 3.7, *CPS 4.0, French 3.7, History 3.0G Math 4.0, *CPS 4.3, Health 4.0, English 3.7H CPS 3.0, *Physics 4.0, PhysEd 4.0, Psychology 3.0I English 4.0, French 4.3, CPS 3.7, *Philosophy 4.3J English 3.7, *French 4.0, Music History 4.0, Math 2.7K *English 4.3, Philosophy 4.0, Psychology 4.0, Music History 4.3L English 3.7, *History 4.0, Psychology 4.0, Music History 4.0M Music History 4.3, Psychology 4.3, *French 4.3, PhysEd 4.0N *Music History 4.0, Psychology 4.0, French 4.0, Health 4.0O Physics 4.0, English 3.3, *Math 4.0, Philosophy 4.0P Physics 3.0, *English 3.7, Math 3.3, Philosophy 4.0Q PhysEd 4.0, Health 4.3, Music History 4.3, *Psychology 4.3R PhysEd 4.0, Health 4.0, Music History 4.0, *CPS 4.0
• M > Q and N > R, because M and Q have similar grades but M has a moredifÞcult schedule, and similarly for N and R.
• K>M,N,Q,RbecauseKhas similargrades inamuchmoredifÞcult schedule.• C, G, and K should be ranked near each other because they have similargrades in similar schedules.
• P> J because Phas similar grades against a signiÞcantlymore difÞcult sched-ule and has higher grades in the two classes that they share.
If we postulate that the well-roundedness of a studentÕs schedule shouldaffect rank, we also Þnd the following relationships:
• E > C, D because E has almost as good grades in amore difÞcult, muchmorewell-rounded schedule.
• I > K, M because I has similar grades against a more well-rounded schedule.
The rankings of this sample population are given in the Table 2. A compar-ison of the different methods relative to the criteria that we have set out is inTable 3. Least squares does best, followed by iterated adjusted, standardized,and plain.
290 The UMAP Journal 19.3
Table 2.
Rankings of the sample population under the various methods.
With+/− Without+/−
Rank Plain Standardized Iterated LS Plain Standardized Iterated LS
1 Q 4.25 K 0.84 K 4.22 E 2.32 R 4.00 G 0.53 L 4.12 G 2.252 M 4.25 I 0.81 I 4.17 I 2.26 Q 4.00 L 0.49 G 4.07 I 2.193 K 4.17 Q 0.60 M 4.09 G 2.24 C 4.00 C 0.39 I 4.06 E 2.174 I 4.08 M 0.52 C 4.08 C 2.24 N 4.00 I 0.36 C 4.05 C 2.175 R 4.00 G 0.39 G 4.07 O 2.18 M 4.00 N 0.34 K 4.03 F 2.146 N 4.00 C 0.22 L 4.06 K 2.14 G 4.00 K 0.27 N 3.96 O 2.047 C 4.00 E 0.21 E 4.05 M 2.05 K 4.00 M 0.24 E 3.92 L 2.048 G 4.00 L 0.16 Q 4.02 Q 2.03 I 4.00 Q 0.24 M 3.89 D 2.039 L 3.92 N −0.01 O 3.96 F 2.01 L 4.00 R 0.23 J 3.87 R 2.0210 E 3.83 O −0.03 N 3.90 R 1.99 O 3.75 F 0.11 D 3.84 K 1.9811 O 3.83 R −0.20 R 3.76 P 1.94 J 3.75 J 0.07 F 3.84 J 1.9512 D 3.67 D −0.26 D 3.74 D 1.93 F 3.75 E 0.07 O 3.83 N 1.9013 J 3.58 A −0.27 F 3.69 L 1.92 E 3.75 D −0.12 Q 3.81 M 1.8814 F 3.58 F −0.28 J 3.66 N 1.87 D 3.75 O −0.15 R 3.80 P 1.8715 H 3.50 H −0.45 P 3.62 J 1.74 H 3.50 H −0.30 P 3.58 Q 1.8516 P 3.50 J −0.49 H 3.41 H 1.60 P 3.50 P −0.60 H 3.39 H 1.5817 A 3.42 P −0.59 A 3.36 A 1.44 A 3.25 A −0.61 A 3.18 A 1.2618 B 2.92 B −1.16 B 2.76 B 0.89 B 2.75 B −1.56 B 2.59 B 1.54
Table 3.
Number of criteria satisÞed by each method on the minicollege data set, for +/− grades.
Plain Standardized Iterated Least Squares
Required (20) all all all allDesirable (13) 5 6 8 9Well-roundedness (4) 1 2 2 all
Test Population Redux (No +/− Grades)We now take the test population and drop all pluses and minuses from the
grades. Again, we determine some basic required relationships that any validranking system must satisfy:
• A > B; C > D; and G > H since A, C, and G have better grades in similarcourses.
We also recognize the following relationships as desirable:
• O > P because O has slightly better grades in the same courseload.• E > F because E has the same grades in a more difÞcult courseload.• O > Q, R because O has almost equivalent grades in a much more difÞcultcourseload.
• C > I, G because C has the same grades in a more difÞcult courseload.• I > K, L because I has the same grades in a more difÞcult courseload.• K, L > M, N because K and L have the same grades in a more difÞcultcourseload.
Alternatives to the Grade Point Average 291
• M, N > Q, R because M and N have the same grades in a more difÞcultcourseload.
If we postulate that the well-roundedness of a studentÕs schedule should affectrank, we also Þnd that C, E, G, and I should be ranked near each other because
• E has slightly worse grades in a more difÞcult, better-rounded courseload;and
• C has the same grades as G and I in a slightly more difÞcult, slightly lesswell-rounded courseload.
The rankings of this sample population are given in the right-hand half ofTable 2. Table 4 gives a comparison of the methods.
Table 4.
Number of criteria satisÞed by each method on the minicollege data set (no +/− grades).
Plain Standardized Iterated Least Squares
Required (3) all all all allDesirable (12) 1 6 9 9Well-roundedness (6) 3 1 3 4
Stability
HowWell Do the Models Agree?We have four ways of ordering students: plain GPA, standardized GPA,
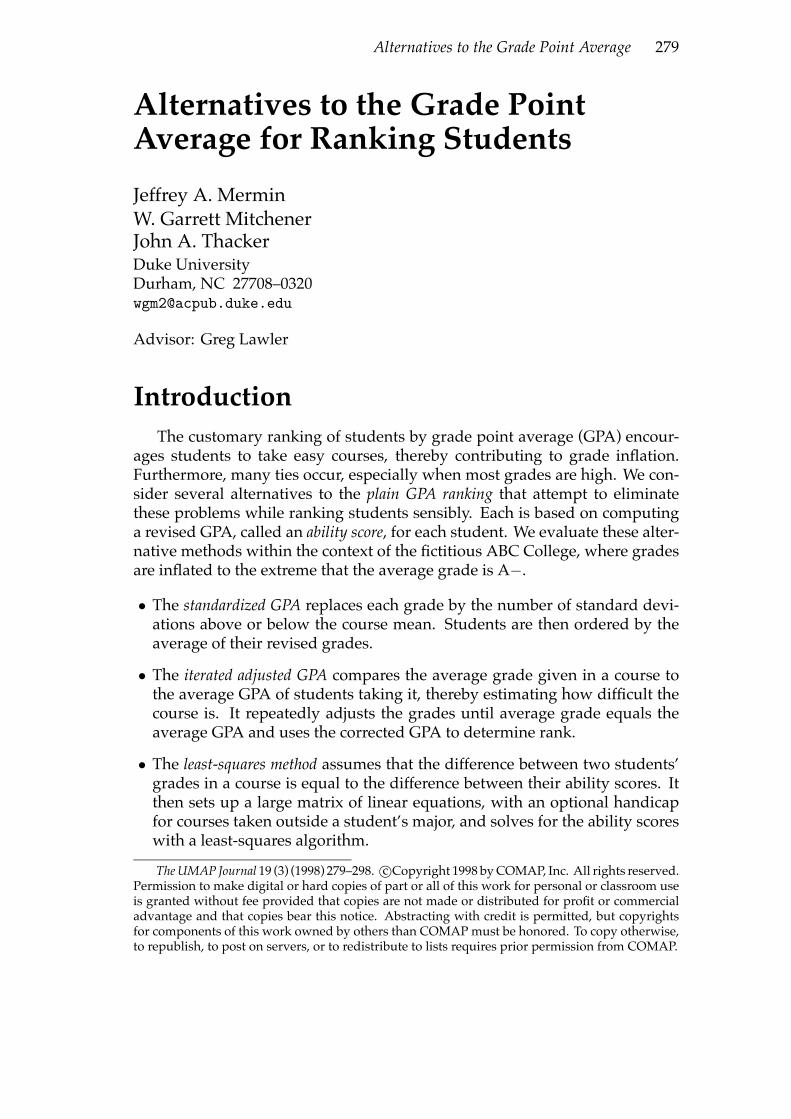
iterated adjusted GPA, and least squares. Since all four are more or less reason-able, they should agree fairly well with each other. One way to test agreementis to plot each studentÕs rank under onemethodwith his rank under the others.If the plot is scattered randomly, then the rankings do not agree about anything.If the plot is a straight line, then the rankings agree completely.Toget an idea forhoweachmodelworks,wecreatedbymeansof a computer
simulation a population of 1,000 students and 200 courses, with 6 courses perstudent. The details of the simulator are explained in the Appendix. Weimplemented all of the algorithms except least squares, which was too difÞcultfor the available time. A single run of the simulation is analyzed here, but theseresults are typical of other runs.
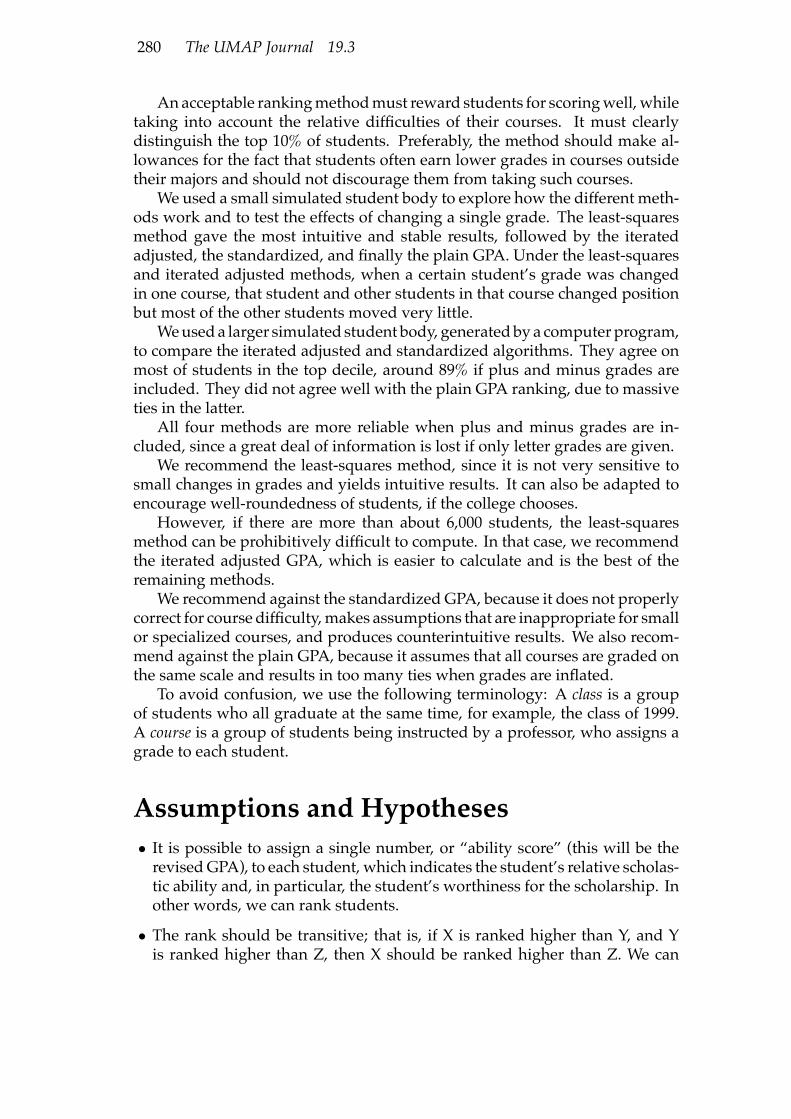
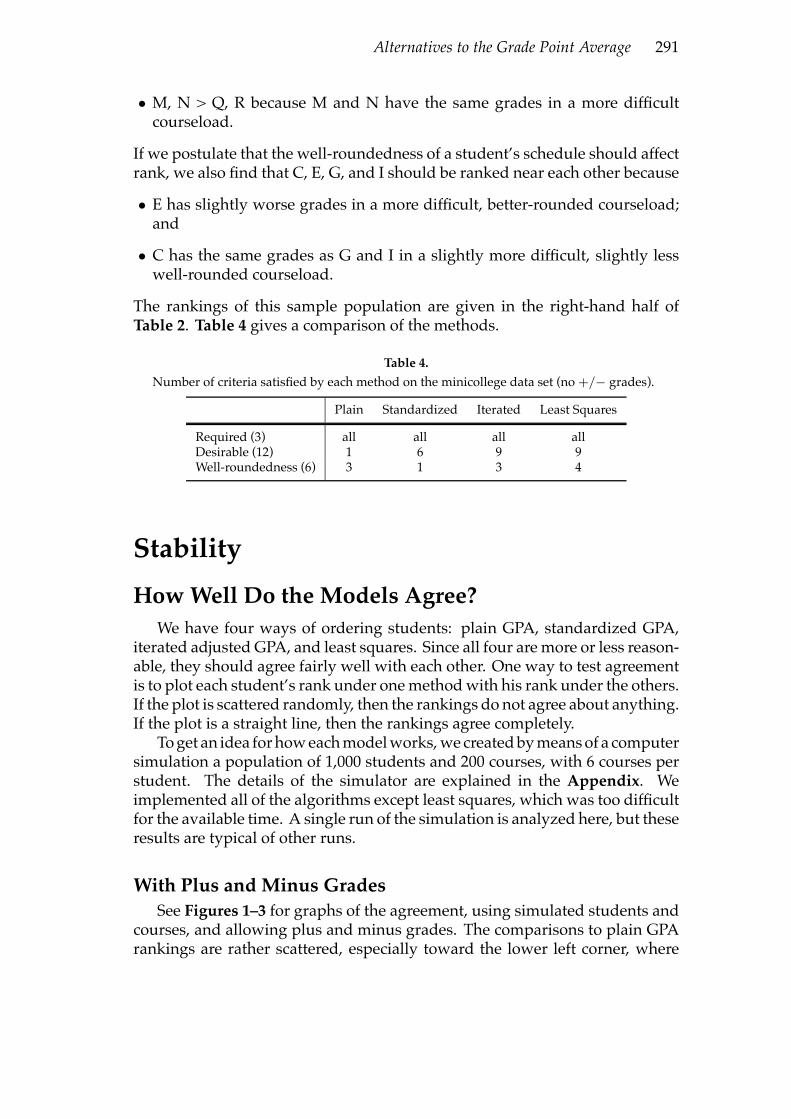
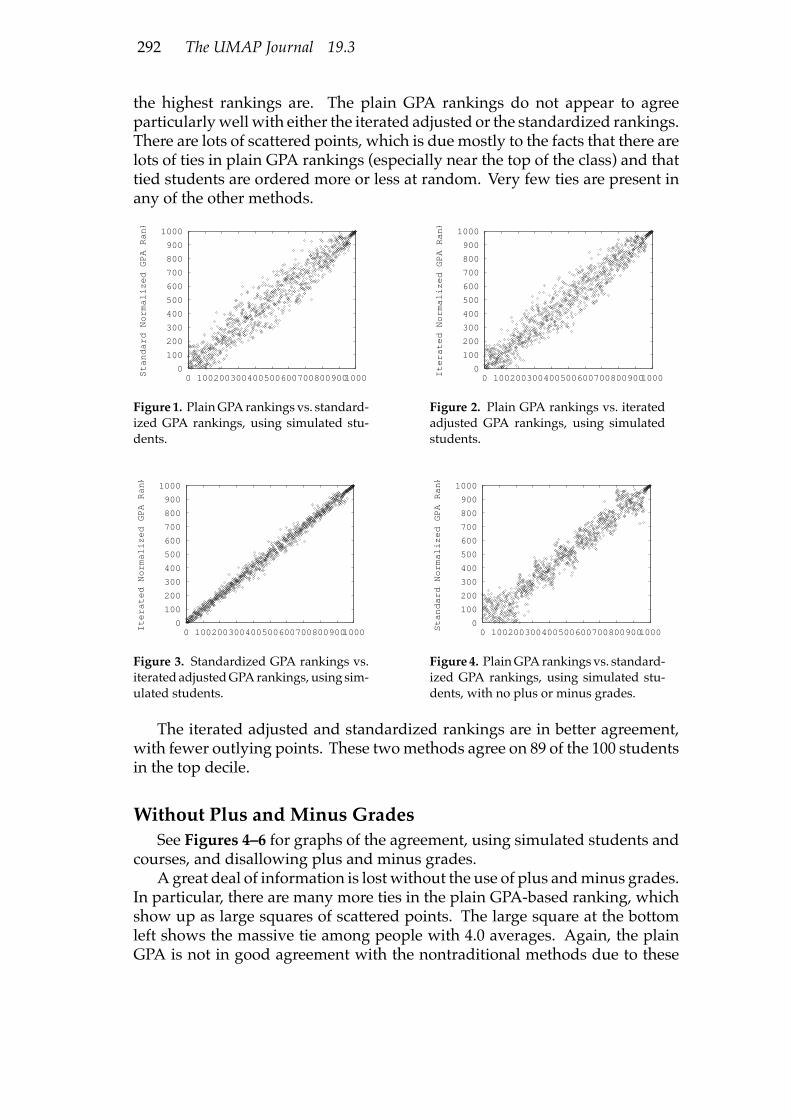
With Plus and Minus GradesSee Figures 1Ð3 for graphs of the agreement, using simulated students and
courses, and allowing plus and minus grades. The comparisons to plain GPArankings are rather scattered, especially toward the lower left corner, where
292 The UMAP Journal 19.3
the highest rankings are. The plain GPA rankings do not appear to agreeparticularlywell with either the iterated adjusted or the standardized rankings.There are lots of scattered points, which is due mostly to the facts that there arelots of ties in plain GPA rankings (especially near the top of the class) and thattied students are ordered more or less at random. Very few ties are present inany of the other methods.
0
100
200
300
400
500
600
700
800
900
1000
0 1002003004005006007008009001000Standard Normalized GPA Rank
Figure 1. PlainGPArankings vs. standard-ized GPA rankings, using simulated stu-dents.
0
100
200
300
400
500
600
700
800
900
1000
0 1002003004005006007008009001000Iterated Normalized GPA Rank
Figure 2. Plain GPA rankings vs. iteratedadjusted GPA rankings, using simulatedstudents.
0
100
200
300
400
500
600
700
800
900
1000
0 1002003004005006007008009001000Iterated Normalized GPA Rank
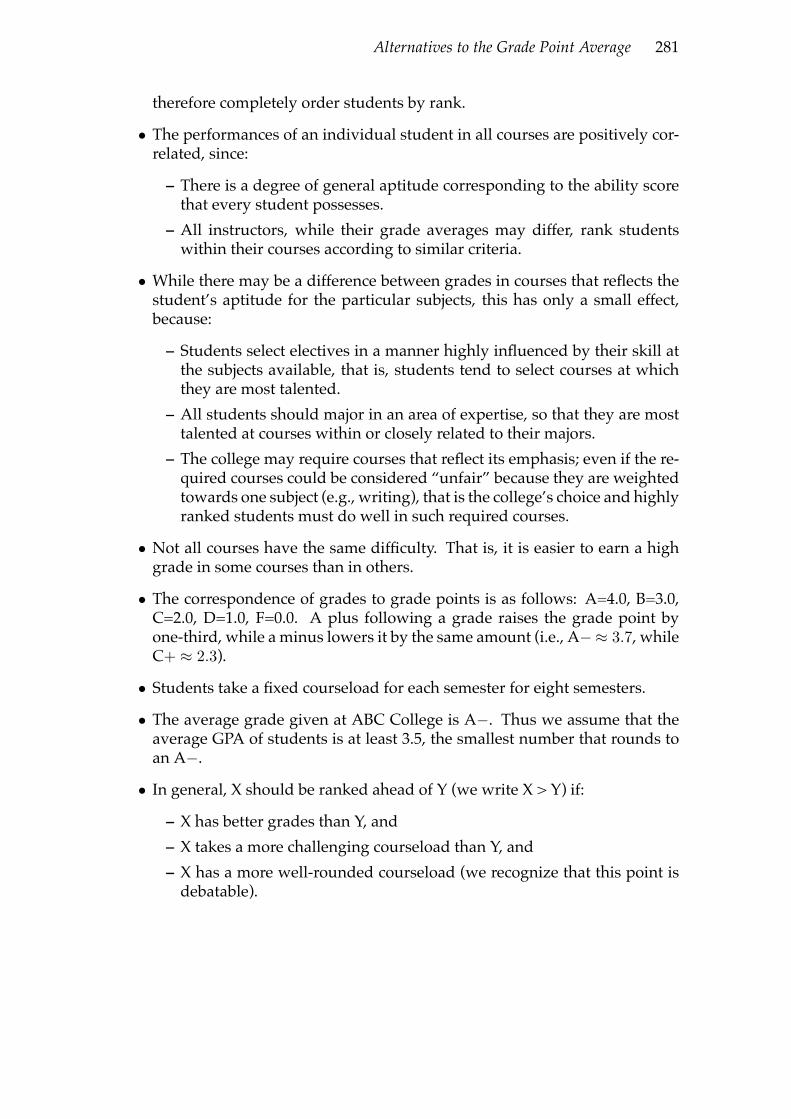
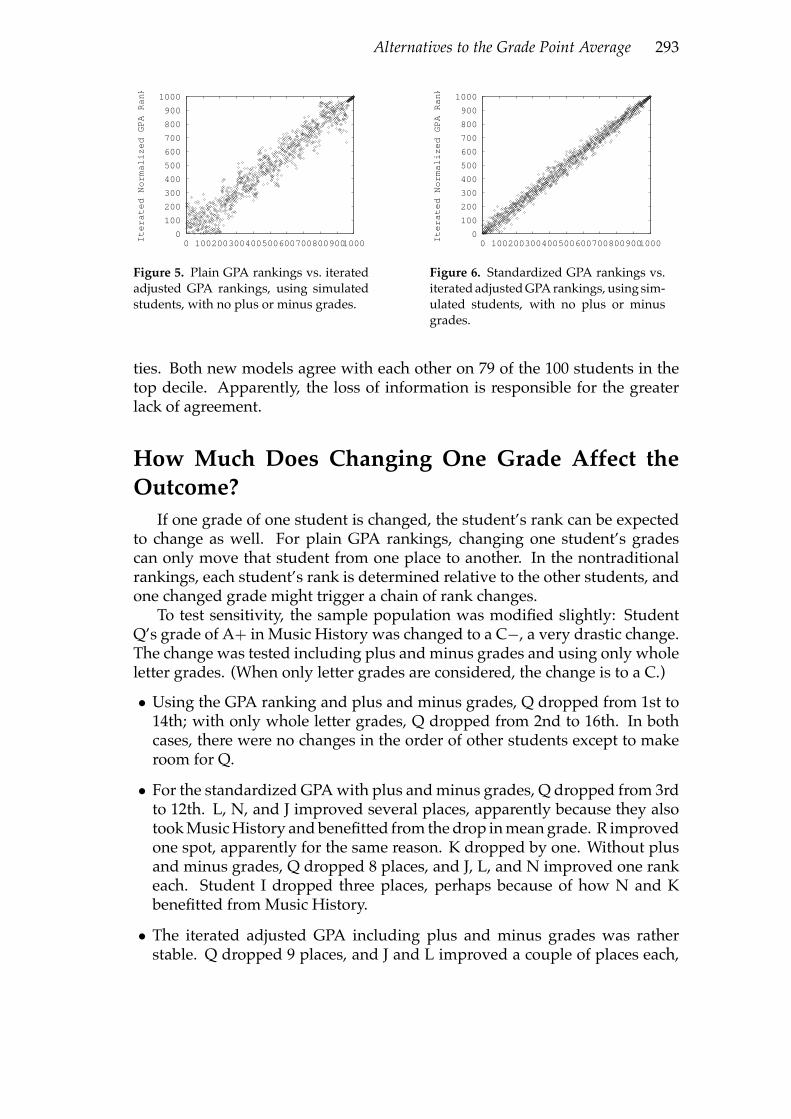
Figure 3. Standardized GPA rankings vs.iteratedadjustedGPArankings, using sim-ulated students.
0
100
200
300
400
500
600
700
800
900
1000
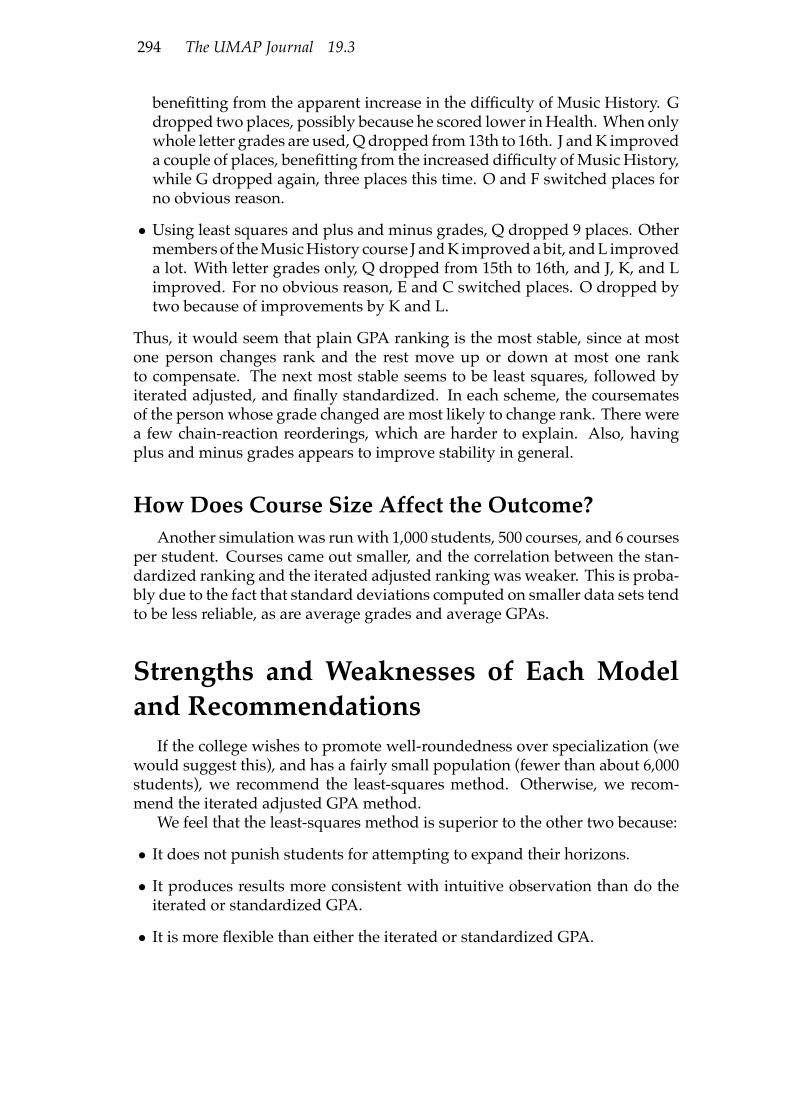
0 1002003004005006007008009001000Standard Normalized GPA Rank
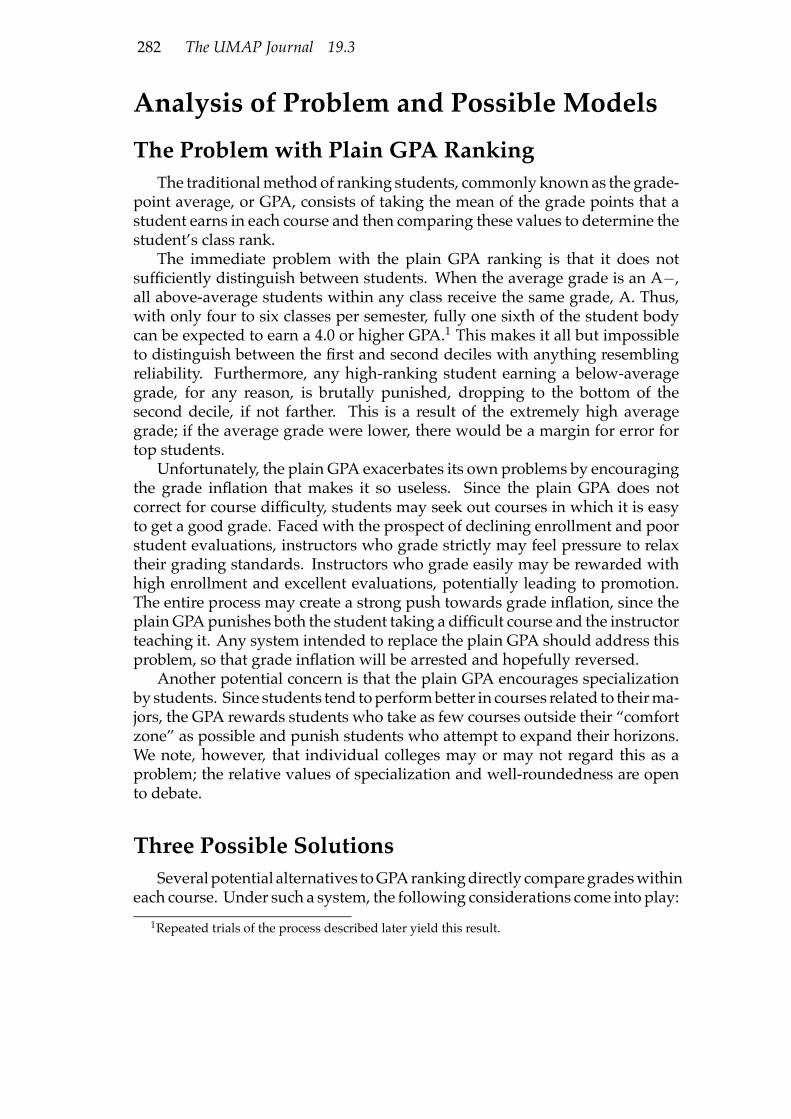
Figure 4. PlainGPArankings vs. standard-ized GPA rankings, using simulated stu-dents, with no plus or minus grades.
The iterated adjusted and standardized rankings are in better agreement,with fewer outlying points. These twomethods agree on 89 of the 100 studentsin the top decile.
Without Plus and Minus GradesSee Figures 4Ð6 for graphs of the agreement, using simulated students and
courses, and disallowing plus and minus grades.A great deal of information is lost without the use of plus andminus grades.
In particular, there are many more ties in the plain GPA-based ranking, whichshow up as large squares of scattered points. The large square at the bottomleft shows the massive tie among people with 4.0 averages. Again, the plainGPA is not in good agreement with the nontraditional methods due to these
Alternatives to the Grade Point Average 293
0
100
200
300
400
500
600
700
800
900
1000
0 1002003004005006007008009001000Iterated Normalized GPA Rank
Figure 5. Plain GPA rankings vs. iteratedadjusted GPA rankings, using simulatedstudents, with no plus or minus grades.
0
100
200
300
400
500
600
700
800
900
1000
0 1002003004005006007008009001000Iterated Normalized GPA Rank
Figure 6. Standardized GPA rankings vs.iteratedadjustedGPArankings, using sim-ulated students, with no plus or minusgrades.
ties. Both new models agree with each other on 79 of the 100 students in thetop decile. Apparently, the loss of information is responsible for the greaterlack of agreement.
How Much Does Changing One Grade Affect theOutcome?If one grade of one student is changed, the studentÕs rank can be expected
to change as well. For plain GPA rankings, changing one studentÕs gradescan only move that student from one place to another. In the nontraditionalrankings, each studentÕs rank is determined relative to the other students, andone changed grade might trigger a chain of rank changes.To test sensitivity, the sample population was modiÞed slightly: Student
QÕs grade of A+ in Music History was changed to a C−, a very drastic change.The change was tested including plus and minus grades and using only wholeletter grades. (When only letter grades are considered, the change is to a C.)
• Using the GPA ranking and plus and minus grades, Q dropped from 1st to14th; with only whole letter grades, Q dropped from 2nd to 16th. In bothcases, there were no changes in the order of other students except to makeroom for Q.
• For the standardized GPAwith plus andminus grades, Q dropped from 3rdto 12th. L, N, and J improved several places, apparently because they alsotookMusicHistory andbeneÞtted from thedrop inmeangrade. R improvedone spot, apparently for the same reason. K dropped by one. Without plusand minus grades, Q dropped 8 places, and J, L, and N improved one rankeach. Student I dropped three places, perhaps because of how N and KbeneÞtted from Music History.
• The iterated adjusted GPA including plus and minus grades was ratherstable. Q dropped 9 places, and J and L improved a couple of places each,
294 The UMAP Journal 19.3
beneÞtting from the apparent increase in the difÞculty of Music History. Gdropped two places, possibly because he scored lower inHealth. When onlywhole letter grades are used, Qdropped from13th to 16th. J andK improveda couple of places, beneÞtting from the increased difÞculty ofMusic History,while G dropped again, three places this time. O and F switched places forno obvious reason.
• Using least squares and plus and minus grades, Q dropped 9 places. Othermembers of theMusicHistory course J andK improvedabit, andL improveda lot. With letter grades only, Q dropped from 15th to 16th, and J, K, and Limproved. For no obvious reason, E and C switched places. O dropped bytwo because of improvements by K and L.
Thus, it would seem that plain GPA ranking is the most stable, since at mostone person changes rank and the rest move up or down at most one rankto compensate. The next most stable seems to be least squares, followed byiterated adjusted, and Þnally standardized. In each scheme, the coursematesof the person whose grade changed are most likely to change rank. There werea few chain-reaction reorderings, which are harder to explain. Also, havingplus and minus grades appears to improve stability in general.
How Does Course Size Affect the Outcome?Another simulationwas runwith 1,000 students, 500 courses, and 6 courses
per student. Courses came out smaller, and the correlation between the stan-dardized ranking and the iterated adjusted ranking was weaker. This is proba-bly due to the fact that standard deviations computed on smaller data sets tendto be less reliable, as are average grades and average GPAs.
Strengths and Weaknesses of Each Modeland RecommendationsIf the college wishes to promote well-roundedness over specialization (we
would suggest this), and has a fairly small population (fewer than about 6,000students), we recommend the least-squares method. Otherwise, we recom-mend the iterated adjusted GPA method.We feel that the least-squares method is superior to the other two because:
• It does not punish students for attempting to expand their horizons.• It produces results more consistent with intuitive observation than do theiterated or standardized GPA.
• It is more ßexible than either the iterated or standardized GPA.
Alternatives to the Grade Point Average 295
• It is clear and easily understood.The iterated adjusted GPA method has a few deÞnite advantages as well:
• It is signiÞcantly faster than the least-squares method.• If thewell-roundedness of students is not a consideration, it produces resultsthat are roughly as consistent with intuitive observation as the least-squaresmethod.
We feel that the standardizedGPAmethod is decidedly inferior, and shouldnot be recommended, because:
• It makes no attempt to correct for schedule difÞculty or well-roundedness.• It assumes that all courses have the same range of ability among their stu-dents.
• It produces results that are no more consistent with intuitive observationthan those produced by the plain GPA.
Further Recommendations
Transition from GPA RankingThe three methods given here all rank an entire student body for one
semester of courses. Thus, to rank students just within a single class, wemust either average their ability scores (revised GPAs) or their ranks withintheir class over each semester. The new system could be phased in at any timeif grades for enough preceding years are kept on record. The new rankingalgorithm could be applied to students who have graduated to determiningrankings for the next class. However, we recommend careful testing on severalpast years of data as well as current grades. The administration should beprepared for a great deal of student and faculty opposition because it is a new,untested system. The standardized and iterated adjusted schemes are likelyto encounter opposition because they directly alter the point values of gradesduring computation. The least-squares method simply reinterprets them andis less likely to make instructors feel that their authority has been violated.
Transfer StudentsABCCollege will have to come upwith its own policy concerning the rank-
ing of transfer students. One option is to translate transferred grades to anequivalent grade in a particular course at ABC. That allows the ranking algo-rithm to run on the maximum amount of information. However, someone willhave to compare all other colleges to ABC very carefully to create the ofÞcial
296 The UMAP Journal 19.3
translation policy. Another possibility is to ignore transferred grades whencomputing the rankings. That avoids the problem of estimating how gradesat other schools compare to ABCÕs, but at the expense of throwing out a lot ofinformation.
Importance of Plus and Minus GradesIt seems that plus and minus grades are extremely helpful in determining
class rank, especially since grades are so heavily inßated. Without them, ABChas to rank its students primarily on the basis of just two grades, A and B, and aconsiderable fraction of the students have exactly the same grades. With plusesand minuses, there are six different grades, A+, A, A−, B+, B, and B−, whichcome into play, thus differentiating students more precisely. All four rankingsystems appear to work better when plus and minus grades are used. ABCshould encourage its instructors to use them with care.
Appendix: Details of the Simulation
Simulating CoursesWe want to take the following things into consideration when creating
courses:
• Students tend to pick more courses in areas they are comfortable in. Inparticular, they are required to select courses in their majors.
• Courses vary in subject matter. Some require a lot of math and scientiÞcexperience,while others focusmoreonhumannature, history, and literature.
• Courses vary in difÞculty. Here, we are not considering the difÞculty ofthe material, but rather how difÞcult it is to get a good grade in the course.Students generally prefer courses where they expect to get better grades.
• Students are able to estimate their grade in a course fairly accurately.Each simulated course c therefore has three attributes. The Þrst two are
fractions, cs and ch, which represent how much the course emphasizes thesciences and the humanities, respectively. Since these are fractions of the totaleffort required for a course, we have cs + ch = 1. In the simulation, cs isdetermined by generating uniformly distributed random numbers between 0and 1, and ch = 1− cs.The third attribute ce is the ÒeasinessÓ of the course, that is, how easy it is
to get a good grade. This number represents the tendency of the instructor togive higher or lower grades. In the simulation, ce is determined by taking auniformly distributed random number between −0.5 and 0.5, indicating that
Alternatives to the Grade Point Average 297
instructors may skew their grades by up to half a letter grade up or down. Weuse a uniform distribution rather than a normal distribution so as to make thecourses vary in difÞculty over the entirety of a small range.
Simulating StudentsWewant to take the following things into consideration when creating sim-
ulated students:
• Students have varying strengths and weaknesses. In particular, some stu-dents have different ability levels in the sciences and humanities. Studentsprefer courses within their comfort zones.
• Students prefer getting higher grades.Each simulated student S has two attributes, Ss and Sh. Both of these are
numbers representing grades that indicate the studentÕs abilities in the sciencesand humanities, respectively. Both range from 0 to gmax, which is either 4.0 or4.3 depending on the grading scale.Given a course c and a student S, the grade for that student in that course
is given by
g = min (Sscs + Shch + ce, gmax) . (1)
In the simulation, Ss and Sh are determined by taking random numbersfrom a normal distribution with mean 3.5 and standard deviation 1.0, with amaximum of gmax.
Generating a Simulated PopulationThe simulated population is created by Þrst generating a number of courses
and a number of students. A courseload is selected for each student S byrepeating the following: First, a course c is selected at random. If the student isweak in science (Ss < 2.5) and the course is heavy in science (cs > 0.75), thenthe course is rejected. Similarly, if the student is weak in humanities and thecourse is heavy in humanities, the course is rejected. If the student estimateshis or her overall grade at less than 2.5, the course is rejected. This process ofselection and rejection is repeated until a course is not rejected, but at most tentimes, and then the last course is taken no matter what. The selected course isthen added to the studentÕs schedule and the grade computed as stated in (1),rounded to the nearest possible grade.The rejectionprocessallows for the studentsÕpreferences in selectingcourses,
and the fact that at most ten courses can be rejected allows for distribution re-quirements.
298 The UMAP Journal 19.3
Analysis of the Simulated DataThe simulation programwas used to create 1,000 students and 200 courses,
where the courseload was six. Thus, there were around 1,000 × 6/200 ≈ 30people in each course, which is reasonable. Two runs were made, one withonly whole grades, and one with + and − grades allowed.We can determine a lower bound for the average GPA at ABC College.
Suppose we have N students, each of whom takes M courses. Denote by gijthe grade of student i in that studentÕs jth course. Then the average grade forthat entire class is given by ∑N
i=1
∑Mj=1 gij
NM,
and the average GPA is given by
∑Ni=1
PMj=1 gij
M
N.
The two are equal, so if the average grade at ABC College is A−, then theaverage GPA should be no more than 3.5. Any GPA less than 3.5 would berounded to a B+ or less, and those greater than 3.5 would be rounded to A−or better. In the both data sets, the median GPAwas 3.5, which agrees with theinformation given about ABC College.
Strengths and Weaknesses of the SimulationThe computation runs very quicklyÑin a fewminutesÑeven though it was
written in a high-level interpreted language (Python). It is very ßexible andcan be adjusted to reßect different grade distributions, as may be found indifferent colleges. It takes into account variation in student interest and incourse material.However,most of the courses turn out roughly the same size. Many colleges
have a high proportion of small, seminar-style courses, and there are almostalways some very large lectures. The simulation ranks the whole school to-gether and does not distinguish among the classes. There are only two majorsin the simulation, sciences and humanities; and while there are forces withinthe simulation that push students into taking more courses in their preferredarea of knowledge, there are no guarantees that the resulting schedules accu-rately reßect major requirements. There are also no prerequisites enforced, andthus no courses that are predominantly populated by freshmen and seniors.This also means that the simulator cannot realistically create courses for morethan one year.


![Amendments/clarification in respect of based on Senate ...Semester Grade Point Average) (SGPA) and Cumulative Grade Point Average (CGPA)] Modified formula for calculation of CGPA approved](https://img.pdfslide.net/doc/110x75/607efc63a02ba013f85829bb/amendmentsclarification-in-respect-of-based-on-senate-semester-grade-point.jpg)


![Chapter 2: Problem Solving - Djamel Bouchaffra130].pdf · Chapter 2: Problem Solving ... Calculate and report the grade-point average for a class – Discussion: The average grade](https://img.pdfslide.net/doc/110x75/5abffe5f7f8b9a5a4e8b7332/chapter-2-problem-solving-djamel-130pdfchapter-2-problem-solving-calculate.jpg)