Embed Size (px)
Citation preview
Ninth International Congress of the Brazilian Geophysical Society
Amazon Seismic Data Imaging with the WIT System Lourenildo W. B. Leite*, Zeno Heilmann**, Ingo Koglin**, Jürgen Mann**, Markus Von Steht** and Pedro Chira-Oliva* *Department of Geophysics, UFPA, Brazil **Institute of Geophysics, Uni Karlsruhe, Germany Copyright 2005, SBGf - Sociedade Brasileira de Geofísica
This paper was prepared for presentation at the 9th International Congress of the Brazilian Geophysical Society held in Salvador, Brazil, 11-14 September 2005.
Contents of this paper were reviewed by the Technical Committee of the 9th International Congress of the Brazilian Geophysical Society. Ideas and concepts of the text are authors’ responsibility and do not necessarily represent any position of the SBGf, its officers or members. Electronic reproduction or storage of any part of this paper for commercial purposes without the written consent of the Brazilian Geophysical Society is prohibited. ____________________________________________________________________________
Abstract
A line of land-data set from the Takutu sedimentary basin (Brazil) was processed as an example, not for comparison with other processing packages, to demonstrate once more the basic steps of the potential CRS-stack based data-driven imaging system aiming at to establish a work-flow for basin reevaluation. Based on the common-reflection-stack (CRS) attributes, a smooth macro-velocity model was determined via tomographic inversion for use on pre- and/or poststack depth migration was carried out.
Poststack and prestack depth migration benefit from this approach. Also other CRS-stack based processing steps is being added in the system as, e.g. residual static corrections, limited-aperture migration based on the estimated projected Fresnel zone, determination of the geometrical spreading factor, and analysis of amplitude variation versus offset.
Geological interpretation is to be carried out mainly on the bases of ZO and migrated sections, considering that all maps have the proper scale, axis exaggeration and size. From visual details of the panels, we can interpret thinning, and an anticline and faults can be mappe where plays of horsts, grabens and rollovers are indicated; on the other hand, the basement can not be simply traced. Also, the right hand part of the section needs more processing, and artifacts can be interpreted in the panels.
Introduction
This paper presents results obtained for land seismic data of the Takutu graben, where we used for reference the processing and imaging workflow for the Rhein graben seismic data. Heilmann et al., 2002 and Mann et al. 2004 are basic references on this CRS-stack data-driven imaging approach. Considering that these reflection seismic surveys are submitted to proprietary laws, our intention is to be accessible to academic research projects for basin reevaluation.
The Takutu dataset used was acquired by Petrobras (Takutu Basin, Rondônia, Brazil) for petroleum exploration. The data is free for use on university research and it was obtained from ANP. The goal here is to support academic projects that can deal with basin reevaluation based on seismic reprocessing. The
software used is non-commercial, and in the spirit of continuous cooperation between the Geophysics Department of the Federal University of Pará (Brazil) and WIT Consortium of the Uni Karlsruhe, Germany. This data set is offered in the form of non-processed field records, therefore a complete pre-processing stage was necessary and described in the sequel.
Following the description by Eiras and Kinoshita (1990), the Takutu basin is classified as a Mesozoic intracontinental rift, oriented NE-SW, with approximately 300 km long and 40 km wide. It was developed in the central part of the Guyana shield, and it is located at the border Brazil and Guyana. The rift is filled with sediments ranging from the Jurassic to the Quaternary, and composed of two asymmetrical half-grabens: The SW part dips southeasterly and the NE part dips northwesterly.
The structural scenario of the Takutu basin features horsts, grabens, anticlines, synclines, flower structures, and dip inversions (rollovers). Transcurrent faulting is considered to have reactivated local features that were developed in the rift stage.
The stratigraphic scenario of the Takutu basin is divided into four depositional sequences, that reflect the geological evolution of the area. The first basal sequence is represented by the volcanic Apoteri formation and by the shaly Manari formation, both related to the pre-rift phase. The second sequence is represented by the evaporitic Pirara formation, and relates to the stage of maximum stretching in the rift phase. The third sequence is represented by the sands and conglomerates of the Tacutu and Tucano formations, and are interpreted to correspond to the continuous decrease in stretching. The fourth sequence is represented by the lateritic and alluvium of the Boa Vista and North Savannas formations.
Continuing with Eiras and Kinoshita (1990), the conclusions for the model of the Takutu basin were formally based on the interpretation of the conventional processed seismic data, seismic reprocessing, seismic stratigraphy, surface geology, drilled wells, geochronology and geochemistry. Several structural styles were considered for the basin in focus, and the most attractive were deltaic fan-shaped, compressional inversions, internal horst highs, and dip reversals. Our intention at this moment is not yet to trace new evidences for the structural scenario for the Takutu basin, what may follow with the course of the studies with more systematically processed data completing at least a full block for a proper geological interpretation.
The workflow for reference was the one for the dataset of the Rhein graben area acquired by the HotRock Company with the aim to obtain a structural image of
WIT IMAGING OF TACUTU SEISMIC DATA _ _ _ _ _ _ _ _ _ _ _ _ _ _ _ _ _ _ _ _ _ _ _ _ _ _ _ _ _ _ _ _ _ _ _ _ _ _ _ _ _ _ _ _ _ _ _ _ _ _ _ _ _ _ _ _ _ _ _ _ _ _ _ _ _ _ _ _ _ _ _ _ _ _ _ _ _ _ _ _ _ _ _ _ _ _ _ _ _ _ _ _ _ _ _ _ _ _ _ _ _ _ _ _ _ _ _ _ _ _ _ _ _ _ _ _ _ _ _ _ _ _ _ _ _ _ _ _ _ _ _ _ _ _ _ _ _ _ _ _ _ _ _ _ _ _ _ _ _ _ _ _ _ _ _ _ _ _ _ _ _ _ _ _ _ _ _ _ _ _ _ _ _ _ _ _ _ _ _ _ _ _ _ _ _ _ _ _ _ _ _ _ _ _ _ _ _ _ _ _ _ _ _ _ _ _ _ _ _ _ _ _ _ _ _ _ _ _ _ _ _ _ _ _ _ _ _ _ _ _ _ _ _ _ _ _ _ _ _ _ _ _ _ _ _ _ _ _ _ _ _ _ _ _ _ _ _ _ _ _ _ _ _ _ _ _ _ _ _ _ _ _ _ _ _ _ _ _ _ _ _ _ _ _ _ _ _ _ _ _ _ _ _ _ _ _ _ _ _ _ _ _ _ _ _ _ _ _ _ _ _ _ _ _ _ _ _ _ _ _ _ _ _ _ _ _ _ _ _ _ _ _ _ _
Ninth International Congress of the Brazilian Geophysical Society
2
relevant structures for a projected geothermal power plant. A power plant is based on boreholes for production and re-injection of thermal water at a depth of 2.5 km, where a strong fractured horizon of hot-water saturated is to be located. The production rate depends mainly on the degree of fracturing of a target horizon, and a detailed knowledge of the subsurface structure is necessary. A standard preprocessing was applied to the Rhein graben dataset, followed by an imaging sequence consisting of: (1) NMO correction stack; (2) DMO correction stack; (3) FD time migration; and (4) a time-to-depth conversion using macrovelocity models based on stacking velocity sections. Complementary to this standard processing, the main steps of the CRS-stack based seismic imaging workflow were carried out. Also, additional tasks, such as residual static corrections , true-amplitude migration and AVO analysis may follow in the course of further research collaboration.
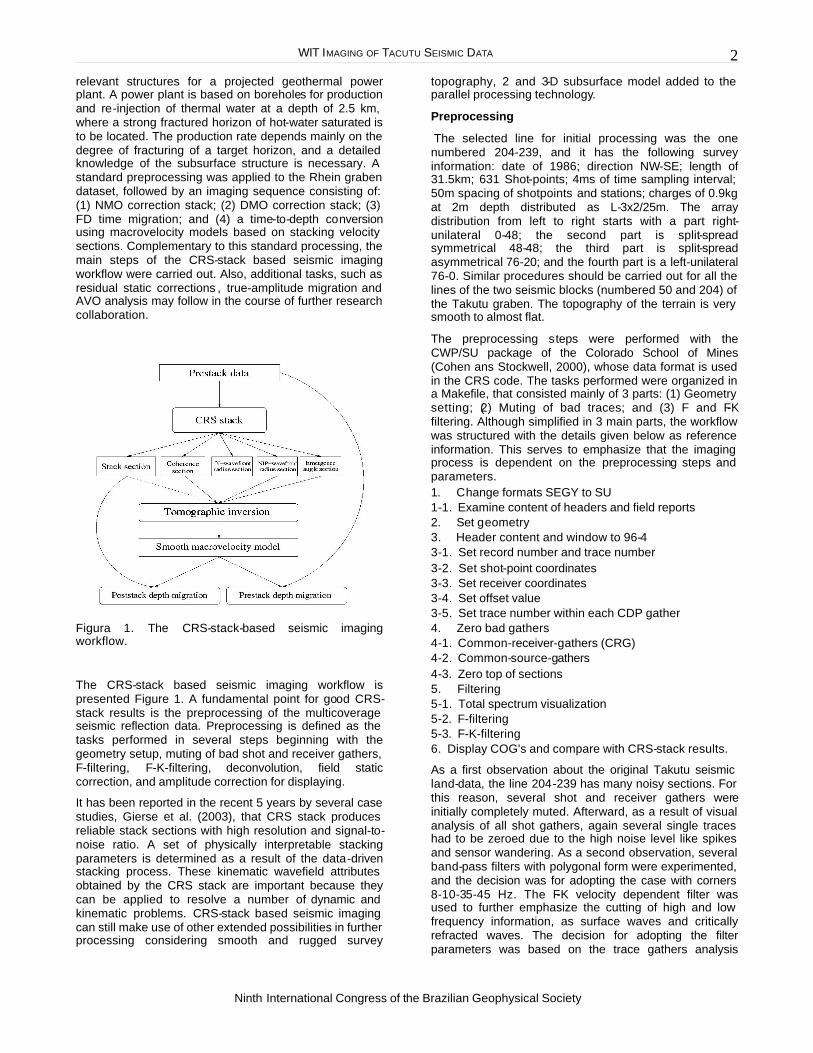
Figura 1. The CRS-stack-based seismic imaging workflow.
The CRS-stack based seismic imaging workflow is presented Figure 1. A fundamental point for good CRS-stack results is the preprocessing of the multicoverage seismic reflection data. Preprocessing is defined as the tasks performed in several steps beginning with the geometry setup, muting of bad shot and receiver gathers, F-filtering, F-K-filtering, deconvolution, field static correction, and amplitude correction for displaying.
It has been reported in the recent 5 years by several case studies, Gierse et al. (2003), that CRS stack produces reliable stack sections with high resolution and signal-to-noise ratio. A set of physically interpretable stacking parameters is determined as a result of the data-driven stacking process. These kinematic wavefield attributes obtained by the CRS stack are important because they can be applied to resolve a number of dynamic and kinematic problems. CRS-stack based seismic imaging can still make use of other extended possibilities in further processing considering smooth and rugged survey
topography, 2 and 3-D subsurface model added to the parallel processing technology.
Preprocessing
The selected line for initial processing was the one numbered 204-239, and it has the following survey information: date of 1986; direction NW-SE; length of 31.5km; 631 Shot-points; 4ms of time sampling interval; 50m spacing of shotpoints and stations; charges of 0.9kg at 2m depth distributed as L-3x2/25m. The array distribution from left to right starts with a part right-unilateral 0-48; the second part is split-spread symmetrical 48-48; the third part is split-spread asymmetrical 76-20; and the fourth part is a left-unilateral 76-0. Similar procedures should be carried out for all the lines of the two seismic blocks (numbered 50 and 204) of the Takutu graben. The topography of the terrain is very smooth to almost flat.
The preprocessing steps were performed with the CWP/SU package of the Colorado School of Mines (Cohen ans Stockwell, 2000), whose data format is used in the CRS code. The tasks performed were organized in a Makefile, that consisted mainly of 3 parts: (1) Geometry setting; (2) Muting of bad traces; and (3) F and F-K filtering. Although simplified in 3 main parts, the workflow was structured with the details given below as reference information. This serves to emphasize that the imaging process is dependent on the preprocessing steps and parameters. 1. Change formats SEGY to SU 1-1. Examine content of headers and field reports 2. Set geometry 3. Header content and window to 96-4 3-1. Set record number and trace number 3-2. Set shot-point coordinates 3-3. Set receiver coordinates 3-4. Set offset value 3-5. Set trace number within each CDP gather 4. Zero bad gathers 4-1. Common-receiver-gathers (CRG) 4-2. Common-source-gathers 4-3. Zero top of sections 5. Filtering 5-1. Total spectrum visualization 5-2. F-filtering 5-3. F-K-filtering 6. Display COG's and compare with CRS-stack results.
As a first observation about the original Takutu seismic land-data, the line 204-239 has many noisy sections. For this reason, several shot and receiver gathers were initially completely muted. Afterward, as a result of visual analysis of all shot gathers, again several single traces had to be zeroed due to the high noise level like spikes and sensor wandering. As a second observation, several band-pass filters with polygonal form were experimented, and the decision was for adopting the case with corners 8-10-35-45 Hz. The F-K velocity dependent filter was used to further emphasize the cutting of high and low frequency information, as surface waves and critically refracted waves. The decision for adopting the filter parameters was based on the trace gathers analysis

LEITE, HEILMANN, KOGLIN, MANN, STEHT AND P. CHIRA-OLIVA _ _ _ _ _ _ _ _ _ _ _ _ _ _ _ _ _ _ _ _ _ _ _ _ _ _ _ _ _ _ _ _ _ _ _ _ _ _ _ _ _ _ _ _ _ _ _ _ _ _ _ _ _ _ _ _ _ _ _ _ _ _ _ _ _ _ _ _ _ _ _ _ _ _ _ _ _ _ _ _ _ _ _ _ _ _ _ _ _ _ _ _ _ _ _ _ _ _ _ _ _ _ _ _ _ _ _ _ _ _ _ _ _ _ _ _ _ _ _ _ _ _ _ _ _ _ _ _ _ _ _ _ _ _ _ _ _ _ _ _ _ _ _ _ _ _ _ _ _ _ _ _ _ _ _ _ _ _ _ _ _ _ _ _ _ _ _ _ _ _ _ _ _ _ _ _ _ _ _ _ _ _ _ _ _ _ _ _ _ _ _ _ _ _ _ _ _ _ _ _ _ _ _ _ _ _ _ _ _ _ _ _ _ _ _ _ _ _ _ _ _ _ _ _ _ _ _ _ _ _ _ _ _ _ _ _ _ _ _ _ _ _ _ _ _ _ _ _ _ _ _ _ _ _ _ _ _ _ _ _ _ _ _ _ _ _ _ _ _ _ _ _ _ _ _ _ _ _ _ _ _ _ _ _ _ _ _ _ _ _ _ _ _ _ _ _ _ _ _ _ _ _ _ _ _ _ _ _ _ _ _ _ _ _ _ _ _ _ _ _ _ _ _ _ _ _ _ _ _ _ _ _ _ _
Ninth International Congress of the Brazilian Geophysical Society
3 3
through the spectrum and stack results, reinforcing the importance of the pre-processing stage on the CRS stack results. Also, it should be clear that, intentionally, static correction and ghost deconvolution were not carried out on this data. Therefore, increased better results on stacking, tomography and migration can be obtained after inclusion of other pre-processing techniques.
Imaging
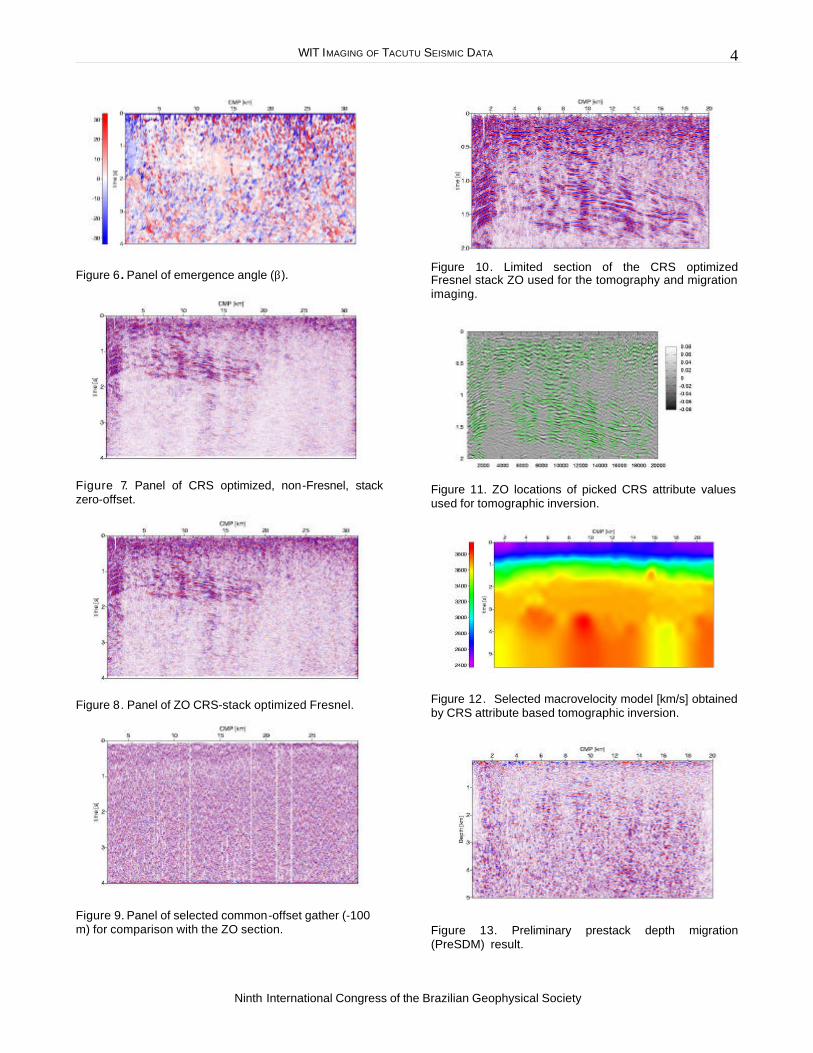
The time panels of kinematic CRS wavefield attributes, version 2-D for flat surface, as indicated in Figure 1, are the following:(1) A section of the emergence angle of the ZO normal ray with respect to the normal to the measurement surface; (2) A section of the radius of curvature of the wavefront relative to a normal incidence point (NIP) as observed at the emergence point of the normal ray; and (3) A section of the curvature of the normal wavefront due to an exploding reflector element at the NIP. Coherence sections were used to mask out locations with very low coherence value, considering that such locations are not expected to be associated with reliable attributes. The sections of emergence angle and NIP wave radius are used to obtain optimized stacking velocity sections (Mann, 2001).
The following figures display the results. Figure 2 displays the coherence panel that serves to indicate the fit between the determined CRS stacking operators and the reflection events. Figure 3 displays the number of traces used on the CRS-stack process. It is clear that there are zones of lower density traces, and they correspond to noisy areas. Figure 4 displays the radius of curvature of the normal-incidence point RNIP. Figure 5 displays the radius of curvature of the normal-wave RN. Figure 6 displays the vertical emergence angle of the normal ray (β). Figure 7 displays the simulated non-Fresnel CRS zero-offset panel. Figure 8 displays the simulated Fresnel CRS zero-offset panel. Figure 9 displays a common-offset gather for a direct use in the analysis of ZO section in interpreting underlying reflectors where we can observe the difficulties in doing so. Figure 10 displays a selected window of the ZO-Fresnel stack panel for details analysis in interpreting underlying reflectors where we can observe the facilities in doing so. Figure 11 displays a selected window of the ZO-Fresnel stack panel for details analysis in the automatic picking for tomographic inversion, where we can see the selected points (green crosses) after some editing. Figure 12 displays the velocity model distribution obtained by tomographic inversion, and it serves as input for the migration process. Figures 13 and 14 display the prestack and poststack depth migration panels, respectively.
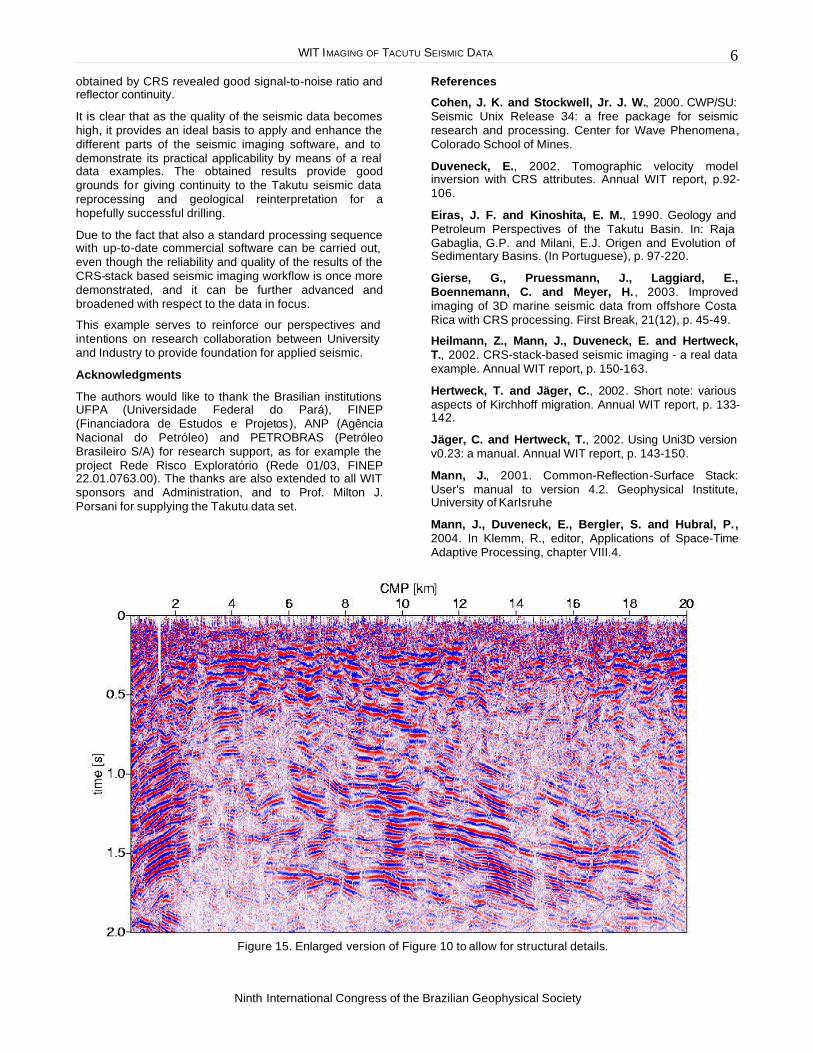
The main panel 10 serves to give details on the final ZO sections to draw reflector zones related to stratigraphical units. Therefore, a prominent reflector dips from ≈0.5 s (left) to ≈1.5 s (right). The most prominent anticline structure is on the left side between ≈2.0 km and ≈6.0 km. The panel 15 is an enlarged version of Figure 10 for better visualization of structures.
The set of panels produced by the CRS process sometimes look at first glance without good and clear correlative information, while the simulated zero offset
sections show rather surprising correlated patterns in the panel.
Figure 2. Panel of coherence panel for line Takutu 204-239.
Figure 3. Panel of density of traces.
Figure 4 . Panel of radius of curvature of normal incidence point wave (RNIP).
Figure 5 . Panel of curvature of normal wave (RN).
WIT IMAGING OF TACUTU SEISMIC DATA _ _ _ _ _ _ _ _ _ _ _ _ _ _ _ _ _ _ _ _ _ _ _ _ _ _ _ _ _ _ _ _ _ _ _ _ _ _ _ _ _ _ _ _ _ _ _ _ _ _ _ _ _ _ _ _ _ _ _ _ _ _ _ _ _ _ _ _ _ _ _ _ _ _ _ _ _ _ _ _ _ _ _ _ _ _ _ _ _ _ _ _ _ _ _ _ _ _ _ _ _ _ _ _ _ _ _ _ _ _ _ _ _ _ _ _ _ _ _ _ _ _ _ _ _ _ _ _ _ _ _ _ _ _ _ _ _ _ _ _ _ _ _ _ _ _ _ _ _ _ _ _ _ _ _ _ _ _ _ _ _ _ _ _ _ _ _ _ _ _ _ _ _ _ _ _ _ _ _ _ _ _ _ _ _ _ _ _ _ _ _ _ _ _ _ _ _ _ _ _ _ _ _ _ _ _ _ _ _ _ _ _ _ _ _ _ _ _ _ _ _ _ _ _ _ _ _ _ _ _ _ _ _ _ _ _ _ _ _ _ _ _ _ _ _ _ _ _ _ _ _ _ _ _ _ _ _ _ _ _ _ _ _ _ _ _ _ _ _ _ _ _ _ _ _ _ _ _ _ _ _ _ _ _ _ _ _ _ _ _ _ _ _ _ _ _ _ _ _ _ _ _ _ _ _ _ _ _ _ _ _ _ _ _ _ _ _ _ _ _ _ _ _ _ _ _ _ _ _ _ _ _ _ _
Ninth International Congress of the Brazilian Geophysical Society
4
Figure 6 . Panel of emergence angle (β). Figure 7. Panel of CRS optimized, non-Fresnel, stack zero-offset. Figure 8. Panel of ZO CRS-stack optimized Fresnel. Figure 9. Panel of selected common-offset gather (-100 m) for comparison with the ZO section.
Figure 10. Limited section of the CRS optimized Fresnel stack ZO used for the tomography and migration imaging.
Figure 11. ZO locations of picked CRS attribute values used for tomographic inversion.
Figure 12. Selected macrovelocity model [km/s] obtained by CRS attribute based tomographic inversion.
Figure 13. Preliminary prestack depth migration (PreSDM) result.

LEITE, HEILMANN, KOGLIN, MANN, STEHT AND P. CHIRA-OLIVA _ _ _ _ _ _ _ _ _ _ _ _ _ _ _ _ _ _ _ _ _ _ _ _ _ _ _ _ _ _ _ _ _ _ _ _ _ _ _ _ _ _ _ _ _ _ _ _ _ _ _ _ _ _ _ _ _ _ _ _ _ _ _ _ _ _ _ _ _ _ _ _ _ _ _ _ _ _ _ _ _ _ _ _ _ _ _ _ _ _ _ _ _ _ _ _ _ _ _ _ _ _ _ _ _ _ _ _ _ _ _ _ _ _ _ _ _ _ _ _ _ _ _ _ _ _ _ _ _ _ _ _ _ _ _ _ _ _ _ _ _ _ _ _ _ _ _ _ _ _ _ _ _ _ _ _ _ _ _ _ _ _ _ _ _ _ _ _ _ _ _ _ _ _ _ _ _ _ _ _ _ _ _ _ _ _ _ _ _ _ _ _ _ _ _ _ _ _ _ _ _ _ _ _ _ _ _ _ _ _ _ _ _ _ _ _ _ _ _ _ _ _ _ _ _ _ _ _ _ _ _ _ _ _ _ _ _ _ _ _ _ _ _ _ _ _ _ _ _ _ _ _ _ _ _ _ _ _ _ _ _ _ _ _ _ _ _ _ _ _ _ _ _ _ _ _ _ _ _ _ _ _ _ _ _ _ _ _ _ _ _ _ _ _ _ _ _ _ _ _ _ _ _ _ _ _ _ _ _ _ _ _ _ _ _ _ _ _ _ _ _ _ _ _ _ _ _ _ _ _ _ _ _ _
Ninth International Congress of the Brazilian Geophysical Society
5 5
Figure 14. Preliminary poststack depth migration (PostSDM) result.
A tomographic inversion based on the kinematic NIP wavefront attributes, as developed by Duveneck (2002), was carried out to obtain a data consistent smooth macrovelocity model for depth imaging of time-domain pre- and/or poststack data. This method is based on: (1) the description of a smooth two-dimensional macrovelocity by B-splines; (2) simultaneous fit to all data points at all iterations; (3) simultaneous update of all model parameters at all iterations. In this case study, about several hundreds of ZO sam ples together with the associated attribute values were picked for each profile to achieve the best resolution possible. Automatic picking was carried out using a module based on the coherence associated with the ZO samples. The picked data shown in Figure 11 was edited using criteria to discriminate outliers and attributes related to multiples before the tomographic inversion process was applied. The obtained macrovelocity model is displayed in Figure 12. In general, the velocity models obtained at each iteration directly looked as non comparable, however they were more similar at the later iterations. For display and analysis, only a limited space-time window (20km by 2s) was used, since the remaining of the time section was noisy and revealed a strong lateral inhomogeneity of the investigated subsurface.
A prestack depth migration based on the macrovelocity models, obtained in the tomographic inversion (Hertweck and Jäger, 2002; Jäger and Hertweck, 2002), was applied to the prestack data of both profiles, where the kinematic Green's function were calculated by means of an eikonal solver. The resulting depth-migrated prestack data was first muted to avoid excessive pulse stretch for shallow reflectors, and then stacked in offset direction in order to obtain the depth-migrated images displayed in Figures 13 and 14. Both sections do not show the amount of structures, as in the stacked sections. These results are preliminary, and they still can advance and be compared to results of standard processing, where time migration methods can be applied after the NMO/DMO/stack process.
The results obtained by the CRS-stack based imaging show to be consistent for the major structural trends, and it is expected that depth location of the reflectors to be more reliable. Comparison of present the results with existing borehole data and other geological and geophysical published information available for the
investigated area (Eiras and Kinoshita, 1990) shows agreement.
As a complementary or alternative step of the CRS-stack based imaging workflow, a poststack depth migration for the profile was carried out. Input for the poststack depth migration are the CRS-stacked sections, and the macrovelocity models derived from the CRS attributes and tomography. Poststack depth migration can be advantageous in cases where the determination of a sufficiently accurate macrovelocity model is difficult and/or the signal-to-noise ratio is poor, as in the case discussed here, where the data quality is considered low and, besides, the obtained macrovelocity models are not reliable. As seen for the alternative, poststack depth migration can not compete with prestack depth migration in view of resolution and image quality. In particular, faults and fractures are not as well resolved as by the prestack depth migration, as exibited by the stack sections. There are regions, especially at greater depths, where some details are better resolved by the prestack depth migration. As a sumary, prestack and poststack depth-migrated results can provide complementary information for questions related to a seismic reevaluation, in the sense tht migration serves as a double check on the obtained model. Also in the sense that: how near (or far) should the output panel (migrated) be from the input panel (ZO)? Should be near.
Conclusions
Geological interpretation should be carried out mainly on the bases of Figures 7, 8 and 10, together with the details given in Figures 13 and 14, being important that all maps have the proper scale, axis exageration and size. From details of Figure 10, thinning and a long anticline and faults can be mapped where plays of horsts, grabens and rollovers are indicated. On the other hand, from Figures 7 and 8, the basement can not be easely traced. Also, the right part of the section needs more processing studies, and artifacts can be interpreted.
The quality of the Takutu seismic data is a limitation in enhancing different parts of imaging the selected line. The ideal is still to process other lines completing a full block to demonstrate the applicability of the CRS-stack based imaging in a form towards basin reevaluation. The CRS formalism is proposed because the aplied methodology can provide good basis for the geological interpretation, but it would be important to be able to conduct a velocity analysis in order to verify for possible structural inversion on the stacked part.
Here, a standard processing sequence with commercial software was not carried out. The present study is not intended to compare softwares, but to compare geological targets represented by the Takutu graben for oil exploration, and by the Rhein graben for geothermal exploration.
The coherence sections served to indicate the fit between the determined CRS stacking operators and the reflection events in the prestack data. The overall Takutu seismic image quality is quite low comparted to the high quality of the Rhein seismic image. In both cases, the results
WIT IMAGING OF TACUTU SEISMIC DATA _ _ _ _ _ _ _ _ _ _ _ _ _ _ _ _ _ _ _ _ _ _ _ _ _ _ _ _ _ _ _ _ _ _ _ _ _ _ _ _ _ _ _ _ _ _ _ _ _ _ _ _ _ _ _ _ _ _ _ _ _ _ _ _ _ _ _ _ _ _ _ _ _ _ _ _ _ _ _ _ _ _ _ _ _ _ _ _ _ _ _ _ _ _ _ _ _ _ _ _ _ _ _ _ _ _ _ _ _ _ _ _ _ _ _ _ _ _ _ _ _ _ _ _ _ _ _ _ _ _ _ _ _ _ _ _ _ _ _ _ _ _ _ _ _ _ _ _ _ _ _ _ _ _ _ _ _ _ _ _ _ _ _ _ _ _ _ _ _ _ _ _ _ _ _ _ _ _ _ _ _ _ _ _ _ _ _ _ _ _ _ _ _ _ _ _ _ _ _ _ _ _ _ _ _ _ _ _ _ _ _ _ _ _ _ _ _ _ _ _ _ _ _ _ _ _ _ _ _ _ _ _ _ _ _ _ _ _ _ _ _ _ _ _ _ _ _ _ _ _ _ _ _ _ _ _ _ _ _ _ _ _ _ _ _ _ _ _ _ _ _ _ _ _ _ _ _ _ _ _ _ _ _ _ _ _ _ _ _ _ _ _ _ _ _ _ _ _ _ _ _ _ _ _ _ _ _ _ _ _ _ _ _ _ _ _ _ _ _ _ _ _ _ _ _ _ _ _ _ _ _ _ _ _
Ninth International Congress of the Brazilian Geophysical Society
6
obtained by CRS revealed good signal-to-noise ratio and reflector continuity.
It is clear that as the quality of the seismic data becomes high, it provides an ideal basis to apply and enhance the different parts of the seismic imaging software, and to demonstrate its practical applicability by means of a real data examples. The obtained results provide good grounds for giving continuity to the Takutu seismic data reprocessing and geological reinterpretation for a hopefully successful drilling.
Due to the fact that also a standard processing sequence with up-to-date commercial software can be carried out, even though the reliability and quality of the results of the CRS-stack based seismic imaging workflow is once more demonstrated, and it can be further advanced and broadened with respect to the data in focus.
This example serves to reinforce our perspectives and intentions on research collaboration between University and Industry to provide foundation for applied seismic.
Acknowledgments
The authors would like to thank the Brasilian institutions UFPA (Universidade Federal do Pará), FINEP (Financiadora de Estudos e Projetos), ANP (Agência Nacional do Petróleo) and PETROBRAS (Petróleo Brasileiro S/A) for research support, as for example the project Rede Risco Exploratório (Rede 01/03, FINEP 22.01.0763.00). The thanks are also extended to all WIT sponsors and Administration, and to Prof. Milton J. Porsani for supplying the Takutu data set.
References
Cohen, J. K. and Stockwell, Jr. J. W., 2000. CWP/SU: Seismic Unix Release 34: a free package for seismic research and processing. Center for Wave Phenomena, Colorado School of Mines.
Duveneck, E., 2002. Tomographic velocity model inversion with CRS attributes. Annual WIT report, p.92-106.
Eiras, J. F. and Kinoshita, E. M., 1990. Geology and Petroleum Perspectives of the Takutu Basin. In: Raja Gabaglia, G.P. and Milani, E.J. Origen and Evolution of Sedimentary Basins. (In Portuguese), p. 97-220.
Gierse, G., Pruessmann, J., Laggiard, E., Boennemann, C. and Meyer, H., 2003. Improved imaging of 3D marine seismic data from offshore Costa Rica with CRS processing. First Break, 21(12), p. 45-49.
Heilmann, Z., Mann, J., Duveneck, E. and Hertweck, T., 2002. CRS-stack-based seismic imaging - a real data example. Annual WIT report, p. 150-163.
Hertweck, T. and Jäger, C., 2002. Short note: various aspects of Kirchhoff migration. Annual WIT report, p. 133-142.
Jäger, C. and Hertweck, T., 2002. Using Uni3D version v0.23: a manual. Annual WIT report, p. 143-150.
Mann, J., 2001. Common-Reflection-Surface Stack: User's manual to version 4.2. Geophysical Institute, University of Karlsruhe
Mann, J., Duveneck, E., Bergler, S. and Hubral, P., 2004. In Klemm, R., editor, Applications of Space-Time Adaptive Processing, chapter VIII.4.
Figure 15. Enlarged version of Figure 10 to allow for structural details.