Embed Size (px)
Citation preview
Ambient Air Quality Monitoring Report for Saldanha Bay and Vredenburg Sites February 2019
Prepared for
Saldanha Bay Municipality
SALDANHA BAY MUNICIPALITY
Ambient Air Quality Monitoring Report for Saldanha Bay and Vredenburg Sites : February 2019
EXECUTIVE SUMMARY
This report covers data from the Saldanha Bay and Vredenburg Air Quality Monitoring stations for
February 2019. These stations have been commissioned and operated throughout the Saldanha Bay
Municipality Area by Argos Scientific Africa (Pty) Ltd.
There were no exceedances of any of the RSA Air Quality Standards during February 2019 at either of
the abovementioned sites.
The average data collection during February 2019 at the Saldanha Site for SO2, NOx and O3 was 0%
due to load-shedding events which damaged the air conditioner circuit. The station was shut-down on
the 10th December 2019 to avoid damage to equipment.
These events resulted in additional damage to the PM-10 analyser (blown IC on Main Board) and SO2
analyser (lamp instability) resulted is no data being available for these two analysers. A full electrical
assessment of the station will be undertaken.
The average data collection during February 2019 at the Vredenburg Site was 0% O3, NOx and SO2
analysers. The Air-conditioner at Vredenburg station leaked out cooling gas and was out of operation,
as a result the station was shut down. No PM-10 data is available.
Site assessment visits to both stations were made during the months of February and March including
visits to assess and replace the air conditioners. The stations ensued with their operations from the 4th
of March 2019.
No meteorological data was available for February 2019 as the Saldanha station was shut down as
detailed above.
.
2 of 48
SALDANHA BAY MUNICIPALITY
Ambient Air Quality Monitoring Report for Saldanha Bay and Vredenburg Sites : February 2019
REPORT DETAILS
Reference AS1138\sbm\201902
Report Title Ambient Air Quality Monitoring Report for Saldanha Bay and Vredenburg Sites : February 2019
Date Submitted 13 March 2019
Client René Toesie
Saldanha Bay Municipality
Pick and Pay Centre
VREDENBURG
E-mail: [email protected]
Prepared by Lukas Tshehla
Argos Scientific SA
Unit 16 360 Business Park
8 Section Street
Paarden Eiland
Cape Town, 7405
Tel: +27 21 8343108
Email: [email protected]
Signed
Technical signatory Grant Ravenscroft
Signed:
Status Final
Notice
3 of 48
SALDANHA BAY MUNICIPALITY
Ambient Air Quality Monitoring Report for Saldanha Bay and Vredenburg Sites : February 2019
TABLE OF CONTENTS
1 INTRODUCTION AND BACKGROUND .......................................................................................................... 5
1.1 SCOPE OF WORK ....................................................................................................................................... 5
1.2 PROJECT DESCRIPTION .............................................................................................................................. 5
2 GUIDELINES AND AIR QUALITY STANDARDS ........................................................................................... 6
3 METHODOLOGY ............................................................................................................................................. 6
3.1 AMBIENT AIR QUALITY ................................................................................................................................ 6
3.2 DATA CAPTURE ......................................................................................................................................... 6
4 RESULTS ........................................................................................................................................................ 7
4.1 AMBIENT AIR QUALITY TRENDS ................................................................................................................... 7
4.2 COMPLIANCE ........................................................................................................................................... 15
4.3 MEAN AND MAXIMUM CONCENTRATIONS .................................................................................................... 16
4.4 DIURNAL TRENDS..................................................................................................................................... 17
4.5 WIND AND POLLUTION ROSES ................................................................................................................... 19
5 CONCLUSIONS AND RECOMMENDATIONS.............................................................................................. 20
APPENDIX 1: SUMMARY TABLE OF HOURLY MEANS (SALDANHA) ... ERROR! BOOKMARK NOT DEFINED.
APPENDIX 2: SUMMARY TABLE OF HOURLY MEANS (VREDENBURG) ........................................................ 22
APPENDIX 3: MONITORING METHODOLOGIES ................................................................................................ 23
1. CONTINUOUS REAL TIME MONITORS .......................................................................................................... 23
2. QUALITY CONTROL REQUIREMENTS ........................................................................................................... 26
3. INSTRUMENT CALIBRATION AND FREQUENCY .............................................................................................. 26
4. DATA ACQUISITION REQUIREMENTS ........................................................................................................... 26
5. SITE SELECTION ...................................................................................................................................... 27
6. DATA MANAGEMENT ................................................................................................................................. 28
APPENDIX 4: QUALITY ASSURANCE STATEMENT .......................................................................................... 29
4 of 48
SALDANHA BAY MUNICIPALITY
Ambient Air Quality Monitoring Report for Saldanha Bay and Vredenburg Sites : February 2019
1 INTRODUCTION AND BACKGROUND
1.1 SCOPE OF WORK
This project covers the communications, data processing and reporting for two Air Quality Monitoring
(AQM) Stations in the Saldanha Bay Municipality Area. Argos Scientific’s understanding of the scope of
work is as follows:
• Establish 3G communications from ambient air quality monitoring station loggers (PC with Linux
Operating System) via 2G/3G modem to a centralised server.
• Provide SIM cards for 2G/3G modems.
• Ensure communication support stations and server.
• Provide real-time access to raw data and validated data from SBM offices.
• Provide real-time downloading of raw data and validated data from SBM offices.
• Submission of monthly reports for each monitoring station, including data graphs, exceedance
graphs, meteorology, analysis and station status.
1.2 PROJECT DESCRIPTION
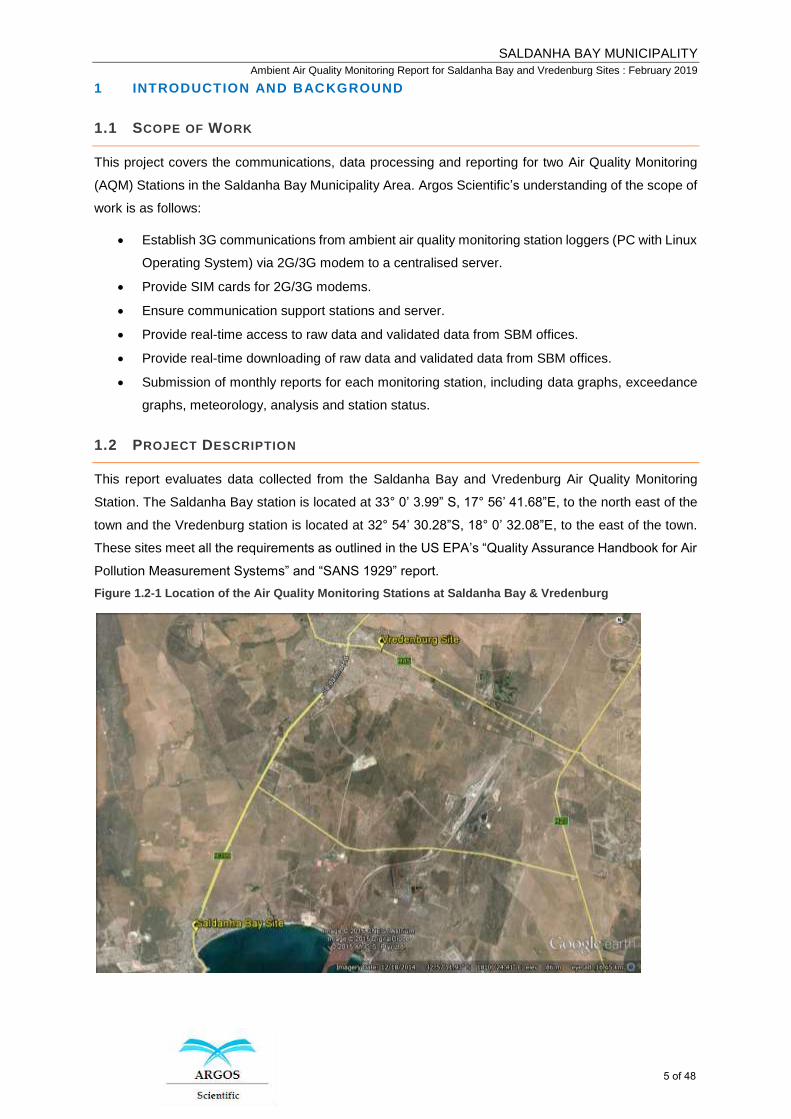
This report evaluates data collected from the Saldanha Bay and Vredenburg Air Quality Monitoring
Station. The Saldanha Bay station is located at 33° 0’ 3.99” S, 17° 56’ 41.68”E, to the north east of the
town and the Vredenburg station is located at 32° 54’ 30.28”S, 18° 0’ 32.08”E, to the east of the town.
These sites meet all the requirements as outlined in the US EPA’s “Quality Assurance Handbook for Air
Pollution Measurement Systems” and “SANS 1929” report.
Figure 1.2-1 Location of the Air Quality Monitoring Stations at Saldanha Bay & Vredenburg
5 of 48
SALDANHA BAY MUNICIPALITY
Ambient Air Quality Monitoring Report for Saldanha Bay and Vredenburg Sites : February 2019
2 GUIDELINES AND AIR QUALITY STANDARDS
The National Department of Environmental Affairs (DEA) standards for common pollutants as listed in
the Government Gazette No.32816, published 24 February 2009, are listed in Table 2.1 below.
Table 1.2-1 National Ambient Air Quality Standards for SO2, NO2, O3, PM-10 and PM2.5
Pollutant SO2 SO2 NO2 O3 PM-10 PM-2.5
Period 10 minute 1 hour 1 hour 8 hour 1 day 1 day
RSA AQ Standard 191ppb 48ppb 106ppb 61ppb 75 µg/m3 40 µg/m3
3 METHODOLOGY
3.1 AMBIENT AIR QUALITY
Ambient concentrations of sulphur dioxide, oxides of nitrogen (NO, NO2 and NOX), ozone, and
particulates less than 10 µm in diameter (PM-10) are measured at the Saldanha Bay monitoring site
and Vredenburg monitoring site in accordance with the latest National Ambient Air Quality Standards
(as above) and SANS standard methods. Levels of these pollutants are presented graphically and in
table form in section 4 below.
3.2 DATA CAPTURE
Data is analysed for completeness against a required standard of 90% and presented in table form
below.
Table 3.2-1 Percentage Data Capture for Ambient Air Quality Pollutants in February 2019 at Saldanha Site
Pollutant SO2 NO2 O3 PM-10 PM-2.5
% Capture 0% 0% 0% 0% 0%
* Power Fault caused by loadshedding ** Equipment damaged by loadshedding
Table 3.2-2 Percentage Data Capture for Ambient Air Quality Pollutants in February 2019 at Vredenburg Site
Pollutant SO2 NO2 O3 PM-10 PM-2.5
% Capture 0% 0% 0% 0%* 0%*
* Equipment out of commission
6 of 48
SALDANHA BAY MUNICIPALITY
Ambient Air Quality Monitoring Report for Saldanha Bay and Vredenburg Sites : February 2019
4 RESULTS
4.1 AMBIENT AIR QUALITY TRENDS
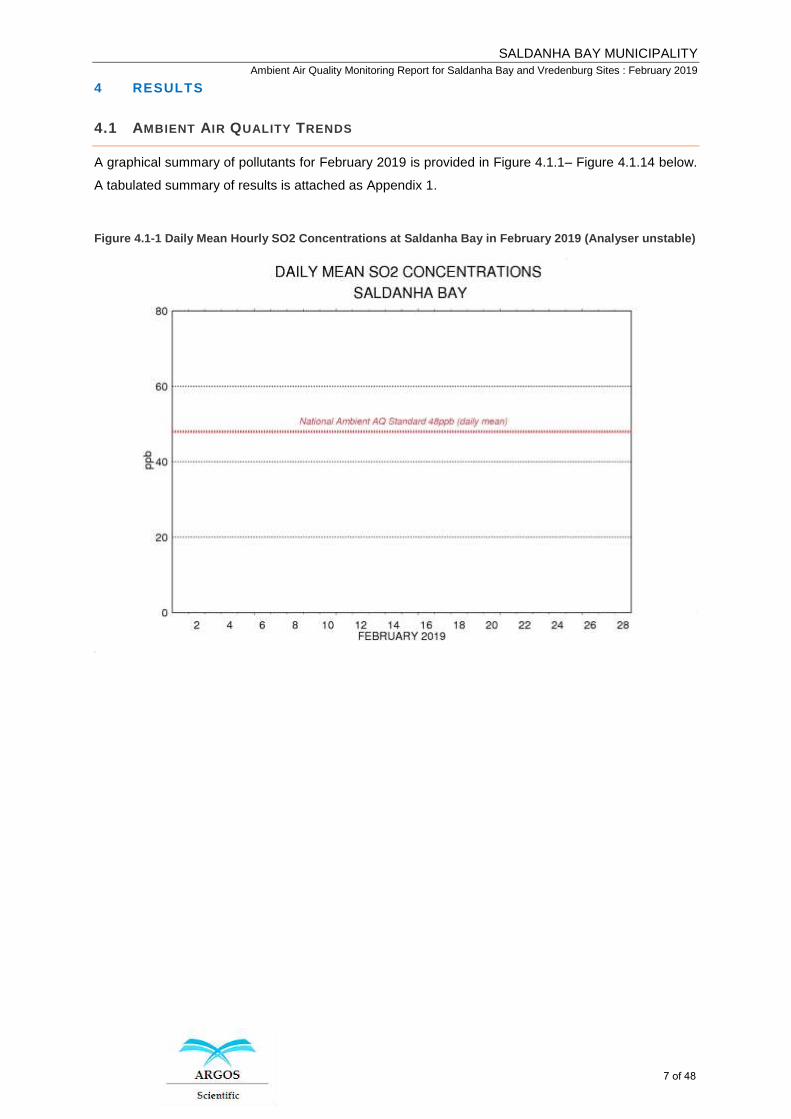
A graphical summary of pollutants for February 2019 is provided in Figure 4.1.1– Figure 4.1.14 below.
A tabulated summary of results is attached as Appendix 1.
Figure 4.1-1 Daily Mean Hourly SO2 Concentrations at Saldanha Bay in February 2019 (Analyser unstable)
7 of 48
SALDANHA BAY MUNICIPALITY
Ambient Air Quality Monitoring Report for Saldanha Bay and Vredenburg Sites : February 2019
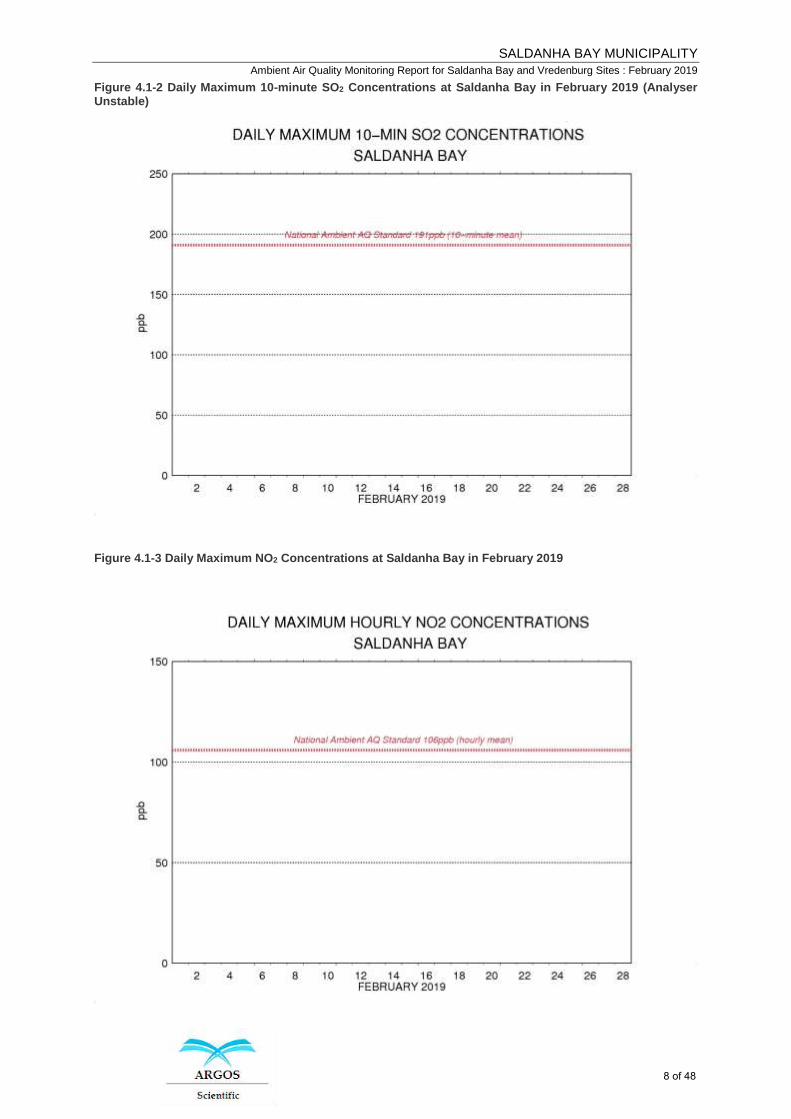
Figure 4.1-2 Daily Maximum 10-minute SO2 Concentrations at Saldanha Bay in February 2019 (Analyser Unstable)
Figure 4.1-3 Daily Maximum NO2 Concentrations at Saldanha Bay in February 2019
8 of 48
SALDANHA BAY MUNICIPALITY
Ambient Air Quality Monitoring Report for Saldanha Bay and Vredenburg Sites : February 2019
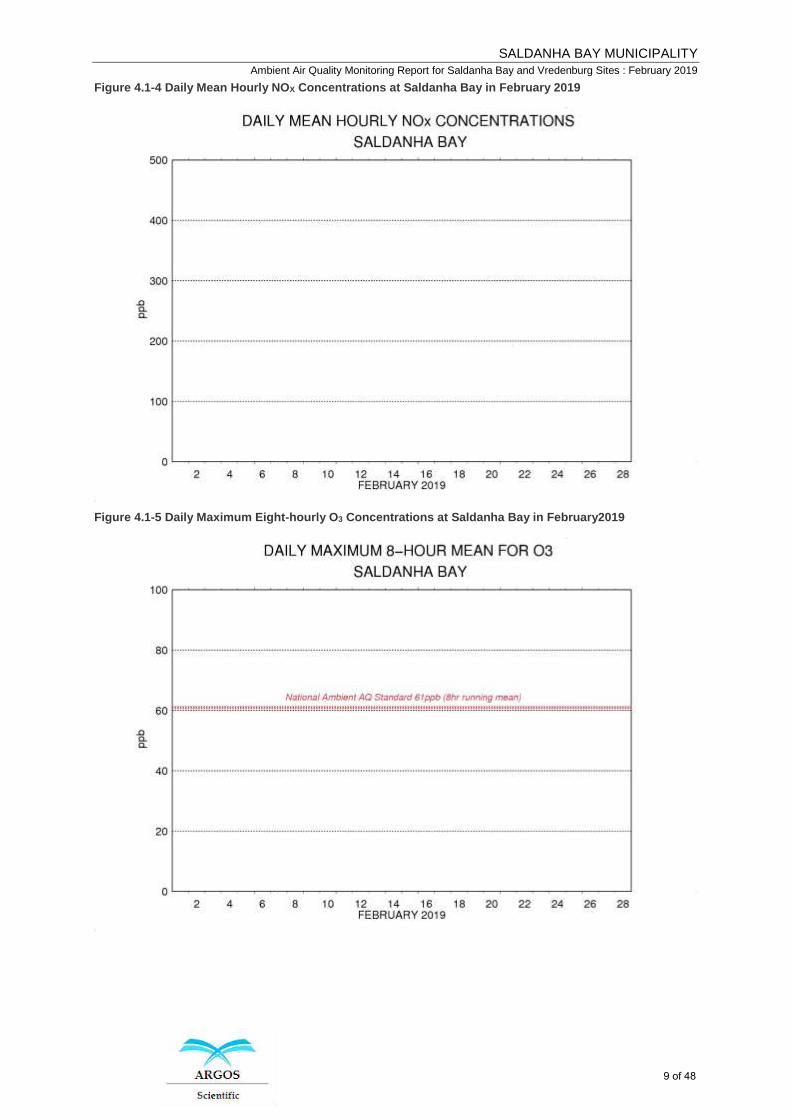
Figure 4.1-4 Daily Mean Hourly NOX Concentrations at Saldanha Bay in February 2019
Figure 4.1-5 Daily Maximum Eight-hourly O3 Concentrations at Saldanha Bay in February2019
9 of 48
SALDANHA BAY MUNICIPALITY
Ambient Air Quality Monitoring Report for Saldanha Bay and Vredenburg Sites : February 2019
Figure 4.1-6 Daily Mean PM-10 Concentrations at Saldanha Bay in February 2019 (Analyser Faulty)
Figure 4.1-7 Daily Mean PM-2.5 Concentrations at Saldanha Bay in February 2019 (Analyser Faulty)
10 of 48
SALDANHA BAY MUNICIPALITY
Ambient Air Quality Monitoring Report for Saldanha Bay and Vredenburg Sites : February 2019
Figure 4.1-8 Daily Mean Hourly SO2 Concentrations at Vredenburg in February 2019 (no data – loadshedding)
Figure 4.1-9 Daily Maximum 10-minute SO2 Concentrations at Vredenburg in February2019 (No data Loadshedding)
11 of 48
SALDANHA BAY MUNICIPALITY
Ambient Air Quality Monitoring Report for Saldanha Bay and Vredenburg Sites : February 2019
Figure 4.1-10 Daily Maximum NO2 Concentrations at Vredenburg in February 2019
Figure 4.1-11 Daily Mean Hourly NOX Concentrations at Vredenburg in February 2019
12 of 48
SALDANHA BAY MUNICIPALITY
Ambient Air Quality Monitoring Report for Saldanha Bay and Vredenburg Sites : February 2019
Figure 4.1-12 Daily Maximum Eight-hourly O3 Concentrations at Vredenburg in February 2019 (No data available)
Figure 4.1-13 Daily Mean PM-10 Concentrations at Vredenburg in February 2019 (No Analyser Available)
13 of 48
SALDANHA BAY MUNICIPALITY
Ambient Air Quality Monitoring Report for Saldanha Bay and Vredenburg Sites : February 2019
Figure 4.1-14 Daily Mean PM-2.5 Concentrations at Saldanha Bay in February 2019 (No Analyser Available)
14 of 48
SALDANHA BAY MUNICIPALITY
Ambient Air Quality Monitoring Report for Saldanha Bay and Vredenburg Sites : February 2019
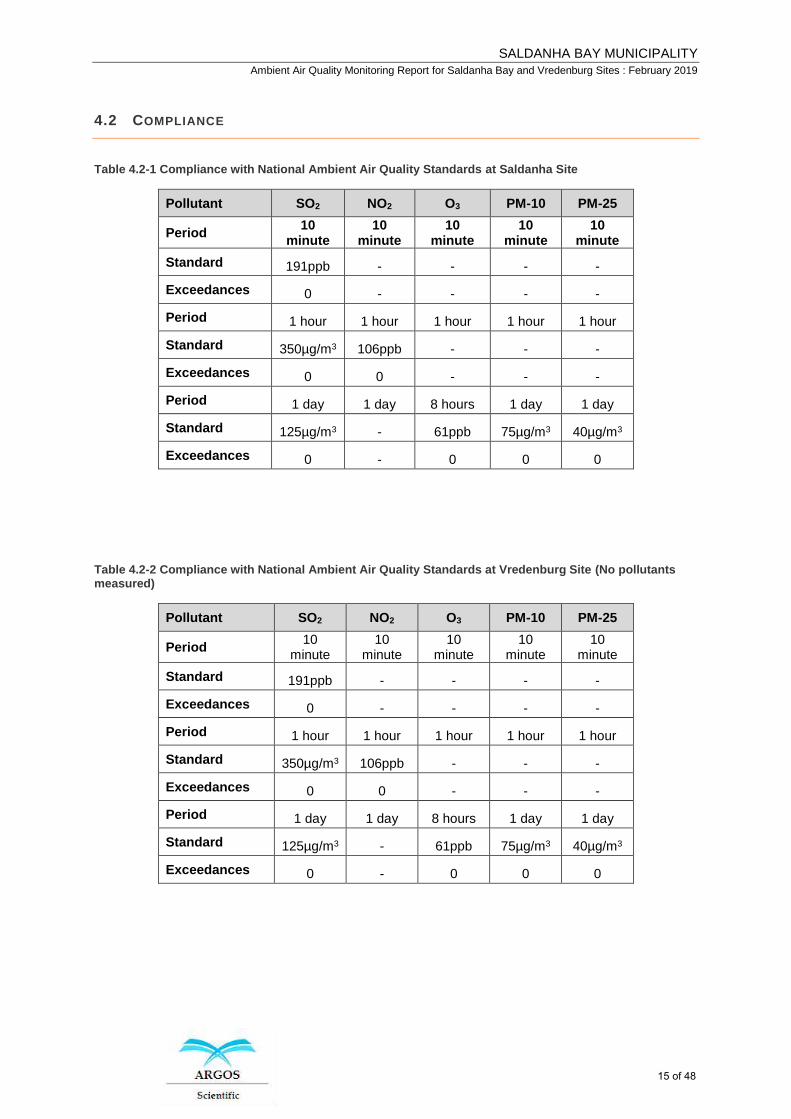
4.2 COMPLIANCE
Table 4.2-1 Compliance with National Ambient Air Quality Standards at Saldanha Site
Pollutant SO2 NO2 O3 PM-10 PM-25
Period 10
minute 10
minute 10
minute 10
minute 10
minute
Standard 191ppb - - - -
Exceedances 0 - - - -
Period 1 hour 1 hour 1 hour 1 hour 1 hour
Standard 350µg/m3 106ppb - - -
Exceedances 0 0 - - -
Period 1 day 1 day 8 hours 1 day 1 day
Standard 125µg/m3 - 61ppb 75µg/m3 40µg/m3
Exceedances 0 - 0 0 0
Table 4.2-2 Compliance with National Ambient Air Quality Standards at Vredenburg Site (No pollutants measured)
Pollutant SO2 NO2 O3 PM-10 PM-25
Period 10
minute 10
minute 10
minute 10
minute 10
minute
Standard 191ppb - - - -
Exceedances 0 - - - -
Period 1 hour 1 hour 1 hour 1 hour 1 hour
Standard 350µg/m3 106ppb - - -
Exceedances 0 0 - - -
Period 1 day 1 day 8 hours 1 day 1 day
Standard 125µg/m3 - 61ppb 75µg/m3 40µg/m3
Exceedances 0 - 0 0 0
15 of 48
SALDANHA BAY MUNICIPALITY
Ambient Air Quality Monitoring Report for Saldanha Bay and Vredenburg Sites : February 2019
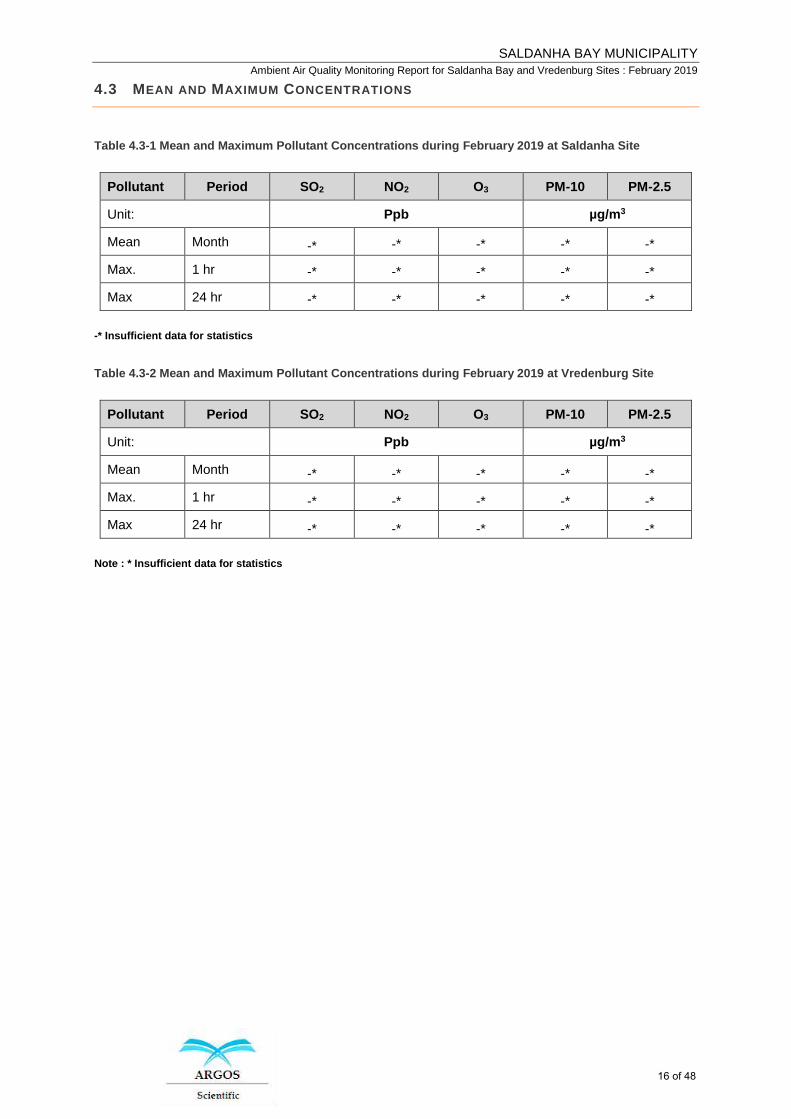
4.3 MEAN AND MAXIMUM CONCENTRATIONS
Table 4.3-1 Mean and Maximum Pollutant Concentrations during February 2019 at Saldanha Site
Pollutant Period SO2 NO2 O3 PM-10 PM-2.5
Unit: Ppb µg/m3
Mean Month -* -* -* -* -*
Max. 1 hr -* -* -* -* -*
Max 24 hr -* -* -* -* -*
-* Insufficient data for statistics
Table 4.3-2 Mean and Maximum Pollutant Concentrations during February 2019 at Vredenburg Site
Pollutant Period SO2 NO2 O3 PM-10 PM-2.5
Unit: Ppb µg/m3
Mean Month -* -* -* -* -*
Max. 1 hr -* -* -* -* -*
Max 24 hr -* -* -* -* -*
Note : * Insufficient data for statistics
16 of 48
SALDANHA BAY MUNICIPALITY
Ambient Air Quality Monitoring Report for Saldanha Bay and Vredenburg Sites : February 2019
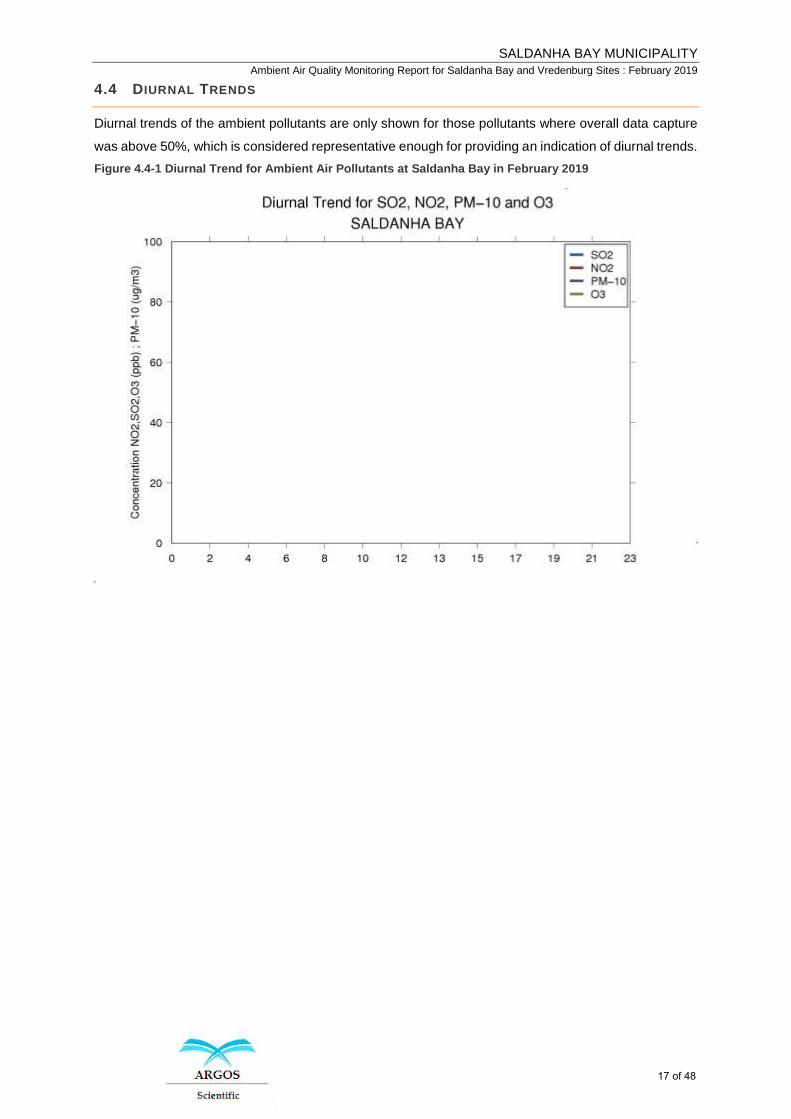
4.4 DIURNAL TRENDS
Diurnal trends of the ambient pollutants are only shown for those pollutants where overall data capture
was above 50%, which is considered representative enough for providing an indication of diurnal trends.
Figure 4.4-1 Diurnal Trend for Ambient Air Pollutants at Saldanha Bay in February 2019
17 of 48
SALDANHA BAY MUNICIPALITY
Ambient Air Quality Monitoring Report for Saldanha Bay and Vredenburg Sites : February 2019
Figure 4.4-2 Diurnal Trend for Ambient Air Pollutants at Vredenburg in February 2019
18 of 48
SALDANHA BAY MUNICIPALITY
Ambient Air Quality Monitoring Report for Saldanha Bay and Vredenburg Sites : February 2019
4.5 WIND AND POLLUTION ROSES
The wind rose for Saldanha Bay for February 2019 is shown below.
There was no wind rose for Saldanha for February 2019
Figure 4.5-1 Wind Rose for Saldanha Bay for February 2019
There was no wind rose for Vredenburg for February 2019
19 of 48
SALDANHA BAY MUNICIPALITY
Ambient Air Quality Monitoring Report for Saldanha Bay and Vredenburg Sites : February 2019
5 CONCLUSIONS AND RECOMMENDATIONS
There were no exceedances of any of the RSA Air Quality Standards during February 2019 at either of
the abovementioned sites.
The average data collection during February 2019 at the Saldanha Site for SO2, NOx and O3 was 0%
due to load-shedding events which damaged the air conditioner circuit. The station was shut-down on
the 10th December 2019 to avoid damage to equipment.
These events resulted in additional damage to the PM-10 analyser (blown IC on Main Board) and SO2
analyser (lamp instability) resulted is no data being available for these two analysers. A full electrical
assessment of the station will be undertaken.
The average data collection during February 2019 at the Vredenburg Site was 0% O3, NOx and SO2
analysers. The Air-conditioner at Vredenburg station leaked out cooling gas and was out of operation,
as a result the station was shut down. No PM-10 data is available.
Site assessment visits to both stations were made during the months of February and March. The
stations ensued with their operations from the 4th of March 2019.
No meteorological data was available for February 2019 as the Saldanha station was shut down as
detailed above.
20 of 48

SALDANHA BAY MUNICIPALITY
Ambient Air Quality Monitoring Report for Saldanha Bay and Vredenburg Sites : February 2019
APPENDIX 1: SUMMARY TABLE OF HOURLY MEANS (SALDANHA)
21 of 48
AS1138 APPENDIX 1: SALDANHA BAY AMBIENT AIR QUALITY DATA - FEBRUARY 2019
NITROGEN OXIDE HOURLY MEAN CONCENTRATIONS - ppb
Start Hr 0 1 2 3 4 5 6 7 8 9 10 11 12 13 14 15 16 17 18 19 20 21 22 23 Mean MaxDay
1 - - - - - - - - - - - - - - - - - - - - - - - - - -2 - - - - - - - - - - - - - - - - - - - - - - - - - -3 - - - - - - - - - - - - - - - - - - - - - - - - - -4 - - - - - - - - - - - - - - - - - - - - - - - - - -5 - - - - - - - - - - - - - - - - - - - - - - - - - -6 - - - - - - - - - - - - - - - - - - - - - - - - - -7 - - - - - - - - - - - - - - - - - - - - - - - - - -8 - - - - - - - - - - - - - - - - - - - - - - - - - -9 - - - - - - - - - - - - - - - - - - - - - - - - - -
10 - - - - - - - - - - - - - - - - - - - - - - - - - -11 - - - - - - - - - - - - - - - - - - - - - - - - - -12 - - - - - - - - - - - - - - - - - - - - - - - - - -13 - - - - - - - - - - - - - - - - - - - - - - - - - -14 - - - - - - - - - - - - - - - - - - - - - - - - - -15 - - - - - - - - - - - - - - - - - - - - - - - - - -16 - - - - - - - - - - - - - - - - - - - - - - - - - -17 - - - - - - - - - - - - - - - - - - - - - - - - - -18 - - - - - - - - - - - - - - - - - - - - - - - - - -19 - - - - - - - - - - - - - - - - - - - - - - - - - -20 - - - - - - - - - - - - - - - - - - - - - - - - - -21 - - - - - - - - - - - - - - - - - - - - - - - - - -22 - - - - - - - - - - - - - - - - - - - - - - - - - -23 - - - - - - - - - - - - - - - - - - - - - - - - - -24 - - - - - - - - - - - - - - - - - - - - - - - - - -25 - - - - - - - - - - - - - - - - - - - - - - - - - -26 - - - - - - - - - - - - - - - - - - - - - - - - - -27 - - - - - - - - - - - - - - - - - - - - - - - - - -28 - - - - - - - - - - - - - - - - - - - - - - - - - -
Mean - - - - - - - - - - - - - - - - - - - - - - - - -
Max - - - - - - - - - - - - - - - - - - - - - - - - - -
POLLUTANT:
22 of 48

A1138 APPENDIX 1: SALDANHA BAY AMBIENT AIR QUALITY DATA - FEBRUARY 2019
NITROGEN DIOXIDE HOURLY MEAN CONCENTRATIONS - ppb
Start Hr 0 1 2 3 4 5 6 7 8 9 10 11 12 13 14 15 16 17 18 19 20 21 22 23 Mean MaxDay
1 - - - - - - - - - - - - - - - - - - - - - - - - - -2 - - - - - - - - - - - - - - - - - - - - - - - - - -3 - - - - - - - - - - - - - - - - - - - - - - - - - -4 - - - - - - - - - - - - - - - - - - - - - - - - - -5 - - - - - - - - - - - - - - - - - - - - - - - - - -6 - - - - - - - - - - - - - - - - - - - - - - - - - -7 - - - - - - - - - - - - - - - - - - - - - - - - - -8 - - - - - - - - - - - - - - - - - - - - - - - - - -9 - - - - - - - - - - - - - - - - - - - - - - - - - -
10 - - - - - - - - - - - - - - - - - - - - - - - - - -11 - - - - - - - - - - - - - - - - - - - - - - - - - -12 - - - - - - - - - - - - - - - - - - - - - - - - - -13 - - - - - - - - - - - - - - - - - - - - - - - - - -14 - - - - - - - - - - - - - - - - - - - - - - - - - -15 - - - - - - - - - - - - - - - - - - - - - - - - - -16 - - - - - - - - - - - - - - - - - - - - - - - - - -17 - - - - - - - - - - - - - - - - - - - - - - - - - -18 - - - - - - - - - - - - - - - - - - - - - - - - - -19 - - - - - - - - - - - - - - - - - - - - - - - - - -20 - - - - - - - - - - - - - - - - - - - - - - - - - -21 - - - - - - - - - - - - - - - - - - - - - - - - - -22 - - - - - - - - - - - - - - - - - - - - - - - - - -23 - - - - - - - - - - - - - - - - - - - - - - - - - -24 - - - - - - - - - - - - - - - - - - - - - - - - - -25 - - - - - - - - - - - - - - - - - - - - - - - - - -26 - - - - - - - - - - - - - - - - - - - - - - - - - -27 - - - - - - - - - - - - - - - - - - - - - - - - - -28 - - - - - - - - - - - - - - - - - - - - - - - - - -
Mean - - - - - - - - - - - - - - - - - - - - - - - - -
Max - - - - - - - - - - - - - - - - - - - - - - - - - -
POLLUTANT:
23 of 48

AS1138 APPENDIX 1: SALDANHA BAY AMBIENT AIR QUALITY DATA - FEBRUARY 2019
OXIDES OF NITROGEN HOURLY MEAN CONCENTRATIONS - ppb
Start Hr 0 1 2 3 4 5 6 7 8 9 10 11 12 13 14 15 16 17 18 19 20 21 22 23 Mean MaxDay
1 - - - - - - - - - - - - - - - - - - - - - - - - - -2 - - - - - - - - - - - - - - - - - - - - - - - - - -3 - - - - - - - - - - - - - - - - - - - - - - - - - -4 - - - - - - - - - - - - - - - - - - - - - - - - - -5 - - - - - - - - - - - - - - - - - - - - - - - - - -6 - - - - - - - - - - - - - - - - - - - - - - - - - -7 - - - - - - - - - - - - - - - - - - - - - - - - - -8 - - - - - - - - - - - - - - - - - - - - - - - - - -9 - - - - - - - - - - - - - - - - - - - - - - - - - -
10 - - - - - - - - - - - - - - - - - - - - - - - - - -11 - - - - - - - - - - - - - - - - - - - - - - - - - -12 - - - - - - - - - - - - - - - - - - - - - - - - - -13 - - - - - - - - - - - - - - - - - - - - - - - - - -14 - - - - - - - - - - - - - - - - - - - - - - - - - -15 - - - - - - - - - - - - - - - - - - - - - - - - - -16 - - - - - - - - - - - - - - - - - - - - - - - - - -17 - - - - - - - - - - - - - - - - - - - - - - - - - -18 - - - - - - - - - - - - - - - - - - - - - - - - - -19 - - - - - - - - - - - - - - - - - - - - - - - - - -20 - - - - - - - - - - - - - - - - - - - - - - - - - -21 - - - - - - - - - - - - - - - - - - - - - - - - - -22 - - - - - - - - - - - - - - - - - - - - - - - - - -23 - - - - - - - - - - - - - - - - - - - - - - - - - -24 - - - - - - - - - - - - - - - - - - - - - - - - - -25 - - - - - - - - - - - - - - - - - - - - - - - - - -26 - - - - - - - - - - - - - - - - - - - - - - - - - -27 - - - - - - - - - - - - - - - - - - - - - - - - - -28 - - - - - - - - - - - - - - - - - - - - - - - - - -
Mean - - - - - - - - - - - - - - - - - - - - - - - - -
Max - - - - - - - - - - - - - - - - - - - - - - - - - -
POLLUTANT:
24 of 48

AS1138 APPENDIX 1: SALDANHA BAY AMBIENT AIR QUALITY DATA - FEBRUARY 2019
OZONE HOURLY MEAN CONCENTRATIONS - ppb
Start Hr 0 1 2 3 4 5 6 7 8 9 10 11 12 13 14 15 16 17 18 19 20 21 22 23 Mean MaxDay
1 - - - - - - - - - - - - - - - - - - - - - - - - - -2 - - - - - - - - - - - - - - - - - - - - - - - - - -3 - - - - - - - - - - - - - - - - - - - - - - - - - -4 - - - - - - - - - - - - - - - - - - - - - - - - - -5 - - - - - - - - - - - - - - - - - - - - - - - - - -6 - - - - - - - - - - - - - - - - - - - - - - - - - -7 - - - - - - - - - - - - - - - - - - - - - - - - - -8 - - - - - - - - - - - - - - - - - - - - - - - - - -9 - - - - - - - - - - - - - - - - - - - - - - - - - -
10 - - - - - - - - - - - - - - - - - - - - - - - - - -11 - - - - - - - - - - - - - - - - - - - - - - - - - -12 - - - - - - - - - - - - - - - - - - - - - - - - - -13 - - - - - - - - - - - - - - - - - - - - - - - - - -14 - - - - - - - - - - - - - - - - - - - - - - - - - -15 - - - - - - - - - - - - - - - - - - - - - - - - - -16 - - - - - - - - - - - - - - - - - - - - - - - - - -17 - - - - - - - - - - - - - - - - - - - - - - - - - -18 - - - - - - - - - - - - - - - - - - - - - - - - - -19 - - - - - - - - - - - - - - - - - - - - - - - - - -20 - - - - - - - - - - - - - - - - - - - - - - - - - -21 - - - - - - - - - - - - - - - - - - - - - - - - - -22 - - - - - - - - - - - - - - - - - - - - - - - - - -23 - - - - - - - - - - - - - - - - - - - - - - - - - -24 - - - - - - - - - - - - - - - - - - - - - - - - - -25 - - - - - - - - - - - - - - - - - - - - - - - - - -26 - - - - - - - - - - - - - - - - - - - - - - - - - -27 - - - - - - - - - - - - - - - - - - - - - - - - - -28 - - - - - - - - - - - - - - - - - - - - - - - - - -
Mean - - - - - - - - - - - - - - - - - - - - - - - - -
Max - - - - - - - - - - - - - - - - - - - - - - - - - -
POLLUTANT:
25 of 48
AS1138 APPENDIX 1: SALDANHA BAY AMBIENT AIR QUALITY DATA - FEBRUARY 2019
OZONE EIGHT-HOURLY MEAN CONCENTRATIONS - ppb
Start Hr 0 1 2 3 4 5 6 7 8 9 10 11 12 13 14 15 16 17 18 19 20 21 22 23 Mean MaxDay
1 - - - - - - - - - - - - - - - - - - - - - - - - - -2 - - - - - - - - - - - - - - - - - - - - - - - - - -3 - - - - - - - - - - - - - - - - - - - - - - - - - -4 - - - - - - - - - - - - - - - - - - - - - - - - - -5 - - - - - - - - - - - - - - - - - - - - - - - - - -6 - - - - - - - - - - - - - - - - - - - - - - - - - -7 - - - - - - - - - - - - - - - - - - - - - - - - - -8 - - - - - - - - - - - - - - - - - - - - - - - - - -9 - - - - - - - - - - - - - - - - - - - - - - - - - -
10 - - - - - - - - - - - - - - - - - - - - - - - - - -11 - - - - - - - - - - - - - - - - - - - - - - - - - -12 - - - - - - - - - - - - - - - - - - - - - - - - - -13 - - - - - - - - - - - - - - - - - - - - - - - - - -14 - - - - - - - - - - - - - - - - - - - - - - - - - -15 - - - - - - - - - - - - - - - - - - - - - - - - - -16 - - - - - - - - - - - - - - - - - - - - - - - - - -17 - - - - - - - - - - - - - - - - - - - - - - - - - -18 - - - - - - - - - - - - - - - - - - - - - - - - - -19 - - - - - - - - - - - - - - - - - - - - - - - - - -20 - - - - - - - - - - - - - - - - - - - - - - - - - -21 - - - - - - - - - - - - - - - - - - - - - - - - - -22 - - - - - - - - - - - - - - - - - - - - - - - - - -23 - - - - - - - - - - - - - - - - - - - - - - - - - -24 - - - - - - - - - - - - - - - - - - - - - - - - - -25 - - - - - - - - - - - - - - - - - - - - - - - - - -26 - - - - - - - - - - - - - - - - - - - - - - - - - -27 - - - - - - - - - - - - - - - - - - - - - - - - - -28 - - - - - - - - - - - - - - - - - - - - - - - - - -
Mean - - - - - - - - - - - - - - - - - - - - - - - - -
Max - - - - - - - - - - - - - - - - - - - - - - - - - -
POLLUTANT:
26 of 48

AS1138 APPENDIX 1: SALDANHA BAY AMBIENT AIR QUALITY DATA - FEBRUARY 2019
PM-10 HOURLY MEAN CONCENTRATIONS - µg/m3
Start Hr 0 1 2 3 4 5 6 7 8 9 10 11 12 13 14 15 16 17 18 19 20 21 22 23 Mean MaxDay
1 - - - - - - - - - - - - - - - - - - - - - - - - - -2 - - - - - - - - - - - - - - - - - - - - - - - - - -3 - - - - - - - - - - - - - - - - - - - - - - - - - -4 - - - - - - - - - - - - - - - - - - - - - - - - - -5 - - - - - - - - - - - - - - - - - - - - - - - - - -6 - - - - - - - - - - - - - - - - - - - - - - - - - -7 - - - - - - - - - - - - - - - - - - - - - - - - - -8 - - - - - - - - - - - - - - - - - - - - - - - - - -9 - - - - - - - - - - - - - - - - - - - - - - - - - -
10 - - - - - - - - - - - - - - - - - - - - - - - - - -11 - - - - - - - - - - - - - - - - - - - - - - - - - -12 - - - - - - - - - - - - - - - - - - - - - - - - - -13 - - - - - - - - - - - - - - - - - - - - - - - - - -14 - - - - - - - - - - - - - - - - - - - - - - - - - -15 - - - - - - - - - - - - - - - - - - - - - - - - - -16 - - - - - - - - - - - - - - - - - - - - - - - - - -17 - - - - - - - - - - - - - - - - - - - - - - - - - -18 - - - - - - - - - - - - - - - - - - - - - - - - - -19 - - - - - - - - - - - - - - - - - - - - - - - - - -20 - - - - - - - - - - - - - - - - - - - - - - - - - -21 - - - - - - - - - - - - - - - - - - - - - - - - - -22 - - - - - - - - - - - - - - - - - - - - - - - - - -23 - - - - - - - - - - - - - - - - - - - - - - - - - -24 - - - - - - - - - - - - - - - - - - - - - - - - - -25 - - - - - - - - - - - - - - - - - - - - - - - - - -26 - - - - - - - - - - - - - - - - - - - - - - - - - -27 - - - - - - - - - - - - - - - - - - - - - - - - - -28 - - - - - - - - - - - - - - - - - - - - - - - - - -
Mean - - - - - - - - - - - - - - - - - - - - - - - - -
Max - - - - - - - - - - - - - - - - - - - - - - - - - -
POLLUTANT:
27 of 48
AS1138 APPENDIX 1: SALDANHA BAY AMBIENT AIR QUALITY DATA - FEBRUARY 2019
PM-25 HOURLY MEAN CONCENTRATIONS - µg/m3
Start Hr 0 1 2 3 4 5 6 7 8 9 10 11 12 13 14 15 16 17 18 19 20 21 22 23 Mean MaxDay
1 - - - - - - - - - - - - - - - - - - - - - - - - - -2 - - - - - - - - - - - - - - - - - - - - - - - - - -3 - - - - - - - - - - - - - - - - - - - - - - - - - -4 - - - - - - - - - - - - - - - - - - - - - - - - - -5 - - - - - - - - - - - - - - - - - - - - - - - - - -6 - - - - - - - - - - - - - - - - - - - - - - - - - -7 - - - - - - - - - - - - - - - - - - - - - - - - - -8 - - - - - - - - - - - - - - - - - - - - - - - - - -9 - - - - - - - - - - - - - - - - - - - - - - - - - -
10 - - - - - - - - - - - - - - - - - - - - - - - - - -11 - - - - - - - - - - - - - - - - - - - - - - - - - -12 - - - - - - - - - - - - - - - - - - - - - - - - - -13 - - - - - - - - - - - - - - - - - - - - - - - - - -14 - - - - - - - - - - - - - - - - - - - - - - - - - -15 - - - - - - - - - - - - - - - - - - - - - - - - - -16 - - - - - - - - - - - - - - - - - - - - - - - - - -17 - - - - - - - - - - - - - - - - - - - - - - - - - -18 - - - - - - - - - - - - - - - - - - - - - - - - - -19 - - - - - - - - - - - - - - - - - - - - - - - - - -20 - - - - - - - - - - - - - - - - - - - - - - - - - -21 - - - - - - - - - - - - - - - - - - - - - - - - - -22 - - - - - - - - - - - - - - - - - - - - - - - - - -23 - - - - - - - - - - - - - - - - - - - - - - - - - -24 - - - - - - - - - - - - - - - - - - - - - - - - - -25 - - - - - - - - - - - - - - - - - - - - - - - - - -26 - - - - - - - - - - - - - - - - - - - - - - - - - -27 - - - - - - - - - - - - - - - - - - - - - - - - - -28 - - - - - - - - - - - - - - - - - - - - - - - - - -
Mean - - - - - - - - - - - - - - - - - - - - - - - - -
Max - - - - - - - - - - - - - - - - - - - - - - - - - -
POLLUTANT:
28 of 48
AS1138 APPENDIX 1: SALDANHA BAY AMBIENT AIR QUALITY DATA - FEBRUARY 2019
WIND DIRECTION HOURLY MEAN - DEGREES (°)
Start Hr 0 1 2 3 4 5 6 7 8 9 10 11 12 13 14 15 16 17 18 19 20 21 22 23Day
1 - - - - - - - - - - - - - - - - - - - - - - - -
2 - - - - - - - - - - - - - - - - - - - - - - - -
3 - - - - - - - - - - - - - - - - - - - - - - - -
4 - - - - - - - - - - - - - - - - - - - - - - - -
5 - - - - - - - - - - - - - - - - - - - - - - - -
6 - - - - - - - - - - - - - - - - - - - - - - - -
7 - - - - - - - - - - - - - - - - - - - - - - - -
8 - - - - - - - - - - - - - - - - - - - - - - - -
9 - - - - - - - - - - - - - - - - - - - - - - - -
10 - - - - - - - - - - - - - - - - - - - - - - - -
11 - - - - - - - - - - - - - - - - - - - - - - - -
12 - - - - - - - - - - - - - - - - - - - - - - - -
13 - - - - - - - - - - - - - - - - - - - - - - - -
14 - - - - - - - - - - - - - - - - - - - - - - - -
15 - - - - - - - - - - - - - - - - - - - - - - - -
16 - - - - - - - - - - - - - - - - - - - - - - - -
17 - - - - - - - - - - - - - - - - - - - - - - - -
18 - - - - - - - - - - - - - - - - - - - - - - - -
19 - - - - - - - - - - - - - - - - - - - - - - - -
20 - - - - - - - - - - - - - - - - - - - - - - - -
21 - - - - - - - - - - - - - - - - - - - - - - - -
22 - - - - - - - - - - - - - - - - - - - - - - - -
23 - - - - - - - - - - - - - - - - - - - - - - - -
24 - - - - - - - - - - - - - - - - - - - - - - - -
25 - - - - - - - - - - - - - - - - - - - - - - - -
26 - - - - - - - - - - - - - - - - - - - - - - - -
27 - - - - - - - - - - - - - - - - - - - - - - - -
28 - - - - - - - - - - - - - - - - - - - - - - - -
POLLUTANT:
29 of 48
AS1138 APPENDIX 1: SALDANHA BAY AMBIENT AIR QUALITY DATA - FEBRUARY 2019
WIND SPEED HOURLY MEAN - m.s-1
Start Hr 0 1 2 3 4 5 6 7 8 9 10 11 12 13 14 15 16 17 18 19 20 21 22 23 Mean MaxDay
1 - - - - - - - - - - - - - - - - - - - - - - - - - -2 - - - - - - - - - - - - - - - - - - - - - - - - - -3 - - - - - - - - - - - - - - - - - - - - - - - - - -4 - - - - - - - - - - - - - - - - - - - - - - - - - -5 - - - - - - - - - - - - - - - - - - - - - - - - - -6 - - - - - - - - - - - - - - - - - - - - - - - - - -7 - - - - - - - - - - - - - - - - - - - - - - - - - -8 - - - - - - - - - - - - - - - - - - - - - - - - - -9 - - - - - - - - - - - - - - - - - - - - - - - - - -
10 - - - - - - - - - - - - - - - - - - - - - - - - - -11 - - - - - - - - - - - - - - - - - - - - - - - - - -12 - - - - - - - - - - - - - - - - - - - - - - - - - -13 - - - - - - - - - - - - - - - - - - - - - - - - - -14 - - - - - - - - - - - - - - - - - - - - - - - - - -15 - - - - - - - - - - - - - - - - - - - - - - - - - -16 - - - - - - - - - - - - - - - - - - - - - - - - - -17 - - - - - - - - - - - - - - - - - - - - - - - - - -18 - - - - - - - - - - - - - - - - - - - - - - - - - -19 - - - - - - - - - - - - - - - - - - - - - - - - - -20 - - - - - - - - - - - - - - - - - - - - - - - - - -21 - - - - - - - - - - - - - - - - - - - - - - - - - -22 - - - - - - - - - - - - - - - - - - - - - - - - - -23 - - - - - - - - - - - - - - - - - - - - - - - - - -24 - - - - - - - - - - - - - - - - - - - - - - - - - -25 - - - - - - - - - - - - - - - - - - - - - - - - - -26 - - - - - - - - - - - - - - - - - - - - - - - - - -27 - - - - - - - - - - - - - - - - - - - - - - - - - -28 - - - - - - - - - - - - - - - - - - - - - - - - - -
Mean - - - - - - - - - - - - - - - - - - - - - - - - -
Max - - - - - - - - - - - - - - - - - - - - - - - - - -
POLLUTANT:
30 of 48
AS1138 APPENDIX 1: SALDANHA BAY AMBIENT AIR QUALITY DATA - FEBRUARY 2019
AMBIENT TEMPERATURE HOURLY MEAN - °C
Start Hr 0 1 2 3 4 5 6 7 8 9 10 11 12 13 14 15 16 17 18 19 20 21 22 23 Mean MaxDay
1 - - - - - - - - - - - - - - - - - - - - - - - - - -2 - - - - - - - - - - - - - - - - - - - - - - - - - -3 - - - - - - - - - - - - - - - - - - - - - - - - - -4 - - - - - - - - - - - - - - - - - - - - - - - - - -5 - - - - - - - - - - - - - - - - - - - - - - - - - -6 - - - - - - - - - - - - - - - - - - - - - - - - - -7 - - - - - - - - - - - - - - - - - - - - - - - - - -8 - - - - - - - - - - - - - - - - - - - - - - - - - -9 - - - - - - - - - - - - - - - - - - - - - - - - - -
10 - - - - - - - - - - - - - - - - - - - - - - - - - -11 - - - - - - - - - - - - - - - - - - - - - - - - - -12 - - - - - - - - - - - - - - - - - - - - - - - - - -13 - - - - - - - - - - - - - - - - - - - - - - - - - -14 - - - - - - - - - - - - - - - - - - - - - - - - - -15 - - - - - - - - - - - - - - - - - - - - - - - - - -16 - - - - - - - - - - - - - - - - - - - - - - - - - -17 - - - - - - - - - - - - - - - - - - - - - - - - - -18 - - - - - - - - - - - - - - - - - - - - - - - - - -19 - - - - - - - - - - - - - - - - - - - - - - - - - -20 - - - - - - - - - - - - - - - - - - - - - - - - - -21 - - - - - - - - - - - - - - - - - - - - - - - - - -22 - - - - - - - - - - - - - - - - - - - - - - - - - -23 - - - - - - - - - - - - - - - - - - - - - - - - - -24 - - - - - - - - - - - - - - - - - - - - - - - - - -25 - - - - - - - - - - - - - - - - - - - - - - - - - -26 - - - - - - - - - - - - - - - - - - - - - - - - - -27 - - - - - - - - - - - - - - - - - - - - - - - - - -28 - - - - - - - - - - - - - - - - - - - - - - - - - -
Mean - - - - - - - - - - - - - - - - - - - - - - - - -
Max - - - - - - - - - - - - - - - - - - - - - - - - - -
POLLUTANT:
31 of 48
AS1138 APPENDIX 1: SALDANHA BAY AMBIENT AIR QUALITY DATA - FEBRUARY 2019
RELATIVE HUMIDITY HOURLY MEAN -%
Start Hr 0 1 2 3 4 5 6 7 8 9 10 11 12 13 14 15 16 17 18 19 20 21 22 23 Mean MaxDay
1 - - - - - - - - - - - - - - - - - - - - - - - - - -2 - - - - - - - - - - - - - - - - - - - - - - - - - -3 - - - - - - - - - - - - - - - - - - - - - - - - - -4 - - - - - - - - - - - - - - - - - - - - - - - - - -5 - - - - - - - - - - - - - - - - - - - - - - - - - -6 - - - - - - - - - - - - - - - - - - - - - - - - - -7 - - - - - - - - - - - - - - - - - - - - - - - - - -8 - - - - - - - - - - - - - - - - - - - - - - - - - -9 - - - - - - - - - - - - - - - - - - - - - - - - - -
10 - - - - - - - - - - - - - - - - - - - - - - - - - -11 - - - - - - - - - - - - - - - - - - - - - - - - - -12 - - - - - - - - - - - - - - - - - - - - - - - - - -13 - - - - - - - - - - - - - - - - - - - - - - - - - -14 - - - - - - - - - - - - - - - - - - - - - - - - - -15 - - - - - - - - - - - - - - - - - - - - - - - - - -16 - - - - - - - - - - - - - - - - - - - - - - - - - -17 - - - - - - - - - - - - - - - - - - - - - - - - - -18 - - - - - - - - - - - - - - - - - - - - - - - - - -19 - - - - - - - - - - - - - - - - - - - - - - - - - -20 - - - - - - - - - - - - - - - - - - - - - - - - - -21 - - - - - - - - - - - - - - - - - - - - - - - - - -22 - - - - - - - - - - - - - - - - - - - - - - - - - -23 - - - - - - - - - - - - - - - - - - - - - - - - - -24 - - - - - - - - - - - - - - - - - - - - - - - - - -25 - - - - - - - - - - - - - - - - - - - - - - - - - -26 - - - - - - - - - - - - - - - - - - - - - - - - - -27 - - - - - - - - - - - - - - - - - - - - - - - - - -28 - - - - - - - - - - - - - - - - - - - - - - - - - -
Mean - - - - - - - - - - - - - - - - - - - - - - - - -
Max - - - - - - - - - - - - - - - - - - - - - - - - - -
POLLUTANT:
32 of 48

AS1138 APPENDIX 1: SALDANHA BAY AMBIENT AIR QUALITY DATA - FEBRUARY 2019
SOLAR RADIATION HOURLY MEAN - W.m-2
Start Hr 0 1 2 3 4 5 6 7 8 9 10 11 12 13 14 15 16 17 18 19 20 21 22 23 Mean MaxDay
1 - - - - - - - - - - - - - - - - - - - - - - - - - -2 - - - - - - - - - - - - - - - - - - - - - - - - - -3 - - - - - - - - - - - - - - - - - - - - - - - - - -4 - - - - - - - - - - - - - - - - - - - - - - - - - -5 - - - - - - - - - - - - - - - - - - - - - - - - - -6 - - - - - - - - - - - - - - - - - - - - - - - - - -7 - - - - - - - - - - - - - - - - - - - - - - - - - -8 - - - - - - - - - - - - - - - - - - - - - - - - - -9 - - - - - - - - - - - - - - - - - - - - - - - - - -
10 - - - - - - - - - - - - - - - - - - - - - - - - - -11 - - - - - - - - - - - - - - - - - - - - - - - - - -12 - - - - - - - - - - - - - - - - - - - - - - - - - -13 - - - - - - - - - - - - - - - - - - - - - - - - - -14 - - - - - - - - - - - - - - - - - - - - - - - - - -15 - - - - - - - - - - - - - - - - - - - - - - - - - -16 - - - - - - - - - - - - - - - - - - - - - - - - - -17 - - - - - - - - - - - - - - - - - - - - - - - - - -18 - - - - - - - - - - - - - - - - - - - - - - - - - -19 - - - - - - - - - - - - - - - - - - - - - - - - - -20 - - - - - - - - - - - - - - - - - - - - - - - - - -21 - - - - - - - - - - - - - - - - - - - - - - - - - -22 - - - - - - - - - - - - - - - - - - - - - - - - - -23 - - - - - - - - - - - - - - - - - - - - - - - - - -24 - - - - - - - - - - - - - - - - - - - - - - - - - -25 - - - - - - - - - - - - - - - - - - - - - - - - - -26 - - - - - - - - - - - - - - - - - - - - - - - - - -27 - - - - - - - - - - - - - - - - - - - - - - - - - -28 - - - - - - - - - - - - - - - - - - - - - - - - - -
Mean - - - - - - - - - - - - - - - - - - - - - - - - -
Max - - - - - - - - - - - - - - - - - - - - - - - - - -
POLLUTANT:
33 of 48

SALDANHA BAY MUNICIPALITY
Ambient Air Quality Monitoring Report for Saldanha Bay and Vredenburg Sites : February 2019
APPENDIX 2: SUMMARY TABLE OF HOURLY MEANS (VREDENBURG)
34 of 48
AS1138 APPENDIX 1: VREDENBURG AMBIENT AIR QUALITY DATA - FEBRUARY 2019
NITROGEN OXIDE HOURLY MEAN CONCENTRATIONS - ppb
Start Hr 0 1 2 3 4 5 6 7 8 9 10 11 12 13 14 15 16 17 18 19 20 21 22 23 Mean MaxDay
1 - - - - - - - - - - - - - - - - - - - - - - - - - -2 - - - - - - - - - - - - - - - - - - - - - - - - - -3 - - - - - - - - - - - - - - - - - - - - - - - - - -4 - - - - - - - - - - - - - - - - - - - - - - - - - -5 - - - - - - - - - - - - - - - - - - - - - - - - - -6 - - - - - - - - - - - - - - - - - - - - - - - - - -7 - - - - - - - - - - - - - - - - - - - - - - - - - -8 - - - - - - - - - - - - - - - - - - - - - - - - - -9 - - - - - - - - - - - - - - - - - - - - - - - - - -
10 - - - - - - - - - - - - - - - - - - - - - - - - - -11 - - - - - - - - - - - - - - - - - - - - - - - - - -12 - - - - - - - - - - - - - - - - - - - - - - - - - -13 - - - - - - - - - - - - - - - - - - - - - - - - - -14 - - - - - - - - - - - - - - - - - - - - - - - - - -15 - - - - - - - - - - - - - - - - - - - - - - - - - -16 - - - - - - - - - - - - - - - - - - - - - - - - - -17 - - - - - - - - - - - - - - - - - - - - - - - - - -18 - - - - - - - - - - - - - - - - - - - - - - - - - -19 - - - - - - - - - - - - - - - - - - - - - - - - - -20 - - - - - - - - - - - - - - - - - - - - - - - - - -21 - - - - - - - - - - - - - - - - - - - - - - - - - -22 - - - - - - - - - - - - - - - - - - - - - - - - - -23 - - - - - - - - - - - - - - - - - - - - - - - - - -24 - - - - - - - - - - - - - - - - - - - - - - - - - -25 - - - - - - - - - - - - - - - - - - - - - - - - - -26 - - - - - - - - - - - - - - - - - - - - - - - - - -27 - - - - - - - - - - - - - - - - - - - - - - - - - -28 - - - - - - - - - - - - - - - - - - - - - - - - - -
Mean - - - - - - - - - - - - - - - - - - - - - - - - -
Max - - - - - - - - - - - - - - - - - - - - - - - - - -
POLLUTANT:
35 of 48
AS1138 APPENDIX 1: VREDENBURG AMBIENT AIR QUALITY DATA - FEBRUARY 2019
NITROGEN DIOXIDE HOURLY MEAN CONCENTRATIONS - ppb
Start Hr 0 1 2 3 4 5 6 7 8 9 10 11 12 13 14 15 16 17 18 19 20 21 22 23 Mean MaxDay
1 - - - - - - - - - - - - - - - - - - - - - - - - - -2 - - - - - - - - - - - - - - - - - - - - - - - - - -3 - - - - - - - - - - - - - - - - - - - - - - - - - -4 - - - - - - - - - - - - - - - - - - - - - - - - - -5 - - - - - - - - - - - - - - - - - - - - - - - - - -6 - - - - - - - - - - - - - - - - - - - - - - - - - -7 - - - - - - - - - - - - - - - - - - - - - - - - - -8 - - - - - - - - - - - - - - - - - - - - - - - - - -9 - - - - - - - - - - - - - - - - - - - - - - - - - -
10 - - - - - - - - - - - - - - - - - - - - - - - - - -11 - - - - - - - - - - - - - - - - - - - - - - - - - -12 - - - - - - - - - - - - - - - - - - - - - - - - - -13 - - - - - - - - - - - - - - - - - - - - - - - - - -14 - - - - - - - - - - - - - - - - - - - - - - - - - -15 - - - - - - - - - - - - - - - - - - - - - - - - - -16 - - - - - - - - - - - - - - - - - - - - - - - - - -17 - - - - - - - - - - - - - - - - - - - - - - - - - -18 - - - - - - - - - - - - - - - - - - - - - - - - - -19 - - - - - - - - - - - - - - - - - - - - - - - - - -20 - - - - - - - - - - - - - - - - - - - - - - - - - -21 - - - - - - - - - - - - - - - - - - - - - - - - - -22 - - - - - - - - - - - - - - - - - - - - - - - - - -23 - - - - - - - - - - - - - - - - - - - - - - - - - -24 - - - - - - - - - - - - - - - - - - - - - - - - - -25 - - - - - - - - - - - - - - - - - - - - - - - - - -26 - - - - - - - - - - - - - - - - - - - - - - - - - -27 - - - - - - - - - - - - - - - - - - - - - - - - - -28 - - - - - - - - - - - - - - - - - - - - - - - - - -
Mean - - - - - - - - - - - - - - - - - - - - - - - - -
Max - - - - - - - - - - - - - - - - - - - - - - - - - -
POLLUTANT:
36 of 48

AS1138 APPENDIX 1: VREDENBURG AMBIENT AIR QUALITY DATA - FEBRUARY 2019
OXIDES OF NITROGEN HOURLY MEAN CONCENTRATIONS - ppb
Start Hr 0 1 2 3 4 5 6 7 8 9 10 11 12 13 14 15 16 17 18 19 20 21 22 23 Mean MaxDay
1 - - - - - - - - - - - - - - - - - - - - - - - - - -2 - - - - - - - - - - - - - - - - - - - - - - - - - -3 - - - - - - - - - - - - - - - - - - - - - - - - - -4 - - - - - - - - - - - - - - - - - - - - - - - - - -5 - - - - - - - - - - - - - - - - - - - - - - - - - -6 - - - - - - - - - - - - - - - - - - - - - - - - - -7 - - - - - - - - - - - - - - - - - - - - - - - - - -8 - - - - - - - - - - - - - - - - - - - - - - - - - -9 - - - - - - - - - - - - - - - - - - - - - - - - - -
10 - - - - - - - - - - - - - - - - - - - - - - - - - -11 - - - - - - - - - - - - - - - - - - - - - - - - - -12 - - - - - - - - - - - - - - - - - - - - - - - - - -13 - - - - - - - - - - - - - - - - - - - - - - - - - -14 - - - - - - - - - - - - - - - - - - - - - - - - - -15 - - - - - - - - - - - - - - - - - - - - - - - - - -16 - - - - - - - - - - - - - - - - - - - - - - - - - -17 - - - - - - - - - - - - - - - - - - - - - - - - - -18 - - - - - - - - - - - - - - - - - - - - - - - - - -19 - - - - - - - - - - - - - - - - - - - - - - - - - -20 - - - - - - - - - - - - - - - - - - - - - - - - - -21 - - - - - - - - - - - - - - - - - - - - - - - - - -22 - - - - - - - - - - - - - - - - - - - - - - - - - -23 - - - - - - - - - - - - - - - - - - - - - - - - - -24 - - - - - - - - - - - - - - - - - - - - - - - - - -25 - - - - - - - - - - - - - - - - - - - - - - - - - -26 - - - - - - - - - - - - - - - - - - - - - - - - - -27 - - - - - - - - - - - - - - - - - - - - - - - - - -28 - - - - - - - - - - - - - - - - - - - - - - - - - -
Mean - - - - - - - - - - - - - - - - - - - - - - - - -
Max - - - - - - - - - - - - - - - - - - - - - - - - - -
POLLUTANT:
37 of 48

AS1138 APPENDIX 1: VREDENBURG AMBIENT AIR QUALITY DATA - FEBRUARY 2019
OZONE HOURLY MEAN CONCENTRATIONS - ppb
Start Hr 0 1 2 3 4 5 6 7 8 9 10 11 12 13 14 15 16 17 18 19 20 21 22 23 Mean MaxDay
1 - - - - - - - - - - - - - - - - - - - - - - - - - -2 - - - - - - - - - - - - - - - - - - - - - - - - - -3 - - - - - - - - - - - - - - - - - - - - - - - - - -4 - - - - - - - - - - - - - - - - - - - - - - - - - -5 - - - - - - - - - - - - - - - - - - - - - - - - - -6 - - - - - - - - - - - - - - - - - - - - - - - - - -7 - - - - - - - - - - - - - - - - - - - - - - - - - -8 - - - - - - - - - - - - - - - - - - - - - - - - - -9 - - - - - - - - - - - - - - - - - - - - - - - - - -
10 - - - - - - - - - - - - - - - - - - - - - - - - - -11 - - - - - - - - - - - - - - - - - - - - - - - - - -12 - - - - - - - - - - - - - - - - - - - - - - - - - -13 - - - - - - - - - - - - - - - - - - - - - - - - - -14 - - - - - - - - - - - - - - - - - - - - - - - - - -15 - - - - - - - - - - - - - - - - - - - - - - - - - -16 - - - - - - - - - - - - - - - - - - - - - - - - - -17 - - - - - - - - - - - - - - - - - - - - - - - - - -18 - - - - - - - - - - - - - - - - - - - - - - - - - -19 - - - - - - - - - - - - - - - - - - - - - - - - - -20 - - - - - - - - - - - - - - - - - - - - - - - - - -21 - - - - - - - - - - - - - - - - - - - - - - - - - -22 - - - - - - - - - - - - - - - - - - - - - - - - - -23 - - - - - - - - - - - - - - - - - - - - - - - - - -24 - - - - - - - - - - - - - - - - - - - - - - - - - -25 - - - - - - - - - - - - - - - - - - - - - - - - - -26 - - - - - - - - - - - - - - - - - - - - - - - - - -27 - - - - - - - - - - - - - - - - - - - - - - - - - -28 - - - - - - - - - - - - - - - - - - - - - - - - - -
Mean - - - - - - - - - - - - - - - - - - - - - - - - -
Max - - - - - - - - - - - - - - - - - - - - - - - - - -
POLLUTANT:
38 of 48

AS1138 APPENDIX 1: VREDENBURG AMBIENT AIR QUALITY DATA - FEBRUARY 2019
OZONE EIGHT-HOURLY MEAN CONCENTRATIONS - ppb
Start Hr 0 1 2 3 4 5 6 7 8 9 10 11 12 13 14 15 16 17 18 19 20 21 22 23 Mean MaxDay
1 - - - - - - - - - - - - - - - - - - - - - - - - - -2 - - - - - - - - - - - - - - - - - - - - - - - - - -3 - - - - - - - - - - - - - - - - - - - - - - - - - -4 - - - - - - - - - - - - - - - - - - - - - - - - - -5 - - - - - - - - - - - - - - - - - - - - - - - - - -6 - - - - - - - - - - - - - - - - - - - - - - - - - -7 - - - - - - - - - - - - - - - - - - - - - - - - - -8 - - - - - - - - - - - - - - - - - - - - - - - - - -9 - - - - - - - - - - - - - - - - - - - - - - - - - -
10 - - - - - - - - - - - - - - - - - - - - - - - - - -11 - - - - - - - - - - - - - - - - - - - - - - - - - -12 - - - - - - - - - - - - - - - - - - - - - - - - - -13 - - - - - - - - - - - - - - - - - - - - - - - - - -14 - - - - - - - - - - - - - - - - - - - - - - - - - -15 - - - - - - - - - - - - - - - - - - - - - - - - - -16 - - - - - - - - - - - - - - - - - - - - - - - - - -17 - - - - - - - - - - - - - - - - - - - - - - - - - -18 - - - - - - - - - - - - - - - - - - - - - - - - - -19 - - - - - - - - - - - - - - - - - - - - - - - - - -20 - - - - - - - - - - - - - - - - - - - - - - - - - -21 - - - - - - - - - - - - - - - - - - - - - - - - - -22 - - - - - - - - - - - - - - - - - - - - - - - - - -23 - - - - - - - - - - - - - - - - - - - - - - - - - -24 - - - - - - - - - - - - - - - - - - - - - - - - - -25 - - - - - - - - - - - - - - - - - - - - - - - - - -26 - - - - - - - - - - - - - - - - - - - - - - - - - -27 - - - - - - - - - - - - - - - - - - - - - - - - - -28 - - - - - - - - - - - - - - - - - - - - - - - - - -
Mean - - - - - - - - - - - - - - - - - - - - - - - - -
Max - - - - - - - - - - - - - - - - - - - - - - - - - -
POLLUTANT:
39 of 48

AS1138 APPENDIX 1: VREDENBURG AMBIENT AIR QUALITY DATA - FEBRUARY 2019
PM-10 HOURLY MEAN CONCENTRATIONS - µg/m3
Start Hr 0 1 2 3 4 5 6 7 8 9 10 11 12 13 14 15 16 17 18 19 20 21 22 23 Mean MaxDay
1 - - - - - - - - - - - - - - - - - - - - - - - - - -2 - - - - - - - - - - - - - - - - - - - - - - - - - -3 - - - - - - - - - - - - - - - - - - - - - - - - - -4 - - - - - - - - - - - - - - - - - - - - - - - - - -5 - - - - - - - - - - - - - - - - - - - - - - - - - -6 - - - - - - - - - - - - - - - - - - - - - - - - - -7 - - - - - - - - - - - - - - - - - - - - - - - - - -8 - - - - - - - - - - - - - - - - - - - - - - - - - -9 - - - - - - - - - - - - - - - - - - - - - - - - - -
10 - - - - - - - - - - - - - - - - - - - - - - - - - -11 - - - - - - - - - - - - - - - - - - - - - - - - - -12 - - - - - - - - - - - - - - - - - - - - - - - - - -13 - - - - - - - - - - - - - - - - - - - - - - - - - -14 - - - - - - - - - - - - - - - - - - - - - - - - - -15 - - - - - - - - - - - - - - - - - - - - - - - - - -16 - - - - - - - - - - - - - - - - - - - - - - - - - -17 - - - - - - - - - - - - - - - - - - - - - - - - - -18 - - - - - - - - - - - - - - - - - - - - - - - - - -19 - - - - - - - - - - - - - - - - - - - - - - - - - -20 - - - - - - - - - - - - - - - - - - - - - - - - - -21 - - - - - - - - - - - - - - - - - - - - - - - - - -22 - - - - - - - - - - - - - - - - - - - - - - - - - -23 - - - - - - - - - - - - - - - - - - - - - - - - - -24 - - - - - - - - - - - - - - - - - - - - - - - - - -25 - - - - - - - - - - - - - - - - - - - - - - - - - -26 - - - - - - - - - - - - - - - - - - - - - - - - - -27 - - - - - - - - - - - - - - - - - - - - - - - - - -28 - - - - - - - - - - - - - - - - - - - - - - - - - -
Mean - - - - - - - - - - - - - - - - - - - - - - - - -
Max - - - - - - - - - - - - - - - - - - - - - - - - - -
POLLUTANT:
40 of 48
AS1138 APPENDIX 1: VREDENBURG AMBIENT AIR QUALITY DATA - FEBRUARY 2019
PM-25 HOURLY MEAN CONCENTRATIONS - µg/m3
Start Hr 0 1 2 3 4 5 6 7 8 9 10 11 12 13 14 15 16 17 18 19 20 21 22 23 Mean MaxDay
1 - - - - - - - - - - - - - - - - - - - - - - - - - -2 - - - - - - - - - - - - - - - - - - - - - - - - - -3 - - - - - - - - - - - - - - - - - - - - - - - - - -4 - - - - - - - - - - - - - - - - - - - - - - - - - -5 - - - - - - - - - - - - - - - - - - - - - - - - - -6 - - - - - - - - - - - - - - - - - - - - - - - - - -7 - - - - - - - - - - - - - - - - - - - - - - - - - -8 - - - - - - - - - - - - - - - - - - - - - - - - - -9 - - - - - - - - - - - - - - - - - - - - - - - - - -
10 - - - - - - - - - - - - - - - - - - - - - - - - - -11 - - - - - - - - - - - - - - - - - - - - - - - - - -12 - - - - - - - - - - - - - - - - - - - - - - - - - -13 - - - - - - - - - - - - - - - - - - - - - - - - - -14 - - - - - - - - - - - - - - - - - - - - - - - - - -15 - - - - - - - - - - - - - - - - - - - - - - - - - -16 - - - - - - - - - - - - - - - - - - - - - - - - - -17 - - - - - - - - - - - - - - - - - - - - - - - - - -18 - - - - - - - - - - - - - - - - - - - - - - - - - -19 - - - - - - - - - - - - - - - - - - - - - - - - - -20 - - - - - - - - - - - - - - - - - - - - - - - - - -21 - - - - - - - - - - - - - - - - - - - - - - - - - -22 - - - - - - - - - - - - - - - - - - - - - - - - - -23 - - - - - - - - - - - - - - - - - - - - - - - - - -24 - - - - - - - - - - - - - - - - - - - - - - - - - -25 - - - - - - - - - - - - - - - - - - - - - - - - - -26 - - - - - - - - - - - - - - - - - - - - - - - - - -27 - - - - - - - - - - - - - - - - - - - - - - - - - -28 - - - - - - - - - - - - - - - - - - - - - - - - - -
Mean - - - - - - - - - - - - - - - - - - - - - - - - -
Max - - - - - - - - - - - - - - - - - - - - - - - - - -
POLLUTANT:
41 of 48
SALDANHA BAY MUNICIPALITY
Ambient Air Quality Monitoring Report for Saldanha Bay and Vredenburg Sites : February 2019
APPENDIX 3: MONITORING METHODOLOGIES
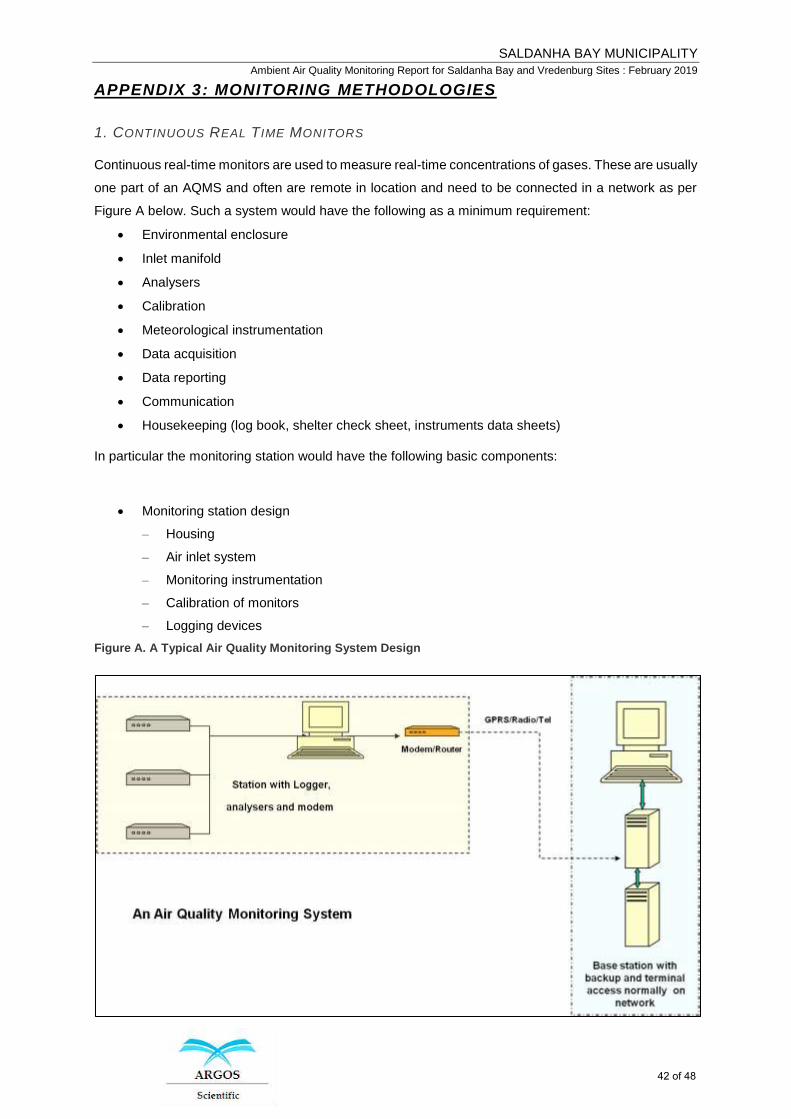
1. CONTINUOUS REAL TIME MONITORS
Continuous real-time monitors are used to measure real-time concentrations of gases. These are usually
one part of an AQMS and often are remote in location and need to be connected in a network as per
Figure A below. Such a system would have the following as a minimum requirement:
• Environmental enclosure
• Inlet manifold
• Analysers
• Calibration
• Meteorological instrumentation
• Data acquisition
• Data reporting
• Communication
• Housekeeping (log book, shelter check sheet, instruments data sheets)
In particular the monitoring station would have the following basic components:
• Monitoring station design
– Housing
– Air inlet system
– Monitoring instrumentation
– Calibration of monitors
– Logging devices
Figure A. A Typical Air Quality Monitoring System Design
42 of 48
SALDANHA BAY MUNICIPALITY
Ambient Air Quality Monitoring Report for Saldanha Bay and Vredenburg Sites : February 2019
• Monitoring Methods
This section gives an overview of the methods employed in the continuous monitoring of ambient
compounds.
1.1 CO/CO2
CO and CO2 are monitored continuously by non-dispersive infrared photometry.
The non-dispersive infrared photometry process is based upon the absorption of infrared light by
CO or CO2.
1.2 NOX
Oxides of nitrogen are measured continuously by the principle of chemiluninescence.
The air sample is split into two pathways; one to measure NO and the other to measure total NOX.
The intensity of light is measured with a photomultiplier to obtain the concentration of NO. To obtain
NO2 the sample gas is passed through a milly converter.
Measurement is the sum of NO2 and NO, expressed as NOX.
43 of 48
SALDANHA BAY MUNICIPALITY
Ambient Air Quality Monitoring Report for Saldanha Bay and Vredenburg Sites : February 2019
1.3 SO2/H2S
SO2 and H2S are monitored continuously by pulsed fluorescence.
In this method, air is drawn through a chamber where it is irradiated with pulses of ultra-violet (UV)
light. Any SO2 in the sample is excited to a higher energy level and upon returning to its original
state, light or fluorescence is released. The amount of fluorescence measured is proportional to the
SO2 concentration.
1.4 O3
O3 is monitored continuously using ultra-violet (UV) light absorption.
The sampled air is exposed to UV light which is absorbed by the O3. The amount of UV light
absorbed is proportional to the amount of O3 in the sample; that is, the more UV light is absorbed,
the greater the amount of O3 in the sample.
1.5 PM-10 and PM-2.5
Particulate matter is monitored continuously and intermittently. The Tapered Element Oscillating
Microbalance (TEOM) is the most widely used and continuous PM-10 (or PM-2.5) monitor.
The TEOM draws an air sample through an inlet system that aerodynamically separates particles
of a specified diameter. The air sample then passes through a filter that is attached to a tapered
element in the mass transducer. This tapered element vibrates at its natural frequency. As particles
are deposited onto the filter, the oscillating frequency changes in proportion to the amount of mass
deposited.
1.6 Meteorological Parameters
Meteorological parameters such as wind direction, wind speed, temperature, relative humidity, solar
radiation and atmospheric pressure are monitored in order to assist in identifying the sources of
elevated concentration events or episodes.
44 of 48
SALDANHA BAY MUNICIPALITY
Ambient Air Quality Monitoring Report for Saldanha Bay and Vredenburg Sites : February 2019
2. QUALITY CONTROL REQUIREMENTS
Quality control of the monitored data is important to verify that the data reported is accurate and of a low
uncertainty. Each monitoring station or passive monitoring site should be treated as if it were a
laboratory. A laboratory is defined as “A place equipped for testing and analysis” or “A place providing
the opportunity for observation in a field of study”.
It must be noted that it has been stated by DEA that only air quality data that is accredited will be
accepted by DEA. The definition for accreditation is “the procedure by which an authoritative body gives
formal recognition that a body is competent to carry out specific tasks”. In order to be accredited a
sampling method must have:
• A recognised methodology that competence can be measured against
• A quality system
• Have been audited by a certification body
A relevant quality system for air quality measurements according to SANAS is ISO 17025. This system
provides guidance to laboratories on essential elements for both:
• Quality management
• Technical requirements for the proper operation of a testing laboratory
3. INSTRUMENT CALIBRATION AND FREQUENCY
This section covers the calibration of continuous air quality monitors. The basic requirements based on
the US EPA Red Book are:
• Each analyser must have a dynamic calibration every three months
• This type of calibration must also be carried out on installation, after any repair, if tolerances of
zero/ span are not met and if the analyser is relocated
• Zero and span calibration every two weeks
• Zero check every other week
4. DATA ACQUISITION REQUIREMENTS
This section also refers to an AQMS based on continuous monitoring from a monitoring station and to
the data logging system:
The data logger must:
• Be verified annually
• Output from the analysers must be recorded
• Generate hourly mean concentrations
• Be able to scan at 30 second intervals with a minimum scan period of 1 hour and store this data
• Collect at least 40 minutes of uninterrupted data per hour for a valid average
• Use calculations verified by a statistician
45 of 48
SALDANHA BAY MUNICIPALITY
Ambient Air Quality Monitoring Report for Saldanha Bay and Vredenburg Sites : February 2019
5. SITE SELECTION
The following quote is noteworthy when considering the location of sites: “Irrespective of how well a
monitoring station is run, if it is not sited correctly data collected will have little value”
As was mentioned earlier sites are selected for one of the following reasons:
• To judge compliance with air quality standards
• To activate emergency control procedures for episodes
• To observe pollution trends throughout a region
• To provide a database for research.
When selecting monitoring sites the following must be considered:
• Economic: Resources must be available for the expensive instrumentation, data retrieval and
evaluation, maintenance and quality assurance and reporting of data
• Security: Problems can arise in this regard that make a site unsuitable when standard measures
are taken into account
• Logistics: Planning, staffing, procurement procedures, training, communications, safety, task
scheduling
• Atmospheric conditions:
o Variability of air pollutants and their transport (effects of buildings, terrain and heat sources)
o Dispersion factors – wind speed, wind direction, atmospheric stability
• Topography: Transport and diffusion of air pollutants are complicated by topographical features
such as valleys or hills
• Pollutant consideration: A sampling site for one pollutant February or February not be suitable for
other pollutants
o For example, monitoring ozone close to primary NO emissions would not provide accurate
pollutant information
• The final placement once a monitoring site has been selected depends on the presence of physical
obstructions, accessibility and availability of utilities.
• Obstructions such as trees and buildings significantly affect the air flow over the monitoring station
and the placement should expose the station to the general air flow of the area to prevent sampling
bias.
• Major roads can produce bias and sites should be 15-60m away unless there are specific
requirements for roadway monitoring. Typically sites would be between 3m and 15m away in this
case.
46 of 48
SALDANHA BAY MUNICIPALITY
Ambient Air Quality Monitoring Report for Saldanha Bay and Vredenburg Sites : February 2019
6. DATA MANAGEMENT
All monitoring stations produce data that February be used for various reasons as outlined above. The
following should be noted when dealing with this monitoring data and systems should be designed to
accommodate the following:
• A copy of the raw data must always be available
• A record must be kept of any adjustments made
• All multiplication factors/ algorithms/ manipulations on the data must be recorded and reported
• Data must be kept for a minimum of 3 years
• When data is reported the temperature and pressure at which the analyser was last calibrated
must be indicated on the test report
The following points must be considered when preparing a monitoring plan:
• Local authority responsible for monitoring
• Check to see if Province has information about your area
• Check to see whether DEA has information about your area (SAAQIS)
• Do screening study to see which pollutants if any are of concern
• SANS 1929 lets you make management decisions on whether costly continuous monitoring is
needed
• If so focus on quality control, reporting 80% or more of available data
• Use data to manage improvements in air quality
47 of 48
SALDANHA BAY MUNICIPALITY
Ambient Air Quality Monitoring Report for Saldanha Bay and Vredenburg Sites : February 2019
APPENDIX 4: QUALITY ASSURANCE STATEMENT
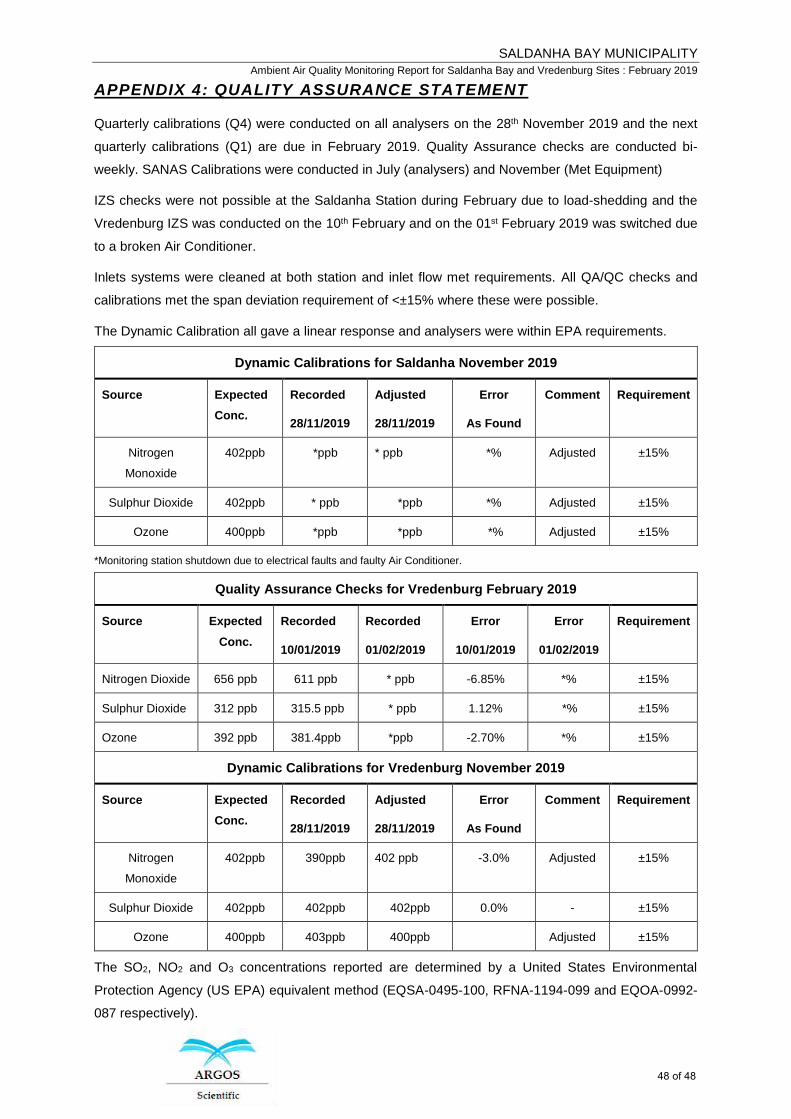
Quarterly calibrations (Q4) were conducted on all analysers on the 28th November 2019 and the next
quarterly calibrations (Q1) are due in February 2019. Quality Assurance checks are conducted bi-
weekly. SANAS Calibrations were conducted in July (analysers) and November (Met Equipment)
IZS checks were not possible at the Saldanha Station during February due to load-shedding and the
Vredenburg IZS was conducted on the 10th February and on the 01st February 2019 was switched due
to a broken Air Conditioner.
Inlets systems were cleaned at both station and inlet flow met requirements. All QA/QC checks and
calibrations met the span deviation requirement of <±15% where these were possible.
The Dynamic Calibration all gave a linear response and analysers were within EPA requirements.
Dynamic Calibrations for Saldanha November 2019
Source Expected
Conc.
Recorded
28/11/2019
Adjusted
28/11/2019
Error
As Found
Comment Requirement
Nitrogen
Monoxide
402ppb *ppb * ppb *% Adjusted ±15%
Sulphur Dioxide 402ppb * ppb *ppb *% Adjusted ±15%
Ozone 400ppb *ppb *ppb *% Adjusted ±15%
*Monitoring station shutdown due to electrical faults and faulty Air Conditioner.
Quality Assurance Checks for Vredenburg February 2019
Source Expected
Conc.
Recorded
10/01/2019
Recorded
01/02/2019
Error
10/01/2019
Error
01/02/2019
Requirement
Nitrogen Dioxide 656 ppb 611 ppb * ppb -6.85% *% ±15%
Sulphur Dioxide 312 ppb 315.5 ppb * ppb 1.12% *% ±15%
Ozone 392 ppb 381.4ppb *ppb -2.70% *% ±15%
Dynamic Calibrations for Vredenburg November 2019
Source Expected
Conc.
Recorded
28/11/2019
Adjusted
28/11/2019
Error
As Found
Comment Requirement
Nitrogen
Monoxide
402ppb 390ppb 402 ppb -3.0% Adjusted ±15%
Sulphur Dioxide 402ppb 402ppb 402ppb 0.0% - ±15%
Ozone 400ppb 403ppb 400ppb Adjusted ±15%
The SO2, NO2 and O3 concentrations reported are determined by a United States Environmental
Protection Agency (US EPA) equivalent method (EQSA-0495-100, RFNA-1194-099 and EQOA-0992-
087 respectively).
48 of 48