Embed Size (px)
Citation preview
Submitted to Sensors. Pages 1 - 21.
OPEN ACCESS
sensors
ISSN 1424-8220www.mdpi.com/journal/sensors
Article
Ambient Intelligence Systems for Personalized Sport Training
J. Vales-Alonso1,�, P. Lopez-Matencio1, F. J. Gonzalez-Castano2, H. Navarro-Hellın1, P. J.
Banos-Guirao1, F. J. Perez-Martınez1, R.P. Martınez-Alvarez3, D. Gonzalez-Jimenez3, F.Gil-Castineira2, R. Duro-Fernandez4
1 Universidad Politecnica de Cartagena, Campus Muralla del Mar. Cartagena, Spain2 Universidad de Vigo, Campus Lagoas-Marcosende. Vigo, Spain3 Gradiant, Campus Lagoas-Marcosende. Vigo, Spain4 Universidad de A Coruna, Rua Maestranza. A Coruna, Spain
� Author to whom correspondence should be addressed; Email: [email protected]
Version November 16, 2009 submitted to Sensors. Typesetted by LATEX using class file mdpi.cls
Abstract: Wireless sensor networks have increasingly grown in the last years, supporting the
concepts of contextual services and ambient intelligence, and enabling new applications at
different areas. Nowadays, several Spanish Information Technologies research programs are
tackling the use of WSN in specific scenarios, such as e-Health, e-Inclusion or e-Sport. This is
the case of the project “Ambient Intelligence Systems Support for Athletes with Specific Pro-
files”, which intends to assist sportsmen with different performance profiles in their training.
In this paper, we describe the main developments and outcomes from this project. The archi-
tecture of the system comprises a WSN deployed in the training area which provides bidirec-
tional communication with athletes’ mobile equipments, performs location tasks, and gathers
environmental variables (humidity, wind speed, temperature, ligth intensity, etc.). Users are
equipped with a monitoring unit which obtain data from the athletes’ training (pulse, oxime-
try, speed). Both sets of data are then used by a decision engine to direct users’ training. An
implementation of this model is presented in this work for a particular scenario where cross
runners are training on a net of tracks with different difficulty. The decision engine, imple-
mented by means of an interpolation algorithm based on (m, s)-splines, heads the runners
towards the most suitable track in each moment to achieve their training goals.
Keywords: Ambient Intelligence; Contextual Services; Wireless Sensor Networks; Sport
Training; Support Vector Machine

Version November 16, 2009 submitted to Sensors 2 of 21
1. Introduction
Wireless sensor networks (WSNs) link information technology with the physical world. Currently,
WSNs are used in a broad range of applications: industrial process control, ecosystem monitoring or
health monitoring among others. Nevertheless, the application areas are constantly growing. It has been
stated that WSNs will provide intelligence to everything around us [1]. As sensor devices shrink, and
their computing and communication capabilities increase, WSNs will get seamlessly integrated into the
physical world (they are transparent to the users, in the sense that the users only perceive the output of
the interfaces).
WSNs may be sensitive and responsive to the presence of people. Depending on the sensed data
(e.g. biometrics, weather conditions, etc.), network devices can situate the user in a context, enabling ap-
plications that react to their changing environments, such as context-aware personalized services. How-
ever, there are some pending research challenges, regarding hardware requirements, service accessibility,
decision-making intelligence, human interfaces, system architectures, security, reliability, etc.
To some extent, the emergence of these networked systems of embedded systems is simply a natural
evolution of the historical trend in computing and communications technologies, which are already of
use in different fields. As an example, advanced sports training is often assisted by more or less complex
computing devices carried by the sportsmen, which provide useful telemetry about their biometrics and
practice related events. Among other parameters, they can monitor heart rate, track routes, measure
speeds and distances, and so forth [2]. All these data are collected while training and recorded in a wrist
or arm unit, to be analyzed by an external software, after each training session. This approach seems
static in some sense, because the external software does not adapt itself to the sportsmen progress, nor it
provides any advice while training.
Supported by the Spanish Ministry of Education, Culture and Sports [3], project Ambient intelligence
systems to assist sportsmen with specific profiles, pursues to provide personalized assistance to sportsmen
in their training.
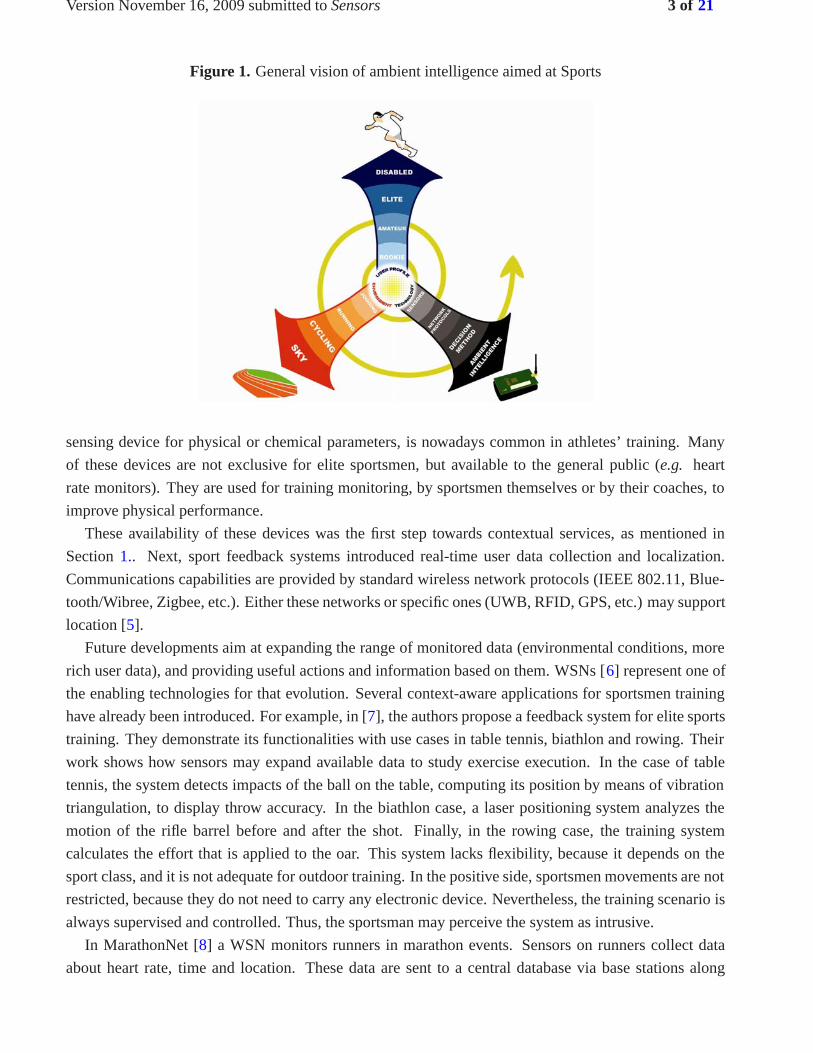
As shown in Figure 1, there are three driving aspects in this project: sportsmen profile, environment,
and computing and communications technologies. Technology will provide adaptive coordination be-
tween the user and the environment, adapting the behavior of the system as it responds to changes in the
environment or the user conditions, such as weather or sportsmen location. Since training conditions can
rapidly vary, the system will be expected to take real time decisions to meet the user needs at their full
potential. Thus, a decision engine, as well as efficient communications and localization protocols, are
two key working areas in the project. This article presents its main advances so far.
The rest of the paper is organized as follows: Section 2. discusses related work. Section 3. presents
the system architecture, its components and the communication protocols. Sections 4. and section 5.
describe a system prototype and the methodology used for the implementation of the decision engine,
respectively. A case of study is analyzed in Section 6.. Finally, section 7. concludes the paper.
2. Related work
As described in [4], the use of chronometers, photocells, contact platforms, microphones, photo or
video cameras, magnetic resonance and X-rays machines, movement sensors and, in summary, every
Version November 16, 2009 submitted to Sensors 3 of 21
Figure 1. General vision of ambient intelligence aimed at Sports
sensing device for physical or chemical parameters, is nowadays common in athletes’ training. Many
of these devices are not exclusive for elite sportsmen, but available to the general public (e.g. heart
rate monitors). They are used for training monitoring, by sportsmen themselves or by their coaches, to
improve physical performance.
These availability of these devices was the first step towards contextual services, as mentioned in
Section 1.. Next, sport feedback systems introduced real-time user data collection and localization.
Communications capabilities are provided by standard wireless network protocols (IEEE 802.11, Blue-
tooth/Wibree, Zigbee, etc.). Either these networks or specific ones (UWB, RFID, GPS, etc.) may support
location [5].
Future developments aim at expanding the range of monitored data (environmental conditions, more
rich user data), and providing useful actions and information based on them. WSNs [6] represent one of
the enabling technologies for that evolution. Several context-aware applications for sportsmen training
have already been introduced. For example, in [7], the authors propose a feedback system for elite sports
training. They demonstrate its functionalities with use cases in table tennis, biathlon and rowing. Their
work shows how sensors may expand available data to study exercise execution. In the case of table
tennis, the system detects impacts of the ball on the table, computing its position by means of vibration
triangulation, to display throw accuracy. In the biathlon case, a laser positioning system analyzes the
motion of the rifle barrel before and after the shot. Finally, in the rowing case, the training system
calculates the effort that is applied to the oar. This system lacks flexibility, because it depends on the
sport class, and it is not adequate for outdoor training. In the positive side, sportsmen movements are not
restricted, because they do not need to carry any electronic device. Nevertheless, the training scenario is
always supervised and controlled. Thus, the sportsman may perceive the system as intrusive.
In MarathonNet [8] a WSN monitors runners in marathon events. Sensors on runners collect data
about heart rate, time and location. These data are sent to a central database via base stations along
Version November 16, 2009 submitted to Sensors 4 of 21
the track, where they are off-line analyzed. Base stations can communicate with the central database by
means of GPRS, WLAN, or a wired network link. The sensor nodes in our work have similar function-
ality, but they also act as information routers.
The system in [9] assists professional skiers. Using accelerometers and force-sensing resistors, skiers
can obtain data about their movements and visualize them, along with video footage, once the exercise
has finished. The research in [10] investigates the combination of two data sources, video and sensed
parameters, to improve the performance of inexpert and elite athletes. This system allows to compare
and evaluate different athletes’ actions and performance, identifying advantages and disadvantages. By
watching recorded video, a coach may give customized feedback to each skier.
Major competition events, like the Olympic games, typically pioneer the adoption if new technologies.
WSN can help referees in their tasks. As an example, in [12], the author introduces the SensorHogu
systems, which embeds piezoelectric force sensors on body protectors, to recognize valid scoring kicks
in Taekwondo.
None of the previous works consider real-time feed-back. In other words, a human -the coach- carries
this task after interpreting sensed data. Some systems aim at simplifying this manual task: The com-
mercial product Team2Pro [11] allows to record and study fitness data in real time for up to 28 players.
Nevertheless, without human intervention the previous system is useless.
A system that aims at providing automatic real-time feedback is described in [13]. The system moni-
tors dynamic data from cyclists and their bicycles. Then, it compares those sensed data with a predefined
set of values to adjust training parameters. For instance, the system can advise the group to change the
formation, split, or to increase or decrease the speed. However, decisions are based on simple rules based
on thresholds on monitored variables. Besides, environmental conditions are not considered (e.g. wind
speed may be critical in cycling).
To sum up, most previous systems do not sense environmental data, but only from sportsmen, and they
only provide limited real-time feedback in some cases. Our proposal tries to overcome such limitations,
providing useful automated feedback to athletes based on an ambient intelligent system, inferring the
behavior of the athlete under changing training conditions.
Our prototype calculates an estimate of the athlete’s heart rate (HR) as the exercise endurance or
the environmental conditions changes. The relationship between HR and sports activity is affected by
many factors, such as temperature, age, sex, mental stress, etc. The effect of ambient temperature in cy-
clist’s HR was studied in [14], which concluded that temperature can be a hardening factor for training.
Analysis of HR dynamics by methods based on chaos theory and nonlinear system theory have received
attention recently, due to observations that suggest that the mechanisms involved in cardiovascular reg-
ulation likely interact with each other nonlinearly [15, 16, 17]. Thus, characterizing HR and athlete
performance is even more difficult.
There exist several numerical and statistical methods to determine the relationships hidden in com-
plex processes where many variables can be involved. These methods have been utilized to predict
physiological parameters, such as HR, systolic blood pressure, or body temperature.
Support vector machines (SVM) have been successfully applied to medical decision support. Refer-
ence [18] describes how to mine medical knowledge from time series of high-dimensional numerical data
describing patients in intensive care. A SVM is used to learn how and when a drug dose must change.
Version November 16, 2009 submitted to Sensors 5 of 21
Also, in [19], it is proposed to improve the diagnosis of tuberculosis infections by means of SVM image
classification. Nevertheless, for sportsmen training purposes, a SVM statistical method requires a huge
amount of time series data of many training sessions, in order to feed the knowledge base of each athlete
appropriately. Therefore, the approach is impractical.
Based on HR and 3D acceleration signals, preprocessed as time sequences, the strategy in [20] em-
ploys Feed-Forward Neural Networks (FFNN) to predict the next time step in the HR sequence. The
predicted HR follows the variance of the real HR, although with noticeable differences in some cases.
The work in this paper is based on numerical approximation techniques based on splines, which are
extensively applied in signal processing and surface fitting areas [21, 22, 23]. Among the different
spline techniques, we selected (m, s)-splines [24] for their favorable characteristics to our research: they
allow to face multi-variable problems, the problem domain is not required to be a mesh grid, and the
computational load is low.
3. System architecture
Our goal was designing a general architecture, to support sportsman and environmental monitoring,
in order to provide real-time feedback for training improvement. The infrastructure is mainly oriented
towards open-field sports, such as running, cycling or skying. In these scenarios, sportsman performance
depends not only on physical conditions, but also heavily on terrain conditions (slope, temperature, wind,
fog, etc.). In indoor sports environmental sensing is less critical and sportsman sensing becomes highly
specialized, as described in Section 2.. Therefore, our approach is less applicable.
Two types of data sets are combined to characterize user performance:
• A static set, which provides information that does not change along training, from the environment
(e.g. terrain slopes, intrinsic exercise, pathway configuration, sensing nodes position, etc.) and the
user (e.g. performance profile, age, skill, training goals, etc.).
• A real-time set, with updated environment information (temperature, wind, visibility, etc.) and
sportsman data (heart rate, body movement, elapsed training time, etc.).
A control element processes these data and issues commands to direct user exercise. Section 6.
describes an implementation of these elements for a realistic case study. The rest of this section describes
the architecture and protocols of the system.
3.1. System components
Figure 2 shows a typical system deployment. It consists of the following elements:
• Infrastructure Nodes (IN), which cover the training area. These nodes sense environmental vari-
ables and relay data to/from the User Equipment or other IN to the Control Node. Communication
relies on a wireless link. In addition, IN nodes also serve as an auxiliary network to perform sports-
men location in the training area. An IN is composed by a processing unit, a wireless interface
including directional communication antennas, and a power supply. Directional antennas increase
the communication range between IN nodes, so that less nodes are necessary, thus reducing net-
work installation costs.
Version November 16, 2009 submitted to Sensors 6 of 21
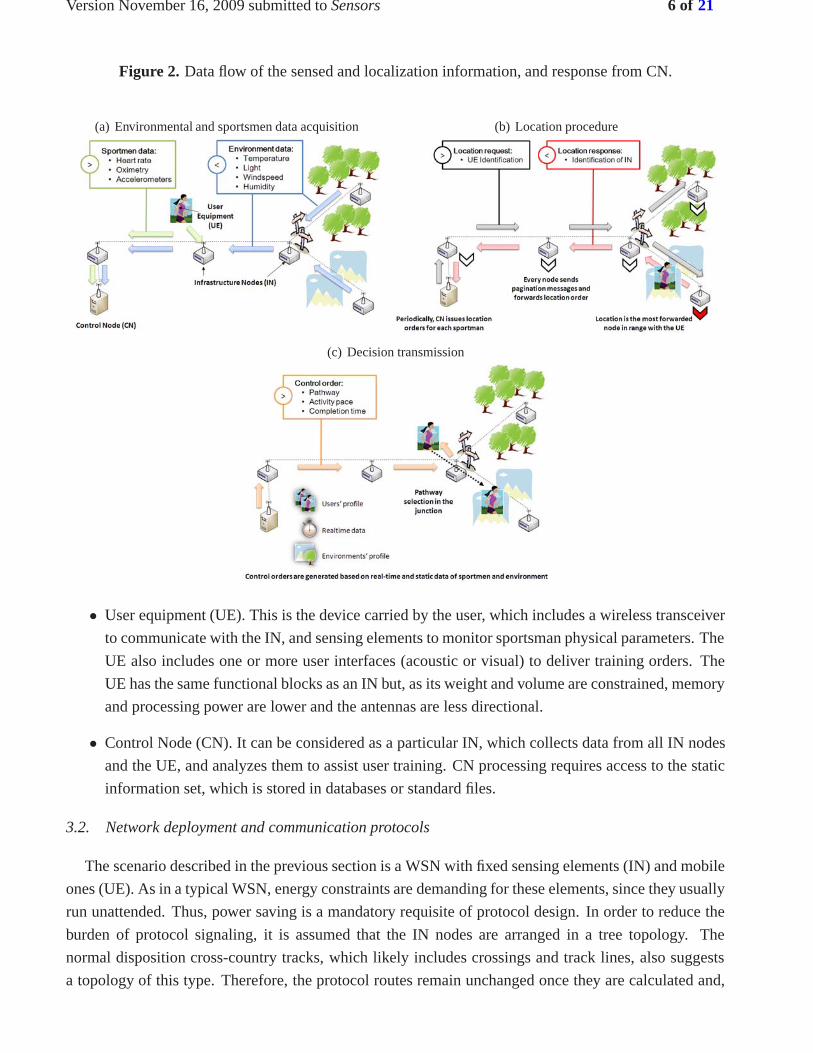
Figure 2. Data flow of the sensed and localization information, and response from CN.
(a) Environmental and sportsmen data acquisition (b) Location procedure
(c) Decision transmission
• User equipment (UE). This is the device carried by the user, which includes a wireless transceiver
to communicate with the IN, and sensing elements to monitor sportsman physical parameters. The
UE also includes one or more user interfaces (acoustic or visual) to deliver training orders. The
UE has the same functional blocks as an IN but, as its weight and volume are constrained, memory
and processing power are lower and the antennas are less directional.
• Control Node (CN). It can be considered as a particular IN, which collects data from all IN nodes
and the UE, and analyzes them to assist user training. CN processing requires access to the static
information set, which is stored in databases or standard files.
3.2. Network deployment and communication protocols
The scenario described in the previous section is a WSN with fixed sensing elements (IN) and mobile
ones (UE). As in a typical WSN, energy constraints are demanding for these elements, since they usually
run unattended. Thus, power saving is a mandatory requisite of protocol design. In order to reduce the
burden of protocol signaling, it is assumed that the IN nodes are arranged in a tree topology. The
normal disposition cross-country tracks, which likely includes crossings and track lines, also suggests
a topology of this type. Therefore, the protocol routes remain unchanged once they are calculated and,
Version November 16, 2009 submitted to Sensors 7 of 21
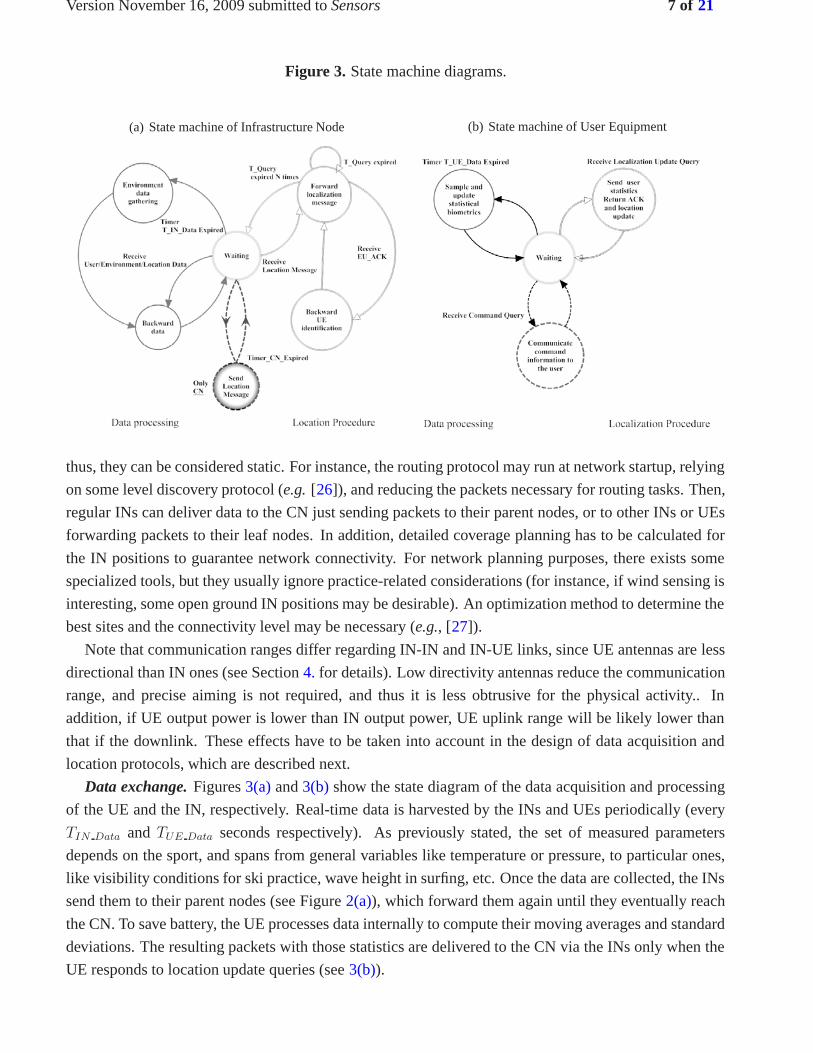
Figure 3. State machine diagrams.
(a) State machine of Infrastructure Node (b) State machine of User Equipment
thus, they can be considered static. For instance, the routing protocol may run at network startup, relying
on some level discovery protocol (e.g. [26]), and reducing the packets necessary for routing tasks. Then,
regular INs can deliver data to the CN just sending packets to their parent nodes, or to other INs or UEs
forwarding packets to their leaf nodes. In addition, detailed coverage planning has to be calculated for
the IN positions to guarantee network connectivity. For network planning purposes, there exists some
specialized tools, but they usually ignore practice-related considerations (for instance, if wind sensing is
interesting, some open ground IN positions may be desirable). An optimization method to determine the
best sites and the connectivity level may be necessary (e.g., [27]).
Note that communication ranges differ regarding IN-IN and IN-UE links, since UE antennas are less
directional than IN ones (see Section 4. for details). Low directivity antennas reduce the communication
range, and precise aiming is not required, and thus it is less obtrusive for the physical activity.. In
addition, if UE output power is lower than IN output power, UE uplink range will be likely lower than
that if the downlink. These effects have to be taken into account in the design of data acquisition and
location protocols, which are described next.
Data exchange. Figures 3(a) and 3(b) show the state diagram of the data acquisition and processing
of the UE and the IN, respectively. Real-time data is harvested by the INs and UEs periodically (every
TIN Data and TUE Data seconds respectively). As previously stated, the set of measured parameters
depends on the sport, and spans from general variables like temperature or pressure, to particular ones,
like visibility conditions for ski practice, wave height in surfing, etc. Once the data are collected, the INs
send them to their parent nodes (see Figure 2(a)), which forward them again until they eventually reach
the CN. To save battery, the UE processes data internally to compute their moving averages and standard
deviations. The resulting packets with those statistics are delivered to the CN via the INs only when the
UE responds to location update queries (see 3(b)).

Version November 16, 2009 submitted to Sensors 8 of 21
The CN issues orders for specific UEs by means of command packets (see Figure 2(c)). These com-
mands are delivered when the sportsman must undertake some action, such as selecting another pathway,
increasing the running pace, etc. The CN delivers the order by transmitting the command to a specific
IN, which, in turn, handles its transmission to the UE. The specific IN is selected according to the UE
position and its movement direction. Both informations are provided by the location procedure.
Location procedure. A discrete positioning system conducted by the INs computes sportsmen loca-
tion. Figure 2(b) illustrates this process, and figures 3(a) and 3(b) describe the IN and UE state diagrams,
respectively. It operates as follows: the CN periodically starts a search by sending a location request
message, including the identity of the nodes it looks for, or a special value indicating that all nodes must
respond. Immediately, the INs forward this query to all their leaf nodes using a broadcast packet. If
one or more of the sought nodes receive this packet, they answer to the IN with a unicast packet, which
also includes the last sportsman statistics. The receiving IN forwards the packet to the CN. However,
the sportsman may transitory lie out of IN coverage, because it crosses shadow areas (due to the reduced
UE-IN communication range), or because the broadcast packet gets lost. As a consequence, in the proto-
col implementation, each IN retransmits the broadcast query packet every TQUERY seconds for NQUERY
times. Eventually, the CN is informed of the nodes in range with each particular UE. The sportsman
movement direction may also be computed from the previous location records.
4. Implementation
A prototype based on the architecture described in the previous section has been implemented using
standard WSN hardware (MicaZ and Imote2 motes from Crossbow Technology [28]). This prototype
has been tested in a cross-country running application (described in the next section). Nevertheless, it
can be easily adapted to other sport activities, such as cycling, walking, etc. In the following paragraphs
the implementation of each component is described, as well as the parameter selection for the protocol.
4.1. IN implementation
Each IN requires sensing, processing, and communicating capabilities, as stated in section 3.. We
selected the MICAz mote [29], based on the CC2420 chip [31], as the IN core. It works in the 2.4 GHz
band, and it is compliant with the low power Zigbee/IEEE 802.15.4 [30] physical interface. Its Medium
Access Control (MAC) protocol is B-MAC [32]. On one hand, B-MAC provides suitable unicast (with
Automatic Repeat reQuest mechanism) and broadcast transmissions, both required for the location and
data transmission protocols. On the other, B-MAC minimizes energy consumption, which is mandatory
in a real WSM deployment. MICAz software relies on the open source event-oriented TinyOS operating
system [33], which is a reliable platform for ad-hoc protocol programming.
Environmental sensing is carried out by a MTS400 sensor board [34], designed for Crossbow motes,
which measures light, temperature, humidity, barometric pressure and seismic activity, although in our
testbeds (section 6.) we only activated temperature sensing.
In addition, each MICAz is equipped with two panel antennas (a 2.4 GHz Stella Doradus 24-8080
planar antenna [35]) to improve communication range. The reason is twofold: (i) to cope with radio
propagation issues (caused by natural obstacles like knolls, woodlands, etc) that may worsen commu-
Version November 16, 2009 submitted to Sensors 9 of 21
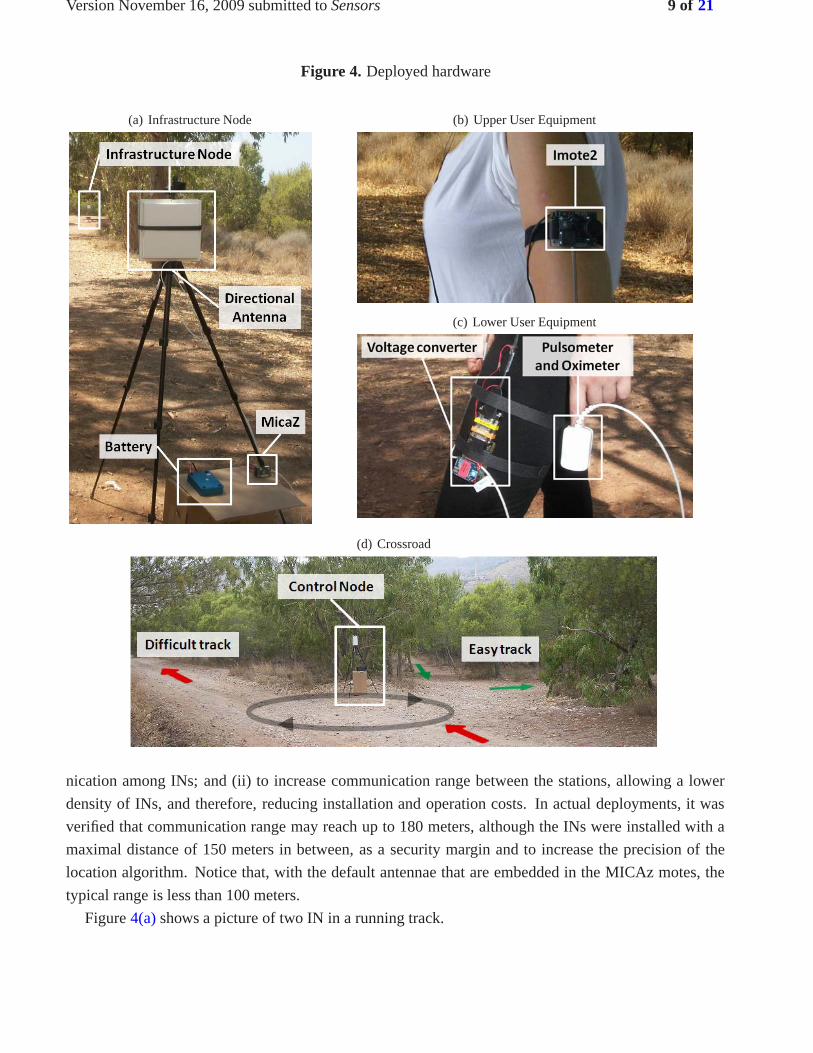
Figure 4. Deployed hardware
(a) Infrastructure Node (b) Upper User Equipment
(c) Lower User Equipment
(d) Crossroad
nication among INs; and (ii) to increase communication range between the stations, allowing a lower
density of INs, and therefore, reducing installation and operation costs. In actual deployments, it was
verified that communication range may reach up to 180 meters, although the INs were installed with a
maximal distance of 150 meters in between, as a security margin and to increase the precision of the
location algorithm. Notice that, with the default antennae that are embedded in the MICAz motes, the
typical range is less than 100 meters.
Figure 4(a) shows a picture of two IN in a running track.

Version November 16, 2009 submitted to Sensors 10 of 21
4.2. CN implementation
The CN can be considered a special IN, because it has the same sensing and data transmission ca-
pabilities. Moreover, the CN also implements the intelligence of the system: it issues commands to
the network and to the users in order to fulfill training goals. Its decisions are transparent to the user,
which only receives the training advice through his/her UE. In this implementation, the decision engine
selects the best path to achieve a target HR. The classification procedure to compute the HR is based on
a (m, s)-spline approximation. Section 5. describes this method in deep.
The location of the CN in our network deployment is shown in Figure 6(b).
4.3. User equipment
As in the IN case, the UE combines sensing and communications functionalities. Nevertheless, the
UE is designed to sense human biometrics, instead of environmental parameters. Human biometrics
variables usually change faster than environmental ones. Therefore, sample frequencies must be higher.
In addition, to avoid continuous packet transmission, these samples are processed in the UE, and only
their statistics are transmitted. The UE must also deliver training advice to the athlete. Thus, the UE is
also the interface between the system and the user. In the implementation, the advices are received and
transmitted to the user as vocal speech messages. To reduce the required bandwidth and energy, an advice
command is just a packet with an identification, and the UE contains in its memory the corresponding
vocal message.
To perform these operations, the UE is composed by several modules, as shown in Figures 4(b) and
4(c). The main module is the Crossbow IMOTE2 IPR2400 [36], a wireless sensor network platform that
can be expanded with extension boards to customize the system to a specific application. IMOTE2 also
includes an 802.15.4 radio (CC2420) with a built-in 2.4 GHz antenna for IN-UE data communications.
In the IMOTE2 there is an embedded IMB400 multimedia board [37] with a codec to play the speech
messages. These messages are recorded into the 32 MB FLASH memory of the IMOTE2, which allows
for up to 50 messages. The IMB400 also has a color image and video camera chip with audio capture,
which could be used in future system applications.
For human biometrics sensing, an integrated pulse oximetry device (iPOD model 3211, from Nonin
Medical company [38]) was used. This sensing device takes measures of heart rhythm and oxygen level
with a low power consumption. The iPOD was chosen due to its lightness, size, and easy integration in
the UE. In fact, only the connection of the iPOD RS-232 interface with the IMOTE2 required a simple
voltage adaptation. An specific driver in TinyOS for connectivity and iPOD control was also developed.
4.4. Protocol parameters selection
In order to tune protocol operation, different parameters and timers (introduced in section 3.) must be
established. Some of them are related to the sportsman activity (e.g. speed), whereas others are related to
environmental change rate. The selection of sportsman parameters was based on an informed guess that
guarantees system operation, limiting message exchange to minimize the impact on energy consumption.
The selection of environmental parameters is discussed next. Table 1 summarizes the parameters for the
specific example of section 6..

Version November 16, 2009 submitted to Sensors 11 of 21
• TQUERY is the elapsed time between IN transmissions of location update requests. It is related
to the shadow time, TSHADOW , which an athlete may experience between consecutive INs. The
criterion was TQUERY = TSHADOW , since this guarantees that, in the worst case, the number of
lost packets is just one. Otherwise, for lower values, more packets may be transmitted (and lost)
while the user is in the shadow area. For higher values, the delay of the communication between
the IN and the UE will increase.
To compute TSHADOW let us denote v as the average expected user speed, and DSHADOW as the
length of the shadow area. Then,
TQUERY = TSHADOW =DSHADOW
v(1)
Besides, DSHADOW can be computed as a function of IN antenna directivity gain (GIN ), the
directivity gain of the UE (GUE), IN output power (PIN ), UE output power (PUE), and the distance
between INs (D).
DSHADOW = D(1 − 2
√GUE PUE
GIN PIN) (2)
Hence,
TQUERY =D(1 − 2
√GUE PUE
GIN PIN)
v(3)
Since in our testbed GIN = 11,15 dB, GUE = 1,41 dB, PIN = 0 dBm, PUE = 0 dBm, D = 150
meters, and v = 4,16 m/s (15 km/h), then TQUERY = 13 s.
• NQUERY is the number of times that an IN tries to locate UEs nearby. It is configured to be the
expected number of intervals of TQUERY s that a user stays in the IN range:
NQUERY =D
v
1
TQUERY(4)
With the reference configuration, NQUERY = 3.
• TCN is the elapsed time between two location procedures initiated by the CN. The minimal interval
corresponds to the expected time in IN range:
TCN = NQUERY TQUERY =D
v(5)
Higher values reduce energy consumption, at the expense of a lower location accuracy.
With the reference configuration, the minimal value should be TCN = 36 s.
Version November 16, 2009 submitted to Sensors 12 of 21
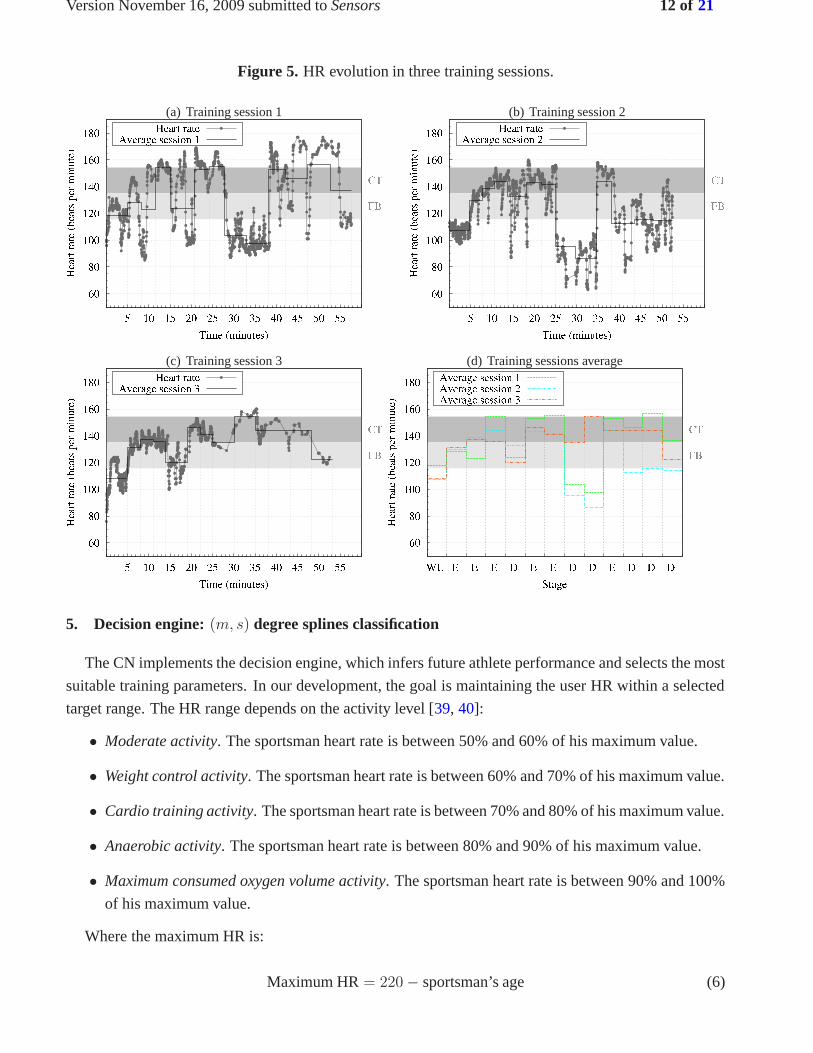
Figure 5. HR evolution in three training sessions.
(a) Training session 1 (b) Training session 2
(c) Training session 3 (d) Training sessions average
5. Decision engine: (m, s) degree splines classification
The CN implements the decision engine, which infers future athlete performance and selects the most
suitable training parameters. In our development, the goal is maintaining the user HR within a selected
target range. The HR range depends on the activity level [39, 40]:
• Moderate activity. The sportsman heart rate is between 50% and 60% of his maximum value.
• Weight control activity. The sportsman heart rate is between 60% and 70% of his maximum value.
• Cardio training activity. The sportsman heart rate is between 70% and 80% of his maximum value.
• Anaerobic activity. The sportsman heart rate is between 80% and 90% of his maximum value.
• Maximum consumed oxygen volume activity. The sportsman heart rate is between 90% and 100%
of his maximum value.
Where the maximum HR is:
Maximum HR = 220 − sportsman’s age (6)

Version November 16, 2009 submitted to Sensors 13 of 21
The decision consists in the next track the athlete must follow. Training advices are calculated by the
decision engine from the following variables:
• Current track environmental temperature, which is considered to be divided in two ranges: “hot”
for temperatures over 25 Celsius degrees or “cold” for lower temperatures.
• Future track temperature (Hot or Cold).
• Current track hardness: Difficult (D) or Easy (E) tracks.
• Future track hardness (Difficult or Easy).
• Average heart rate during the last track.
• Variance of the heart rate during the last track.
All these variables have influence on HR performance [14, 20]. The INs monitor the temperature
of the tracks, while the UE measures the user HR. The information on track hardness is static and it is
selected a priori taking into account the length and the slopes of each circuit. Note that the CN is aware
of the position of the different UEs that are present in the training field, and knows the direction of the
movement. When a user approaches a bifurcation, the CN selects the next track in two steps:
First, for all possible next tracks, the CN runs a classification algorithm which selects whether:
1. The user will increase his average HR over 5% of his maximum HR
2. The user will decrease his average HR below 5% of his maximum HR
3. The user Will keep his average HR within ± 5% of his maximum HR
Then, based on these results, and according to the user profile, the CN selects the appropriate tracks
with the following rules:
• If the target HR is below the current HR and a HR drop is predicted, the track belongs to the set of
suitable tracks.
• If the target HR is above the current HR and an increase of HR is predicted, the track belongs to
the set of suitable tracks.
• If the current HR is within ± 5% of the user maximum HR, and the expected HR will lie in this
interval, the track belongs to the set of suitable tracks.
Then, the user is notified the selected track. If there are several suitable tracks, the choice is random.
If none is selected, the system informs the user that all of them are valid.
The key of this process is the classification method, which must cope with the uncertainty of HR
prediction. As an example of its difficulty, Figure 5 shows results for three training sessions, which
were performed as part of the experimental validation in section 6.. It is interesting to observe in Figure
5(d) how the same part in different sessions produces so different average HR values. This is because
sportsmen psychology and physical condition have an important role in performance. They can induce

Version November 16, 2009 submitted to Sensors 14 of 21
the sportsman to increase physical activity, and, accordingly, HR in the easy section of the course; or the
sportsman to rest in the same section, leading to activity and HR decrease. For example, this is possibly
the reason why session 3 ends several minutes before sessions 1 and 2 do. Note as well that HR increases
are not directly related to hardness or temperature increases: e.g. the hardness increase from track 7 to
track 8 (see figure 5(d)) produces a sudden HR drop.
To implement the classification algorithm different approaches have been considered, such as SVM,
but finally an interpolation method that computes the expected HR has been selected. Based on the
computed HR, the classification region is selected (increase, decrease or same level). Interpolation is
performed by means of (m, s)-degree splines. As it has been mentioned in Section 2., interpolation
techniques with splines functions have been extensively studied and successfully applied in computer-
aided geometric image processing, and curve and surface generations. These techniques can be easily
extended to approach solutions in multi-dimensional problems, as the one in this work.
5.1. (m, s) degree splines
Interpolation with (m, s)-degree splines has the following advantages that make them suitable to
implement the decision engine:
• Data points must not belong to a mesh grid (as in our case), unlike in other multi-variable inter-
polation methods (e.g. tensor product with finite elements, or with a basis of any vector space of
functions). Nevertheless, data points must differ for the problem to have a unique solution.
• Reduced computing cost to obtain the interpolation function. As described next, finding the solu-
tion requires to solve a system of linear equations with a matrix of symmetric coefficients, which
conditions standard solution methods (e.g Gaussian elimination). Once the interpolation function
is obtained, computing the next HR under new conditions in immediate.
The theory of (m, s)-degree splines derives from the study of the semi-Hilbert space of functions,
Xm,s, as is described in [24].
Let d ∈ N∗ be the number of dimensions considered (e.g. six in our problem). Given a set of elements
Ad∈Rd, and its corresponding values β ∈ R at those locations (e.g. HR in our problem), the goal is to
determine a mapping σdε as smooth as possible that approximates the observed data.
The problem can be formulated as the minimization of the penalized sum of squares:
Jdε (v) =
∣∣ρdv − β|2 + ε∣∣ v|2m,s (7)
where ε > 0, v ∈ Xm,s, and ρd is an operator defined as
ρdv = (v(a))a∈Ad (8)
Value ε∣∣v|2m,s represents a smoothness penalty on function v. The semi-norm |v|m,s is specifically
defined in [24, 25].
Then, the approximation spline of degree (m, s) relative to Ad, β, and ε, is a function σdε such that
∀v ∈ Xm,s, Jdε
(σd
ε
) ≤ Jdε (v).

Version November 16, 2009 submitted to Sensors 15 of 21
Considering Pm as the ring of real polynomials of d variables, x1, x2, . . . , xd, and degree ≤ m, namely
{p ∈ Pm, p(x) =
∑α1+···+αd≤m
xα11 · · ·xαd
d ; x ∈ Rd
}(9)
In [24] it is demonstrated that σdε is unique and it can be obtained by solving the following system of
equations:
{εC∗λb +
∑a∈Ad λaK2m+2s−n(b − a) +
∑Mj=1 Cjpj(b) = βb, ε > 0∑
a∈Ad λapj(a) = 0, ∀j = 1, . . . , M(10)
where {pj, 1 ≤ j ≤ M} is a space basis of Pm−1, M = dimPm−1, and λa, a ∈ Ad, λb, b ∈ Ad, and
Cj , 1 ≤ j ≤ M are coefficients to be determined. The function K2m+2s−n(x) is
K2m+2s−n(x) =
{|x|2m+2s−n , si 2m + 2s �= 2l, l ∈ N
∗
|x|2m+2s−n log|x| , si 2m + 2s = 2l, l ∈ N∗ (11)
The constant C∗ has the following expression:
C∗ =
{(2π)2m
C1, si 2m + 2s �= 2l, l ∈ N
∗(2π)2m
C2, si 2m + 2s = 2l, l ∈ N
∗ (12)
with
C1 =π(2m+2s−n/2)Γ(n
2−m−s)
Γ(m+s), C2 = 2π(2m+2s−n/2)(−1)(m+s−n/2+1)
Γ(m+s)(m+s−n2 )!
(13)
Therefore, approximation (m, s) − splines has a coefficient matrix whose diagonal is εC∗. In this
work the value of ε is zero, and then σd is an interpolation function.
6. Validation experiment: cross-country training circuit
The prototype has been validated by means of a cross-country training experiment. The selected area
is located near Cartagena (Spain), and it is shown in figure 6. It consists of two interconnected loops (red
and blue) with different hardness and environmental conditions due to:
• Closeness to the sea in some areas of the circuit. For example, training by the coast is characterized
by constant winds.
• Different terrain slopes, since part of the circuit is on a hill whose height is 97 meters over sea
level, with some slopes of 14%.
• Shadow, depending on training hours and the trees along the circuit (as can be observed in the red
circuit in Figure 6(a). It has influence on temperature.
• Different lengths: 1.1 and 0.9 kilometers for the red and blue tracks, respectively.
Version November 16, 2009 submitted to Sensors 16 of 21
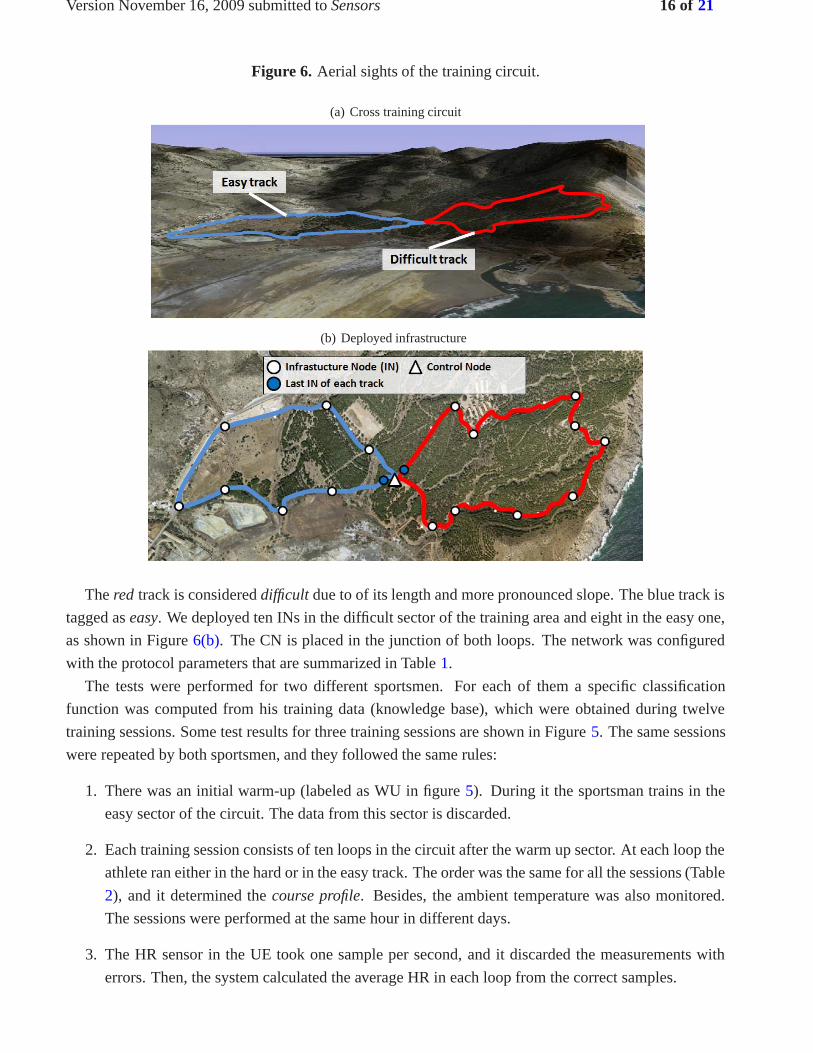
Figure 6. Aerial sights of the training circuit.
(a) Cross training circuit
(b) Deployed infrastructure
The red track is considered difficult due to of its length and more pronounced slope. The blue track is
tagged as easy. We deployed ten INs in the difficult sector of the training area and eight in the easy one,
as shown in Figure 6(b). The CN is placed in the junction of both loops. The network was configured
with the protocol parameters that are summarized in Table 1.
The tests were performed for two different sportsmen. For each of them a specific classification
function was computed from his training data (knowledge base), which were obtained during twelve
training sessions. Some test results for three training sessions are shown in Figure 5. The same sessions
were repeated by both sportsmen, and they followed the same rules:
1. There was an initial warm-up (labeled as WU in figure 5). During it the sportsman trains in the
easy sector of the circuit. The data from this sector is discarded.
2. Each training session consists of ten loops in the circuit after the warm up sector. At each loop the
athlete ran either in the hard or in the easy track. The order was the same for all the sessions (Table
2), and it determined the course profile. Besides, the ambient temperature was also monitored.
The sessions were performed at the same hour in different days.
3. The HR sensor in the UE took one sample per second, and it discarded the measurements with
errors. Then, the system calculated the average HR in each loop from the correct samples.

Version November 16, 2009 submitted to Sensors 17 of 21
Table 1. Protocol parameter selection
Parameter Value
TQUERY 13 s
TCN 60 s
TINDATA120 s
TUEDATA1 s
NQUERY 3
Table 2. Course profile of a training session.
Loop 1 2 3 4 5 6 7 8 9 10 11 12 13
Hardness WU E E E D E E D D E D D D
With the collected data, the classification mappings of section 5. were computed. The conformity
of the classification method was measured by means of its degree of discrepancy between the decision
engine outcome and the following real sportsman HR. To perform these conformity tests, several samples
were taken from the training set. From the knowledge base of the first sportsman, which included a
total of 119 HR values with their associated variable values, 14 records were randomly chosen. For
the second sportsman, with 110 HR and associated variable values in his knowledge base, 12 records
were randomly chosen. These records represent 11.8% and 10.9% of their respective knowledge bases.
Then, the classification method was applied (to compute the expected HR rate) and the success rate was
measured (notice that for every sample the real HR value was available). Table 3 summarizes the results
of four conformity tests for the two sportsmen.
Table 3. Conformity test results.
Base Records Percentage of valid decisions
dimension analyzed Test 1 Test 2 Test 3 Test 4
sportsman-1 119 11.80% 76.80% 76.40% 85.70% 71.40%
sportsman-2 110 10.90% 75.00% 75.00% 75.00% 83.30%
The (m, s)-spline decision engine outperforms a SVM for the same knowledge base (the outcomes of
a SVM practically resembled a toss coin test), that reflects the uncontrolled effects of sportsman subjec-
tive sensations about the intensity of the physical activity (Figure 5) and the nonlinear behavior of HR
fluctuations (mentioned in Section 2.). We have carried out tests that also considered environment tem-
perature and track hardness for two of three previous tracks (instead of only one), but SVM performance
did not improve.

Version November 16, 2009 submitted to Sensors 18 of 21
Moreover, in the deployment, the communication and location delays and the location accuracy were
measured. The round trip time of a message from the CN to a particular UE (or viceversa) was less than
0.55 ms per hop for a packet length of 10 bytes including headers. The average location delay was 5.73
s, (the procedure may suffer temporary fading of the communications with the UE due to shadow areas).
The average number of nodes that detected a UE was 1.3.
7. Conclusions and future work
This work demonstrates the feasibility of ambient intelligence technologies applied to outdoor sports
practice. The environment, the athlete condition, and the track configuration are taken into account
to provide real-time feedback directly to the user. A main outcome is the design of the classification
method, which features a success rate that is close to 80%. Besides, both the infrastructure and the
user equipment, which were developed with off-the-shelf sensor technology, behaved well for ambient
intelligence applications. The results of this work may be extrapolated to other contexts than sports.
As future work, we aim at developing less intrusive UE devices, and design testbeds for different
sports.
Acknowledgements
This work has been supported by grants DEP2006-56158-C03-01/02/03, TEC2007-67966-01/02/TCM
CON-PARTE-1/2 (Ministerio de Educacion y Ciencia, Spain), TSI-020301-2008-16 ELISA and TSI-
020301-2008-2 PIRAmIDE (Ministerio de Industria, Turismo y Comercio, Spain), and it has been also
developed within the framework of “Programa de Ayudas a Grupos de Excelencia de la Region de Mur-
cia”, funded by Fundacion Seneca, Agencia de Ciencia y Tecnologia de la Region de Murcia (Plan
Regional de Ciencia y Tecnologia 2007/2010).
References
1. Aarts, Emile; Harwig, Rick; Schuurmans, Martin. ”Ambient Intelligence” in The Invisible Future:
The Seamless Integration Of Technology Into Everyday Life. 2001. McGraw-Hill Companies.
2. Training plan bank with Polar devices,
http://www.polarusa.com/us-en/training with polar/training plan bank
3. Ministry of Education, Culture and Sports webpage, http://www.educacion.es/portada.html, [in
spanish].
4. Perez-Soriano, P.; Llana-Belloch, S. Instrumentation in Sports Biomechanics. Journal of Human
Sport and Exercise 2007; vol. 2, pp. 26-41.
5. Mao G.; Fidan B.; Anderson, B. D.O. Wireless sensor network localization techniques, Computer
Networks; Volume 51, Issue 10, 11 July 2007, pp. 2529-2553,
6. Armstrong, S. Wireless connectivity for health and sports monitoring: a review. British Journal of
Sports Medicine, 2007; 41:285-289.
7. Baca, A.; Kornfeind, P. Rapid Feedback Systems for Elite Sports Training, Pervasive Computing,
2006; pp. 70-76.
8. Pfisterer, D.; Lipphardt, M.; Buschmann, C.; Hellbrueck, H.; Fischer, S.; Hendrik Sauselin, J.

Version November 16, 2009 submitted to Sensors 19 of 21
MarathonNet: adding value to large scale sport events - A connectivity analysis. Conference on
Integrated Internet Ad-hoc and Sensor Networks, 2006.
9. Michahelles, F.; Schiele, B. Sensing and Monitoring Professional Skiers. Pervasive Computing,
2005; pp. 40-46.
10. Hailes, S.; Kalra, D.; Hopper, A.; Lasenby, J.; Kerwin, D.; Wilson, A. SESAME (SEnsing for Sport
And Managed Exercise). http://www.sesame.ucl.ac.uk/index.html. 2006-2010.
11. Team sports products from Polar Company webpage,
http://www.polarusa.com/us-en/b2b products/team sports
12. Chi, Ed H. Introducing Wearable Force Sensors in Martial Arts. Pervasive Computing, 2005; pp.
47-53.
13. Thomas Jaitner, T.; Trapp, M.; Niebuhr, D.; Koch, J. Indoor-Simulation of Team Training in Cy-
cling. Engineering of sport 6; Vol. 1; Developments for sports. International Sports Engineering
Association. Springer Science, 2006.
14. Backx, K; van Someren, K A.; Nevill, A M.; Palmer, G S. Mathematical Prediction of One Hour
Cycle Time Trial Performance Under Different Ambient Temperatures. Medicine & Science in
Sports & Exercise, May 2003; Volume 35, Issue 5; p S30.
15. Kaplan, D.T.; Furman, M.I.; Pincus, S.M.; Ryan, S.M.; Lipsitz, L.A.; Goldberger, A.L. Aging and
the complexity of cardiovascular dynamics. Biophysical Journal; Volume 59, Issue 4, April 1991;
pp. 945-949.
16. Absilz,P.-A.; Sepulchrez, R.; Bilgey, A.; Gerard, P. Nonlinear analysis of cardiac rhythm fluctua-
tions using DFA method. Physica. A, Statistical mechanics and its applications, 1999; vol. 272,
no1-2; pp. 235-244.
17. Huikuri, H.V.; Makikallio, T.H.; Perkiomaki, J. Measurement of heart rate variability by methods
based on nonlinear dynamics. Journal of Electrocardiology; Volume 36, Supplement 1, December
2003; pp 95-99.
18. Veropoulos, K.; Cristianini, N.; Campbell, C. The Application of Support Vector Machines to
Medical Decision Support: A Case Study. Advanced Course in Artificial Intelligence (ACAI”99),
Jul. 1999.
19. Morik, K.; Brockhausen, P.; Joachims, T. Combining statistical learning with a knowledge-based
approach - A case study in intensive care monitoring. Proc. 16th International Conference on
Machine Learning (ICML-99), 1999.
20. Yuchi, M.; Jo, J. Heart Rate Prediction Based on Physical Activity Using Feedforwad Neural Net-
work. Hybrid Information Technology, International Conference on, pp. 344-350, 2008 Interna-
tional Conference on Convergence and Hybrid Information Technology, 2008.
21. Lancaster, P.; Salkauskas, K. Curve and Surface Fitting. An Introduction. Academic Press, Lon-
don; 1986.
22. Torrens, J. J. Discrete smoothing Dm-splines: applications to surface fitting. In Proceedings of
the international Conference on Mathematical Methods For Curves and Surfaces II Lillehammer,
1997 (Lillehammer, Norway). Eds. Vanderbilt University, Nashville, TN; pp. 477-484.
23. Unser, M. Splines: A perfect fit for signal and image processing. Signal Processing Magazine,
1999; Vol. 16, no. 6; pp. 22-38.

Version November 16, 2009 submitted to Sensors 20 of 21
24. Lopez de Silanes, M.C.; Arcangeli, R. Estimations de l erreur d approximation par splines d inter-
polation et d a justement d ordre (m,s). Numerische Mathematik, no56, Springer Verlag, 1989; pp.
449467.
25. Sharma G.; Shaw M.Q. Thin-plate splines for printer data interpolation. In Proceeding of European
Signal Processing Conference (EUSIPCO), 2006.
26. The Collection Tree Protocol(CTP), TinyOS-2.X webpage,
http://www.tinyos.net/tinyos-2.x/doc/html/tep123.html
27. J. Vales-Alonso; S. Costas-Rodrıguez;M. V. Bueno-Delgado; E. Egea-Lopez; F. Gil-Castineira;
P. S. Rodrıguez-Hernandez; J. Garcıa-Haro; F. J. Gonzalez-Castano. An Analytical Approach to
the Optimal Deployment of Wireless Sensor Networks. Computational Intelligence for Remote
Sensing, Springer Berlin / Heidelberg, Volume 133/2008, Pages 145-161.
28. Crossbow Technology webpage, http://www.xbow.com/
29. Micaz, Crossbow webpage, http://www.xbow.com/Products/productdetails.aspx?sid=164.
30. Zigbee Alliance webpage, http://www.zigbee.org/LearnMore/WhitePapers/tabid/257/Default.aspx
31. CC2420 Chip Documentation, http://docs.tinyos.net/index.php/CC2420
32. BMAC, Versatile Low Power Media Acces for WSN, http://www.polastre.com/papers/sensys04-
bmac.pdf
33. TinyOS webpage, http://www.tinyos.net/.
34. MTS400, Crossbow webpage, http://www.xbow.com/Products/productdetails.aspx?sid=177
35. MTS400, Stella Doradus webpage, http://www.stelladoradus.com/2.4.ghz.planar.antennas.php
36. Imote2, Crossbow webpage, http://www.xbow.com/Products/productdetails.aspx?sid=253.
37. IMB-400 Multimedia Board, Crossbow webpage,
http://www.xbow.com/Products/productdetails.aspx?sid=280
38. Pulse Oximeter and Sensor webpage, http://www.nonin.com/products/ipod-digital-oximeter-and-
sensor-all-in-one/
39. Musnick, D.; Pierce, M. Conditioning for outdoor fitness: functional exercise and nutrition for
every body; The Mountaineers Books, 2004.
40. Mora, J. Triathlon workout planner; Eds.; Human Kinetics, 2006; pp. 45-49.
41. Anlauff, M.; Sunbul, A. Deploying localization services in wireless sensor networks. In Proceed-
ings. 24th International Conference on Distributed Computing Systems Workshops, March 2004;
pp. 782-787.
42. Hu, L.; Evans, D. Localization for Mobile Sensor Networks. International Conference on Mobile
Computing and Networking, 2004.
43. HZein-Sabatto, S.; Elangovan, V.; Wei Chen; Mgaya, R. Localization strategies for large-scale
airbone deployed wireless sensors. Computational intelligence in multi-criteria decision-making,
mcdm ’09. ieee symposium, 2009; pp. 9-15.
44. Ganesh, S. Efficient localization scheme for wireless sensor networks. Wireless Communications
and Sensor Networks, WCSN 2008. Fourth International Conference, 2008; pp. 73-76.
45. Galstyan, A.; Krishnamachari, B.; Lerman, K.; Pattem, S. Distributed online localization in sensor
networks using a moving target. Information Processing in Sensor Networks. IPSN 2004. Third
International Symposium, 2004; pp. 61-70.

Version November 16, 2009 submitted to Sensors 21 of 21
46. D’Souza, M.; Wark, T.; Ros, M. Wireless localisation network for patient tracking. Intelligent
Sensors, Sensor Networks and Information Processing. ISSNIP 2008. International Conference,
2008; pp. 79-84.
47. Oh, S.; Sastry, S. Tracking on a Graph. Information Processing in Sensor Networks, IPSN 2005.
Fourth International Symposium , 2005; pp. 195-202.
c© November 16, 2009 by the authors; submitted to Sensors for open access under the terms and condi-
tions of the Creative Commons Attribution license http://creativecommons.org/licenses/by/3.0/.


![Middlesex Universityeis.mdx.ac.uk/staffpages/juanaugusto/AITAmI2006.pdf · Artificial Intelligence Techniques for Ambient Intelligence (AITAmI06) Ambient intelligence [1] (AmI) is](https://img.pdfslide.net/doc/110x75/5f571a916659c52d7f47326c/middlesex-artiicial-intelligence-techniques-for-ambient-intelligence-aitami06.jpg)