Embed Size (px)
Citation preview
NJ Department of Environmental Protection Water Monitoring and Standards
AMBIENT LAKES MONITORING NETWORK
Panel 2
Volume 1 of 2
Echo Lake, West Milford, Passaic County
December 2011
State of New Jersey NJ Department of Environmental Protection Chris Christie, Governor Bob Martin, Commissioner Kim Guadagno, Lt. Governor
NJ Department of Environmental Protection
Water Monitoring and Standards Jill Lipoti, Director
Bureau of Freshwater & Biological Monitoring Leslie J. McGeorge, Administrator
December 2011
AMBIENT LAKES MONITORING NETWORK Panel 2
Volume 1 of 2
AUTHOR
Victor Poretti
PROJECT OFFICER Johannus Franken
DATA MANAGEMENT
Thomas Miller Brian Taylor
GIS AND MAPS
Leigh Lager
FIELD COLLECTION STAFF Johannus Franken
Thomas Miller Victor Poretti Brian Taylor
ACKNOWLEDGEMENTS
This report would not have been possible without the significant contributions from environmental scientists at the New Jersey Department of Environmental Protection and the United States Environmental Protection Agency. Alfred Korndoerfer, Debra Hammond, Kevin Berry, Leslie McGeorge, and Alena Baldwin-Brown, of NJDEP Water Monitoring and Standards provided useful editorial comments and interpretation of results. Jim Kurtenbach at U.S. EPA Region 2 provided guidance on the Network’s design and implementation. Tony Olsen at USEPA National Health and Environmental Effects, Research Lab/ORD Western Ecology Division created the probabilistically-based design of the Network. Many thanks to all involved for the successful implementation of the Ambient Lakes Monitoring Network.

TABLE OF CONTENTS
Executive Summary …………………………………………………………. 1 Introduction………………………………………………………………….. 5 Methods and Materials………………………………………………………. 9 Results and Discussion………………………………………………………. 15
Summary of Physical/Chemical and Biological Measures……..………15 Trophic State Index (TSI)……………………………………………....22 Potential Stressors………………………………………………………25
Recommendations………………………………………………………26 References……………………………………………………………………..28
1
EXECUTIVE SUMMARY The NJ Department of Environmental Protection (NJDEP) initiated a renewed Ambient Lake Monitoring Network in 2005. This initiative, which was undertaken by Water Monitoring and Standards’ (WM&S) Bureau of Freshwater & Biological Monitoring (BFBM), was in response to deficiencies cited in a 1999 USEPA Office of Inspector General’s (OIG) Audit Report [14] of the state’s water monitoring programs, recommendations from EPA’s “Elements of a State Water Monitoring and Assessment Program” (March 2003) [11], as well as needs identified by the Department’s Watershed Management and Water Quality Standards and Assessment programs. Additional monitoring and assessment is performed in support of USEPA’s National Lake Assessment (NLA). The network consists of 200 lakes, divided into five Panels of 40 lakes each. Lakes were selected probabilistically, using EPA’s Generalized Random Tessellation Stratified (GRTS) method, in a manner that equalizes selections over all Omerik Level III Ecoregions [9], of which there are six (6) in the state. The GRTS survey design is a plan for selecting the sample area appropriately so that it provides valid data for developing accurate estimates for the entire population or area of interest that meets specific design criteria. In this case, the population is New Jersey’s lakes defined as: a permanent body of water man made or natural of at least two (2) hectares in size, and a depth of approximately one meter at the deepest point measured; potable water reservoirs with active “draw downs” are excluded. These Statewide probabilistic estimates will be addressed in a separate report. Data is collected to evaluate the trophic state of selected lakes and assess the ecological health of the State's lentic water resources. Forty lakes (designated as a Panel) per year are monitored in order to develop baseline, and eventually statewide status and trend information for New Jersey lakes. Water quality monitoring takes place at up to three in-lake stations that best represent the limnological aspects of the lake. Sites are sampled three times per year (spring, summer, and fall). In addition to evaluating the ecological health of lakes statewide, information from this monitoring network is used to assess the conditions of individual lakes in the New Jersey Integrated Water Quality Monitoring and Assessment Report (Integrated Report) [6] (see http://www.state.nj.us/dep/wms/bwqsa/generalinfo.html ). The methods used to collect, analyze, and interpret data for the Integrated Report are outlined in the Integrated Water Quality Monitoring and Assessment Methods document.[7] This Methods Document provides an objective and scientifically sound assessment methodology. The Methods require samples for in-lake chemistry to be collected just below the surface (generally at a one-meter depth if the lake is sufficiently deep). Lakes can have multiple in-lake sampling locations, depending on their size. Each sampling location within a lake is considered a “subsample”. Lake subsamples that do not comply with the applicable numeric SWQS criteria are considered excursions and are reviewed to determine if the excursion is within the margin of error of the analytical method or can be attributed to natural conditions or transient events. Excursions occurring at multiple locations or subsamples within a lake on the same date are considered a “single excursion”.

2
Figure ES1. Panel 2 Summary of Trophic Status.
For lakes, there are three parameters with numeric SWQS criteria:
Total Phosphorus (TP) > 0.05 mg/L
Dissolved Oxygen (DO) < 4.0mg/l (There is also a daily average criterion of 5mg/l, which is not applicable to the sampling methods used for this monitoring network) pH 3.5 - 8.5 Standard Units (SU)* *6.5 – 8.5 SU for lakes within waters designated as FW2 waters in the Upper Delaware, Upper Raritan, Passaic, and Wallkill River Basins. *4.5 - 7.5 SU for lakes within FW2 waters in the Atlantic, Lower Delaware, and Lower Raritan River basins. *3.5 - 5.5 SU for lakes designated as PL waters.
The lake condition is evaluated along with other water quality information at the subwatershed level (HUC14) and presented in the Integrated Water Quality Monitoring and Assessment Report. In 2006, 40 Panel 2 lakes were sampled. Of these 40 lakes, 18 had an excursion from the SWQS Criterion [7] for TP from at least one in-lake station. Very low DO levels (the SWQC of < 4.0 mg/l) were observed in 15 lakes in the mesotrophic-through-hypereutrophic range, predominantly during the summer months. Elevated pH levels showed a strong correlation to algal concentrations. Lakes with higher pH measurements also had higher chlorophyll “a” concentrations, thus more likely to be in a eutrophic state. See Volume 2 of this report for all raw data results. Carlson’s Trophic State Index (TSI) is used as the basis for estimating the trophic status of New Jersey Lakes. Trophic status ranges from oligotrophic to hyper-eutrophic, and is viewed as a continuum on this scale. Carlson’s TSI is based on the interrelationships of TP (TP), chlorophyll “a”, and Secchi disk transparency. Nine (9) lakes (Keswick Lake, Dennisville Lake, Greenwood Lake, Taunton Lake, Harrisville Lake, Mount Misery Lake, Stony Lake, Irisado Lake, and Lefferts Lake) had a TSI rating of Oligotrophic for at least one station and one season. This rating always occurred in the spring or fall, with the exception of Lefferts Lake which received an oligotrophic rating in the summer.
Trophic Status of Panel 2 Lakes
50.0%
15.0%
12.5% 22.5%
Oligotrophic(Lakes with ≥ 1Oligotrophic sites)
Mesotrophic(Lakes with ≥ 1Mesotrophic site and no Oligotrophic sites)
Eutrophic(Lakes with only Eutrophic sites)
Hyper-eutrophic(Lakes with ≥ 1Hyper-eutrophic and no Oligotrophic orMesotrophic sites)

3
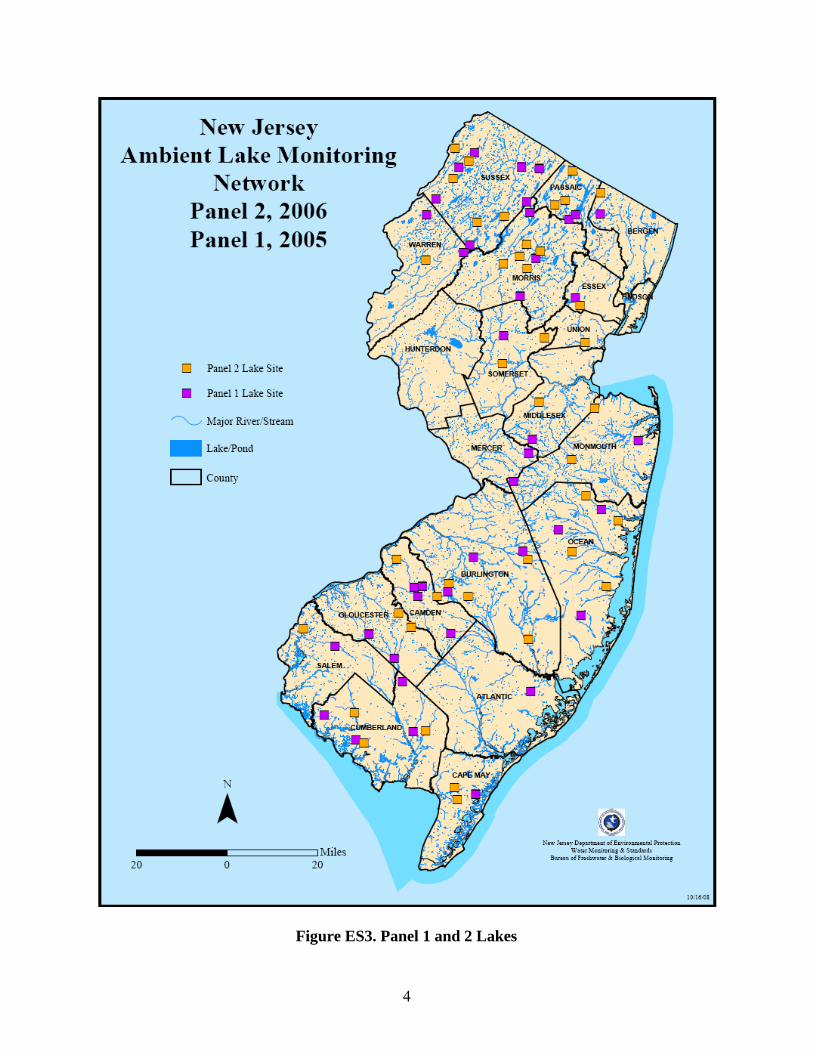
Three lakes (Harrisville Lake, Mount Misery Lake, and Lefferts Lake) were a combination of oligotrophic and mesotrophic for all seasons sampled. All other lakes sampled had a TSI rating of eutrophic or hyper-eutrophic for at least one site during one season. (Figure ES1) The Panel 2 monitoring data and assessments provide a continuing, but preliminary, estimate of the statewide status of New Jersey lakes (Figure ES1). As in Panel 1, the number of Panel 2 lakes exhibiting periods of oligotrophy was limited and no lakes were oligotrophic for all three seasons. This demonstrates that lakes assessed for the Network to date (Panel 1 and Panel 2) are in, or may be accelerating toward, an entirely eutrophic state. Figure ES2 provides a comparison of results from Panel 1 and Panel 2 lakes. All lakes sampled to date are shown in Figure ES3. Additional Information Additional information on the Ambient Lakes Monitoring Program can be obtained from WM&S’ Bureau of Freshwater & Biological Monitoring by calling 609-292-0427 or visiting its website at: www.state.nj.us/dep/wms/bfbm. Raw data is posted on this website by the end of the calendar year that the data is received and validated. Additionally, raw data is submitted to WQX as soon as the data is received and validated. WQX is USEPA's repository and framework for water quality, biological, and physical data. It is used by state environmental agencies, EPA and other federal agencies, universities, private citizens, and many others to store data. The retrieval of the data is handled through the STORET interface and can be accessed at: www.epa.gov/storet. Comments are welcome and may be emailed to: [email protected]
0.00%10.00%20.00%30.00%40.00%50.00%
Oligotro
phic
Mesotr
ophic
Eutroph
ic
Hyper-
eutro
phic
Trophic State Comparison Panel 1 & Panel 2
Panel 1Panel 2Combined
Figure ES2. Comparison of Panel 1 & Panel 2 Lakes
4
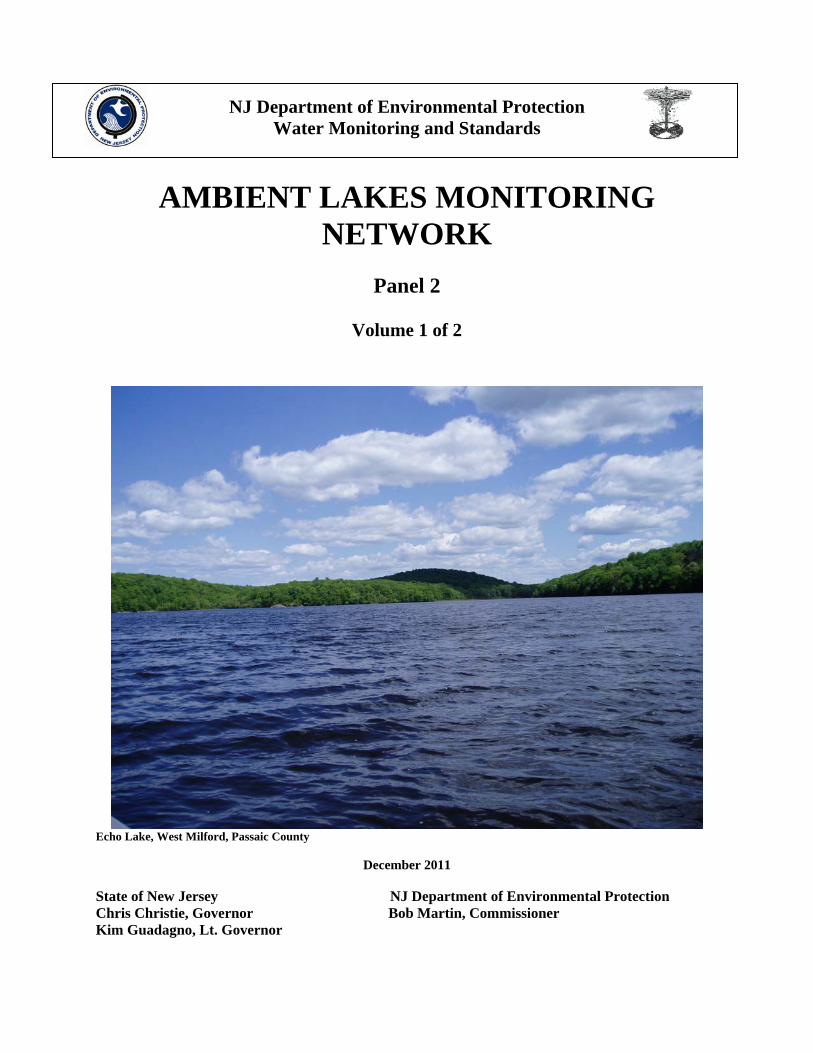
Figure ES3. Panel 1 and 2 Lakes

5
INTRODUCTION
Background In 2003, Water Monitoring & Standard’s (WM&S’) Bureau of Freshwater and Biological Monitoring (BFBM) formed an Ambient Lake Water Quality Monitoring Workgroup (Lake Workgroup). The workgroup was tasked with developing a monitoring network design optimized to address the ambient lake assessment deficiencies cited in the 1999 USEPA Office of Inspector General’s (OIG) Audit Report, [14] the recommendations from EPA’s “Elements of a State Water Monitoring and Assessment Program” [11], as well as needs identified by the Department’s Watershed Management and Water Quality Standards and Assessment programs. Of particular concern to EPA was that the state needed a network design that would capture the status of lake water quality statewide – a task the EPA felt could only be accomplished by a probabilistically designed network. Members of the Workgroup included representatives from WM&S/BFBM, the Bureau of Environmental Analysis and Restoration (BEAR) in the Division of Watershed Management (responsible for developing TMDLs); WM&S’ Bureau of Water Quality Standards and Assessment, which is responsible for preparing the Integrated Water Quality Monitoring and Assessment Report (Integrated Report)[6]; and the USEPA Region 2, Division of Environmental Science and Assessment. New Jersey Ambient Lakes Monitoring Network As a result of the recommendations of the Lake Workgroup NJDEP initiated a renewed ambient lake monitoring network in 2005. The target population was identified as all lakes, man-made or natural, wholly or partially within New Jersey’s political boundaries, excepting water supply reservoirs being actively managed for potable water supply. Water supply reservoirs are subject to various pumping and water exchange operations, which do not represent the statewide status of New Jersey lakes and were, therefore, excluded. In order to maximize the applicability of the monitoring for statewide assessments, a probabilistically-based design was selected for the renewed network. Towards that end, lakes were selected randomly, using EPA’s Generalized Random Tessellation Stratified (GRTS) method, but in a manner that equalizes selections over all Omerik Level III Ecoregions [9], of which there are six (6) in the state. Additional design stratifications include defining a lake as a permanent body of water of at least two (2) hectares in size, and a depth of approximately one meter at the deepest point measured; potable water reservoirs with active “draw downs” are excluded.. The final probabilistic network consists of 200 lakes divided into five Panels of 40 lakes, each Panel sampled once every five (5) years; each lake sampled 3 times per year, during the Spring, Summer and Fall. Because lakes were chosen using the GRTS method, data from the 200 lakes in the Network can be used to develop accurate probabilistic estimates for all lakes in New Jersey which meet the network design stratifications. These Statewide probabilistic estimates will be addressed in a separate report. Table 1 lists the active sites sampled for Panel 2. Figure 1 shows sites sampled as of this report. Additional monitoring and assessment is performed in support of USEPA’s National Lake Assessment (NLA).

6
Figure 1. Panel 1 and 2 Lakes

7
Table 1. 2006 (Panel 2) Active Sites
SITE ID NAME COUNTY MUNICIPALITY NJW04459-048 A. Clemente Inc. Pond SALEM CARNEYS POINT TWP NJW04459-240 Bear Swamp Lake BERGEN MAHWAH NJW04459-078 Bells Lake GLOUCESTER WASHINGTON TWP NJW04459-079 Bennetts Pond OCEAN JACKSON TWP NJW04459-062 Bowlby Pond MORRIS DOVER TOWN NJW04459-052 Campbells Pond ESSEX MILLBURN TWP NJW04459-055 Cedar Lake MORRIS DENVILLE TWP NJW04459-243 Cedar Lake CUMBERLAND LAWRENCE TWP NJW04459-051 Chesler Lake MORRIS ROXBURY TWP NJW04459-073 Clint Millpond CAPE MAY DENNIS TWP NJW04459-047 Cooper River Lake CAMDEN COLLINGSWOOD BORO NJW04459-045 Crystal Spring Lake GLOUCESTER MONROE TWP NJW04459-053 Cumberland Pond CUMBERLAND MAURICE RIVER TWP NJW04459-046 Dennisville Lake CAPE MAY DENNIS TWP NJW04459-072 Echo Lake PASSAIC WEST MILFORD TWP NJW04459-060 Farrington Lake MIDDLESEX EAST BRUNSWICK TWP NJW04459-071 Flamingo Lake BURLINGTON EVESHAM TWP NJW04459-075 Gardners Pond SUSSEX ANDOVER TWP NJW04459-049 Greenwood Lake PASSAIC WEST MILFORD TWP NJW04459-057 Harrisville Lake BURLINGTON WASHINGTON TWP NJW04459-077 Irisado Lake OCEAN BRICK TWP NJW04459-061 Jeddy's Pond CUMBERLAND BRIDGETON CITY NJW04459-042 Keswick Lake OCEAN MANCHESTER TWP NJW04459-054 Kittatinny Camp Lake SUSSEX SANDYSTON TWP NJW04459-242 Lake 31A SOMERSET HILLSBOROUGH TWP NJW04459-080 Lefferts Lake MONMOUTH MATAWAN BORO NJW04459-246 Liberty Lake WARREN LIBERTY TWP NJW04459-068 Lower Lake OCEAN LACEY TWP NJW04459-059 Mecca Lake SUSSEX HAMPTON TWP NJW04459-074 Millhurst Pond MONMOUTH MANALAPAN TWP NJW04459-058 Mt. Misery Lake BURLINGTON PEMBERTON TWP NJW04459-041 Openaka Lake MORRIS DENVILLE TWP NJW04459-044 Rahway River Park Lake UNION RAHWAY CITY NJW04459-064 Saginaw Lake SUSSEX SPARTA TWP NJW04459-065 Shadow Lake BURLINGTON SHAMONG TWP NJW04459-063 Stony Lake SUSSEX SANDYSTON TWP NJW04459-050 Taunton Lake BURLINGTON MEDFORD TWP NJW04459-076 Upper Mount Glenn Lake PASSAIC WEST MILFORD TWP NJW04459-070 Upper Mount Hope Lake MORRIS ROCKAWAY TWP NJW04459-245 Watchung Lake SOMERSET WATCHUNG BORO

8
Lake Eutrophication (aging) Process Lakes are frequently divided into two (2) types: oligotrophic and eutrophic. These two types represent the extreme ends of a lake aging (eutrophication) continuum. Some typical characteristics of an oligotrophic lake are greater depth, adequate concentrations of DO from surface to bottom, low nutrients, low quantities of phytoplankton (measured as chlorophyll “a”), little aquatic plant growth, and good water clarity. Eutrophic lakes, in contrast, are usually shallow, have low DO levels, are rich in nutrients, have persistent aquatic plant and phytoplankton growth, and decreased water clarity (usually due to an increase of phytoplankton levels). Generally, as the oligotrophic lake ages, it gradually accumulates sediment and nutrients and moves toward and eventually into the eutrophic stage. There is a transitional stage between the oligotrophic and eutrophic conditions and this has been labeled the mesotrophic condition. Lakes having a hyper-eutrophic condition have little or no oxygen in the bottom layers. They have extreme algae and aquatic plant problems. The lake aging process is a natural process that commonly occurs over thousands of years. This natural aging process is often accelerated, however, by what has been termed cultural eutrophication (resulting from human activities). Unlike natural eutrophication, cultural eutrophication can accelerate oligotrophic type lakes into the eutrophic conditions in a matter of a human generation or two. To measure the trophic state of the lakes sampled, the Carlson’s Trophic State Index (TSI), calculated using TP concentrations, Chlorophyll-a concentrations, and Secchi disk transparency measurements, was selected as the indicator of choice. [3]

9
METHODS and MATERIALS
General Procedures: Sampling was performed on a given lake when there had not been any rainfall within 24 hours prior to sampling. This is to ensure that the sample is representative of the overall condition of the lake and not the condition of the lake only after a rain event. Sample volumes and container types are as described in the respective analytical laboratory’s “Quality Manual” and/ or SOP, which have been approved by NJDEP’s Office of Quality Assurance (OQA) and are on file with that Office as part of the laboratory’s certification application.
Sample Equipment Cleaning: Prior to field sampling, all sample collection equipment is thoroughly cleaned using a phosphate free detergent and rinsed with ultra pure PICO® water several times to ensure no phosphorus contamination is present. Physical / Chemical Sampling Procedures and Parameters: Samples were collected at multiple lake locations (up to three in-lake stations). In addition, the outlet(s) of each lake were sampled. Samples were collected as per "NJDEP Field Sampling Procedures Manual", 2005.[5] In-lake samples were taken one meter below the surface, unless the lake was stratified or the sampling station had a depth of less than one meter. When a lake is stratified (the seasonal formation of a thermocline) samples will be taken from the epilimnion (upper layer), and hypolimnion (lower layer). However, no Panel 2 lakes exhibited characteristics of stratification. While every attempt was made to select lakes with a depth of at least one meter, some lakes had depths of slightly less than one meter. A drop in depth to below one meter was usually attributed to seasonality. In lakes less than one meter deep, samples were collected at 0.5 meters below the surface or mid-depth. Samples were collected using a submerged horizontal sampler. A combination field blank and equipment blank of PICO® water was collected on-site from the submerged horizontal sampler prior to the first sample for each lake (PICO® water, an ultra clean water, is supplied from the WM&S/BFBM lab system, which is analyzed twice per year at a NJ certified laboratory for applicable parameters). Prior to sampling each station, the submerged sampler is field rinsed with "water of interest" (i.e. lake water present at each station at the sample depth) three times prior to collecting a sample at each station for the lake. Each individual lake required one dedicated and cleaned submerged sampler. Samples collected from the submerged sampler were analyzed for the following parameters:
Total Phosphorus (TP) Nitrite and Nitrate Ammonia Total Kjeldahl Nitrogen (TKN) Hardness Alkalinity Turbidity Chlorophyll “a”.

10
For stratified lakes, these samples (with the exception of chlorophyll “a”) were also collected from the epilimnion and hypolimnion. Turbidity was also measured from these discrete samples, using a HACH 2100P Turbidity meter. All samples collected, except for turbitity, were analyzed off-site at a New Jersey certified laboratory. Analytical results are reported in exact concentrations except when a result is at a level below the method Reporting Limit (RL) and a definitive concentration cannot be determined. In these cases, the result is reported as Non-Detected (ND). For TP, the RL changed near the end of the summer sampling. This was due to an upgrade in analytical instrumentation at the laboratory, resulting in greater sensitivity and a lower RL (see Volume 2, raw data sheets). An in situ top-to-bottom profile was also measured at each in-lake station for:
Specific Conductance pH Water Temperature DO.
Measurements were recorded at one meter depth intervals using a Hydrolab QUANTA multi-parameter meter. Total depth was measured using a Hondex Portable Depth Sounder. Aquatic plants, however, sometimes obstruct the readings of the Depth Sounder. In these cases, measurements were recorded using the Hydrolab QUANTA multi-parameter meter. The Hydrolab probe was lowered until resting on the lake bottom and the total depth was recorded. Transparency was measured using a Secchi Disk. Sampling was also performed, using the above methods and same parameters, at observed “hot spots” in a lake. A “hot spot” is defined as a small area of the lake which has unusual characteristics as compared to the rest of the lake. These characteristics include dense algal growth and unusual odor or color. A “hot spot” was sampled at only one lake, Taunton Lake, during the 2006 sampling where dense algal growth was observed throughout the water column. Lake outlets streams were sampled for the same parameters as the in-lake samples, with the exception of transparency. Outlet samples were collected as a “grab” as per "NJDEP Field Sampling Procedures Manual", 2005, [5] (http://www.state.nj.us/dep/srp/guidance/fspm/) at a depth representative of the total water column. In situ measurements were also recorded using a Hydrolab QUANTA multi-parameter meter at approximately mid-depth of the average total water column. Other Parameters Sampled / Measured / or Observed
Aquatic vegetation: A gross estimate of total areal coverage of dominant type(s) of surface macrophytes was recorded. Lake macrophyte areal extent is determined by preparing an aerial photograph map of each lake prior to the sampling date. This is done using the latest version of aerial photography available and using GIS shapefiles for lake identification. The map includes the entire area of the lake so that it can be used for navigation/identification while on the lake. During the summer sampling season, all

11
surface vegetation observed at each lake was marked on the aerial photograph map. This is done using a combination of landmarks (such as houses, bridges, etc.), lake shoreline features and estimated distances to these features. Areal extent is recorded as accurately as possible so it can be transcribed to GIS maps. Upon return to the office, the aerial photograph map is modified with the polygon that best represents the areal extent of the macrophytes present in each lake.
Algal Concentration: As mentioned previously, a sample was collected from the submerged horizontal sampler for chlorophyll “a”. Sample analyses were performed by WM&S/BFBM staff, in the Bureau’s certified laboratory, using a modified "EPA Method 445.0”.
Stormwater Outfall Pipes: The presence of stormwater outfall pipes was noted and their locations recorded using a Global Positioning System Unit (GPS unit). The diameters of the pipes were measured and the material of their composition was recorded.

12
CALCULATING CARLSON’S TROPHIC INDEX Trophic State As previously noted, Carlson’s Trophic State Index (TSI) is used for estimating the trophic state of New Jersey Lakes; “state” defined as a measure in a given point in time. Carlson’s TSI uses algal biomass as the basis for trophic state classification. Three variables, TP, Chlorophyll “a”, and Secchi depth independently estimate algal biomass. These three index variables are interrelated by linear regression models, and should produce the same index value for a given combination of variable values. Any of the three can, therefore, theoretically be used to classify a waterbody. [3] Each variable has its limitations, however, in estimating algal biomass to classify a trophic state. Chlorophyll “a” is the most accurate of the three but still has drawbacks as a biomass surrogate. The greatest drawback being that the amount of chlorophyll in an algal cell may vary considerably depending on the condition of the cell and species. Cells that are subject to low light conditions will have more chlorophyll in them than cells exposed to high light. [2] In turbid lakes, phosphorus may be attached to non-algal particles and not available for algal growth, thus making it a poor predictor of trophic state. [2] Similarly, Secchi depth measurements can be influenced by a number of abiotic sources such as turbidity, and is a poor predictor in these instances. Calculating the TSI [3] Data results for each TSI parameter are converted into common units using the following calculations: [4]
TP TSI (TSIP) = 14.42 ln (TP) + 4.15 Chlorophyll “a” TSI (TSIC) = 9.81 ln (Chl a) + 30.6 Secchi Disk TSI (TSIS) = 60-14.41 ln (SD)
These calculated values can then be placed in the proper TSI category below. Trophic state ranges from oligotrophic to hypereutrophic, and is viewed as a continuum (Figure 2), on this scale.
Oligotrophic. TSI values range from 0 to 40. Lakes have low nutrient levels, are usually deep, and have high oxygen levels in the bottom waters. These lakes have very few algal blooms.
Mesotrophic. TSI values range from 41-50. Lakes are in the "middle" of the trophic scale. They have increasing amounts of nutrients and slightly lower amounts of DO. There are temporary algae and aquatic plant problems.

13
Eutrophic. TSI values range from 51-70. Lakes are nutrient rich. They are usually shallow, "green" lakes that have limited oxygen levels in the bottom waters. They have persistent algae and aquatic plant problems.
Hypereutrophic. TSI range is >70. Lakes are very green and have little or no oxygen in the bottom layers. There are extreme algae and aquatic plant problems.
Each lake may have up to three fixed stations per sampling event (season) where parameters used for the TSI were collected. Because each TSI variable has its own strengths and limitations in estimating a lake’s trophic state, calculated TSI values at each in-lake station, and for each season, are individually reported (see Volume 2). Although TSI can be calculated for any of the parameters [3] measured, when comparing TSI values, priority should be given to Chlorophyll, as it is the most accurate in predicting algal biomass and, therefore, trophic state. [2] For the purpose of demonstrating an approximation of statewide trophic states, TSI values were averaged for each station, and each season. Secchi disk measurements were not used in the calculation of the “average” if the transparency was obscured by vegetation, or the lake was too shallow to give a representative measurement. Furthermore, TP was not used in the “average” if the concentration was below the analytical reporting limit. To summarize the percentage of lakes in which a particular trophic state was represented, the following convention was used: Since most lakes had periods of having eutrophic states, a lake was designated by its most unique state that was not eutrophic. For example, if a lake had one site that was oligotrophic during the sampling period and eutrophic the rest, it was designated oligotrophic for the purpose of statewide status. This same convention was used for mesotrophic and hyper-eutrophic sites. If more than two trophic states were observed in a lake, the least eutrohic state was used for the summary. This was done to show a lake’s recovery potential. If a
Figure 2. Carlson Trophic State Index viewed as a continuum.[1]

14
lake was eutrophic for all sites and seasons then it was designated eutrophic. The purpose of this convention was to capture those trophic states that may not have been represented in predominantly eutrophic lakes. See Figure 9 in the Trophic State Index Discussion for the statewide averages of trophic conditions. For a more detailed account of how the above trophic designations were derived for individual lakes, see Volume 2 of this report. Volume 2 contains raw data and TSI results for each parameter and each in-lake site. The following Results and Discussion section discusses how the interactions of each parameter can affect the trophic state of individual lakes. Non-TSI data such as hypolimnetic oxygen, other nutrients, and total plant biomass should be used to further assess a lake. Emphasis should be made that TSI is not the same as a water quality index, although existing terminology often equates eutrophic lakes with poor water quality. [3] The TSI should serve as a standard measurement against which comparisons can be made between the many biological and physical/chemical components of the lake system, and how these components relate to each other and the lake ecosystem as a whole.[3] The TSI, along with individual chemical results, lake morphological observations, and expected or designated lake use will allow for the proper management of New Jersey lakes. The Integrated Report should be referred to for assessments concerning support, or non-support, of aquatic life use.
15
RESULTS AND DISCUSSION It should be noted that a complete statewide assessment of New Jersey’s lakes cannot be performed until data for the entire network of 200 lakes is collected. Data and assessments from this 2nd Panel of lakes continue to serve as a preliminary estimate of the statewide status of New Jersey lakes. Statewide probabilistic estimates (i.e. using Ambient Lake Monitoring Network data to estimate conditions for all lakes in New Jersey meeting the design criteria) will be addressed in a separate report. In this Volume, a summary of the results from the 2006 (Panel 2) monitoring is presented. A full accounting of the results, by lake sampled, can be found in Volume 2 of this report. A discussion on the relationships between trophic state and the physical/ chemical and biological results follows: SUMMARY OF IN-LAKE PHYSICAL/ CHEMICAL AND BIOLOGICAL MEASURES The following is a discussion of the results and their relationship to the trophic state of a lake.
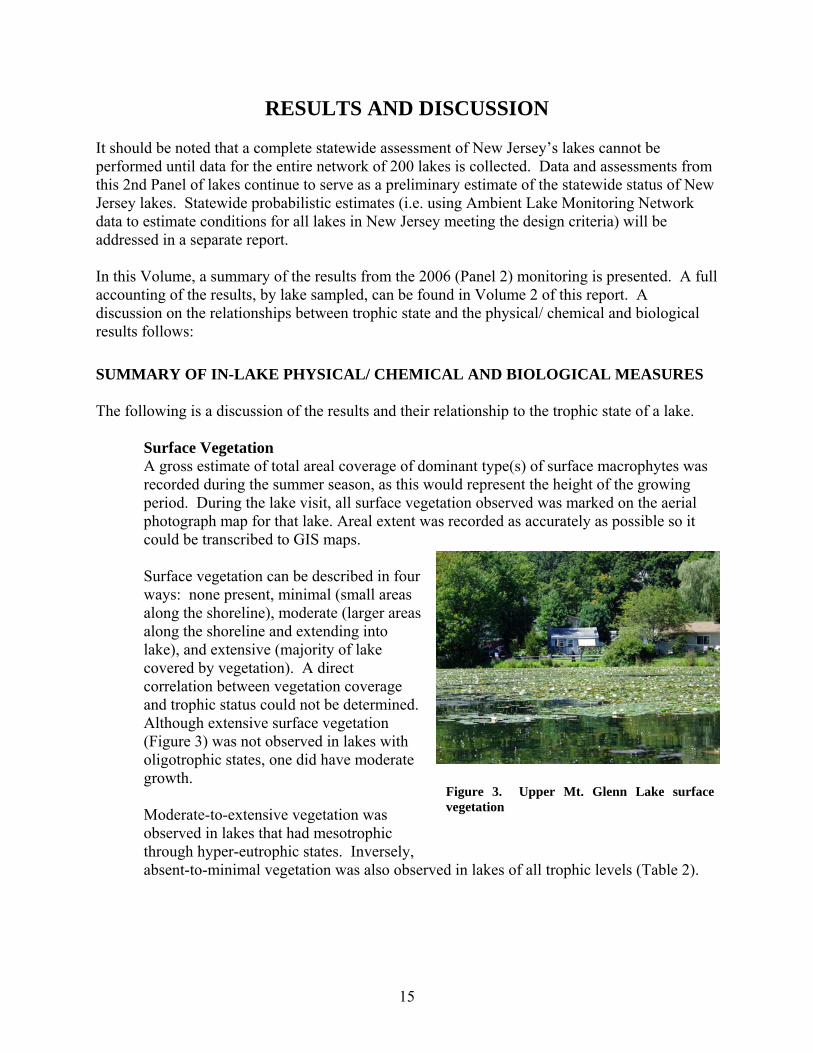
Surface Vegetation A gross estimate of total areal coverage of dominant type(s) of surface macrophytes was recorded during the summer season, as this would represent the height of the growing period. During the lake visit, all surface vegetation observed was marked on the aerial photograph map for that lake. Areal extent was recorded as accurately as possible so it could be transcribed to GIS maps. Surface vegetation can be described in four ways: none present, minimal (small areas along the shoreline), moderate (larger areas along the shoreline and extending into lake), and extensive (majority of lake covered by vegetation). A direct correlation between vegetation coverage and trophic status could not be determined. Although extensive surface vegetation (Figure 3) was not observed in lakes with oligotrophic states, one did have moderate growth. Moderate-to-extensive vegetation was observed in lakes that had mesotrophic through hyper-eutrophic states. Inversely, absent-to-minimal vegetation was also observed in lakes of all trophic levels (Table 2).
Figure 3. Upper Mt. Glenn Lake surface vegetation
16
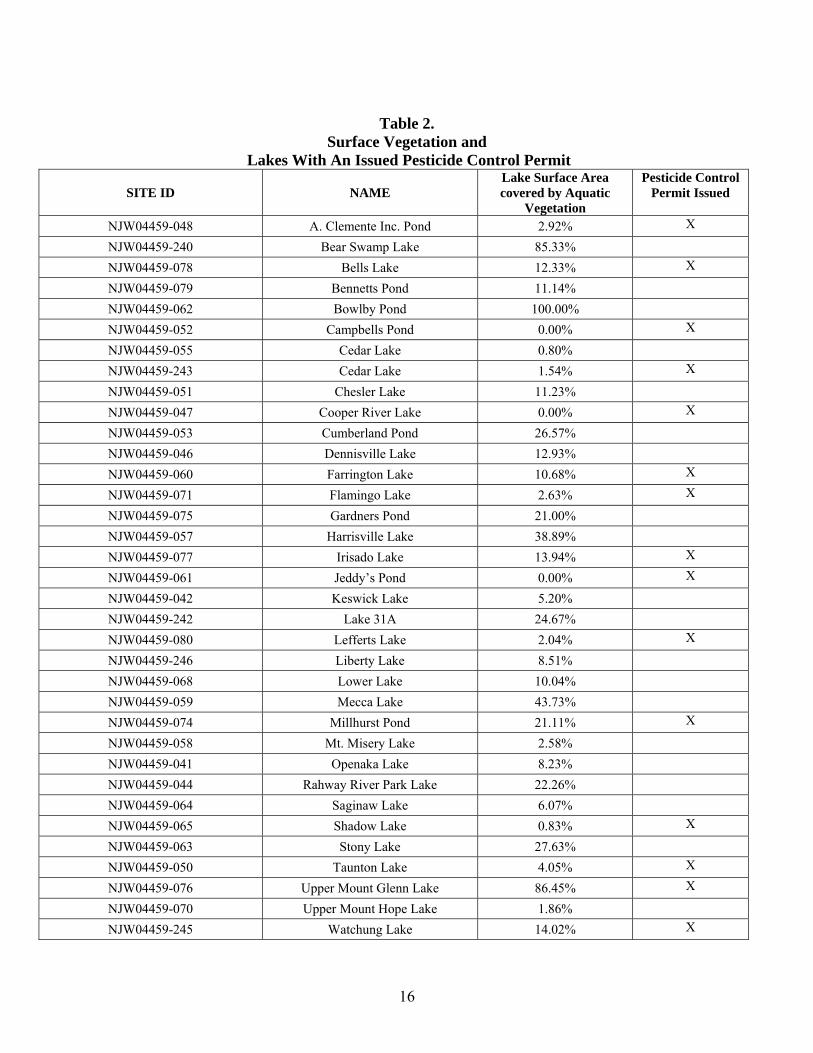
Table 2.
Surface Vegetation and Lakes With An Issued Pesticide Control Permit
SITE ID NAME Lake Surface Area covered by Aquatic
Vegetation
Pesticide Control Permit Issued
NJW04459-048 A. Clemente Inc. Pond 2.92% X
NJW04459-240 Bear Swamp Lake 85.33%
NJW04459-078 Bells Lake 12.33% X
NJW04459-079 Bennetts Pond 11.14%
NJW04459-062 Bowlby Pond 100.00%
NJW04459-052 Campbells Pond 0.00% X
NJW04459-055 Cedar Lake 0.80%
NJW04459-243 Cedar Lake 1.54% X
NJW04459-051 Chesler Lake 11.23%
NJW04459-047 Cooper River Lake 0.00% X
NJW04459-053 Cumberland Pond 26.57%
NJW04459-046 Dennisville Lake 12.93%
NJW04459-060 Farrington Lake 10.68% X
NJW04459-071 Flamingo Lake 2.63% X
NJW04459-075 Gardners Pond 21.00%
NJW04459-057 Harrisville Lake 38.89%
NJW04459-077 Irisado Lake 13.94% X
NJW04459-061 Jeddy’s Pond 0.00% X
NJW04459-042 Keswick Lake 5.20%
NJW04459-242 Lake 31A 24.67%
NJW04459-080 Lefferts Lake 2.04% X
NJW04459-246 Liberty Lake 8.51%
NJW04459-068 Lower Lake 10.04%
NJW04459-059 Mecca Lake 43.73%
NJW04459-074 Millhurst Pond 21.11% X
NJW04459-058 Mt. Misery Lake 2.58%
NJW04459-041 Openaka Lake 8.23%
NJW04459-044 Rahway River Park Lake 22.26%
NJW04459-064 Saginaw Lake 6.07%
NJW04459-065 Shadow Lake 0.83% X
NJW04459-063 Stony Lake 27.63%
NJW04459-050 Taunton Lake 4.05% X
NJW04459-076 Upper Mount Glenn Lake 86.45% X
NJW04459-070 Upper Mount Hope Lake 1.86%
NJW04459-245 Watchung Lake 14.02% X
17
Information is calculated from NJDEP Lakes GIS shapefile and summer aquatic vegetation observation shapefile. See Volume 2 for aerial photograph maps.
Compounding the difficulty of relating vegetation to trophic state is the treatment of some lakes to eliminate vegetation from the water. This is often done through the use of herbicides, but dredging and lake lowering are also common practices. At the time of sampling, it usually cannot be determined if plant life is absent due to natural conditions or treatment. However, a notice is required to be posted in a conspicuous location upon treatment. If such a notice was posted while sampling occurred it was recorded as part of the field observations (see Volume 2); no notices were observed at any Panel 2 lake at the time of sampling. Fifteen lakes sampled were permitted through the NJDEP Pesticide Control Program (Table 2). Vegetation observed at these lakes ranged from absent to 86.45% (see Table 2).
Chlorophyll ‘a’
Algal concentrations in the water column are measured through Chlorophyll ‘a’ analysis. Chlorophyll ‘a’ concentrations ≥ 4 µg/l are in the eutrophic range as assessed by Carlson’s TSI. Concentrations at Panel 2 sites ranged from 0.2 µg/l to 209.2 µg/l. with the higher concentrations occurring predominantly in the summer months. There is not a numeric SWQC for Chlorophyll ‘a’. However, it may be inferred that concentrations greater than 10 µg/l may be indicative of impacted water quality. As shown by Carlson’s TSI continuum (Figure 2) a Chlorophyll ‘a’ concentration of 10 µg/l approximately corresponds to a Total Phosphorus (TP) concentration of 0.05 mg/l, the lower threshold for the TP SWQC (see further discussion below).
Total Phosphorus (TP) Of the 40 lakes sampled in 2006, 18 lakes had at least one excursion above the total phosphorus criteria of 0.05 mg/L (Figure 4). TP results ranged from non-detected to 0.217 mg/l in the spring, 0.345 mg/l in the summer and 0.331 mg/l in the fall. It should be noted that the 0.331 mg/l fall concentration, measured at Cooper River Lake, was significantly higher than all others. Other concentrations measured in the fall were 0.186 mg/l (Rahway River Park Lake) and less. All samples collected at Rahway River Park Lake, Crystal Spring Lake, Cooper River Lake, and Lake 31A were above the TP criterion. See Volume 2 for results for each lake.

18
Phosphorus is essential to the growth of organisms and can be the nutrient that limits primary productivity in a body of water.[10] Of the nutrients analyzed, TP exhibited the best correlation to algal concentrations and trophic state. When TP levels were elevated, algal concentrations as measured by Chlorophyll “a” were also elevated. When these individual TSI parameters (TP and Chlorophyll “a”) are approximately equal, it can be inferred that TP limits the algal growth. If they are not equal, then light or other nutrients are likely the limiting factors. [12] In all instances for Panel 2, the TSI for TP and Chlorophyll “a” were approximately equal suggesting that TP was the limiting nutrient. Although the TSI is not a direct measure of water quality, some correlation can be made. TSI scores in the upper eutrophic through hyper-eutrophic states can be said to be impacted due to the likelihood of an excursion of TP from the SWQC. Other Nutrients The other analyzed nutrients were: Total Kjeldahl Nitrogen (TKN - also referred to as organic nitrogen), Total Nitrite + Nitrate Nitrogen, and Ammonia Nitrogen. Total Nitrogen (TN) is calculated using the sum of TKN and Total Nitrite + Nitrate Nitrogen concentrations. A trophic assessment, independent of Carlson’s TSI was developed by the USEPA as part of their National Lake Assessment for Total Nitrogen.[13] A threshold of greater than 0.75 mg/l for Total Nitrogen (TN) was established as being a eutrophic state. Greater than 50 % of lakes showed TN elevated above the 0.75 mg/l threshold indicating that TN may be significantly contributing to eutrophication.
Surface Water Quality Criteria Thresholds for Lakes
Total Phosphorus (TP) > 0.05 mg/L
Dissolved Oxygen (DO) < 4.0mg/l (There is also a daily average criterion of 5mg/l, which is not applicable to the sampling methods used for this monitoring network) pH 3.5 - 8.5 Standard Units (SU)* *6.5 – 8.5 SU for lakes within waters designated as FW2 waters in the Upper Delaware, Upper Raritan, Passaic, and Wallkill River Basins. *4.5 - 7.5 SU for lakes within FW2 waters in the Atlantic, Lower Delaware, and Lower Raritan River basins. *3.5 - 5.5 SU for lakes designated as PL waters.
Figure 4. SWQC Thresholds for Lakes.
19
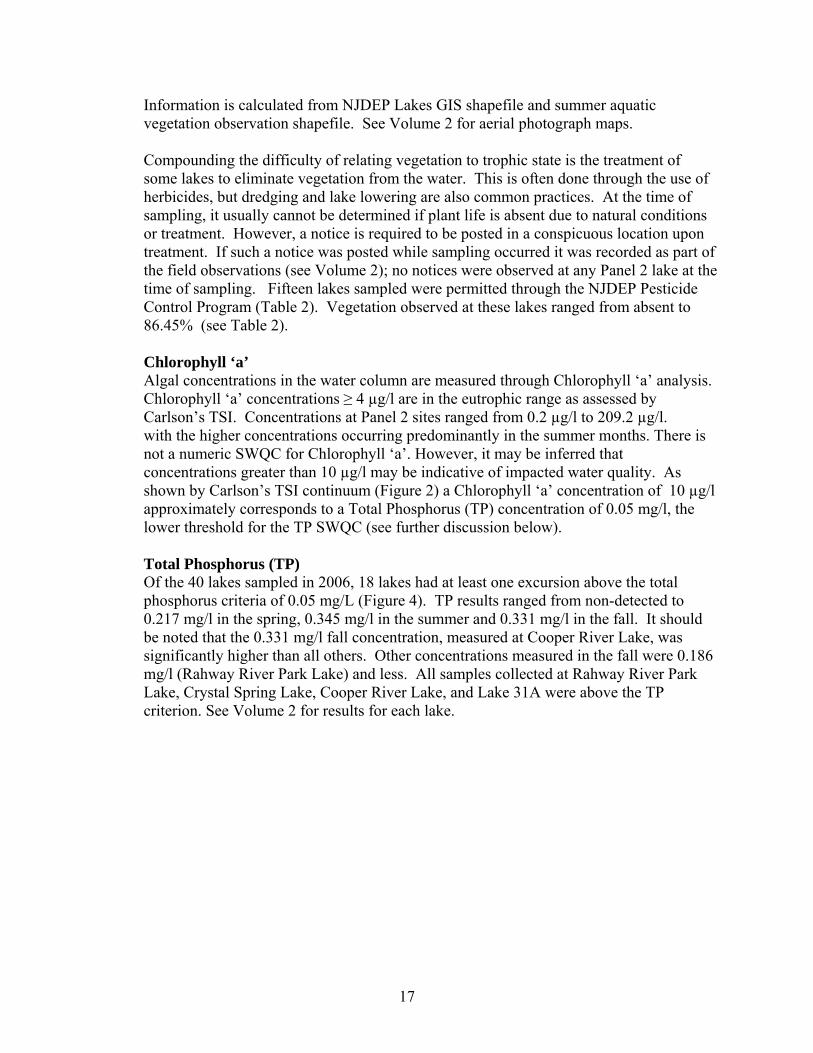
Physical / Chemical Measurements DO, temperature, pH, conductivity, and turbidity were measured in the field, while alkalinity and hardness samples were collected using a submerged horizontal sampler. DO, pH, and turbidity results showed a strong correlation with a lake’s trophic state. As expected, temperature showed a strong relationship with DO as low DO only occurred in the summer. Very low DO levels (below the SWQC, Figure 4) were observed in
lakes in the mesotrophic-through-hypereutrophic range during the summer months. The majority of lakes with very low DO were shallow (approximately 1 – 2 meters in depth). Shallow depths can limit the ability of a lake to maintain cooler temperatures, because of the penetration of sunlight. As a result, they tend to exhibit unstable DO concentrations. It could not be determined whether lake depth or other factors had the greater influence on low DO concentrations. Furthermore, waters with high algal levels will generally have fluctuating DO levels. DO rises when algae are in the growth state and respiring, and decreases when algal growth slows. This was demonstrated in five lakes where the DO was super-saturated (greater than 100% saturation) with corresponding high Chlorophyll “a” concentrations. (Figure 5) A diurnal study of lakes with very low DO would be necessary to definitively determine if water level, or algae, is primarily affecting the DO. A similar study would be necessary to record the fluctuating DO where super-saturation was observed.
Figure 5. Campbells Pond - Supersaturated DO and high Chl “a” concentrations.

20
Key Parameters, Panel 2
0
10
20
30
40
50
60
70
80
90
100
TP > 0.05mg/l
TN > 0.75mg/l
Chl a > 10µg/l
DO < 4mg/l
DO >100% sat
pH > HighRange
Turbidity >15 NTU
% o
f Lak
es
Elevated pH levels showed a strong correlation to algal concentrations. Lakes with higher pH measurements also had higher chlorophyll “a” concentrations. The production of the hydroxyl ion during photosynthesis is likely responsible for the increase in lake water pH when elevated levels of algal chlorophyll are present. Furthermore, lakes with the highest pH measurements also had supersaturated DO concentrations. Both the pH and DO concentrations measured are likely part of the diurnal cycle associated with algal growth. These relationships demonstrate how the trophic state and algal concentration can directly affect the chemical composition of a lake.
Turbidity also showed a strong correlation to a lake’s trophic state. Turbidity was always low when a lake was in an oligotrophic or mesotrophic state. Turbidity levels were high when a lake was in a eutrophic state and very high when in a hypereutrophic state (see discussion on “Potential Stressors” for exploration of this relationship). The value of 15 Nephelometric Turbidity Units (NTU) used in Figure 6 is the SWQC, thirty day average threshold, for streams. SWQC for turbidity in lakes has not been established and the 15 NTU value was chosen to demonstrate significant elevations observed in lakes.
Figure 6. Percentage of Panel 2 lakes showing key parameters with levels exceeding thresholds for at least one in-lake site during the sampling season. TP, DO mg/l, and pH are SWQC thresholds. pH high range is determined by Water Basin specific thresholds (see Figure 4).
21
Conductivity exceeded 1000 µS/cm at two lakes - Rahway River Park Lake which is hyper-eutrophic, and Campbells Pond which is eutrophic. Alkalinity and hardness results did not show levels outside of expected ranges or correlations with trophic state. Figure 6 shows a summary of key parameters. Individual results can be found in Volume 2 of this report. Hot Spots A “hot spot” is defined as a small area of the lake which has unusual characteristics as compared to the rest of the lake. These characteristics include dense algal growth and unusual odor or color that can indicate contamination which may be tracked to a source. A “hot spot” was observed and sampled at only one lake, Taunton Lake, during the 2006 sampling where dense algal growth was observed throughout the water column. This “hot spot” did indeed exceed the SWQC for TP and had a high turbidity level. Additional Physical / Chemical Monitoring
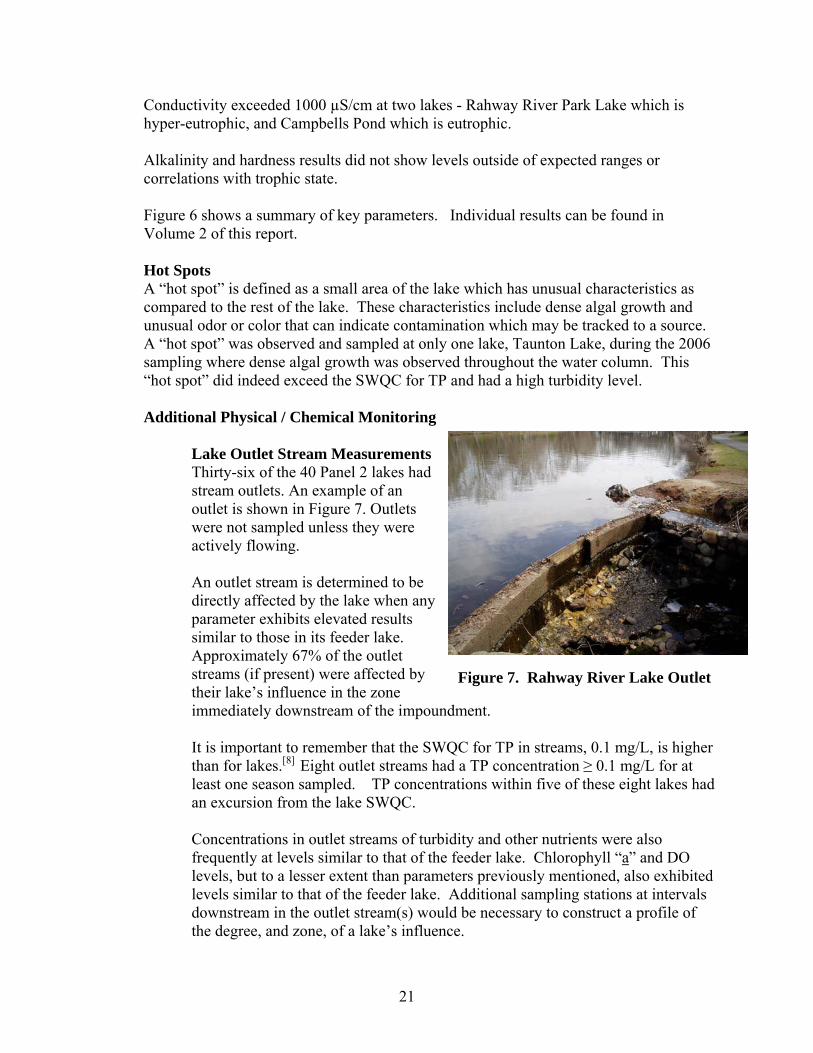
Lake Outlet Stream Measurements Thirty-six of the 40 Panel 2 lakes had stream outlets. An example of an outlet is shown in Figure 7. Outlets were not sampled unless they were actively flowing. An outlet stream is determined to be directly affected by the lake when any parameter exhibits elevated results similar to those in its feeder lake. Approximately 67% of the outlet streams (if present) were affected by their lake’s influence in the zone immediately downstream of the impoundment. It is important to remember that the SWQC for TP in streams, 0.1 mg/L, is higher than for lakes.[8] Eight outlet streams had a TP concentration ≥ 0.1 mg/L for at least one season sampled. TP concentrations within five of these eight lakes had an excursion from the lake SWQC. Concentrations in outlet streams of turbidity and other nutrients were also frequently at levels similar to that of the feeder lake. Chlorophyll “a” and DO levels, but to a lesser extent than parameters previously mentioned, also exhibited levels similar to that of the feeder lake. Additional sampling stations at intervals downstream in the outlet stream(s) would be necessary to construct a profile of the degree, and zone, of a lake’s influence.
Figure 7. Rahway River Lake Outlet

22
TROPHIC STATE INDEX (TSI) DISCUSSION Carlson’s Trophic State Index (TSI) is used as the basis for estimating the trophic state of New Jersey lakes. See Calculating Carlson’s Trophic State Index in the Methods and Materials section on how trophic states were designated. The trophic state for lake sampling sites range from oligotrophic to hypereutrophic, and is viewed as a continuum on this scale (Figure 2). Carlson’s TSI is based on the interrelationships of TP, chlorophyll “a”, and Secchi disk transparency.
Oligotrophic Lakes Lakes that were entirely oligotrophic were not represented in Panel 2, and the number of lakes exhibiting periods of oligotrophy was limited. Only 9 of the 40 Panel 2 lakes had stations which were in an oligotrophic state. Keswick Lake, Dennisville Lake, Greenwood Lake, Taunton Lake, Harrisville Lake, Mount Misery Lake, Stony Lake, Irisado Lake, and Lefferts Lake exhibited a TSI rating of oligotrophic for at least one station, mostly in the spring and/ or fall season. Lefferts Lake was the only lake which had an oligotrophic site in the summer. No lake remained in a constant oligotrophic state for all seasons sampled. This suggests that the trophic state is likely affected by seasonal variation. Three of the lakes which had an oligotrophic site are of particular note, Lefferts Lake, Mt. Misery Lake, and Harrisville Lake (Figure 8). These lakes were a combination of oligotrophic and mesotrophic (see below) for all seasons sampled. The other six lakes which had oligotrophic sites also had a site with a eutrophic TSI. Mesotrophic Lakes Lakes having periods of mesotrophic status, which are by definition in transition to a eutrophic state, were more prevalent than oligotrophic states. Twenty lakes had stations in a mesotrophic state, but only two of these, Chesler Lake and Gardeners Pond, maintained a mesotrophic state throughout all seasons.
Figure 8. Harrisville Lake - One of nine lakes with oligotrophic sites.

23
Eutrophic and Hyper-eutrophic Lakes Eleven Panel 2 lakes exhibited TSI ratings exclusively in the eutrophic range (Eutrophic, or Hypereutrophic) for all seasons sampled. All Panel 2 lakes exhibited degrees of eutrophication depending on the season and / or area of the lake sampled. Accordingly, this data demonstrates that all Panel 2 lakes are in, or accelerating towards, an entirely eutrophic state. Figure 9 shows a summary of the percentage of lakes exhibiting a particular trophic state at least one time during the sampling run. Panel 1 and Panel 2 TSI Comparison A review of the Panel 2 lakes monitoring data reveals an increase in lakes with sampling sites exhibiting either an oligotrophic or mesotrophic TSI when compared to the Panel 1 lake monitoring results (Figure 10). Panel 2 lakes had less sampling sites exhibiting either a eutrophic or a hyper-eutrophic TSI than did the Panel 1 lakes. Due to a delay in certification of the analytical lab used for the chemical analysis, only the summer and fall samplings could be completed for Panel 1. As shown in Panel 2 results, oligotrophic and mesotrophic TSI results are more likely to occur in the spring and fall. The lower percentages of oligotrophic and mesotrophic lakes in Panel 1 are likely because spring samples were not represented.
Figure 9. Panel 2 Summary of TSI Results.
0.00%10.00%20.00%30.00%40.00%50.00%
Oligotr
ophic
Mesotr
ophic
Eutrop
hic
Hyper-
eutro
phic
Trophic State Comparison Panel 1 & Panel 2
Panel 1Panel 2Combined
Figure 10. Comparison of Panel 1 & Panel 2 Lakes
Trophic Status of Panel 2 Lakes
50.0%
15.0%
12.5% 22.5%
Oligotrophic(Lakes with ≥ 1Oligotrophic sites)
Mesotrophic(Lakes with ≥ 1Mesotrophic site and no Oligotrophic sites)
Eutrophic(Lakes with only Eutrophic sites)
Hyper-eutrophic(Lakes with ≥ 1Hyper-eutrophic and no Oligotrophic orMesotrophic sites)

24
Seasonal Variation in TSI As the results demonstrate (see Volume 2), the trophic state of a lake is highly related to the season. Eutrophic and hyper-eutrophic TSI results were most common in the summer, while oligotrophic and mesotrophic TSI results occurred mostly in the spring or fall (Figure 11). This phenomenon can likely be attributed to the seasonal concentrations of TP. In the spring and fall, at sites that had a TSI of oligotrophic or mesotrophic, TP concentrations were often below the analytical reporting limit of 0.01 mg/l. In the summer, the TP concentrations rose, at many of these same sites, which corresponded with more eutrophic TSI results (see Volume 2 for results by season). Atmospheric precipitation and land runoff are potential sources of phosphorus that can be affected by season. Atmospheric precipitation originates from fine particles of soil and rock, from living and dead organisms (primarily as volatile compounds released from plants) and from natural fires and the burning of fossil fuels. [15] Atmospheric phosphorus is generally low in unpopulated areas and increases considerably in urban-industrial areas. [15] Furthermore, in agricultural regions with heavy applications of phosphorus-containing fertilizers, the phosphorus content of precipitation is much higher during the active growing (summer) season. [15] Surface drainage is often a major contributor of phosphorus in lakes. The quantities of phosphorus entering surface drainage vary with the amount of phosphorus in soils, topography, vegetative cover, quantity and duration of runoff flow, landuse, and pollution. [15] All of these factors can be influenced by season. For example, nutrients can accumulate in snowpacks and ice in winter and release rapidly and in large amounts in the spring. [15] Another source is from the release of sediment-bound phosphorus due to changes in sediment-water interface. Exchanges of phosphorus across the sediment-water interface are regulated by oxidation-reduction interactions dependent on oxygen supply, metabolic activities of bacteria, and turbulence from physical activities. [10] All of these interactions are variable by season.
0.00%
5.00%
10.00%
15.00%
20.00%
25.00%
Perc
enta
ge o
f Si
tes
Oligotr
ophic
Mesotr
ophic
Eutrop
hic
Hyper-
Eutrop
hic
Trophic State
Panel 2 Seasonal Variation In Trophic State
spring
summer
fall
Figure 11. Trophic State by Season

25
POTENTIAL STRESSORS
Stormwater Outfalls Stormwater outfall pipes were observed at some lakes. An example of an outfall pipe is shown in Figure 12. These pipes were made of cement, corrugated metal, PVC, or vitrified clay. Twelve Panel 2 lakes had stormwater outfalls entering the lake. Previously, Panel 1 lakes showed a strong relationship between trophic status and the presence of these outfalls. In Panel 1, no lake with an oligotrophic status had outfalls and all but two lakes with outfalls exceeded the SWQC for TP. In addition to TP, turbidity was also at high levels in most of Panel 1 lakes with outfall pipes. It was concluded that these stormwater pipes likely served as a conduit for the increased levels observed. Panel 2 lakes did not show as strong of a relationship between trophic state and the presence of outfall pipes as only four lakes from this subset were eutrophic for all seasons sampled. However, there was a strong relationship observed between TP, turbidity, and the presence of outfall pipes. Fifty percent (50%) of lakes with outfalls exceeded the SWQC for TP, and twenty-five percent (25%) had high turbidity, for at least one season. Stormwater monitoring studies on these lakes would be helpful to determine the loading of nutrients, and other pollutants, from these outfalls.
Lakeshore Habitat
The National Lake Assessment (NLA) conducted by the EPA shows that of the physical indicators measured in the study, degraded lakeshore habitat is the most significant stressor to poor biological integrity. The NLA results also show that lakes in poor condition for habitat are 3 times more likely to be in poor biological condition. Another physical habitat indicator examined was the presence of human activities. From the standpoint of human disturbances along lakeshores, just one-third (35%) of the country’s lakes are in good condition. [13]
Figure 12. Stormwater outfalls like this one, draining into Farrington Lake, can contribute to numerous problems such as excursions from the SWQC for TP.

26
RECOMMENDATIONS Stormwater outfalls seem to be a major stressor for lakes. Twelve lakes in Panel 2 had stormwater outfall pipes entering the lake. As stated above, TP and turbidity were at significant concentrations in lakes with outfalls. It is likely that these stormwater pipes serve as a conduit for the increased levels observed. Stormwater monitoring studies on these lakes would be helpful to determine the loading of nutrients, and other pollutants, from these outfalls. Such a study should include analysis in mixing zones of the outfalls. As demonstrated in EPA’s National Lake Assessment, lakeshore habitat is the most significant stressor to poor biological activity. More detailed lakeshore habitat observations should be recorded to assess degradation of habitat. DO rises when algae are in the growth state and respiring, and declines when algal growth slows. This was demonstrated in five lakes where the DO was supersaturated (greater than 100% saturation) with corresponding high Chlorophyll “a” concentrations. A diurnal study of lakes exhibiting either very low or supersaturated DO is necessary to definitively determine if water level or algae is primarily affecting the DO concentrations measured. Approximately 65% of the lake outlet streams (if present and flowing) were affected by their lake’s influence in the zone immediately downstream of the impoundment. In the majority of streams where TP or other nutrient concentrations were elevated, those same parameters were also elevated in the feeder lake. Turbidity, Chlorophyll “a”, and DO were also parameters which had similar concentrations to that of the feeder lake. Additional sampling stations at intervals downstream in the outlet stream(s) would be necessary to construct a profile of the degree, and zone, of a lake’s influence. Once the USEPA biological monitoring methods are available, the addition of lentic biological indices should be considered. In-stream, lotic, biological monitoring, for both macroinvertebrates and fish, would also be recommended at intervals downstream to determine the lake’s effect on the in-stream biota. Data for the initial Panel of the Ambient Lakes Monitoring Network serves as a preliminary estimate of the statewide water quality status of New Jersey lakes. Statewide probabilistic estimates (i.e. using Ambient Lake Monitoring Network data to estimate conditions for all lakes in New Jersey meeting the design criteria) will be addressed in a separate report. Pending the availability of sufficient resources, it is recommended that site specific lentic studies be performed on individual lakes to supplement the data collected for statewide status in the Ambient Lakes Monitoring Network.

27
Additional Information Additional information on the Ambient Lakes Monitoring Program can be obtained from WM&S’ Bureau of Freshwater & Biological Monitoring by calling 609-292-0427 or visiting its website at: www.state.nj.us/dep/wms/bfbm. Raw data is posted on this website by the end of the calendar year that the data is received and validated. Additionally, raw data is submitted to WQX as soon as the data is received and validated. WQX is USEPA's repository and framework for water quality, biological, and physical data. It is used by state environmental agencies, EPA and other federal agencies, universities, private citizens, and many others to store data. The retrieval of the data is handled through the STORET interface and can be accessed at: www.epa.gov/storet. Comments are welcome and may be emailed to: [email protected]

28
REFERENCES 1. Beltrami soil and water conservation district, Bemidji, Minnesota, 2006. 2. Carlson, Robert E. and J. Simpson. A coordinator’s guide to volunteer lake monitoring
methods. North American lake management society. 1996. 3. Carlson, Robert E. A trophic state index for lakes. Limnology and Oceanography.
V. 22 (2). March 1977. 4. MINNESOTA LAKE WATER QUALITY ASSESSMENT DATA: 2004
An update to data presented in the Minnesota Lake Water Quality Assessment Report: 1990, Environmental Outcomes Division, Environmental Standards and Analysis Section March 2004
5. NJDEP. Field sampling procedures manual. NJDEP. Trenton, NJ. 2005. 6. NJDEP. Draft New Jersey 2010 Integrated Water Quality Monitoring and Assessment
Report. 2010. 7. NJDEP. New Jersey 2010 Integrated Water Quality Monitoring and Assessment Methods
September 2010. 8. NJDEP. Surface water quality standards. N.JA.C. 7:9B. October 2009. 9. Omernick, J. M. 1987a. Ecoregions of the conterminous United States. Ann. Assoc. Am.
Geograph. 77(1):118-125 10. Standards methods for the examination of wastewater. 20th edition. American public
health association. 1998. 11. USEPA. Elements of a state water monitoring and assessment program. March 2003. 12. USEPA. Lake and reservoir bioassessment and biocriteria technical guidance document.
August 1998. 13. USEPA. National Lakes Assessment, a collaborative survey of the Nation’s lakes. April
2010. 14. USEPA. Office of inspector general audit report. New Jersey’s water quality monitoring
program. July 1999. 15. Wetzel, Robert G. Limnology, lake and river ecosystems. 3rd edition. Academic Press.
2001.

NJ Department of Environmental Protection
Water Monitoring and Standards
AMBIENT LAKES MONITORING NETWORK
Panel 2
Volume 2 of 2 Data and Results
Echo Lake, West Milford, Passaic County
December 2011
State of New Jersey NJ Department of Environmental Protection Chris Christie, Governor Bob Martin, Commissioner Kim Guadagno, Lt. Governor

NJ Department of Environmental Protection
Water Monitoring and Standards
Jill Lipoti, Director
Bureau of Freshwater & Biological Monitoring Leslie J. McGeorge, Administrator
December 2011
AMBIENT LAKES MONITORING NETWORK Panel 2
Volume 2 of 2
AUTHOR Victor Poretti
PROJECT OFFICER
Johannus Franken
DATA MANAGEMENT Thomas Miller Brian Taylor
GIS AND MAPS
Leigh Lager Johannus Franken
FIELD COLLECTION STAFF
Johannus Franken Thomas Miller Victor Poretti Brian Taylor
This Volume contains Panel 2 lakes raw data, observations, and trophic state assessments as described below. See Volume 1 of this report for detailed methods and discussion of results.
Carlson Trophic State Index (TSI )
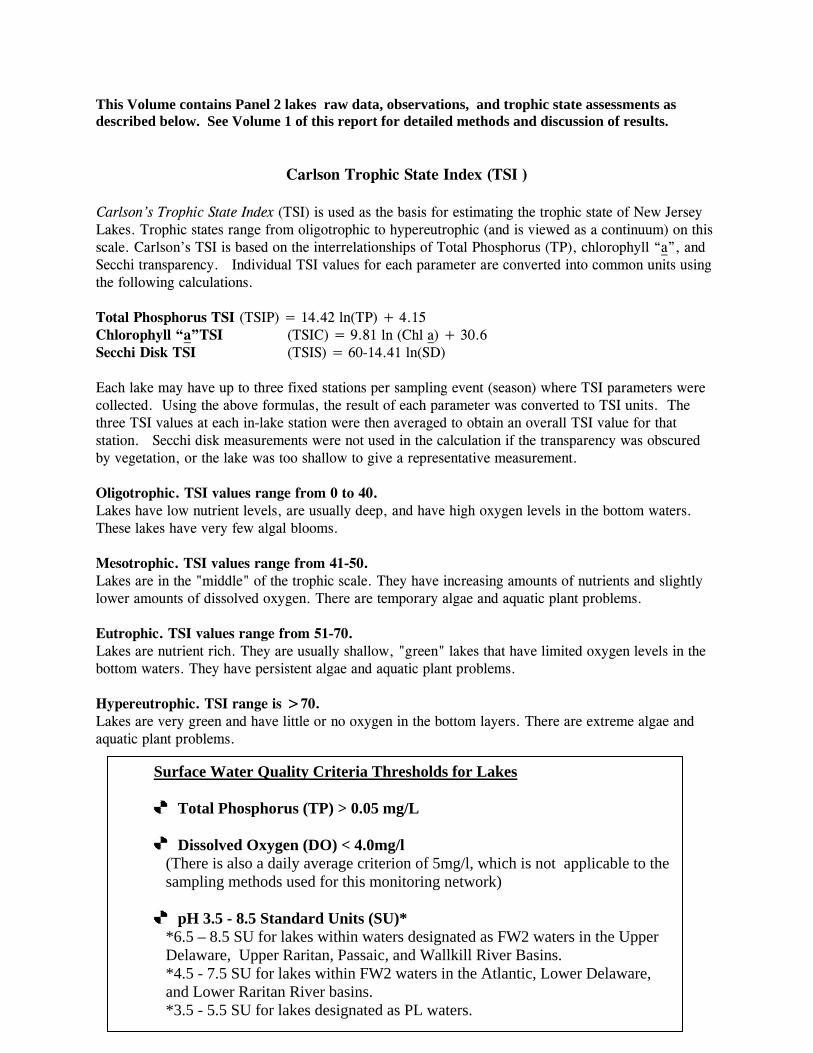
Carlson’s Trophic State Index (TSI) is used as the basis for estimating the trophic state of New Jersey Lakes. Trophic states range from oligotrophic to hypereutrophic (and is viewed as a continuum) on this scale. Carlson’s TSI is based on the interrelationships of Total Phosphorus (TP), chlorophyll “a”, and Secchi transparency. Individual TSI values for each parameter are converted into common units using the following calculations.
Total Phosphorus TSI (TSIP) = 14.42 ln(TP) + 4.15 Chlorophyll “a”TSI (TSIC) = 9.81 ln (Chl a) + 30.6 Secchi Disk TSI (TSIS) = 60-14.41 ln(SD) Each lake may have up to three fixed stations per sampling event (season) where TSI parameters were collected. Using the above formulas, the result of each parameter was converted to TSI units. The three TSI values at each in-lake station were then averaged to obtain an overall TSI value for that station. Secchi disk measurements were not used in the calculation if the transparency was obscured by vegetation, or the lake was too shallow to give a representative measurement. Oligotrophic. TSI values range from 0 to 40. Lakes have low nutrient levels, are usually deep, and have high oxygen levels in the bottom waters. These lakes have very few algal blooms. Mesotrophic. TSI values range from 41-50. Lakes are in the "middle" of the trophic scale. They have increasing amounts of nutrients and slightly lower amounts of dissolved oxygen. There are temporary algae and aquatic plant problems. Eutrophic. TSI values range from 51-70. Lakes are nutrient rich. They are usually shallow, "green" lakes that have limited oxygen levels in the bottom waters. They have persistent algae and aquatic plant problems. Hypereutrophic. TSI range is >70. Lakes are very green and have little or no oxygen in the bottom layers. There are extreme algae and aquatic plant problems.
Surface Water Quality Criteria Thresholds for Lakes
Total Phosphorus (TP) > 0.05 mg/L
Dissolved Oxygen (DO) < 4.0mg/l (There is also a daily average criterion of 5mg/l, which is not applicable to the sampling methods used for this monitoring network) pH 3.5 - 8.5 Standard Units (SU)* *6.5 – 8.5 SU for lakes within waters designated as FW2 waters in the Upper Delaware, Upper Raritan, Passaic, and Wallkill River Basins. *4.5 - 7.5 SU for lakes within FW2 waters in the Atlantic, Lower Delaware, and Lower Raritan River basins. *3.5 - 5.5 SU for lakes designated as PL waters.

AMBIENT LAKE MONITORING NETWORKLake Name A. Clemente Inc. Pond County SalemSite ID NJW04459-048 Municipality Carneys Point Twp.
INSERT LAKE MAP W/ AREAL EXTENT
Carlson's Trophic Index (TSI)
Season TSIP TSIC TSIS TSISpring Station 1 37.35 44.2 43.24 41.60
MesotrophicSpring Station 2 ND 48.5 B 48.50
MesotrophicSummerStation 1 38.73 50.37 48.64 45.91
MesotrophicSummerStation 2 59.67 71.07 57.37 62.70
EutrophicFallStation 1 41.14 43.95 51.53 45.54
MesotrophicFallStation 2 44.13 47.32 B 45.73
Mesotrophic
ND - TP concentration below detection limitB - Secchi visible to Lake bottom. (See Datasheet for total depth)
Observations
Spring-SAV, turtles
Summer-no outlet, wetlands, kayakers, swimming, fishing
AMBIENT LAKE MONITORING NETWORK
NJW04459-048
A. Clemente Inc. PondLake Name: SiteID: CARNEYS POINT TWPMunicipality:
County: SALEM
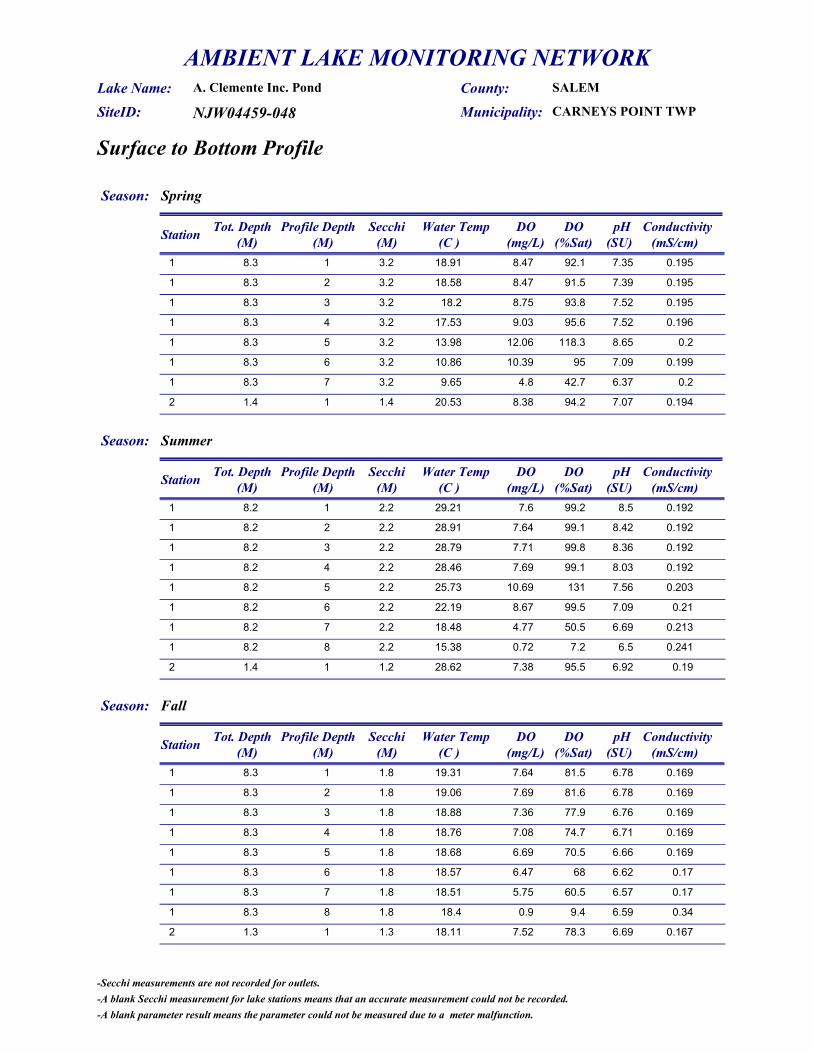
Surface to Bottom Profile
Season: Spring
Station Profile Depth Water Temp DO pH Conductivity(M) (C ) (SU) (mS/cm)(mg/L)
Tot. Depth(M)
Secchi(M)
DO(%Sat)
1 18.91 8.47 7.35 0.1958.3 3.2 92.11
1 18.58 8.47 7.39 0.1958.3 3.2 91.52
1 18.2 8.75 7.52 0.1958.3 3.2 93.83
1 17.53 9.03 7.52 0.1968.3 3.2 95.64
1 13.98 12.06 8.65 0.28.3 3.2 118.35
1 10.86 10.39 7.09 0.1998.3 3.2 956
1 9.65 4.8 6.37 0.28.3 3.2 42.77
2 20.53 8.38 7.07 0.1941.4 1.4 94.21
Season: Summer
Station Profile Depth Water Temp DO pH Conductivity(M) (C ) (SU) (mS/cm)(mg/L)
Tot. Depth(M)
Secchi(M)
DO(%Sat)
1 29.21 7.6 8.5 0.1928.2 2.2 99.21
1 28.91 7.64 8.42 0.1928.2 2.2 99.12
1 28.79 7.71 8.36 0.1928.2 2.2 99.83
1 28.46 7.69 8.03 0.1928.2 2.2 99.14
1 25.73 10.69 7.56 0.2038.2 2.2 1315
1 22.19 8.67 7.09 0.218.2 2.2 99.56
1 18.48 4.77 6.69 0.2138.2 2.2 50.57
1 15.38 0.72 6.5 0.2418.2 2.2 7.28
2 28.62 7.38 6.92 0.191.4 1.2 95.51
Season: Fall
Station Profile Depth Water Temp DO pH Conductivity(M) (C ) (SU) (mS/cm)(mg/L)
Tot. Depth(M)
Secchi(M)
DO(%Sat)
1 19.31 7.64 6.78 0.1698.3 1.8 81.51
1 19.06 7.69 6.78 0.1698.3 1.8 81.62
1 18.88 7.36 6.76 0.1698.3 1.8 77.93
1 18.76 7.08 6.71 0.1698.3 1.8 74.74
1 18.68 6.69 6.66 0.1698.3 1.8 70.55
1 18.57 6.47 6.62 0.178.3 1.8 686
1 18.51 5.75 6.57 0.178.3 1.8 60.57
1 18.4 0.9 6.59 0.348.3 1.8 9.48
2 18.11 7.52 6.69 0.1671.3 1.3 78.31
-Secchi measurements are not recorded for outlets.-A blank Secchi measurement for lake stations means that an accurate measurement could not be recorded.-A blank parameter result means the parameter could not be measured due to a meter malfunction.
AMBIENT LAKE MONITORING NETWORK
NJW04459-048
A. Clemente Inc. PondLake Name: SiteID: CARNEYS POINT TWPMunicipality:
County: SALEM
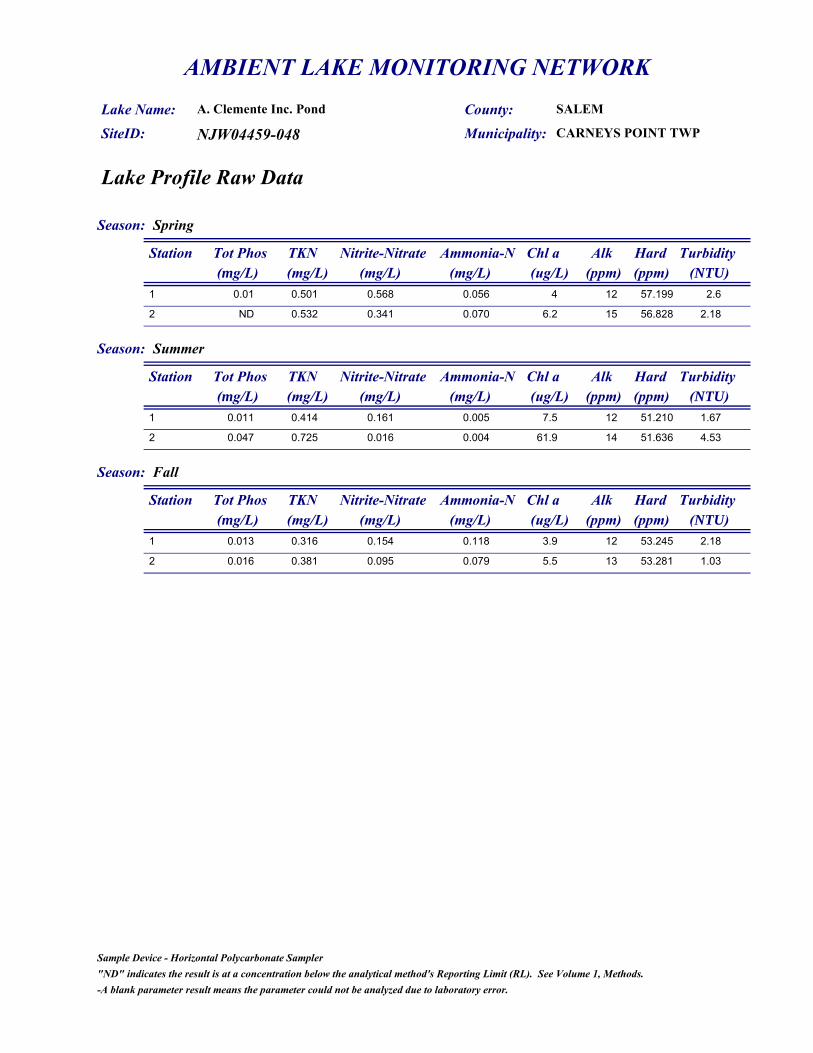
Lake Profile Raw Data
Season: Spring
Station Tot Phos TKN Nitrite-Nitrate Ammonia-N Chl a(mg/L) (mg/L) (mg/L) (ug/L)(mg/L)
Alk(ppm)
Hard(ppm)
Turbidity(NTU)
1 0.01 0.501 0.568 0.056 4 12 57.199 2.6
2 ND 0.532 0.341 0.070 6.2 15 56.828 2.18
Season: Summer
Station Tot Phos TKN Nitrite-Nitrate Ammonia-N Chl a(mg/L) (mg/L) (mg/L) (ug/L)(mg/L)
Alk(ppm)
Hard(ppm)
Turbidity(NTU)
1 0.011 0.414 0.161 0.005 7.5 12 51.210 1.67
2 0.047 0.725 0.016 0.004 61.9 14 51.636 4.53
Season: Fall
Station Tot Phos TKN Nitrite-Nitrate Ammonia-N Chl a(mg/L) (mg/L) (mg/L) (ug/L)(mg/L)
Alk(ppm)
Hard(ppm)
Turbidity(NTU)
1 0.013 0.316 0.154 0.118 3.9 12 53.245 2.18
2 0.016 0.381 0.095 0.079 5.5 13 53.281 1.03
"ND" indicates the result is at a concentration below the analytical method's Reporting Limit (RL). See Volume 1, Methods.Sample Device - Horizontal Polycarbonate Sampler
-A blank parameter result means the parameter could not be analyzed due to laboratory error.
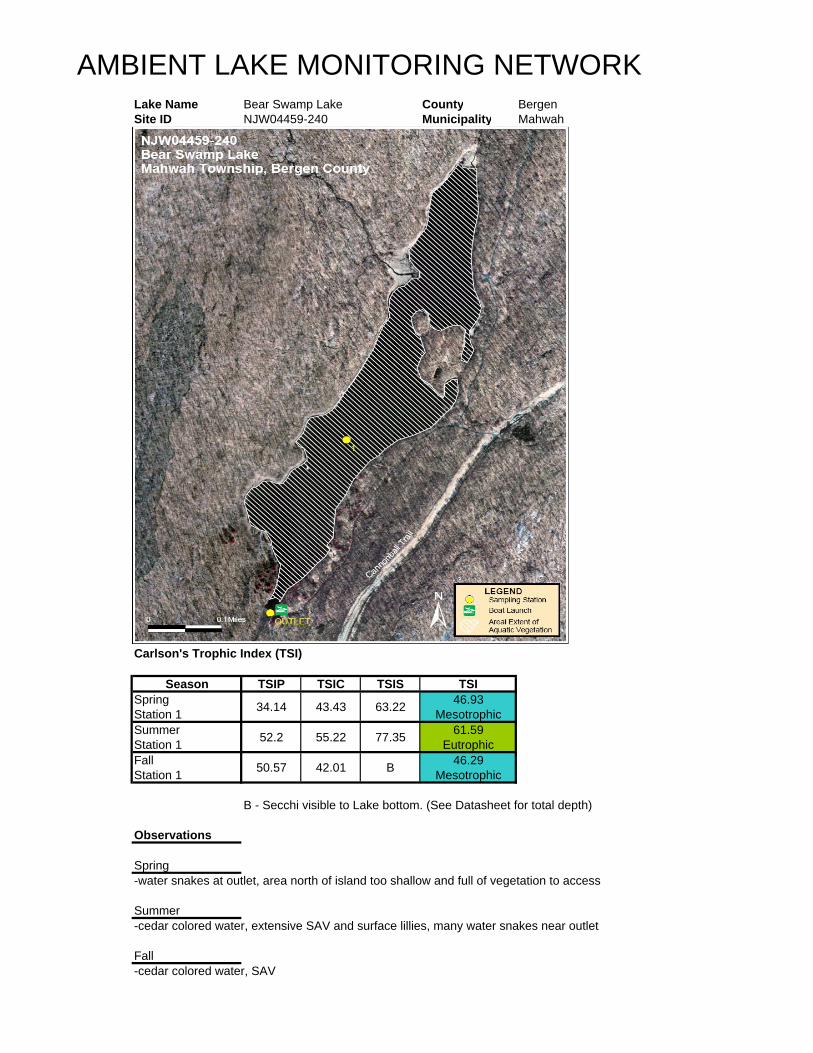
AMBIENT LAKE MONITORING NETWORKLake Name Bear Swamp Lake County BergenSite ID NJW04459-240 Municipality Mahwah
INSERT LAKE MAP W/ AREAL EXTENT
Carlson's Trophic Index (TSI)
Season TSIP TSIC TSIS TSISpringStation 1 34.14 43.43 63.22 46.93
MesotrophicSummerStation 1 52.2 55.22 77.35 61.59
EutrophicFallStation 1 50.57 42.01 B 46.29
Mesotrophic
B - Secchi visible to Lake bottom. (See Datasheet for total depth)
Observations
Spring-water snakes at outlet, area north of island too shallow and full of vegetation to access
Summer-cedar colored water, extensive SAV and surface lillies, many water snakes near outlet
Fall-cedar colored water, SAV
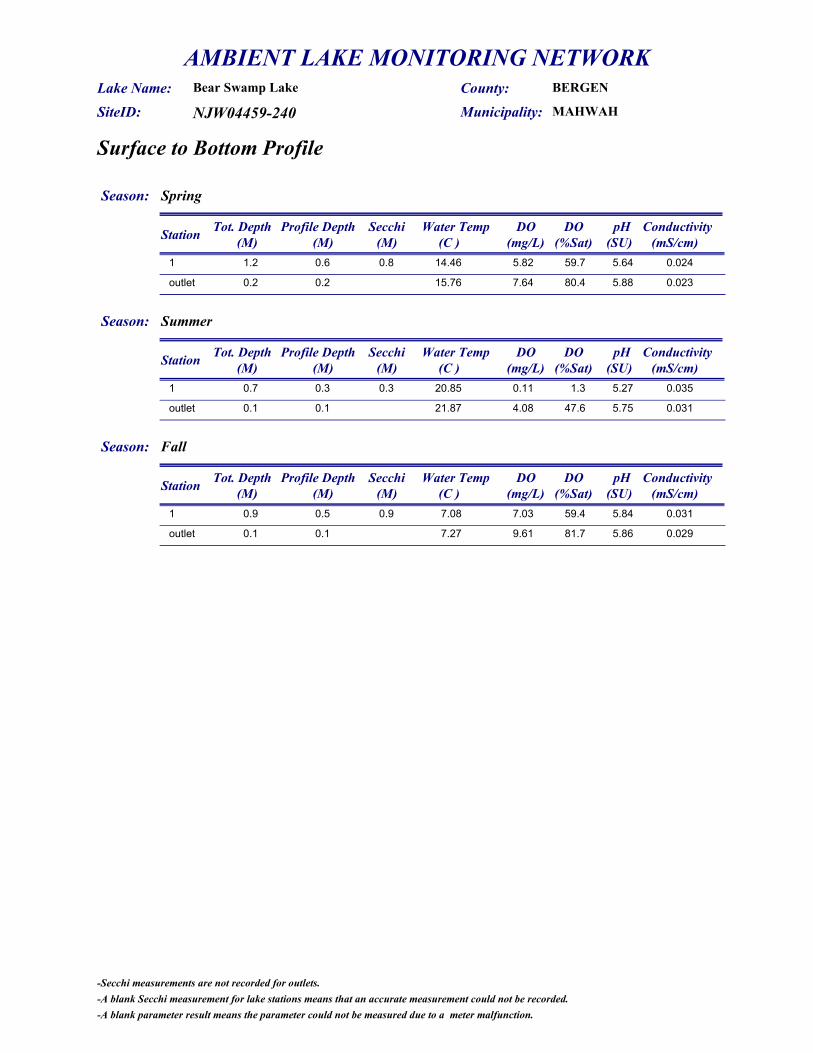
AMBIENT LAKE MONITORING NETWORK
NJW04459-240
Bear Swamp LakeLake Name: SiteID: MAHWAHMunicipality:
County: BERGEN
Surface to Bottom Profile
Season: Spring
Station Profile Depth Water Temp DO pH Conductivity(M) (C ) (SU) (mS/cm)(mg/L)
Tot. Depth(M)
Secchi(M)
DO(%Sat)
1 14.46 5.82 5.64 0.0241.2 0.8 59.70.6
outlet 15.76 7.64 5.88 0.0230.2 80.40.2
Season: Summer
Station Profile Depth Water Temp DO pH Conductivity(M) (C ) (SU) (mS/cm)(mg/L)
Tot. Depth(M)
Secchi(M)
DO(%Sat)
1 20.85 0.11 5.27 0.0350.7 0.3 1.30.3
outlet 21.87 4.08 5.75 0.0310.1 47.60.1
Season: Fall
Station Profile Depth Water Temp DO pH Conductivity(M) (C ) (SU) (mS/cm)(mg/L)
Tot. Depth(M)
Secchi(M)
DO(%Sat)
1 7.08 7.03 5.84 0.0310.9 0.9 59.40.5
outlet 7.27 9.61 5.86 0.0290.1 81.70.1
-Secchi measurements are not recorded for outlets.-A blank Secchi measurement for lake stations means that an accurate measurement could not be recorded.-A blank parameter result means the parameter could not be measured due to a meter malfunction.

AMBIENT LAKE MONITORING NETWORK
NJW04459-240
Bear Swamp LakeLake Name: SiteID: MAHWAHMunicipality:
County: BERGEN
Lake Profile Raw Data
Season: Spring
Station Tot Phos TKN Nitrite-Nitrate Ammonia-N Chl a(mg/L) (mg/L) (mg/L) (ug/L)(mg/L)
Alk(ppm)
Hard(ppm)
Turbidity(NTU)
1 0.008 0.470 0.006 0.018 3.7 5 10.461 1.27
outlet ND 0.446 0.020 0.017 2.5 5 9.638 1.44
Season: Summer
Station Tot Phos TKN Nitrite-Nitrate Ammonia-N Chl a(mg/L) (mg/L) (mg/L) (ug/L)(mg/L)
Alk(ppm)
Hard(ppm)
Turbidity(NTU)
1 0.028 0.707 0.010 0.022 12.3 11 16.755 1.61
outlet 0.024 0.602 0.015 0.065 7.9 10 13.425 1.73
Season: Fall
Station Tot Phos TKN Nitrite-Nitrate Ammonia-N Chl a(mg/L) (mg/L) (mg/L) (ug/L)(mg/L)
Alk(ppm)
Hard(ppm)
Turbidity(NTU)
1 0.025 0.322 0.002 0.014 3.2 8.200 13.629 0.83
outlet 0.017 0.275 0.002 0.015 2.3 14.300 12.277 0.6
"ND" indicates the result is at a concentration below the analytical method's Reporting Limit (RL). See Volume 1, Methods.Sample Device - Horizontal Polycarbonate Sampler
-A blank parameter result means the parameter could not be analyzed due to laboratory error.

AMBIENT LAKE MONITORING NETWORKLake Name Bells Lake County GloucesterSite ID NJW04459-078 Municipality Washington Twp.
INSERT LAKE MAP W/ AREAL EXTENT
Carlson's Trophic Index (TSI)
Season TSIP TSIC TSIS TSISpringStation 1 48.72 57.36 B 53.04
EutrophicSpringStation 2 39.98 59.12 54.16 51.09
EutrophicSummerStation 1 57.34 47.32 57.37 54.01
EutrophicSummerStation 2 53.2 54.73 58.63 55.52
EutrophicFallStation 1 58.72 66.91 61.52 62.38
EutrophicFallStation 2 54.57 65.59 60 60.05
Eutrophic
B - Secchi visible to Lake bottom. (See Datasheet for total depth)
Observations
Fall-SAV throughout station 1, filamentous algae, bladderwort

AMBIENT LAKE MONITORING NETWORK
NJW04459-078
Bells LakeLake Name: SiteID: WASHINGTON TWPMunicipality:
County: GLOUCESTER
Surface to Bottom Profile
Season: Spring
Station Profile Depth Water Temp DO pH Conductivity(M) (C ) (SU) (mS/cm)(mg/L)
Tot. Depth(M)
Secchi(M)
DO(%Sat)
1 13.24 9.11 6.85 0.1561.2 1.2 85.91
2 14.08 10.73 7.31 0.1522.3 1.5 102.81
2 12.85 9.19 6.85 0.1522.3 1.5 85.82
outlet 14.2 9.42 7.18 0.1510.1 90.60.1
Season: Summer
Station Profile Depth Water Temp DO pH Conductivity(M) (C ) (SU) (mS/cm)(mg/L)
Tot. Depth(M)
Secchi(M)
DO(%Sat)
1 21.96 3.36 6.4 0.1241.3 1.2 38.31
2 23.78 4.32 6.55 0.1242.3 1.1 511
2 23.15 0.94 6.45 0.1092.3 1.1 10.72
outlet 23.95 6.93 6.79 0.1260.2 82.10.2
Season: Fall
Station Profile Depth Water Temp DO pH Conductivity(M) (C ) (SU) (mS/cm)(mg/L)
Tot. Depth(M)
Secchi(M)
DO(%Sat)
1 18.25 7.69 6.69 0.1740.9 0.9 80.40.5
2 20.67 8.36 6.84 0.132.2 1 91.71
2 20.45 4.65 6.55 0.1362.2 1 50.82
outlet 20.58 7.9 6.91 0.1280.1 86.50.1
-Secchi measurements are not recorded for outlets.-A blank Secchi measurement for lake stations means that an accurate measurement could not be recorded.-A blank parameter result means the parameter could not be measured due to a meter malfunction.

AMBIENT LAKE MONITORING NETWORK
NJW04459-078
Bells LakeLake Name: SiteID: WASHINGTON TWPMunicipality:
County: GLOUCESTER
Lake Profile Raw Data
Season: Spring
Station Tot Phos TKN Nitrite-Nitrate Ammonia-N Chl a(mg/L) (mg/L) (mg/L) (ug/L)(mg/L)
Alk(ppm)
Hard(ppm)
Turbidity(NTU)
1 0.022 0.354 0.840 0.045 15.3 18 43.865 2.98
2 0.012 0.346 0.598 0.019 18.3 18 41.293 2.36
outlet 0.016 0.341 0.578 0.032 23.3 19 38.244 2.4
Season: Summer
Station Tot Phos TKN Nitrite-Nitrate Ammonia-N Chl a(mg/L) (mg/L) (mg/L) (ug/L)(mg/L)
Alk(ppm)
Hard(ppm)
Turbidity(NTU)
1 0.04 0.700 0.388 0.186 5.5 18 31.053 3.68
2 0.03 0.657 0.239 0.134 11.7 13 30.017 3.93
outlet 0.047 0.640 0.236 0.136 13.4 19 29.393 4.03
Season: Fall
Station Tot Phos TKN Nitrite-Nitrate Ammonia-N Chl a(mg/L) (mg/L) (mg/L) (ug/L)(mg/L)
Alk(ppm)
Hard(ppm)
Turbidity(NTU)
1 0.044 1.080 0.454 0.023 40.5 19 36.156 8.41
2 0.033 0.743 0.212 0.022 35.4 20 31.901 6.75
outlet 0.024 0.664 0.211 0.063 37.9 19 32.026 6.14
"ND" indicates the result is at a concentration below the analytical method's Reporting Limit (RL). See Volume 1, Methods.Sample Device - Horizontal Polycarbonate Sampler
-A blank parameter result means the parameter could not be analyzed due to laboratory error.

AMBIENT LAKE MONITORING NETWORKLake Name Bennetts Pond County OceanSite ID NJW04459-079 Municipality Jackson Twp.
INSERT LAKE MAP W/ AREAL EXTENT
Carlson's Trophic Index (TSI)
Season TSIP TSIC TSIS TSISpringStation 1 54.57 46.39 60 53.65
EutrophicSpringStation 2 45 39.97 57.37 47.45
MesotrophicSummerStation 1 62.95 56.13 69.99 63.02
EutrophicSummerStation 2 59.97 65.08 69.99 65.01
EutrophicFallStation 1 56.6 39.97 B 48.29
MesotrophicFallStation 2 57.34 46.77 57.37 53.83
Eutrophic
Total Phosphorus exceeds SWQC threshold (See Datasheet for actual concentration)B - Secchi visible to Lake bottom. (See Datasheet for total depth)
Observations
Summer-poor water clarity, turtles, heron
Fall-waterfowl

AMBIENT LAKE MONITORING NETWORK
NJW04459-079
Bennetts PondLake Name: SiteID: JACKSON TWPMunicipality:
County: OCEAN
Surface to Bottom Profile
Season: Spring
Station Profile Depth Water Temp DO pH Conductivity(M) (C ) (SU) (mS/cm)(mg/L)
Tot. Depth(M)
Secchi(M)
DO(%Sat)
1 13.25 8.49 5.98 0.111.2 1 811
2 14.3 8.02 6.04 0.1091.8 1.2 78.41
outlet 14.64 9.94 6.15 0.1090.7 97.80.4
Season: Summer
Station Profile Depth Water Temp DO pH Conductivity(M) (C ) (SU) (mS/cm)(mg/L)
Tot. Depth(M)
Secchi(M)
DO(%Sat)
1 22.56 2.04 5.87 0.1150.9 0.5 23.70.5
2 23.07 4.18 6.03 0.1271.6 0.5 49.21
outlet 25.67 6.88 6.68 0.120.5 84.50.3
Season: Fall
Station Profile Depth Water Temp DO pH Conductivity(M) (C ) (SU) (mS/cm)(mg/L)
Tot. Depth(M)
Secchi(M)
DO(%Sat)
1 19.13 6.26 6.35 0.1151 1 68.30.5
2 19.51 6.25 6.37 0.1111.5 1.2 68.71
outlet 19.81 7.5 6.57 0.1110.2 830.2
-Secchi measurements are not recorded for outlets.-A blank Secchi measurement for lake stations means that an accurate measurement could not be recorded.-A blank parameter result means the parameter could not be measured due to a meter malfunction.

AMBIENT LAKE MONITORING NETWORK
NJW04459-079
Bennetts PondLake Name: SiteID: JACKSON TWPMunicipality:
County: OCEAN
Lake Profile Raw Data
Season: Spring
Station Tot Phos TKN Nitrite-Nitrate Ammonia-N Chl a(mg/L) (mg/L) (mg/L) (ug/L)(mg/L)
Alk(ppm)
Hard(ppm)
Turbidity(NTU)
1 0.033 0.380 0.134 0.043 5 5 18.645 6.55
2 0.017 0.309 0.134 0.053 2.6 15 18.504 4.65
outlet 0.016 0.294 0.144 0.053 2.9 4 18.637 4.79
Season: Summer
Station Tot Phos TKN Nitrite-Nitrate Ammonia-N Chl a(mg/L) (mg/L) (mg/L) (ug/L)(mg/L)
Alk(ppm)
Hard(ppm)
Turbidity(NTU)
1 0.059 0.620 0.266 0.035 13.5 12 28.545 20.5
2 0.048 0.522 0.246 0.020 33.6 6 27.670 16
outlet 0.047 0.673 0.211 0.014 48.4 12 27.329 16
Season: Fall
Station Tot Phos TKN Nitrite-Nitrate Ammonia-N Chl a(mg/L) (mg/L) (mg/L) (ug/L)(mg/L)
Alk(ppm)
Hard(ppm)
Turbidity(NTU)
1 0.038 0.351 0.254 0.064 2.6 11 24.995 6.42
2 0.04 0.382 0.205 0.070 5.2 9 23.532 6.04
outlet 0.04 0.324 0.219 0.061 9.2 9 23.746 6.15
"ND" indicates the result is at a concentration below the analytical method's Reporting Limit (RL). See Volume 1, Methods.Sample Device - Horizontal Polycarbonate Sampler
-A blank parameter result means the parameter could not be analyzed due to laboratory error.
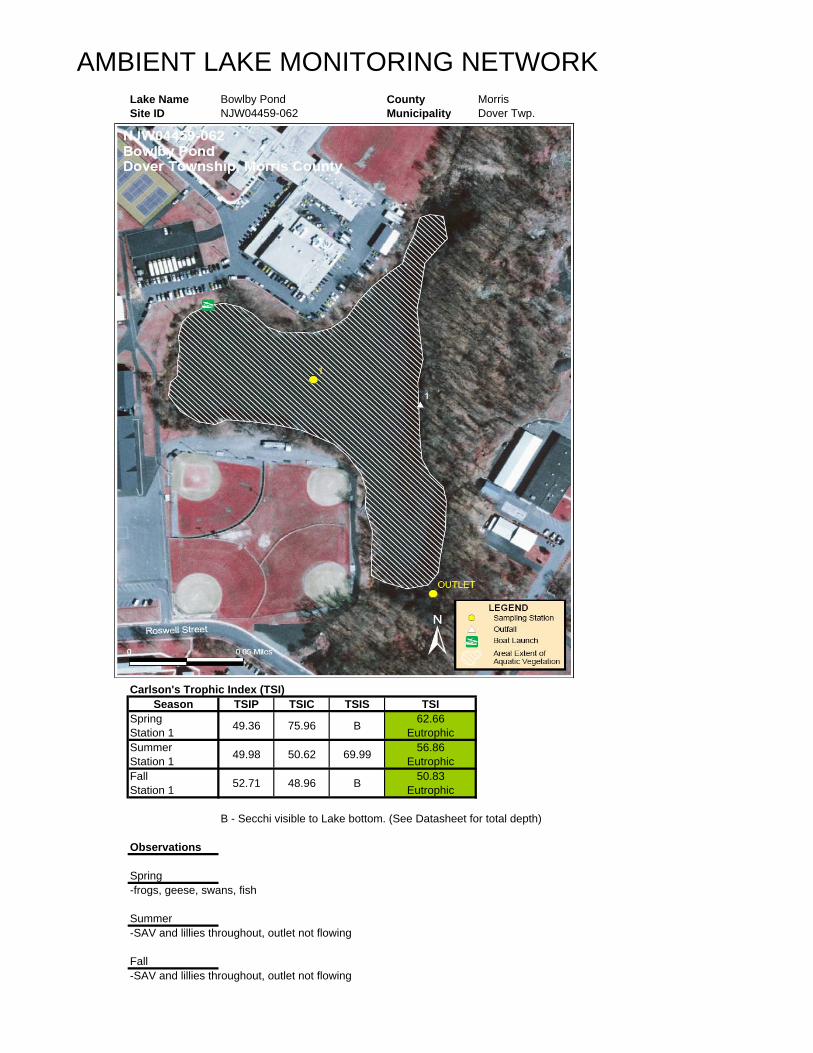
AMBIENT LAKE MONITORING NETWORKLake Name Bowlby Pond County MorrisSite ID NJW04459-062 Municipality Dover Twp.
Carlson's Trophic Index (TSI)Season TSIP TSIC TSIS TSI
SpringStation 1 49.36 75.96 B 62.66
EutrophicSummerStation 1 49.98 50.62 69.99 56.86
EutrophicFallStation 1 52.71 48.96 B 50.83
Eutrophic
B - Secchi visible to Lake bottom. (See Datasheet for total depth)
Observations
Spring-frogs, geese, swans, fish
Summer-SAV and lillies throughout, outlet not flowing
Fall-SAV and lillies throughout, outlet not flowing
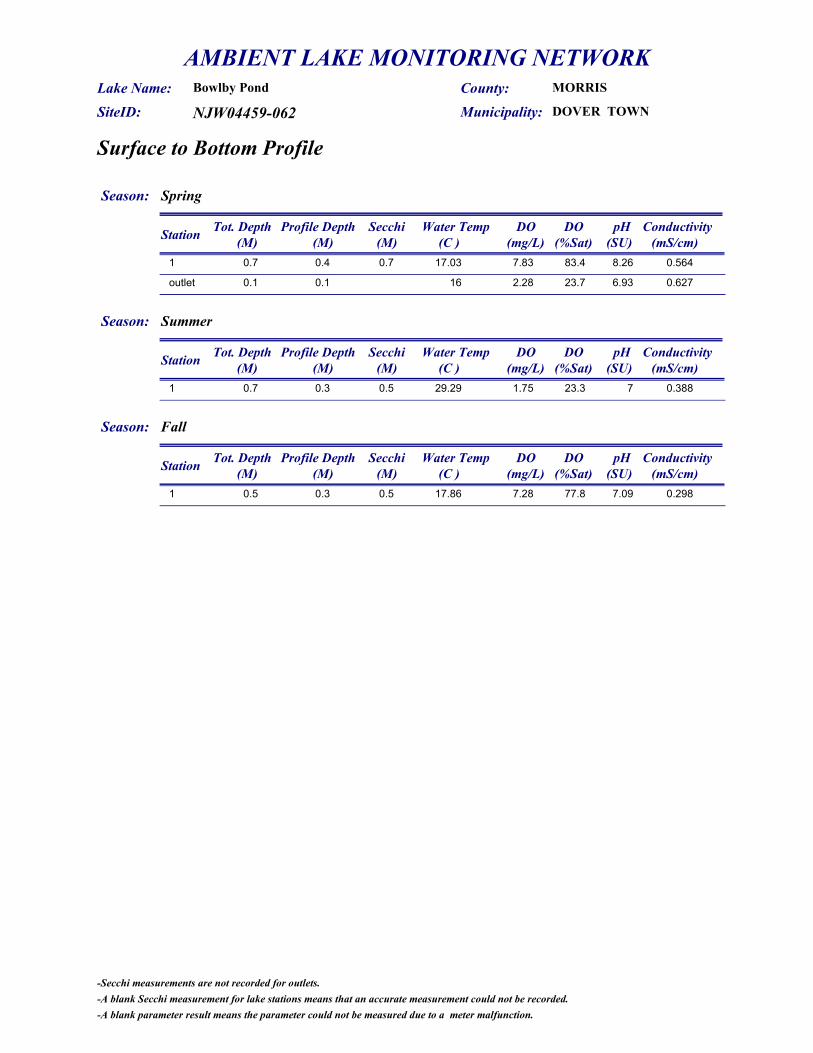
AMBIENT LAKE MONITORING NETWORK
NJW04459-062
Bowlby PondLake Name: SiteID: DOVER TOWNMunicipality:
County: MORRIS
Surface to Bottom Profile
Season: Spring
Station Profile Depth Water Temp DO pH Conductivity(M) (C ) (SU) (mS/cm)(mg/L)
Tot. Depth(M)
Secchi(M)
DO(%Sat)
1 17.03 7.83 8.26 0.5640.7 0.7 83.40.4
outlet 16 2.28 6.93 0.6270.1 23.70.1
Season: Summer
Station Profile Depth Water Temp DO pH Conductivity(M) (C ) (SU) (mS/cm)(mg/L)
Tot. Depth(M)
Secchi(M)
DO(%Sat)
1 29.29 1.75 7 0.3880.7 0.5 23.30.3
Season: Fall
Station Profile Depth Water Temp DO pH Conductivity(M) (C ) (SU) (mS/cm)(mg/L)
Tot. Depth(M)
Secchi(M)
DO(%Sat)
1 17.86 7.28 7.09 0.2980.5 0.5 77.80.3
-Secchi measurements are not recorded for outlets.-A blank Secchi measurement for lake stations means that an accurate measurement could not be recorded.-A blank parameter result means the parameter could not be measured due to a meter malfunction.
AMBIENT LAKE MONITORING NETWORK
NJW04459-062
Bowlby PondLake Name: SiteID: DOVER TOWNMunicipality:
County: MORRIS
Lake Profile Raw Data
Season: Spring
Station Tot Phos TKN Nitrite-Nitrate Ammonia-N Chl a(mg/L) (mg/L) (mg/L) (ug/L)(mg/L)
Alk(ppm)
Hard(ppm)
Turbidity(NTU)
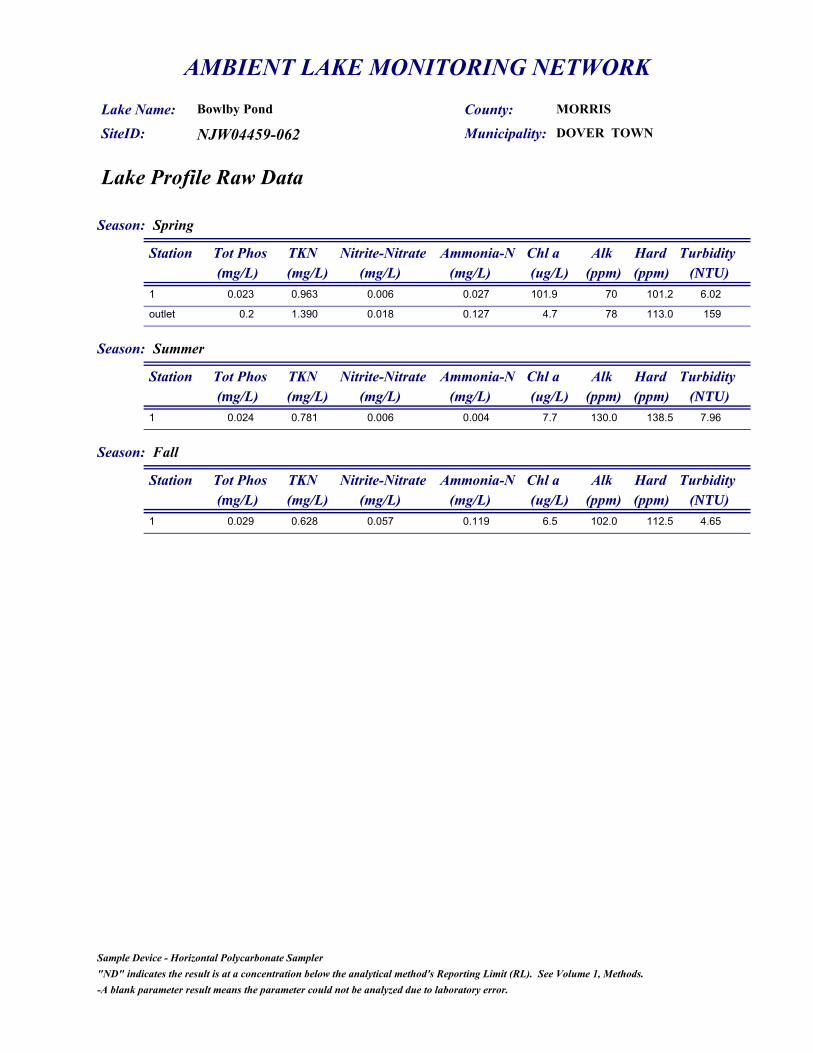
1 0.023 0.963 0.006 0.027 101.9 70 101.2 6.02
outlet 0.2 1.390 0.018 0.127 4.7 78 113.0 159
Season: Summer
Station Tot Phos TKN Nitrite-Nitrate Ammonia-N Chl a(mg/L) (mg/L) (mg/L) (ug/L)(mg/L)
Alk(ppm)
Hard(ppm)
Turbidity(NTU)
1 0.024 0.781 0.006 0.004 7.7 130.0 138.5 7.96
Season: Fall
Station Tot Phos TKN Nitrite-Nitrate Ammonia-N Chl a(mg/L) (mg/L) (mg/L) (ug/L)(mg/L)
Alk(ppm)
Hard(ppm)
Turbidity(NTU)
1 0.029 0.628 0.057 0.119 6.5 102.0 112.5 4.65
"ND" indicates the result is at a concentration below the analytical method's Reporting Limit (RL). See Volume 1, Methods.Sample Device - Horizontal Polycarbonate Sampler
-A blank parameter result means the parameter could not be analyzed due to laboratory error.

AMBIENT LAKE MONITORING NETWORKLake Name Campbells Pond County EssexSite ID NJW04459-052 Municipality Millburn Twp.
INSERT LAKE MAP W/ AREAL EXTENT
Carlson's Trophic Index (TSI)
Season TSIP TSIC TSIS TSISpring Station 1 44.13 55.84 56.22 52.06
EutrophicSummer Station 1 68.21 61.1 56.22 61.84
EutrophicFallStation 1 66.97 52.37 NA 59.67
Eutrophic
Total Phosphorus exceeds SWQC threshold (See Datasheet for actual concentration)
NA - Reading not available.
Observations
Summer-bluegreen scum line around lake perimeter
Fall-aprox 50% of lake surface covered by filamentous algae, some duckweed
AMBIENT LAKE MONITORING NETWORK
NJW04459-052
Campbells PondLake Name: SiteID: MILLBURN TWPMunicipality:
County: ESSEX
Surface to Bottom Profile
Season: Spring
Station Profile Depth Water Temp DO pH Conductivity(M) (C ) (SU) (mS/cm)(mg/L)
Tot. Depth(M)
Secchi(M)
DO(%Sat)
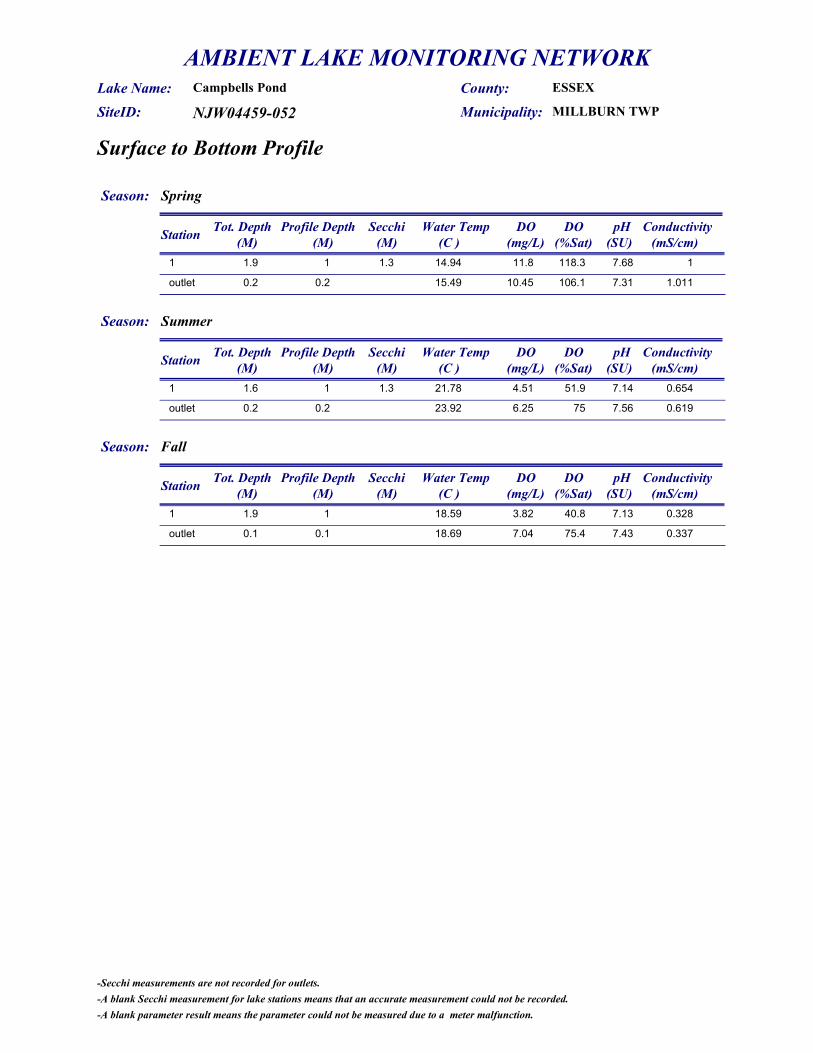
1 14.94 11.8 7.68 11.9 1.3 118.31
outlet 15.49 10.45 7.31 1.0110.2 106.10.2
Season: Summer
Station Profile Depth Water Temp DO pH Conductivity(M) (C ) (SU) (mS/cm)(mg/L)
Tot. Depth(M)
Secchi(M)
DO(%Sat)
1 21.78 4.51 7.14 0.6541.6 1.3 51.91
outlet 23.92 6.25 7.56 0.6190.2 750.2
Season: Fall
Station Profile Depth Water Temp DO pH Conductivity(M) (C ) (SU) (mS/cm)(mg/L)
Tot. Depth(M)
Secchi(M)
DO(%Sat)
1 18.59 3.82 7.13 0.3281.9 40.81
outlet 18.69 7.04 7.43 0.3370.1 75.40.1
-Secchi measurements are not recorded for outlets.-A blank Secchi measurement for lake stations means that an accurate measurement could not be recorded.-A blank parameter result means the parameter could not be measured due to a meter malfunction.

AMBIENT LAKE MONITORING NETWORK
NJW04459-052
Campbells PondLake Name: SiteID: MILLBURN TWPMunicipality:
County: ESSEX
Lake Profile Raw Data
Season: Spring
Station Tot Phos TKN Nitrite-Nitrate Ammonia-N Chl a(mg/L) (mg/L) (mg/L) (ug/L)(mg/L)
Alk(ppm)
Hard(ppm)
Turbidity(NTU)
1 0.016 0.410 0.100 0.022 13.1 46 123.1 2.47
outlet 0.034 0.609 0.127 0.079 12.3 45 128.4 1.84
Season: Summer
Station Tot Phos TKN Nitrite-Nitrate Ammonia-N Chl a(mg/L) (mg/L) (mg/L) (ug/L)(mg/L)
Alk(ppm)
Hard(ppm)
Turbidity(NTU)
1 0.085 0.652 0.339 0.084 22.4 52 124.5 5.55
outlet 0.107 0.693 0.300 0.100 15.8 52 116.5 6.64
Season: Fall
Station Tot Phos TKN Nitrite-Nitrate Ammonia-N Chl a(mg/L) (mg/L) (mg/L) (ug/L)(mg/L)
Alk(ppm)
Hard(ppm)
Turbidity(NTU)
1 0.078 0.446 0.504 0.090 9.2 43 82.625 3.54
outlet 0.08 0.434 0.484 0.106 9.7 44 82.830 3.36
"ND" indicates the result is at a concentration below the analytical method's Reporting Limit (RL). See Volume 1, Methods.Sample Device - Horizontal Polycarbonate Sampler
-A blank parameter result means the parameter could not be analyzed due to laboratory error.

AMBIENT LAKE MONITORING NETWORKLake Name Cedar Lake County MorrisSite ID NJW04459-055 Municipality Denville Twp.
INSERT LAKE MAP W/ AREAL EXTENT
Carlson's Trophic Index (TSI)
Season TSIP TSIC TSIS TSISpringStation 1 ND 44.2 43.7 43.95
MesotrophicSpringStation 2 41.14 45.57 B 43.35
MesotrophicSummerStation 1 45.83 53.19 50.01 49.69
MesotrophicSummerStation 2 57.7 51.48 B 54.59
EutrophicFallStation 1 48.72 51.93 NA 50.33
EutrophicFallStation 2 48.72 45.57 B 47.15
Mesotrophic
ND - TP concentration below detection limitB - Secchi visible to Lake bottom. (See Datasheet for total depth)NA - Reading not available.
Observations
Spring-SAV, outlet dry
Summer-filamentous algae, outlet not flowing, treated w/ CuSO4 in swimming area on 7/25/06, treated w/ SONAR in May
Fall-freshwater jellyfish

AMBIENT LAKE MONITORING NETWORK
NJW04459-055
Cedar LakeLake Name: SiteID: DENVILLE TWPMunicipality:
County: MORRIS
Surface to Bottom Profile
Season: Spring
Station Profile Depth Water Temp DO pH Conductivity(M) (C ) (SU) (mS/cm)(mg/L)
Tot. Depth(M)
Secchi(M)
DO(%Sat)
1 17.95 7.66 6.6 0.2384.1 3.1 82.91
1 17.35 7.46 6.89 0.2394.1 3.1 79.82
1 17.09 7.18 6.86 0.2394.1 3.1 76.43
2 18.15 7.13 6.94 0.241.8 1.8 77.61
Season: Summer
Station Profile Depth Water Temp DO pH Conductivity(M) (C ) (SU) (mS/cm)(mg/L)
Tot. Depth(M)
Secchi(M)
DO(%Sat)
1 27.36 6.89 7.37 0.2143.8 2 88.31
1 27.15 6.72 7.18 0.2143.8 2 85.92
1 26.91 4.12 6.83 0.2153.8 2 52.43
2 27.16 6.37 6.99 0.2131.8 1.8 81.41
Season: Fall
Station Profile Depth Water Temp DO pH Conductivity(M) (C ) (SU) (mS/cm)(mg/L)
Tot. Depth(M)
Secchi(M)
DO(%Sat)
1 19.7 7.5 6.82 0.1723 82.91
1 19.57 7.61 6.8 0.1723 83.92
2 19.2 7.3 6.78 0.1711.8 1.8 79.91
outlet 19.4 7.56 6.97 0.1710.1 83.10.1
-Secchi measurements are not recorded for outlets.-A blank Secchi measurement for lake stations means that an accurate measurement could not be recorded.-A blank parameter result means the parameter could not be measured due to a meter malfunction.

AMBIENT LAKE MONITORING NETWORK
NJW04459-055
Cedar LakeLake Name: SiteID: DENVILLE TWPMunicipality:
County: MORRIS
Lake Profile Raw Data
Season: Spring
Station Tot Phos TKN Nitrite-Nitrate Ammonia-N Chl a(mg/L) (mg/L) (mg/L) (ug/L)(mg/L)
Alk(ppm)
Hard(ppm)
Turbidity(NTU)
1 ND 0.482 0.140 0.125 4 13 44.642 2.11
2 0.013 0.562 0.136 0.143 4.6 12 44.142 1.44
Season: Summer
Station Tot Phos TKN Nitrite-Nitrate Ammonia-N Chl a(mg/L) (mg/L) (mg/L) (ug/L)(mg/L)
Alk(ppm)
Hard(ppm)
Turbidity(NTU)
1 0.018 0.513 0.006 0.004 10 8 34.913 1.36
2 0.041 0.557 0.006 0.004 8.4 9 34.322 1.56
Season: Fall
Station Tot Phos TKN Nitrite-Nitrate Ammonia-N Chl a(mg/L) (mg/L) (mg/L) (ug/L)(mg/L)
Alk(ppm)
Hard(ppm)
Turbidity(NTU)
1 0.022 0.346 0.004 0.026 8.8 6 31.161 1.03
2 0.022 0.358 0.007 0.044 4.6 6 30.753 0.95
outlet 0.027 0.344 0.006 0.040 6.6 6 30.913 0.84
"ND" indicates the result is at a concentration below the analytical method's Reporting Limit (RL). See Volume 1, Methods.Sample Device - Horizontal Polycarbonate Sampler
-A blank parameter result means the parameter could not be analyzed due to laboratory error.

AMBIENT LAKE MONITORING NETWORKLake Name Cedar Lake County CumberlandSite ID NJW04459-243 Municipality Lawrence Twp.
INSERT LAKE MAP W/ AREAL EXTENT
Carlson's Trophic Index (TSI)
Season TSIP TSIC TSIS TSISpringStation 1 55 55.61 58.63 56.47
EutrophicSummerStation 1 73.19 70.73 65.14 69.99
EutrophicFallStation 1 ND 71.34 65.14 68.24
Eutrophic
Total Phosphorus exceeds SWQC threshold (See Datasheet for actual concentration)ND - TP concentration below detection limit
Observations
Summer-turtles, frogs, geese, macrophytes
Fall-geese, bright green algae on banks
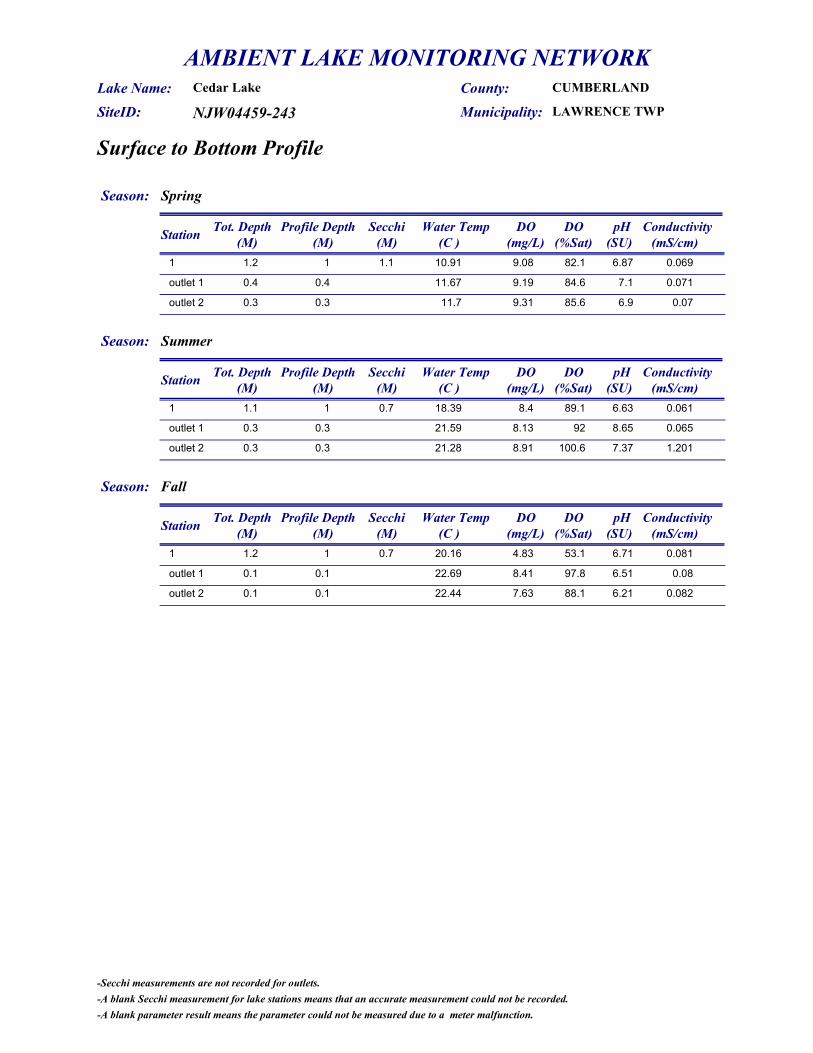
AMBIENT LAKE MONITORING NETWORK
NJW04459-243
Cedar LakeLake Name: SiteID: LAWRENCE TWPMunicipality:
County: CUMBERLAND
Surface to Bottom Profile
Season: Spring
Station Profile Depth Water Temp DO pH Conductivity(M) (C ) (SU) (mS/cm)(mg/L)
Tot. Depth(M)
Secchi(M)
DO(%Sat)
1 10.91 9.08 6.87 0.0691.2 1.1 82.11
outlet 1 11.67 9.19 7.1 0.0710.4 84.60.4
outlet 2 11.7 9.31 6.9 0.070.3 85.60.3
Season: Summer
Station Profile Depth Water Temp DO pH Conductivity(M) (C ) (SU) (mS/cm)(mg/L)
Tot. Depth(M)
Secchi(M)
DO(%Sat)
1 18.39 8.4 6.63 0.0611.1 0.7 89.11
outlet 1 21.59 8.13 8.65 0.0650.3 920.3
outlet 2 21.28 8.91 7.37 1.2010.3 100.60.3
Season: Fall
Station Profile Depth Water Temp DO pH Conductivity(M) (C ) (SU) (mS/cm)(mg/L)
Tot. Depth(M)
Secchi(M)
DO(%Sat)
1 20.16 4.83 6.71 0.0811.2 0.7 53.11
outlet 1 22.69 8.41 6.51 0.080.1 97.80.1
outlet 2 22.44 7.63 6.21 0.0820.1 88.10.1
-Secchi measurements are not recorded for outlets.-A blank Secchi measurement for lake stations means that an accurate measurement could not be recorded.-A blank parameter result means the parameter could not be measured due to a meter malfunction.

AMBIENT LAKE MONITORING NETWORK
NJW04459-243
Cedar LakeLake Name: SiteID: LAWRENCE TWPMunicipality:
County: CUMBERLAND
Lake Profile Raw Data
Season: Spring
Station Tot Phos TKN Nitrite-Nitrate Ammonia-N Chl a(mg/L) (mg/L) (mg/L) (ug/L)(mg/L)
Alk(ppm)
Hard(ppm)
Turbidity(NTU)
1 0.034 0.444 1.020 0.034 12.8 9 22.169 5.28
outlet 1 0.025 0.450 0.969 0.037 21.7 9 22.709 4.28
outlet 2 0.031 0.543 0.956 0.129 15.8 9 22.343 4.86
Season: Summer
Station Tot Phos TKN Nitrite-Nitrate Ammonia-N Chl a(mg/L) (mg/L) (mg/L) (ug/L)(mg/L)
Alk(ppm)
Hard(ppm)
Turbidity(NTU)
1 0.12 1.200 0.175 0.015 59.8 14 21.574 12.1
Outlet 1 0.102 1.010 0.080 0.015 37.2 13 21.564 10.6
Outlet 2 0.115 1.270 0.242 0.062 55.3 17 109.1 17
Season: Fall
Station Tot Phos TKN Nitrite-Nitrate Ammonia-N Chl a(mg/L) (mg/L) (mg/L) (ug/L)(mg/L)
Alk(ppm)
Hard(ppm)
Turbidity(NTU)
1 ND 1.520 0.635 0.085 63.6 10 24.830 27.4
outlet 1 0.115 0.812 0.410 0.021 37.4 10 24.068 10.6
outlet 2 0.101 0.674 0.429 0.036 31.7 11 24.308 9.94
"ND" indicates the result is at a concentration below the analytical method's Reporting Limit (RL). See Volume 1, Methods.Sample Device - Horizontal Polycarbonate Sampler
-A blank parameter result means the parameter could not be analyzed due to laboratory error.

AMBIENT LAKE MONITORING NETWORKLake Name Chesler Lake County MorrisSite ID NJW04459-051 Municipality Roxbury Twp.
INSERT LAKE MAP W/ AREAL EXTENT
Carlson's Trophic Index (TSI)
Season TSIP TSIC TSIS TSISpringStation 1 29.99 55.91 52.35 46.08
MesotrophicSummerStation 1 45 51.48 48 48.16
MesotrophicFallStation 1 ND 47.32 40.09 43.86
Mesotrophic
ND - TP concentration below detection limit
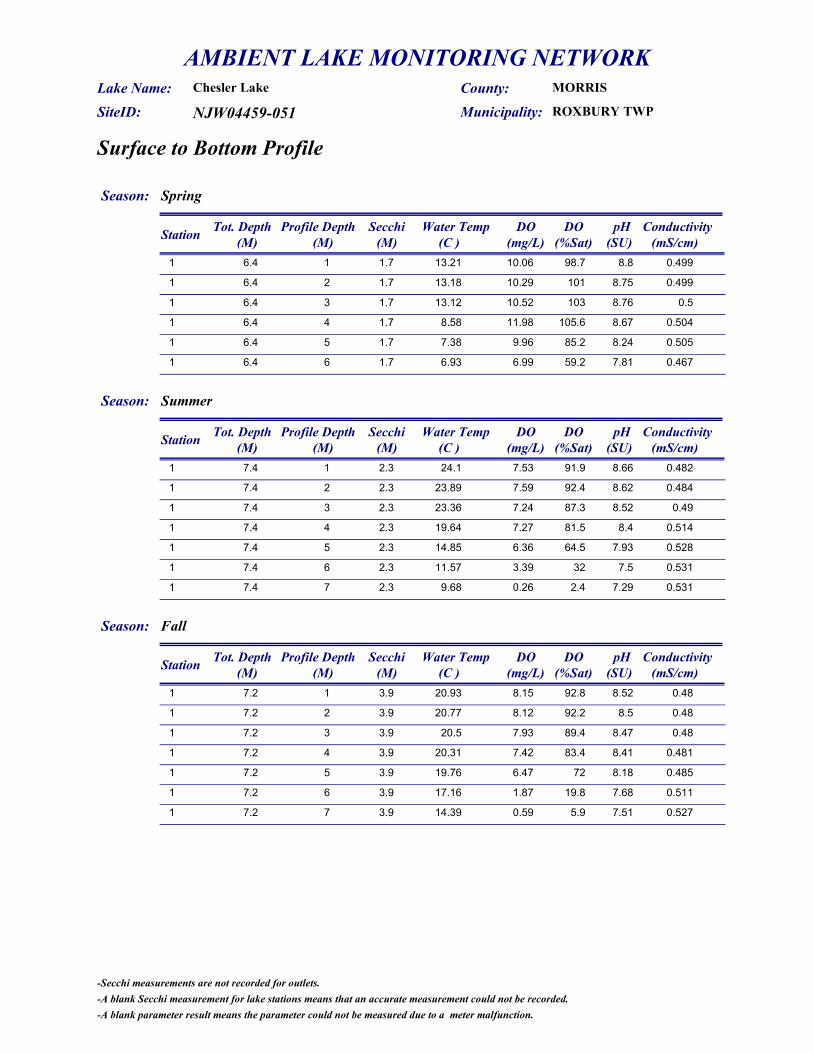
AMBIENT LAKE MONITORING NETWORK
NJW04459-051
Chesler LakeLake Name: SiteID: ROXBURY TWPMunicipality:
County: MORRIS
Surface to Bottom Profile
Season: Spring
Station Profile Depth Water Temp DO pH Conductivity(M) (C ) (SU) (mS/cm)(mg/L)
Tot. Depth(M)
Secchi(M)
DO(%Sat)
1 13.21 10.06 8.8 0.4996.4 1.7 98.71
1 13.18 10.29 8.75 0.4996.4 1.7 1012
1 13.12 10.52 8.76 0.56.4 1.7 1033
1 8.58 11.98 8.67 0.5046.4 1.7 105.64
1 7.38 9.96 8.24 0.5056.4 1.7 85.25
1 6.93 6.99 7.81 0.4676.4 1.7 59.26
Season: Summer
Station Profile Depth Water Temp DO pH Conductivity(M) (C ) (SU) (mS/cm)(mg/L)
Tot. Depth(M)
Secchi(M)
DO(%Sat)
1 24.1 7.53 8.66 0.4827.4 2.3 91.91
1 23.89 7.59 8.62 0.4847.4 2.3 92.42
1 23.36 7.24 8.52 0.497.4 2.3 87.33
1 19.64 7.27 8.4 0.5147.4 2.3 81.54
1 14.85 6.36 7.93 0.5287.4 2.3 64.55
1 11.57 3.39 7.5 0.5317.4 2.3 326
1 9.68 0.26 7.29 0.5317.4 2.3 2.47
Season: Fall
Station Profile Depth Water Temp DO pH Conductivity(M) (C ) (SU) (mS/cm)(mg/L)
Tot. Depth(M)
Secchi(M)
DO(%Sat)
1 20.93 8.15 8.52 0.487.2 3.9 92.81
1 20.77 8.12 8.5 0.487.2 3.9 92.22
1 20.5 7.93 8.47 0.487.2 3.9 89.43
1 20.31 7.42 8.41 0.4817.2 3.9 83.44
1 19.76 6.47 8.18 0.4857.2 3.9 725
1 17.16 1.87 7.68 0.5117.2 3.9 19.86
1 14.39 0.59 7.51 0.5277.2 3.9 5.97
-Secchi measurements are not recorded for outlets.-A blank Secchi measurement for lake stations means that an accurate measurement could not be recorded.-A blank parameter result means the parameter could not be measured due to a meter malfunction.
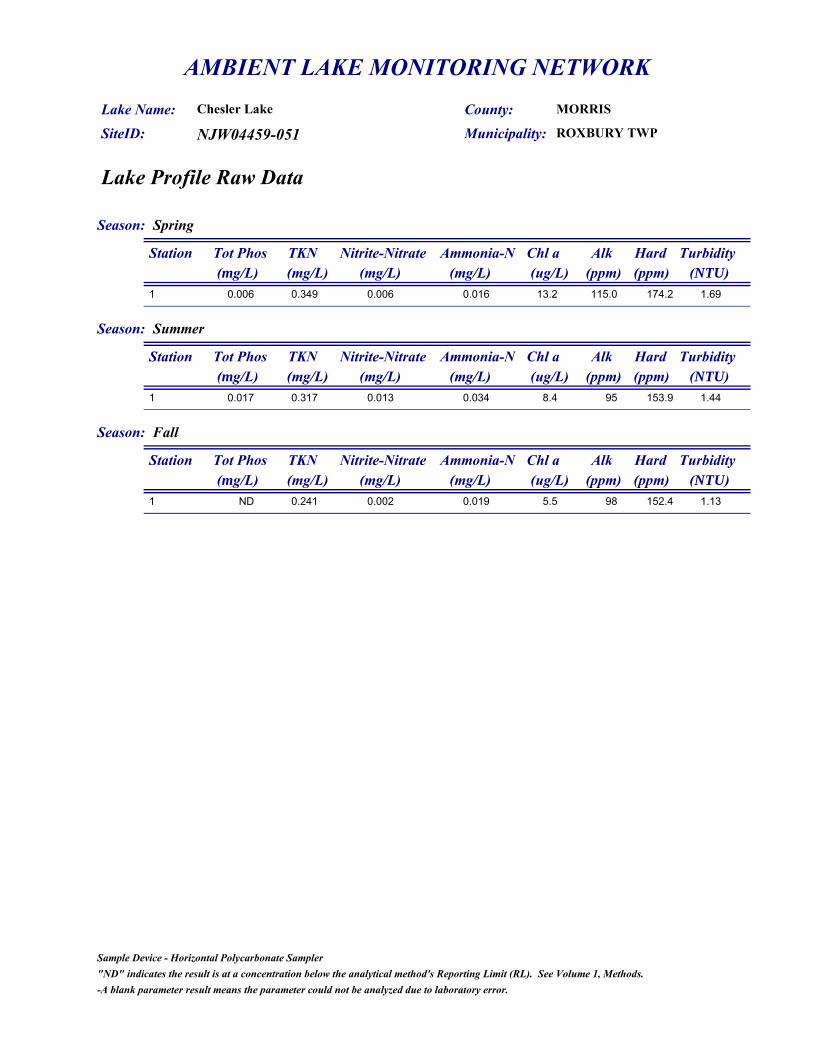
AMBIENT LAKE MONITORING NETWORK
NJW04459-051
Chesler LakeLake Name: SiteID: ROXBURY TWPMunicipality:
County: MORRIS
Lake Profile Raw Data
Season: Spring
Station Tot Phos TKN Nitrite-Nitrate Ammonia-N Chl a(mg/L) (mg/L) (mg/L) (ug/L)(mg/L)
Alk(ppm)
Hard(ppm)
Turbidity(NTU)
1 0.006 0.349 0.006 0.016 13.2 115.0 174.2 1.69
Season: Summer
Station Tot Phos TKN Nitrite-Nitrate Ammonia-N Chl a(mg/L) (mg/L) (mg/L) (ug/L)(mg/L)
Alk(ppm)
Hard(ppm)
Turbidity(NTU)
1 0.017 0.317 0.013 0.034 8.4 95 153.9 1.44
Season: Fall
Station Tot Phos TKN Nitrite-Nitrate Ammonia-N Chl a(mg/L) (mg/L) (mg/L) (ug/L)(mg/L)
Alk(ppm)
Hard(ppm)
Turbidity(NTU)
1 ND 0.241 0.002 0.019 5.5 98 152.4 1.13
"ND" indicates the result is at a concentration below the analytical method's Reporting Limit (RL). See Volume 1, Methods.Sample Device - Horizontal Polycarbonate Sampler
-A blank parameter result means the parameter could not be analyzed due to laboratory error.
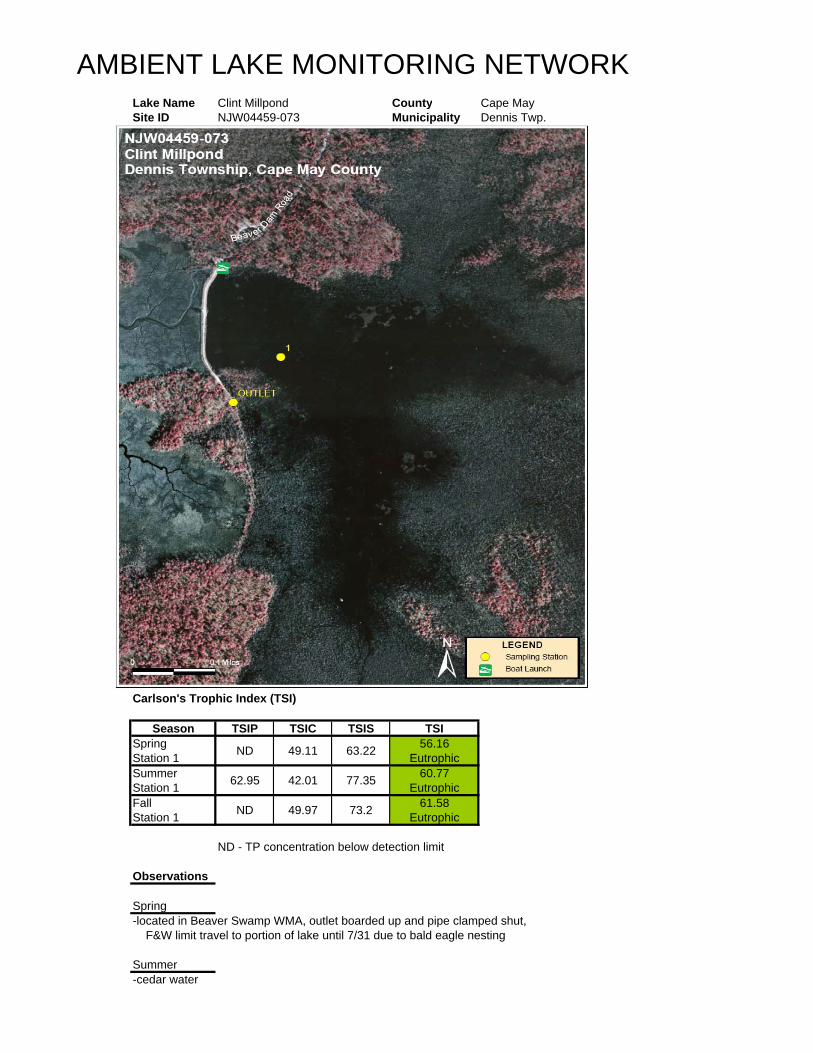
AMBIENT LAKE MONITORING NETWORKLake Name Clint Millpond County Cape MaySite ID NJW04459-073 Municipality Dennis Twp.
INSERT LAKE MAP W/ AREAL EXTENT
Carlson's Trophic Index (TSI)
Season TSIP TSIC TSIS TSISpringStation 1 ND 49.11 63.22 56.16
EutrophicSummerStation 1 62.95 42.01 77.35 60.77
EutrophicFallStation 1 ND 49.97 73.2 61.58
Eutrophic
ND - TP concentration below detection limit
Observations
Spring-located in Beaver Swamp WMA, outlet boarded up and pipe clamped shut, F&W limit travel to portion of lake until 7/31 due to bald eagle nesting
Summer-cedar water

AMBIENT LAKE MONITORING NETWORK
NJW04459-073
Clint MillpondLake Name: SiteID: DENNIS TWPMunicipality:
County: CAPE_MAY
Surface to Bottom Profile
Season: Spring
Station Profile Depth Water Temp DO pH Conductivity(M) (C ) (SU) (mS/cm)(mg/L)
Tot. Depth(M)
Secchi(M)
DO(%Sat)
1 12.08 8.52 4.12 0.0761.4 0.8 78.21
outlet 14.81 9.38 4.35 0.0750.1 91.30.1
Season: Summer
Station Profile Depth Water Temp DO pH Conductivity(M) (C ) (SU) (mS/cm)(mg/L)
Tot. Depth(M)
Secchi(M)
DO(%Sat)
1 19.46 2.67 4.33 0.0691.4 0.3 29.11
outlet 20.79 2.93 4.33 0.0680.1 32.60.1
Season: Fall
Station Profile Depth Water Temp DO pH Conductivity(M) (C ) (SU) (mS/cm)(mg/L)
Tot. Depth(M)
Secchi(M)
DO(%Sat)
1 20.66 4.1 4.57 0.0871.3 0.4 451
outlet 20.8 2.95 4.67 0.0890.1 32.50.1
-Secchi measurements are not recorded for outlets.-A blank Secchi measurement for lake stations means that an accurate measurement could not be recorded.-A blank parameter result means the parameter could not be measured due to a meter malfunction.

AMBIENT LAKE MONITORING NETWORK
NJW04459-073
Clint MillpondLake Name: SiteID: DENNIS TWPMunicipality:
County: CAPE_MAY
Lake Profile Raw Data
Season: Spring
Station Tot Phos TKN Nitrite-Nitrate Ammonia-N Chl a(mg/L) (mg/L) (mg/L) (ug/L)(mg/L)
Alk(ppm)
Hard(ppm)
Turbidity(NTU)
1 ND 0.646 0.007 0.017 6.6 1 9.209 1.5
outlet ND 0.673 0.006 0.020 10.3 1 9.003 1.74
Season: Summer
Station Tot Phos TKN Nitrite-Nitrate Ammonia-N Chl a(mg/L) (mg/L) (mg/L) (ug/L)(mg/L)
Alk(ppm)
Hard(ppm)
Turbidity(NTU)
1 0.059 1.020 0.025 0.050 3.2 2 8.069 1.94
outlet 0.028 0.876 0.021 0.047 7.3 1 8.061 1.47
Season: Fall
Station Tot Phos TKN Nitrite-Nitrate Ammonia-N Chl a(mg/L) (mg/L) (mg/L) (ug/L)(mg/L)
Alk(ppm)
Hard(ppm)
Turbidity(NTU)
1 ND 0.895 0.013 0.115 7.2 2 10.876 4.4
outlet ND 0.864 0.002 0.026 3.9 1 11.093 2.24
"ND" indicates the result is at a concentration below the analytical method's Reporting Limit (RL). See Volume 1, Methods.Sample Device - Horizontal Polycarbonate Sampler
-A blank parameter result means the parameter could not be analyzed due to laboratory error.

AMBIENT LAKE MONITORING NETWORKLake Name Cooper River Lake County CamdenSite ID NJW04459-047 Municipality Collingswood Boro
INSERT LAKE MAP W/ AREAL EXTENT
Carlson's Trophic Index (TSI)
Season TSIP TSIC TSIS TSI
Spring Station 1 81.73 68.7 75.13 75.18Hypereutrophic
Spring Station 2 66.79 72.65 67.36 68.93Eutrophic
Spring Station 3 68.04 71.99 67.36 69.13Eutrophic
SummerStation 1 82.5 61.86 73.2 72.52
HypereutrophicSummerStation 2 71.26 71.31 73.2 71.92
HypereutrophicSummerStation 3 72.32 73.3 69.99 71.87
HypereutrophicFallStation 1 87.82 72.98 77.35 79.38
HypereutrophicFallStation 2 69.35 69.8 67.36 68.84
EutrophicFallStation 3 67.16 69.15 67.36 67.89
Eutrophic
Total Phosphorus exceeds SWQC threshold (See Datasheet for actual concentration)

AMBIENT LAKE MONITORING NETWORK
NJW04459-047
Cooper River LakeLake Name: SiteID: COLLINGSWOOD BOROMunicipality:
County: CAMDEN
Surface to Bottom Profile
Season: Spring
Station Profile Depth Water Temp DO pH Conductivity(M) (C ) (SU) (mS/cm)(mg/L)
Tot. Depth(M)
Secchi(M)
DO(%Sat)
1 16.55 8.5 6.99 0.3230.6 0.35 870.3
2 17.41 10.95 8.42 0.321.7 0.6 114.11
3 17.55 10.08 8.29 0.3011.9 0.6 105.31
outlet 17.66 10.4 8.48 0.2984.1 108.91
Season: Summer
Station Profile Depth Water Temp DO pH Conductivity(M) (C ) (SU) (mS/cm)(mg/L)
Tot. Depth(M)
Secchi(M)
DO(%Sat)
1 28.99 2.65 6.69 0.2810.6 0.4 34.30.3
2 30.28 6.75 7.58 0.2381.6 0.4 891
3 29.33 7.01 7.69 0.2191.9 0.5 91.11
outlet 29.18 5.8 7.25 0.2194.1 75.21
Season: Fall
Station Profile Depth Water Temp DO pH Conductivity(M) (C ) (SU) (mS/cm)(mg/L)
Tot. Depth(M)
Secchi(M)
DO(%Sat)
1 18.44 5.46 6.83 0.2630.5 0.3 57.50.3
2 19.94 7.69 7.4 0.2451.7 0.6 83.41
3 20.23 7.72 7.55 0.2331.8 0.6 84.21
outlet 20.43 7.76 7.56 0.2294 84.91
-Secchi measurements are not recorded for outlets.-A blank Secchi measurement for lake stations means that an accurate measurement could not be recorded.-A blank parameter result means the parameter could not be measured due to a meter malfunction.

AMBIENT LAKE MONITORING NETWORK
NJW04459-047
Cooper River LakeLake Name: SiteID: COLLINGSWOOD BOROMunicipality:
County: CAMDEN
Lake Profile Raw Data
Season: Spring
Station Tot Phos TKN Nitrite-Nitrate Ammonia-N Chl a(mg/L) (mg/L) (mg/L) (ug/L)(mg/L)
Alk(ppm)
Hard(ppm)
Turbidity(NTU)
1 0.217 0.625 0.316 0.075 48.6 31 78.671 29.2
2 0.077 0.969 0.006 0.024 72.7 34 69.430 9.55
3 0.084 0.855 0.006 0.043 68 32 60.102 10.4
outlet 0.085 0.871 0.006 0.024 76 38 59.688 12.5
Season: Summer
Station Tot Phos TKN Nitrite-Nitrate Ammonia-N Chl a(mg/L) (mg/L) (mg/L) (ug/L)(mg/L)
Alk(ppm)
Hard(ppm)
Turbidity(NTU)
1 0.229 1.120 0.233 0.362 24.2 37 73.992 22.8
2 0.105 0.881 0.015 0.015 63.4 35 64.128 15.8
3 0.113 0.899 0.011 0.015 77.7 31 60.481 15.1
outlet 0.11 0.919 0.023 0.024 71.9 32 60.066 14.5
Season: Fall
Station Tot Phos TKN Nitrite-Nitrate Ammonia-N Chl a(mg/L) (mg/L) (mg/L) (ug/L)(mg/L)
Alk(ppm)
Hard(ppm)
Turbidity(NTU)
1 0.331 1.160 0.516 0.182 75.2 38 81.168 35
2 0.092 0.651 0.268 0.024 54.4 41 76.401 9.51
3 0.079 0.618 0.167 0.021 50.9 38 71.510 8.27
outlet 0.063 0.641 0.176 0.032 52.2 37 72.133 8.75
"ND" indicates the result is at a concentration below the analytical method's Reporting Limit (RL). See Volume 1, Methods.Sample Device - Horizontal Polycarbonate Sampler
-A blank parameter result means the parameter could not be analyzed due to laboratory error.

AMBIENT LAKE MONITORING NETWORKLake Name Crystal Spring Lake County GloucesterSite ID NJW04459-045 Municipality Monroe Twp.
INSERT LAKE MAP W/ AREAL EXTENT
Carlson's Trophic Index (TSI)
Season TSIP TSIC TSIS TSISpring Station 1 66.41 58.62 77.35 67.46
EutrophicSummerStation 1 88.41 83.02 93.18 88.20
HypereutrophicFallStation 1 78.54 78.54 83.19 76.93
Hypereutrophic
Total Phosphorus exceeds SWQC threshold (See Datasheet for actual concentration)
Observations
Spring-outlet not flowing
Summer-outlet not flowing
Fall-outlet not flowing, filamentous algae throughout
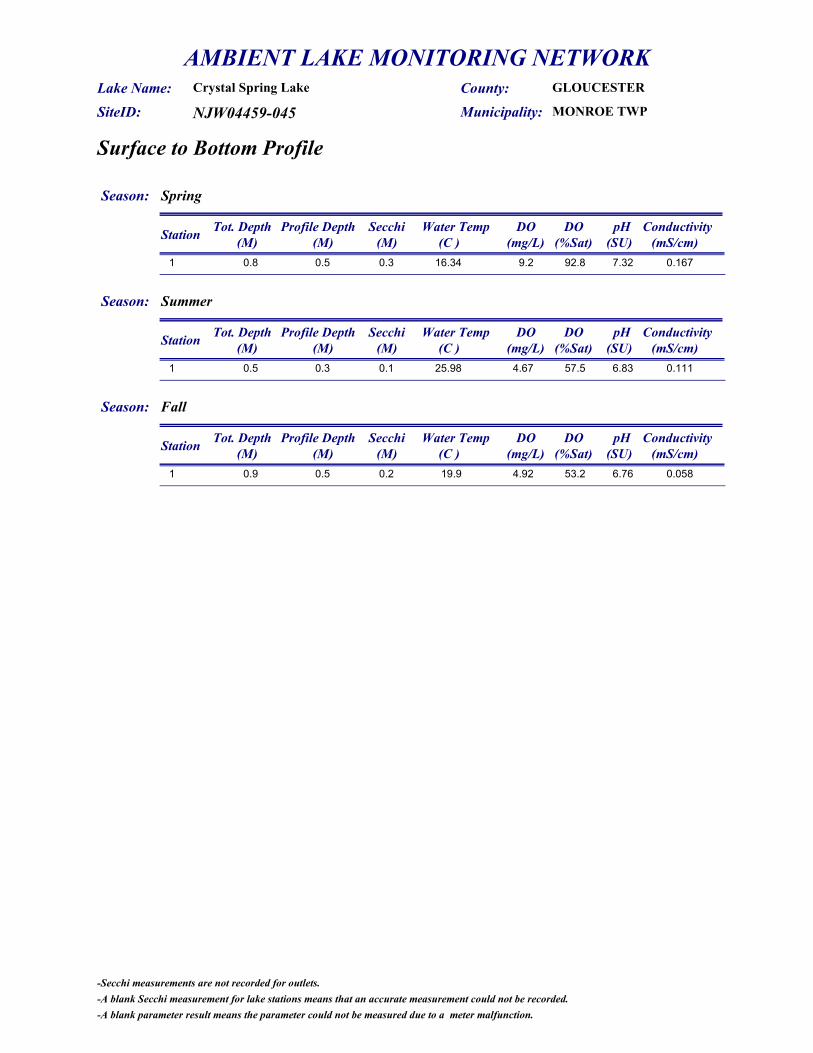
AMBIENT LAKE MONITORING NETWORK
NJW04459-045
Crystal Spring LakeLake Name: SiteID: MONROE TWPMunicipality:
County: GLOUCESTER
Surface to Bottom Profile
Season: Spring
Station Profile Depth Water Temp DO pH Conductivity(M) (C ) (SU) (mS/cm)(mg/L)
Tot. Depth(M)
Secchi(M)
DO(%Sat)
1 16.34 9.2 7.32 0.1670.8 0.3 92.80.5
Season: Summer
Station Profile Depth Water Temp DO pH Conductivity(M) (C ) (SU) (mS/cm)(mg/L)
Tot. Depth(M)
Secchi(M)
DO(%Sat)
1 25.98 4.67 6.83 0.1110.5 0.1 57.50.3
Season: Fall
Station Profile Depth Water Temp DO pH Conductivity(M) (C ) (SU) (mS/cm)(mg/L)
Tot. Depth(M)
Secchi(M)
DO(%Sat)
1 19.9 4.92 6.76 0.0580.9 0.2 53.20.5
-Secchi measurements are not recorded for outlets.-A blank Secchi measurement for lake stations means that an accurate measurement could not be recorded.-A blank parameter result means the parameter could not be measured due to a meter malfunction.

AMBIENT LAKE MONITORING NETWORK
NJW04459-045
Crystal Spring LakeLake Name: SiteID: MONROE TWPMunicipality:
County: GLOUCESTER
Lake Profile Raw Data
Season: Spring
Station Tot Phos TKN Nitrite-Nitrate Ammonia-N Chl a(mg/L) (mg/L) (mg/L) (ug/L)(mg/L)
Alk(ppm)
Hard(ppm)
Turbidity(NTU)
1 0.075 0.945 0.006 0.032 17.4 18 14.795 39.8
Season: Summer
Station Tot Phos TKN Nitrite-Nitrate Ammonia-N Chl a(mg/L) (mg/L) (mg/L) (ug/L)(mg/L)
Alk(ppm)
Hard(ppm)
Turbidity(NTU)
1 0.345 4.820 0.006 0.033 209.2 15 15.585 138
Season: Fall
Station Tot Phos TKN Nitrite-Nitrate Ammonia-N Chl a(mg/L) (mg/L) (mg/L) (ug/L)(mg/L)
Alk(ppm)
Hard(ppm)
Turbidity(NTU)
1 0.174 1.540 0.002 0.063 50.4 14 14.584 32.9
"ND" indicates the result is at a concentration below the analytical method's Reporting Limit (RL). See Volume 1, Methods.Sample Device - Horizontal Polycarbonate Sampler
-A blank parameter result means the parameter could not be analyzed due to laboratory error.

AMBIENT LAKE MONITORING NETWORKLake Name Cumberland Pond County CumberlandSite ID NJW04459-053 Municipality Maurice River Twp.
INSERT LAKE MAP W/ AREAL EXTENT
Carlson's Trophic Index (TSI)
Season TSIP TSIC TSIS TSISpringStation 1 ND 53.48 B 53.48
EutrophicSummerStation 1 61.4 68.43 B 64.92
EutrophicFallStation 1 56.22 33.17 B 44.70
Mesotrophic
Total Phosphorus exceeds SWQC threshold (See Datasheet for actual concentration)ND - TP concentration below detection limitB - Secchi visible to Lake bottom. (See Datasheet for total depth)
Observations
Spring-fish ladder at outlet
Summer-SAV throughout, filamentous algae
Fall-SAV throughout
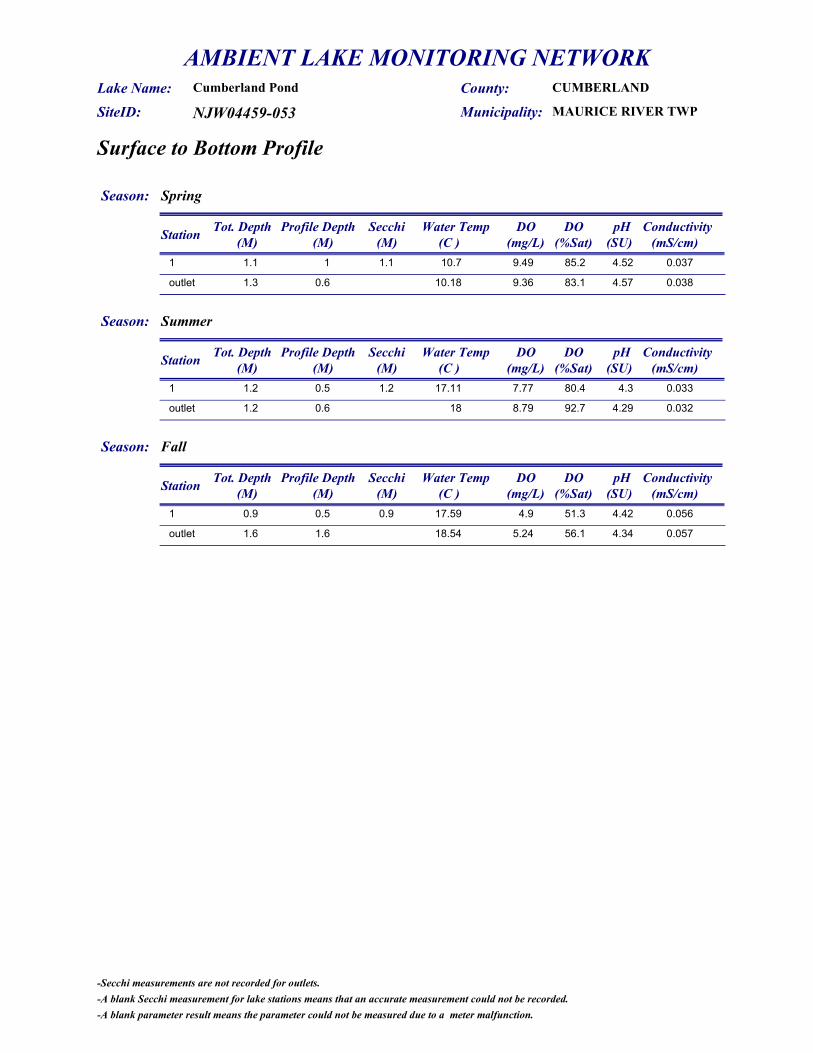
AMBIENT LAKE MONITORING NETWORK
NJW04459-053
Cumberland PondLake Name: SiteID: MAURICE RIVER TWPMunicipality:
County: CUMBERLAND
Surface to Bottom Profile
Season: Spring
Station Profile Depth Water Temp DO pH Conductivity(M) (C ) (SU) (mS/cm)(mg/L)
Tot. Depth(M)
Secchi(M)
DO(%Sat)
1 10.7 9.49 4.52 0.0371.1 1.1 85.21
outlet 10.18 9.36 4.57 0.0381.3 83.10.6
Season: Summer
Station Profile Depth Water Temp DO pH Conductivity(M) (C ) (SU) (mS/cm)(mg/L)
Tot. Depth(M)
Secchi(M)
DO(%Sat)
1 17.11 7.77 4.3 0.0331.2 1.2 80.40.5
outlet 18 8.79 4.29 0.0321.2 92.70.6
Season: Fall
Station Profile Depth Water Temp DO pH Conductivity(M) (C ) (SU) (mS/cm)(mg/L)
Tot. Depth(M)
Secchi(M)
DO(%Sat)
1 17.59 4.9 4.42 0.0560.9 0.9 51.30.5
outlet 18.54 5.24 4.34 0.0571.6 56.11.6
-Secchi measurements are not recorded for outlets.-A blank Secchi measurement for lake stations means that an accurate measurement could not be recorded.-A blank parameter result means the parameter could not be measured due to a meter malfunction.

AMBIENT LAKE MONITORING NETWORK
NJW04459-053
Cumberland PondLake Name: SiteID: MAURICE RIVER TWPMunicipality:
County: CUMBERLAND
Lake Profile Raw Data
Season: Spring
Station Tot Phos TKN Nitrite-Nitrate Ammonia-N Chl a(mg/L) (mg/L) (mg/L) (ug/L)(mg/L)
Alk(ppm)
Hard(ppm)
Turbidity(NTU)
1 ND 0.261 0.006 0.030 10.3 1 4.271 2
outlet ND 0.189 0.006 0.029 3.2 1 4.467 1.18
Season: Summer
Station Tot Phos TKN Nitrite-Nitrate Ammonia-N Chl a(mg/L) (mg/L) (mg/L) (ug/L)(mg/L)
Alk(ppm)
Hard(ppm)
Turbidity(NTU)
1 0.053 0.327 0.012 0.016 47.3 1 3.595 3.77
outlet 0.012 0.169 0.011 0.017 2.8 1 3.750 1.01
Season: Fall
Station Tot Phos TKN Nitrite-Nitrate Ammonia-N Chl a(mg/L) (mg/L) (mg/L) (ug/L)(mg/L)
Alk(ppm)
Hard(ppm)
Turbidity(NTU)
1 0.037 0.216 0.017 0.026 1.3 1 4.750 0.95
outlet 0.024 0.250 0.103 0.030 1.4 1 4.639 0.97
"ND" indicates the result is at a concentration below the analytical method's Reporting Limit (RL). See Volume 1, Methods.Sample Device - Horizontal Polycarbonate Sampler
-A blank parameter result means the parameter could not be analyzed due to laboratory error.

AMBIENT LAKE MONITORING NETWORKLake Name Dennisville Lake County Cape MaySite ID NJW04459-046 Municipality Dennis Twp.
INSERT LAKE MAP W/ AREAL EXTENT
Carlson's Trophic Index (TSI)
Season TSIP TSIC TSIS TSISpring Station 1 ND 33.9 B 33.90
OligotrophicSpring Station 2 ND 37.88 B 37.88
OligotrophicSummerStation 1 38.73 46.77 B 42.75
MesotrophicSummerStation 2 51.13 51.24 B 51.19
EutrophicFallStation 1 ND 45.35 B 45.35
MesotrophicFallStation 2 ND 42.31 B 42.31
Mesotrophic
ND - TP concentration below detection limitB - Secchi visible to Lake bottom. (See Datasheet for total depth)
Observations
Spring-F&W trout stocked
Summer-turtles

AMBIENT LAKE MONITORING NETWORK
NJW04459-046
Dennisville LakeLake Name: SiteID: DENNIS TWPMunicipality:
County: CAPE_MAY
Surface to Bottom Profile
Season: Spring
Station Profile Depth Water Temp DO pH Conductivity(M) (C ) (SU) (mS/cm)(mg/L)
Tot. Depth(M)
Secchi(M)
DO(%Sat)
1 13.39 9.19 5.98 0.0721.3 1.3 86.91
2 13.83 9.14 5.64 0.0730.9 0.9 87.10.5
outlet 12.64 9.04 6.39 0.3590.1 840.1
Season: Summer
Station Profile Depth Water Temp DO pH Conductivity(M) (C ) (SU) (mS/cm)(mg/L)
Tot. Depth(M)
Secchi(M)
DO(%Sat)
1 21.53 7.76 6.15 0.0631.3 1.3 87.91
2 21.41 7.78 5.76 0.0620.8 0.8 880.4
outlet 21.46 7.28 6.36 0.0640.2 82.40.2
Season: Fall
Station Profile Depth Water Temp DO pH Conductivity(M) (C ) (SU) (mS/cm)(mg/L)
Tot. Depth(M)
Secchi(M)
DO(%Sat)
1 21.97 8.23 5.36 0.0771.3 1.3 92.71
2 21.74 7.4 5.21 0.0770.8 0.8 830.4
outlet 22.3 7.4 5.75 0.1860.4 83.90.2
-Secchi measurements are not recorded for outlets.-A blank Secchi measurement for lake stations means that an accurate measurement could not be recorded.-A blank parameter result means the parameter could not be measured due to a meter malfunction.

AMBIENT LAKE MONITORING NETWORK
NJW04459-046
Dennisville LakeLake Name: SiteID: DENNIS TWPMunicipality:
County: CAPE_MAY
Lake Profile Raw Data
Season: Spring
Station Tot Phos TKN Nitrite-Nitrate Ammonia-N Chl a(mg/L) (mg/L) (mg/L) (ug/L)(mg/L)
Alk(ppm)
Hard(ppm)
Turbidity(NTU)
1 ND 0.255 0.291 0.017 1.4 5 13.245 0.53
2 ND 0.296 0.324 0.031 2.1 2 13.269 0.68
outlet 0.021 0.568 0.079 0.040 20.9 58 1718.6 7.8
Season: Summer
Station Tot Phos TKN Nitrite-Nitrate Ammonia-N Chl a(mg/L) (mg/L) (mg/L) (ug/L)(mg/L)
Alk(ppm)
Hard(ppm)
Turbidity(NTU)
1 0.011 0.384 0.006 0.025 5.2 6 11.336 0.9
2 0.026 0.411 0.034 0.029 8.2 11.370 0.91
outlet 0.011 0.379 0.009 0.031 5 12.164 0.82
Season: Fall
Station Tot Phos TKN Nitrite-Nitrate Ammonia-N Chl a(mg/L) (mg/L) (mg/L) (ug/L)(mg/L)
Alk(ppm)
Hard(ppm)
Turbidity(NTU)
1 ND 0.353 0.029 0.014 4.5 2 12.427 1.11
2 ND 0.303 0.050 0.021 3.3 2 12.445 0.93
outlet ND 0.294 0.013 0.043 4.2 4 13.214 1.47
"ND" indicates the result is at a concentration below the analytical method's Reporting Limit (RL). See Volume 1, Methods.Sample Device - Horizontal Polycarbonate Sampler
-A blank parameter result means the parameter could not be analyzed due to laboratory error.

AMBIENT LAKE MONITORING NETWORKLake Name Echo Lake County PassaicSite ID NJW04459-072 Municipality West Milford Twp.
INSERT LAKE MAP W/ AREAL EXTENT
Carlson's Trophic Index (TSI)
Season TSIP TSIC TSIS TSISpringStation 1 44.13 59.01 58.63 53.92
EutrophicSpringStation 2 49.98 59.69 58.63 56.10
EutrophicSummerStation 1 54.13 55.76 52.35 54.08
EutrophicSummerStation 2 57.7 55.84 53.23 55.59
EutrophicFallStation 1 56.22 61.65 55.15 57.67
EutrophicFallStation 2 57.7 64.66 56.22 59.53
Eutrophic
Observations
Summer-outlet 1 not flowing, outlet 2 dry
Fall-outlet 1 not flowing

AMBIENT LAKE MONITORING NETWORK
NJW04459-072
Echo LakeLake Name: SiteID: WEST MILFORD TWPMunicipality:
County: PASSAIC
Surface to Bottom Profile
Season: Spring
Station Profile Depth Water Temp DO pH Conductivity(M) (C ) (SU) (mS/cm)(mg/L)
Tot. Depth(M)
Secchi(M)
DO(%Sat)
1 14.76 8.21 7.43 0.1559.1 1.1 81.41
1 14.65 8.05 7.12 0.1569.1 1.1 79.63
1 13.89 6.21 6.92 0.1579.1 1.1 60.36
1 11.3 0.98 6.31 0.1619.1 1.1 97
2 14.91 8.2 7.12 0.15510.1 1.1 81.61
2 14.87 7.67 7.14 0.15610.1 1.1 76.23
2 13.58 6.83 6.99 0.15810.1 1.1 67.46
2 12.3 1.78 6.85 0.1610.1 1.1 16.87
outlet 1 12.01 5.76 6.79 0.2570.1 53.70.1
outlet 2 16.45 7.98 7.82 0.1660.1 82.30.1
Season: Summer
Station Profile Depth Water Temp DO pH Conductivity(M) (C ) (SU) (mS/cm)(mg/L)
Tot. Depth(M)
Secchi(M)
DO(%Sat)
1 25.26 7.34 7.87 0.1369.2 1.7 911
1 24.83 7.24 7.81 0.1379.2 1.7 892
1 24.62 6.98 7.69 0.1379.2 1.7 85.63
1 22.57 2.79 7.08 0.1369.2 1.7 32.84
1 17.11 1.51 6.96 0.1449.2 1.7 165
1 14.46 0.42 6.82 0.1489.2 1.7 4.26
1 12.9 0.3 6.71 0.1549.2 1.7 2.87
1 11.96 0.19 6.67 0.1639.2 1.7 1.88
2 25.37 6.97 7.84 0.1377.7 1.6 86.61
2 25.16 6.66 7.57 0.1377.7 1.6 82.22
2 24.62 3.9 6.87 0.1377.7 1.6 47.83
2 22.97 0.83 6.79 0.1377.7 1.6 9.94
2 16.17 0.3 6.83 0.1467.7 1.6 3.15
2 13.31 0.39 6.83 0.1537.7 1.6 3.86
2 12.36 0.62 6.88 0.167.7 1.6 5.97
Season: Fall
Station Profile Depth Water Temp DO pH Conductivity(M) (C ) (SU) (mS/cm)(mg/L)
Tot. Depth(M)
Secchi(M)
DO(%Sat)
1 14.84 6.58 7.46 0.1329.2 1.4 66.71
1 14.53 5.8 7.16 0.1329.2 1.4 58.42
1 14.34 5.32 7.02 0.1329.2 1.4 53.43
1 14.22 4.82 6.96 0.1329.2 1.4 48.34
1 14.18 4.92 6.94 0.1339.2 1.4 49.15
1 14.15 4.92 6.91 0.1329.2 1.4 49.26
1 14.01 5.12 6.9 0.1329.2 1.4 517
1 13.86 2.72 6.81 0.1369.2 1.4 278
2 14.88 6.71 7.15 0.1328.1 1.3 681
2 14.46 5.9 7.07 0.1328.1 1.3 59.42
2 14.27 5.65 7.03 0.1328.1 1.3 56.73
2 14.19 5.29 6.97 0.1328.1 1.3 52.94
2 14.06 5.07 6.93 0.1328.1 1.3 50.65
2 14.03 5.11 6.91 0.1338.1 1.3 50.86
2 14 5.1 6.89 0.1338.1 1.3 50.87
outlet 2 14.84 7.66 7.54 0.1430.2 77.70.2
-Secchi measurements are not recorded for outlets.-A blank Secchi measurement for lake stations means that an accurate measurement could not be recorded.-A blank parameter result means the parameter could not be measured due to a meter malfunction.

AMBIENT LAKE MONITORING NETWORK
NJW04459-072
Echo LakeLake Name: SiteID: WEST MILFORD TWPMunicipality:
County: PASSAIC
Lake Profile Raw Data
Season: Spring
Station Tot Phos TKN Nitrite-Nitrate Ammonia-N Chl a(mg/L) (mg/L) (mg/L) (ug/L)(mg/L)
Alk(ppm)
Hard(ppm)
Turbidity(NTU)
1 0.016 0.585 0.006 0.008 18.1 18 37.807 3.54
2 0.024 0.662 0.006 0.007 19.4 20 36.754 3.53
outlet 1 0.049 0.673 0.093 0.004 41.6 97 127.1 3.67
outlet 2 0.035 0.769 0.015 0.014 17.5 20 38.279 3.69
Season: Summer
Station Tot Phos TKN Nitrite-Nitrate Ammonia-N Chl a(mg/L) (mg/L) (mg/L) (ug/L)(mg/L)
Alk(ppm)
Hard(ppm)
Turbidity(NTU)
1 0.032 .621 .0082 .011 13 21 38.034 4.31
2 0.041 .673 .0084 .012 13.1 21 37.529 2.92
Season: Fall
Station Tot Phos TKN Nitrite-Nitrate Ammonia-N Chl a(mg/L) (mg/L) (mg/L) (ug/L)(mg/L)
Alk(ppm)
Hard(ppm)
Turbidity(NTU)
1 0.037 0.687 0.014 0.092 23.7 24 39.076 2.23
2 0.041 0.777 0.012 0.086 32.2 25 38.570 2.57
outlet 2 0.041 0.735 0.036 0.068 25.9 28 41.653 2.42
"ND" indicates the result is at a concentration below the analytical method's Reporting Limit (RL). See Volume 1, Methods.Sample Device - Horizontal Polycarbonate Sampler
-A blank parameter result means the parameter could not be analyzed due to laboratory error.

AMBIENT LAKE MONITORING NETWORKLake Name Farrington Lake County MiddlesexSite ID NJW04459-060 Municipality East Brunswick Twp.
INSERT LAKE MAP W/ AREAL EXTENT
Carlson's Trophic Index (TSI)
Season TSIP TSIC TSIS TSI
Spring Station 1 ND 44.2 B 44.20Mesotrophic
Spring Station 2 ND 50.37 51.53 50.95Eutrophic
Spring Station 3 ND 54.21 51.53 52.87Eutrophic
SummerStation 1 63.89 41.38 B 52.64
EutrophicSummerStation 2 63.43 64.65 67.36 65.05
EutrophicSummerStation 3 63.19 64.51 65.14 64.28
EutrophicFallStation 1 59.36 47.67 63.22 56.75
EutrophicFallStation 2 62.45 49.83 64.14 59.14
EutrophicFallStation 3 57.34 56.97 61.52 58.61
Eutrophic
Total Phosphorus exceeds SWQC threshold (See Datasheet for actual concentration)ND - TP concentration below detection limitB - Secchi visible to Lake bottom. (See Datasheet for total depth)
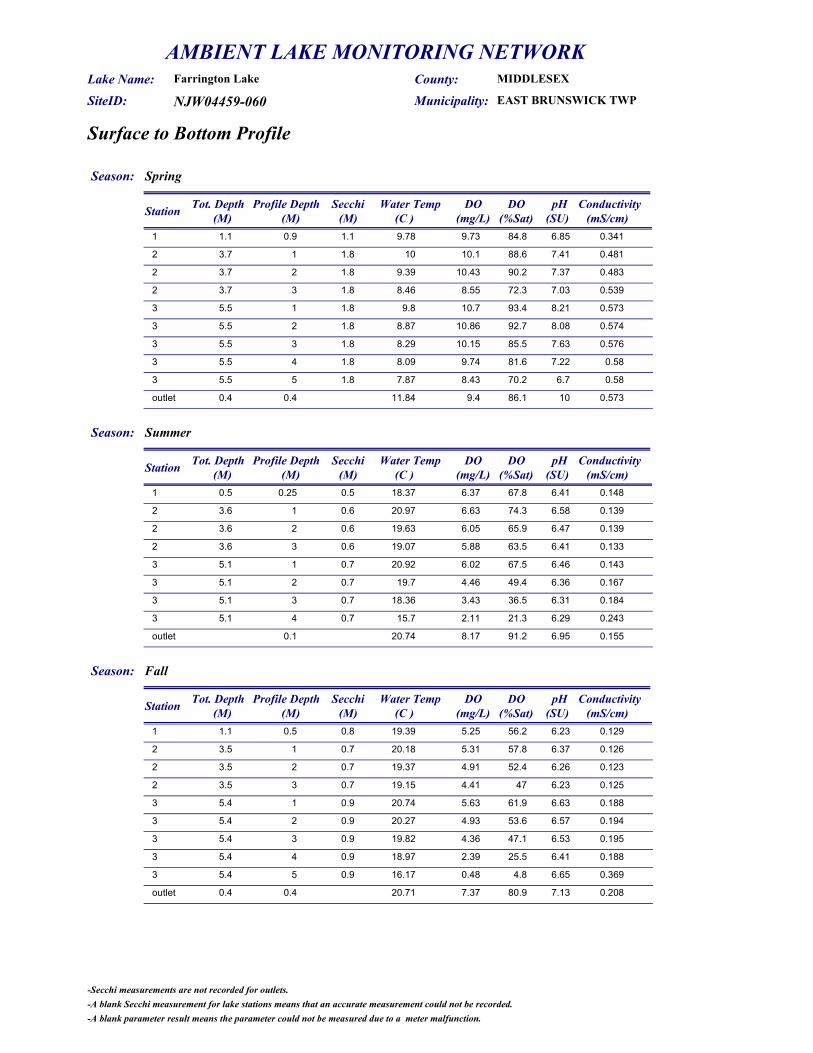
AMBIENT LAKE MONITORING NETWORK
NJW04459-060
Farrington LakeLake Name: SiteID: EAST BRUNSWICK TWPMunicipality:
County: MIDDLESEX
Surface to Bottom Profile
Season: Spring
Station Profile Depth Water Temp DO pH Conductivity(M) (C ) (SU) (mS/cm)(mg/L)
Tot. Depth(M)
Secchi(M)
DO(%Sat)
1 9.78 9.73 6.85 0.3411.1 1.1 84.80.9
2 10 10.1 7.41 0.4813.7 1.8 88.61
2 9.39 10.43 7.37 0.4833.7 1.8 90.22
2 8.46 8.55 7.03 0.5393.7 1.8 72.33
3 9.8 10.7 8.21 0.5735.5 1.8 93.41
3 8.87 10.86 8.08 0.5745.5 1.8 92.72
3 8.29 10.15 7.63 0.5765.5 1.8 85.53
3 8.09 9.74 7.22 0.585.5 1.8 81.64
3 7.87 8.43 6.7 0.585.5 1.8 70.25
outlet 11.84 9.4 10 0.5730.4 86.10.4
Season: Summer
Station Profile Depth Water Temp DO pH Conductivity(M) (C ) (SU) (mS/cm)(mg/L)
Tot. Depth(M)
Secchi(M)
DO(%Sat)
1 18.37 6.37 6.41 0.1480.5 0.5 67.80.25
2 20.97 6.63 6.58 0.1393.6 0.6 74.31
2 19.63 6.05 6.47 0.1393.6 0.6 65.92
2 19.07 5.88 6.41 0.1333.6 0.6 63.53
3 20.92 6.02 6.46 0.1435.1 0.7 67.51
3 19.7 4.46 6.36 0.1675.1 0.7 49.42
3 18.36 3.43 6.31 0.1845.1 0.7 36.53
3 15.7 2.11 6.29 0.2435.1 0.7 21.34
outlet 20.74 8.17 6.95 0.15591.20.1
Season: Fall
Station Profile Depth Water Temp DO pH Conductivity(M) (C ) (SU) (mS/cm)(mg/L)
Tot. Depth(M)
Secchi(M)
DO(%Sat)
1 19.39 5.25 6.23 0.1291.1 0.8 56.20.5
2 20.18 5.31 6.37 0.1263.5 0.7 57.81
2 19.37 4.91 6.26 0.1233.5 0.7 52.42
2 19.15 4.41 6.23 0.1253.5 0.7 473
3 20.74 5.63 6.63 0.1885.4 0.9 61.91
3 20.27 4.93 6.57 0.1945.4 0.9 53.62
3 19.82 4.36 6.53 0.1955.4 0.9 47.13
3 18.97 2.39 6.41 0.1885.4 0.9 25.54
3 16.17 0.48 6.65 0.3695.4 0.9 4.85
outlet 20.71 7.37 7.13 0.2080.4 80.90.4
-Secchi measurements are not recorded for outlets.-A blank Secchi measurement for lake stations means that an accurate measurement could not be recorded.-A blank parameter result means the parameter could not be measured due to a meter malfunction.

AMBIENT LAKE MONITORING NETWORK
NJW04459-060
Farrington LakeLake Name: SiteID: EAST BRUNSWICK TWPMunicipality:
County: MIDDLESEX
Lake Profile Raw Data
Season: Spring
Station Tot Phos TKN Nitrite-Nitrate Ammonia-N Chl a(mg/L) (mg/L) (mg/L) (ug/L)(mg/L)
Alk(ppm)
Hard(ppm)
Turbidity(NTU)
1 ND 0.333 0.903 0.025 4 6 55.506 4.32
2 ND 0.317 0.806 0.011 7.5 26 58.083 2.64
3 ND 0.331 0.749 0.011 11.1 15 57.017 2.88
outlet ND 0.302 0.748 0.017 6.6 13 56.147 2.41
Season: Summer
Station Tot Phos TKN Nitrite-Nitrate Ammonia-N Chl a(mg/L) (mg/L) (mg/L) (ug/L)(mg/L)
Alk(ppm)
Hard(ppm)
Turbidity(NTU)
1 0.063 0.966 0.336 0.157 3 8 29.713 6.31
2 0.061 0.820 0.394 0.082 31.2 16 27.494 9.61
3 0.06 0.762 0.397 0.133 31.7 16 28.519 8.33
outlet 0.055 0.773 0.404 0.134 36.7 18 29.655 9.37
Season: Fall
Station Tot Phos TKN Nitrite-Nitrate Ammonia-N Chl a(mg/L) (mg/L) (mg/L) (ug/L)(mg/L)
Alk(ppm)
Hard(ppm)
Turbidity(NTU)
1 0.046 0.600 0.615 0.100 5.7 14 24.990 8.86
2 0.057 0.525 0.602 0.051 7.1 14 24.470 14.2
3 0.04 0.547 0.379 0.161 14.7 20 34.797 8.35
outlet ND 0.760 0.311 0.136 23.4 23 39.265 10.9
"ND" indicates the result is at a concentration below the analytical method's Reporting Limit (RL). See Volume 1, Methods.Sample Device - Horizontal Polycarbonate Sampler
-A blank parameter result means the parameter could not be analyzed due to laboratory error.

AMBIENT LAKE MONITORING NETWORKLake Name Flamingo Lake County BurlingtonSite ID NJW04459-071 Municipality Evesham Twp.
INSERT LAKE MAP W/ AREAL EXTENT
Carlson's Trophic Index (TSI)
Season TSIP TSIC TSIS TSISpringStation 1 ND 42.31 B 42.31
MesotrophicSummerStation 1 48.05 71.1 69.99 63.05
EutrophicFallStation 1 ND 41.38 B 41.38
Mesotrophic
ND - TP concentration below detection limitB - Secchi visible to Lake bottom. (See Datasheet for total depth)

AMBIENT LAKE MONITORING NETWORK
NJW04459-071
Flamingo LakeLake Name: SiteID: EVESHAM TWPMunicipality:
County: BURLINGTON
Surface to Bottom Profile
Season: Spring
Station Profile Depth Water Temp DO pH Conductivity(M) (C ) (SU) (mS/cm)(mg/L)
Tot. Depth(M)
Secchi(M)
DO(%Sat)
1 15.98 8.39 6.79 0.1271 1 84.70.5
outlet 16.18 8.41 6.66 0.1280.2 85.40.2
Season: Summer
Station Profile Depth Water Temp DO pH Conductivity(M) (C ) (SU) (mS/cm)(mg/L)
Tot. Depth(M)
Secchi(M)
DO(%Sat)
1 27.98 7.08 6.83 0.0881 0.5 90.20.5
outlet 27.52 6.92 6.61 0.0890.2 87.40.2
Season: Fall
Station Profile Depth Water Temp DO pH Conductivity(M) (C ) (SU) (mS/cm)(mg/L)
Tot. Depth(M)
Secchi(M)
DO(%Sat)
1 19.73 8.11 6.27 0.1020.9 0.9 870.5
outlet 20.91 8.34 5.96 0.1020.1 91.60.1
-Secchi measurements are not recorded for outlets.-A blank Secchi measurement for lake stations means that an accurate measurement could not be recorded.-A blank parameter result means the parameter could not be measured due to a meter malfunction.

AMBIENT LAKE MONITORING NETWORK
NJW04459-071
Flamingo LakeLake Name: SiteID: EVESHAM TWPMunicipality:
County: BURLINGTON
Lake Profile Raw Data
Season: Spring
Station Tot Phos TKN Nitrite-Nitrate Ammonia-N Chl a(mg/L) (mg/L) (mg/L) (ug/L)(mg/L)
Alk(ppm)
Hard(ppm)
Turbidity(NTU)
1 ND 0.326 1.000 0.045 3.3 9 18.838 3.51
outlet 0.006 0.330 1.030 0.042 3.7 9 18.863 4.3
Season: Summer
Station Tot Phos TKN Nitrite-Nitrate Ammonia-N Chl a(mg/L) (mg/L) (mg/L) (ug/L)(mg/L)
Alk(ppm)
Hard(ppm)
Turbidity(NTU)
1 0.021 0.694 0.268 0.013 62.1 12 19.269 8.22
outlet 0.027 0.865 0.257 0.016 62.9 12 19.485 9.75
Season: Fall
Station Tot Phos TKN Nitrite-Nitrate Ammonia-N Chl a(mg/L) (mg/L) (mg/L) (ug/L)(mg/L)
Alk(ppm)
Hard(ppm)
Turbidity(NTU)
1 ND 0.442 0.830 0.170 3 10 18.068 2.97
outlet ND 0.400 0.779 0.183 2.9 10 18.011 3.4
"ND" indicates the result is at a concentration below the analytical method's Reporting Limit (RL). See Volume 1, Methods.Sample Device - Horizontal Polycarbonate Sampler
-A blank parameter result means the parameter could not be analyzed due to laboratory error.
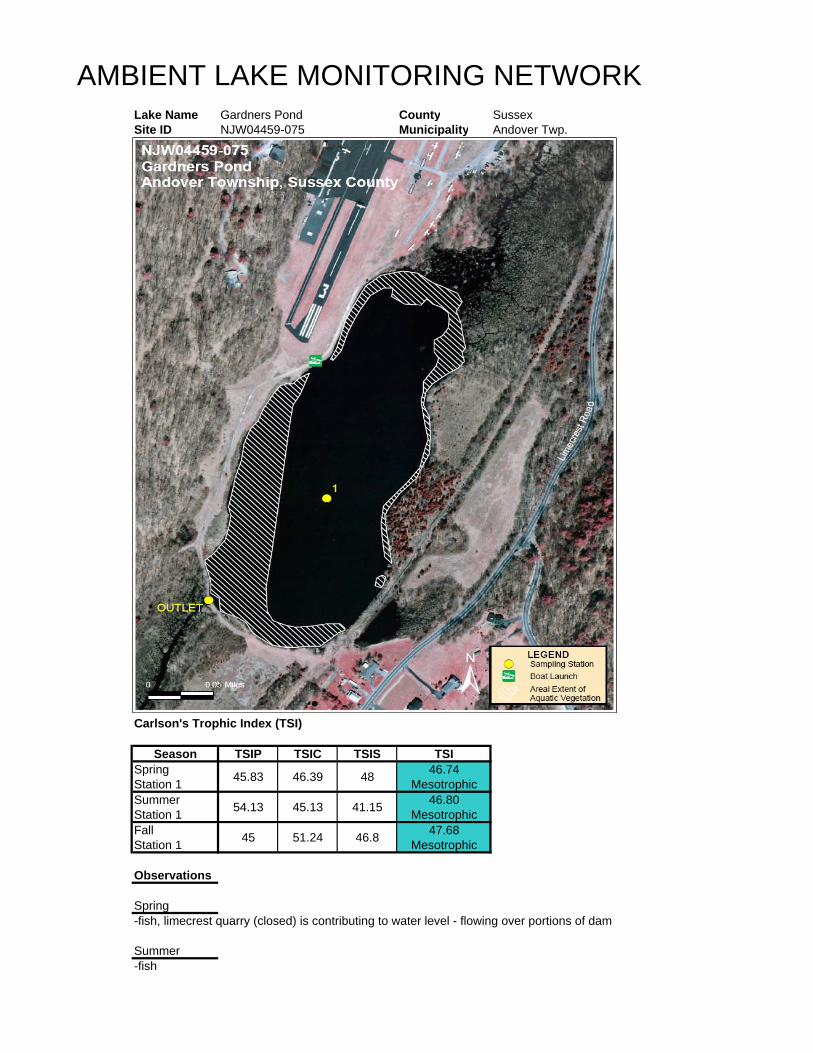
AMBIENT LAKE MONITORING NETWORKLake Name Gardners Pond County SussexSite ID NJW04459-075 Municipality Andover Twp.
INSERT LAKE MAP W/ AREAL EXTENT
Carlson's Trophic Index (TSI)
Season TSIP TSIC TSIS TSISpringStation 1 45.83 46.39 48 46.74
MesotrophicSummerStation 1 54.13 45.13 41.15 46.80
MesotrophicFallStation 1 45 51.24 46.8 47.68
Mesotrophic
Observations
Spring-fish, limecrest quarry (closed) is contributing to water level - flowing over portions of dam
Summer-fish

AMBIENT LAKE MONITORING NETWORK
NJW04459-075
Gardners PondLake Name: SiteID: ANDOVER TWPMunicipality:
County: SUSSEX
Surface to Bottom Profile
Season: Spring
Station Profile Depth Water Temp DO pH Conductivity(M) (C ) (SU) (mS/cm)(mg/L)
Tot. Depth(M)
Secchi(M)
DO(%Sat)
1 17.05 7.71 8.14 0.42710.2 2.3 82.61
1 16.87 7.61 8.13 0.42810.2 2.3 81.32
1 15.95 6.45 7.72 0.43710.2 2.3 67.63
1 13.49 9.83 8.23 0.43610.2 2.3 97.74
1 9.35 11.23 8.29 0.43710.2 2.3 101.55
1 7.42 9.4 7.87 0.44110.2 2.3 816
1 6.7 7.25 7.65 0.44110.2 2.3 61.57
1 6.16 4.56 7.45 0.44210.2 2.3 38.18
1 5.8 0.95 7.31 0.4410.2 2.3 7.99
outlet 17.51 8.06 8.19 0.4270.8 87.30.8
Season: Summer
Station Profile Depth Water Temp DO pH Conductivity(M) (C ) (SU) (mS/cm)(mg/L)
Tot. Depth(M)
Secchi(M)
DO(%Sat)
1 24.84 5.38 7.71 0.3889.5 3.7 65.81
1 24.71 5.33 7.67 0.3889.5 3.7 65.12
1 24.02 4.09 7.43 0.3919.5 3.7 49.33
1 20.13 8.7 7.85 0.3899.5 3.7 974
1 15.17 19.5 8.82 0.3569.5 3.7 196.95
1 10.71 3.51 7.45 0.3839.5 3.7 31.96
1 8.35 1.44 7.44 0.4159.5 3.7 12.67
1 7.11 0.9 7.4 0.4139.5 3.7 7.68
1 6.57 0.56 7.27 0.4189.5 3.7 4.79
outlet 24.72 4.09 7.45 0.3880.3 500.3
Season: Fall
Station Profile Depth Water Temp DO pH Conductivity(M) (C ) (SU) (mS/cm)(mg/L)
Tot. Depth(M)
Secchi(M)
DO(%Sat)
1 16.86 6.63 7.86 0.4258.9 2.5 70.31
1 16.19 6.4 7.72 0.4238.9 2.5 67.12
1 15.75 6.35 7.69 0.4248.9 2.5 65.73
1 15.41 5.36 7.57 0.4248.9 2.5 55.14
1 14.96 3.95 7.41 0.4248.9 2.5 40.35
1 13.59 0.58 7.18 0.4238.9 2.5 5.86
1 10.07 0.43 7.34 0.488.9 2.5 3.87
1 8.03 0.32 7.31 0.4828.9 2.5 2.88
outlet 16.55 5.13 7.62 0.4280.6 540.6
-Secchi measurements are not recorded for outlets.-A blank Secchi measurement for lake stations means that an accurate measurement could not be recorded.-A blank parameter result means the parameter could not be measured due to a meter malfunction.

AMBIENT LAKE MONITORING NETWORK
NJW04459-075
Gardners PondLake Name: SiteID: ANDOVER TWPMunicipality:
County: SUSSEX
Lake Profile Raw Data
Season: Spring
Station Tot Phos TKN Nitrite-Nitrate Ammonia-N Chl a(mg/L) (mg/L) (mg/L) (ug/L)(mg/L)
Alk(ppm)
Hard(ppm)
Turbidity(NTU)
1 0.018 0.518 0.006 0.004 5 1 173.0 1.06
outlet 0.006 0.525 0.006 0.007 4.8 1 173.7 1.6
Season: Summer
Station Tot Phos TKN Nitrite-Nitrate Ammonia-N Chl a(mg/L) (mg/L) (mg/L) (ug/L)(mg/L)
Alk(ppm)
Hard(ppm)
Turbidity(NTU)
1 0.032 0.394 .0059 .008 4.4 151 175.800 0.9
outlet 0.048 0.916 .0144 .023 4.9 150 186.748 7.74
Season: Fall
Station Tot Phos TKN Nitrite-Nitrate Ammonia-N Chl a(mg/L) (mg/L) (mg/L) (ug/L)(mg/L)
Alk(ppm)
Hard(ppm)
Turbidity(NTU)
1 0.017 0.343 0.003 0.007 8.2 150.0 170.9 1.22
outlet 0.023 0.335 0.003 0.007 5.8 143.0 169.6 1.41
"ND" indicates the result is at a concentration below the analytical method's Reporting Limit (RL). See Volume 1, Methods.Sample Device - Horizontal Polycarbonate Sampler
-A blank parameter result means the parameter could not be analyzed due to laboratory error.

AMBIENT LAKE MONITORING NETWORKLake Name Greenwood Lake County PassaicSite ID NJW04459-049 Municipality West Milford Twp.
Carlson's Trophic Index (TSI)
Season TSIP TSIC TSIS TSI
Spring Station 1 56.22 51.36 46.23 51.27Eutrophic
Spring Station 2 34.14 36.9 O 35.52Oligotrophic
Spring Station 3 44.13 54.12 O 49.13Mesotrophic
SummerStation 1 47.35 61.69 53.23 54.09
EutrophicSummerStation 2 56.6 63.87 61.52 60.66
EutrophicSummerStation 3 64.78 66.08 61.52 64.13
EutrophicFallStation 1 ND 55.22 51.53 53.37
EutrophicFallStation 2 38.73 53.76 52.35 48.28
MesotrophicFallStation 3 54.13 58.45 61.52 58.03
Eutrophic
Total Phosphorus exceeds SWQC threshold (See Datasheet for actual concentration)ND - TP concentration below detection limitO - Secchi obstructed by vegetation.
Observations
Spring-outlet sampled at USGS gauging station on Wanaque River downtstream of dam
Fall-SAV

AMBIENT LAKE MONITORING NETWORK
NJW04459-049
Greenwood LakeLake Name: SiteID: WEST MILFORD TWPMunicipality:
County: PASSAIC
Surface to Bottom Profile
Season: Spring
Station Profile Depth Water Temp DO pH Conductivity(M) (C ) (SU) (mS/cm)(mg/L)
Tot. Depth(M)
Secchi(M)
DO(%Sat)
1 21.6 9.35 8.55 0.2067 2.6 106.71
1 20.12 9.52 8.44 0.2067 2.6 105.42
1 18.23 9.33 8.17 0.2077 2.6 99.53
1 17.47 8.29 7.85 0.2077 2.6 87.24
1 15.16 6 7.49 0.2077 2.6 59.85
1 14.16 5.01 7.22 0.2087 2.6 49.16
2 21.38 8.93 9.5 0.2212.7 2.6 101.51
2 15.13 1.58 7.56 0.2342.7 2.6 15.82
3 21.13 5.64 7.68 0.1971.8 1.7 63.41
outlet 22.92 7.1 9.21 0.2190.3 83.10.1
Season: Summer
Station Profile Depth Water Temp DO pH Conductivity(M) (C ) (SU) (mS/cm)(mg/L)
Tot. Depth(M)
Secchi(M)
DO(%Sat)
1 22.23 6.87 7.52 0.1837.2 1.6 79.21
1 22.22 6.86 7.47 0.1837.2 1.6 792
1 22.18 6.84 7.44 0.1837.2 1.6 78.83
1 22.14 6.83 7.42 0.1837.2 1.6 78.54
1 22.1 6.75 7.41 0.1837.2 1.6 77.65
1 22 6.75 7.39 0.1837.2 1.6 77.46
1 21.99 0.67 6.96 0.2057.2 1.6 7.77
2 21.13 6.64 7.3 0.1812.8 0.9 74.91
2 21.14 6.48 7.28 0.1812.8 0.9 73.12
3 20.12 7.52 7.46 0.1762 0.9 83.21
3 21.14 6.48 7.28 0.1812 0.9 73.12
outlet 20.87 7.47 7.55 0.1830.7 83.80.7
Season: Fall
Station Profile Depth Water Temp DO pH Conductivity(M) (C ) (SU) (mS/cm)(mg/L)
Tot. Depth(M)
Secchi(M)
DO(%Sat)
1 11.89 8.18 7.51 0.1677.2 1.8 77.31
1 11.67 7.73 7.29 0.1667.2 1.8 72.62
1 11.53 7.96 7.23 0.1667.2 1.8 74.63
1 11.48 8 7.21 0.1667.2 1.8 754
1 11.46 8.04 7.2 0.1667.2 1.8 75.25
1 10.38 8.63 7.25 0.1667.2 1.8 78.86
2 8.98 8.86 7.28 0.1572.5 1.7 78.21
2 8.85 8.61 7.2 0.1562.5 1.7 75.92
3 8.43 9.12 7.22 0.141.7 0.9 79.41
outlet 8.71 9.51 7.2 0.1530.7 83.40.4
-Secchi measurements are not recorded for outlets.-A blank Secchi measurement for lake stations means that an accurate measurement could not be recorded.-A blank parameter result means the parameter could not be measured due to a meter malfunction.

AMBIENT LAKE MONITORING NETWORK
NJW04459-049
Greenwood LakeLake Name: SiteID: WEST MILFORD TWPMunicipality:
County: PASSAIC
Lake Profile Raw Data
Season: Spring
Station Tot Phos TKN Nitrite-Nitrate Ammonia-N Chl a(mg/L) (mg/L) (mg/L) (ug/L)(mg/L)
Alk(ppm)
Hard(ppm)
Turbidity(NTU)
1 0.037 0.452 0.006 0.009 8.3 31 44.961 1.66
2 0.008 0.284 0.006 0.009 1.9 28 46.449 0.83
3 0.016 0.404 0.008 0.017 11 31 49.427 2.96
outlet 0.042 0.363 0.012 0.028 1.9 26 47.819 1.09
Season: Summer
Station Tot Phos TKN Nitrite-Nitrate Ammonia-N Chl a(mg/L) (mg/L) (mg/L) (ug/L)(mg/L)
Alk(ppm)
Hard(ppm)
Turbidity(NTU)
1 0.02 0.491 0.006 0.019 23.8 29 45.293 3.63
2 0.038 0.667 0.033 0.070 29.7 29 45.582 7.27
3 0.067 0.793 0.083 0.055 37.2 30 43.000 8.69
outlet 0.051 0.649 0.051 0.085 30.7 29 41.756 7.85
Season: Fall
Station Tot Phos TKN Nitrite-Nitrate Ammonia-N Chl a(mg/L) (mg/L) (mg/L) (ug/L)(mg/L)
Alk(ppm)
Hard(ppm)
Turbidity(NTU)
1 ND 0.425 0.041 0.173 12.3 31 44.627 2.06
2 0.011 0.357 0.048 0.043 10.6 30 42.459 3.21
3 0.032 0.382 0.074 0.026 17.1 30 44.570 7.24
outlet 0.024 0.352 0.046 0.032 13.5 34 43.458 4.02
"ND" indicates the result is at a concentration below the analytical method's Reporting Limit (RL). See Volume 1, Methods.Sample Device - Horizontal Polycarbonate Sampler
-A blank parameter result means the parameter could not be analyzed due to laboratory error.

AMBIENT LAKE MONITORING NETWORKLake Name Harrisville Lake County BurlingtonSite ID NJW04459-057 Municipality Washington Twp.
INSERT LAKE MAP W/ AREAL EXTENT
Carlson's Trophic Index (TSI)
Season TSIP TSIC TSIS TSISpringStation 1 ND 34.58 B 34.58
OligotrophicSpringStation 2 32.21 28.41 B 30.31
OligotrophicSummerStation 1 54.57 44.91 O 49.74
MesotrophicSummerStation 2 39.98 35.81 54.16 43.32
MesotrophicFallStation 1 ND 28.41 B 28.41
OligotrophicFallStation 2 ND 31.53 61.52 46.53
Mesotrophic
ND - TP concentration below detection limitB - Secchi visible to Lake bottom. (See Datasheet for total depth)O - Secchi obstructed by vegetation.
Observations
Summer-fish, SAV
Fall-filamentous algae mats

AMBIENT LAKE MONITORING NETWORK
NJW04459-057
Harrisville LakeLake Name: SiteID: WASHINGTON TWPMunicipality:
County: BURLINGTON
Surface to Bottom Profile
Season: Spring
Station Profile Depth Water Temp DO pH Conductivity(M) (C ) (SU) (mS/cm)(mg/L)
Tot. Depth(M)
Secchi(M)
DO(%Sat)
1 14.63 9.22 4.39 0.0330.6 0.6 91.50.3
2 14.75 8.68 4.41 0.0350.7 0.7 86.30.4
outlet 1 14.77 8.91 4.47 0.0340.2 88.70.2
outlet 2 15.21 9.06 4.39 0.0340.4 910.4
Season: Summer
Station Profile Depth Water Temp DO pH Conductivity(M) (C ) (SU) (mS/cm)(mg/L)
Tot. Depth(M)
Secchi(M)
DO(%Sat)
1 26.04 5.77 4.17 0.0350.8 0.8 70.50.4
2 27.39 5.05 4.13 0.041.9 1.5 63.21
outlet 1 28.03 5.64 4.16 0.0380.4 71.50.1
outlet 2 28.15 6.18 4.12 0.0390.4 78.40.1
Season: Fall
Station Profile Depth Water Temp DO pH Conductivity(M) (C ) (SU) (mS/cm)(mg/L)
Tot. Depth(M)
Secchi(M)
DO(%Sat)
1 14.07 7.66 4.28 0.0360.6 0.6 730.3
2 16.29 7.66 4.26 0.0381.1 0.9 76.60.5
outlet 1 15.9 8.17 4.22 0.0370.2 810.2
outlet 2 16.28 8.9 4.26 0.0370.2 890.2
-Secchi measurements are not recorded for outlets.-A blank Secchi measurement for lake stations means that an accurate measurement could not be recorded.-A blank parameter result means the parameter could not be measured due to a meter malfunction.

AMBIENT LAKE MONITORING NETWORK
NJW04459-057
Harrisville LakeLake Name: SiteID: WASHINGTON TWPMunicipality:
County: BURLINGTON
Lake Profile Raw Data
Season: Spring
Station Tot Phos TKN Nitrite-Nitrate Ammonia-N Chl a(mg/L) (mg/L) (mg/L) (ug/L)(mg/L)
Alk(ppm)
Hard(ppm)
Turbidity(NTU)
1 ND 0.260 0.006 0.012 1.5 1 2.989 1.94
2 0.007 0.209 0.006 0.020 0.8 1 2.913 1.64
outlet 1 ND 0.147 0.006 0.020 1 1 3.028 2.02
outlet 2 ND 0.122 0.006 0.022 1.1 1 2.976 1.84
Season: Summer
Station Tot Phos TKN Nitrite-Nitrate Ammonia-N Chl a(mg/L) (mg/L) (mg/L) (ug/L)(mg/L)
Alk(ppm)
Hard(ppm)
Turbidity(NTU)
1 0.033 0.156 0.006 0.011 4.3 1 2.742 3.72
2 0.012 0.120 0.006 0.008 1.7 1 2.717 2.97
outlet 1 ND 0.127 0.006 0.009 1.5 1 2.717 2.93
outlet 2 0.01 0.116 0.007 0.018 2 1 2.793 3.3
Season: Fall
Station Tot Phos TKN Nitrite-Nitrate Ammonia-N Chl a(mg/L) (mg/L) (mg/L) (ug/L)(mg/L)
Alk(ppm)
Hard(ppm)
Turbidity(NTU)
1 ND 0.134 0.004 0.026 0.8 1 2.603 1.95
2 ND 0.085 0.002 0.026 1.1 1 2.688 2.17
outlet 1 0.011 0.065 0.002 0.028 0.9 1 2.735 2.06
outlet 2 0.018 0.167 0.007 0.025 3.3 1 2.786 2.94
"ND" indicates the result is at a concentration below the analytical method's Reporting Limit (RL). See Volume 1, Methods.Sample Device - Horizontal Polycarbonate Sampler
-A blank parameter result means the parameter could not be analyzed due to laboratory error.

AMBIENT LAKE MONITORING NETWORKLake Name Irisado Lake County OceanSite ID NJW04459-077 Municipality Brick Twp.
INSERT LAKE MAP W/ AREAL EXTENT
Carlson's Trophic Index (TSI)
Season TSIP TSIC TSIS TSISpringStation 1 34.14 42.89 B 38.51
OligotrophicSpringStation 2 37.35 41.38 B 39.37
OligotrophicSummerStation 1 ND 57.92 58.63 58.27
EutrophicSummerStation 2 54.57 61.9 B 58.23
EutrophicFallStation 1 52.2 59.28 B 55.74
EutrophicFallStation 2 49.36 58.95 57.37 55.23
Eutrophic
ND - TP concentration below detection limitB - Secchi visible to Lake bottom. (See Datasheet for total depth)
Observations
Spring-2 piped outlets, 1 on private property and not able to sample, cedar water
Summer-cedar water, fish
Fall-numerous waterfowl, some SAV

AMBIENT LAKE MONITORING NETWORK
NJW04459-077
Irisado LakeLake Name: SiteID: BRICK TWPMunicipality:
County: OCEAN
Surface to Bottom Profile
Season: Spring
Station Profile Depth Water Temp DO pH Conductivity(M) (C ) (SU) (mS/cm)(mg/L)
Tot. Depth(M)
Secchi(M)
DO(%Sat)
1 16.63 7.83 6.33 0.1621.1 1.1 81.20.5
2 17.16 7.75 6.68 0.161.7 1.7 81.41
Season: Summer
Station Profile Depth Water Temp DO pH Conductivity(M) (C ) (SU) (mS/cm)(mg/L)
Tot. Depth(M)
Secchi(M)
DO(%Sat)
1 26.49 5.92 6.58 0.1191.2 1.1 73.70.5
2 26.74 5.95 6.72 0.1111.3 1.3 74.31
Season: Fall
Station Profile Depth Water Temp DO pH Conductivity(M) (C ) (SU) (mS/cm)(mg/L)
Tot. Depth(M)
Secchi(M)
DO(%Sat)
1 21.65 5.3 6.79 0.1111.1 1.1 60.81
2 21.88 5.57 6.72 0.1021.5 1.2 64.41
-Secchi measurements are not recorded for outlets.-A blank Secchi measurement for lake stations means that an accurate measurement could not be recorded.-A blank parameter result means the parameter could not be measured due to a meter malfunction.

AMBIENT LAKE MONITORING NETWORK
NJW04459-077
Irisado LakeLake Name: SiteID: BRICK TWPMunicipality:
County: OCEAN
Lake Profile Raw Data
Season: Spring
Station Tot Phos TKN Nitrite-Nitrate Ammonia-N Chl a(mg/L) (mg/L) (mg/L) (ug/L)(mg/L)
Alk(ppm)
Hard(ppm)
Turbidity(NTU)
1 0.008 0.305 0.735 0.042 3.5 9 18.405 1.66
2 0.01 0.278 0.552 0.047 3 10 17.877 1.26
outlet 0.011 0.299 0.551 0.049 2.5 10 17.870 1.51
Season: Summer
Station Tot Phos TKN Nitrite-Nitrate Ammonia-N Chl a(mg/L) (mg/L) (mg/L) (ug/L)(mg/L)
Alk(ppm)
Hard(ppm)
Turbidity(NTU)
1 ND .392 .259 .062 16.2 12 18.312 1.94
2 0.033 .415 .107 .047 24.3 11 17.086 2.3
outlet 0.034 .559 .103 .069 39.7 11 17.103 2.81
Season: Fall
Station Tot Phos TKN Nitrite-Nitrate Ammonia-N Chl a(mg/L) (mg/L) (mg/L) (ug/L)(mg/L)
Alk(ppm)
Hard(ppm)
Turbidity(NTU)
1 0.028 0.456 0.291 0.083 18.6 12 17.062 5.07
2 0.023 0.512 0.230 0.103 18 10 15.255 2.53
outlet 0.023 0.486 0.241 0.099 11 15.305 2.24
"ND" indicates the result is at a concentration below the analytical method's Reporting Limit (RL). See Volume 1, Methods.Sample Device - Horizontal Polycarbonate Sampler
-A blank parameter result means the parameter could not be analyzed due to laboratory error.
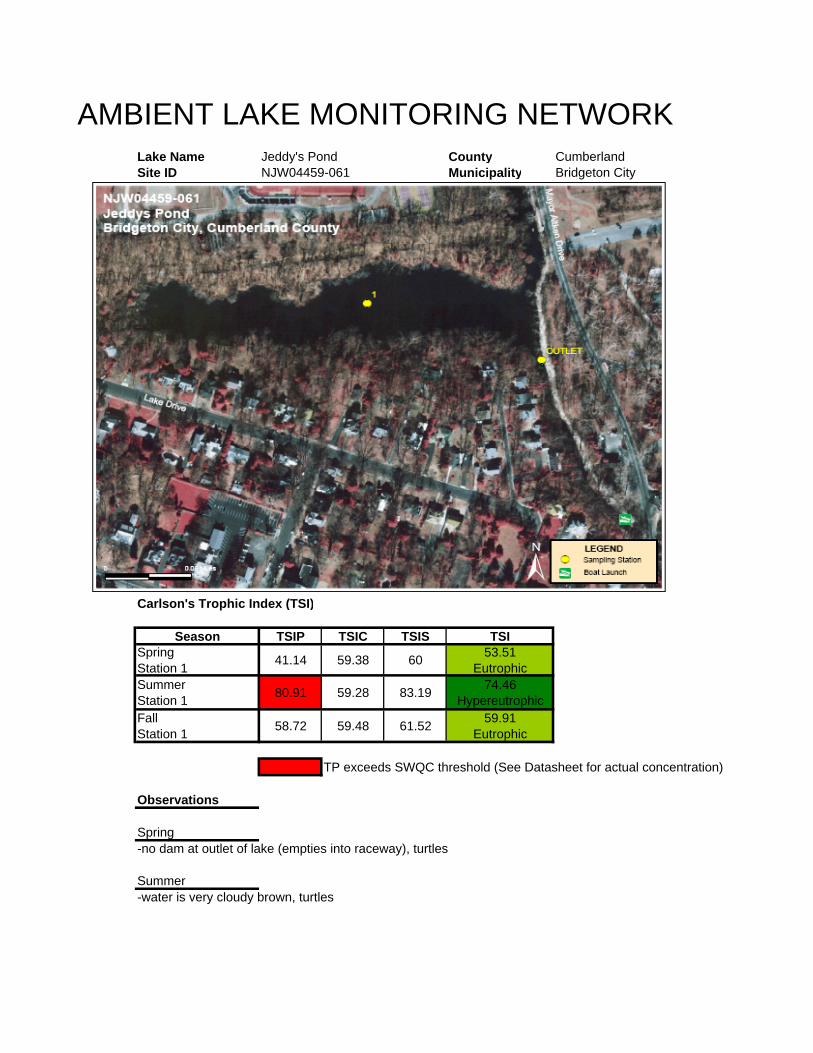
AMBIENT LAKE MONITORING NETWORKLake Name Jeddy's Pond County CumberlandSite ID NJW04459-061 Municipality Bridgeton City
Carlson's Trophic Index (TSI)
Season TSIP TSIC TSIS TSISpringStation 1 41.14 59.38 60 53.51
EutrophicSummerStation 1 80.91 59.28 83.19 74.46
HypereutrophicFallStation 1 58.72 59.48 61.52 59.91
Eutrophic
TP exceeds SWQC threshold (See Datasheet for actual concentration)
Observations
Spring-no dam at outlet of lake (empties into raceway), turtles
Summer-water is very cloudy brown, turtles
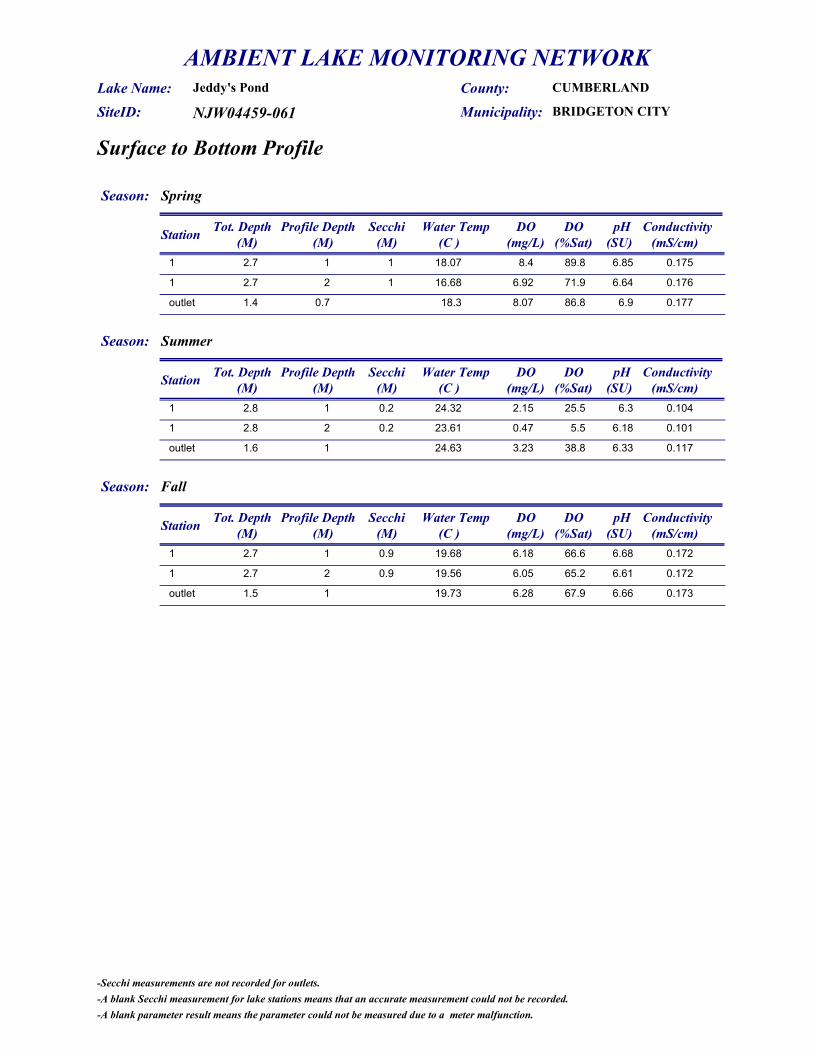
AMBIENT LAKE MONITORING NETWORK
NJW04459-061
Jeddy's PondLake Name: SiteID: BRIDGETON CITYMunicipality:
County: CUMBERLAND
Surface to Bottom Profile
Season: Spring
Station Profile Depth Water Temp DO pH Conductivity(M) (C ) (SU) (mS/cm)(mg/L)
Tot. Depth(M)
Secchi(M)
DO(%Sat)
1 18.07 8.4 6.85 0.1752.7 1 89.81
1 16.68 6.92 6.64 0.1762.7 1 71.92
outlet 18.3 8.07 6.9 0.1771.4 86.80.7
Season: Summer
Station Profile Depth Water Temp DO pH Conductivity(M) (C ) (SU) (mS/cm)(mg/L)
Tot. Depth(M)
Secchi(M)
DO(%Sat)
1 24.32 2.15 6.3 0.1042.8 0.2 25.51
1 23.61 0.47 6.18 0.1012.8 0.2 5.52
outlet 24.63 3.23 6.33 0.1171.6 38.81
Season: Fall
Station Profile Depth Water Temp DO pH Conductivity(M) (C ) (SU) (mS/cm)(mg/L)
Tot. Depth(M)
Secchi(M)
DO(%Sat)
1 19.68 6.18 6.68 0.1722.7 0.9 66.61
1 19.56 6.05 6.61 0.1722.7 0.9 65.22
outlet 19.73 6.28 6.66 0.1731.5 67.91
-Secchi measurements are not recorded for outlets.-A blank Secchi measurement for lake stations means that an accurate measurement could not be recorded.-A blank parameter result means the parameter could not be measured due to a meter malfunction.
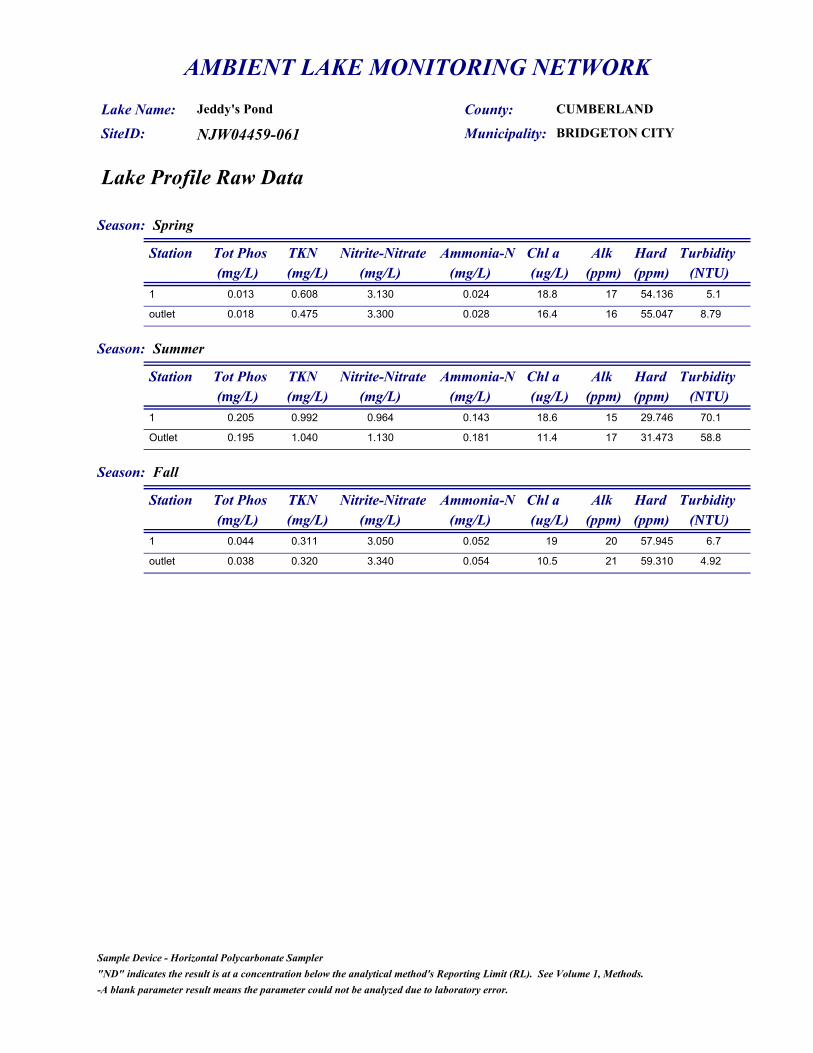
AMBIENT LAKE MONITORING NETWORK
NJW04459-061
Jeddy's PondLake Name: SiteID: BRIDGETON CITYMunicipality:
County: CUMBERLAND
Lake Profile Raw Data
Season: Spring
Station Tot Phos TKN Nitrite-Nitrate Ammonia-N Chl a(mg/L) (mg/L) (mg/L) (ug/L)(mg/L)
Alk(ppm)
Hard(ppm)
Turbidity(NTU)
1 0.013 0.608 3.130 0.024 18.8 17 54.136 5.1
outlet 0.018 0.475 3.300 0.028 16.4 16 55.047 8.79
Season: Summer
Station Tot Phos TKN Nitrite-Nitrate Ammonia-N Chl a(mg/L) (mg/L) (mg/L) (ug/L)(mg/L)
Alk(ppm)
Hard(ppm)
Turbidity(NTU)
1 0.205 0.992 0.964 0.143 18.6 15 29.746 70.1
Outlet 0.195 1.040 1.130 0.181 11.4 17 31.473 58.8
Season: Fall
Station Tot Phos TKN Nitrite-Nitrate Ammonia-N Chl a(mg/L) (mg/L) (mg/L) (ug/L)(mg/L)
Alk(ppm)
Hard(ppm)
Turbidity(NTU)
1 0.044 0.311 3.050 0.052 19 20 57.945 6.7
outlet 0.038 0.320 3.340 0.054 10.5 21 59.310 4.92
"ND" indicates the result is at a concentration below the analytical method's Reporting Limit (RL). See Volume 1, Methods.Sample Device - Horizontal Polycarbonate Sampler
-A blank parameter result means the parameter could not be analyzed due to laboratory error.

AMBIENT LAKE MONITORING NETWORKLake Name Keswick Lake County OceanSite ID NJW04459-042 Municipality Manchester Twp.
INSERT LAKE MAP W/ AREAL EXTENT
Carlson's Trophic Index (TSI)
Season TSIP TSIC TSIS TSISpringStation 1 ND 39.97 B 39.97
OligotrophicSummerStation 1 57.34 45.13 B 51.24
EutrophicFallStation 1 ND 37.88 B 37.88
Oligotrophic
ND - TP concentration below detection limitB - Secchi visible to Lake bottom. (See Datasheet for total depth)
Observations
Spring-SAV, water lillies (spadderdock), turtles, water snake, swan
Summer-ducks, turtles, sunfish, swan, water cedar brown
Fall-SAV throughout

AMBIENT LAKE MONITORING NETWORK
NJW04459-042
Keswick LakeLake Name: SiteID: MANCHESTER TWPMunicipality:
County: OCEAN
Surface to Bottom Profile
Season: Spring
Station Profile Depth Water Temp DO pH Conductivity(M) (C ) (SU) (mS/cm)(mg/L)
Tot. Depth(M)
Secchi(M)
DO(%Sat)
1 17.86 6.71 5.82 0.0981.9 1.9 72.11
outlet 20.3 7.52 6.11 0.1010.1 71.60.1
Season: Summer
Station Profile Depth Water Temp DO pH Conductivity(M) (C ) (SU) (mS/cm)(mg/L)
Tot. Depth(M)
Secchi(M)
DO(%Sat)
1 25 8.33 5.88 0.0911.7 1.7 99.21
outlet 25.27 6.57 5.97 0.0940.1 78.70.1
Season: Fall
Station Profile Depth Water Temp DO pH Conductivity(M) (C ) (SU) (mS/cm)(mg/L)
Tot. Depth(M)
Secchi(M)
DO(%Sat)
1 11.4 8.88 5.65 0.0831.7 1.7 79.51
outlet 12.63 9.43 5.8 0.0850.1 86.80.1
-Secchi measurements are not recorded for outlets.-A blank Secchi measurement for lake stations means that an accurate measurement could not be recorded.-A blank parameter result means the parameter could not be measured due to a meter malfunction.

AMBIENT LAKE MONITORING NETWORK
NJW04459-042
Keswick LakeLake Name: SiteID: MANCHESTER TWPMunicipality:
County: OCEAN
Lake Profile Raw Data
Season: Spring
Station Tot Phos TKN Nitrite-Nitrate Ammonia-N Chl a(mg/L) (mg/L) (mg/L) (ug/L)(mg/L)
Alk(ppm)
Hard(ppm)
Turbidity(NTU)
1 ND 0.423 0.138 0.026 2.6 3 12.533 1.77
outlet 0.016 0.307 0.144 0.033 2.6 4 12.674 2.23
Season: Summer
Station Tot Phos TKN Nitrite-Nitrate Ammonia-N Chl a(mg/L) (mg/L) (mg/L) (ug/L)(mg/L)
Alk(ppm)
Hard(ppm)
Turbidity(NTU)
1 0.04 .463 .0079 .010 4.4 5 13.404 1.49
outlet 0.017 0.496 .0507 .041 5.6 5 13.821 2.93
Season: Fall
Station Tot Phos TKN Nitrite-Nitrate Ammonia-N Chl a(mg/L) (mg/L) (mg/L) (ug/L)(mg/L)
Alk(ppm)
Hard(ppm)
Turbidity(NTU)
1 ND 0.280 0.153 0.019 2.1 4 12.083 0.8
outlet 0.021 0.315 0.133 0.024 1.6 4 12.249 0.93
"ND" indicates the result is at a concentration below the analytical method's Reporting Limit (RL). See Volume 1, Methods.Sample Device - Horizontal Polycarbonate Sampler
-A blank parameter result means the parameter could not be analyzed due to laboratory error.
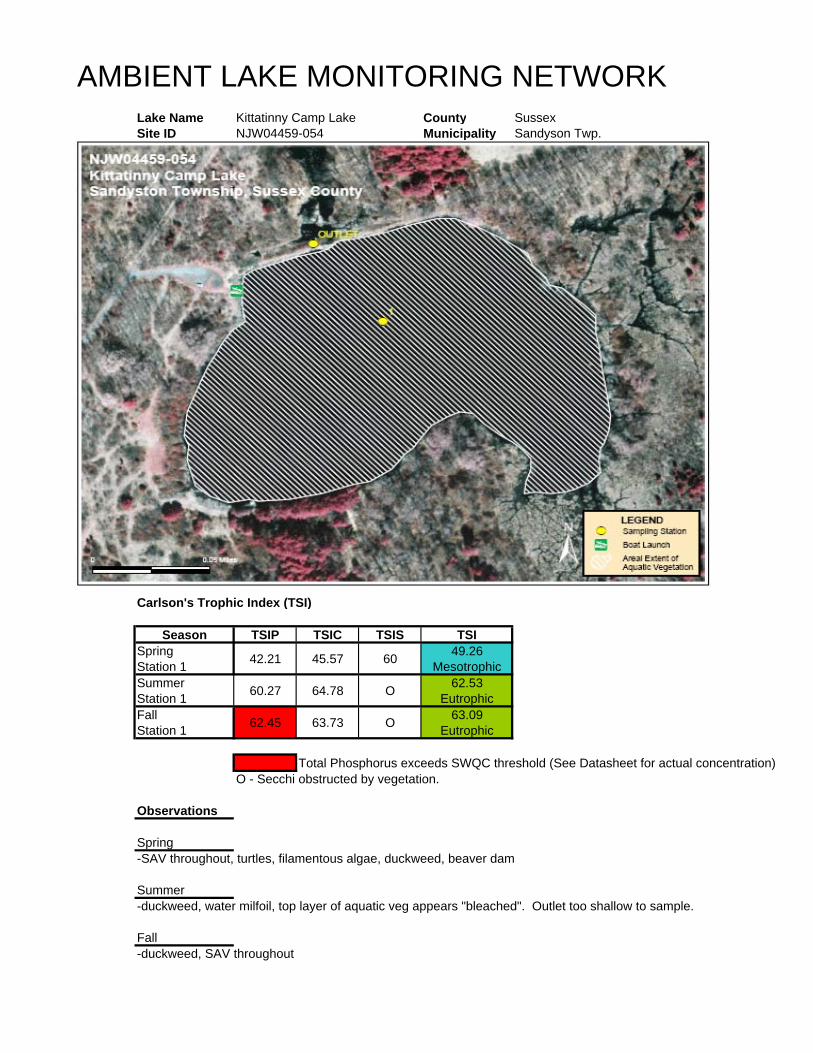
AMBIENT LAKE MONITORING NETWORKLake Name Kittatinny Camp Lake County SussexSite ID NJW04459-054 Municipality Sandyson Twp.
INSERT LAKE MAP W/ AREAL EXTENT
Carlson's Trophic Index (TSI)
Season TSIP TSIC TSIS TSISpringStation 1 42.21 45.57 60 49.26
MesotrophicSummerStation 1 60.27 64.78 O 62.53
EutrophicFallStation 1 62.45 63.73 O 63.09
Eutrophic
Total Phosphorus exceeds SWQC threshold (See Datasheet for actual concentration)O - Secchi obstructed by vegetation.
Observations
Spring-SAV throughout, turtles, filamentous algae, duckweed, beaver dam
Summer-duckweed, water milfoil, top layer of aquatic veg appears "bleached". Outlet too shallow to sample.
Fall-duckweed, SAV throughout

AMBIENT LAKE MONITORING NETWORK
NJW04459-054
Kittatinny Camp LakeLake Name: SiteID: SANDYSTON TWPMunicipality:
County: SUSSEX
Surface to Bottom Profile
Season: Spring
Station Profile Depth Water Temp DO pH Conductivity(M) (C ) (SU) (mS/cm)(mg/L)
Tot. Depth(M)
Secchi(M)
DO(%Sat)
1 14.27 11.15 8.76 0.2211.5 1 1121
outlet 16.01 7.6 8.31 0.2290.1 79.30.1
Season: Summer
Station Profile Depth Water Temp DO pH Conductivity(M) (C ) (SU) (mS/cm)(mg/L)
Tot. Depth(M)
Secchi(M)
DO(%Sat)
1 20.29 0.81 6.84 0.2521.7 0.5 9.21
Season: Fall
Station Profile Depth Water Temp DO pH Conductivity(M) (C ) (SU) (mS/cm)(mg/L)
Tot. Depth(M)
Secchi(M)
DO(%Sat)
1 16.21 0.92 7.12 0.2051.6 0.5 9.41.1
outlet 17.04 5.11 7.57 0.2390.1 53.50.1
-Secchi measurements are not recorded for outlets.-A blank Secchi measurement for lake stations means that an accurate measurement could not be recorded.-A blank parameter result means the parameter could not be measured due to a meter malfunction.

AMBIENT LAKE MONITORING NETWORK
NJW04459-054
Kittatinny Camp LakeLake Name: SiteID: SANDYSTON TWPMunicipality:
County: SUSSEX
Lake Profile Raw Data
Season: Spring
Station Tot Phos TKN Nitrite-Nitrate Ammonia-N Chl a(mg/L) (mg/L) (mg/L) (ug/L)(mg/L)
Alk(ppm)
Hard(ppm)
Turbidity(NTU)
1 0.014 0.347 0.006 0.023 4.6 87 103.7 2.77
outlet 0.086 1.930 0.007 0.041 29.8 88 104.0 6.99
Season: Summer
Station Tot Phos TKN Nitrite-Nitrate Ammonia-N Chl a(mg/L) (mg/L) (mg/L) (ug/L)(mg/L)
Alk(ppm)
Hard(ppm)
Turbidity(NTU)
1 0.049 0.790 0.006 0.039 32.6 78 100.6 8.7
outlet ND 0.467 0.013 0.044 3.2 83 98.401 1.79
Season: Fall
Station Tot Phos TKN Nitrite-Nitrate Ammonia-N Chl a(mg/L) (mg/L) (mg/L) (ug/L)(mg/L)
Alk(ppm)
Hard(ppm)
Turbidity(NTU)
1 0.057 1.100 0.002 0.033 29.3 102.0 119.5 9.87
outlet 0.038 0.343 0.035 0.047 5.1 124.0 129.9 2.7
"ND" indicates the result is at a concentration below the analytical method's Reporting Limit (RL). See Volume 1, Methods.Sample Device - Horizontal Polycarbonate Sampler
-A blank parameter result means the parameter could not be analyzed due to laboratory error.

AMBIENT LAKE MONITORING NETWORKLake Name Lake 31A County SomersetSite ID NJW04459-242 Municipality Hillsborough Twp.
INSERT LAKE MAP W/ AREAL EXTENT
Carlson's Trophic Index (TSI)
Season TSIP TSIC TSIS TSISpringStation 1 64.56 45.35 B 54.96
EutrophicSpringStation 2 73.89 47.32 B 60.61
EutrophicSummerStation 1 76.11 77.48 69.99 74.53
HypereutrophicSummerStation 2 79.43 79.37 73.2 77.34
HypereutrophicFallStation 1 76.4 58.51 B 67.46
EutrophicFallStation 2 78.12 60.79 63.22 67.38
Eutrophic
Total Phosphorus exceeds SWQC threshold (See Datasheet for actual concentration)B - Secchi visible to Lake bottom. (See Datasheet for total depth)
Observations
Spring-excessive algae growth, SAV, turtles, fish
Fall-some duckweed, small clumps of algae throughout
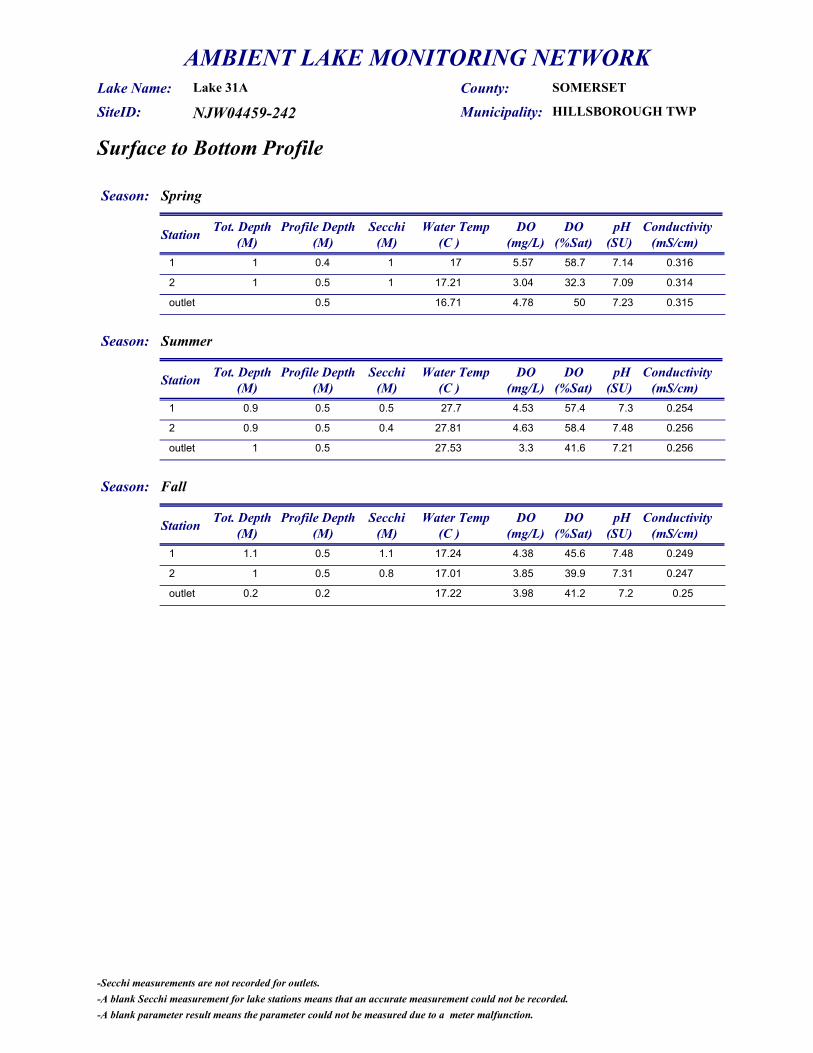
AMBIENT LAKE MONITORING NETWORK
NJW04459-242
Lake 31ALake Name: SiteID: HILLSBOROUGH TWPMunicipality:
County: SOMERSET
Surface to Bottom Profile
Season: Spring
Station Profile Depth Water Temp DO pH Conductivity(M) (C ) (SU) (mS/cm)(mg/L)
Tot. Depth(M)
Secchi(M)
DO(%Sat)
1 17 5.57 7.14 0.3161 1 58.70.4
2 17.21 3.04 7.09 0.3141 1 32.30.5
outlet 16.71 4.78 7.23 0.315500.5
Season: Summer
Station Profile Depth Water Temp DO pH Conductivity(M) (C ) (SU) (mS/cm)(mg/L)
Tot. Depth(M)
Secchi(M)
DO(%Sat)
1 27.7 4.53 7.3 0.2540.9 0.5 57.40.5
2 27.81 4.63 7.48 0.2560.9 0.4 58.40.5
outlet 27.53 3.3 7.21 0.2561 41.60.5
Season: Fall
Station Profile Depth Water Temp DO pH Conductivity(M) (C ) (SU) (mS/cm)(mg/L)
Tot. Depth(M)
Secchi(M)
DO(%Sat)
1 17.24 4.38 7.48 0.2491.1 1.1 45.60.5
2 17.01 3.85 7.31 0.2471 0.8 39.90.5
outlet 17.22 3.98 7.2 0.250.2 41.20.2
-Secchi measurements are not recorded for outlets.-A blank Secchi measurement for lake stations means that an accurate measurement could not be recorded.-A blank parameter result means the parameter could not be measured due to a meter malfunction.

AMBIENT LAKE MONITORING NETWORK
NJW04459-242
Lake 31ALake Name: SiteID: HILLSBOROUGH TWPMunicipality:
County: SOMERSET
Lake Profile Raw Data
Season: Spring
Station Tot Phos TKN Nitrite-Nitrate Ammonia-N Chl a(mg/L) (mg/L) (mg/L) (ug/L)(mg/L)
Alk(ppm)
Hard(ppm)
Turbidity(NTU)
1 0.066 0.709 0.010 0.041 4.5 59 91.059 1.8
2 0.126 0.689 0.006 0.020 5.5 65 90.702 2.02
outlet 0.071 0.833 0.008 0.037 15.3 59 90.439 2.83
Season: Summer
Station Tot Phos TKN Nitrite-Nitrate Ammonia-N Chl a(mg/L) (mg/L) (mg/L) (ug/L)(mg/L)
Alk(ppm)
Hard(ppm)
Turbidity(NTU)
1 0.147 0.006 0.039 119 59 84.122 13.1
2 0.185 1.780 0.006 0.015 144.3 61 84.660 15.8
outlet 0.183 2.110 0.016 0.100 100.4 65 94.527 17.3
Season: Fall
Station Tot Phos TKN Nitrite-Nitrate Ammonia-N Chl a(mg/L) (mg/L) (mg/L) (ug/L)(mg/L)
Alk(ppm)
Hard(ppm)
Turbidity(NTU)
1 0.15 1.700 0.094 0.728 17.2 67 84.395 6.77
2 0.169 1.900 0.064 0.769 21.7 66 85.520 16.9
outlet 0.151 1.870 0.133 0.672 21.7 67 84.436 7.58
"ND" indicates the result is at a concentration below the analytical method's Reporting Limit (RL). See Volume 1, Methods.Sample Device - Horizontal Polycarbonate Sampler
-A blank parameter result means the parameter could not be analyzed due to laboratory error.

AMBIENT LAKE MONITORING NETWORKLake Name Lefferts Lake County MonmouthSite ID NJW04459-080 Municipality Matawan Boro
INSERT LAKE MAP W/ AREAL EXTENT
Carlson's Trophic Index (TSI)
Season TSIP TSIC TSIS TSISpringStation 1 ND 14.81 43.24 29.03
OligotrophicSpringStation 2 ND 33.9 53.23 43.56
MesotrophicSummerStation 1 53.2 42.89 45.16 47.08
MesotrophicSummerStation 2 32.21 45.13 B 38.67
OligotrophicFallStation 1 44.13 48.34 51.53 48.00
MesotrophicFallStation 2 35.83 48.01 57.37 47.07
Mesotrophic
ND - TP concentration below detection limitB - Secchi visible to Lake bottom. (See Datasheet for total depth)
Observations
Spring-lake extremely green, some SAV, outlet possibly tidal and brackish
Summer-outlet too shallow to sample (low tide), SAV, many budding macrophytes on shoreline
Fall-bald eagle, osprey, SAV, outlet not sampled (bridge construction)

AMBIENT LAKE MONITORING NETWORK
NJW04459-080
Lefferts LakeLake Name: SiteID: MATAWAN BOROMunicipality:
County: MONMOUTH
Surface to Bottom Profile
Season: Spring
Station Profile Depth Water Temp DO pH Conductivity(M) (C ) (SU) (mS/cm)(mg/L)
Tot. Depth(M)
Secchi(M)
DO(%Sat)
1 16.7 8.12 5.33 0.3073.6 3.2 83.71
1 16.68 8.18 5.37 0.3083.6 3.2 84.22
1 16.69 7.76 5.38 0.3083.6 3.2 79.93
2 16.81 6.82 5.03 0.2622 1.6 70.61
outlet 16.17 8.54 6.4 5.260.8 88.80.5
Season: Summer
Station Profile Depth Water Temp DO pH Conductivity(M) (C ) (SU) (mS/cm)(mg/L)
Tot. Depth(M)
Secchi(M)
DO(%Sat)
1 29.37 6.82 7.01 0.1672.9 2.8 89.21
1 28.69 7.08 6.85 0.1662.9 2.8 91.42
2 29.26 7.98 6.71 0.1621.8 1.8 103.91
Season: Fall
Station Profile Depth Water Temp DO pH Conductivity(M) (C ) (SU) (mS/cm)(mg/L)
Tot. Depth(M)
Secchi(M)
DO(%Sat)
1 21.34 8.39 7.16 0.1473.6 1.8 95.81
1 20.35 6.25 7.16 0.163.6 1.8 702
1 20.01 5.67 7.35 0.1623.6 1.8 63.13
2 20.7 8.81 7.33 0.1541.3 1.2 99.31
-Secchi measurements are not recorded for outlets.-A blank Secchi measurement for lake stations means that an accurate measurement could not be recorded.-A blank parameter result means the parameter could not be measured due to a meter malfunction.

AMBIENT LAKE MONITORING NETWORK
NJW04459-080
Lefferts LakeLake Name: SiteID: MATAWAN BOROMunicipality:
County: MONMOUTH
Lake Profile Raw Data
Season: Spring
Station Tot Phos TKN Nitrite-Nitrate Ammonia-N Chl a(mg/L) (mg/L) (mg/L) (ug/L)(mg/L)
Alk(ppm)
Hard(ppm)
Turbidity(NTU)
1 ND 0.337 0.346 0.247 0.2 1 50.745 1.25
2 ND 0.495 0.247 0.262 1.4 1 46.969 3.99
outlet ND 0.558 0.305 0.218 2.5 13 533.6 2.65
Season: Summer
Station Tot Phos TKN Nitrite-Nitrate Ammonia-N Chl a(mg/L) (mg/L) (mg/L) (ug/L)(mg/L)
Alk(ppm)
Hard(ppm)
Turbidity(NTU)
1 0.03 0.231 0.245 0.015 3.5 11 45.074 1.03
2 0.007 0.246 0.161 0.011 4.4 10 44.040 1.84
Season: Fall
Station Tot Phos TKN Nitrite-Nitrate Ammonia-N Chl a(mg/L) (mg/L) (mg/L) (ug/L)(mg/L)
Alk(ppm)
Hard(ppm)
Turbidity(NTU)
1 0.016 0.284 0.413 0.036 6.1 9 37.950 3.15
2 0.009 0.375 0.442 0.058 5.9 10 43.178 6.92
"ND" indicates the result is at a concentration below the analytical method's Reporting Limit (RL). See Volume 1, Methods.Sample Device - Horizontal Polycarbonate Sampler
-A blank parameter result means the parameter could not be analyzed due to laboratory error.
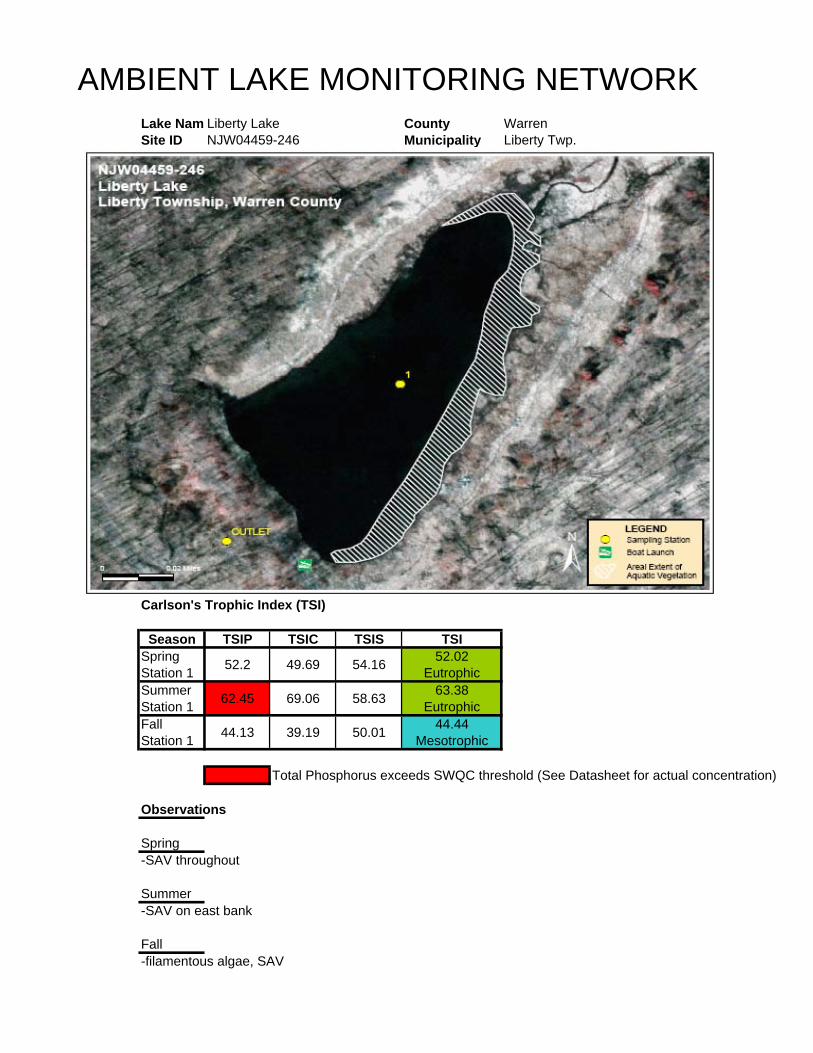
AMBIENT LAKE MONITORING NETWORKLake Nam Liberty Lake County WarrenSite ID NJW04459-246 Municipality Liberty Twp.
INSERT LAKE MAP W/ AREAL EXTENT
Carlson's Trophic Index (TSI)
Season TSIP TSIC TSIS TSISpringStation 1 52.2 49.69 54.16 52.02
EutrophicSummerStation 1 62.45 69.06 58.63 63.38
EutrophicFallStation 1 44.13 39.19 50.01 44.44
Mesotrophic
Total Phosphorus exceeds SWQC threshold (See Datasheet for actual concentration)
Observations
Spring-SAV throughout
Summer-SAV on east bank
Fall-filamentous algae, SAV
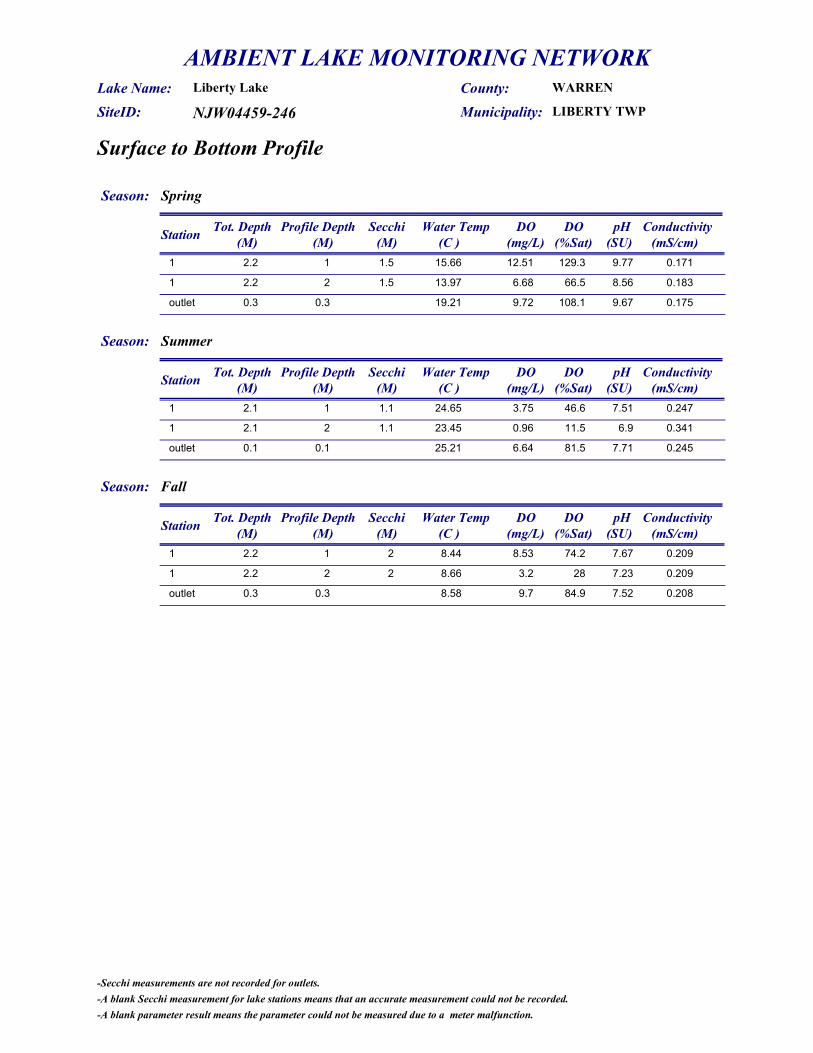
AMBIENT LAKE MONITORING NETWORK
NJW04459-246
Liberty LakeLake Name: SiteID: LIBERTY TWPMunicipality:
County: WARREN
Surface to Bottom Profile
Season: Spring
Station Profile Depth Water Temp DO pH Conductivity(M) (C ) (SU) (mS/cm)(mg/L)
Tot. Depth(M)
Secchi(M)
DO(%Sat)
1 15.66 12.51 9.77 0.1712.2 1.5 129.31
1 13.97 6.68 8.56 0.1832.2 1.5 66.52
outlet 19.21 9.72 9.67 0.1750.3 108.10.3
Season: Summer
Station Profile Depth Water Temp DO pH Conductivity(M) (C ) (SU) (mS/cm)(mg/L)
Tot. Depth(M)
Secchi(M)
DO(%Sat)
1 24.65 3.75 7.51 0.2472.1 1.1 46.61
1 23.45 0.96 6.9 0.3412.1 1.1 11.52
outlet 25.21 6.64 7.71 0.2450.1 81.50.1
Season: Fall
Station Profile Depth Water Temp DO pH Conductivity(M) (C ) (SU) (mS/cm)(mg/L)
Tot. Depth(M)
Secchi(M)
DO(%Sat)
1 8.44 8.53 7.67 0.2092.2 2 74.21
1 8.66 3.2 7.23 0.2092.2 2 282
outlet 8.58 9.7 7.52 0.2080.3 84.90.3
-Secchi measurements are not recorded for outlets.-A blank Secchi measurement for lake stations means that an accurate measurement could not be recorded.-A blank parameter result means the parameter could not be measured due to a meter malfunction.
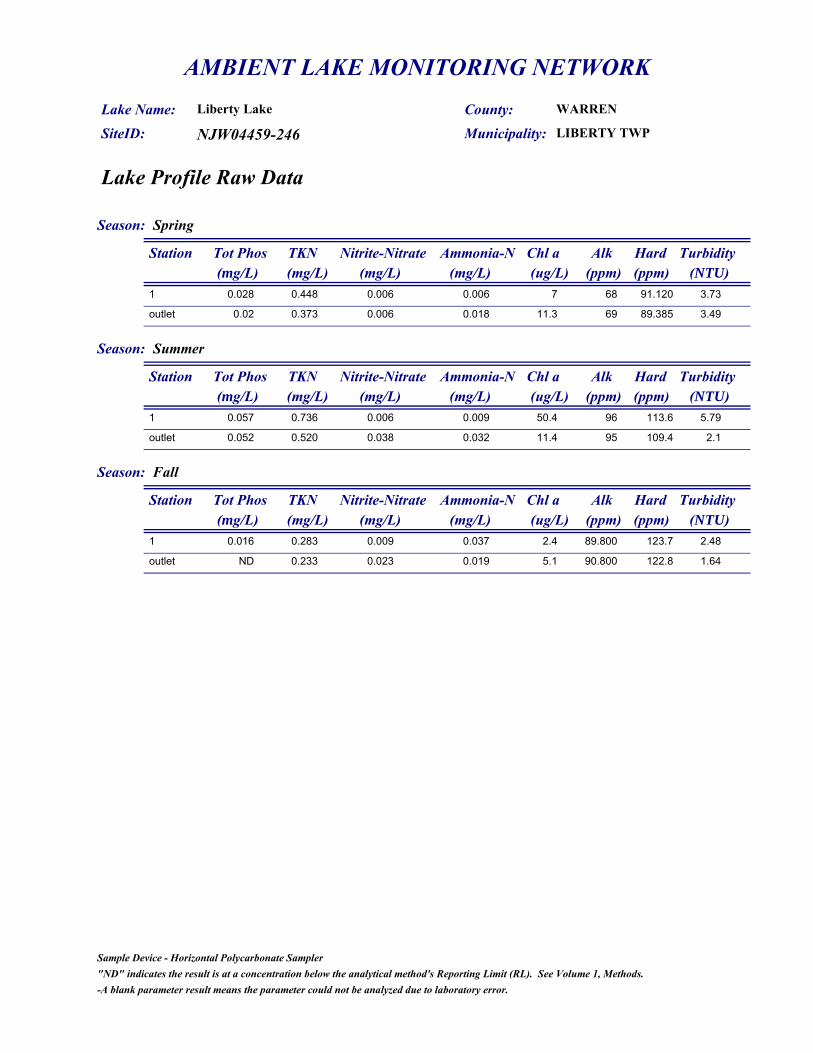
AMBIENT LAKE MONITORING NETWORK
NJW04459-246
Liberty LakeLake Name: SiteID: LIBERTY TWPMunicipality:
County: WARREN
Lake Profile Raw Data
Season: Spring
Station Tot Phos TKN Nitrite-Nitrate Ammonia-N Chl a(mg/L) (mg/L) (mg/L) (ug/L)(mg/L)
Alk(ppm)
Hard(ppm)
Turbidity(NTU)
1 0.028 0.448 0.006 0.006 7 68 91.120 3.73
outlet 0.02 0.373 0.006 0.018 11.3 69 89.385 3.49
Season: Summer
Station Tot Phos TKN Nitrite-Nitrate Ammonia-N Chl a(mg/L) (mg/L) (mg/L) (ug/L)(mg/L)
Alk(ppm)
Hard(ppm)
Turbidity(NTU)
1 0.057 0.736 0.006 0.009 50.4 96 113.6 5.79
outlet 0.052 0.520 0.038 0.032 11.4 95 109.4 2.1
Season: Fall
Station Tot Phos TKN Nitrite-Nitrate Ammonia-N Chl a(mg/L) (mg/L) (mg/L) (ug/L)(mg/L)
Alk(ppm)
Hard(ppm)
Turbidity(NTU)
1 0.016 0.283 0.009 0.037 2.4 89.800 123.7 2.48
outlet ND 0.233 0.023 0.019 5.1 90.800 122.8 1.64
"ND" indicates the result is at a concentration below the analytical method's Reporting Limit (RL). See Volume 1, Methods.Sample Device - Horizontal Polycarbonate Sampler
-A blank parameter result means the parameter could not be analyzed due to laboratory error.

AMBIENT LAKE MONITORING NETWORKLake Name Lower Lake County OceanSite ID NJW04459-068 Municipality Lacey Twp.
INSERT LAKE MAP W/ AREAL EXTENT
Carlson's Trophic Index (TSI)
Season TSIP TSIC TSIS TSISpringStation 1 29.99 44.91 63.22 46.04
MesotrophicSpringStation 2 57.7 49.41 63.22 56.77
EutrophicSummerStation 1 38.73 56.63 60 51.79
EutrophicSummerStation 2 60.85 48.34 O 54.59
EutrophicFallStation 1 ND 65.81 57.37 46.59
MesotrophicFallStation 2 ND 48.81 O 48.81
Mesotrophic
ND - TP concentration below detection limitO - Secchi obstructed by vegetation.
Observations
Spring-cedar colored water
Fall-SAV throughout, cedar colored water

AMBIENT LAKE MONITORING NETWORK
NJW04459-068
Lower LakeLake Name: SiteID: LACEY TWPMunicipality:
County: OCEAN
Surface to Bottom Profile
Season: Spring
Station Profile Depth Water Temp DO pH Conductivity(M) (C ) (SU) (mS/cm)(mg/L)
Tot. Depth(M)
Secchi(M)
DO(%Sat)
1 15.13 7.57 4.53 0.0631.5 0.8 75.81
2 15.31 7.81 4.39 0.0640.9 0.8 78.60.5
outlet 14.98 7.93 4.6 0.0620.1 79.20.1
Season: Summer
Station Profile Depth Water Temp DO pH Conductivity(M) (C ) (SU) (mS/cm)(mg/L)
Tot. Depth(M)
Secchi(M)
DO(%Sat)
1 28.31 3.47 4.37 0.0631.8 1 441
2 31.28 5.2 4.5 0.0570.9 0.7 69.90.5
outlet 30.73 6.19 4.62 0.0570.1 82.30.1
Season: Fall
Station Profile Depth Water Temp DO pH Conductivity(M) (C ) (SU) (mS/cm)(mg/L)
Tot. Depth(M)
Secchi(M)
DO(%Sat)
1 18.63 6.39 4.34 0.0611.6 1.2 67.31
2 18.89 7.69 4.44 0.060.9 0.7 81.40.5
outlet 19.6 8.09 4.33 0.0590.2 86.80.2
-Secchi measurements are not recorded for outlets.-A blank Secchi measurement for lake stations means that an accurate measurement could not be recorded.-A blank parameter result means the parameter could not be measured due to a meter malfunction.

AMBIENT LAKE MONITORING NETWORK
NJW04459-068
Lower LakeLake Name: SiteID: LACEY TWPMunicipality:
County: OCEAN
Lake Profile Raw Data
Season: Spring
Station Tot Phos TKN Nitrite-Nitrate Ammonia-N Chl a(mg/L) (mg/L) (mg/L) (ug/L)(mg/L)
Alk(ppm)
Hard(ppm)
Turbidity(NTU)
1 0.006 0.376 0.038 0.035 4.3 1 6.137 2.59
2 0.041 0.351 0.037 0.039 6.8 1 6.407 2.91
outlet ND 0.418 0.036 0.037 4.8 1 6.997 2.34
Season: Summer
Station Tot Phos TKN Nitrite-Nitrate Ammonia-N Chl a(mg/L) (mg/L) (mg/L) (ug/L)(mg/L)
Alk(ppm)
Hard(ppm)
Turbidity(NTU)
1 0.011 0.340 0.010 0.014 14.2 1 5.471 2.68
2 0.051 0.270 0.006 0.015 6.1 1 5.291 1.58
outlet 0.016 0.265 0.006 0.036 6.7 3 6.166 1.76
Season: Fall
Station Tot Phos TKN Nitrite-Nitrate Ammonia-N Chl a(mg/L) (mg/L) (mg/L) (ug/L)(mg/L)
Alk(ppm)
Hard(ppm)
Turbidity(NTU)
1 ND 0.275 0.073 0.053 1.7 1 6.125 1.99
2 ND 0.349 0.058 0.025 6.4 1 6.312 2.05
outlet ND 0.384 0.058 0.070 2.2 1 7.239 1.89
"ND" indicates the result is at a concentration below the analytical method's Reporting Limit (RL). See Volume 1, Methods.Sample Device - Horizontal Polycarbonate Sampler
-A blank parameter result means the parameter could not be analyzed due to laboratory error.

AMBIENT LAKE MONITORING NETWORKLake Name Mecca Lake County SussexSite ID NJW04459-059 Municipality Hampton Twp.
INSERT LAKE MAP W/ AREAL EXTENT
Carlson's Trophic Index (TSI)
Season TSIP TSIC TSIS TSISpringStation 1 48.72 58.68 58.63 55.34
EutrophicSummerStation 1 46.61 52.58 53.23 50.81
EutrophicFallStation 1 ND 42.01 57.37 49.69
Mesotrophic
ND - TP concentration below detection limit
Observations
Spring-turtles, decomposing plant/ algae mats, outlet stream sampled at Mountain Rd.

AMBIENT LAKE MONITORING NETWORK
NJW04459-059
Mecca LakeLake Name: SiteID: HAMPTON TWPMunicipality:
County: SUSSEX
Surface to Bottom Profile
Season: Spring
Station Profile Depth Water Temp DO pH Conductivity(M) (C ) (SU) (mS/cm)(mg/L)
Tot. Depth(M)
Secchi(M)
DO(%Sat)
1 14.96 7.73 6.09 0.0552.4 1.1 78.41
1 13.73 6.05 5.91 0.052.4 1.1 59.72
outlet 16.03 8.21 6.64 0.0580.3 85.10.2
Season: Summer
Station Profile Depth Water Temp DO pH Conductivity(M) (C ) (SU) (mS/cm)(mg/L)
Tot. Depth(M)
Secchi(M)
DO(%Sat)
1 22.93 4.1 5.98 0.0552.4 1.6 48.51
1 18.86 0.38 5.67 0.0712.4 1.6 4.12
outlet 21.22 6.59 6.8 0.0870.1 75.30.1
Season: Fall
Station Profile Depth Water Temp DO pH Conductivity(M) (C ) (SU) (mS/cm)(mg/L)
Tot. Depth(M)
Secchi(M)
DO(%Sat)
1 9.52 6.96 6.36 0.0472.4 1.2 63.41
1 9.42 6.46 6.22 0.0472.4 1.2 58.72
outlet 9.53 9.89 6.49 0.0490.3 90.10.3
-Secchi measurements are not recorded for outlets.-A blank Secchi measurement for lake stations means that an accurate measurement could not be recorded.-A blank parameter result means the parameter could not be measured due to a meter malfunction.

AMBIENT LAKE MONITORING NETWORK
NJW04459-059
Mecca LakeLake Name: SiteID: HAMPTON TWPMunicipality:
County: SUSSEX
Lake Profile Raw Data
Season: Spring
Station Tot Phos TKN Nitrite-Nitrate Ammonia-N Chl a(mg/L) (mg/L) (mg/L) (ug/L)(mg/L)
Alk(ppm)
Hard(ppm)
Turbidity(NTU)
1 0.022 0.495 0.006 0.009 17.5 6 14.208 2.01
outlet 0.022 0.497 0.019 0.008 15.1 9 16.878 2.12
Season: Summer
Station Tot Phos TKN Nitrite-Nitrate Ammonia-N Chl a(mg/L) (mg/L) (mg/L) (ug/L)(mg/L)
Alk(ppm)
Hard(ppm)
Turbidity(NTU)
1 0.019 0.466 0.006 0.009 9.4 8 15.198 1.02
outlet 0.147 0.628 0.149 0.019 3.7 18 27.809 0.92
Season: Fall
Station Tot Phos TKN Nitrite-Nitrate Ammonia-N Chl a(mg/L) (mg/L) (mg/L) (ug/L)(mg/L)
Alk(ppm)
Hard(ppm)
Turbidity(NTU)
1 ND 0.397 0.007 0.021 3.2 8.200 14.758 1.04
outlet 0.017 0.332 0.021 0.020 2.8 10.200 15.004 1.06
"ND" indicates the result is at a concentration below the analytical method's Reporting Limit (RL). See Volume 1, Methods.Sample Device - Horizontal Polycarbonate Sampler
-A blank parameter result means the parameter could not be analyzed due to laboratory error.
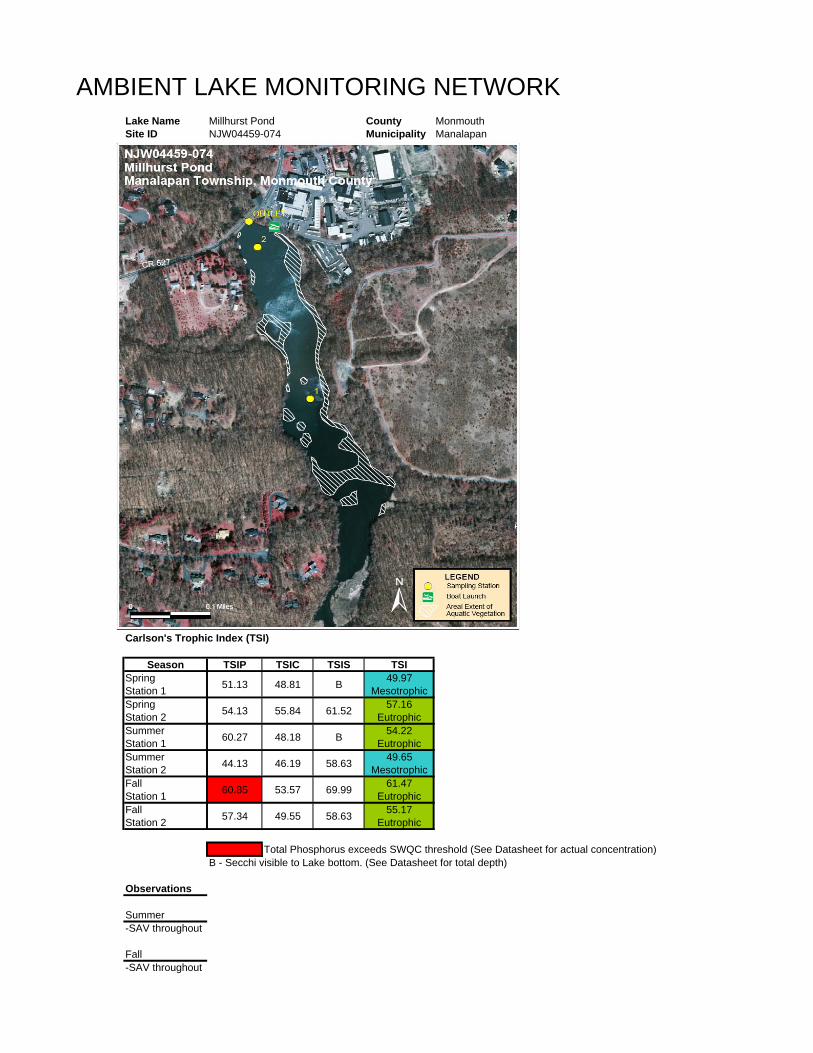
AMBIENT LAKE MONITORING NETWORKLake Name Millhurst Pond County MonmouthSite ID NJW04459-074 Municipality Manalapan
INSERT LAKE MAP W/ AREAL EXTENT
Carlson's Trophic Index (TSI)
Season TSIP TSIC TSIS TSISpringStation 1 51.13 48.81 B 49.97
MesotrophicSpringStation 2 54.13 55.84 61.52 57.16
EutrophicSummerStation 1 60.27 48.18 B 54.22
EutrophicSummerStation 2 44.13 46.19 58.63 49.65
MesotrophicFallStation 1 60.85 53.57 69.99 61.47
EutrophicFallStation 2 57.34 49.55 58.63 55.17
Eutrophic
Total Phosphorus exceeds SWQC threshold (See Datasheet for actual concentration)B - Secchi visible to Lake bottom. (See Datasheet for total depth)
Observations
Summer-SAV throughout
Fall-SAV throughout

AMBIENT LAKE MONITORING NETWORK
NJW04459-074
Millhurst PondLake Name: SiteID: MANALAPAN TWPMunicipality:
County: MONMOUTH
Surface to Bottom Profile
Season: Spring
Station Profile Depth Water Temp DO pH Conductivity(M) (C ) (SU) (mS/cm)(mg/L)
Tot. Depth(M)
Secchi(M)
DO(%Sat)
1 12.72 8.54 6.59 0.190.6 0.6 80.60.5
2 14.71 7.63 6.52 0.1791.2 0.9 75.21
outlet 16.33 9.07 6.95 0.1820.5 92.50.5
Season: Summer
Station Profile Depth Water Temp DO pH Conductivity(M) (C ) (SU) (mS/cm)(mg/L)
Tot. Depth(M)
Secchi(M)
DO(%Sat)
1 28.17 4.45 6.86 0.2330.5 0.5 56.80.2
2 28.93 6.37 7.21 0.2221.2 1.1 82.50.5
outlet 29.18 6.12 7.2 0.2240.1 79.50.1
Season: Fall
Station Profile Depth Water Temp DO pH Conductivity(M) (C ) (SU) (mS/cm)(mg/L)
Tot. Depth(M)
Secchi(M)
DO(%Sat)
1 20.39 7.38 7.41 0.2110.6 0.5 84.40.3
2 18.86 4.45 7.07 0.1761.5 1.1 48.41
outlet 23.41 7.2 7.11 0.2010.1 85.50.1
-Secchi measurements are not recorded for outlets.-A blank Secchi measurement for lake stations means that an accurate measurement could not be recorded.-A blank parameter result means the parameter could not be measured due to a meter malfunction.

AMBIENT LAKE MONITORING NETWORK
NJW04459-074
Millhurst PondLake Name: SiteID: MANALAPAN TWPMunicipality:
County: MONMOUTH
Lake Profile Raw Data
Season: Spring
Station Tot Phos TKN Nitrite-Nitrate Ammonia-N Chl a(mg/L) (mg/L) (mg/L) (ug/L)(mg/L)
Alk(ppm)
Hard(ppm)
Turbidity(NTU)
1 0.026 0.375 0.937 0.098 6.4 12 33.380 8.28
2 0.032 0.545 0.683 0.100 13.1 13 31.920 10.9
outlet 0.026 0.359 0.716 0.089 6 12 31.934 9.1
Season: Summer
Station Tot Phos TKN Nitrite-Nitrate Ammonia-N Chl a(mg/L) (mg/L) (mg/L) (ug/L)(mg/L)
Alk(ppm)
Hard(ppm)
Turbidity(NTU)
1 0.049 0.386 0.546 0.032 6 17 41.247 7.69
2 0.016 0.545 0.534 0.033 4.9 19 41.249 4.16
outlet 0.028 0.639 0.566 0.066 3.2 14 41.489 5.34
Season: Fall
Station Tot Phos TKN Nitrite-Nitrate Ammonia-N Chl a(mg/L) (mg/L) (mg/L) (ug/L)(mg/L)
Alk(ppm)
Hard(ppm)
Turbidity(NTU)
1 0.051 0.436 0.896 0.084 10.4 15 37.244 10.1
2 0.04 0.384 0.667 0.048 6.9 14 34.177 6.31
outlet 0.032 0.352 0.690 0.049 3.9 14 34.418 4.83
"ND" indicates the result is at a concentration below the analytical method's Reporting Limit (RL). See Volume 1, Methods.Sample Device - Horizontal Polycarbonate Sampler
-A blank parameter result means the parameter could not be analyzed due to laboratory error.

AMBIENT LAKE MONITORING NETWORKLake Name Mt. Misery Lake County BurlingtonSite ID NJW04459-058 Municipality Pemberton Twp.
INSERT LAKE MAP W/ AREAL EXTENT
Carlson's Trophic Index (TSI)
Season TSIP TSIC TSIS TSISpringStation 1 ND 23.8 B 23.80
OligotrophicSpringStation 2 ND 25.59 B 25.59
OligotrophicSummerStation 1 34.14 33.9 61.52 43.18
MesotrophicSummerStation 2 38.73 36.37 61.52 45.54
MesotrophicFallStation 1 ND 27.1 54.16 40.63
MesotrophicFallStation 2 56.6 25.59 B 41.10
Mesotrophic
ND - TP concentration below detection limitB - Secchi visible to Lake bottom. (See Datasheet for total depth)
Observations
Summer-cedar water
Fall-beaver dens, excessive foam at outlet, road construction at outlet

AMBIENT LAKE MONITORING NETWORK
NJW04459-058
Mt. Misery LakeLake Name: SiteID: PEMBERTON TWPMunicipality:
County: BURLINGTON
Surface to Bottom Profile
Season: Spring
Station Profile Depth Water Temp DO pH Conductivity(M) (C ) (SU) (mS/cm)(mg/L)
Tot. Depth(M)
Secchi(M)
DO(%Sat)
1 6.97 8.53 5.03 0.0411.5 1.5 69.61
2 7.11 8.39 5.54 0.041.3 1.3 68.61
outlet 7.52 9.51 5.99 0.0390.5 78.60.5
Season: Summer
Station Profile Depth Water Temp DO pH Conductivity(M) (C ) (SU) (mS/cm)(mg/L)
Tot. Depth(M)
Secchi(M)
DO(%Sat)
1 15.84 6.06 4.37 0.0361.7 0.9 62.31
2 15.63 5.71 4.28 0.0351.4 0.9 58.41
outlet 16.11 7.67 4.27 0.0350.1 79.20.1
Season: Fall
Station Profile Depth Water Temp DO pH Conductivity(M) (C ) (SU) (mS/cm)(mg/L)
Tot. Depth(M)
Secchi(M)
DO(%Sat)
1 17.17 5.78 4.02 0.0591.6 1.5 60.11
2 17.3 6.01 3.93 0.0591.3 1.3 62.81
outlet 17.21 7.51 4.23 0.0581.2 78.11.2
-Secchi measurements are not recorded for outlets.-A blank Secchi measurement for lake stations means that an accurate measurement could not be recorded.-A blank parameter result means the parameter could not be measured due to a meter malfunction.
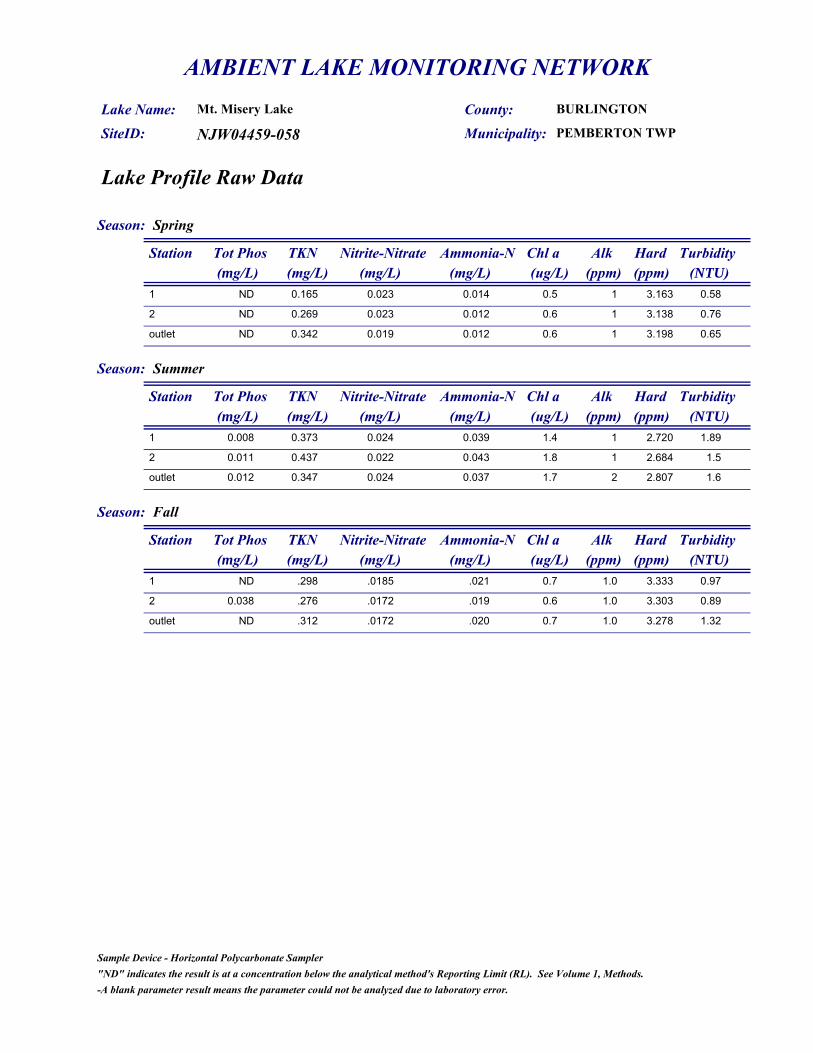
AMBIENT LAKE MONITORING NETWORK
NJW04459-058
Mt. Misery LakeLake Name: SiteID: PEMBERTON TWPMunicipality:
County: BURLINGTON
Lake Profile Raw Data
Season: Spring
Station Tot Phos TKN Nitrite-Nitrate Ammonia-N Chl a(mg/L) (mg/L) (mg/L) (ug/L)(mg/L)
Alk(ppm)
Hard(ppm)
Turbidity(NTU)
1 ND 0.165 0.023 0.014 0.5 1 3.163 0.58
2 ND 0.269 0.023 0.012 0.6 1 3.138 0.76
outlet ND 0.342 0.019 0.012 0.6 1 3.198 0.65
Season: Summer
Station Tot Phos TKN Nitrite-Nitrate Ammonia-N Chl a(mg/L) (mg/L) (mg/L) (ug/L)(mg/L)
Alk(ppm)
Hard(ppm)
Turbidity(NTU)
1 0.008 0.373 0.024 0.039 1.4 1 2.720 1.89
2 0.011 0.437 0.022 0.043 1.8 1 2.684 1.5
outlet 0.012 0.347 0.024 0.037 1.7 2 2.807 1.6
Season: Fall
Station Tot Phos TKN Nitrite-Nitrate Ammonia-N Chl a(mg/L) (mg/L) (mg/L) (ug/L)(mg/L)
Alk(ppm)
Hard(ppm)
Turbidity(NTU)
1 ND .298 .0185 .021 0.7 1.0 3.333 0.97
2 0.038 .276 .0172 .019 0.6 1.0 3.303 0.89
outlet ND .312 .0172 .020 0.7 1.0 3.278 1.32
"ND" indicates the result is at a concentration below the analytical method's Reporting Limit (RL). See Volume 1, Methods.Sample Device - Horizontal Polycarbonate Sampler
-A blank parameter result means the parameter could not be analyzed due to laboratory error.
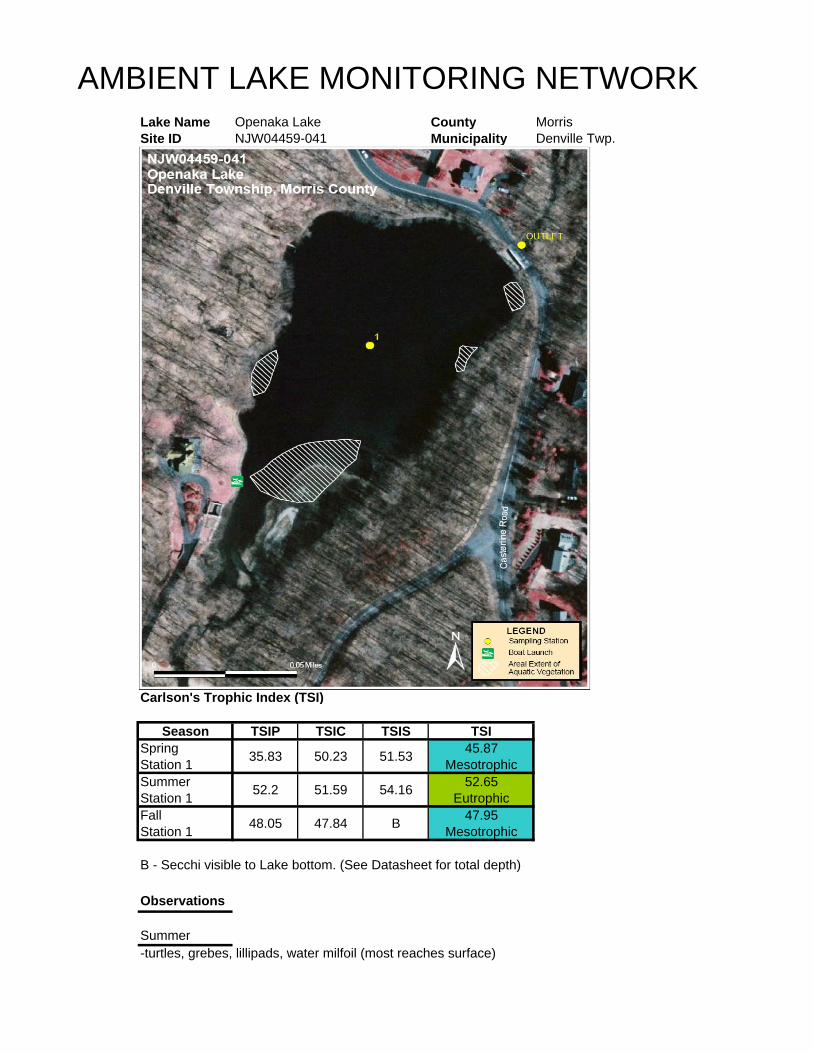
AMBIENT LAKE MONITORING NETWORKLake Name Openaka Lake County MorrisSite ID NJW04459-041 Municipality Denville Twp.
INSERT LAKE MAP W/ AREAL EXTENT
Carlson's Trophic Index (TSI)
Season TSIP TSIC TSIS TSISpringStation 1 35.83 50.23 51.53 45.87
MesotrophicSummerStation 1 52.2 51.59 54.16 52.65
EutrophicFallStation 1 48.05 47.84 B 47.95
Mesotrophic
B - Secchi visible to Lake bottom. (See Datasheet for total depth)
Observations
Summer-turtles, grebes, lillipads, water milfoil (most reaches surface)

AMBIENT LAKE MONITORING NETWORK
NJW04459-041
Openaka LakeLake Name: SiteID: DENVILLE TWPMunicipality:
County: MORRIS
Surface to Bottom Profile
Season: Spring
Station Profile Depth Water Temp DO pH Conductivity(M) (C ) (SU) (mS/cm)(mg/L)
Tot. Depth(M)
Secchi(M)
DO(%Sat)
1 15.15 7.85 7.22 0.3922 1.8 80.21
outlet 16.25 7.21 7.57 0.3920.1 75.40.1
Season: Summer
Station Profile Depth Water Temp DO pH Conductivity(M) (C ) (SU) (mS/cm)(mg/L)
Tot. Depth(M)
Secchi(M)
DO(%Sat)
1 24.34 6.93 7.03 0.2361.9 1.5 82.91
outlet 25.71 6.94 7.26 0.2420.2 860.2
Season: Fall
Station Profile Depth Water Temp DO pH Conductivity(M) (C ) (SU) (mS/cm)(mg/L)
Tot. Depth(M)
Secchi(M)
DO(%Sat)
1 19.65 7.81 7.17 0.2091.9 1.9 86.61
outlet 21.08 7.83 7.5 0.2140.2 89.30.2
-Secchi measurements are not recorded for outlets.-A blank Secchi measurement for lake stations means that an accurate measurement could not be recorded.-A blank parameter result means the parameter could not be measured due to a meter malfunction.

AMBIENT LAKE MONITORING NETWORK
NJW04459-041
Openaka LakeLake Name: SiteID: DENVILLE TWPMunicipality:
County: MORRIS
Lake Profile Raw Data
Season: Spring
Station Tot Phos TKN Nitrite-Nitrate Ammonia-N Chl a(mg/L) (mg/L) (mg/L) (ug/L)(mg/L)
Alk(ppm)
Hard(ppm)
Turbidity(NTU)
1 0.009 0.281 0.459 0.033 7.4 26 70.846 2.37
outlet 0.007 0.276 0.460 0.025 15.8 25 66.694 2.01
Season: Summer
Station Tot Phos TKN Nitrite-Nitrate Ammonia-N Chl a(mg/L) (mg/L) (mg/L) (ug/L)(mg/L)
Alk(ppm)
Hard(ppm)
Turbidity(NTU)
1 0.028 0.428 0.331 0.066 8.5 29 54.477 2.47
outlet 0.025 0.425 0.322 0.072 5.2 27 56.470 3.99
Season: Fall
Station Tot Phos TKN Nitrite-Nitrate Ammonia-N Chl a(mg/L) (mg/L) (mg/L) (ug/L)(mg/L)
Alk(ppm)
Hard(ppm)
Turbidity(NTU)
1 0.021 0.307 0.331 0.042 5.8 29 51.612 1.47
outlet 0.013 0.306 0.311 0.052 3.1 27 52.068 1.16
"ND" indicates the result is at a concentration below the analytical method's Reporting Limit (RL). See Volume 1, Methods.Sample Device - Horizontal Polycarbonate Sampler
-A blank parameter result means the parameter could not be analyzed due to laboratory error.

AMBIENT LAKE MONITORING NETWORK
Lake Name Rahway River Park Lake County UnionSite ID NJW04459-044 Municipality Rahway City
INSERT LAKE MAP W/ AREAL EXTENT
Carlson's Trophic Index (TSI)
Season TSIP TSIC TSIS TSISpring Station 1 64.12 74.09 69.99 69.40
EutrophicSpring Station 2 63.19 74.68 NA 68.93
EutrophicSummerStation 1 69.97 66.54 67.36 67.96
EutrophicSummerStation 2 70.7 66.31 67.36 68.12
EutrophicFallStation 1 78.12 76.11 65.14 73.13
HypereutrophicFallStation 2 79.51 71.88 O 75.69
Hypereutrophic
Total Phosphorus exceeds SWQC threshold (See Datasheet for actual concentration)O - Secchi obstructed by vegetation.NA - Reading not available.
Observations
Summer-filamentous algae, duckweed, SAV, flowering macrophytes (abundance). Outlet not flowing.
Fall-ducks, geese, SAV and algae dense throughout, duckweed on 90% of surface
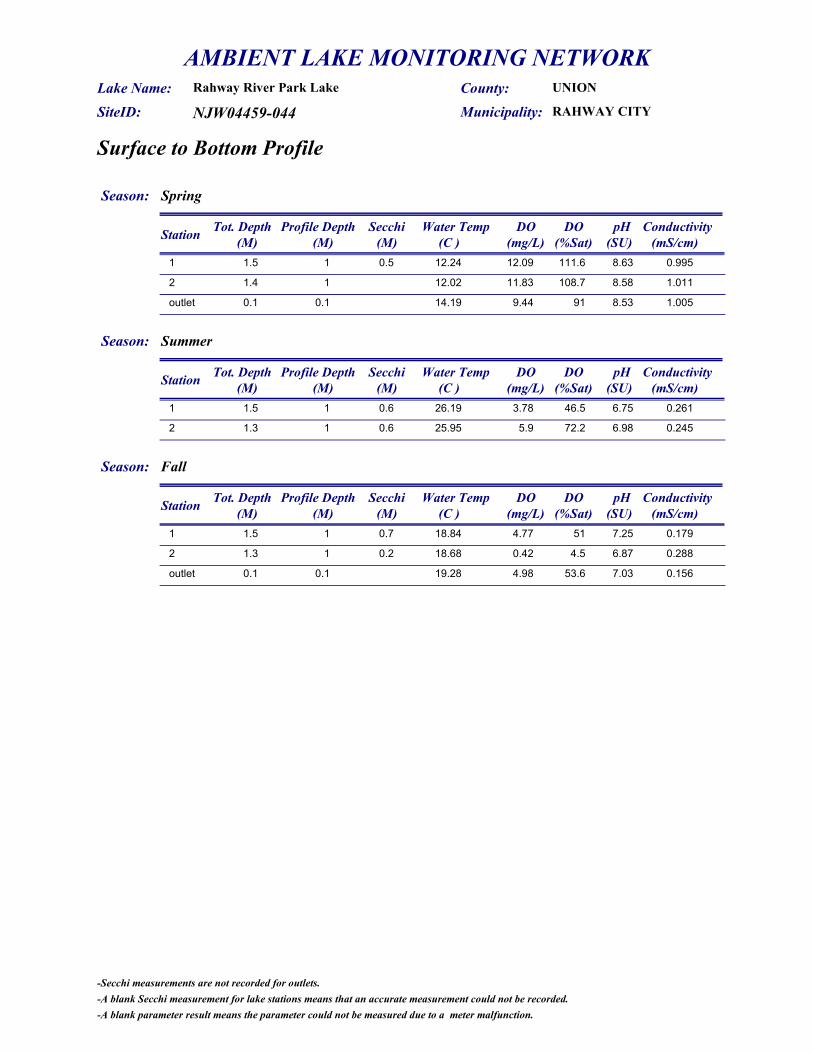
AMBIENT LAKE MONITORING NETWORK
NJW04459-044
Rahway River Park LakeLake Name: SiteID: RAHWAY CITYMunicipality:
County: UNION
Surface to Bottom Profile
Season: Spring
Station Profile Depth Water Temp DO pH Conductivity(M) (C ) (SU) (mS/cm)(mg/L)
Tot. Depth(M)
Secchi(M)
DO(%Sat)
1 12.24 12.09 8.63 0.9951.5 0.5 111.61
2 12.02 11.83 8.58 1.0111.4 108.71
outlet 14.19 9.44 8.53 1.0050.1 910.1
Season: Summer
Station Profile Depth Water Temp DO pH Conductivity(M) (C ) (SU) (mS/cm)(mg/L)
Tot. Depth(M)
Secchi(M)
DO(%Sat)
1 26.19 3.78 6.75 0.2611.5 0.6 46.51
2 25.95 5.9 6.98 0.2451.3 0.6 72.21
Season: Fall
Station Profile Depth Water Temp DO pH Conductivity(M) (C ) (SU) (mS/cm)(mg/L)
Tot. Depth(M)
Secchi(M)
DO(%Sat)
1 18.84 4.77 7.25 0.1791.5 0.7 511
2 18.68 0.42 6.87 0.2881.3 0.2 4.51
outlet 19.28 4.98 7.03 0.1560.1 53.60.1
-Secchi measurements are not recorded for outlets.-A blank Secchi measurement for lake stations means that an accurate measurement could not be recorded.-A blank parameter result means the parameter could not be measured due to a meter malfunction.

AMBIENT LAKE MONITORING NETWORK
NJW04459-044
Rahway River Park LakeLake Name: SiteID: RAHWAY CITYMunicipality:
County: UNION
Lake Profile Raw Data
Season: Spring
Station Tot Phos TKN Nitrite-Nitrate Ammonia-N Chl a(mg/L) (mg/L) (mg/L) (ug/L)(mg/L)
Alk(ppm)
Hard(ppm)
Turbidity(NTU)
1 0.064 1.320 0.142 0.025 84.2 73 133.0 9.18
2 0.06 1.350 0.086 0.024 89.4 71 130.9 9.92
outlet 0.056 0.953 0.137 0.065 46.5 71 129.7 6.95
Season: Summer
Station Tot Phos TKN Nitrite-Nitrate Ammonia-N Chl a(mg/L) (mg/L) (mg/L) (ug/L)(mg/L)
Alk(ppm)
Hard(ppm)
Turbidity(NTU)
1 0.096 1.140 0.006 0.008 39 50 63.359 7.96
2 0.101 1.080 0.009 0.010 38.1 96 60.953 8
Season: Fall
Station Tot Phos TKN Nitrite-Nitrate Ammonia-N Chl a(mg/L) (mg/L) (mg/L) (ug/L)(mg/L)
Alk(ppm)
Hard(ppm)
Turbidity(NTU)
1 0.169 0.974 0.002 0.021 103.5 95 55.645 8.21
2 0.186 1.120 0.013 0.042 67.2 42 58.188 38.8
outlet 0.078 0.456 0.139 0.092 13.7 40 49.827 1.65
"ND" indicates the result is at a concentration below the analytical method's Reporting Limit (RL). See Volume 1, Methods.Sample Device - Horizontal Polycarbonate Sampler
-A blank parameter result means the parameter could not be analyzed due to laboratory error.

AMBIENT LAKE MONITORING NETWORKLake Name Saginaw Lake County SussexSite ID NJW04459-064 Municipality Sparta Twp.
INSERT LAKE MAP W/ AREAL EXTENT
Carlson's Trophic Index (TSI)
Season TSIP TSIC TSIS TSISpringStation 1 29.99 45.35 46.8 40.71
MesotrophicSummerStation 1 51.68 56.35 50.01 52.68
EutrophicFallStation 1 52.2 62.06 55.15 56.47
Eutrophic
Observations
Spring-filamentous algae
Summer-snails, fish, treated on 7/31/06 with REWARD and copper sulfate
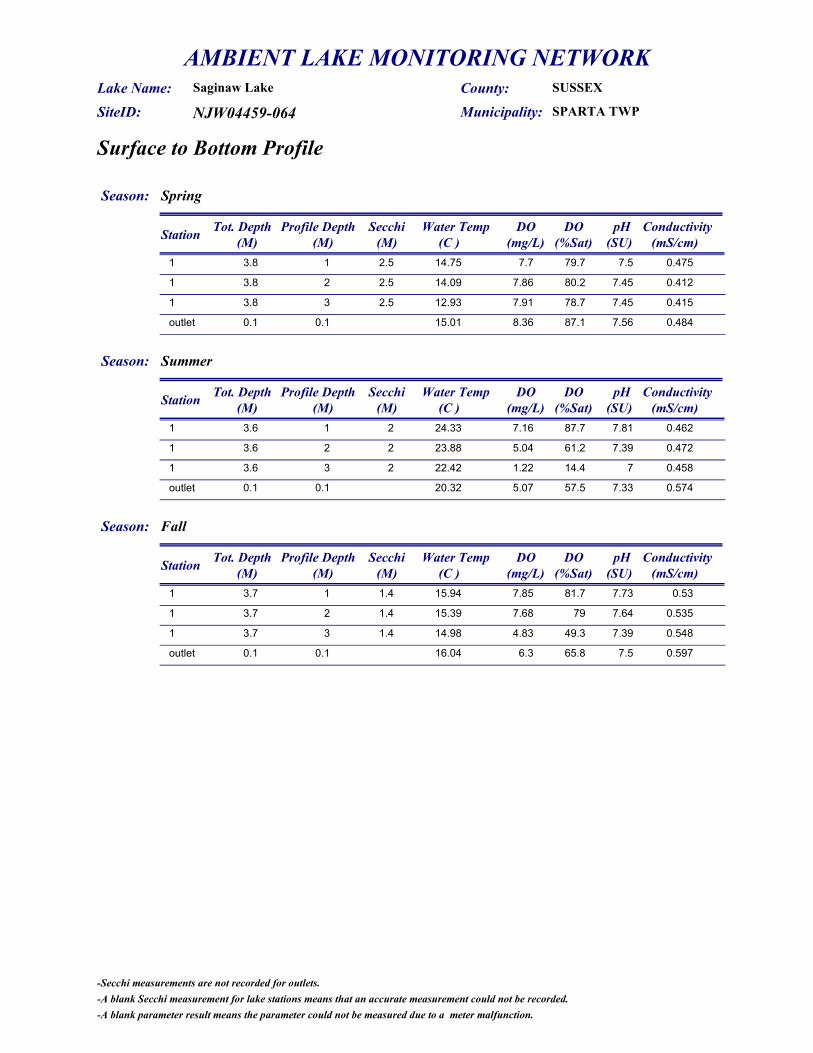
AMBIENT LAKE MONITORING NETWORK
NJW04459-064
Saginaw LakeLake Name: SiteID: SPARTA TWPMunicipality:
County: SUSSEX
Surface to Bottom Profile
Season: Spring
Station Profile Depth Water Temp DO pH Conductivity(M) (C ) (SU) (mS/cm)(mg/L)
Tot. Depth(M)
Secchi(M)
DO(%Sat)
1 14.75 7.7 7.5 0.4753.8 2.5 79.71
1 14.09 7.86 7.45 0.4123.8 2.5 80.22
1 12.93 7.91 7.45 0.4153.8 2.5 78.73
outlet 15.01 8.36 7.56 0.4840.1 87.10.1
Season: Summer
Station Profile Depth Water Temp DO pH Conductivity(M) (C ) (SU) (mS/cm)(mg/L)
Tot. Depth(M)
Secchi(M)
DO(%Sat)
1 24.33 7.16 7.81 0.4623.6 2 87.71
1 23.88 5.04 7.39 0.4723.6 2 61.22
1 22.42 1.22 7 0.4583.6 2 14.43
outlet 20.32 5.07 7.33 0.5740.1 57.50.1
Season: Fall
Station Profile Depth Water Temp DO pH Conductivity(M) (C ) (SU) (mS/cm)(mg/L)
Tot. Depth(M)
Secchi(M)
DO(%Sat)
1 15.94 7.85 7.73 0.533.7 1.4 81.71
1 15.39 7.68 7.64 0.5353.7 1.4 792
1 14.98 4.83 7.39 0.5483.7 1.4 49.33
outlet 16.04 6.3 7.5 0.5970.1 65.80.1
-Secchi measurements are not recorded for outlets.-A blank Secchi measurement for lake stations means that an accurate measurement could not be recorded.-A blank parameter result means the parameter could not be measured due to a meter malfunction.

AMBIENT LAKE MONITORING NETWORK
NJW04459-064
Saginaw LakeLake Name: SiteID: SPARTA TWPMunicipality:
County: SUSSEX
Lake Profile Raw Data
Season: Spring
Station Tot Phos TKN Nitrite-Nitrate Ammonia-N Chl a(mg/L) (mg/L) (mg/L) (ug/L)(mg/L)
Alk(ppm)
Hard(ppm)
Turbidity(NTU)
1 0.006 0.549 0.036 0.024 4.5 146.0 83.358 1.83
outlet 0.017 0.518 0.035 0.027 2.6 31 82.477 2.02
Season: Summer
Station Tot Phos TKN Nitrite-Nitrate Ammonia-N Chl a(mg/L) (mg/L) (mg/L) (ug/L)(mg/L)
Alk(ppm)
Hard(ppm)
Turbidity(NTU)
1 0.027 .549 .066 .009 13.8 84 102.434 1.52
outlet 0.065 .606 .200 .117 6.9 109 145.410 2.67
Season: Fall
Station Tot Phos TKN Nitrite-Nitrate Ammonia-N Chl a(mg/L) (mg/L) (mg/L) (ug/L)(mg/L)
Alk(ppm)
Hard(ppm)
Turbidity(NTU)
1 0.028 0.399 0.002 0.009 24.7 80 104.1 3.09
outlet 0.029 0.349 0.099 0.058 9.5 98 129.3 1.82
"ND" indicates the result is at a concentration below the analytical method's Reporting Limit (RL). See Volume 1, Methods.Sample Device - Horizontal Polycarbonate Sampler
-A blank parameter result means the parameter could not be analyzed due to laboratory error.

AMBIENT LAKE MONITORING NETWORKLake Name Shadow Lake County BurlingtonSite ID NJW04459-065 Municipality Shamong Twp.
INSERT LAKE MAP W/ AREAL EXTENT
Carlson's Trophic Index (TSI)
Season TSIP TSIC TSIS TSISpringStation 1 ND 48.5 B 48.50
MesotrophicSummerStation 1 59.04 81.09 63.22 67.78
EutrophicFallStation 1 57.34 63.6 65.14 62.03
Eutrophic
ND - TP concentration below detection limitB - Secchi visible to Lake bottom. (See Datasheet for total depth)
Observations
Summer-SAV throughout, cedar colored water

AMBIENT LAKE MONITORING NETWORK
NJW04459-065
Shadow LakeLake Name: SiteID: SHAMONG TWPMunicipality:
County: BURLINGTON
Surface to Bottom Profile
Season: Spring
Station Profile Depth Water Temp DO pH Conductivity(M) (C ) (SU) (mS/cm)(mg/L)
Tot. Depth(M)
Secchi(M)
DO(%Sat)
1 11.32 9.05 5.44 0.0760.9 0.9 81.60.7
outlet 13.71 9.74 5.76 0.0760.3 92.70.3
Season: Summer
Station Profile Depth Water Temp DO pH Conductivity(M) (C ) (SU) (mS/cm)(mg/L)
Tot. Depth(M)
Secchi(M)
DO(%Sat)
1 23.96 6.01 5.42 0.0751.1 0.8 71.10.5
outlet 24.91 7.14 5.63 0.0760.1 85.90.1
Season: Fall
Station Profile Depth Water Temp DO pH Conductivity(M) (C ) (SU) (mS/cm)(mg/L)
Tot. Depth(M)
Secchi(M)
DO(%Sat)
1 19.84 5.95 5.12 0.11 0.7 63.70.5
outlet 19.83 6.19 6.05 0.1090.1 66.30.1
-Secchi measurements are not recorded for outlets.-A blank Secchi measurement for lake stations means that an accurate measurement could not be recorded.-A blank parameter result means the parameter could not be measured due to a meter malfunction.

AMBIENT LAKE MONITORING NETWORK
NJW04459-065
Shadow LakeLake Name: SiteID: SHAMONG TWPMunicipality:
County: BURLINGTON
Lake Profile Raw Data
Season: Spring
Station Tot Phos TKN Nitrite-Nitrate Ammonia-N Chl a(mg/L) (mg/L) (mg/L) (ug/L)(mg/L)
Alk(ppm)
Hard(ppm)
Turbidity(NTU)
1 ND 0.402 0.455 0.029 6.2 3 14.889 1.87
outlet ND 0.406 0.449 0.028 6 3 14.591 1.73
Season: Summer
Station Tot Phos TKN Nitrite-Nitrate Ammonia-N Chl a(mg/L) (mg/L) (mg/L) (ug/L)(mg/L)
Alk(ppm)
Hard(ppm)
Turbidity(NTU)
1 0.045 1.450 0.063 0.013 171.8 6 14.194 4.6
outlet 0.055 0.712 0.070 0.027 22.6 5 14.177 2.74
Season: Fall
Station Tot Phos TKN Nitrite-Nitrate Ammonia-N Chl a(mg/L) (mg/L) (mg/L) (ug/L)(mg/L)
Alk(ppm)
Hard(ppm)
Turbidity(NTU)
1 0.04 0.800 0.348 0.021 28.9 3 20.389 6.01
outlet 0.042 0.856 0.156 0.191 20.4 15 30.515 2.46
"ND" indicates the result is at a concentration below the analytical method's Reporting Limit (RL). See Volume 1, Methods.Sample Device - Horizontal Polycarbonate Sampler
-A blank parameter result means the parameter could not be analyzed due to laboratory error.

AMBIENT LAKE MONITORING NETWORKLake Name Stony Lake County SussexSite ID NJW04459-063 Municipality Sandyson Twp.
INSERT LAKE MAP W/ AREAL EXTENT
Carlson's Trophic Index (TSI)
Season TSIP TSIC TSIS TSISpringStation 1 32.31 36.37 B 34.29
OligotrophicSummerStation 1 44.13 55.46 51.53 50.37
EutrophicFallStation 1 41.14 32.39 B 36.76
Oligotrophic
B - Secchi visible to Lake bottom. (See Datasheet for total depth)
Observations
Spring-beaver, turtles, fish, outfall from filtered artesian well (water is excess flow from well used for restrooms)
Summer-SAV throughout
Fall-SAV

AMBIENT LAKE MONITORING NETWORK
NJW04459-063
Stony LakeLake Name: SiteID: SANDYSTON TWPMunicipality:
County: SUSSEX
Surface to Bottom Profile
Season: Spring
Station Profile Depth Water Temp DO pH Conductivity(M) (C ) (SU) (mS/cm)(mg/L)
Tot. Depth(M)
Secchi(M)
DO(%Sat)
1 14.35 8.42 6.07 0.0232.2 2.2 84.51
1 12.96 8.34 5.97 0.0232.2 2.2 81.22
outlet 14.54 8.53 6.5 0.0250.3 860.3
Season: Summer
Station Profile Depth Water Temp DO pH Conductivity(M) (C ) (SU) (mS/cm)(mg/L)
Tot. Depth(M)
Secchi(M)
DO(%Sat)
1 23.67 4.5 6.26 0.0432.1 1.8 53.91
outlet 21.49 4.49 6.72 0.0640.1 51.40.1
Season: Fall
Station Profile Depth Water Temp DO pH Conductivity(M) (C ) (SU) (mS/cm)(mg/L)
Tot. Depth(M)
Secchi(M)
DO(%Sat)
1 9.77 8.67 5.88 0.0262.2 2.2 79.51
1 8.54 9.37 5.78 0.0242.2 2.2 83.42
outlet 9.87 9.59 6.34 0.0270.2 88.10.2
-Secchi measurements are not recorded for outlets.-A blank Secchi measurement for lake stations means that an accurate measurement could not be recorded.-A blank parameter result means the parameter could not be measured due to a meter malfunction.
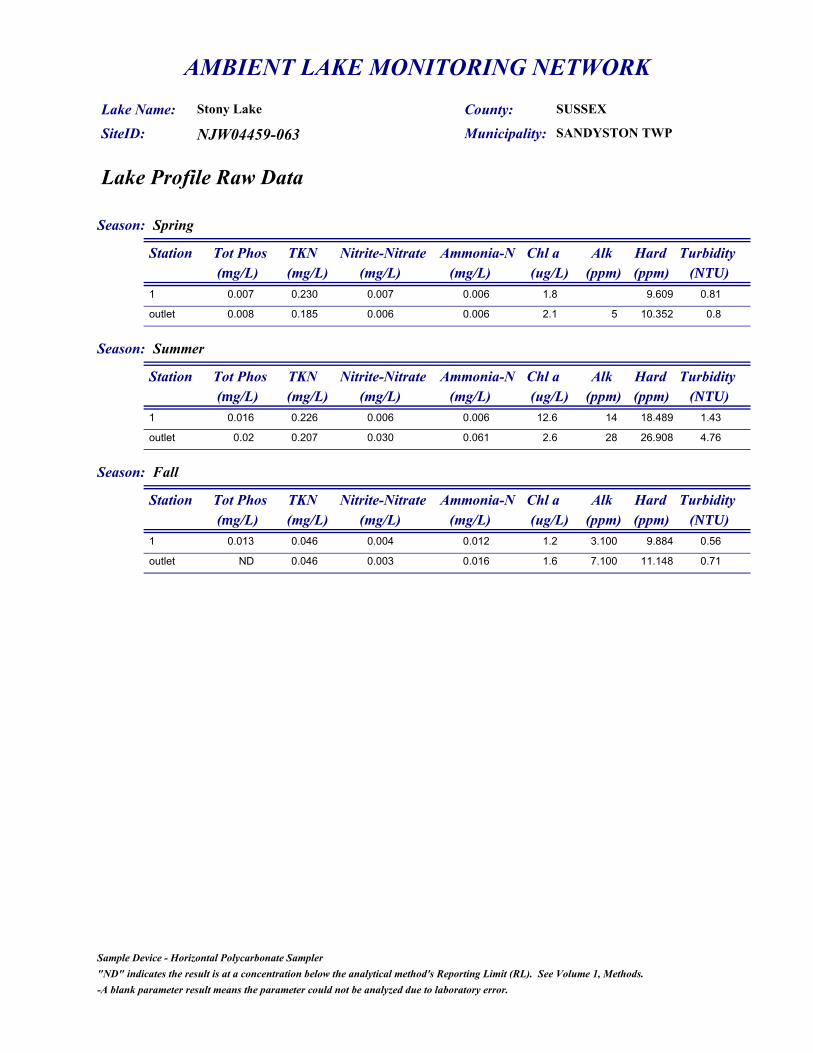
AMBIENT LAKE MONITORING NETWORK
NJW04459-063
Stony LakeLake Name: SiteID: SANDYSTON TWPMunicipality:
County: SUSSEX
Lake Profile Raw Data
Season: Spring
Station Tot Phos TKN Nitrite-Nitrate Ammonia-N Chl a(mg/L) (mg/L) (mg/L) (ug/L)(mg/L)
Alk(ppm)
Hard(ppm)
Turbidity(NTU)
1 0.007 0.230 0.007 0.006 1.8 9.609 0.81
outlet 0.008 0.185 0.006 0.006 2.1 5 10.352 0.8
Season: Summer
Station Tot Phos TKN Nitrite-Nitrate Ammonia-N Chl a(mg/L) (mg/L) (mg/L) (ug/L)(mg/L)
Alk(ppm)
Hard(ppm)
Turbidity(NTU)
1 0.016 0.226 0.006 0.006 12.6 14 18.489 1.43
outlet 0.02 0.207 0.030 0.061 2.6 28 26.908 4.76
Season: Fall
Station Tot Phos TKN Nitrite-Nitrate Ammonia-N Chl a(mg/L) (mg/L) (mg/L) (ug/L)(mg/L)
Alk(ppm)
Hard(ppm)
Turbidity(NTU)
1 0.013 0.046 0.004 0.012 1.2 3.100 9.884 0.56
outlet ND 0.046 0.003 0.016 1.6 7.100 11.148 0.71
"ND" indicates the result is at a concentration below the analytical method's Reporting Limit (RL). See Volume 1, Methods.Sample Device - Horizontal Polycarbonate Sampler
-A blank parameter result means the parameter could not be analyzed due to laboratory error.

AMBIENT LAKE MONITORING NETWORKLake Name Taunton Lake County Burlington Site ID NJW04459-050 Municipality Medford Twp.
INSERT LAKE MAP W/ AREAL EXTENT
Carlson's Trophic Index (TSI)
Season TSIP TSIC TSIS TSISpring Station 1 ND 44.91 B 44.91
MesotrophicSpring Station 2 42.21 44.44 NA 43.32
MesotrophicSpring Station 3 32.21 45.78 NA 39.00
OligotrophicSpringHot Spot 35.83 48.18 NA 42.01
MesotrophicSummerStation 1 56.22 59.59 B 57.90
EutrophicSummerStation 2 55 57.61 56.22 56.28
EutrophicSummerStation 3 57.7 56.97 57.37 57.35
EutrophicSummerHot Spot 73.06 60.61 67.36 67.01
EutrophicFallStation 1 50.57 50.62 65.14 55.44
EutrophicFallStation 2 43.2 45.99 57.37 48.85
MesotrophicFallStation 3 49.98 42.31 56.22 49.50
MesotrophicSummerHot Spot 49.98 55.99 69.99 58.65
Eutrophic
Total Phosphorus exceeds SWQC threshold (See Datasheet for actual concentration)ND - TP concentration below detection limitB - Secchi visible to Lake bottom. (See Datasheet for total depth)NA - Reading not available.
Observations
Summer-turtles
Fall-white scum along eastern shore

AMBIENT LAKE MONITORING NETWORK
NJW04459-050
Taunton LakeLake Name: SiteID: MEDFORD TWPMunicipality:
County: BURLINGTON
Surface to Bottom Profile
Season: Spring
Station Profile Depth Water Temp DO pH Conductivity(M) (C ) (SU) (mS/cm)(mg/L)
Tot. Depth(M)
Secchi(M)
DO(%Sat)
1 10.49 9.76 5.41 0.071 1 86.40.8
2 11.6 9.32 5.11 0.071.7 84.61
3 11.3 8.77 5.57 0.0731.9 79.11
hotspot 7.75 9.8 4.3 0.0831 81.20.5
outlet 11.18 10.11 5.69 0.070.4 90.90.4
Season: Summer
Station Profile Depth Water Temp DO pH Conductivity(M) (C ) (SU) (mS/cm)(mg/L)
Tot. Depth(M)
Secchi(M)
DO(%Sat)
1 21.55 7.25 5.85 0.0751.2 1.2 82.41
2 21.03 6.9 5.48 0.0751.5 1.3 771
3 20.13 5.54 5.58 0.0911.8 1.2 61.21
hotspot 17.36 4.86 4.47 0.0760.7 0.6 50.80.5
outlet 21.77 6.91 5.59 0.0770.3 78.80.3
Season: Fall
Station Profile Depth Water Temp DO pH Conductivity(M) (C ) (SU) (mS/cm)(mg/L)
Tot. Depth(M)
Secchi(M)
DO(%Sat)
1 21.5 6.26 4.93 0.0620.8 0.7 69.30.4
2 22.02 6.41 5.12 0.0611.5 1.2 71.51
3 22.13 6.23 5.41 0.0721.9 1.3 69.71
hotspot 20.93 5.26 4.95 0.0660.6 0.5 57.60.3
outlet 21.81 7.02 5.26 0.0660.5 78.20.5
-Secchi measurements are not recorded for outlets.-A blank Secchi measurement for lake stations means that an accurate measurement could not be recorded.-A blank parameter result means the parameter could not be measured due to a meter malfunction.

AMBIENT LAKE MONITORING NETWORK
NJW04459-050
Taunton LakeLake Name: SiteID: MEDFORD TWPMunicipality:
County: BURLINGTON
Lake Profile Raw Data
Season: Spring
Station Tot Phos TKN Nitrite-Nitrate Ammonia-N Chl a(mg/L) (mg/L) (mg/L) (ug/L)(mg/L)
Alk(ppm)
Hard(ppm)
Turbidity(NTU)
1 ND 0.162 0.691 0.024 4.3 3 12.471 1.34
2 0.014 0.139 0.551 0.021 4.1 2 12.132 1.48
3 0.007 0.206 0.495 0.022 4.7 2 14.499 2.25
hotspot 0.009 0.297 0.108 0.021 6 1 8.895 1.31
outlet 0.012 0.304 0.508 0.020 5.1 3 13.760 2.15
Season: Summer
Station Tot Phos TKN Nitrite-Nitrate Ammonia-N Chl a(mg/L) (mg/L) (mg/L) (ug/L)(mg/L)
Alk(ppm)
Hard(ppm)
Turbidity(NTU)
1 0.037 0.409 0.080 0.018 19.2 5 10.288 1.69
2 0.034 0.397 0.078 0.015 15.7 4 10.255 2.31
3 0.041 0.402 0.123 0.026 14.7 5 11.310 3.09
hotspot 0.119 1.290 0.063 0.037 21.3 4 10.330 15.7
outlet 0.025 0.462 0.109 0.037 14.1 3 11.691 2.47
Season: Fall
Station Tot Phos TKN Nitrite-Nitrate Ammonia-N Chl a(mg/L) (mg/L) (mg/L) (ug/L)(mg/L)
Alk(ppm)
Hard(ppm)
Turbidity(NTU)
1 0.025 0.615 0.159 0.065 7.7 2 9.171 4.36
2 0.015 0.474 0.121 0.055 4.8 2 9.378 3.43
3 0.024 0.493 0.170 0.056 3.3 4 11.379 3.32
hotspot 0.024 0.774 0.101 0.066 13.3 2 9.810 5.87
outlet 0.01 0.496 0.161 0.068 4.5 2 11.056 3.66
"ND" indicates the result is at a concentration below the analytical method's Reporting Limit (RL). See Volume 1, Methods.Sample Device - Horizontal Polycarbonate Sampler
-A blank parameter result means the parameter could not be analyzed due to laboratory error.

AMBIENT LAKE MONITORING NETWORKLake Name Upper Mount Glenn Lake County PassaicSite ID NJW04459-076 Municipality West Milford Twp.
INSERT LAKE MAP W/ AREAL EXTENT
Carlson's Trophic Index (TSI)
Season TSIP TSIC TSIS TSISpringStation 1 49.36 44.68 B 47.02
MesotrophicSummerStation 1 65 54.47 O 59.73
EutrophicFallStation 1 54.13 56.77 B 55.45
Eutrophic
B - Secchi visible to Lake bottom. (See Datasheet for total depth)O - Secchi obstructed by vegetation.
Observations
Spring-excessive filamentous algae, lillies, frogs, geese, ducks, tea colored water
Summer-SAV throughout, sediment from storm run-off, outlet not flowing
Fall-SAV throughout

AMBIENT LAKE MONITORING NETWORK
NJW04459-076
Upper Mount Glenn LakeLake Name: SiteID: WEST MILFORD TWPMunicipality:
County: PASSAIC
Surface to Bottom Profile
Season: Spring
Station Profile Depth Water Temp DO pH Conductivity(M) (C ) (SU) (mS/cm)(mg/L)
Tot. Depth(M)
Secchi(M)
DO(%Sat)
1 13.48 8.42 7.35 0.2741 1 81.20.5
outlet 13.97 8.34 7.36 0.310.2 81.30.2
Season: Summer
Station Profile Depth Water Temp DO pH Conductivity(M) (C ) (SU) (mS/cm)(mg/L)
Tot. Depth(M)
Secchi(M)
DO(%Sat)
1 20.84 3.38 7.05 0.5350.9 0.5 38.60.5
Season: Fall
Station Profile Depth Water Temp DO pH Conductivity(M) (C ) (SU) (mS/cm)(mg/L)
Tot. Depth(M)
Secchi(M)
DO(%Sat)
1 13.48 7.88 7.25 0.5261.1 1.1 77.60.5
outlet 13.07 8.2 7.17 0.3160.3 80.10.3
-Secchi measurements are not recorded for outlets.-A blank Secchi measurement for lake stations means that an accurate measurement could not be recorded.-A blank parameter result means the parameter could not be measured due to a meter malfunction.

AMBIENT LAKE MONITORING NETWORK
NJW04459-076
Upper Mount Glenn LakeLake Name: SiteID: WEST MILFORD TWPMunicipality:
County: PASSAIC
Lake Profile Raw Data
Season: Spring
Station Tot Phos TKN Nitrite-Nitrate Ammonia-N Chl a(mg/L) (mg/L) (mg/L) (ug/L)(mg/L)
Alk(ppm)
Hard(ppm)
Turbidity(NTU)
1 0.023 0.518 0.567 0.066 4.2 25 52.133 1.57
outlet 0.012 0.583 0.580 0.100 6.3 30 58.480 1.76
Season: Summer
Station Tot Phos TKN Nitrite-Nitrate Ammonia-N Chl a(mg/L) (mg/L) (mg/L) (ug/L)(mg/L)
Alk(ppm)
Hard(ppm)
Turbidity(NTU)
1 0.068 .571 .0067 .012 11.4 69 123.231 3.45
Season: Fall
Station Tot Phos TKN Nitrite-Nitrate Ammonia-N Chl a(mg/L) (mg/L) (mg/L) (ug/L)(mg/L)
Alk(ppm)
Hard(ppm)
Turbidity(NTU)
1 0.032 0.733 0.551 0.171 14.4 64 104.7 1.72
outlet 0.03 0.584 0.345 0.077 10.4 46 69.768 1.14
"ND" indicates the result is at a concentration below the analytical method's Reporting Limit (RL). See Volume 1, Methods.Sample Device - Horizontal Polycarbonate Sampler
-A blank parameter result means the parameter could not be analyzed due to laboratory error.

AMBIENT LAKE MONITORING NETWORKLake Name Upper Mount Hope Lake County MorrisSite ID NJW04459-070 Municipality Rockaway Twp.
INSERT LAKE MAP W/ AREAL EXTENT
Carlson's Trophic Index (TSI)
Season TSIP TSIC TSIS TSISpringStation 1 60.56 43.7 65.14 56.47
EutrophicSummerStation 1 46.61 54.3 O 50.45
EutrophicFallStation 1 38.73 47.14 B 42.94
Mesotrophic
Total Phosphorus exceeds SWQC threshold (See Datasheet for actual concentration)B - Secchi visible to Lake bottom. (See Datasheet for total depth)O - Secchi obstructed by vegetation.
Observations
Spring-highly vegetated on bottom of entire lake, no outlet observed, possible lake to lake outlet, drainage ditch on north side of boat launch
Summer-excess SAV throughout, swans, fish, ducks, heron, filamentous algae covers approx 50% of lake
Fall-some SAV

AMBIENT LAKE MONITORING NETWORK
NJW04459-070
Upper Mount Hope LakeLake Name: SiteID: ROCKAWAY TWPMunicipality:
County: MORRIS
Surface to Bottom Profile
Season: Spring
Station Profile Depth Water Temp DO pH Conductivity(M) (C ) (SU) (mS/cm)(mg/L)
Tot. Depth(M)
Secchi(M)
DO(%Sat)
1 16.3 7.59 9.96 0.31.7 0.7 77.81
Season: Summer
Station Profile Depth Water Temp DO pH Conductivity(M) (C ) (SU) (mS/cm)(mg/L)
Tot. Depth(M)
Secchi(M)
DO(%Sat)
1 26.02 3.8 7.69 0.2781.6 1.6 47.81
Season: Fall
Station Profile Depth Water Temp DO pH Conductivity(M) (C ) (SU) (mS/cm)(mg/L)
Tot. Depth(M)
Secchi(M)
DO(%Sat)
1 17.9 7.58 7.92 0.2931.5 1.5 81.81
-Secchi measurements are not recorded for outlets.-A blank Secchi measurement for lake stations means that an accurate measurement could not be recorded.-A blank parameter result means the parameter could not be measured due to a meter malfunction.
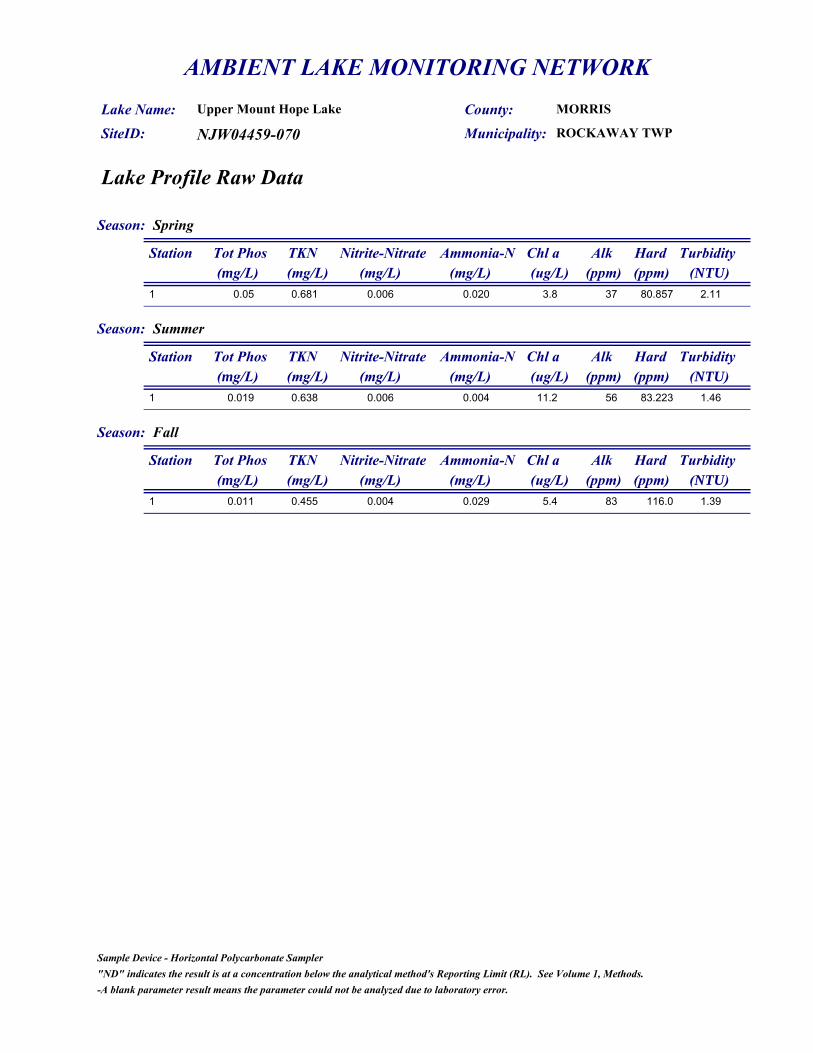
AMBIENT LAKE MONITORING NETWORK
NJW04459-070
Upper Mount Hope LakeLake Name: SiteID: ROCKAWAY TWPMunicipality:
County: MORRIS
Lake Profile Raw Data
Season: Spring
Station Tot Phos TKN Nitrite-Nitrate Ammonia-N Chl a(mg/L) (mg/L) (mg/L) (ug/L)(mg/L)
Alk(ppm)
Hard(ppm)
Turbidity(NTU)
1 0.05 0.681 0.006 0.020 3.8 37 80.857 2.11
Season: Summer
Station Tot Phos TKN Nitrite-Nitrate Ammonia-N Chl a(mg/L) (mg/L) (mg/L) (ug/L)(mg/L)
Alk(ppm)
Hard(ppm)
Turbidity(NTU)
1 0.019 0.638 0.006 0.004 11.2 56 83.223 1.46
Season: Fall
Station Tot Phos TKN Nitrite-Nitrate Ammonia-N Chl a(mg/L) (mg/L) (mg/L) (ug/L)(mg/L)
Alk(ppm)
Hard(ppm)
Turbidity(NTU)
1 0.011 0.455 0.004 0.029 5.4 83 116.0 1.39
"ND" indicates the result is at a concentration below the analytical method's Reporting Limit (RL). See Volume 1, Methods.Sample Device - Horizontal Polycarbonate Sampler
-A blank parameter result means the parameter could not be analyzed due to laboratory error.

AMBIENT LAKE MONITORING NETWORKLake Name Watchung Lake County SomersetSite ID NJW04459-245 Municipality Watchung Boro
INSERT LAKE MAP W/ AREAL EXTENT
Carlson's Trophic Index (TSI)
Season TSIP TSIC TSIS TSISpringStation 1 32.21 58.68 58.63 49.84
MesotrophicSummerStation 1 65 68.94 63.22 65.72
EutrophicFallStation 1 61.67 53.76 51.53 55.65
Eutrophic
TP exceeds SWQC threshold (See Datasheet for actual concentration)
Observations
Spring-filamentous algae
Fall-algae along banks

AMBIENT LAKE MONITORING NETWORK
NJW04459-245
Watchung LakeLake Name: SiteID: WATCHUNG BOROMunicipality:
County: SOMERSET
Surface to Bottom Profile
Season: Spring
Station Profile Depth Water Temp DO pH Conductivity(M) (C ) (SU) (mS/cm)(mg/L)
Tot. Depth(M)
Secchi(M)
DO(%Sat)
1 22.98 8.78 8.34 0.4582.4 1.1 102.81
1 15.96 6.75 7.29 0.442.4 1.1 68.42
outlet 25.23 5.99 7.98 0.4520.2 72.90.1
Season: Summer
Station Profile Depth Water Temp DO pH Conductivity(M) (C ) (SU) (mS/cm)(mg/L)
Tot. Depth(M)
Secchi(M)
DO(%Sat)
1 27.38 9.7 8.57 0.3552.3 0.8 120.71
1 25.92 7.99 7.89 0.3782.3 0.8 91.42
outlet 28.54 5.04 8.22 0.3551 64.60.1
Season: Fall
Station Profile Depth Water Temp DO pH Conductivity(M) (C ) (SU) (mS/cm)(mg/L)
Tot. Depth(M)
Secchi(M)
DO(%Sat)
1 16.48 7.21 7.31 0.3022.7 1.8 73.61
1 16.07 5.45 7.24 0.3172.7 1.8 56.42
outlet 16.37 7.55 7.48 0.3140.1 77.30.1
-Secchi measurements are not recorded for outlets.-A blank Secchi measurement for lake stations means that an accurate measurement could not be recorded.-A blank parameter result means the parameter could not be measured due to a meter malfunction.

AMBIENT LAKE MONITORING NETWORK
NJW04459-245
Watchung LakeLake Name: SiteID: WATCHUNG BOROMunicipality:
County: SOMERSET
Lake Profile Raw Data
Season: Spring
Station Tot Phos TKN Nitrite-Nitrate Ammonia-N Chl a(mg/L) (mg/L) (mg/L) (ug/L)(mg/L)
Alk(ppm)
Hard(ppm)
Turbidity(NTU)
1 0.007 0.468 0.291 0.017 17.5 66 144.2 3.22
outlet 0.03 0.494 0.333 0.050 11.7 68 145.9 2.98
Season: Summer
Station Tot Phos TKN Nitrite-Nitrate Ammonia-N Chl a(mg/L) (mg/L) (mg/L) (ug/L)(mg/L)
Alk(ppm)
Hard(ppm)
Turbidity(NTU)
1 0.068 0.979 0.006 0.017 49.8 68 128.9 9.51
outlet 0.057 0.654 0.069 0.033 24.5 71 128.9 5.57
Season: Fall
Station Tot Phos TKN Nitrite-Nitrate Ammonia-N Chl a(mg/L) (mg/L) (mg/L) (ug/L)(mg/L)
Alk(ppm)
Hard(ppm)
Turbidity(NTU)
1 0.054 0.478 0.554 0.204 10.6 64 110.7 4.98
outlet 0.05 0.405 0.736 0.089 5.9 61 116.4 4.19
"ND" indicates the result is at a concentration below the analytical method's Reporting Limit (RL). See Volume 1, Methods.Sample Device - Horizontal Polycarbonate Sampler
-A blank parameter result means the parameter could not be analyzed due to laboratory error.