Embed Size (px)
Citation preview

Amended Trauma Service Area Assessment
Florida Department of Health
Bureau of Emergency Medical Oversight
Health Information and Policy Analysis Program
Date: March 24, 2014

Contents
Data Sources ................................................................................................................................. 3
Glossary of Terms .......................................................................................................................... 3
Review of the Assignment of the 67 Counties to Trauma Service Areas .............................. 5
Trauma Center Funding ............................................................................................................... 6
Trauma Service Areas .................................................................................................................. 7
Trauma Service Area 1 ............................................................................................................. 7
Trauma Service Area 2 ............................................................................................................. 7
Trauma Service Area 3 ............................................................................................................. 9
Trauma Service Area 4 ........................................................................................................... 10
Trauma Service Area 5 ........................................................................................................... 11
Trauma Service Area 6 ........................................................................................................... 12
Trauma Service Area 7 ........................................................................................................... 13
Trauma Service Area 8 ........................................................................................................... 14
Trauma Service Area 9 ........................................................................................................... 15
Trauma Service Area 10 ......................................................................................................... 16
Trauma Service Area 11 ......................................................................................................... 17
Trauma Service Area 12 ......................................................................................................... 18
Trauma Service Area 13 ......................................................................................................... 19
Trauma Service Area 14 ......................................................................................................... 20
Trauma Service Area 15 ......................................................................................................... 21
Trauma Service Area 16 ......................................................................................................... 22
Trauma Service Area 17 ......................................................................................................... 23
Trauma Service Area 18 ......................................................................................................... 24
Trauma Service Area 19 ......................................................................................................... 25
Conclusion ................................................................................................................................... 26

3
Data Sources
The hospital discharge dataset is collected by the Agency for Health Care
Administration (AHCA). It is a comprehensive set of all hospitalizations in the state.
Records used for this report are for 2012.
The Florida Emergency Medical Services Tracking and Reporting System (EMSTARS)
collects incident-level information on millions of EMS incidents every year, for
benchmarking and quality improvement initiatives. EMSTARS currently contains over
nine million records. The EMSTARS data used for this report is for 2009-2012.
The Florida Trauma Registry collects patient-level data from the state’s verified and
provisional trauma centers, as authorized by section 395.404(1), Florida Statutes.
Verified and provisional trauma centers must maintain a comprehensive database
of those injured patients treated within the hospital. The records used for this report
are 2010-2012, the three most recent years available.
The data regarding severely injured patients was derived from the AHCA hospital
discharge database for 2012.
US Census Data was used to determine TSA demographics. Population is based on
2012 estimates.
Glossary of Terms
1) Acute Care Hospital – An acute care hospital is defined by the Agency for
Health Care Administration as a facility type that is equal to a hospital with acute
care bed capacity. Acute care hospitals include trauma centers.
2) Statutory Trauma Center Patient Volume – Defined by section 395.402(1), Florida
Statutes. Florida counties with a population of more than 500,000 are Duval,
Brevard, Miami-Dade, Hillsborough, Lee, Orange, Palm Beach, Pinellas, and Polk.
3) Annual Trauma Patient Volume – Trauma patient volume is derived from the state
trauma registry for records submitted by provisional and verified trauma centers
for 2012. No inclusion criteria were applied to the self-reported volumes.
4) ICISS: International Classification Injury Severity Score, ICISS is derived using the
Agency for Health Care Administration discharge database.
Probability of Survival (SRR=Survival Risk Ratio): ratio of the number
of patients with that injury code who have survived to the total
number of patients diagnosed with that code
Age is included as a predictor variable with the SRR
5) Severely Injured Patient – A patient with injuries as defined in the National
Trauma Data Standard Patient Inclusion criteria with an ICISS score of < .85,
excluding a length of stay of less than 24 hours or isolated hip fractures.

4
6) Severely Injured Patients Discharged from Acute Care Hospitals – The number of
severely injured patients that were discharged from an acute care hospital
(excluding trauma centers) as reflected by the AHCA database of 2012.
7) Annual Percent of Patients Discharged from Acute Care Hospitals – The total
number of severely injured patients discharged from acute care hospitals
(excluding trauma centers) divided by total number of severely injured patients.
8) Rotor Wing Aircraft – Rotor Wing Aircraft includes all rotary winged aircraft
permitted by the Department. The total number of aircraft per TSA is derived
from the Customer Oriented Medical Practitioner Administration System
(COMPAS). Aircraft such as jets or airplanes are considered fixed wing aircraft
and are not included in this measure. This is a static look at the COMPAS
database for a specific time period and does not differentiate between active
and inactive aircraft. Aircraft represented in this assessment may service multiple
TSAs.
9) Permitted EMS Ground Vehicles – A vehicle that is permitted by the department
to perform Basic Life Support or Advanced Life Support and transport patients to
a receiving facility. The total number of permitted EMS ground vehicles per TSA is
derived from a static look from the COMPAS database and does not
differentiate between active and inactive vehicles. EMS ground vehicles
represented in this assessment may service multiple TSAs.
10) EMS Ground Vehicle to Population Ratio – The total number of permitted ground
vehicles, regardless of transport or non-transport status, to a population of 10,000
residents. (Total number EMS Ground Vehicles/Population)*10,000
11) EMS Ground Vehicle to 100 Square Miles Ratio – The total number of permitted
ground vehicles, regardless of transport or non-transport status, to 100 square
miles. (Total number EMS ground Vehicles/Total Land Area)*100
12) Median Transport Time – The median EMS transport time is derived from the
Emergency Medical Services Tracking and Reporting System (EMSTARS). All
patients transported to a hospital licensed as a verified trauma center are
included regardless of illness or injury. EMS transport time is the difference
between the time the unit left the scene and the time the EMS unit arrived at the
hospital. Transport time includes all EMSTARS records submitted from 2009 to 2012
with a Type of Service Requested equal to 911 scene or intercept. Records that
had a median transport time of greater than two hours were excluded.

5
Review of the Assignment of the 67 Counties to Trauma Service Areas
Since 1990, Florida's 67 counties have been assigned to 19 trauma service areas (TSAs)
pursuant to section 395.402, Florida Statutes. As required by legislative amendments to
the trauma statutes in 2004, the assignment of counties to TSAs is to be reviewed
annually. The first such review occurred on February 1, 2005, when the Department
released A Comprehensive Assessment of the Florida Trauma System which was
conducted by the University of South Florida. The 2005 assessment considered
transforming Florida's TSAs so that the boundaries of the TSAs would be identical to the
boundaries of the Regional Domestic Security Task Forces (RDSTFs), thus realigning
counties and reducing the number of TSAs to seven. While the assessment determined
it may be possible to transform the TSAs into areas that coincide with the RDSTFs, it
noted that regional trauma agencies would need to be developed in each of the
larger geographical areas in order to make the transformation feasible.
As part of this assessment, the Department again evaluated the possibility of altering
the current county assignments to establish TSAs that are identical to the RDSTFs. At this
time, Florida has just one regional trauma agency and three local trauma agencies.
None of the regional or local trauma agencies have boundaries that are identical to
the RDSTFs. Neither the one regional trauma system plan in existence nor the state
trauma system plan recommend realignment of counties into the RDSTFs for allocation
purposes. While the RDSTFs present opportunities for planning and performance
improvement, the RDSTFs are too large of a geographic area to ensure the even
distribution of trauma centers throughout Florida. Without the existence of regional
trauma agencies in each of the trauma regions, the allocation of trauma centers
throughout the state should continue to be guided by the more geographically
compact TSAs.
Also as part of this assessment, the Department evaluated the current county
assignments to TSAs. The existing TSAs have been used to guide trauma center
development in Florida since 1990 and are familiar to all stakeholders of the trauma
system. On review, the Department has determined that none of the current county
assignments require realignment at this time. The most appropriate alignment of
counties is described in section 395.402(4)(a), Florida Statutes.

6
Trauma Center Funding
As noted by the American College of Surgeons in its Trauma System Consultation
Report, "Florida is fortunate to have several funding sources to support the trauma
program." The Florida Legislature provides funding for existing trauma centers through
portions of the revenue from the vehicle registration taxes and red light camera fines.
The funding provided to existing trauma centers has increased significantly in the past
two years as a result of the installation of red light cameras throughout Florida. For
example, funds distributed to trauma centers in calendar year 2011 totaled
$5,163,848.64, and in 2012, that number more than doubled with distributions to trauma
centers totaling $12,683,771.76.
The current funding methodology is prescribed by section 395.4036, Florida Statutes,
and uses trauma patient volumes to disburse funds. As part of its Trauma System
Consultation Report, the American College of Surgeons’ system consultation team
recommended changes to Florida's current funding methodology.
As the needs of the Trauma Program and trauma system change, the
Trauma Program should consider revising the statutes and rules governing
the trauma fund to ensure that designated trauma centers receive level-
appropriate support for the "cost of readiness." In addition, distribution of
funds should focus on the deliverables established by the Trauma Program
rather than volume and acuity exclusively.
The Department concurs with the assessment of the system consultation team.

7
Trauma Service Areas
Trauma Service Area 1
TSA Emergency Medical Services
# of Rotor Wing Aircraft 2
# of Permitted EMS Ground 87
Vehicles
EMS Ground Vehicle to 1.23:10,000
Population Ratio
EMS Ground Vehicle 2.4:100
to100 Square Miles Ratio
Median Transport Time 00:14:00
hh:mm:ss
TSA Trauma System Information
# Verified Level I Trauma Centers 0
# Verified Level II Trauma Centers 2
# of Acute Care Hospitals 11
Statutory Patient Volume 1,000
Annual Trauma Patient 2,544
Volume Reported by Trauma
Centers
# of Severely Injured Patients 447
Annual # of Severely Injured Patients 93
Discharged from Acute Care Hospitals
Annual % of Severely Injured 20.8%
Patients Discharged from Acute
Care Hospitals
TSA Demographics
Population 708,892 Population Density 194.97
10 Year Population 13.7%
Growth Rate
Median Age 37.9
% Persons 65 & Over 13.2%
% Persons Under 18 20.02%
Total Land Area 3,635 sq Miles
8
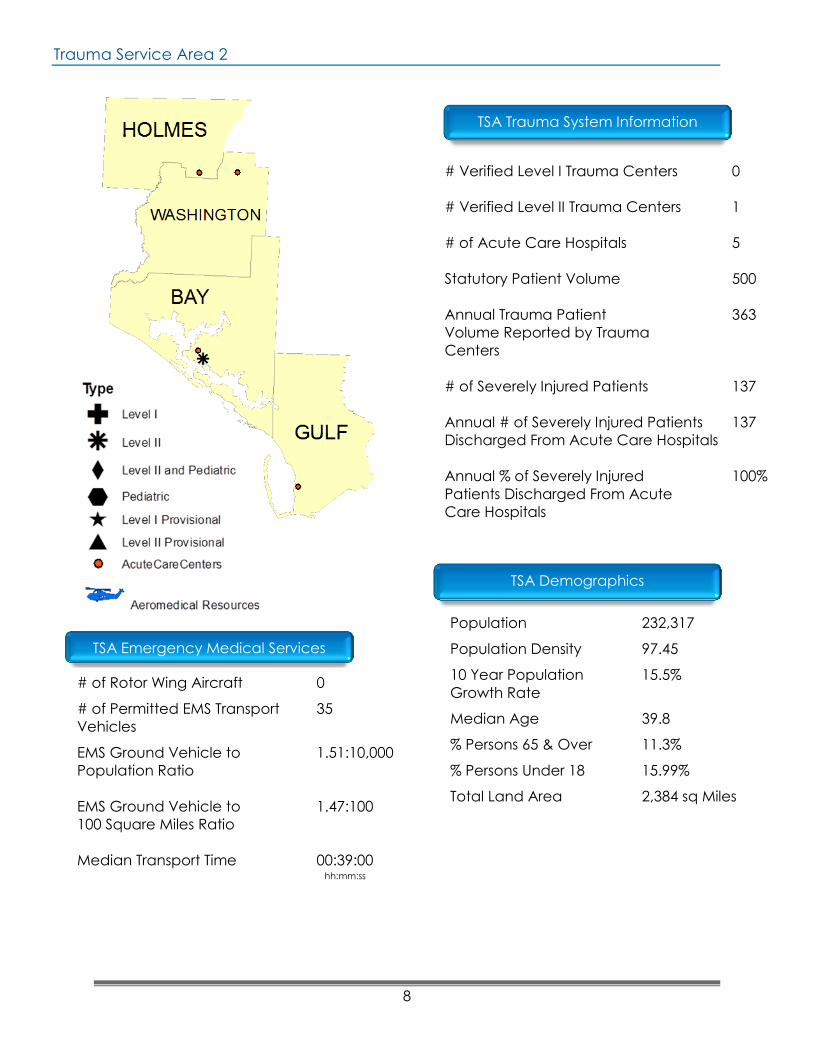
Trauma Service Area 2
TSA Emergency Medical Services
TSA Demographics
Population 232,317
Population Density 97.45
10 Year Population 15.5%
Growth Rate
Median Age 39.8
% Persons 65 & Over 11.3%
% Persons Under 18 15.99%
Total Land Area 2,384 sq Miles
# Verified Level I Trauma Centers 0
# Verified Level II Trauma Centers 1
# of Acute Care Hospitals 5
Statutory Patient Volume 500
Annual Trauma Patient 363
Volume Reported by Trauma
Centers
# of Severely Injured Patients 137
Annual # of Severely Injured Patients 137
Discharged From Acute Care Hospitals
Annual % of Severely Injured 100%
Patients Discharged From Acute
Care Hospitals
TSA Trauma System Information
# of Rotor Wing Aircraft 0
# of Permitted EMS Transport 35
Vehicles
EMS Ground Vehicle to 1.51:10,000
Population Ratio
EMS Ground Vehicle to 1.47:100
100 Square Miles Ratio
Median Transport Time 00:39:00
hh:mm:ss

9
Trauma Service Area 3
# of Rotor Wing Aircraft 2
# of Permitted EMS Transport 95
Vehicles
EMS Vehicle to Population 1.91:10,000
Ratio
EMS Vehicle to 100 Square 1.36:100
Miles Ratio
Median Transport Time 00:16:18
hh:mm:ss
Population 498,882
Population Density 70.68
10 Year Population 8.0%
Growth Rate
Median Age 39.8
% Persons 65 & Over 12.52%
% Persons Under 14 16.62%
Total Land Area 6,982 sq Miles
Annual Average Daily 8,430,177
Traffic
TSA Trauma System Information
# Verified Level I Trauma Centers 0
# Verified Level II Trauma Centers 1
# of Acute Care Hospitals 9
Statutory Patient Volume 500
Annual Trauma Patient 1,292
Volume Reported by Trauma
Centers
# of Severely Injured Patients 289
Annual # of Severely Injured Patients 32
Discharged From Acute Care Hospitals
Annual % of Severely Injured 11.1%
Patients Discharged From Acute
Care Hospitals
# of Rotor Wing Aircraft 3
# of Permitted EMS Transport 95
Vehicles
EMS Ground Vehicle to 1.90:10,000
Population Ratio
EMS Ground Vehicle to 1.36:100
100 Square Miles Ratio
Median Transport Time 00:33:00
hh:mm:ss
Population 500,675
Population Density 71.71
10 Year Population 14.8%
Growth Rate
Median Age 30.2
% Persons 65 & Over 5.9%
% Persons Under 18 10.51%
Total Land Area 6,982 sq Miles
TSA Demographics
TSA Emergency Medical Services

10
Trauma Service Area 4
TSA Trauma System Information
TSA Demographics
Population 575,041
Population Density 83.87
10 Year Population 14.5%
Growth Rate
Median Age 38.1
% Persons 65 & Over 9.4%
% Persons Under 18 13.16%
Total Land Area 6,856 sq Miles
# Verified Level I Trauma Centers 1
# Verified Level II Trauma Centers 0
# of Acute Care Hospitals 10
Statutory Patient Volume 1,000
Annual Trauma Patient 2,745
Volume Reported by Trauma
Centers
# of Severely Injured Patients 537
Annual # of Severely Injured Patients 63
Discharged From Acute Care Hospitals
Annual % of Severely Injured 11.7%
Patients Discharged From Acute
Care Hospitals
TSA Emergency Medical Services
# of Rotor Wing Aircraft 4
# of Permitted EMS Transport 96
Vehicles
EMS Ground Vehicle to 1.68:10,000
Population Ratio
EMS Ground Vehicle to 1.40:100
100 Square Miles Ratio
Median Transport Time 00:51:00
hh:mm:ss
11
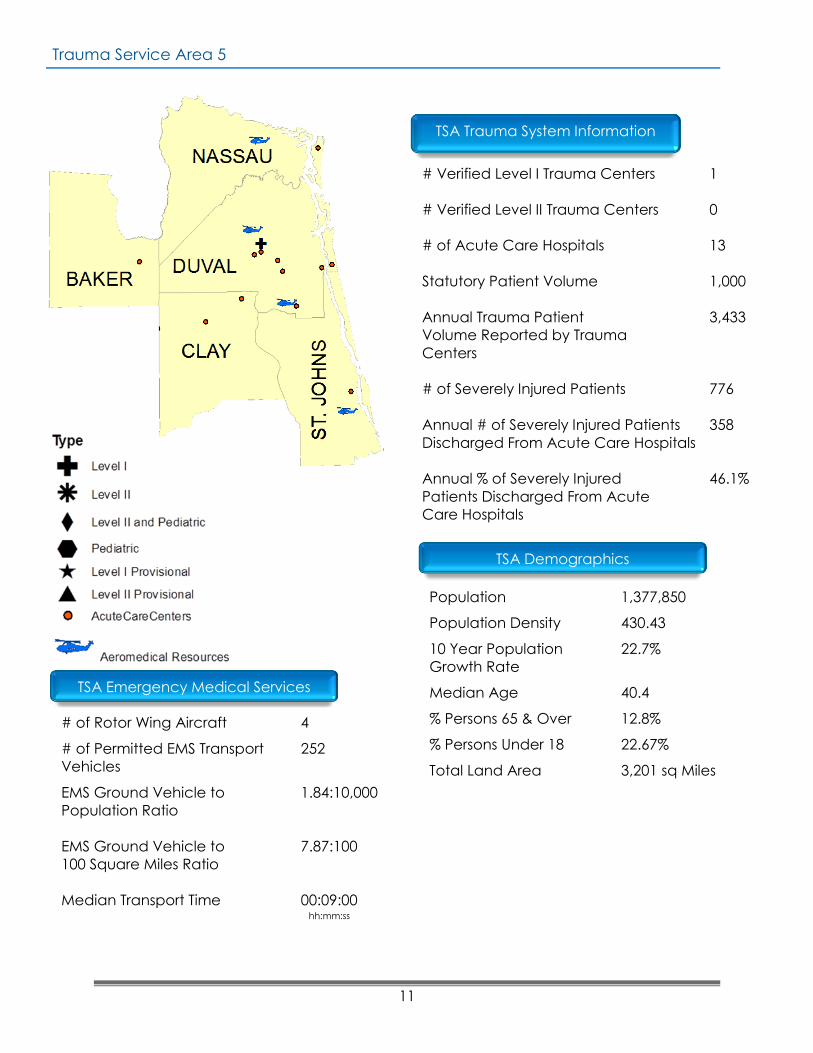
Trauma Service Area 5
TSA Emergency Medical Services
# of Rotor Wing Aircraft 4
# of Permitted EMS Transport 252
Vehicles
EMS Ground Vehicle to 1.84:10,000
Population Ratio
EMS Ground Vehicle to 7.87:100
100 Square Miles Ratio
Median Transport Time 00:09:00
hh:mm:ss
TSA Trauma System Information
# Verified Level I Trauma Centers 1
# Verified Level II Trauma Centers 0
# of Acute Care Hospitals 13
Statutory Patient Volume 1,000
Annual Trauma Patient 3,433
Volume Reported by Trauma
Centers
# of Severely Injured Patients 776
Annual # of Severely Injured Patients 358
Discharged From Acute Care Hospitals
Annual % of Severely Injured 46.1%
Patients Discharged From Acute
Care Hospitals
TSA Demographics
Population 1,377,850
Population Density 430.43
10 Year Population 22.7%
Growth Rate
Median Age 40.4
% Persons 65 & Over 12.8%
% Persons Under 18 22.67%
Total Land Area 3,201 sq Miles

12
Trauma Service Area 6
TSA Emergency Medical Services
# of Rotor Wing Aircraft 2
# of Permitted EMS Transport 78
Vehicles
EMS Ground Vehicle to 1.19:10,000
Population Ratio
EMS Ground Vehicle to 2.96:100
100 Square Miles Ratio
Median Transport Time 00:22:00
hh:mm:ss
TSA Trauma System Information
# Verified Level I Trauma Centers 0
# Verified Level II Trauma Centers 0
# of Acute Care Hospitals 8
Statutory Patient Volume 0
Annual Trauma Patient 80
Volume Reported by Trauma
Centers
# of Severely Injured Patients 216
Annual # of Severely Injured Patients 216
Discharged From Acute Care Hospitals
Annual % of Severely Injured 100%
Patients Discharged From Acute
Care Hospitals
TSA Demographics
Population 647,907
Population Density 245.53
10 Year Population 27.6%
Growth Rate
Median Age 48
% Persons 65 & Over 28.2%
% Persons Under 18 18.36%
Total Land Area 2,639 sq Miles

13
Trauma Service Area 7
TSA Emergency Medical Services
# of Rotor Wing Aircraft 4
# of Permitted EMS Transport 73
Vehicles
EMS Ground Vehicle to 1.22:10,000
Population Ratio
EMS Ground Vehicle to 4.60:100
100 Square Miles Ratio
Median Transport Time 00:12:05
hh:mm:ss
TSA Trauma System Information
# Verified Level I Trauma Centers 0
# Verified Level II Trauma Centers 1
# of Acute Care Hospitals 8
Statutory Patient Volume 500
Annual Trauma Patient 1,936
Volume Reported by Trauma
Centers
# of Severely Injured Patients 369
Annual # of Severely Injured Patients 99
Discharged From Acute Care Hospitals
Annual % of Severely Injured 26.8%
Patients Discharged From Acute
Care Hospitals
TSA Demographics
Population 595,309
Population Density 375.24
10 Year Population 20.7%
Growth Rate
Median Age 47.85
% Persons 65 & Over 22.8%
% Persons Under 18 18.45%
Total Land Area 1,586 sq Miles
14
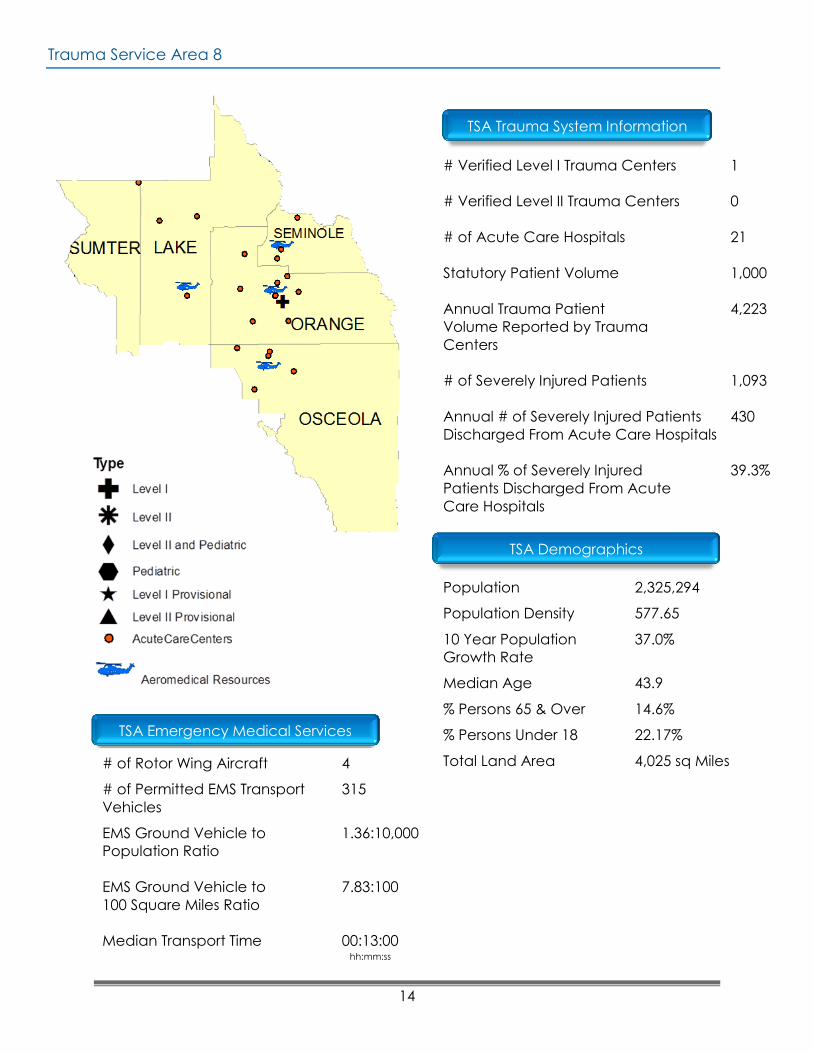
Trauma Service Area 8
TSA Emergency Medical Services
# of Rotor Wing Aircraft 4
# of Permitted EMS Transport 315
Vehicles
EMS Ground Vehicle to 1.36:10,000
Population Ratio
EMS Ground Vehicle to 7.83:100
100 Square Miles Ratio
Median Transport Time 00:13:00
hh:mm:ss
TSA Trauma System Information
# Verified Level I Trauma Centers 1
# Verified Level II Trauma Centers 0
# of Acute Care Hospitals 21
Statutory Patient Volume 1,000
Annual Trauma Patient 4,223
Volume Reported by Trauma
Centers
# of Severely Injured Patients 1,093
Annual # of Severely Injured Patients 430
Discharged From Acute Care Hospitals
Annual % of Severely Injured 39.3%
Patients Discharged From Acute
Care Hospitals
TSA Demographics
Population 2,325,294
Population Density 577.65
10 Year Population 37.0%
Growth Rate
Median Age 43.9
% Persons 65 & Over 14.6%
% Persons Under 18 22.17%
Total Land Area 4,025 sq Miles

15
Trauma Service Area 9
TSA Emergency Medical Services
# of Rotor Wing Aircraft 0
# of Permitted EMS Transport 129
Vehicles
EMS Ground Vehicle to 0.92:10,000
Population Ratio
EMS Ground Vehicle to 12.64:100
100 Square Miles Ratio
Median Transport Time 00:12:08
hh:mm:ss
TSA Trauma System Information
# Verified Level I Trauma Centers 0
# Verified Level II Trauma Centers 2
# of Acute Care Hospitals 19
Statutory Patient Volume 1,500
Annual Trauma Patient 3,977
Volume Reported by Trauma
Centers
# of Severely Injured Patients 937
Annual # of Severely Injured Patients 608
Discharged From Acute Care Hospitals
Annual % of Severely Injured 64.9%
Patients Discharged From Acute
Care Hospitals
TSA Demographics
Population 1,391,710
Population Density 1,363.50
10 Year Population 9.9%
Growth Rate
Median Age 43.9
% Persons 65 & Over 21.9%
% Persons Under 18 18.45%
Total Land Area 1,021 sq Miles

16
Trauma Service Area 10
TSA Emergency Medical Services
# of Rotor Wing Aircraft 2
# of Permitted EMS Transport 193
Vehicles
EMS Ground Vehicle to 1.51:10,000
Population Ratio
EMS Ground Vehicle to 18.92:100
100 Square Miles Ratio
Median Transport Time 00:13:00
hh:mm:ss
TSA Trauma System Information
# Verified Level I Trauma Centers 1
# Verified Level II Trauma Centers 1
# of Acute Care Hospitals 12
Statutory Patient Volume 2,000
Annual Trauma Patient 4,788
Volume Reported by Trauma
Centers
# of Severely Injured Patients 949
Annual # of Severely Injured Patients 160
Discharged From Acute Care Hospitals
Annual % of Severely Injured 16.9%
Patients Discharged From Acute
Care Hospitals
TSA Demographics
Population 1,277,746
Population Density 1,252.43
10 Year Population 27.9%
Growth Rate
Median Age 36.4
% Persons 65 & Over 12.4%
% Persons Under 18 23.33%
Total Land Area 1,020 sq Miles

17
Trauma Service Area 11
TSA Emergency Medical Services
# of Rotor Wing Aircraft 2
# of Permitted EMS Transport 83
Vehicles
EMS Ground Vehicle to 1.12:10,000
Population Ratio
EMS Ground Vehicle to 2.40:100
100 Square Miles Ratio
Median Transport Time 00:21:00
hh:mm:ss
TSA Trauma System Information
# Verified Level I Trauma Centers 0
# Verified Level II Trauma Centers 1
# of Acute Care Hospitals 10
Statutory Patient Volume 1,000
Annual Trauma Patient 1,413
Volume Reported by Trauma
Centers
# of Severely Injured Patients 409
Annual # of Severely Injured Patients 103
Discharged From Acute Care Hospitals
Annual % of Severely Injured 25.2%
Patients Discharged From Acute
Care Hospitals
TSA Demographics
Population 741,800
Population Density 214.87
10 Year Population 24.0%
Growth Rate
Median Age 46.3
% Persons 65 & Over 20.0%
% Persons Under 18 21.51%
Total Land Area 3,452 sq Miles

18
Trauma Service Area 12
TSA Emergency Medical Services
# of Rotor Wing Aircraft 1
# of Permitted EMS Transport 67
Vehicles
EMS Ground Vehicle to 0.97:10,000
Population Ratio
EMS Ground Vehicle to 4.41:100
100 Square Miles Ratio
Median Transport Time 00:11:00
hh:mm:ss
TSA Trauma System Information
# Verified Level I Trauma Centers 0
# Verified Level II Trauma Centers 1
# of Acute Care Hospitals 9
Statutory Patient Volume 1,000
Annual Trauma Patient 1,657
Volume Reported by Trauma
Centers
# of Severely Injured Patients 359
Annual # of Severely Injured Patients 137
Discharged From Acute Care Hospitals
Annual % of Severely Injured 38.2%
Patients Discharged From Acute
Care Hospitals
TSA Demographics
Population 687,874
Population Density 452.99
10 Year Population 16.8%
Growth Rate
Median Age 48.2
% Persons 65 & Over 23.0%
% Persons Under 18 18.90%
Total Land Area 1,519 sq Miles

19
Trauma Service Area 13
Population 755,737
Population Density 380.78
10 Year Population 14.5%
Growth Rate
Median Age 45.3
% Persons 65 & Over 27.57%
% Persons Under 14 14.68%
Total Land Area 1,936 sq Miles
Annual Average Daily 9,184,615
Traffic
# of Rotor Wing Aircraft 1
# of Permitted EMS Transport 77
Vehicles
EMS Vehicle to Population 1.03:10,000
Ratio
EMS Vehicle to 100 Square 3.98:100
Miles Ratio
Median Transport Time 00:11:00
hh:mm:ss
TSA Emergency Medical Services
# of Rotor Wing Aircraft 1
# of Permitted EMS Transport 77
Vehicles
EMS Ground Vehicle to 1.02:10,000
Population Ratio
EMS Ground Vehicle to 3.98:100
100 Square Miles Ratio
Median Transport Time 00:16:00
hh:mm:ss
TSA Trauma System Information
# Verified Level I Trauma Centers 0
# Verified Level II Trauma Centers 1
# of Acute Care Hospitals 8
Statutory Patient Volume 500
Annual Trauma Patient 890
Volume Reported by Trauma
Centers
# of Severely Injured Patients 458
Annual # of Severely Injured Patients 458
Discharged From Acute Care Hospitals
Annual % of Severely Injured 100%
Patients Discharged From Acute
Care Hospitals
TSA Demographics
Population 754,754
Population Density 389.88
10 Year Population 21.3%
Growth Rate
Median Age 49.9
% Persons 65 & Over 27.4%
% Persons Under 18 16.74%
Total Land Area 1,936 sq Miles

20
Trauma Service Area 14
Population 472,210
Population Density 246.30
10 Year Population 20.8%
Growth Rate
Median Age 42.2
% Persons 65 & Over 22.34%
% Persons Under 14 16.92%
Total Land Area 1,884 sq Miles
Annual Average Daily 5,869,950
Traffic
# of Rotor Wing Aircraft 2
# of Permitted EMS Transport 79
Vehicles
EMS Vehicle to Population 1.69:10,000
Ratio
EMS Vehicle to 100 Square 4.19:100
Miles Ratio
Median Transport Time 00:10:00
hh:mm:ss
TSA Emergency Medical Services
# of Rotor Wing Aircraft 2
# of Permitted EMS Transport 79
Vehicles
EMS Ground Vehicle to 1.67:10,000
Population Ratio
EMS Ground Vehicle to 4.19:100
100 Square Miles Ratio
Median Transport Time 00:09:00
hh:mm:ss
TSA Trauma System Information
# Verified Level I Trauma Centers 0
# Verified Level II Trauma Centers 1
# of Acute Care Hospitals 6
Statutory Patient Volume 500
Annual Trauma Patient 1,174
Volume Reported by Trauma
Centers
# of Severely Injured Patients 272
Annual # of Severely Injured Patients 87
Discharged From Acute Care Hospitals
Annual % of Severely Injured 32.0%
Patients Discharged From Acute
Care Hospitals
TSA Demographics
Population 472,150
Population Density 250.57
10 Year Population 32.9%
Growth Rate
Median Age 46.7
% Persons 65 & Over 21.9%
% Persons Under 18 18.33%
Total Land Area 1,884 sq Miles

21
Trauma Service Area 15
# of Rotor Wing Aircraft 2
# of Permitted EMS Transport 118
Vehicles
EMS Vehicle to Population 1.38:10,000
Ratio
EMS Vehicle to 100 Square 3.45:100
Miles Ratio
Median Transport Time 00:15:00
hh:mm:ss
TSA Emergency Medical Services
# of Rotor Wing Aircraft 3
# of Permitted EMS Transport 118
Vehicles
EMS Ground Vehicle to 1.36:10,000
Population Ratio
EMS Ground Vehicle to 3.45:100
100 Square Miles Ratio
Median Transport Time 00:23:00
hh:mm:ss
TSA Trauma System Information
# Verified Level I Trauma Centers 0
# Verified Level II Trauma Centers 1
# of Acute Care Hospitals 9
Statutory Patient Volume 1,000
Annual Trauma Patient 2,080
Volume Reported by Trauma
Centers
# of Severely Injured Patients 644
Annual # of Severely Injured Patients 190
Discharged From Acute Care Hospitals
Annual % of Severely Injured 29.5%
Patients Discharged From Acute
Care Hospitals
TSA Demographics
Population 858,296
Population Density 250.70
10 Year Population 36.4%
Growth Rate
Median Age 56.8
% Persons 65 & Over 25.6%
% Persons Under 18 16.93%
Total Land Area 3,424 sq Miles

22
Trauma Service Area 16
TSA Emergency Medical Services
# of Rotor Wing Aircraft 2
# of Permitted EMS Transport 204
Vehicles
EMS Ground Vehicle to 1.51:10,000
Population Ratio
EMS Ground Vehicle to 10.36:100
100 Square Miles Ratio
Median Transport Time 00:08:00
hh:mm:ss
TSA Trauma System Information
# Verified Level I Trauma Centers 1
# Verified Level II Trauma Centers 1
# of Acute Care Hospitals 14
Statutory Patient Volume 2,000
Annual Trauma Patient 3,117
Volume Reported by Trauma
Centers
# of Severely Injured Patients 786
Annual # of Severely Injured Patients 238
Discharged From Acute Care Hospitals
Annual % of Severely Injured 30.3%
Patients Discharged From Acute
Care Hospitals
TSA Demographics
Population 1,356,545
Population Density 688.69
10 Year Population 19.9%
Growth Rate
Median Age 43.6
% Persons 65 & Over 22.1%
% Persons Under 18 20.10%
Total Land Area 1,970 sq Miles

23
Trauma Service Area 17
TSA Emergency Medical Services
# of Rotor Wing Aircraft 1
# of Permitted EMS Transport 33
Vehicles
EMS Ground Vehicle to 0.98:10,000
Population Ratio
EMS Ground Vehicle to 1.65:100
100 Square Miles Ratio
Median Transport Time 00:15:51
hh:mm:ss
TSA Trauma System Information
# Verified Level I Trauma Centers 0
# Verified Level II Trauma Centers 0
# of Acute Care Hospitals 4
Statutory Patient Volume 0
Annual Trauma Patient 0
Volume Reported by Trauma
Centers
# of Severely Injured Patients 154
Annual # of Severely Injured Patients 154
Discharged From Acute Care Hospitals
Annual % of Severely Injured 100%
Patients Discharged From Acute
Care Hospitals
TSA Demographics
Population 332,427
Population Density 166.35
10 Year Population 32.2%
Growth Rate
Median Age 48
% Persons 65 & Over 28.1%
% Persons Under 18 19.02%
Total Land Area 1,998 sq Miles

24
Trauma Service Area 18
TSA Emergency Medical Services
# of Rotor Wing Aircraft 4
# of Permitted EMS Transport 277
Vehicles
EMS Ground Vehicle to 1.55:10,000
Population Ratio
EMS Ground Vehicle to 22.90:100
100 Square Miles Ratio
Median Transport Time 00:10:00
hh:mm:ss
TSA Trauma System Information
# Verified Level I Trauma Centers 2
# Verified Level II Trauma Centers 1
# of Acute Care Hospitals 16
Statutory Patient Volume 3,000
Annual Trauma Patient 5,294
Volume Reported by Trauma
Centers
# of Severely Injured Patients 913
Annual # of Severely Injured Patients 273
Discharged From Acute Care Hospitals
Annual % of Severely Injured 29.9%
Patients Discharged From Acute
Care Hospitals
TSA Demographics
Population 1,815,137
Population Density 1,500.37
10 Year Population 11.8%
Growth Rate
Median Age 40.0
% Persons 65 & Over 14.6%
% Persons Under 18 21.61%
Total Land Area 1,210 sq Miles

25
Trauma Service Area 19
TSA Emergency Medical Services
# of Rotor Wing Aircraft 7
# of Permitted EMS Transport 463
Vehicles
EMS Ground Vehicle to 1.75:10,000
P opulation Ratio
EMS Ground Vehicle to 16.07:100
100 Square Miles Ratio
Median Transport Time 00:13:01
hh:mm:ss
TSA Trauma System Information
# Verified Level I Trauma Centers 1
# Verified Level II Trauma Centers 1
# of Acute Care Hospitals 29
Statutory Patient Volume 2,000
Annual Trauma Patient 6,745
Volume Reported by Trauma
Centers
# of Severely Injured Patients 1,579
Annual # of Severely Injured Patients 837
Discharged From Acute Care Hospitals
Annual % of Severely Injured 53.0%
Patients Discharged From Acute
Care Hospitals
TSA Demographics
Population 2,665,844
Population Density 925.32
10 Year Population 14.3%
Growth Rate
Median Age 42.7
% Persons 65 & Over 14.6%
% Persons Under 18 20.88%
Total Land Area 2,881 sq Miles
26
Conclusion
Based upon available data and the reliability of the data, the Department has
determined that the following criteria should be used to evaluate the number and level
of trauma centers needed to serve the population in a defined trauma service area:
1. Population
2. Median Transport Times
3. Community Support
4. Severely Injured Patients Discharged From Acute Care Hospitals
5. The Existence of A Level I Trauma Center
6. Number of Severely Injured Patients