Embed Size (px)
Citation preview

Carlos García-MorenoChief Financial [email protected]
Daniela Lecuona TorrasInvestor Relations [email protected]
América Móvil’s second quarter of 2017 financial and operating report
Mexico City, July 18, 2017 - América Móvil, S.A.B. de C.V. (“América Móvil”) [BMV: AMX]
[NYSE: AMX, AMOV], announced today its financial and operating results for the second
quarter of 2017.
• Our postpaid wireless subscriber segment continued delivering growth as it registered an annual increase of 5.1% after net additions of 565 thousand in the quarter, including 166 thousand in Mexico and 124 thousand in Brazil.
• On the fixed-line platform broadband accesses were up 5.7% year-on-year af-ter 209 thousand new access gains in the quarter, while our Pay TV subscriber base registered 278 thousand disconnections, 1.3% of total PayTV units.
• Our second quarter revenues rose 6.9% from the year-earlier quarter to nearly 250 billion pesos, with service revenues climbing 8.1%. At constant exchange rates, service revenues were up 4.2% year-on-year, their best performance in ten quarters, driven by mobile data revenues that were up 21.8%.
• EBITDA rose 13.7% year-on-year to 69.4 billion pesos. At constant exchange rates, EBITDA shot up 10.4%, marking its strongest climb in the last five years. All our operations observed sequential increases in EBITDA, with very signifi-cant moves in Peru, Chile, Argentina, Europe, Mexico and Colombia.
• The EBITDA margin stood at 27.8%, up 0.7 percentage points from the prior quarter and up 1.7 percentage points from the year-earlier quarter. Almost all of our operations presented sequential increases in EBITDA margins.
• Our operating profit increased 21.0% from the year-earlier quarter to 31.2 billion pesos. After our comprehensive financing cost of 13.3 billion pesos, it helped bring about a net profit of 14.3 billion pesos, an 86% year-on-year increase.
• We achieved a net debt reduction of 27.0 billion pesos—in cash flow terms—in the second quarter. Our outstanding net debt has come down from 629.7 billion pesos in December to 550.8 billion pesos in June, a 12.5% decrease. This reflected positively on our net debt to EBITDA ratio which stood at 1.9x.
• Our capital expenditures totaled 51.0 billion pesos in the first half of the year, and our acquisitions 3.6 billion pesos. After adjusting for dividends received from KPN, net shareholder distributions totaled 734 million pesos in the pe-riod, mostly by way of share buy-backs.
CONTENT
Highlights
Relevant events
Subscribers
América Móvil Consolidated
Mexico
Argentina, Paraguay & Uruguay
Brazil
Chile
Colombia
Ecuador
Peru
Central America
Caribbean
USA
Austria & CEE
Glossary
Currency Exchange Rates
Postpaid net adds of 565k
2Q17
Net debt to EBITDA ratio at 1.9x
Service revenues up 4.2% YoY at constant Fx
EBITDA margin up 1.7pp YoY
Broadband accesses +5.7% YoY
EBITDA +10% YoY at constant Fx
We will host our conference call to discuss 2Q17 financial and operating results on July 19th at 9:00am Mexico
City time. To access the call please log on to www.americamovil.com/investors.
Net proft of MxP 13Bn
Capex of MxP 51 Bn in 2Q
page 2
Relevant Events
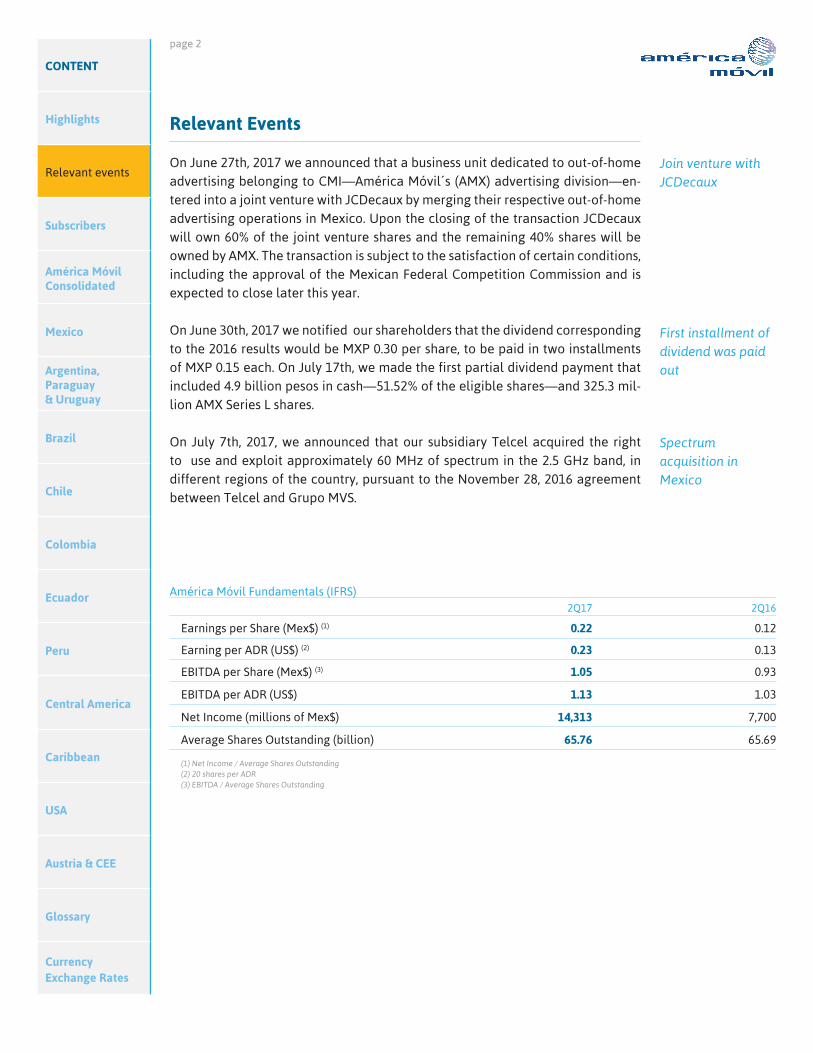
On June 27th, 2017 we announced that a business unit dedicated to out-of-home advertising belonging to CMI—América Móvil´s (AMX) advertising division—en-tered into a joint venture with JCDecaux by merging their respective out-of-home advertising operations in Mexico. Upon the closing of the transaction JCDecaux will own 60% of the joint venture shares and the remaining 40% shares will be owned by AMX. The transaction is subject to the satisfaction of certain conditions, including the approval of the Mexican Federal Competition Commission and is expected to close later this year.
On June 30th, 2017 we notified our shareholders that the dividend corresponding to the 2016 results would be MXP 0.30 per share, to be paid in two installments of MXP 0.15 each. On July 17th, we made the first partial dividend payment that included 4.9 billion pesos in cash—51.52% of the eligible shares—and 325.3 mil-lion AMX Series L shares.
On July 7th, 2017, we announced that our subsidiary Telcel acquired the right to use and exploit approximately 60 MHz of spectrum in the 2.5 GHz band, in different regions of the country, pursuant to the November 28, 2016 agreement between Telcel and Grupo MVS.
CONTENT
Highlights
Relevant events
Subscribers
América Móvil Consolidated
Mexico
Argentina, Paraguay & Uruguay
Brazil
Chile
Colombia
Ecuador
Peru
Central America
Caribbean
USA
Austria & CEE
Glossary
Currency Exchange Rates
América Móvil Fundamentals (IFRS)2Q17 2Q16
Earnings per Share (Mex$) (1) 0.22 0.12
Earning per ADR (US$) (2) 0.23 0.13
EBITDA per Share (Mex$) (3) 1.05 0.93
EBITDA per ADR (US$) 1.13 1.03
Net Income (millions of Mex$) 14,313 7,700
Average Shares Outstanding (billion) 65.76 65.69
(1) Net Income / Average Shares Outstanding (2) 20 shares per ADR (3) EBITDA / Average Shares Outstanding
Join venture with JCDecaux
First installment of dividend was paid out
Spectrum acquisition in Mexico

page 3
CONTENT
Highlights
Relevant events
Subscribers
América Móvil Consolidated
Mexico
Argentina, Paraguay & Uruguay
Brazil
Chile
Colombia
Ecuador
Peru
Central America
Caribbean
USA
Austria & CEE
Glossary
Currency Exchange Rates
América Móvil’s Subsidiaries as of June 2017
Country Brand BusinessEquity
Participation
Mexico Telcel wireless 100.0%
Telmex wireline 98.8%
Sección Amarilla (1) other 98.4%
Telvista other 89.4%
Argentina Claro wireless 100.0%
Telmex wireline 99.7%
Brazil Claro wireless/wireline 97.7%
Chile Claro wireless 100.0%
Telmex(1) wireline 100.0%
Colombia Claro wireless 99.4%
Telmex wireline 99.3%
Costa Rica Claro wireless 100.0%
Dominicana Claro wireless/wireline 100.0%
Ecuador Claro wireless/wireline 100.0%
El Salvador Claro wireless/wireline 95.8%
Guatemala Claro wireless/wireline 99.3%
Honduras Claro wireless/wireline 100.0%
Nicaragua Claro wireless/wireline 99.6%
Panama Claro wireless/wireline 100.0%
Paraguay Claro wireless/wireline 100.0%
Peru Claro wireless/wireline 100.0%
Puerto Rico Claro wireless/wireline 100.0%
Uruguay Claro wireless/wireline 100.0%
USA Tracfone wireless 100.0%
Netherlands KPN wireless/wireline 21.1%
Austria Telekom Austria wireless/wireline 51.0%
(1) Equity Participation of Telmex Internacional of which América Móvil owns 97.88%.
Access Lines
We ended June with 363 million access lines, practically flat from a year before, with our fixed-RGUs increasing 1.1% and our wireless base declining 1.0%. Access lines included 280 million wireless subscribers, 33.3 million landlines, 27.5 million broadband accesses and 21.8 million PayTV units.
In the second quarter our wireless subscriber base increased by 215 thousand subscribers, having added 565 thousand postpaid subs—including 166 thousand in Mexico and 124 thousand in Brazil—and disconnected 350 thousand prepaid subs. Our postpaid base was up 5.1% with Chile’s increasing 17.8%, Brazil’s 10.0%, Colombia’s 7.7% and Mexico’s 6.4%.
363M accesses
Postpaid sub base +5.1% YoY
page 4
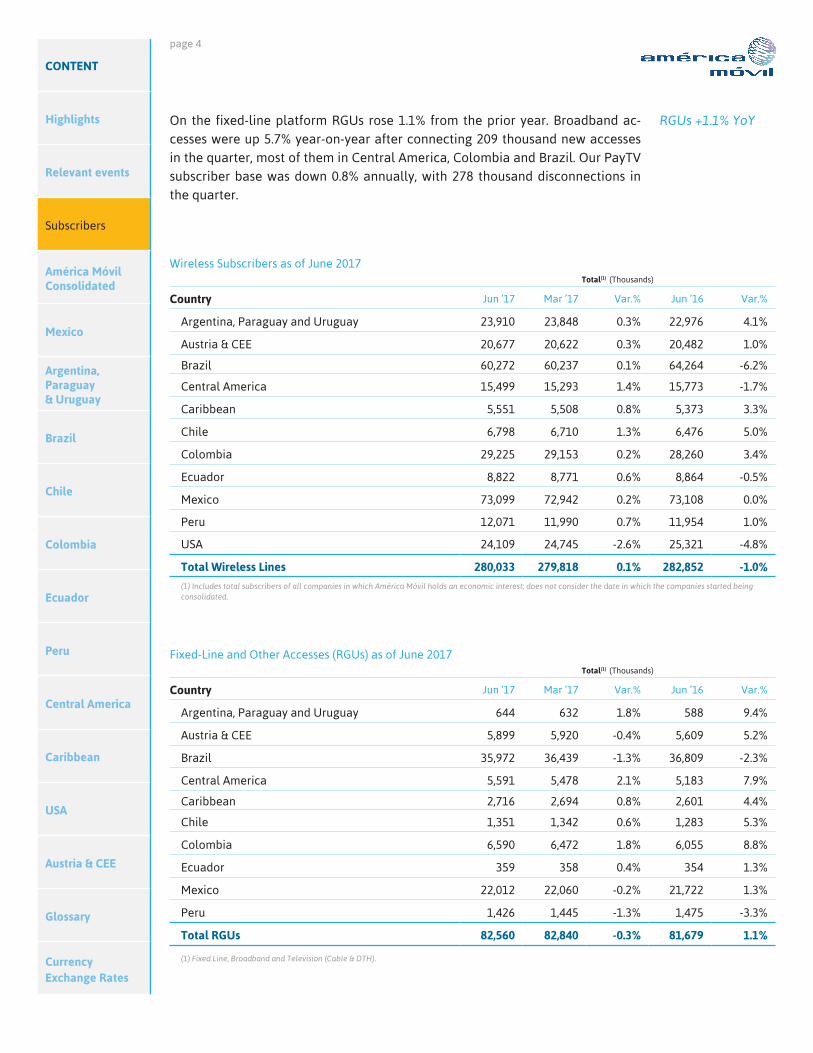
On the fixed-line platform RGUs rose 1.1% from the prior year. Broadband ac-cesses were up 5.7% year-on-year after connecting 209 thousand new accesses in the quarter, most of them in Central America, Colombia and Brazil. Our PayTV subscriber base was down 0.8% annually, with 278 thousand disconnections in the quarter.
CONTENT
Highlights
Relevant events
Subscribers
América Móvil Consolidated
Mexico
Argentina, Paraguay & Uruguay
Brazil
Chile
Colombia
Ecuador
Peru
Central America
Caribbean
USA
Austria & CEE
Glossary
Currency Exchange Rates
Wireless Subscribers as of June 2017Total(1) (Thousands)
Country Jun ’17 Mar ’17 Var.% Jun ’16 Var.%
Argentina, Paraguay and Uruguay 23,910 23,848 0.3% 22,976 4.1%
Austria & CEE 20,677 20,622 0.3% 20,482 1.0%
Brazil 60,272 60,237 0.1% 64,264 -6.2%
Central America 15,499 15,293 1.4% 15,773 -1.7%
Caribbean 5,551 5,508 0.8% 5,373 3.3%
Chile 6,798 6,710 1.3% 6,476 5.0%
Colombia 29,225 29,153 0.2% 28,260 3.4%
Ecuador 8,822 8,771 0.6% 8,864 -0.5%
Mexico 73,099 72,942 0.2% 73,108 0.0%
Peru 12,071 11,990 0.7% 11,954 1.0%
USA 24,109 24,745 -2.6% 25,321 -4.8%
Total Wireless Lines 280,033 279,818 0.1% 282,852 -1.0%
(1) Includes total subscribers of all companies in which América Móvil holds an economic interest; does not consider the date in which the companies started being consolidated.
Fixed-Line and Other Accesses (RGUs) as of June 2017Total(1) (Thousands)
Country Jun ’17 Mar ’17 Var.% Jun ’16 Var.%
Argentina, Paraguay and Uruguay 644 632 1.8% 588 9.4%
Austria & CEE 5,899 5,920 -0.4% 5,609 5.2%
Brazil 35,972 36,439 -1.3% 36,809 -2.3%
Central America 5,591 5,478 2.1% 5,183 7.9%
Caribbean 2,716 2,694 0.8% 2,601 4.4%
Chile 1,351 1,342 0.6% 1,283 5.3%
Colombia 6,590 6,472 1.8% 6,055 8.8%
Ecuador 359 358 0.4% 354 1.3%
Mexico 22,012 22,060 -0.2% 21,722 1.3%
Peru 1,426 1,445 -1.3% 1,475 -3.3%
Total RGUs 82,560 82,840 -0.3% 81,679 1.1%
(1) Fixed Line, Broadband and Television (Cable & DTH).
RGUs +1.1% YoY
page 5
América Móvil Consolidated Results
In the second quarter financial volatility in Latin America became more subdued in line with the situation in the global markets, with world economic growth on a slightly improving path. The U.S. economy continued to hold up and those of the European Union and China showed clear signs of strength.
The appreciation of the Mexican peso vs. the dollar observed in the first quarter continued in the sec-ond one, whereas the Brazilian real, the Colombian peso and the Argentinean peso depreciated vs. the dollar, the first one mostly on account of new politi-cal pressures, and the other ones reflecting for the most part a worsening of their balance of payments position.
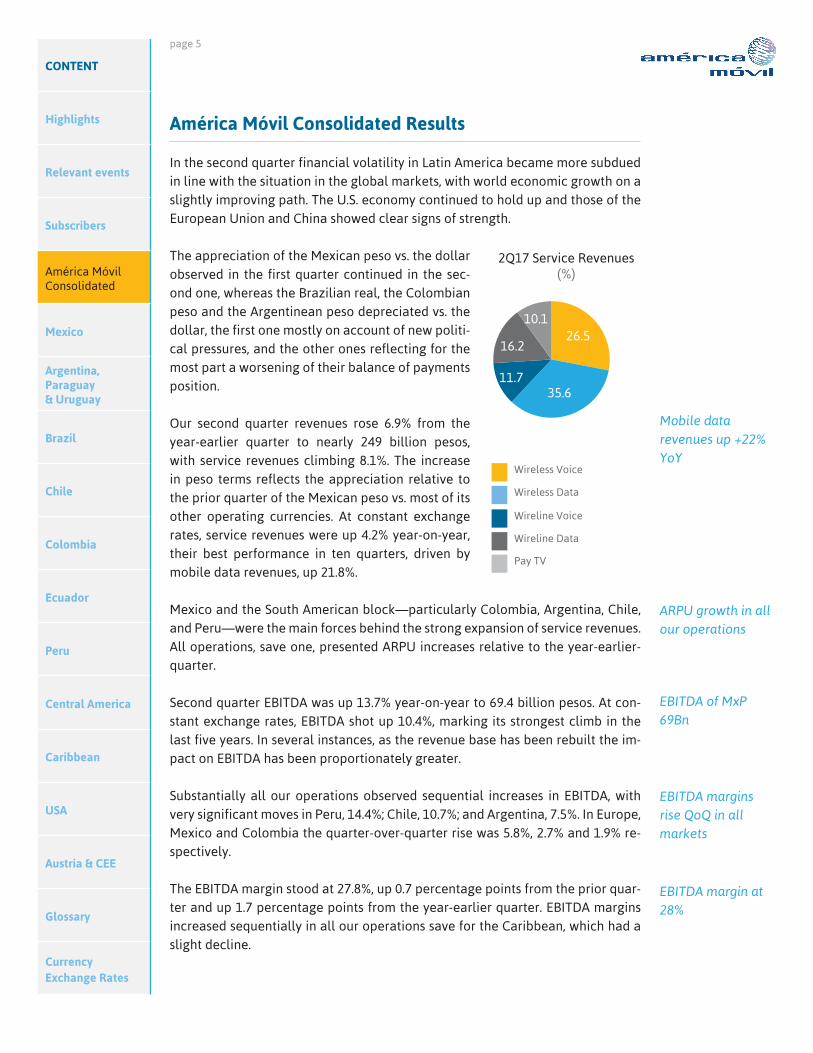
Our second quarter revenues rose 6.9% from the year-earlier quarter to nearly 249 billion pesos, with service revenues climbing 8.1%. The increase in peso terms reflects the appreciation relative to the prior quarter of the Mexican peso vs. most of its other operating currencies. At constant exchange rates, service revenues were up 4.2% year-on-year, their best performance in ten quarters, driven by mobile data revenues, up 21.8%.
Mexico and the South American block—particularly Colombia, Argentina, Chile, and Peru—were the main forces behind the strong expansion of service revenues.All operations, save one, presented ARPU increases relative to the year-earlier-quarter.
Second quarter EBITDA was up 13.7% year-on-year to 69.4 billion pesos. At con-stant exchange rates, EBITDA shot up 10.4%, marking its strongest climb in the last five years. In several instances, as the revenue base has been rebuilt the im-pact on EBITDA has been proportionately greater.
Substantially all our operations observed sequential increases in EBITDA, with very significant moves in Peru, 14.4%; Chile, 10.7%; and Argentina, 7.5%. In Europe, Mexico and Colombia the quarter-over-quarter rise was 5.8%, 2.7% and 1.9% re-spectively.
The EBITDA margin stood at 27.8%, up 0.7 percentage points from the prior quar-ter and up 1.7 percentage points from the year-earlier quarter. EBITDA margins increased sequentially in all our operations save for the Caribbean, which had a slight decline.
28+34+12+16+10Wireless Voice
Wireline Voice
Wireless Data
Wireline Data
Pay TV
26.5
35.611.7
16.2
10.1
2Q17 Service Revenues (%)
CONTENT
Highlights
Relevant events
Subscribers
América Móvil Consolidated
Mexico
Argentina, Paraguay & Uruguay
Brazil
Chile
Colombia
Ecuador
Peru
Central America
Caribbean
USA
Austria & CEE
Glossary
Currency Exchange Rates
Mobile data revenues up +22% YoY
EBITDA of MxP 69Bn
EBITDA margins rise QoQ in all markets
EBITDA margin at 28%
ARPU growth in all our operations

page 6
CONTENT
Highlights
Relevant events
Subscribers
América Móvil Consolidated
Mexico
Argentina, Paraguay & Uruguay
Brazil
Chile
Colombia
Ecuador
Peru
Central America
Caribbean
USA
Austria & CEE
Glossary
Currency Exchange Rates
América Móvil’s Income Statement (IFRS) Millions of Mexican pesos
2Q17 2Q16 Var.% Jan-Jun 17 Jan-Jun 16 Var.%
Service Revenues 215,931 199,808 8.1% 447,207 394,111 13.5%
Equipment Revenues 33,498 33,575 -0.2% 66,379 62,257 6.6%
Total Revenues 249,429 233,383 6.9% 513,586 456,368 12.5%
Cost of Service 79,568 75,145 5.9% 167,364 147,590 13.4%
Cost of Equipment 39,693 41,427 -4.2% 79,804 77,484 3.0%
Selling, General & Administrative Expenses 59,337 54,238 9.4% 122,366 105,405 16.1%
Others 1,468 1,591 -7.7% 3,185 3,172 0.4%
Total Costs and Expenses 180,066 172,400 4.4% 372,720 333,651 11.7%
EBITDA 69,363 60,983 13.7% 140,866 122,717 14.8%
% of Total Revenues 27.8% 26.1% 27.4% 26.9%
Depreciation & Amortization 38,201 35,224 8.4% 79,341 68,917 15.1%
EBIT 31,162 25,758 21.0% 61,525 53,801 14.4%
% of Total Revenues 12.5% 11.0% 12.0% 11.8%
Net Interest Expense 6,658 7,241 -8.0% 13,813 14,188 -2.6%
Other Financial Expenses 4,727 -6,396 173.9% 4,334 5,516 -21.4%
Foreign Exchange Loss 1,869 11,826 -84.2% -35,260 13,665 -358.0%
Comprehensive Financing Cost (Income) 13,254 12,671 4.6% -17,114 33,369 -151.3%
Income & Deferred Taxes 2,645 4,547 -41.8% 26,652 6,770 293.7%
Net Income before Minority Interest and Equity Participation in Results ofAffiliates
15,264 8,540 78.7% 51,987 13,661 280.5%
EquityParticipationinResultsofAffiliates -5 33 -113.8% 26 70 -62.2%
Minority Interest -946 -873 -8.4% -1,845 -1,233 -49.7%
Net Income 14,313 7,700 86% 50,168 12,499 301.4%
n.m. Not meaningful
Our operating profit increased almost 21% from the year-earlier quarter to 31.2 billion pesos. After our comprehensive financing cost of 13.3 billion pesos, it helped bring about a net profit of 14.3 billion pesos in the second quarter, up 86%.
Net profit +86% YoY
page 7
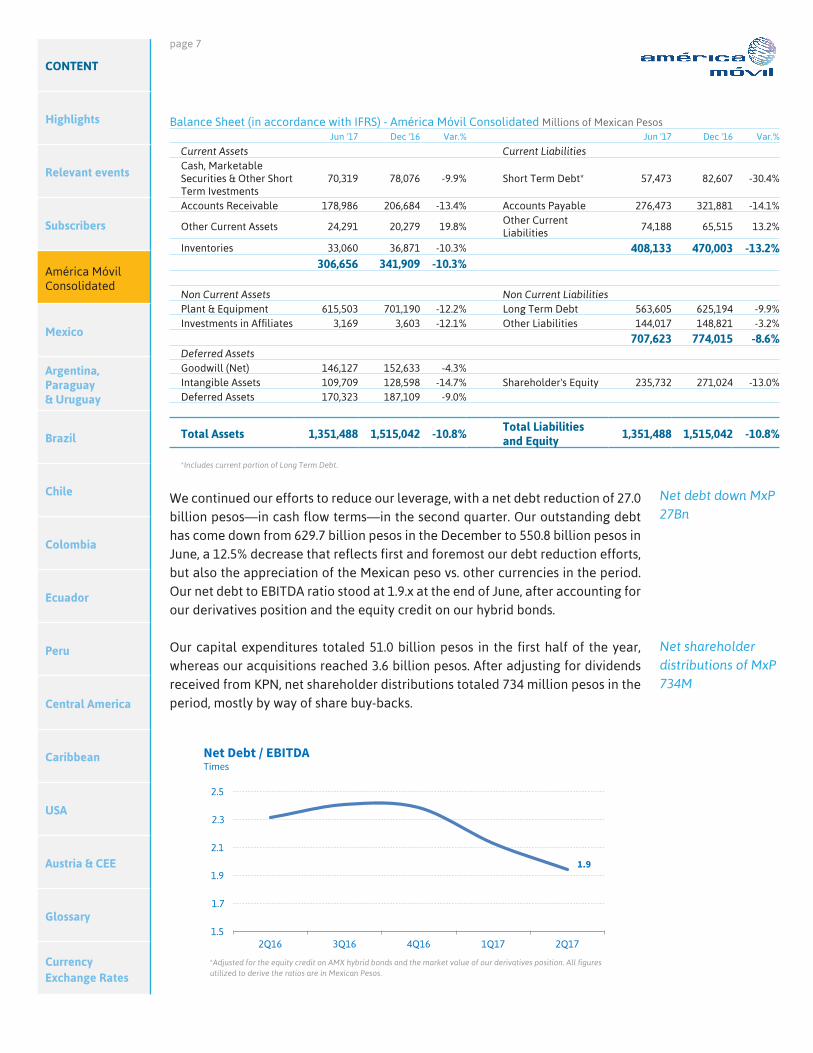
Balance Sheet (in accordance with IFRS) - América Móvil Consolidated Millions of Mexican PesosJun '17 Dec '16 Var.% Jun '17 Dec '16 Var.%
Current Assets Current LiabilitiesCash, Marketable Securities & Other Short Term Ivestments
70,319 78,076 -9.9% Short Term Debt* 57,473 82,607 -30.4%
Accounts Receivable 178,986 206,684 -13.4% Accounts Payable 276,473 321,881 -14.1%
Other Current Assets 24,291 20,279 19.8%Other Current Liabilities
74,188 65,515 13.2%
Inventories 33,060 36,871 -10.3% 408,133 470,003 -13.2%306,656 341,909 -10.3%
Non Current Assets Non Current LiabilitiesPlant & Equipment 615,503 701,190 -12.2% Long Term Debt 563,605 625,194 -9.9%InvestmentsinAffiliates 3,169 3,603 -12.1% Other Liabilities 144,017 148,821 -3.2%
707,623 774,015 -8.6%Deferred AssetsGoodwill (Net) 146,127 152,633 -4.3%Intangible Assets 109,709 128,598 -14.7% Shareholder's Equity 235,732 271,024 -13.0%Deferred Assets 170,323 187,109 -9.0%
Total Assets 1,351,488 1,515,042 -10.8%Total Liabilities and Equity
1,351,488 1,515,042 -10.8%
*Includes current portion of Long Term Debt.
CONTENT
Highlights
Relevant events
Subscribers
América Móvil Consolidated
Mexico
Argentina, Paraguay & Uruguay
Brazil
Chile
Colombia
Ecuador
Peru
Central America
Caribbean
USA
Austria & CEE
Glossary
Currency Exchange Rates
We continued our efforts to reduce our leverage, with a net debt reduction of 27.0 billion pesos—in cash flow terms—in the second quarter. Our outstanding debt has come down from 629.7 billion pesos in the December to 550.8 billion pesos in June, a 12.5% decrease that reflects first and foremost our debt reduction efforts, but also the appreciation of the Mexican peso vs. other currencies in the period. Our net debt to EBITDA ratio stood at 1.9.x at the end of June, after accounting for our derivatives position and the equity credit on our hybrid bonds.
Our capital expenditures totaled 51.0 billion pesos in the first half of the year, whereas our acquisitions reached 3.6 billion pesos. After adjusting for dividends received from KPN, net shareholder distributions totaled 734 million pesos in the period, mostly by way of share buy-backs.
1
1.5
1.7
1.9
2.1
2.3
2.5
2Q16 3Q16 4Q16 1Q17 2Q17
1.9
Net Debt / EBITDA Times
*Adjusted for the equity credit on AMX hybrid bonds and the market value of our derivatives position. All figures utilized to derive the ratios are in Mexican Pesos.
Net debt down MxP 27Bn
Net shareholder distributions of MxP 734M
page 8
CONTENT
Highlights
Relevant events
Subscribers
América Móvil Consolidated
Mexico
Argentina, Paraguay & Uruguay
Brazil
Chile
Colombia
Ecuador
Peru
Central America
Caribbean
USA
Austria & CEE
Glossary
Currency Exchange Rates
Mexico
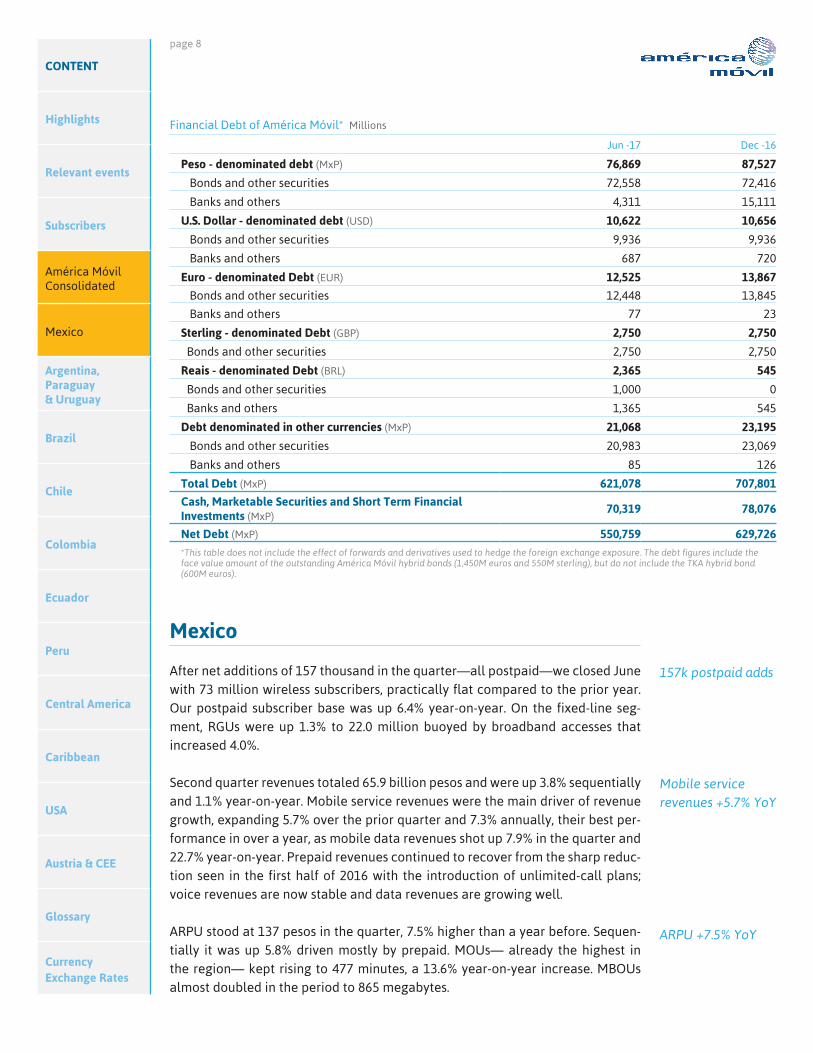
After net additions of 157 thousand in the quarter—all postpaid—we closed June with 73 million wireless subscribers, practically flat compared to the prior year. Our postpaid subscriber base was up 6.4% year-on-year. On the fixed-line seg-ment, RGUs were up 1.3% to 22.0 million buoyed by broadband accesses that increased 4.0%.
Second quarter revenues totaled 65.9 billion pesos and were up 3.8% sequentially and 1.1% year-on-year. Mobile service revenues were the main driver of revenue growth, expanding 5.7% over the prior quarter and 7.3% annually, their best per-formance in over a year, as mobile data revenues shot up 7.9% in the quarter and 22.7% year-on-year. Prepaid revenues continued to recover from the sharp reduc-tion seen in the first half of 2016 with the introduction of unlimited-call plans; voice revenues are now stable and data revenues are growing well.
ARPU stood at 137 pesos in the quarter, 7.5% higher than a year before. Sequen-tially it was up 5.8% driven mostly by prepaid. MOUs— already the highest in the region— kept rising to 477 minutes, a 13.6% year-on-year increase. MBOUs almost doubled in the period to 865 megabytes.
Financial Debt of América Móvil* Millions
Jun -17 Dec -16
Peso - denominated debt (MxP) 76,869 87,527
Bonds and other securities 72,558 72,416
Banks and others 4,311 15,111
U.S. Dollar - denominated debt (USD) 10,622 10,656
Bonds and other securities 9,936 9,936
Banks and others 687 720
Euro - denominated Debt (EUR) 12,525 13,867
Bonds and other securities 12,448 13,845
Banks and others 77 23
Sterling - denominated Debt (GBP) 2,750 2,750
Bonds and other securities 2,750 2,750
Reais - denominated Debt (BRL) 2,365 545
Bonds and other securities 1,000 0
Banks and others 1,365 545
Debt denominated in other currencies (MxP) 21,068 23,195
Bonds and other securities 20,983 23,069
Banks and others 85 126
Total Debt (MxP) 621,078 707,801
Cash, Marketable Securities and Short Term Financial Investments (MxP)
70,319 78,076
Net Debt (MxP) 550,759 629,726
*This table does not include the effect of forwards and derivatives used to hedge the foreign exchange exposure. The debt figures include the face value amount of the outstanding América Móvil hybrid bonds (1,450M euros and 550M sterling), but do not include the TKA hybrid bond (600M euros).
157k postpaid adds
Mobile service revenues +5.7% YoY
ARPU +7.5% YoY

page 9
CONTENT
Highlights
Relevant events
Subscribers
América Móvil Consolidated
Mexico
Argentina, Paraguay & Uruguay
Brazil
Chile
Colombia
Ecuador
Peru
Central America
Caribbean
USA
Austria & CEE
Glossary
Currency Exchange Rates
Mexico Operating Data (IFRS)
2Q17 2Q16 Var.%
Wireless Subscribers (thousands) 73,099 73,108 0.0%
Postpaid 12,358 11,619 6.4%
Prepaid 60,741 61,489 -1.2%
MOU 477 420 13.6%
ARPU (MxP) 137 127 7.5%
Churn (%) 4.1% 4.6% -0.4
Revenue Generating Units (RGUs) * 22,012 21,722 1.3%
Fixed Lines 12,758 12,826 -0.5%
Broadband 9,254 8,896 4.0%* Fixed Line and Broadband.
INCOME STATEMENT (IFRS) - Mexico Millions of MxP
2Q17 2Q16 Var.% Jan - Jun 17 Jan - Jun 16 Var.%
Total Revenues 65,858 65,118 1.1% 129,297 129,934 -0.5%
Total Service Revenues 50,548 49,425 2.3% 99,897 100,630 -0.7%
Wireless Revenues 43,520 41,876 3.9% 84,111 83,536 0.7%
Service Revenues 29,963 27,913 7.3% 58,305 57,213 1.9%
Equipment Revenues 13,431 13,712 -2.0% 25,474 25,330 0.6%
Fixed Line and Other Revenues 24,251 25,115 -3.4% 49,037 49,948 -1.8%
EBITDA 20,786 21,502 -3.3% 41,021 44,687 -8.2%
% total revenues 31.6% 33.0% 31.7% 34.4%
EBIT 13,366 14,842 -9.9% 26,289 31,576 -16.7%
% 20.3% 22.8% 20.3% 24.3%
*Total Revenues reflect eliminations derived from both the overlap of fixed and mobile operations as well as international intercompany transactions; Wireless Revenues and Fixed Line and Other Revenues only exclude intercompany transactions with foreign subsidiaries. The sum of the parts will not equal Total Revenues.
Fixed-line revenues were down 3.4% pulled down by international long distance revenues, but fixed-data revenues expanded 3.6%.
EBITDA came in at 20.8 billion pesos, rising 2.7% over the first quarter. It was slightly down vs. the year-earlier quarter, 3.3%, but continued with its recover-ing trend. It was its best performance in over a year. The EBITDA margin stood at 31.6% of revenues, compared to 33.0% a year before.
Argentina, Paraguay and Uruguay
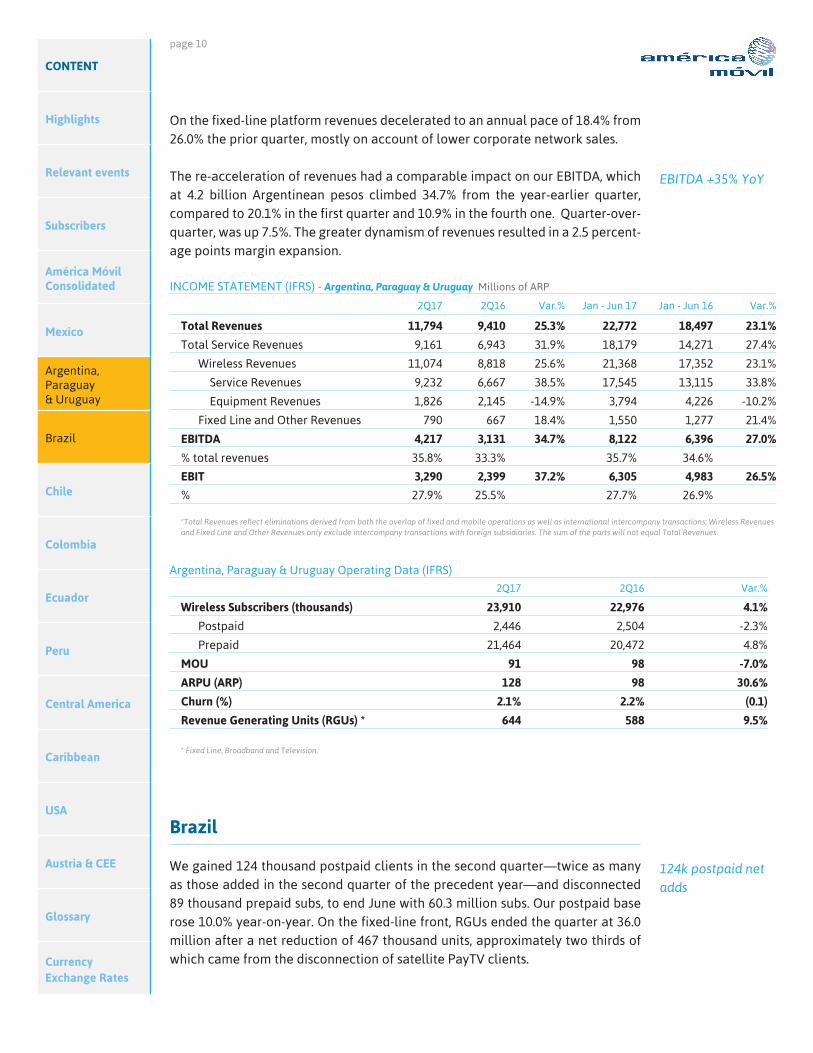
In the second quarter we added 84 thousand prepaid clients and disconnected 22 thousand postpaid clients, to finish the quarter with 23.9 million mobile clients, a 4.1% annual increase. Our fixed-RGUs, 644 thousand, were up 9.4% year-on-year, driven by PayTV accesses that expanded 17.1% in Paraguay.
Revenue growth re-accelerated in the second quarter, with strong sequential and annual increases in total revenues and mobile service revenues, with the latter´s rate of growth jumping to 38.5% from 28.9% in the first quarter. Mobile data rev-enues soared 18.3% sequentially and 73.3% year-on-year and undoubtedly were the main engine of growth.
EBITDA up 2.7% QoQ
Sub base +4.1% YoY
Mobile service revenues +39% YoY
Fixed data +3.6% YoY
page 10
CONTENT
Highlights
Relevant events
Subscribers
América Móvil Consolidated
Mexico
Argentina, Paraguay & Uruguay
Brazil
Chile
Colombia
Ecuador
Peru
Central America
Caribbean
USA
Austria & CEE
Glossary
Currency Exchange Rates
Argentina, Paraguay & Uruguay Operating Data (IFRS)
2Q17 2Q16 Var.%
Wireless Subscribers (thousands) 23,910 22,976 4.1%
Postpaid 2,446 2,504 -2.3%
Prepaid 21,464 20,472 4.8%
MOU 91 98 -7.0%
ARPU (ARP) 128 98 30.6%
Churn (%) 2.1% 2.2% (0.1)
Revenue Generating Units (RGUs) * 644 588 9.5%
* Fixed Line, Broadband and Television.
Brazil
We gained 124 thousand postpaid clients in the second quarter—twice as many as those added in the second quarter of the precedent year—and disconnected 89 thousand prepaid subs, to end June with 60.3 million subs. Our postpaid base rose 10.0% year-on-year. On the fixed-line front, RGUs ended the quarter at 36.0 million after a net reduction of 467 thousand units, approximately two thirds of which came from the disconnection of satellite PayTV clients.
INCOME STATEMENT (IFRS) - Argentina, Paraguay & Uruguay Millions of ARP
2Q17 2Q16 Var.% Jan - Jun 17 Jan - Jun 16 Var.%
Total Revenues 11,794 9,410 25.3% 22,772 18,497 23.1%
Total Service Revenues 9,161 6,943 31.9% 18,179 14,271 27.4%
Wireless Revenues 11,074 8,818 25.6% 21,368 17,352 23.1%
Service Revenues 9,232 6,667 38.5% 17,545 13,115 33.8%
Equipment Revenues 1,826 2,145 -14.9% 3,794 4,226 -10.2%
Fixed Line and Other Revenues 790 667 18.4% 1,550 1,277 21.4%
EBITDA 4,217 3,131 34.7% 8,122 6,396 27.0%
% total revenues 35.8% 33.3% 35.7% 34.6%
EBIT 3,290 2,399 37.2% 6,305 4,983 26.5%
% 27.9% 25.5% 27.7% 26.9%
*Total Revenues reflect eliminations derived from both the overlap of fixed and mobile operations as well as international intercompany transactions; Wireless Revenues and Fixed Line and Other Revenues only exclude intercompany transactions with foreign subsidiaries. The sum of the parts will not equal Total Revenues.
On the fixed-line platform revenues decelerated to an annual pace of 18.4% from 26.0% the prior quarter, mostly on account of lower corporate network sales.
The re-acceleration of revenues had a comparable impact on our EBITDA, which at 4.2 billion Argentinean pesos climbed 34.7% from the year-earlier quarter, compared to 20.1% in the first quarter and 10.9% in the fourth one. Quarter-over-quarter, was up 7.5%. The greater dynamism of revenues resulted in a 2.5 percent-age points margin expansion.
EBITDA +35% YoY
124k postpaid net adds

page 11
CONTENT
Highlights
Relevant events
Subscribers
América Móvil Consolidated
Mexico
Argentina, Paraguay & Uruguay
Brazil
Chile
Colombia
Ecuador
Peru
Central America
Caribbean
USA
Austria & CEE
Glossary
Currency Exchange Rates
Brazil Operating Data (IFRS)
2Q17 2Q16 Var.%
Wireless Subscribers (thousands) 60,272 64,264 -6.2%
Postpaid 18,639 16,952 10.0%
Prepaid 41,633 47,313 -12.0%
MOU 81 103 -21.6%
ARPU (BrL) 15 13 9.1%
Churn (%) 3.4% 3.7% (0.3)
Revenue Generating Units (RGUs) * 35,972 36,809 -2.3%* Fixed Line, Broadband and Television.
INCOME STATEMENT (IFRS) - Brazil Millions of BrL
2Q17 2Q16 Var.% Jan - Jun 17 Jan - Jun 16 Var.%
Total Revenues 8,793 9,084 -3.2% 17,698 18,038 -1.9%
Total Service Revenues 8,633 8,751 -1.3% 17,402 17,453 -0.3%
Wireless Revenues 2,826 2,946 -4.1% 5,711 5,952 -4.1%
Service Revenues 2,654 2,616 1.4% 5,400 5,372 0.5%
Equipment Revenues 160 332 -51.9% 295 581 -49.2%
Fixed Line and Other Revenues 5,967 6,137 -2.8% 11,987 12,086 -0.8%
EBITDA 2,415 2,379 1.5% 4,890 4,736 3.2%
% total revenues 27.5% 26.2% 27.6% 26.3%
EBIT 247 194 27.4% 527 340 54.7%
% 2.8% 2.1% 3.0% 1.9%
*Revenues reflect eliminations derived from both the overlap of fixed and mobile operations as well as international intercompany transactions.
Chile
Our wireless subscriber base ended June with 6.8 million clients, 5.0% more than a year before, after net additions on the postpaid segment of 73 thousand. Fixed RGUs increased 5.3% relative to 2016, for the most part on account of a 15.5% expansion of broadband accesses.
Revenues continued on an improving trend, rising 13.1% year-on-year—and 4.7% sequentially—to reach 210 billion Chilean pesos as service revenues ex-panded 11% on the mobile and 9.0% on fixed-line platform.
Second quarter revenues came in at 8.8 billion reais, with service revenues de-clining 1.3% year-on-year dragged down by voice revenues on both the mobile and fixed-line platform. Altogether service revenues were up 1.4% on the mobile platform and down 2.1% on the fixed-line one.
Mobile data revenues expanded significantly—26.4% year-on-year, up from 9.7% the prior quarter—while fixed-broadband and PayTV revenues decelerated slightly, to 6.7% and 1.0% respectively.
At 2.4 billion reais, EBITDA was up 1.5% year-on-year, with the EBITDA margin climbing 1.3 percentage-points from the year-earlier quarter, to 27.5%.
Mobile service revenues +1.3% YoY
Mobile data revenues +26% YoY
EBITDA +1.5% YoY
Wireless base up 5.0% YoY
2Q Revenues +13% YoY

page 12
CONTENT
Highlights
Relevant events
Subscribers
América Móvil Consolidated
Mexico
Argentina, Paraguay & Uruguay
Brazil
Chile
Colombia
Ecuador
Peru
Central America
Caribbean
USA
Austria & CEE
Glossary
Currency Exchange Rates
Chile Operating Data (IFRS)
2Q17 2Q16 Var.%
Wireless Subscribers (thousands) 6,798 6,476 5.0%
Postpaid 1,746 1,482 17.8%
Prepaid 5,052 4,993 1.2%
MOU 153 142 7.4%
ARPU (ChP) 5,826 5,452 6.9%
Churn (%) 5.3% 5.5% (0.3)
Revenue Generating Units (RGUs) * 1,351 1,283 5.3%* Fixed Line, Broadband and Television.
INCOME STATEMENT (IFRS) - Chile Millions of ChPL
2Q17 2Q16 Var.% Jan - Jun 17 Jan - Jun 16 Var.%
Total Revenues 210,078 185,718 13.1% 410,767 366,424 12.1%
Total Service Revenues 186,387 167,702 11.1% 365,567 333,724 9.5%
Wireless Revenues 139,106 121,934 14.1% 270,878 240,152 12.8%
Service Revenues 115,403 104,005 11.0% 225,780 206,865 9.1%
Equipment Revenues 23,691 18,016 31.5% 45,200 32,700 38.2%
Fixed Line and Other Revenues 77,495 69,355 11.7% 152,607 137,403 11.1%
EBITDA 29,730 13,854 114.6% 56,588 27,127 108.6%
% total revenues 14.2% 7.5% 13.8% 7.4%
EBIT -22,794 -38,909 41.4% -49,699 -78,414 36.6%
% -10.9% -21.0% -12.1% -21.4%
*Total Revenues reflect eliminations derived from both the overlap of fixed and mobile operations as well as international intercompany transactions; Wireless Revenues and Fixed Line and Other Revenues only exclude intercompany transactions with foreign subsidiaries. The sum of the parts will not equal Total Revenues.
Colombia
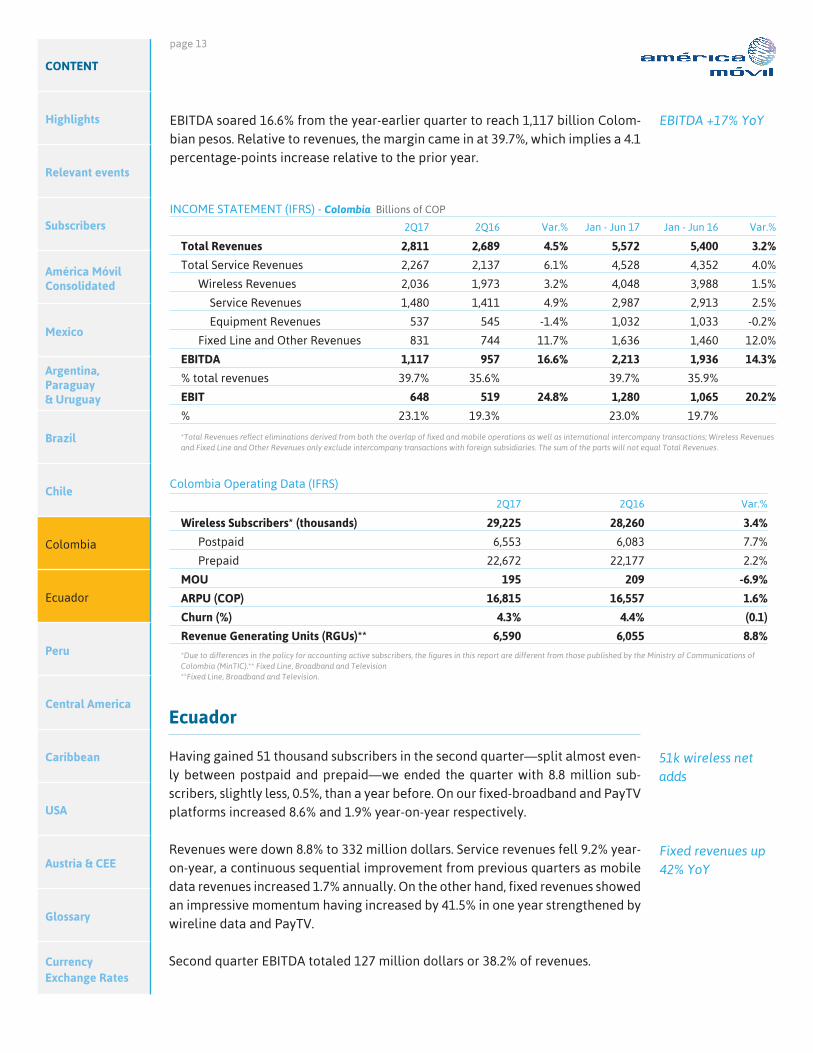
We ended June with 29.2 million wireless subscribers after adding 72 thousand clients in the quarter, all of which were postpaid. Our postpaid base increased 7.7% from the year before to 6.6 million subscribers. On the fixed-line side, our fixed RGUs were up 8.8%, with landlines and broadband expanding 12.7% and 10.3%, respectively.
Revenues rose 4.5% year-on-year in the second quarter to 2,811 billion Colom-bian pesos. Service revenue growth continued posting sequential improvements, expanding at a 6.1% pace, up from 2.1% the previous quarter and -4.3% a year before.
On the mobile platform service revenues increased 4.9% led by data revenues, up 17.4%; those on the fixed platform surged 13.2% in a broad based expansion: voice revenues climbed 12.3%, data revenues 10.8% and PayTV revenues 17.7%.
Mobile and fixed data revenues led the way, climbing in the second quarter 25.7% and 20.2% respectively, compared to 16.5% and 15.1% the prior one.
At 29.7 billion Chilean pesos, EBITDA soared 115% year-on-year—and 10.7% over the quarter. The EBITDA margin, 14.2%, was up nearly seven percentage points in the quarter.
EBITDA +115% YoY
72k net adds in 2Q
Sequential improvements on service revenues
Mobile data revenues +17% YoY
page 13
CONTENT
Highlights
Relevant events
Subscribers
América Móvil Consolidated
Mexico
Argentina, Paraguay & Uruguay
Brazil
Chile
Colombia
Ecuador
Peru
Central America
Caribbean
USA
Austria & CEE
Glossary
Currency Exchange Rates
Colombia Operating Data (IFRS)
2Q17 2Q16 Var.%
Wireless Subscribers* (thousands) 29,225 28,260 3.4%
Postpaid 6,553 6,083 7.7%
Prepaid 22,672 22,177 2.2%
MOU 195 209 -6.9%
ARPU (COP) 16,815 16,557 1.6%
Churn (%) 4.3% 4.4% (0.1)
Revenue Generating Units (RGUs)** 6,590 6,055 8.8%
*Due to differences in the policy for accounting active subscribers, the figures in this report are different from those published by the Ministry of Communications of Colombia (MinTIC).** Fixed Line, Broadband and Television**Fixed Line, Broadband and Television.
INCOME STATEMENT (IFRS) - Colombia Billions of COP
2Q17 2Q16 Var.% Jan - Jun 17 Jan - Jun 16 Var.%
Total Revenues 2,811 2,689 4.5% 5,572 5,400 3.2%
Total Service Revenues 2,267 2,137 6.1% 4,528 4,352 4.0%
Wireless Revenues 2,036 1,973 3.2% 4,048 3,988 1.5%
Service Revenues 1,480 1,411 4.9% 2,987 2,913 2.5%
Equipment Revenues 537 545 -1.4% 1,032 1,033 -0.2%
Fixed Line and Other Revenues 831 744 11.7% 1,636 1,460 12.0%
EBITDA 1,117 957 16.6% 2,213 1,936 14.3%
% total revenues 39.7% 35.6% 39.7% 35.9%
EBIT 648 519 24.8% 1,280 1,065 20.2%
% 23.1% 19.3% 23.0% 19.7%
*Total Revenues reflect eliminations derived from both the overlap of fixed and mobile operations as well as international intercompany transactions; Wireless Revenues and Fixed Line and Other Revenues only exclude intercompany transactions with foreign subsidiaries. The sum of the parts will not equal Total Revenues.
EBITDA soared 16.6% from the year-earlier quarter to reach 1,117 billion Colom-bian pesos. Relative to revenues, the margin came in at 39.7%, which implies a 4.1 percentage-points increase relative to the prior year.
Ecuador
Having gained 51 thousand subscribers in the second quarter—split almost even-ly between postpaid and prepaid—we ended the quarter with 8.8 million sub-scribers, slightly less, 0.5%, than a year before. On our fixed-broadband and PayTV platforms increased 8.6% and 1.9% year-on-year respectively.
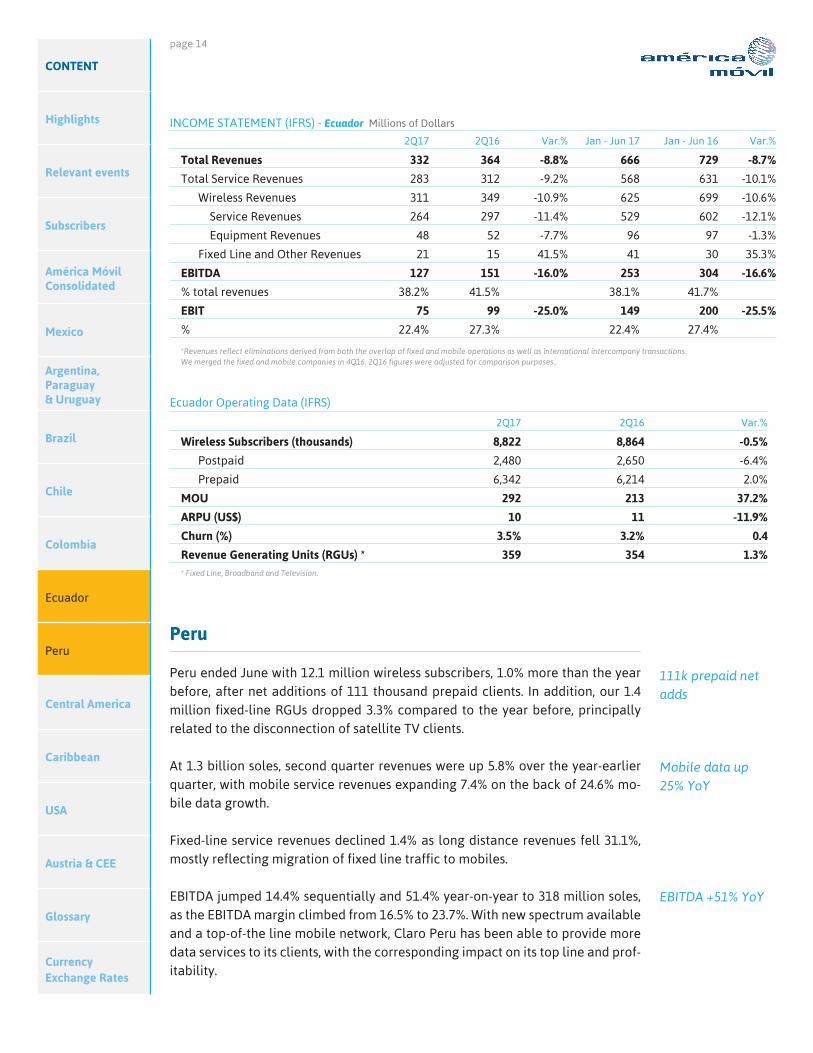
Revenues were down 8.8% to 332 million dollars. Service revenues fell 9.2% year-on-year, a continuous sequential improvement from previous quarters as mobile data revenues increased 1.7% annually. On the other hand, fixed revenues showed an impressive momentum having increased by 41.5% in one year strengthened by wireline data and PayTV.
Second quarter EBITDA totaled 127 million dollars or 38.2% of revenues.
EBITDA +17% YoY
51k wireless net adds
Fixed revenues up 42% YoY
page 14
CONTENT
Highlights
Relevant events
Subscribers
América Móvil Consolidated
Mexico
Argentina, Paraguay & Uruguay
Brazil
Chile
Colombia
Ecuador
Peru
Central America
Caribbean
USA
Austria & CEE
Glossary
Currency Exchange Rates
Ecuador Operating Data (IFRS)
2Q17 2Q16 Var.%
Wireless Subscribers (thousands) 8,822 8,864 -0.5%
Postpaid 2,480 2,650 -6.4%
Prepaid 6,342 6,214 2.0%
MOU 292 213 37.2%
ARPU (US$) 10 11 -11.9%
Churn (%) 3.5% 3.2% 0.4
Revenue Generating Units (RGUs) * 359 354 1.3%* Fixed Line, Broadband and Television.
Peru
Peru ended June with 12.1 million wireless subscribers, 1.0% more than the year before, after net additions of 111 thousand prepaid clients. In addition, our 1.4 million fixed-line RGUs dropped 3.3% compared to the year before, principally related to the disconnection of satellite TV clients.
At 1.3 billion soles, second quarter revenues were up 5.8% over the year-earlier quarter, with mobile service revenues expanding 7.4% on the back of 24.6% mo-bile data growth.
Fixed-line service revenues declined 1.4% as long distance revenues fell 31.1%, mostly reflecting migration of fixed line traffic to mobiles.
EBITDA jumped 14.4% sequentially and 51.4% year-on-year to 318 million soles, as the EBITDA margin climbed from 16.5% to 23.7%. With new spectrum available and a top-of-the line mobile network, Claro Peru has been able to provide more data services to its clients, with the corresponding impact on its top line and prof-itability.
INCOME STATEMENT (IFRS) - Ecuador Millions of Dollars
2Q17 2Q16 Var.% Jan - Jun 17 Jan - Jun 16 Var.%
Total Revenues 332 364 -8.8% 666 729 -8.7%
Total Service Revenues 283 312 -9.2% 568 631 -10.1%
Wireless Revenues 311 349 -10.9% 625 699 -10.6%
Service Revenues 264 297 -11.4% 529 602 -12.1%
Equipment Revenues 48 52 -7.7% 96 97 -1.3%
Fixed Line and Other Revenues 21 15 41.5% 41 30 35.3%
EBITDA 127 151 -16.0% 253 304 -16.6%
% total revenues 38.2% 41.5% 38.1% 41.7%
EBIT 75 99 -25.0% 149 200 -25.5%
% 22.4% 27.3% 22.4% 27.4%
*Revenues reflect eliminations derived from both the overlap of fixed and mobile operations as well as international intercompany transactions.We merged the fixed and mobile companies in 4Q16, 2Q16 figures were adjusted for comparison purposes..
111k prepaid net adds
Mobile data up25% YoY
EBITDA +51% YoY

page 15
CONTENT
Highlights
Relevant events
Subscribers
América Móvil Consolidated
Mexico
Argentina, Paraguay & Uruguay
Brazil
Chile
Colombia
Ecuador
Peru
Central America
Caribbean
USA
Austria & CEE
Glossary
Currency Exchange Rates
Peru Operating Data (IFRS)
2Q17 2Q16 Var.%
Wireless Subscribers (thousands) 12,071 11,954 1.0%
Postpaid 4,062 4,130 -1.7%
Prepaid 8,009 7,824 2.4%
MOU 202 166 21.6%
ARPU (Sol) 26 24 7.5%
Churn (%) 5.5% 5.6% (0.1)
Revenue Generating Units (RGUs) * 1,426 1,475 -3.3%* Fixed Line, Broadband and Television
INCOME STATEMENT (IFRS) - Peru Millions of Soles
2Q17 2Q16 Var.% Jan - Jun 17 Jan - Jun 16 Var.%
Total Revenues 1,344 1,270 5.8% 2,688 2,542 5.7%
Total Service Revenues 1,166 1,106 5.4% 2,331 2,233 4.4%
Wireless Revenues 1,136 1,059 7.2% 2,267 2,123 6.8%
Service Revenues 947 882 7.4% 1,888 1,794 5.2%
Equipment Revenues 177 163 9.1% 355 306 16.1%
Fixed Line and Other Revenues 208 211 -1.4% 421 420 0.3%
EBITDA 318 210 51.4% 596 465 28.0%
% total revenues 23.7% 16.5% 22.2% 18.3%
EBIT 130 38 242.0% 226 128 76.3%
% 9.7% 3.0% 8.4% 5.0%
*Revenues reflect eliminations derived from both the overlap of fixed and mobile operations as well as international intercompany transactions.
Central America
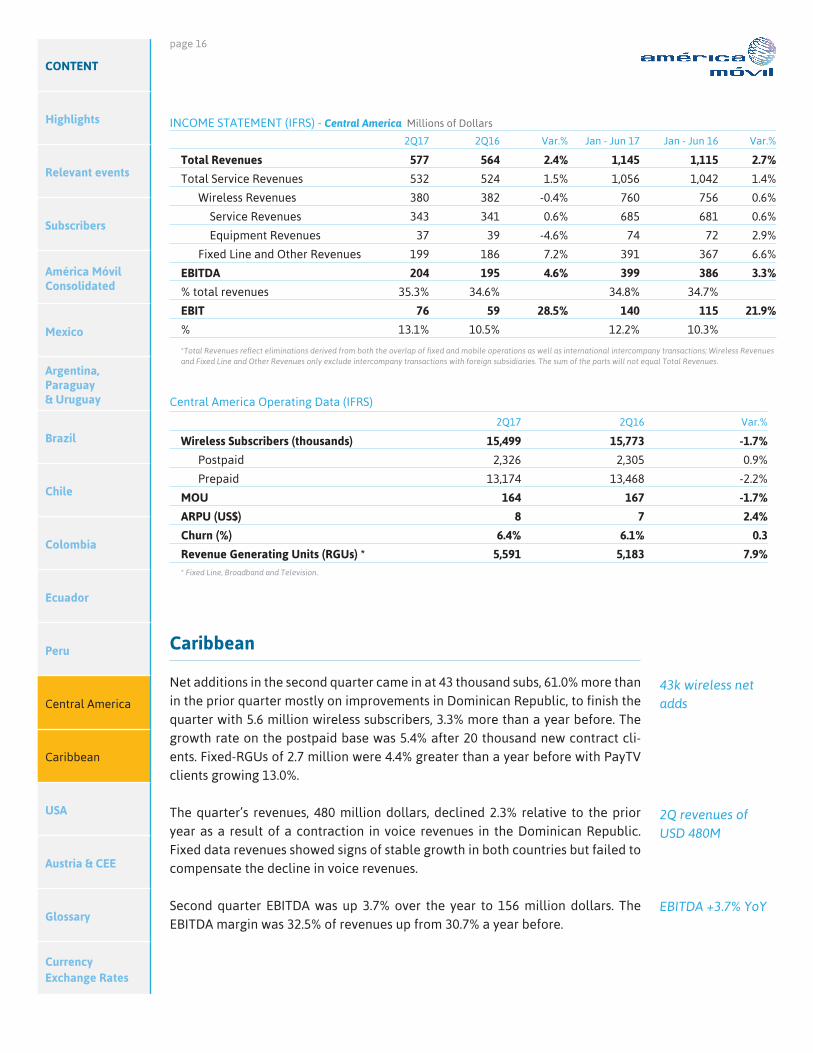
In the second quarter we added 207 thousand mobile clients and 112 thousand fixed-line RGUs to finish June with 21.1 million accesses, an increase of 1.5% in the quarter and 0.6% in the year. Fixed RGUs expanded 7.9% compared to a year before and reached 5.6 million; growth was driven by broadband accesses, up 16.3% year-on-year.
Revenues of 577 million dollars were up 2.4% year-on-year, with service revenues rising 1.5% driven by data revenue growth—expanding 12.3% on the fixed plat-form and 10.1% on the mobile. PayTV revenues were up 5.1% year-on-year, while wireless voice revenues declined 4.9%.
The quarter’s EBITDA of 204 million dollars was 4.6% higher than a year before. At 35.3% of revenues, the EBITDA margin was slightly better as well.
Fixed RGUs up 7.9% YoY
Growth on service revenues due to data
EBITDA margin of 35%
page 16
CONTENT
Highlights
Relevant events
Subscribers
América Móvil Consolidated
Mexico
Argentina, Paraguay & Uruguay
Brazil
Chile
Colombia
Ecuador
Peru
Central America
Caribbean
USA
Austria & CEE
Glossary
Currency Exchange Rates
Central America Operating Data (IFRS)
2Q17 2Q16 Var.%
Wireless Subscribers (thousands) 15,499 15,773 -1.7%
Postpaid 2,326 2,305 0.9%
Prepaid 13,174 13,468 -2.2%
MOU 164 167 -1.7%
ARPU (US$) 8 7 2.4%
Churn (%) 6.4% 6.1% 0.3
Revenue Generating Units (RGUs) * 5,591 5,183 7.9%* Fixed Line, Broadband and Television.
INCOME STATEMENT (IFRS) - Central America Millions of Dollars
2Q17 2Q16 Var.% Jan - Jun 17 Jan - Jun 16 Var.%
Total Revenues 577 564 2.4% 1,145 1,115 2.7%
Total Service Revenues 532 524 1.5% 1,056 1,042 1.4%
Wireless Revenues 380 382 -0.4% 760 756 0.6%
Service Revenues 343 341 0.6% 685 681 0.6%
Equipment Revenues 37 39 -4.6% 74 72 2.9%
Fixed Line and Other Revenues 199 186 7.2% 391 367 6.6%
EBITDA 204 195 4.6% 399 386 3.3%
% total revenues 35.3% 34.6% 34.8% 34.7%
EBIT 76 59 28.5% 140 115 21.9%
% 13.1% 10.5% 12.2% 10.3%
*Total Revenues reflect eliminations derived from both the overlap of fixed and mobile operations as well as international intercompany transactions; Wireless Revenues and Fixed Line and Other Revenues only exclude intercompany transactions with foreign subsidiaries. The sum of the parts will not equal Total Revenues.
Caribbean
Net additions in the second quarter came in at 43 thousand subs, 61.0% more than in the prior quarter mostly on improvements in Dominican Republic, to finish the quarter with 5.6 million wireless subscribers, 3.3% more than a year before. The growth rate on the postpaid base was 5.4% after 20 thousand new contract cli-ents. Fixed-RGUs of 2.7 million were 4.4% greater than a year before with PayTV clients growing 13.0%.
The quarter’s revenues, 480 million dollars, declined 2.3% relative to the prior year as a result of a contraction in voice revenues in the Dominican Republic. Fixed data revenues showed signs of stable growth in both countries but failed to compensate the decline in voice revenues.
Second quarter EBITDA was up 3.7% over the year to 156 million dollars. The EBITDA margin was 32.5% of revenues up from 30.7% a year before.
43k wireless net adds
2Q revenues of USD 480M
EBITDA +3.7% YoY

page 17
CONTENT
Highlights
Relevant events
Subscribers
América Móvil Consolidated
Mexico
Argentina, Paraguay & Uruguay
Brazil
Chile
Colombia
Ecuador
Peru
Central America
Caribbean
USA
Austria & CEE
Glossary
Currency Exchange Rates
Caribbean Operating Data (IFRS)
2Q17 2Q16 Var.%
Wireless Subscribers (thousands) 5,551 5,373 3.3%
Postpaid 1,831 1,738 5.4%
Prepaid 3,720 3,634 2.3%
MOU 263 282 -6.9%
ARPU (US$) 13 14 -6.7%
Churn (%) 3.5% 3.7% (0.0)
Revenue Generating Units (RGUs) * 2,716 2,601 4.4%* Fixed Line, Broadband and Television.
INCOME STATEMENT (IFRS) - Caribbean Millions of Dollars
2Q17 2Q16 Var.% Jan - Jun 17 Jan - Jun 16 Var.%
Total Revenues 480 491 -2.3% 958 974 -1.7%
Total Service Revenues 421 432 -2.4% 843 865 -2.5%
Wireless Revenues 272 278 -2.2% 542 550 -1.5%
Service Revenues 218 224 -2.9% 437 450 -3.0%
Equipment Revenues 55 55 0.4% 107 102 5.4%
Fixed Line and Other Revenues 207 212 -2.4% 416 424 -1.9%
EBITDA 156 150 3.7% 312 298 4.6%
% total revenues 32.5% 30.7% 32.5% 30.6%
EBIT 91 81 12.4% 180 148 21.7%
% 18.9% 16.4% 18.8% 15.2%*Total Revenues reflect eliminations derived from both the overlap of fixed and mobile operations as well as international intercompany transactions; Wireless Revenues and Fixed Line and Other Revenues only exclude intercompany transactions with foreign subsidiaries. The sum of the parts will not equal Total Revenues. 2Q16 figures have been adjusted to incorporate accounting changes in equipment revenues in Puerto Rico.
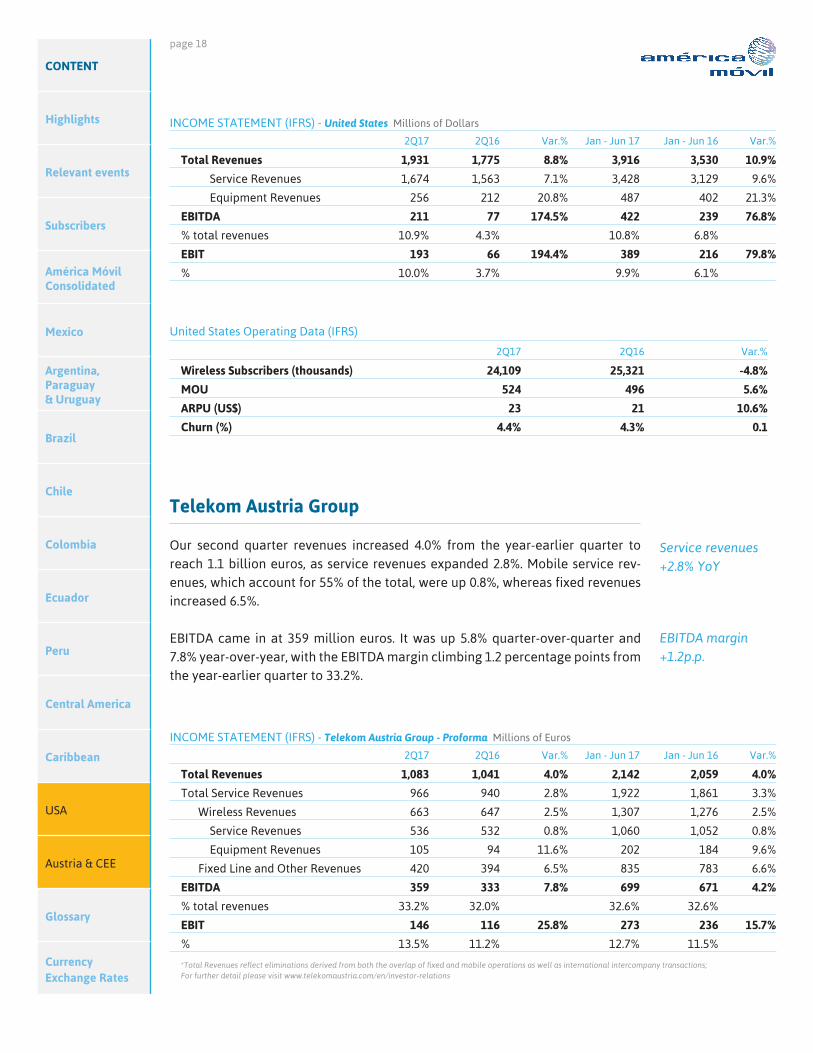
United States
We ended the quarter with 24.1 million subscribers—4.8% below the year-earlier quarter—after net disconnections of 636 thousand subs, resulting from a cleanup of our base, from increased competition in the segment and from seasonal ef-fects.
Our second quarter revenues totaled 1.9 billion dollars; they were up 8.8% year-on-year, with equipment revenues jumping 20.8% and service revenues rising 7.1%, mostly on the back of data services that increased almost twice as fast.
EBITDA nearly tripled from the year-earlier quarter to 211 million dollars, as the EBITDA margin expanded by 6.6 percentage points, to 10.9%.
Our financials reflect the consolidation of Walmart Family Mobile’s figures from August, 2016. Adjusting for that, revenues would have risen 4.7% over the year and EBITDA would have trebled.
24M sub base in 2Q
2Q Revenues +8.8% YoY
EBITDA margin +6.6p.p.
page 18
CONTENT
Highlights
Relevant events
Subscribers
América Móvil Consolidated
Mexico
Argentina, Paraguay & Uruguay
Brazil
Chile
Colombia
Ecuador
Peru
Central America
Caribbean
USA
Austria & CEE
Glossary
Currency Exchange Rates
United States Operating Data (IFRS)
2Q17 2Q16 Var.%
Wireless Subscribers (thousands) 24,109 25,321 -4.8%
MOU 524 496 5.6%
ARPU (US$) 23 21 10.6%
Churn (%) 4.4% 4.3% 0.1
INCOME STATEMENT (IFRS) - United States Millions of Dollars
2Q17 2Q16 Var.% Jan - Jun 17 Jan - Jun 16 Var.%
Total Revenues 1,931 1,775 8.8% 3,916 3,530 10.9%
Service Revenues 1,674 1,563 7.1% 3,428 3,129 9.6%
Equipment Revenues 256 212 20.8% 487 402 21.3%
EBITDA 211 77 174.5% 422 239 76.8%
% total revenues 10.9% 4.3% 10.8% 6.8%
EBIT 193 66 194.4% 389 216 79.8%
% 10.0% 3.7% 9.9% 6.1%
Telekom Austria Group
Our second quarter revenues increased 4.0% from the year-earlier quarter to reach 1.1 billion euros, as service revenues expanded 2.8%. Mobile service rev-enues, which account for 55% of the total, were up 0.8%, whereas fixed revenues increased 6.5%.
EBITDA came in at 359 million euros. It was up 5.8% quarter-over-quarter and 7.8% year-over-year, with the EBITDA margin climbing 1.2 percentage points from the year-earlier quarter to 33.2%.
INCOME STATEMENT (IFRS) - Telekom Austria Group - Proforma Millions of Euros
2Q17 2Q16 Var.% Jan - Jun 17 Jan - Jun 16 Var.%
Total Revenues 1,083 1,041 4.0% 2,142 2,059 4.0%
Total Service Revenues 966 940 2.8% 1,922 1,861 3.3%
Wireless Revenues 663 647 2.5% 1,307 1,276 2.5%
Service Revenues 536 532 0.8% 1,060 1,052 0.8%
Equipment Revenues 105 94 11.6% 202 184 9.6%
Fixed Line and Other Revenues 420 394 6.5% 835 783 6.6%
EBITDA 359 333 7.8% 699 671 4.2%
% total revenues 33.2% 32.0% 32.6% 32.6%
EBIT 146 116 25.8% 273 236 15.7%
% 13.5% 11.2% 12.7% 11.5%
*Total Revenues reflect eliminations derived from both the overlap of fixed and mobile operations as well as international intercompany transactions; For further detail please visit www.telekomaustria.com/en/investor-relations
Service revenues +2.8% YoY
EBITDA margin +1.2p.p.
page 19
CONTENT
Highlights
Relevant events
Subscribers
América Móvil Consolidated
Mexico
Argentina, Paraguay & Uruguay
Brazil
Chile
Colombia
Ecuador
Peru
Central America
Caribbean
USA
Austria & CEE
Glossary
Currency Exchange Rates
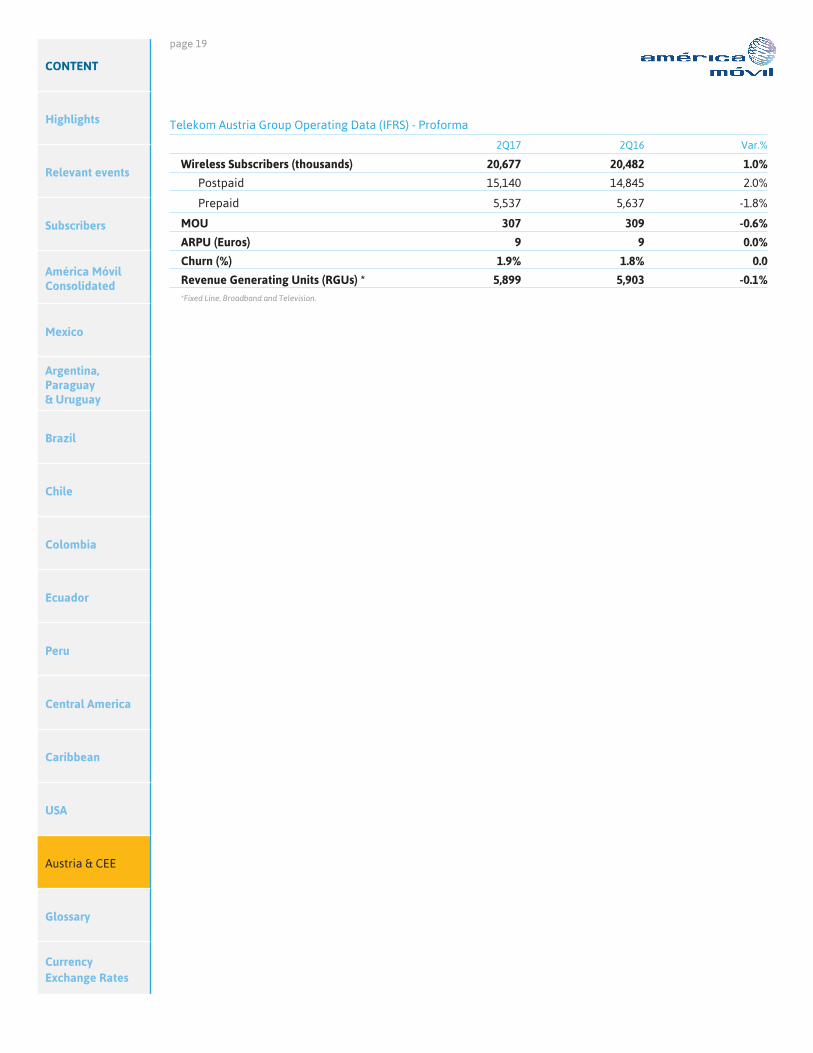
Telekom Austria Group Operating Data (IFRS) - Proforma
2Q17 2Q16 Var.%
Wireless Subscribers (thousands) 20,677 20,482 1.0%
Postpaid 15,140 14,845 2.0%
Prepaid 5,537 5,637 -1.8%
MOU 307 309 -0.6%
ARPU (Euros) 9 9 0.0%
Churn (%) 1.9% 1.8% 0.0
Revenue Generating Units (RGUs) * 5,899 5,903 -0.1%*Fixed Line, Broadband and Television.
page 20
CONTENT
Highlights
Relevant events
Subscribers
América Móvil Consolidated
Mexico
Argentina, Paraguay & Uruguay
Brazil
Chile
Colombia
Ecuador
Peru
Central America
Caribbean
USA
Austria & CEE
Glossary
Currency Exchange Rates
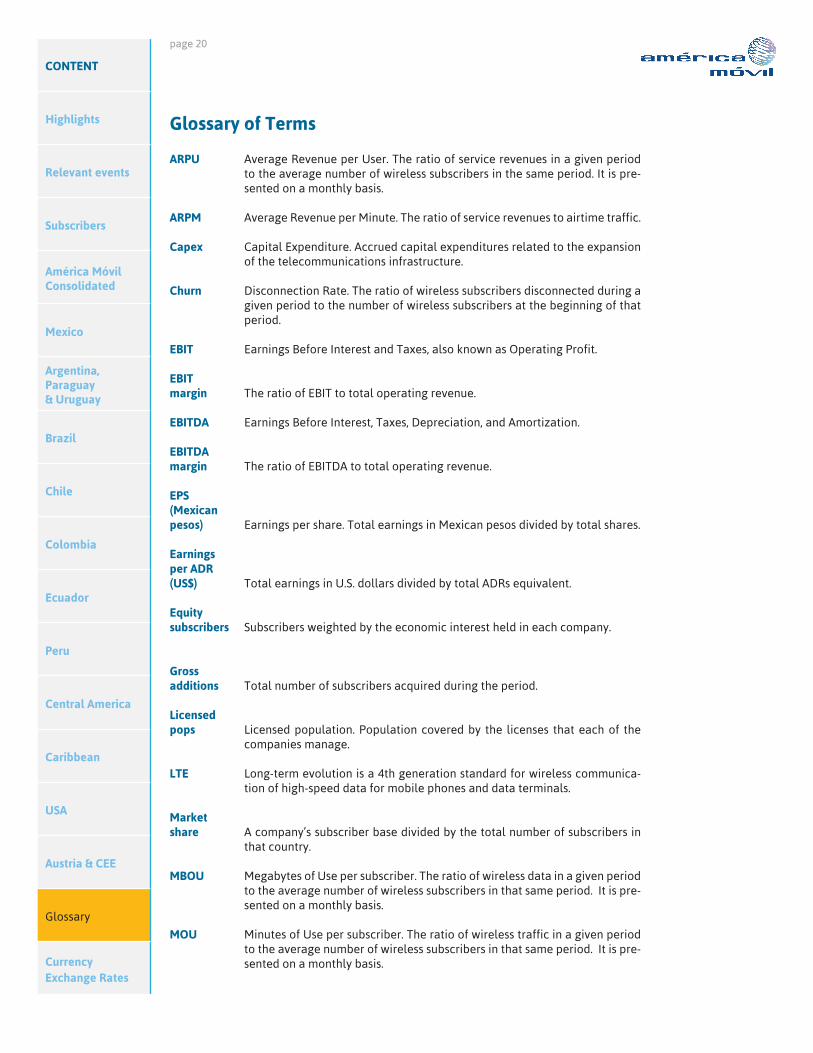
Glossary of Terms
ARPU Average Revenue per User. The ratio of service revenues in a given period to the average number of wireless subscribers in the same period. It is pre-sented on a monthly basis.
ARPM Average Revenue per Minute. The ratio of service revenues to airtime traffic.
Capex Capital Expenditure. Accrued capital expenditures related to the expansion of the telecommunications infrastructure.
Churn Disconnection Rate. The ratio of wireless subscribers disconnected during a given period to the number of wireless subscribers at the beginning of that period.
EBIT Earnings Before Interest and Taxes, also known as Operating Profit.
EBIT margin The ratio of EBIT to total operating revenue.
EBITDA Earnings Before Interest, Taxes, Depreciation, and Amortization.
EBITDA margin The ratio of EBITDA to total operating revenue.
EPS (Mexican pesos) Earnings per share. Total earnings in Mexican pesos divided by total shares.
Earnings per ADR (US$) Total earnings in U.S. dollars divided by total ADRs equivalent.
Equity subscribers Subscribers weighted by the economic interest held in each company.
Gross additions Total number of subscribers acquired during the period.
Licensed pops Licensed population. Population covered by the licenses that each of the
companies manage.
LTE Long-term evolution is a 4th generation standard for wireless communica-tion of high-speed data for mobile phones and data terminals.
Market share A company’s subscriber base divided by the total number of subscribers in
that country.
MBOU Megabytes of Use per subscriber. The ratio of wireless data in a given period to the average number of wireless subscribers in that same period. It is pre-sented on a monthly basis.
MOU Minutes of Use per subscriber. The ratio of wireless traffic in a given period to the average number of wireless subscribers in that same period. It is pre-sented on a monthly basis.
page 21
CONTENT
Highlights
Relevant events
Subscribers
América Móvil Consolidated
Mexico
Argentina, Paraguay & Uruguay
Brazil
Chile
Colombia
Ecuador
Peru
Central America
Caribbean
USA
Austria & CEE
Glossary
Currency Exchange Rates
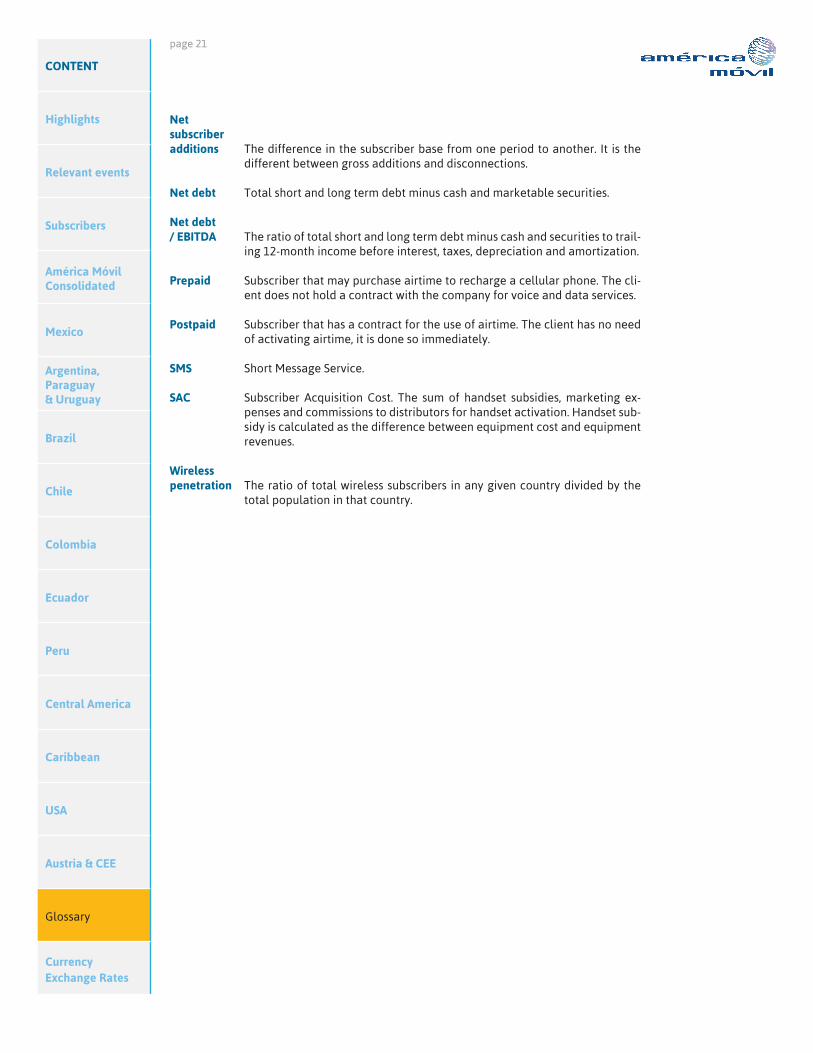
Net subscriber additions The difference in the subscriber base from one period to another. It is the
different between gross additions and disconnections.
Net debt Total short and long term debt minus cash and marketable securities.
Net debt / EBITDA The ratio of total short and long term debt minus cash and securities to trail-
ing 12-month income before interest, taxes, depreciation and amortization.
Prepaid Subscriber that may purchase airtime to recharge a cellular phone. The cli-ent does not hold a contract with the company for voice and data services.
Postpaid Subscriber that has a contract for the use of airtime. The client has no need of activating airtime, it is done so immediately.
SMS Short Message Service.
SAC Subscriber Acquisition Cost. The sum of handset subsidies, marketing ex-penses and commissions to distributors for handset activation. Handset sub-sidy is calculated as the difference between equipment cost and equipment revenues.
Wireless penetration The ratio of total wireless subscribers in any given country divided by the
total population in that country.
page 22
CONTENT
Highlights
Relevant events
Subscribers
América Móvil Consolidated
Mexico
Argentina, Paraguay & Uruguay
Brazil
Chile
Colombia
Ecuador
Peru
Central America
Caribbean
USA
Austria & CEE
Glossary
Currency Exchange Rates
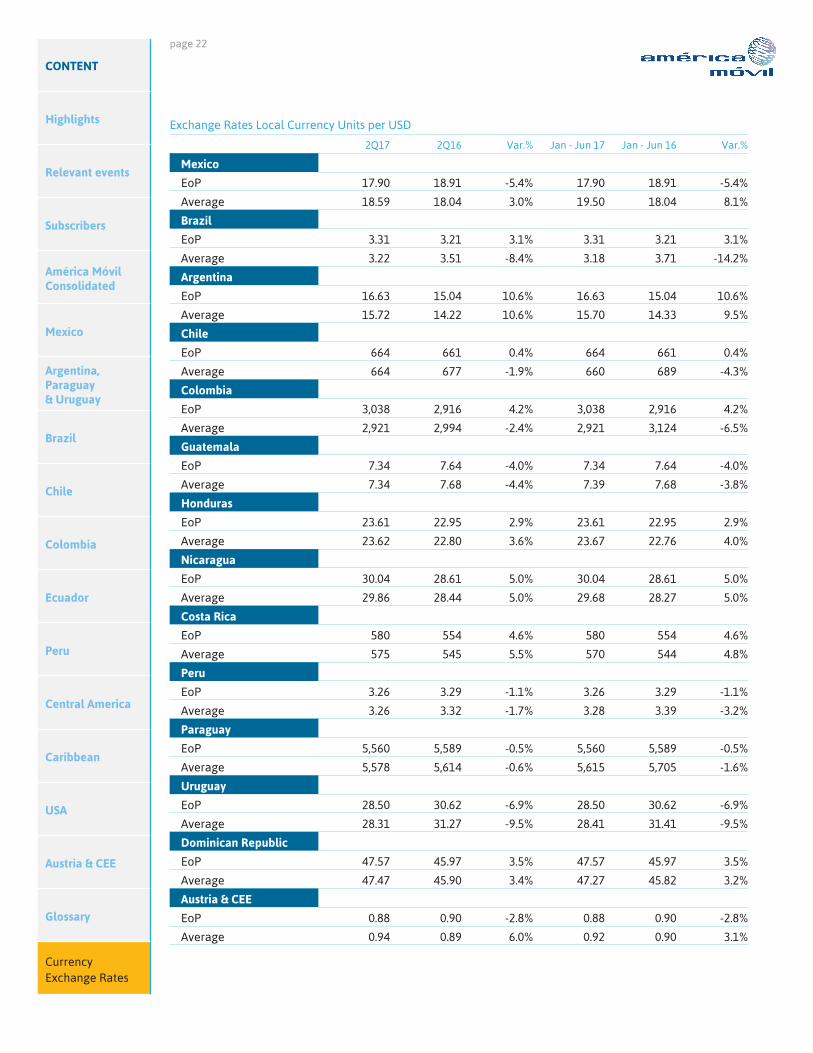
Exchange Rates Local Currency Units per USD
2Q17 2Q16 Var.% Jan - Jun 17 Jan - Jun 16 Var.%
Mexico
EoP 17.90 18.91 -5.4% 17.90 18.91 -5.4%
Average 18.59 18.04 3.0% 19.50 18.04 8.1%
Brazil
EoP 3.31 3.21 3.1% 3.31 3.21 3.1%
Average 3.22 3.51 -8.4% 3.18 3.71 -14.2%
Argentina
EoP 16.63 15.04 10.6% 16.63 15.04 10.6%
Average 15.72 14.22 10.6% 15.70 14.33 9.5%
Chile
EoP 664 661 0.4% 664 661 0.4%
Average 664 677 -1.9% 660 689 -4.3%
Colombia
EoP 3,038 2,916 4.2% 3,038 2,916 4.2%
Average 2,921 2,994 -2.4% 2,921 3,124 -6.5%
Guatemala
EoP 7.34 7.64 -4.0% 7.34 7.64 -4.0%
Average 7.34 7.68 -4.4% 7.39 7.68 -3.8%
Honduras
EoP 23.61 22.95 2.9% 23.61 22.95 2.9%
Average 23.62 22.80 3.6% 23.67 22.76 4.0%
Nicaragua
EoP 30.04 28.61 5.0% 30.04 28.61 5.0%
Average 29.86 28.44 5.0% 29.68 28.27 5.0%
Costa Rica
EoP 580 554 4.6% 580 554 4.6%
Average 575 545 5.5% 570 544 4.8%
Peru
EoP 3.26 3.29 -1.1% 3.26 3.29 -1.1%
Average 3.26 3.32 -1.7% 3.28 3.39 -3.2%
Paraguay
EoP 5,560 5,589 -0.5% 5,560 5,589 -0.5%
Average 5,578 5,614 -0.6% 5,615 5,705 -1.6%
Uruguay
EoP 28.50 30.62 -6.9% 28.50 30.62 -6.9%
Average 28.31 31.27 -9.5% 28.41 31.41 -9.5%
Dominican Republic
EoP 47.57 45.97 3.5% 47.57 45.97 3.5%
Average 47.47 45.90 3.4% 47.27 45.82 3.2%
Austria & CEE
EoP 0.88 0.90 -2.8% 0.88 0.90 -2.8%
Average 0.94 0.89 6.0% 0.92 0.90 3.1%
page 23
For further information please visit our website at: www.americamovil.com
América Móvil, S.A.B. de C.V. (the “Company”) quarterly reports and all other written materials may from time to time contain forward-looking statements that reflect the current views and/or expectations of the Company and its management with respect to its performance, business and future events. Forward looking statements include, without limitation, any statement that may predict, forecast, indicate or imply future results, performance, or achievements, and may contain words like “believe”, “anticipate”, “expect”, “envisages”, “will likely result”, or any other words or phrases of similar meaning. Such statements are subject to a number of risks, uncertainties and assumptions. We caution you that a number of important factors could cause actual results to differ materially from the plans, objectives, expectations, estimates and intentions expressed in this report. In no event, neither the Company nor any of its subsidiaries, affiliates, directors, officers, agents or employees shall be liable before any third party (including investors) for any investment or business decision made or action taken in reliance on the information and statements contained in this document or for any consequential, special or similar damages.
CONTENT
Highlights
Relevant events
Subscribers
América Móvil Consolidated
Mexico
Argentina, Paraguay & Uruguay
Brazil
Chile
Colombia
Ecuador
Peru
Central America
Caribbean
USA
Austria & CEE
Glossary
Currency Exchange Rates
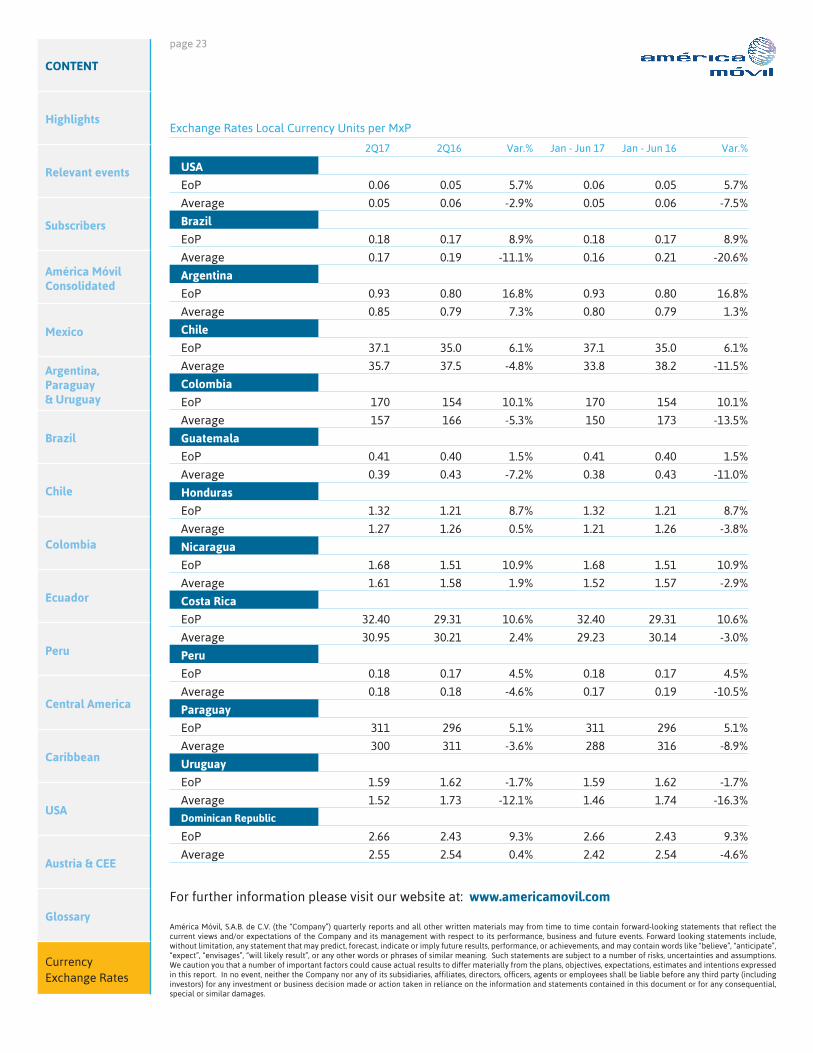
Exchange Rates Local Currency Units per MxP
2Q17 2Q16 Var.% Jan - Jun 17 Jan - Jun 16 Var.%
USA
EoP 0.06 0.05 5.7% 0.06 0.05 5.7%
Average 0.05 0.06 -2.9% 0.05 0.06 -7.5%
Brazil
EoP 0.18 0.17 8.9% 0.18 0.17 8.9%
Average 0.17 0.19 -11.1% 0.16 0.21 -20.6%
Argentina
EoP 0.93 0.80 16.8% 0.93 0.80 16.8%
Average 0.85 0.79 7.3% 0.80 0.79 1.3%
Chile
EoP 37.1 35.0 6.1% 37.1 35.0 6.1%
Average 35.7 37.5 -4.8% 33.8 38.2 -11.5%
Colombia
EoP 170 154 10.1% 170 154 10.1%
Average 157 166 -5.3% 150 173 -13.5%
Guatemala
EoP 0.41 0.40 1.5% 0.41 0.40 1.5%
Average 0.39 0.43 -7.2% 0.38 0.43 -11.0%
Honduras
EoP 1.32 1.21 8.7% 1.32 1.21 8.7%
Average 1.27 1.26 0.5% 1.21 1.26 -3.8%
Nicaragua
EoP 1.68 1.51 10.9% 1.68 1.51 10.9%
Average 1.61 1.58 1.9% 1.52 1.57 -2.9%
Costa Rica
EoP 32.40 29.31 10.6% 32.40 29.31 10.6%
Average 30.95 30.21 2.4% 29.23 30.14 -3.0%
Peru
EoP 0.18 0.17 4.5% 0.18 0.17 4.5%
Average 0.18 0.18 -4.6% 0.17 0.19 -10.5%
Paraguay
EoP 311 296 5.1% 311 296 5.1%
Average 300 311 -3.6% 288 316 -8.9%
Uruguay
EoP 1.59 1.62 -1.7% 1.59 1.62 -1.7%
Average 1.52 1.73 -12.1% 1.46 1.74 -16.3%
Dominican Republic
EoP 2.66 2.43 9.3% 2.66 2.43 9.3%
Average 2.55 2.54 0.4% 2.42 2.54 -4.6%