Embed Size (px)
Citation preview

The Mispricing of Abnormal AccrualsAuthor(s): Hong XieReviewed work(s):Source: The Accounting Review, Vol. 76, No. 3 (Jul., 2001), pp. 357-373Published by: American Accounting AssociationStable URL: http://www.jstor.org/stable/3068940 .Accessed: 02/07/2012 02:31
Your use of the JSTOR archive indicates your acceptance of the Terms & Conditions of Use, available at .http://www.jstor.org/page/info/about/policies/terms.jsp
.JSTOR is a not-for-profit service that helps scholars, researchers, and students discover, use, and build upon a wide range ofcontent in a trusted digital archive. We use information technology and tools to increase productivity and facilitate new formsof scholarship. For more information about JSTOR, please contact [email protected].
.
American Accounting Association is collaborating with JSTOR to digitize, preserve and extend access to TheAccounting Review.
http://www.jstor.org
THE ACCOUNTING REVIEW Vo. 76, No. 3 July 2001 pp. 357-373
The Mispricing of
Abnormal Accruals
Hong Xie University of Illinois at Urbana-Champaign
ABSTRACT: This paper examines the market pricing of Jones (1991) model- estimated abnormal accruals (often termed "discretionary accruals" in the prior literature) to test whether stock prices rationally reflect the one-year- ahead earnings implications of these accruals. Using the Mishkin (1983) and hedge-portfolio test methods Sloan (1996) employs, I find that the market overestimates the persistence, or one-year-ahead earnings implications, of ab- normal accruals, and consequently overprices these accruals. These results extend Subramanyam (1996) by demonstrating that the market not only prices, but also overprices abnormal accruals. They also suggest that the overpricing of total accruals that Sloan (1996) documents is due largely to abnormal ac- cruals. The results are robust to five alternative measures of abnormal accru- als, and still hold when I estimate abnormal accruals after controlling for major unusual but largely nondiscretionary accruals. The latter finding is consistent with the notion that the market overprices the portion of abnormal accruals stemming from managerial discretion.
Keywords: accruals; abnormal accruals; discretionary accruals; mispricing.
Data Availability: Data used in this study are available from public sources identified in the study.
This paper, formerly entitled "Are Discretionary Accruals Mispriced? A Reexamination," is based on my dissertation completed at The University of Iowa and on work completed while I was at The University of Arizona. I thank my dissertation committee members, Tim Loughran, Eugene Savin, Charles Wasley, and especially Dan Collins (Co-chair) and Mort Pincus (Co-chair) for many valuable comments and suggestions. I also thank Ashiq Ali, Paul Beck, Bruce Billings, Robert Bowen, Tom Carnes, Kevin Den Adel, Dan Dhaliwal, Rajib Doogar, Cristi Gleason, Jonathan Glover, Paul Hribar, Bruce Johnson, Sok-Hyon Kang, Irene Karamanou, Laurie Krigman, David Mest, Jim McKeown, Lil Mills, Tom Omer, Mark Peecher, John Phillips, Tom Schaefer, Shivaram Rajgopal, Jay Rich, Jerry Salamon, D. Shores, Richard Sloan, Shyam Sunder, Wayne Thomas, Rick Tubbs, Bill Waller, an anonymous reviewer, and accounting workshop participants at The University of Arizona, Carnegie Mellon Uni- versity, Florida State University, University of Illinois, The University of Iowa, Pennsylvania State University, University of Utah, University of Washington, and the 1999 American Accounting Association Annual Meeting for many helpful comments. Financial support from the Arthur Andersen Foundation is gratefully acknowledged.
Submitted February 1999 Accepted January 2001
357
358 The Accounting Review, July 2001
I. INTRODUCTION T n his paper examines the market pricing of Jones (1991) model-estimated abnormal
accruals (often termed "discretionary accruals" in the prior literature) to test whether stock prices rationally reflect the one-year-ahead earnings implications of these ac-
cruals. Subramanyam (1996) finds that the market prices Jones (1991) model-estimated abnormal accruals, and that abnormal accruals are positively associated with future profit- ability. However, Subramanyam's (1996) evidence that abnormal accruals are positively related to future profitability does not necessarily mean that the market rationally prices these accruals with respect to their association with future profitability, such as earnings.
Sloan (1996) investigates the market pricing of total accruals. He finds that the market fails to appreciate fully the lower persistence of the accrual component of earnings and, consequently, overprices total accruals. Using quarterly data, Collins and Hribar (2000a) also find that the market overprices total accruals. Neither Sloan (1996) nor Collins and Hribar (2000a) investigate whether the overpricing is due to abnormal accruals, normal accruals, or both.
Teoh et al. (1998a, 1998b) and Rangan (1998) document that managers choose positive abnormal accruals to opportunistically increase earnings before initial public offerings (IPOs) or seasoned equity offerings, and that the market overprices these abnormal accruals. However, the extant literature has not investigated whether the market misprices abnormal accruals in more general settings where managers may or may not have opportunistic incentives to manipulate earnings. This paper empirically examines this issue.
Following Sloan (1996), I use the Mishkin (1983) test and the hedge-portfolio test methods to examine whether the market rationally prices abnormal accruals with respect to their one-year-ahead earnings implications. The Mishkin (1983) test provides a statistical comparison between: (1) a measure of the market's pricing of abnormal accruals (i.e., the market's valuation coefficient on abnormal accruals) and (2) a measure of abnormal accru- als' ability to predict one-year-ahead earnings (i.e., the forecasting coefficient of these ac- cruals). If the market's valuation coefficient on abnormal accruals is significantly larger than the forecasting coefficient of these accruals for one-year-ahead earnings, then the Mishkin (1983) test would indicate that the market overprices abnormal accruals. Con- versely, if the valuation coefficient is significantly smaller than the forecasting coefficient, then the Mishkin (1983) test would suggest that the market underprices abnormal accruals. Since the forecasting coefficient is a measure of the persistence of abnormal accruals (Free- man et al. 1982; Sloan 1996), I attribute any market mispricing of abnormal accruals to the market's failure to correctly assess the persistence of these accruals.
The hedge-portfolio test forms a portfolio long in firms in the most negative decile and short in firms in the most positive decile of current abnormal accruals. Evidence that the hedge portfolio yields consistently positive abnormal returns in subsequent years would suggest that the market overprices abnormal accruals in the portfolio formation year.
My Mishkin (1983) test results suggest that abnormal accruals are less persistent than normal accruals, which, in turn, are less persistent than cash from operations. Moreover, the market overestimates the persistence of, and thus overprices, both abnormal and normal accruals, although the overpricing of abnormal accruals is more severe. The hedge-portfolio test results confirm the overpricing of abnormal accruals detected by the Mishkin (1983) test, but do not support the overpricing of normal accruals. Taken together, the results of these two tests suggest that the market overprices abnormal accruals, but that it does not materially misprice normal accruals.
Xie-The Mispricing of Abnormal Accruals 359
Prior research has often termed the Jones (1991) model-estimated abnormal accruals as "discretionary accruals," and then used these abnormal accruals as a proxy for mana- gerial discretion (e.g., Jones 1991; Subramanyam 1996; Erickson and Wang 1999). How- ever, Healy (1996) and Bernard and Skinner (1996) point out that the Jones (1991) model (hereafter the Jones model) residuals capture not only managerial discretion, but also un- usual nondiscretionary accruals and unintentional misstatements. Due to this measurement error in the Jones model residuals, it is difficult to ascertain whether the market overprices that portion of abnormal accruals stemming from earnings management or the portion arising from unusual business circumstances. To provide evidence on this issue, I estimate abnormal accruals after controlling for major unusual accruals and non-articulation events (i.e., mergers, acquisitions, and divestitures) following the suggestions in Bernard and Skin- ner (1996) and Collins and Hribar (2000b). I find that my refined measure of abnormal accruals, which more cleanly isolates managerial discretion, is still overpriced.
This paper contributes to the literature on abnormal accruals and market efficiency in several ways. First, it provides direct evidence that the market overprices abnormal accruals. Besides extending Subramanyam (1996) and Sloan (1996), this finding adds to a growing body of research suggesting that the market does not fully impound publicly disclosed accounting information (Freeman and Tse 1989; Bernard and Thomas 1989, 1990; Sloan 1996; Teoh et al. 1998a, 1998b; Rangan 1998; Collins and Hribar 2000a). My results are also consistent with the conclusion reached in a contemporaneous and independently de- veloped study by DeFond and Park (2001). Their conclusion that the market overprices abnormal accruals because investors underanticipate the future reversal of these accruals is entirely consistent with my conclusion that the market overprices abnormal accruals because investors overestimate the persistence of these accruals. My study, however, differs from DeFond and Park (2001) in terms of research design, research question, and controls for measurement error in the balance-sheet-estimated total accruals.'
Second, the evidence in this paper suggests that the market mispricing of abnormal accruals is due to its inability to correctly assess the persistence of abnormal accruals. Moreover, this mispricing is not limited to settings that give managers opportunistic incen- tives to manipulate earnings, such as before IPOs or seasoned equity offerings. This sug- gests that investors may benefit from disclosures that help them assess the persistence of accrual information. Hribar's (2000) finding that the market does not materially misprice those transitory accrual items that financial reports make relatively visible, such as special item accruals and LIFO liquidations, is consistent with the notion that appropriate disclo- sures may help the market correctly assess the persistence of accrual information.
Finally, I control for major unusual accruals and non-articulation events when estimat- ing abnormal accruals. Evidence that the market still overprices this refined measure of abnormal accruals is consistent with the market overpricing the portion of abnormal accruals arising from managerial discretion.
1 For example, I use a long-window design while DeFond and Park (2001) use a short-window design and a different abnormal accrual model. I examine whether the market assigns an appropriate valuation coefficient to abnormal accruals. DeFond and Park (2001), on the other hand, investigate whether the market valuation of earnings surprises (i.e., the earnings response coefficient or ERC) for good and bad news firms, respectively, differs across income-increasing and income-decreasing abnormal accruals, and whether the market fully antic- ipates the future reversal of abnormal accruals. Finally, I control for measurement error in the balance-sheet- estimated total accruals following Collins and Hribar (2000b) in an attempt to better isolate the portion of abnormal accruals stemming from managerial discretion, whereas they do not.
360 The Accounting Review, July 2001
The paper proceeds as follows. Section II describes the sample and variable measure- ment, Section III provides evidence on the market overpricing of abnormal accruals, and Section IV conducts sensitivity analyses. I conclude the paper in Section V.
II. RESEARCH DESIGN Sample Selection
I obtain all data from the 1995 Compustat Annual Industrial, Research, and Full Cov- erage files, and the 1995 CRSP monthly return files. Since funds from operations (Com- pustat item #110) are not available until 1971 and since the analysis requires stock returns for three years after the sample year, my sample covers the 22-year period from 1971 to 1992.2 For this sample period, I delete firm-year observations with: (1) missing beginning- of-year total assets or insufficient data to calculate accruals as defined below; (2) NASDAQ observations prior to 1982;3 (3) missing monthly stock returns on the 1995 CRSP files; and (4) fewer than six observations in any two-digit SIC code and year combination, or where any variable in the Jones model (described below) has a value that is more than three standard deviations away from its mean. The final sample consists of 7,506 firms and 56,692 firm-year observations from 1971 to 1992.
Variable Measurement I use Subramanyam's (1996) definitions of earnings, accruals, and cash from operations.
Earnings (EARNt) are defined as income before extraordinary items (Compustat item #18), and cash from operations (CFO,) is net cash flows from operating activities reported under SFAS No. 95 (Compustat item #308). For firm-years prior to 1988 when Compustat item #308 is unavailable, I estimate CFOt as follows:
CFOt = FFOt - ACAt + ACASHt + ACLt - ASTDEBTt,
where:
FFOt = funds from operations (Compustat item #110); SCAt = change in current assets (Compustat item #4);
ACASHt = change in cash and short-term investments (Compustat item #1); ACLt = change in current liabilities (Compustat item #5); and
ASTDEBTt = change in short term debt (Compustat item #34).
Total accruals (ACCR1) are measured as the difference between earnings and cash from operations; i.e., ACCRt = EARNt - CFOt.4 All three variables are deflated by beginning- of-year total assets (TAt-I, Compustat item #6).
I use the Jones model to estimate normal accruals and abnormal accruals (firm subscript is omitted for ease of exposition):
2 To avoid a survivorship bias, my sample contains firms that cease to exist after the sample year. For these nonsurviving firms, return and Compustat data are missing in one or more years after the sample year. I use size-adjusted returns defined as the difference between firms' raw returns and the returns on their corre- sponding size-matched decile portfolios. The 1995 CRSP Indices files report size decile portfolio returns for NASDAQ firms starting in 1982.
4 Collins and Hribar (2000b) suggest that total accruals measured directly from the statement of cash flows (post 1987) are accurate, while total accruals estimated using a balance sheet approach (prior to 1988) contain mea- surement error when non-articulation events such as mergers, acquisitions, and divestitures are present. Un- tabulated analyses reveal that the results reported in my study hold for both pre-1988 and post-1987 periods.
Xie-The Mispricing of Abnormal Accruals 361
ACCR,/TA,1 = a1[1/TA,-1] + a2[AREV,/TA,-,] + a3[PPE,/TA,-1] + et, (1)
where AREVt is the change in sales revenues in year t (Compustat item #12) and PPEt is gross property, plant, and equipment in year t (Compustat item #7). Following DeFond and Jiambalvo (1994) and Subramanyam (1996), I estimate the Jones model in cross-section for each two-digit SIC code and year combination, formed separately for NYSE/AMEX firms and for NASDAQ firms. I denote the predicted values of the Jones model as normal accruals (NACt) and the residuals as abnormal accruals (ABNACt).
I use the 1995 CRSP monthly returns file to measure annual buy-and-hold returns (RETURNt) for the 12-month period ending three months after the firm's fiscal year end. If a stock is delisted during a particular year, I assume the liquidating proceeds are re- invested in the market portfolio for the remainder of the year. Following Sloan (1996), I calculate size-adjusted abnormal returns (SIZEAJRt) as the difference between a firm's annual buy-and-hold return and the annual buy-and-hold return for the same 12-month period on the market-capitalization-based portfolio decile (i.e., size decile) to which the firm belongs. I use the CRSP size decile breakpoints to classify each firm into a size decile according to its market value of equity at the beginning of the calendar year in which the 12-month return period begins.
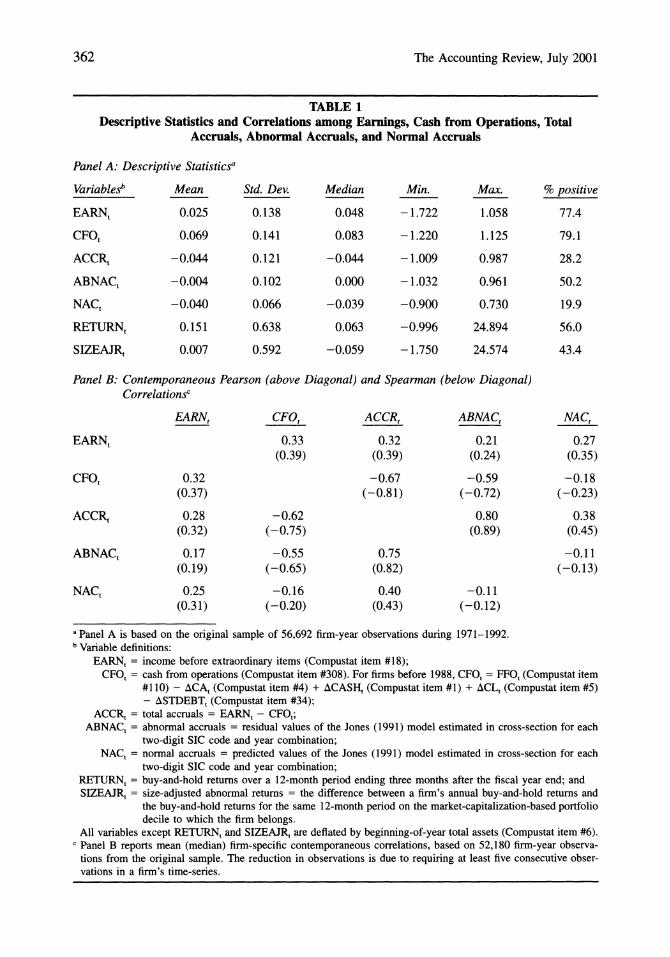
Panel A of Table 1 provides descriptive statistics for the sample. The results are com- parable to those reported in Subramanyam (1996, Table 2), except that the means (medians) of earnings and raw returns are somewhat smaller in my sample.5 As expected, average total accruals are negative (-0.044) due to depreciation expenses, and average abnormal accruals are near zero (_0.004).6
Panel B of Table 1 reports the mean and median firm-specific Pearson and Spearman correlations between selected variables. The Pearson results are comparable to those re- ported in Subramanyam (1996, Table 5, Panel A), except that the correlations between total accruals and abnormal accruals, and between total accruals and normal accruals are some- what larger in my sample. Although the correlation between total accruals and abnormal accruals is high (Pearson = 0.80; Spearman = 0.75), abnormal accruals are not the major component of total accruals. The mean (median) ratio of abnormal accruals to total accruals in my sample is 0.37 (0.46) after deleting 168 observations where total accruals are virtually zero (untabulated). Thus, abnormal accruals are a relatively smaller but more variable com- ponent of total accruals, whereas normal accruals are a larger but relatively more stable component.
III. TESTS OF THE PRICING OF ABNORMAL ACCRUALS The Mishkin Test
Mishkin (1983) develops a framework to test the rational expectations hypothesis in macroeconomics (hereafter the Mishkin test). I employ the Mishkin approach to examine whether the market rationally prices abnormal accruals with respect to their one-year-ahead earnings implications. Specifically, I estimate the following regression system:7
5 Two factors may contribute to this difference. First, Subramanyam (1996) appears to require earnings and other accounting data in the three years after the sample year, while I do not. Imposing this requirement on my sample yields mean (median) earnings of 0.047 (0.054) and mean (median) raw returns of 0.165 (0.079), which are closer to Subramanyam's 0.053 (0.057) for earnings and 0.183 (0.103) for raw returns. Second, Subramanyam's sample does not include firms on the research file. Despite of these differences, I successfully replicate Subra- manyam (1996, Tables 3, 6, 7, and 8) on my sample.
6 Since the Jones model does not have an intercept, the sum of the residuals is not necessarily equal to zero. 7 I gratefully thank Richard Sloan for his generous help with the Mishkin test method.
362 The Accounting Review, July 2001
TABLE 1 Descriptive Statistics and Correlations among Earnings, Cash from Operations, Total
Accruals, Abnormal Accruals, and Normal Accruals
Panel A: Descriptive Statisticsa
Variablesb Mean Std. Dev. Median Min. Max. % positive
EARNt 0.025 0.138 0.048 -1.722 1.058 77.4
CFOt 0.069 0.141 0.083 -1.220 1.125 79.1
ACCRt -0.044 0.121 -0.044 -1.009 0.987 28.2
ABNACt -0.004 0.102 0.000 - 1.032 0.961 50.2
NACt -0.040 0.066 -0.039 -0.900 0.730 19.9
RETURNt 0.151 0.638 0.063 -0.996 24.894 56.0
SIZEAJRt 0.007 0.592 -0.059 -1.750 24.574 43.4
Panel B: Contemporaneous Pearson (above Diagonal) and Spearman (below Diagonal) Correlationsc
EARNt CFOt ACCRt ABNACt NACt
EARNt 0.33 0.32 0.21 0.27 (0.39) (0.39) (0.24) (0.35)
CFOt 0.32 -0.67 -0.59 -0.18 (0.37) (-0.81) (-0.72) (-0.23)
ACCRt 0.28 -0.62 0.80 0.38 (0.32) (-0.75) (0.89) (0.45)
ABNACt 0.17 -0.55 0.75 -0.11 (0.19) (-0.65) (0.82) (-0.13)
NACt 0.25 -0.16 0.40 -0.11 (0.31) (-0.20) (0.43) (-0.12)
a Panel A is based on the original sample of 56,692 firm-year observations during 1971-1992. b Variable definitions:
EARNt = income before extraordinary items (Compustat item #18); CFOt = cash from operations (Compustat item #308). For firms before 1988, CFOt = FFOt (Compustat item
#110) - ACAt (Compustat item #4) + ACASHt (Compustat item #1) + ACLt (Compustat item #5) - ASTDEBT, (Compustat item #34);
ACCR, = total accruals = EARNt - CFOt; ABNACt = abnormal accruals = residual values of the Jones (1991) model estimated in cross-section for each
two-digit SIC code and year combination; NACt = normal accruals = predicted values of the Jones (1991) model estimated in cross-section for each
two-digit SIC code and year combination; RETURNt = buy-and-hold returns over a 12-month period ending three months after the fiscal year end; and SIZEAJRt = size-adjusted abnormal returns = the difference between a firm's annual buy-and-hold returns and
the buy-and-hold returns for the same 12-month period on the market-capitalization-based portfolio decile to which the firm belongs.
All variables except RETURNt and SIZEAJRt are deflated by beginning-of-year total assets (Compustat item #6). c Panel B reports mean (median) firm-specific contemporaneous correlations, based on 52,180 firm-year observa-
tions from the original sample. The reduction in observations is due to requiring at least five consecutive obser- vations in a firm's time-series.
Xie-The Mispricing of Abnormal Accruals 363
TABLE 2 Nonlinear Generalized Least Squares Estimation (the Mishkin Test) of the Market Pricing of
Cash from Operations, Normal Accruals, and Abnormal Accruals with Respect to Their Implications for One-Year-Ahead Earnings
Panel A: Market Pricing of Earnings Components with Respect to Their Implications for One-Year- Ahead Earnings
EARN,+, = yo + y1CFO, + y2NAC, + y3ABNAC, + vt+, (2)
SIZEAJR,+, = a + J3(EARN,+, - yo - y*CFO, - y*2NAC, - y*3ABNAC,) + s,+] (3)a
Forecasting Coefficients Valuation Coefficients
Asymptotic Asymptotic Parameter Estimate Std. Error Parameter Estimate Std. Error
y (CFO) 0.73 0.004 y*1 (CFO) 0.67 0.013
Y2 (NAC) 0.70 0.007 Y*2 (NAC) 0.78 0.024
Y3 (ABNAC) 0.57 0.005 *3 (ABNAC) 0.69 0.018
Panel B: Tests of Rational Pricing of Earnings Components
Likelihood Ratio Marginal Null Hypotheses Statistic Significance Level
CFO: y*I = wy 23.15b <0.0001
NAC: Y*2 = PY2 11.62 <0.001
ABNAC: y*3 = 'Y3 42.11 <0.0001
NAC, ABNAC: )Y*2 = "y*3 and "Y2 = PY3 277.28 <0.0001
CFO, NAC, ABNAC: y*1 = wy and "Y*2 = "Y2 and "Y*3 = )/3 147.78 <0.0001
a Equations (2) and (3) are jointly estimated using an iterative generalized nonlinear least squares estimation pro- cedure based on 56,692 observations during 1971-1992. Due to missing values for the dependent variables, the number of observations used is 51,579.
b 2NLn(SSRc/SSRu) = 2 x 51,579 x Ln(30,546.905/30,540.051) = 23.15. The variables are defined in Table 1.
EARNt+1 = yo + -yCFOt + Y2NACt + Y3ABNACt + v-t+, (2)
SIZEAJR,+1 = (X + 3(EARNt+1 - yo - y*1CFOt - Y*2NACt - y*3ABNACt) + ?t+,, (3)
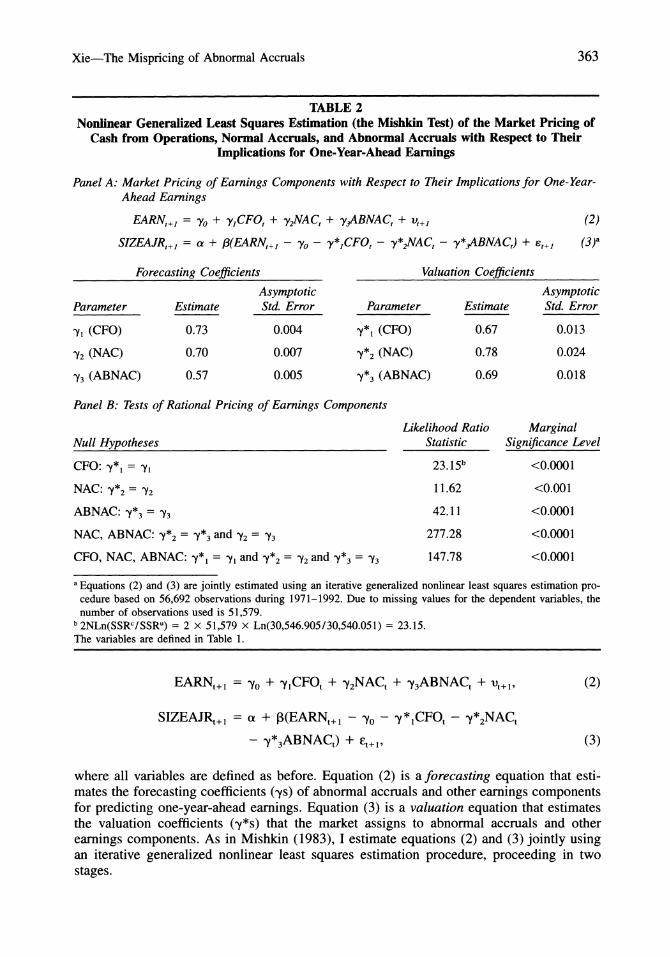
where all variables are defined as before. Equation (2) is a forecasting equation that esti- mates the forecasting coefficients (ys) of abnormal accruals and other earnings components for predicting one-year-ahead earnings. Equation (3) is a valuation equation that estimates the valuation coefficients (y*s) that the market assigns to abnormal accruals and other earnings components. As in Mishkin (1983), I estimate equations (2) and (3) jointly using an iterative generalized nonlinear least squares estimation procedure, proceeding in two stages.
364 The Accounting Review, July 2001
In the first stage, I jointly estimate equations (2) and (3) without imposing any con- straints on Iys and ys. To test whether the valuation coefficients (y*s) are significantly different from their counterpart forecasting coefficients (ys) obtained in the first stage, I estimate equations (2) and (3) jointly in the second stage after imposing the rational pricing constraints, r*q = Yq (q = 1, 2, and/or 3). Mishkin shows that the following likelihood ratio statistic is asymptotically x2(q) distributed under the null hypothesis that the market rationally prices one or more earnings components with respect to their associations with one-year-ahead earnings:
2NLn(SSRC/SSRu),
where:
q = the number of rational pricing constraints imposed; N = the number of sample observations;
Ln = natural logarithm operator; SSRC = the sum of squared residuals from the constrained regressions in the second stage;
and SSRU = the sum of squared residuals from the unconstrained regressions in the first stage.
I reject the rational pricing of one or more earnings components (i.e., -*q = 'Yq, q = 1, 2, and/or 3) if the above likelihood ratio statistic is sufficiently large.
Panel A of Table 2 reports the coefficient estimates for equations (2) and (3) obtained in the first stage.' For cash from operations, the valuation coefficient (Y*1 = 0.67) is smaller than the forecasting coefficient (yl = 0.73), suggesting that the market underprices cash from operations relative to its ability to forecast one-year-ahead earnings. To test whether this underpricing is statistically significant, I jointly estimate equations (2) and (3) again in the second stage, after imposing the rational pricing constraint (i.e., -y*l = yl). The likeli- hood ratio statistic of 23.15 reported in Panel B of Table 2 is significant at the 0.0001 level, indicating that the underpricing of cash from operations (-y*I < y1) is statistically significant.
Panel A of Table 2 shows that the valuation coefficients the market assigns to normal accruals (Y*2) and abnormal accruals (Y*3) are 0.78 and 0.69, respectively. These coeffi- cients are larger than their forecasting counterparts (Y2 = 0.70, Y3 = 0.57). Specifically, Y*2 is approximately 11 percent greater than Y2, and Y*3 is 21% greater than 3Y. Panel B of Table 2 reports that the likelihood ratio statistics reject the null hypotheses of rational pricing of normal accruals (p < 0.001) and abnormal accruals (p < 0.0001). Therefore, the market significantly overprices both normal accruals (Y*2 > Y2) and abnormal accruals (w*3
> Y3). The overpricing appears more severe for abnormal accruals because the likelihood ratio statistic (277.28) rejects a special case of the null hypothesis that the market overprices normal and abnormal accruals to the same extent (Y*2 = Y*3 and Y2 = Y3). Finally, the likelihood ratio statistic of 147.78 rejects the null hypothesis that the market rationally prices all three earnings components (p < 0.0001).
8 Coefficient estimates for (x, A, and -y are not reported because they have no bearing on the market pricing of earnings components.
Xie-The Mispricing of Abnormal Accruals 365
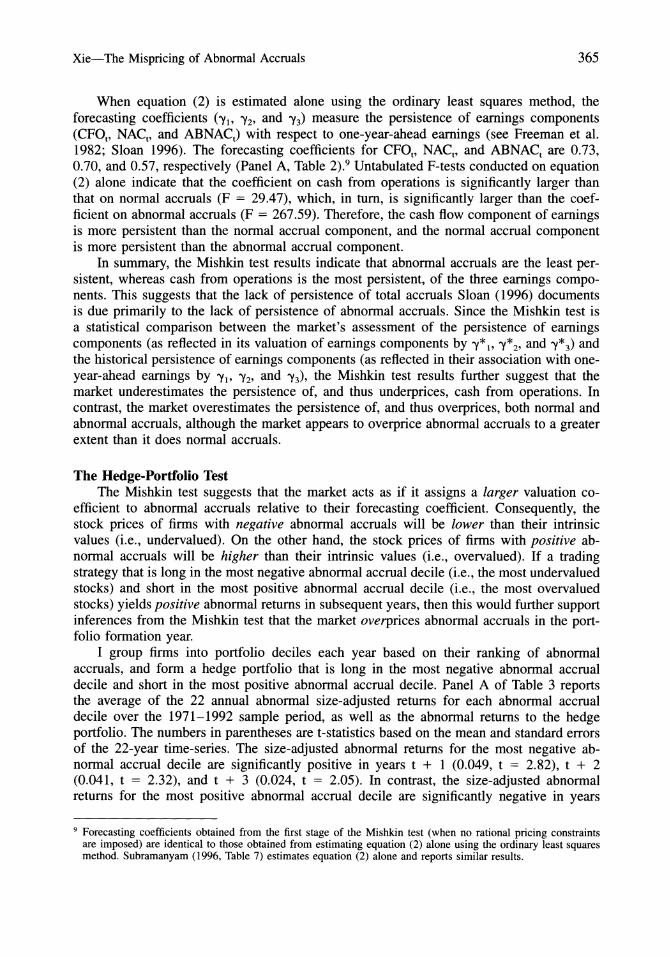
When equation (2) is estimated alone using the ordinary least squares method, the forecasting coefficients (_Y1, Y2, and Y3) measure the persistence of earnings components (CFOt, NACt, and ABNACt) with respect to one-year-ahead earnings (see Freeman et al. 1982; Sloan 1996). The forecasting coefficients for CFOt, NACt, and ABNACt are 0.73, 0.70, and 0.57, respectively (Panel A, Table 2).9 Untabulated F-tests conducted on equation (2) alone indicate that the coefficient on cash from operations is significantly larger than that on normal accruals (F = 29.47), which, in turn, is significantly larger than the coef- ficient on abnormal accruals (F = 267.59). Therefore, the cash flow component of earnings is more persistent than the normal accrual component, and the normal accrual component is more persistent than the abnormal accrual component.
In summary, the Mishkin test results indicate that abnormal accruals are the least per- sistent, whereas cash from operations is the most persistent, of the three earnings compo- nents. This suggests that the lack of persistence of total accruals Sloan (1996) documents is due primarily to the lack of persistence of abnormal accruals. Since the Mishkin test is a statistical comparison between the market's assessment of the persistence of earnings components (as reflected in its valuation of earnings components by y*C, Y*2, and Y*3) and the historical persistence of earnings components (as reflected in their association with one- year-ahead earnings by yl, Y2, and y3), the Mishkin test results further suggest that the market underestimates the persistence of, and thus underprices, cash from operations. In contrast, the market overestimates the persistence of, and thus overprices, both normal and abnormal accruals, although the market appears to overprice abnormal accruals to a greater extent than it does normal accruals.
The Hedge-Portfolio Test The Mishkin test suggests that the market acts as if it assigns a larger valuation co-
efficient to abnormal accruals relative to their forecasting coefficient. Consequently, the stock prices of firms with negative abnormal accruals will be lower than their intrinsic values (i.e., undervalued). On the other hand, the stock prices of firms with positive ab- normal accruals will be higher than their intrinsic values (i.e., overvalued). If a trading strategy that is long in the most negative abnormal accrual decile (i.e., the most undervalued stocks) and short in the most positive abnormal accrual decile (i.e., the most overvalued stocks) yields positive abnormal returns in subsequent years, then this would further support inferences from the Mishkin test that the market overprices abnormal accruals in the port- folio formation year.
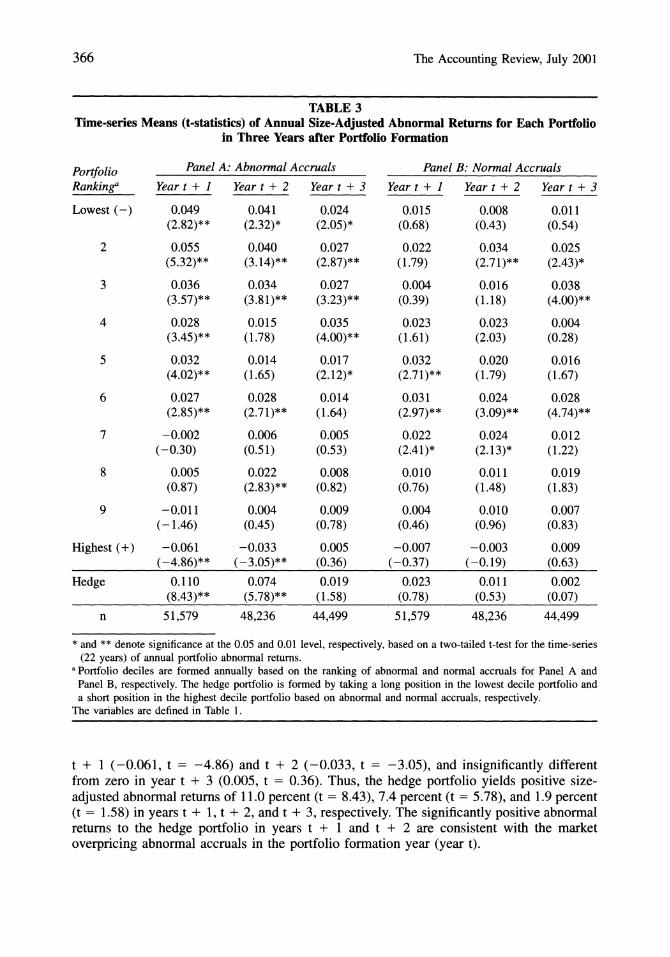
I group firms into portfolio deciles each year based on their ranking of abnormal accruals, and form a hedge portfolio that is long in the most negative abnormal accrual decile and short in the most positive abnormal accrual decile. Panel A of Table 3 reports the average of the 22 annual abnormal size-adjusted returns for each abnormal accrual decile over the 1971-1992 sample period, as well as the abnormal returns to the hedge portfolio. The numbers in parentheses are t-statistics based on the mean and standard errors of the 22-year time-series. The size-adjusted abnormal returns for the most negative ab- normal accrual decile are significantly positive in years t + 1 (0.049, t = 2.82), t + 2 (0.041, t = 2.32), and t + 3 (0.024, t = 2.05). In contrast, the size-adjusted abnormal returns for the most positive abnormal accrual decile are significantly negative in years
9 Forecasting coefficients obtained from the first stage of the Mishkin test (when no rational pricing constraints are imposed) are identical to those obtained from estimating equation (2) alone using the ordinary least squares method. Subramanyam (1996, Table 7) estimates equation (2) alone and reports similar results.
366 The Accounting Review, July 2001
TABLE 3 Time-series Means (t-statistics) of Annual Size-Adjusted Abnormal Returns for Each Portfolio
in Three Years after Portfolio Formation
Portfolio Panel A: Abnormal Accruals Panel B: Normal Accruals Rankinga Year t + I Year t + 2 Year t + 3 Year t + I Year t + 2 Year t + 3
Lowest (-) 0.049 0.041 0.024 0.015 0.008 0.011 (2.82)** (2.32)* (2.05)* (0.68) (0.43) (0.54)
2 0.055 0.040 0.027 0.022 0.034 0.025 (5.32)** (3.14)** (2.87)** (1.79) (2.71)** (2.43)*
3 0.036 0.034 0.027 0.004 0.016 0.038 (3.57)** (3.81)** (3.23)** (0.39) (1.18) (4.00)**
4 0.028 0.015 0.035 0.023 0.023 0.004 (3.45)** (1.78) (4.00)** (1.61) (2.03) (0.28)
5 0.032 0.014 0.017 0.032 0.020 0.016 (4.02)** (1.65) (2.12)* (2.71)** (1.79) (1.67)
6 0.027 0.028 0.014 0.031 0.024 0.028 (2.85)** (2.71)** (1.64) (2.97)** (3.09)** (4.74)**
7 -0.002 0.006 0.005 0.022 0.024 0.012 (-0.30) (0.51) (0.53) (2.41)* (2.13)* (1.22)
8 0.005 0.022 0.008 0.010 0.011 0.019 (0.87) (2.83)** (0.82) (0.76) (1.48) (1.83)
9 -0.011 0.004 0.009 0.004 0.010 0.007 (-1.46) (0.45) (0.78) (0.46) (0.96) (0.83)
Highest (+) -0.061 -0.033 0.005 -0.007 -0.003 0.009 (-4.86)** (-3.05)** (0.36) (-0.37) (-0.19) (0.63)
Hedge 0.110 0.074 0.019 0.023 0.011 0.002 (8.43)** (5.78)** (1.58) (0.78) (0.53) (0.07)
n 51,579 48,236 44,499 51,579 48,236 44,499
* and ** denote significance at the 0.05 and 0.01 level, respectively, based on a two-tailed t-test for the time-series (22 years) of annual portfolio abnormal returns.
a Portfolio decides are formed annually based on the ranking of abnormal and normal accruals for Panel A and Panel B, respectively. The hedge portfolio is formed by taking a long position in the lowest decile portfolio and a short position in the highest decile portfolio based on abnormal and normal accruals, respectively.
The variables are defined in Table 1.
t + 1 (-0.061, t = -4.86) and t + 2 (-0.033, t = -3.05), and insignificantly different from zero in year t + 3 (0.005, t = 0.36). Thus, the hedge portfolio yields positive size- adjusted abnormal returns of 11.0 percent (t = 8.43), 7.4 percent (t = 5.78), and 1.9 percent (t = 1.58) in years t + 1, t + 2, and t + 3, respectively. The significantly positive abnormal returns to the hedge portfolio in years t + 1 and t + 2 are consistent with the market overpricing abnormal accruals in the portfolio formation year (year t).
Xie-The Mispricing of Abnormal Accruals 367
Untabulated results reveal that the size-adjusted abnormal returns to the hedge portfolio in year t + 1 are positive for each of the 22 sample years. This suggests that unidentified risk factors are unlikely to explain the abnormal returns. Rather, the year-after-year positive abnormal returns to the hedge portfolio are more consistent with the market overpricing abnormal accruals.
When I form the hedge portfolio based on normal accruals, the average annual abnor- mal returns in years t + 1, t + 2, and t + 3 for both the most negative and the most positive normal accrual deciles are all insignificantly different from zero. The average annual abnormal returns to the hedge portfolio are 2.3 percent (t = 0.78), 1.1 percent (t = 0.53), and 0.2 percent (t = 0.07) in years t + 1, t + 2, and t + 3, respectively (see Panel B, Table 3). The fact that abnormal returns to the normal accrual-based hedge port- folio are not significantly different from zero suggests that the market does not misprice normal accruals in year t. Moreover, untabulated results reveal that the normal accrual- based hedge portfolio does not yield consistently positive abnormal returns, as the year t + 1 abnormal returns are negative in seven of the 22 sample years. Overall, the hedge- portfolio test results do not suggest that the market overprices normal accruals, which is inconsistent with the inferences from the Mishkin test.
This inconsistency is likely due to the fact that I conducted the Mishkin test on the entire (larger) sample, whereas I conducted the hedge-portfolio test on the most positive and most negative deciles (20 percent of the sample). When I use only December fiscal year-end firms (29,967 observations, 52.86 percent of the sample) and conduct both Mishkin and hedge-portfolio tests on the most positive and most negative normal accrual decides of this reduced sample, neither the Mishkin test nor the hedge-portfolio test detects any mis- pricing of normal accruals. Similarly, when I randomly reduce the entire sample by half (randomly choosing half of the firms in each sample year) and conduct the Mishkin and hedge-portfolio tests on the most positive and most negative normal accrual deciles of the reduced sample, neither test detects any mispricing of normal accruals.
My sample includes both December fiscal year-end and non-December fiscal year-end firms. Accounting information for a given fiscal year will become available to the market at different points in calendar time for firms with different fiscal year-end months. Thus, one cannot directly implement the hedge-portfolio strategies reported in Table 3. To address this concern, I form 12 hedge portfolios, one for each fiscal year-end month. I then conduct the hedge-portfolio test separately for each of the 12 fiscal year-end months. The results are qualitatively identical to those reported in Table 3. For example, the abnormal accrual- based hedge portfolio for December fiscal year-end firms yields abnormal returns of 10.10 percent (t = 6.01), 4.84 percent (t = 3.29), and 3.67 percent (t = 2.36) in years t + 1, t + 2, and t + 3, respectively. On the other hand, the abnormal returns to the normal accrual- based hedge portfolio are 1.07 percent (t = 0.36), 1.93 percent (t = 0.72), and 0.23 percent (t = 0.07) in years t + 1, t + 2, and t + 3, respectively. The abnormal returns for the 11 non-December fiscal year-end hedge portfolios are qualitatively similar. Thus, one can think of the abnormal returns reported in Table 3 as the average abnormal returns from these 12 implementable hedge portfolios with the same fiscal year-end months.
Finally, I repeat the hedge-portfolio test using the Fama and French (1993) three-factor model to estimate abnormal returns to the hedge portfolios for December fiscal year-end firms. For the abnormal accrual-based hedge portfolio, the abnormal returns in years t + 1, t + 2, and t + 3 are 9.60 percent (t = 4.59), 4.32 percent (t = 2.51), and 3.00 percent
368 The Accounting Review, July 2001
(t = 1.65), respectively.10 These returns are very similar to the size-adjusted abnormal returns reported above for December fiscal year-end firms. The abnormal returns to the normal accrual-based hedge portfolio are 2.28 percent (t = 0.92), 4.32 percent (t = 1.71), and 1.92 percent (t = 0.78) in years t + 1, t + 2, and t + 3, respectively, which are again qualitatively similar to the size-adjusted abnormal returns reported above.
To summarize, the hedge-portfolio results corroborate the Mishkin test finding that the market overprices abnormal accruals, but they do not support the overpricing of normal accruals detected by the Mishkin test. On the whole, I conclude that the market overprices abnormal accruals but does not materially misprice normal accruals, and that Sloan's (1996) finding that the market overprices total accruals is due largely to abnormal accruals.
IV. SENSITIVITY ANALYSIS Alternative Abnormal Accrual Models
The results reported in this paper are based on the cross-sectional Jones model. I examine the results' robustness to five alternative abnormal accrual models: (1) the cross- sectional modified Jones model (Dechow et al. 1995); (2) the time-series Jones model; (3) the time-series modified Jones model (Dechow et al. 1995); (4) the Beneish (1997) model, which expands the Jones model by adding lagged total accruals and lagged stock returns as two additional explanatory variables; and (5) the Beneish (1998) model, which replaces "change in sales" in the Jones model by "change in cash sales." These five models produce abnormal and normal accrual measures that are highly correlated with the cross-sectional Jones model-estimated abnormal and normal accruals, suggesting considerable overlap be- tween abnormal accruals estimated by the cross-sectional Jones model and by the five alternative models.11
I repeat the Mishkin test and the hedge-portfolio test using the five alternative models. The Mishkin test suggests that (1) the market overprices abnormal accruals based on each of the five models; (2) the market also overprices normal accruals (but to a lesser extent than abnormal accruals), except for the Beneish (1998) model, where normal accruals ap- pear to be rationally priced; and (3) the market underprices cash from operations, except for the time-series Jones model and the time-series modified Jones model, where cash from operations appears to be rationally priced. The hedge-portfolio test results suggest that
10 Specificially, I estimate the following regression for December fiscal year-end firms:
RPT - Rf, = %o + 3l(RMT - RfT) + I32SMBT + 33HMLT + 1 (5F)
where RPT = stock return of portfolio p in month T; Rf, = risk-free rate in month T; RMT = market return in month a; SMBT = size factor (small minus big) in month a; and HMLT = book-to-market factor (high minus low) in month T. I rank firms annually into portfolio deciles based on abnormal accruals. In each sample year t (from 1971 to 1992), I calculate 12 equally weighted monthly portfolio returns in year t + 1 (i.e., RPT), starting from April, year t + 1, to March, year t + 2, for the most positive and the most negative abnormal accrual deciles. Thus, I obtain a time-series of 264 (22 years X 12 months) observations of monthly portfolio returns for each decile. I then run equation (5F) using these 264 monthly portfolio returns for each decile. The intercept coo measures the average monthly abnormal return of that decile in year t + 1. I multiply coo by 12 to get the annualized abnormal return. The abnormal return to the abnormal accrual-based hedge portfolio in year t + I is the difference between the annualized abnormal return of the most negative abnormal accrual decile (long position) and that of the most positive abnormal accrual decile (short position). I estimate the abnormal returns to the hedge portfolio in year t + 2 and t + 3 similarly. The pairwise Pearson correlations between abnormal accruals used in the paper and those estimated by the five alternative models range from 0.73 (with the time-series modified Jones model) to 0.98 (with the cross-sectional modified Jones model). Similarly, the pairwise Pearson correlations between normal accruals used in the paper and those estimated by the five alternative models range from 0.57 (with the time-series modified Jones model) to 0.96 (with the cross-sectional modified Jones model).
Xie-The Mispricing of Abnormal Accruals 369
(1) the market overprices abnormal accruals based on each of the five models, and (2) the market approximately rationally prices normal accruals, except for the time-series Jones model, where it slightly overprices normal accruals (size-adjusted abnormal return in year t + 1 = 0.043, t = 2.55). Thus, the paper's main conclusion, that the market overprices abnormal accruals relative to their one-year-ahead earnings implications, is robust to all five alternative abnormal accrual models.
Controls for Major Unusual Accruals The Jones model-estimated abnormal accruals capture both managerial discretion and
unusual nondiscretionary accruals (Healy 1996; Bernard and Skinner 1996). Consequently, it is difficult to determine whether the market overprices the portion of abnormal accruals stemming from discretionary managerial behavior or the portion arising from unusual busi- ness circumstances. Following Bernard and Skinner (1996) and Collins and Hribar (2000b), I estimate abnormal accruals after controlling for major unusual accruals and non- articulation events. I then test whether the market still misprices this refined measure of abnormal accruals.
Bernard and Skinner (1996, 317) suggest that special items such as nonoperating gains and losses are often not discretionary. However, the Jones model misclassifies them as "discretionary" (i.e., as unexplained residuals) because they are typically not linearly re- lated to changes in revenues. Since I define total accruals as the difference between earnings before extraordinary items and cash from operations, total accruals include the effect of special items. As a first step in controlling for major unusual but largely nondiscretionary accruals, I remove after-tax special items from earnings, and thus from total accruals. Specifically, I define this refined measure of total accruals (ACCR2t) as follows: ACCR2t = EARNt - 0.6 X SPECIALt - CFOt, where SPECIALt = special items (Compustat item #17).12 I define other variables as before.
Collins and Hribar (2000b) demonstrate that when the presumed articulation between the balance sheet and the income statement breaks down (due to non-articulation events such as mergers, acquisitions, and divestitures), total accruals estimated using a balance- sheet approach contain material measurement error, relative to total accruals correctly mea- sured from the statement of cash flows. They further demonstrate that this measurement error in the balance-sheet-estimated total accruals flows directly through to the Jones model residuals, contaminating these residuals' ability to capture managerial discretion when merg- ers, acquisitions, and divestitures are present. I estimate total accruals using a balance-sheet approach for the 1971-1987 period because cash from operations is unavailable until 1988. Thus, the measurement error Collins and Hribar identify directly applies to that period of my sample. In addition, mergers, acquisitions, and divestitures are important "unusual busi- ness circumstances" that may lead to unusual but nondiscretionary accruals. To the extent that these unusual accruals are not linearly related to changes in revenues, the Jones model will misclassify them as "discretionary" even when total accruals are correctly measured from the statement of cash flows, as in my 1988-1992 period.
Thus, in the spirit of Collins and Hribar (2000b), to better proxy for managerial dis- cretion using the Jones model, I delete observations with mergers and acquisitions (Com- pustat footnote #1) or divestitures (defined as the absolute value of discontinued operations, Compustat item #66, exceeding $10,000) in order to control for (1) measurement error in the balance-sheet-estimated total accruals due to non-articulation events and (2) unusual
12 I assume that the marginal tax rate is 40 percent for all my sample firms and years. Changing the marginal tax rate to 30 percent does not qualitatively change the results.
370 The Accounting Review, July 2001
but largely nondiscretionary accruals arising from these unusual business circumstances. I then use my refined measure of total accruals (ACCR2t) and the Jones model (equation [1]) to estimate abnormal accruals for the subsample of firm-years without mergers, ac- quisitions, or divestitures. As before, I estimate the Jones model in cross-section for each two-digit SIC code and year combination. I denote the predicted values as normal accruals (NAC2t) and the residuals as abnormal accruals (ABNAC2,).
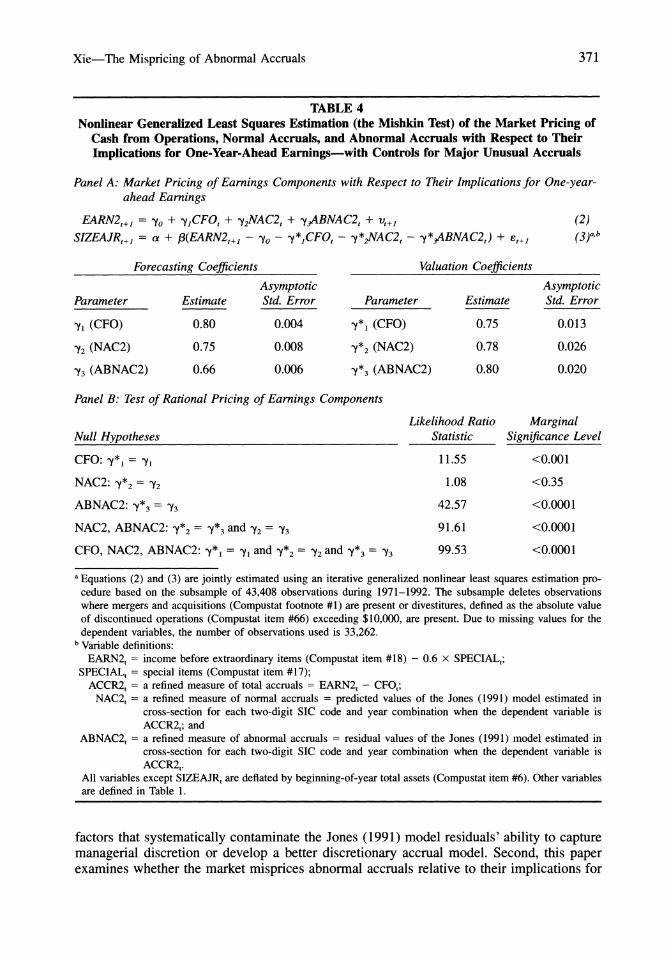
Table 4 reports the Mishkin test results using the refined measures of normal and abnormal accruals. The forecasting coefficient for each earnings component is larger than its counterpart in Table 2, likely because the earnings stream becomes more persistent after I purge after-tax special items from earnings. The Mishkin test indicates that the market underprices cash from operations (9yl = 0.75, yl = 0.80, p < 0.001), but that it does not misprice normal accruals (y*2 = 0.78, Y2 = 0.75, p < 0.35). More importantly, the market overprices abnormal accruals (0*3 = 0.80, Y3 = 0.66, p < 0.0001). Finally, untabulated analyses indicate that the size-adjusted abnormal returns to the abnormal accrual-based hedge portfolio are 11.54 percent (t = 5.35), 4.19 percent (t = 2.37), and 2.81 percent (t = 1.78) in years t + 1, t + 2, and t + 3, respectively. In contrast, the abnormal returns to the normal accrual-based hedge portfolio are 1.85 percent (t = 0.61), 0.14 percent (t = 0.05), and -0.46 percent (t = -0.18) in years t + 1, t + 2, and t + 3, respectively. These results suggest that the market overprices abnormal accruals, but that it does not misprice normal accruals, consistent with the Mishkin test results. Thus, both the Mishkin test and the hedge-portfolio test indicate that the market still overprices the refined measure of abnormal accruals. Since this measure is more likely to capture accruals arising from managerial discretion, the above finding is consistent with the market overpricing the por- tion of abnormal accruals stemming from earnings management.
V. CONCLUSION This paper examines whether the market rationally prices Jones model-estimated ab-
normal accruals. The Mishkin test results suggest that the market overestimates the per- sistence of, and thus overprices, both abnormal and normal accruals, although the over- pricing of abnormal accruals is more severe. The hedge-portfolio test results corroborate the overpricing of abnormal accruals, but do not support the overpricing of normal accruals. Taken together, my results suggest that the market overprices abnormal accruals, while the evidence on the overpricing of normal accruals is mixed and weak.
This paper extends Subramanyam's (1996) finding that the market prices abnormal accruals, by providing direct evidence that the market overprices abnormal accruals relative to their association with one-year-ahead earnings. The study also extends Sloan (1996) by suggesting that the lack of persistence and the overpricing of total accruals he reports are due largely to abnormal accruals. Finally, this paper extends Teoh et al. (1998a, 1998b) and Rangan (1998) by suggesting that the overpricing of abnormal accruals arises in general contexts and is not limited to IPOs or seasoned equity offerings.
Following suggestions in Bernard and Skinner (1996) and Collins and Hribar (2000b), I control for major unusual accruals and non-articulation events when estimating abnormal accruals using the Jones model. I find that the market still overprices this refined measure of abnormal accruals. This is consistent with the notion that the market overprices the portion of abnormal accruals stemming from managerial discretion.
This study raises several issues for future research. First, Jones model-estimated ab- normal accruals capture managerial discretion with error. Although my sensitivity analysis controls for major unusual accruals and non-articulation events, it is only a first step in developing a better proxy for managerial discretion. Future research could investigate other
Xie-The Mispricing of Abnormal Accruals 371
TABLE 4 Nonlinear Generalized Least Squares Estimation (the Mishkin Test) of the Market Pricing of
Cash from Operations, Normal Accruals, and Abnormal Accruals with Respect to Their Implications for One-Year-Ahead Earnings-with Controls for Major Unusual Accruals
Panel A: Market Pricing of Earnings Components with Respect to Their Implications for One-year- ahead Earnings
EARN2+, = 'Yo + y1CFOt + _y2NAC2t + _y3ABNAC2t + vt,+ (2)
SIZEAJR,+J = a + ,3(EARN2,+J - yo - y*1CFOt - y*2NAC2 - y*3ABNAC2,) + a,+ (3)asb
Forecasting Coefficients Valuation Coefficients
Asymptotic Asymptotic Parameter Estimate Std. Error Parameter Estimate Std. Error
yI (CFO) 0.80 0.004 y*I (CFO) 0.75 0.013
_Y2 (NAC2) 0.75 0.008 'Y*2 (NAC2) 0.78 0.026
_Y3 (ABNAC2) 0.66 0.006 'y*3 (ABNAC2) 0.80 0.020
Panel B: Test of Rational Pricing of Earnings Components
Likelihood Ratio Marginal Null Hypotheses Statistic Significance Level
CFO: Cyl = -y 11.55 <0.001
NAC2: _Y*2 = _Y2 1.08 <0.35
ABNAC2: 9Y*3=Y3 42.57 <0.0001
NAC2, ABNAC2: _y*2 = _Y*3 and _Y2 = 'Y3 91.61 <0.0001
CFO, NAC2, ABNAC2: y*1 = yi and Y*2 = Y2 and Y*3 = 'Y3 99.53 <0.0001
a Equations (2) and (3) are jointly estimated using an iterative generalized nonlinear least squares estimation pro- cedure based on the subsample of 43,408 observations during 1971-1992. The subsample deletes observations where mergers and acquisitions (Compustat footnote #1) are present or divestitures, defined as the absolute value of discontinued operations (Compustat item #66) exceeding $10,000, are present. Due to missing values for the dependent variables, the number of observations used is 33,262.
b Variable definitions: EARN2t = income before extraordinary items (Compustat item #18) - 0.6 x SPECIALt;
SPECIALt = special items (Compustat item #17); ACCR2t = a refined measure of total accruals = EARN2t - CFOt;
NAC2t = a refined measure of normal accruals = predicted values of the Jones (1991) model estimated in cross-section for each two-digit SIC code and year combination when the dependent variable is ACCR2t; and
ABNAC2t = a refined measure of abnormal accruals = residual values of the Jones (1991) model estimated in cross-section for each two-digit SIC code and year combination when the dependent variable is ACCR2t.
All variables except SIZEAJRt are deflated by beginning-of-year total assets (Compustat item #6). Other variables are defined in Table 1.
factors that systematically contaminate the Jones (1991) model residuals' ability to capture managerial discretion or develop a better discretionary accrual model. Second, this paper examines whether the market misprices abnormal accruals relative to their implications for
372 The Accounting Review, July 2001
one-year-ahead earnings. This is only one dimension of market mispricing. Future research could investigate other dimensions or forms of market mispricing. Finally, although I find that the abnormal returns to the abnormal accrual-based hedge portfolio in year t + 1 are positive in each of my 22 sample-years, it is difficult to completely rule out unknown risk factors as an alternative explanation for the results.
REFERENCES Bernard, V. L., and J. K. Thomas. 1989. Post-earnings-announcement drift: Delayed price response
or risk premium? Journal of Accounting Research 27 (Supplement): 1-36. , and . 1990. Evidence that stock prices do not fully reflect the implications of current
earnings for future earnings. Journal of Accounting and Economics 13 (December): 305-340. , and D. J. Skinner. 1996. What motivates managers' choice of discretionary accruals? Journal
of Accounting and Economics 22 (August-December): 313-325. Beneish, M. D. 1997. Detecting GAAP violation: Implications for assessing earnings management
among firms with extreme financial performance. Journal of Accounting and Public Policy 16 (Fall): 271-309.
. 1998. Discussion of: Are accruals during initial public offerings opportunistic? Review of Accounting Studies 3 (Issues 1&2): 209-221.
Collins, D. W., and P. Hribar. 2000a. Earnings-based and accrual-based market anomalies: One effect or two? Journal of Accounting and Economics 29 (February): 101-123.
, and . 2000b. Errors in estimating accruals: Implications for empirical research. Work- ing paper, University of Iowa and Cornell University.
Dechow, P. M., R. G. Sloan, and A. P. Sweeney. 1995. Detecting earnings management. The Ac- counting Review 70 (April): 193-225.
DeFond, M. L., and J. Jiambalvo. 1994. Debt covenant violation and manipulation of accruals: Ac- counting choices in troubled companies. Journal of Accounting and Economics 17 (January): 145-176.
, and C. W. Park. 2001. The reversal of abnormal accruals and the market valuation of earnings surprises. The Accounting Review (July): 375-404.
Erickson, M., and S. W. Wang. 1999. Earnings management by acquiring firms in stock for stock mergers. Journal of Accounting and Economics 27 (April): 149-176.
Fama, E. F., and K. R. French. 1993. Common risk factors in the returns on stocks and bonds. Journal of Financial Economics 33 (February): 3-56.
Freeman, R., J. Ohlson, and S. Penman. 1982. Book rate-of-return and prediction of earnings change: An empirical investigation. Journal of Accounting Research 20 (Autumn): 3-42.
, and S. Tse. 1989. The multi-period information content of earnings announcements: Confir- mations and contradictions of previous earnings reports. Journal of Accounting Research 27 (Supplement): 49-79.
Healy, P. 1996. Discussion of a market-based evaluation of discretionary accrual models. Journal of Accounting Research 34 (Supplement): 107-115.
Hribar, P. 2000. The market pricing of components of accruals. Working paper, Cornell University. Jones, J. 1991. Earnings management during import relief investigations. Journal of Accounting Re-
search 29 (Autumn): 193-228. Mishkin, F. 1983. A Rational Expectations Approach to Macroeconometrics: Testing Policy Effective-
ness and Efficient-Markets Models. Chicago, IL: University of Chicago Press. Rangan, S. 1998. Earnings management and the performance of seasoned equity offerings. Journal
of Financial Economics 50 (October): 101-122. Sloan, R. G. 1996. Do stock prices fully reflect information in accruals and cash flows about future
earnings? The Accounting Review 71 (July): 289-315. Subramanyam, K. R. 1996. The pricing of discretionary accruals. Journal of Accounting and Eco-
nomics 22 (August-December): 249-281.

Xie-The Mispricing of Abnormal Accruals 373
Teoh, S. H., I. Welch, and T. J. Wong. 1998a. Earnings management and the underperformance of seasoned equity offerings. Journal of Financial Economics 50 (October): 63-99. ___ , . and . 1998b. Earnings management and the long-run market performance of initial public offerings. The Journal of Finance 53 (December): 1935-1974.


![Agricultural Productivity, Comparative Advantage, and ...lib.cufe.edu.cn/upload_files/other/4_20140530024310_[59]matsuyama... · Agricultural Productivity, Comparative Advantage,](https://img.pdfslide.net/doc/110x75/5b1eab367f8b9a22028bd7eb/agricultural-productivity-comparative-advantage-and-libcufeeducnuploadfilesother42014053002431059matsuyama.jpg)