Embed Size (px)
Citation preview
American Indian and Alaska Native Servicemembers
and Veterans
September 2012
American Indian and Alaska Native Veterans, September 2012 Page 1
TABLE OF CONTENTS EXECUTIVE SUMMARY .......................................................................................................................... 2
Section I: Introduction ................................................................................................................................ 3
Overview .................................................................................................................................................. 3
Purpose .................................................................................................................................................... 3
Objective .................................................................................................................................................. 3
Historical Background ............................................................................................................................ 4
Section II: Active Duty, Reserve, and National Guard Servicemembers ........................................... 6
Overview .................................................................................................................................................. 6
Active Duty, Reserve, and National Guard Servicemembers by Age and Sex ............................ 6
Active Duty, Reserve, and National Guard Servicemembers by Branch of Service, Rank, and Length of Service ................................................................................................................................... 8
Section III: Veteran Demographics ........................................................................................................ 11
Overview ................................................................................................................................................ 11
Veterans by Age and Sex ................................................................................................................... 11
Veterans by Period of Service ............................................................................................................ 12
Estimated Veteran Population by State ............................................................................................ 14
Section IV: Veteran Socioeconomic Status.......................................................................................... 16
Overview ................................................................................................................................................ 16
Income for Veterans ............................................................................................................................. 16
Educational Attainment of Veterans .................................................................................................. 18
Employment Status of Veterans ........................................................................................................ 18
Section V: Veteran Health Status .......................................................................................................... 20
Overview ................................................................................................................................................ 20
VA Health Care Usage ........................................................................................................................ 20
Health Insurance Coverage of Veterans .......................................................................................... 21
Disability Status of Veterans ............................................................................................................... 22
Service-Connected Disability Status of Veterans ............................................................................ 23
Appendix A. Data Sources ...................................................................................................................... 25
Appendix B. Acronyms ............................................................................................................................ 26
Appendix C. References ......................................................................................................................... 27
American Indian and Alaska Native Veterans, September 2012 Page 2
EXECUTIVE SUMMARY
American Indian and Alaska Native (AIAN) Veterans have played a vital role in the United States military for over two hundred years. Recognizing their long history of distinguished service, the following report seeks to provide comprehensive statistics on this important cohort of Veterans through an examination of AIAN Active Duty, Reserve, and National Guard data together with demographic, socioeconomic, and health status statistics for AIAN Veterans. AIAN Active Duty, Reserve, and National Guard Analysis
• Native Americans serve at a high rate and have a higher concentration of female Servicemembers than all other Servicemembers.
• AIAN Servicemembers are younger as a cohort than all other Servicemembers.
• More AIAN Servicemembers serve in the Navy than in any other branch of
service. AIAN Veteran Analysis
• Similar to AIAN Servicemembers, AIAN Veterans are younger as a cohort.
• AIAN Veterans have served in more recent conflicts.
• AIAN Veterans have lower incomes, lower educational attainment, and higher unemployment than Veterans of other races.
• AIAN Veterans are also more likely to lack health insurance and to have a
disability, service-connected or otherwise, than Veterans of other races.
American Indian and Alaska Native Veterans, September 2012 Page 3
Section I: Introduction Overview In honoring November 2011 as National Native American Heritage Month, the President of the United States extolled American Indians and Alaska Natives, saying:
Native Americans stand among America's most distinguished authors, artists, scientists, and political leaders, and in their accomplishments, they have profoundly strengthened the legacy we will leave our children. So, too, have American Indians and Alaska Natives bravely fought to protect this legacy as members of our Armed Forces.1
Indeed, Native Americans have made lasting contributions to the United States, including significant military service to defend our country. Continuing in the November 2011 proclamation, the President praised American Indian and Alaska Native (AIAN) Veterans, stating:
As service members, [Native Americans] have shown exceptional valor and heroism on battlefields from the American Revolution to Iraq and Afghanistan.
This report focuses on demographic, socioeconomic, and health characteristics of AIAN Servicemembers and Veterans, and presents similar summary information for all Servicemembers and Veterans. Purpose To provide comprehensive statistics on AIAN Servicemembers and Veterans. Objective To put forth accurate data concerning the demographics, socioeconomic status, and health characteristics of AIAN Servicemembers and Veterans.
1 The full text of the November 2011 Presidential proclamation is available from: http://www.whitehouse.gov/the-press-office/2011/11/01/presidential-proclamation-national-native-american-heritage-month-2011.
American Indian and Alaska Native Veterans, September 2012 Page 4
Historical Background A brief overview2
of the contributions of AIAN Veterans in the military is provided in the following text:
Early Wars (before World War I)
• From the Revolutionary War through the Civil War, American Indians served as auxiliary troops and as scouts.
• The Indian Scouts were established in 1866. This service was active for the remainder of the nineteenth century and the early twentieth century.
World War I
• Roughly 12,000 Native Americans served in the military during World War I.
• Four American Indians serving in the 142nd Infantry of the 36th Texas-Oklahoma National Guard Division received the Croix de Guerre medal from France.
World War II
• Over 44,000 Native Americans served between 1941 and 1945. The entire population of Native Americans in the United States was less than 350,000 at the time.
• Native American military personnel worked as cryptologists, using their Native
languages to encode messages so that enemy code-breakers could not decipher them.
• Alaska Natives were a significant presence on the Alaska Combat Intelligence Detachment. This outfit was the first ashore on each island occupied by Allied forces in the Aleutian Campaign.3
2 Unless otherwise noted, historical information is obtained from a U.S. Army article celebrating AIAN heritage (available from: http://www.army.mil/article/48472/honoring-native-american-alaska-native-heritage). 3 Information obtained from a Department of Defense report titled Native Alaska - Military Relations: 1867 to Current.
American Indian and Alaska Native Veterans, September 2012 Page 5
Korean Conflict
• Approximately 10,000 Native Americans served in the military during this period.
• Three were awarded the Medal of Honor. Vietnam Era
• More than 42,000 Native Americans served in the military in the Vietnam Era, and over 90 percent of these Servicemembers were volunteers.
Post-Vietnam Era
• AIAN Servicemembers continued to serve in high numbers after the Vietnam Era.
• AIAN Servicemembers saw action in Grenada, Panama, Somalia, the Gulf War, and in Operation Enduring Freedom (OEF), Operation Iraqi Freedom (OIF) and Operation New Dawn (OND).
American Indian and Alaska Native Veterans, September 2012 Page 6
Section II: Active Duty, Reserve, and National Guard Servicemembers Overview The information below details basic demographic information on Active Duty, Reserve, and National Guard Servicemembers, as well as their branch of service, their length of service, and their rank (i.e., enlisted personnel or officers).4
All data in this section comes from the Active Duty Master Personnel File and the Reserve Components Common Personnel Data System (RCCPDS). This information was provided to the Department of Veterans Affairs by the Department of Defense’s Defense Manpower Data Center through an interagency data sharing agreement. Active Duty, Reserve, and National Guard Servicemembers by Age and Sex
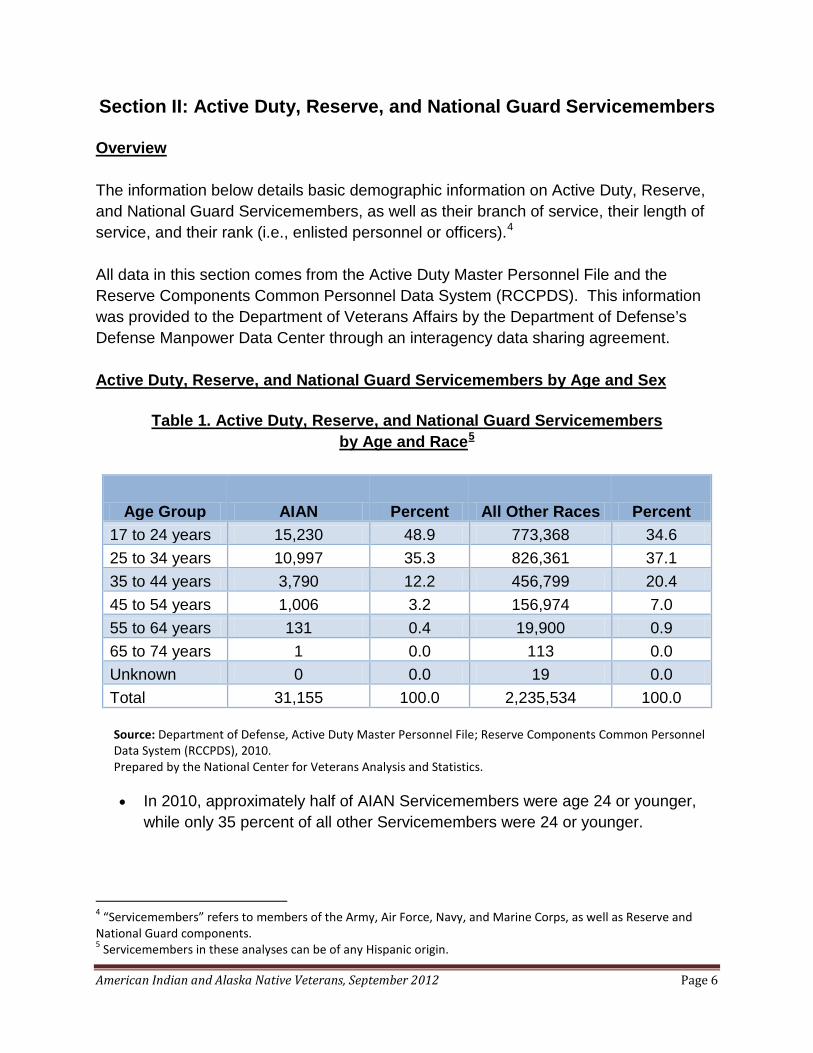
Table 1. Active Duty, Reserve, and National Guard Servicemembers by Age and Race5
Age Group AIAN Percent All Other Races Percent 17 to 24 years 15,230 48.9 773,368 34.6 25 to 34 years 10,997 35.3 826,361 37.1 35 to 44 years 3,790 12.2 456,799 20.4 45 to 54 years 1,006 3.2 156,974 7.0 55 to 64 years 131 0.4 19,900 0.9 65 to 74 years 1 0.0 113 0.0 Unknown 0 0.0 19 0.0 Total 31,155 100.0 2,235,534 100.0
Source: Department of Defense, Active Duty Master Personnel File; Reserve Components Common Personnel Data System (RCCPDS), 2010. Prepared by the National Center for Veterans Analysis and Statistics.
• In 2010, approximately half of AIAN Servicemembers were age 24 or younger,
while only 35 percent of all other Servicemembers were 24 or younger.
4 “Servicemembers” refers to members of the Army, Air Force, Navy, and Marine Corps, as well as Reserve and National Guard components. 5 Servicemembers in these analyses can be of any Hispanic origin.
American Indian and Alaska Native Veterans, September 2012 Page 7
• The percentages of AIAN Servicemembers and all other Servicemembers between the ages of 25 and 34 were similar.
• Twelve percent of AIAN Servicemembers were in the 35-44 age group, while 20 percent of all other Servicemembers were in the same age group.
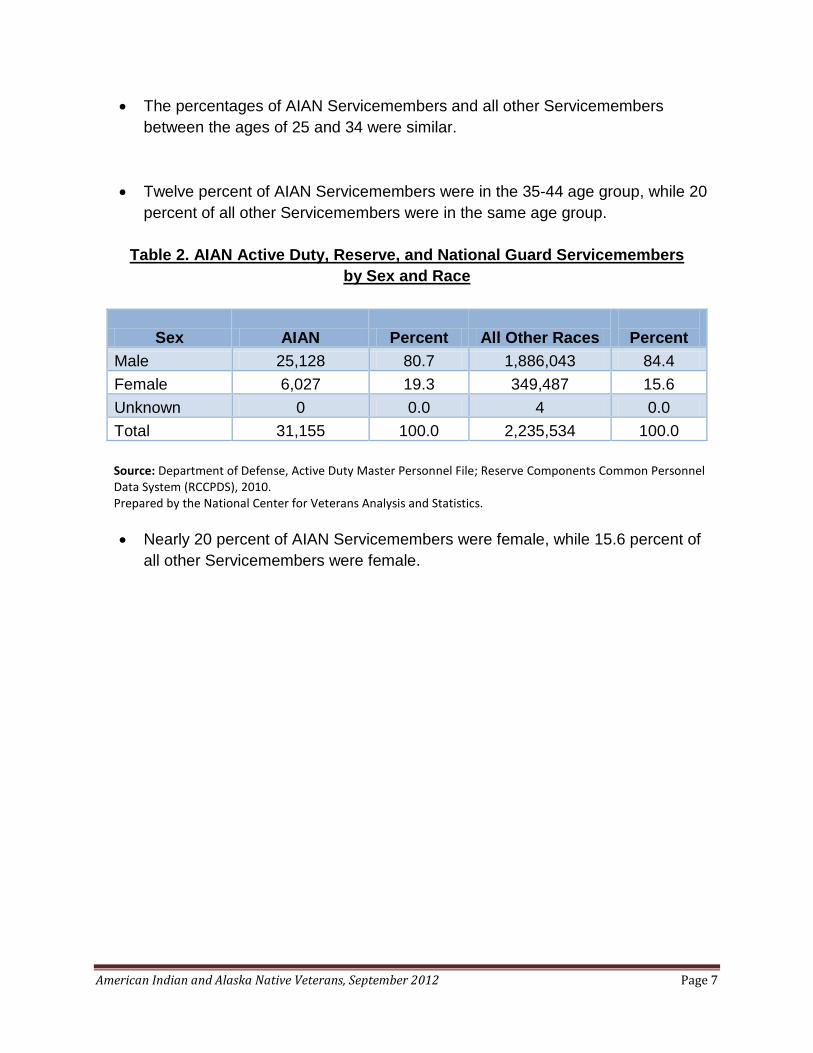
Table 2. AIAN Active Duty, Reserve, and National Guard Servicemembers
by Sex and Race
Sex AIAN Percent All Other Races
Percent Male 25,128 80.7 1,886,043 84.4 Female 6,027 19.3 349,487 15.6 Unknown 0 0.0 4 0.0 Total 31,155 100.0 2,235,534 100.0
Source: Department of Defense, Active Duty Master Personnel File; Reserve Components Common Personnel Data System (RCCPDS), 2010. Prepared by the National Center for Veterans Analysis and Statistics.
• Nearly 20 percent of AIAN Servicemembers were female, while 15.6 percent of
all other Servicemembers were female.
American Indian and Alaska Native Veterans, September 2012 Page 8
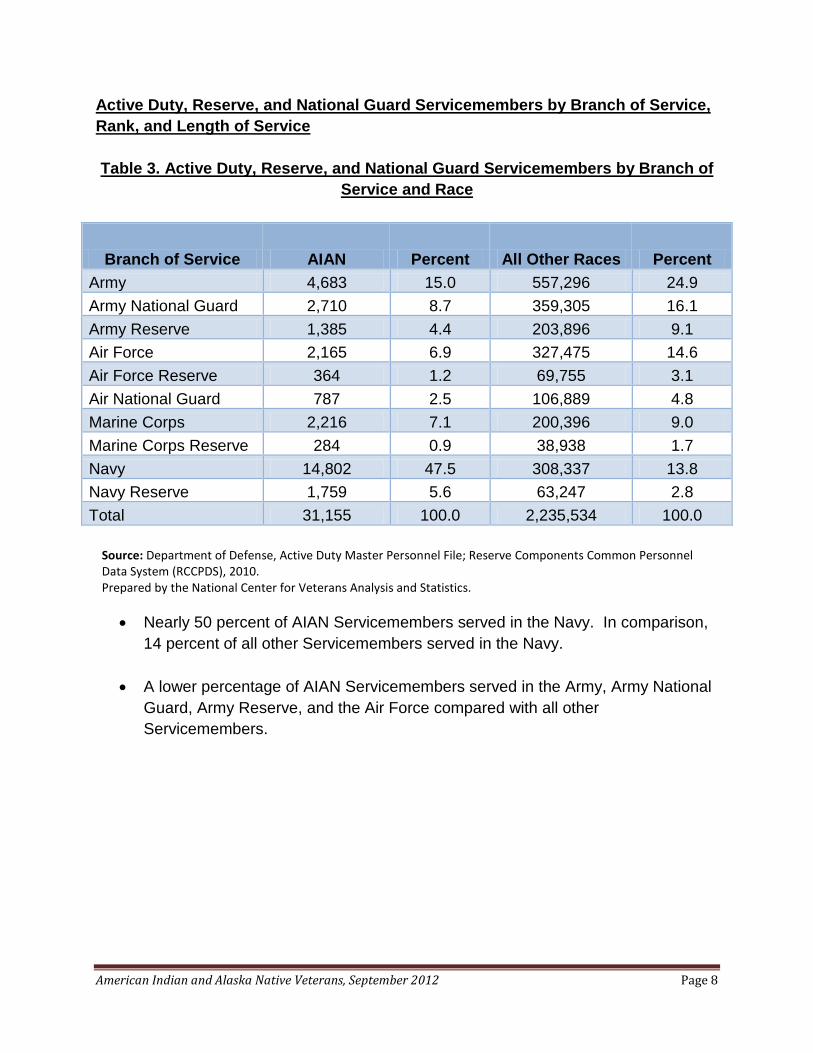
Active Duty, Reserve, and National Guard Servicemembers by Branch of Service, Rank, and Length of Service Table 3. Active Duty, Reserve, and National Guard Servicemembers by Branch of
Service and Race
Branch of Service AIAN Percent All Other Races Percent Army 4,683 15.0 557,296 24.9 Army National Guard 2,710 8.7 359,305 16.1 Army Reserve 1,385 4.4 203,896 9.1 Air Force 2,165 6.9 327,475 14.6 Air Force Reserve 364 1.2 69,755 3.1 Air National Guard 787 2.5 106,889 4.8 Marine Corps 2,216 7.1 200,396 9.0 Marine Corps Reserve 284 0.9 38,938 1.7 Navy 14,802 47.5 308,337 13.8 Navy Reserve 1,759 5.6 63,247 2.8 Total 31,155 100.0 2,235,534 100.0
Source: Department of Defense, Active Duty Master Personnel File; Reserve Components Common Personnel Data System (RCCPDS), 2010. Prepared by the National Center for Veterans Analysis and Statistics.
• Nearly 50 percent of AIAN Servicemembers served in the Navy. In comparison, 14 percent of all other Servicemembers served in the Navy.
• A lower percentage of AIAN Servicemembers served in the Army, Army National Guard, Army Reserve, and the Air Force compared with all other Servicemembers.
American Indian and Alaska Native Veterans, September 2012 Page 9
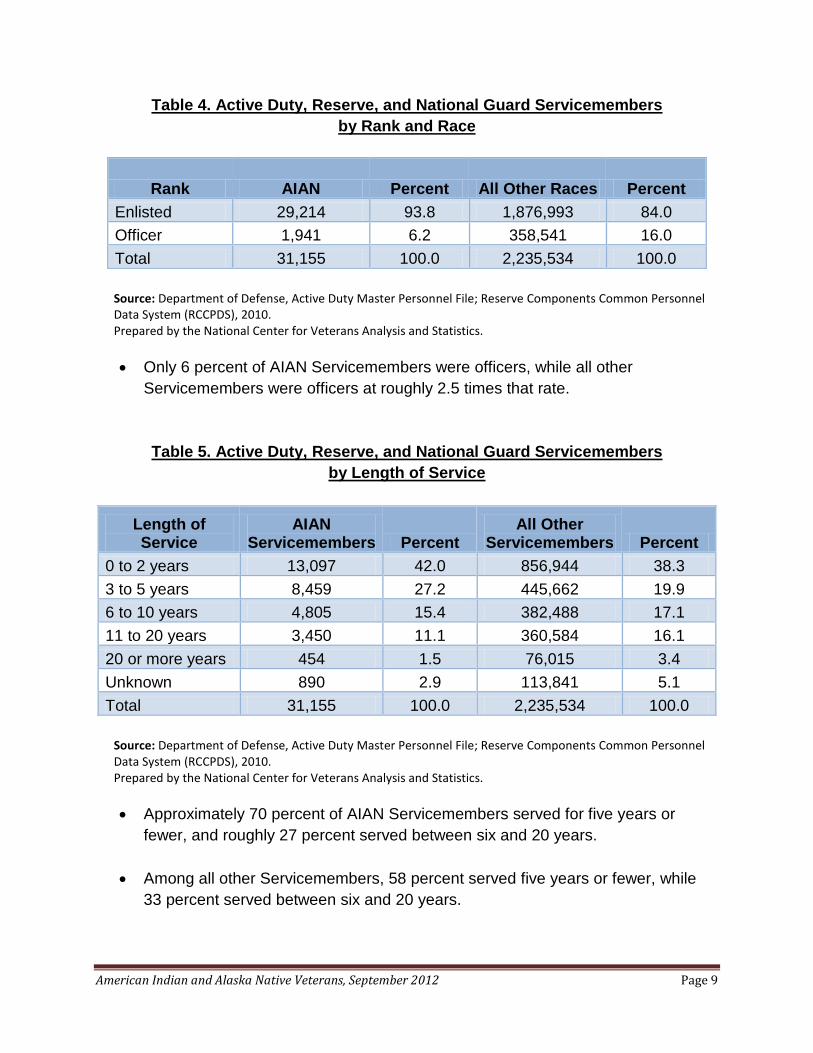
Table 4. Active Duty, Reserve, and National Guard Servicemembers by Rank and Race
Rank AIAN Percent All Other Races Percent Enlisted 29,214 93.8 1,876,993 84.0 Officer 1,941 6.2 358,541 16.0 Total 31,155 100.0 2,235,534 100.0
Source: Department of Defense, Active Duty Master Personnel File; Reserve Components Common Personnel Data System (RCCPDS), 2010. Prepared by the National Center for Veterans Analysis and Statistics.
• Only 6 percent of AIAN Servicemembers were officers, while all other
Servicemembers were officers at roughly 2.5 times that rate.
Table 5. Active Duty, Reserve, and National Guard Servicemembers by Length of Service
Length of Service
AIAN Servicemembers Percent
All Other Servicemembers Percent
0 to 2 years 13,097 42.0 856,944 38.3 3 to 5 years 8,459 27.2 445,662 19.9 6 to 10 years 4,805 15.4 382,488 17.1 11 to 20 years 3,450 11.1 360,584 16.1 20 or more years 454 1.5 76,015 3.4 Unknown 890 2.9 113,841 5.1 Total 31,155 100.0 2,235,534 100.0
Source: Department of Defense, Active Duty Master Personnel File; Reserve Components Common Personnel Data System (RCCPDS), 2010. Prepared by the National Center for Veterans Analysis and Statistics.
• Approximately 70 percent of AIAN Servicemembers served for five years or
fewer, and roughly 27 percent served between six and 20 years.
• Among all other Servicemembers, 58 percent served five years or fewer, while 33 percent served between six and 20 years.
American Indian and Alaska Native Veterans, September 2012 Page 10
• The percentage of AIAN Servicemembers who served for 20 or more years is less than half that of all other Servicemembers.
American Indian and Alaska Native Veterans, September 2012 Page 11
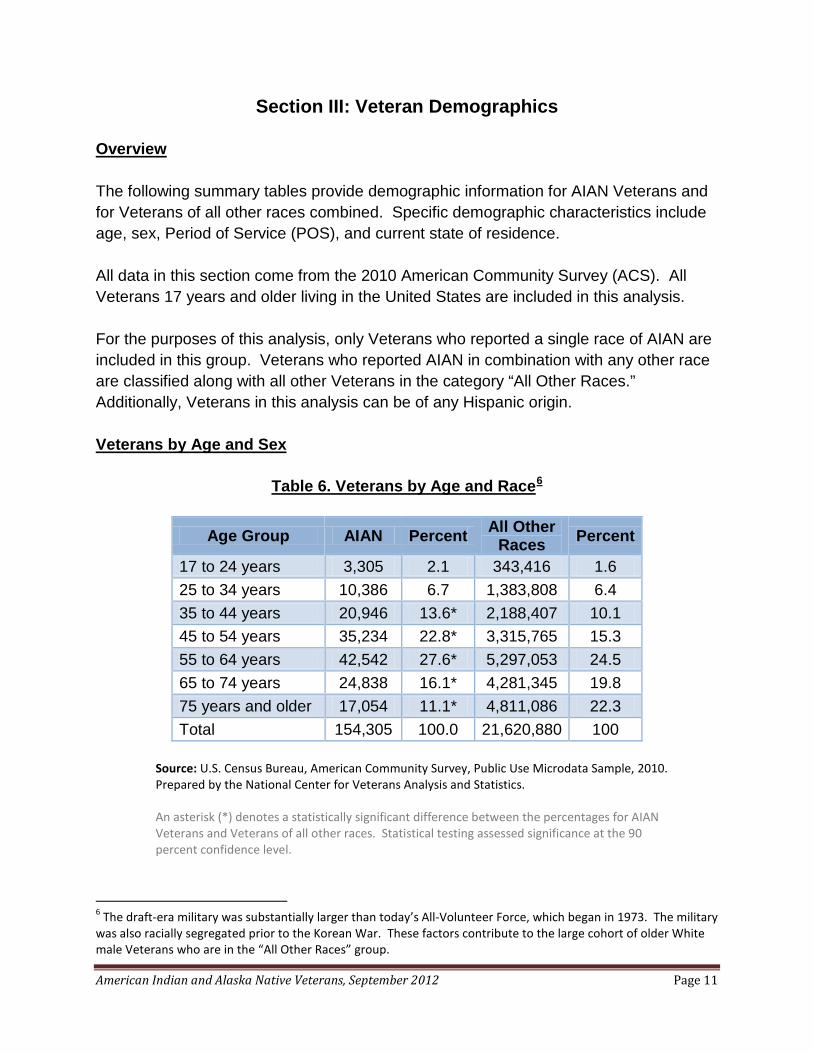
Section III: Veteran Demographics Overview The following summary tables provide demographic information for AIAN Veterans and for Veterans of all other races combined. Specific demographic characteristics include age, sex, Period of Service (POS), and current state of residence. All data in this section come from the 2010 American Community Survey (ACS). All Veterans 17 years and older living in the United States are included in this analysis. For the purposes of this analysis, only Veterans who reported a single race of AIAN are included in this group. Veterans who reported AIAN in combination with any other race are classified along with all other Veterans in the category “All Other Races.” Additionally, Veterans in this analysis can be of any Hispanic origin. Veterans by Age and Sex
Table 6. Veterans by Age and Race6
Age Group AIAN Percent All Other Races Percent
17 to 24 years 3,305 2.1 343,416 1.6 25 to 34 years 10,386 6.7 1,383,808 6.4 35 to 44 years 20,946 13.6* 2,188,407 10.1 45 to 54 years 35,234 22.8* 3,315,765 15.3 55 to 64 years 42,542 27.6* 5,297,053 24.5 65 to 74 years 24,838 16.1* 4,281,345 19.8 75 years and older 17,054 11.1* 4,811,086 22.3 Total 154,305 100.0 21,620,880 100
Source: U.S. Census Bureau, American Community Survey, Public Use Microdata Sample, 2010. Prepared by the National Center for Veterans Analysis and Statistics. An asterisk (*) denotes a statistically significant difference between the percentages for AIAN Veterans and Veterans of all other races. Statistical testing assessed significance at the 90 percent confidence level.
6 The draft-era military was substantially larger than today’s All-Volunteer Force, which began in 1973. The military was also racially segregated prior to the Korean War. These factors contribute to the large cohort of older White male Veterans who are in the “All Other Races” group.
American Indian and Alaska Native Veterans, September 2012 Page 12
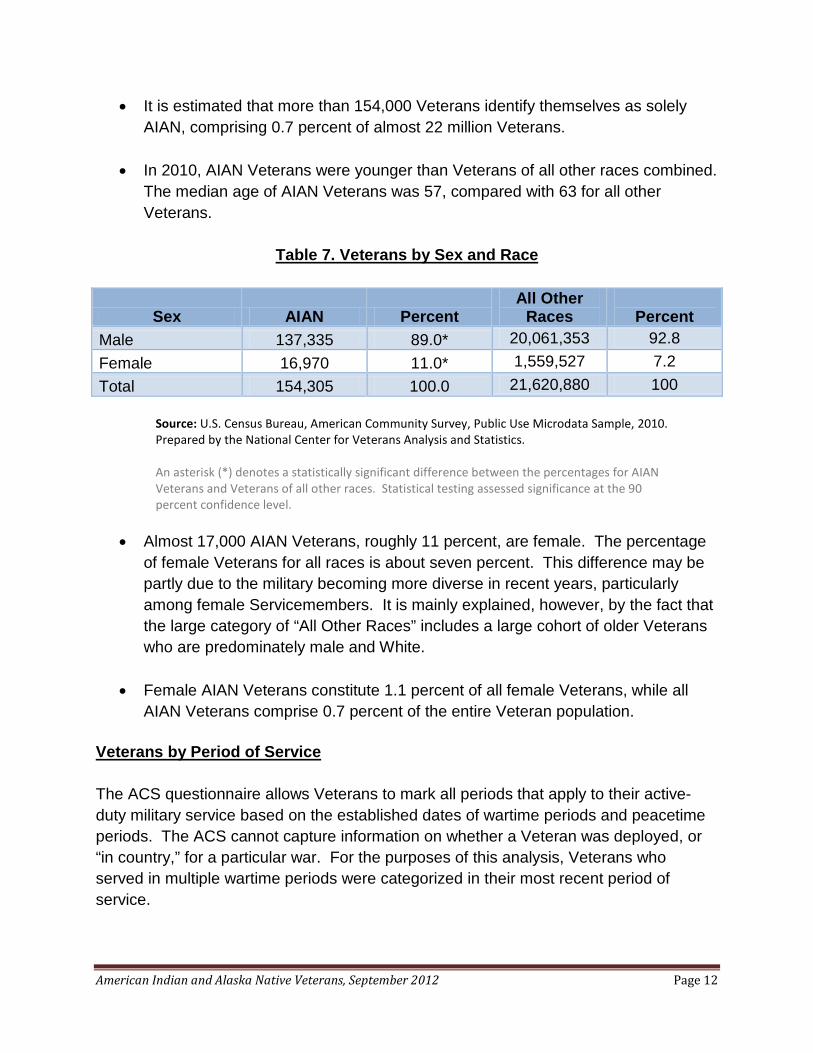
• It is estimated that more than 154,000 Veterans identify themselves as solely AIAN, comprising 0.7 percent of almost 22 million Veterans.
• In 2010, AIAN Veterans were younger than Veterans of all other races combined. The median age of AIAN Veterans was 57, compared with 63 for all other Veterans.
Table 7. Veterans by Sex and Race
Sex AIAN Percent All Other
Races
Percent Male 137,335 89.0* 20,061,353 92.8 Female 16,970 11.0* 1,559,527 7.2 Total 154,305 100.0 21,620,880 100
Source: U.S. Census Bureau, American Community Survey, Public Use Microdata Sample, 2010. Prepared by the National Center for Veterans Analysis and Statistics. An asterisk (*) denotes a statistically significant difference between the percentages for AIAN Veterans and Veterans of all other races. Statistical testing assessed significance at the 90 percent confidence level.
• Almost 17,000 AIAN Veterans, roughly 11 percent, are female. The percentage
of female Veterans for all races is about seven percent. This difference may be partly due to the military becoming more diverse in recent years, particularly among female Servicemembers. It is mainly explained, however, by the fact that the large category of “All Other Races” includes a large cohort of older Veterans who are predominately male and White.
• Female AIAN Veterans constitute 1.1 percent of all female Veterans, while all
AIAN Veterans comprise 0.7 percent of the entire Veteran population. Veterans by Period of Service The ACS questionnaire allows Veterans to mark all periods that apply to their active-duty military service based on the established dates of wartime periods and peacetime periods. The ACS cannot capture information on whether a Veteran was deployed, or “in country,” for a particular war. For the purposes of this analysis, Veterans who served in multiple wartime periods were categorized in their most recent period of service.

American Indian and Alaska Native Veterans, September 2012 Page 13
Table 8. Veterans by Period of Service and Race
Period of Service AIAN Percent All Other
Races Percent Gulf War II (Sept. 2001 to present) 17,570 11.4 2,261,573 10.5 Gulf War I (Aug. 1990 to Aug. 2001) 21,380 13.9* 2,522,033 11.7 Vietnam Era 56,543 36.6* 7,205,748 33.3 Korean Conflict 9,801 6.4* 2,295,464 10.6 World War II 5,007 3.2* 1,865,559 8.6 Peacetime Only 44,004 28.5* 5,470,503 25.3 Total 154,305 100.0 21,620,880 100.0
Source: U.S. Census Bureau, American Community Survey, Public Use Microdata Sample, 2010. Prepared by the National Center for Veterans Analysis and Statistics. An asterisk (*) denotes a statistically significant difference between the percentages for AIAN Veterans and Veterans of all other races. Statistical testing assessed significance at the 90 percent confidence level.
• In 2010, the largest living cohort of Veterans, regardless of race, was the
Vietnam Era. Over one-third of Veterans served during this period.
• Higher percentages of AIAN Veterans served in the more recent peacetime periods (29 percent) and the Pre-9/11 Gulf War period (14 percent), compared with Veterans of all other races (25 percent and 12 percent, respectively). This is also true for the Vietnam Era.
American Indian and Alaska Native Veterans, September 2012 Page 14
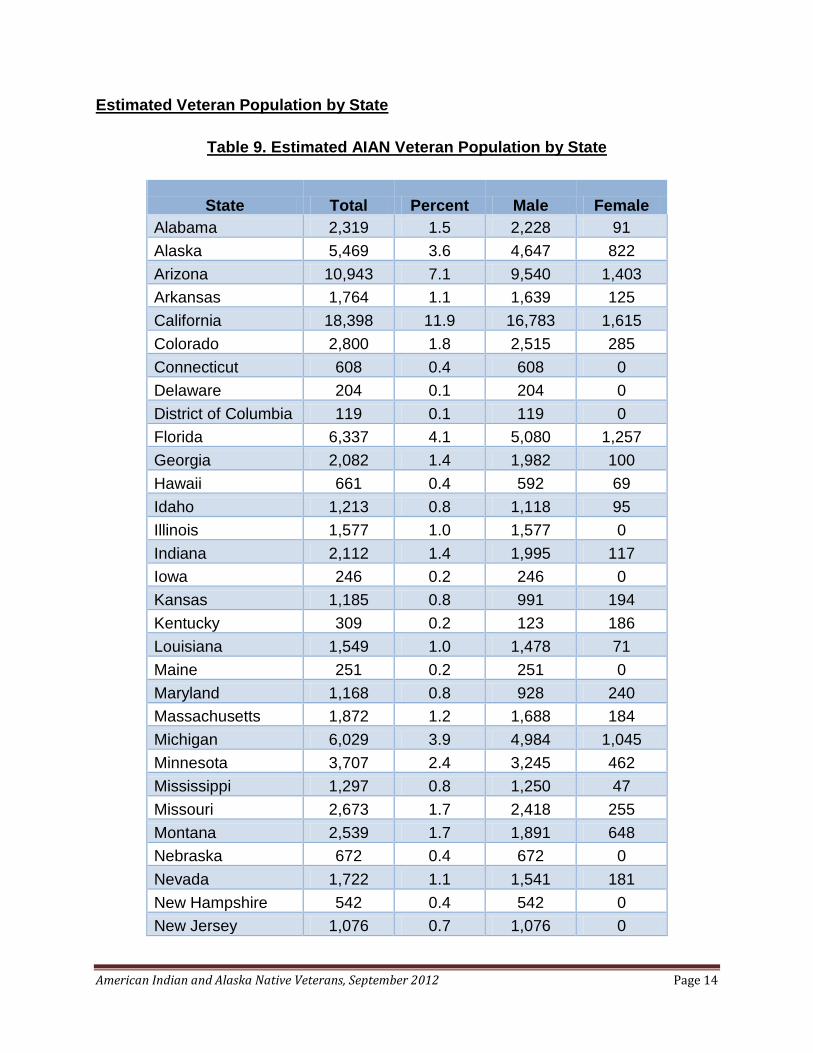
Estimated Veteran Population by State
Table 9. Estimated AIAN Veteran Population by State
State Total Percent Male Female Alabama 2,319 1.5 2,228 91 Alaska 5,469 3.6 4,647 822 Arizona 10,943 7.1 9,540 1,403 Arkansas 1,764 1.1 1,639 125 California 18,398 11.9 16,783 1,615 Colorado 2,800 1.8 2,515 285 Connecticut 608 0.4 608 0 Delaware 204 0.1 204 0 District of Columbia 119 0.1 119 0 Florida 6,337 4.1 5,080 1,257 Georgia 2,082 1.4 1,982 100 Hawaii 661 0.4 592 69 Idaho 1,213 0.8 1,118 95 Illinois 1,577 1.0 1,577 0 Indiana 2,112 1.4 1,995 117 Iowa 246 0.2 246 0 Kansas 1,185 0.8 991 194 Kentucky 309 0.2 123 186 Louisiana 1,549 1.0 1,478 71 Maine 251 0.2 251 0 Maryland 1,168 0.8 928 240 Massachusetts 1,872 1.2 1,688 184 Michigan 6,029 3.9 4,984 1,045 Minnesota 3,707 2.4 3,245 462 Mississippi 1,297 0.8 1,250 47 Missouri 2,673 1.7 2,418 255 Montana 2,539 1.7 1,891 648 Nebraska 672 0.4 672 0 Nevada 1,722 1.1 1,541 181 New Hampshire 542 0.4 542 0 New Jersey 1,076 0.7 1,076 0
American Indian and Alaska Native Veterans, September 2012 Page 15
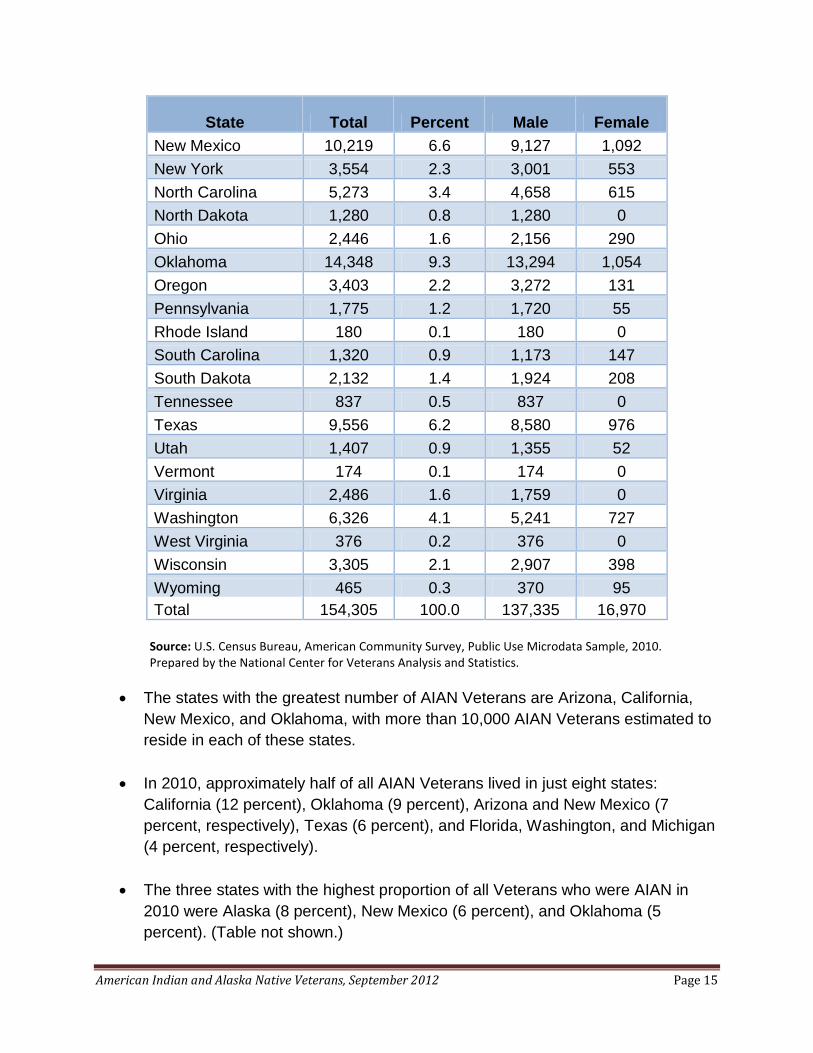
State Total Percent Male Female New Mexico 10,219 6.6 9,127 1,092 New York 3,554 2.3 3,001 553 North Carolina 5,273 3.4 4,658 615 North Dakota 1,280 0.8 1,280 0 Ohio 2,446 1.6 2,156 290 Oklahoma 14,348 9.3 13,294 1,054 Oregon 3,403 2.2 3,272 131 Pennsylvania 1,775 1.2 1,720 55 Rhode Island 180 0.1 180 0 South Carolina 1,320 0.9 1,173 147 South Dakota 2,132 1.4 1,924 208 Tennessee 837 0.5 837 0 Texas 9,556 6.2 8,580 976 Utah 1,407 0.9 1,355 52 Vermont 174 0.1 174 0 Virginia 2,486 1.6 1,759 0 Washington 6,326 4.1 5,241 727 West Virginia 376 0.2 376 0 Wisconsin 3,305 2.1 2,907 398 Wyoming 465 0.3 370 95 Total 154,305 100.0 137,335 16,970
Source: U.S. Census Bureau, American Community Survey, Public Use Microdata Sample, 2010. Prepared by the National Center for Veterans Analysis and Statistics.
• The states with the greatest number of AIAN Veterans are Arizona, California,
New Mexico, and Oklahoma, with more than 10,000 AIAN Veterans estimated to reside in each of these states.
• In 2010, approximately half of all AIAN Veterans lived in just eight states: California (12 percent), Oklahoma (9 percent), Arizona and New Mexico (7 percent, respectively), Texas (6 percent), and Florida, Washington, and Michigan (4 percent, respectively).
• The three states with the highest proportion of all Veterans who were AIAN in 2010 were Alaska (8 percent), New Mexico (6 percent), and Oklahoma (5 percent). (Table not shown.)
American Indian and Alaska Native Veterans, September 2012 Page 16
Section IV: Veteran Socioeconomic Status Overview Income, educational attainment, and employment figures can be useful indicators of socioeconomic welfare. While they are clearly not the only indicators of wellbeing, they are valuable measures of socioeconomic status. These data enable the Department of Veterans Affairs to plan needed services and benefits for the Veteran population. All data in this section come from the 2010 American Community Survey (ACS). All Veterans 17 years and older living in the United States are included in this analysis. Income for Veterans In the ACS data, “total personal income” is defined as the sum of wage or salary income; net self-employment income; interest, dividends, or net rental or royalty income or income from estates and trusts; Social Security or Railroad Retirement income; Supplemental Security Income; public assistance or welfare payments; retirement, survivor, or disability pensions; and any other sources of income received regularly such as VA compensation payments, unemployment compensation, child support or alimony. Data for personal income are shown for all individual race groups by Hispanic origin, rather than for AIAN alone and all other races combined, as in other sections of this report. This allows for a more complete picture of how AIAN Veterans compare to other minority race groups. In Chart 1, the category “Other NH” includes Veterans who reported themselves as “Some Other Race” or who chose more than one race category and who are non-Hispanic.
American Indian and Alaska Native Veterans, September 2012 Page 17
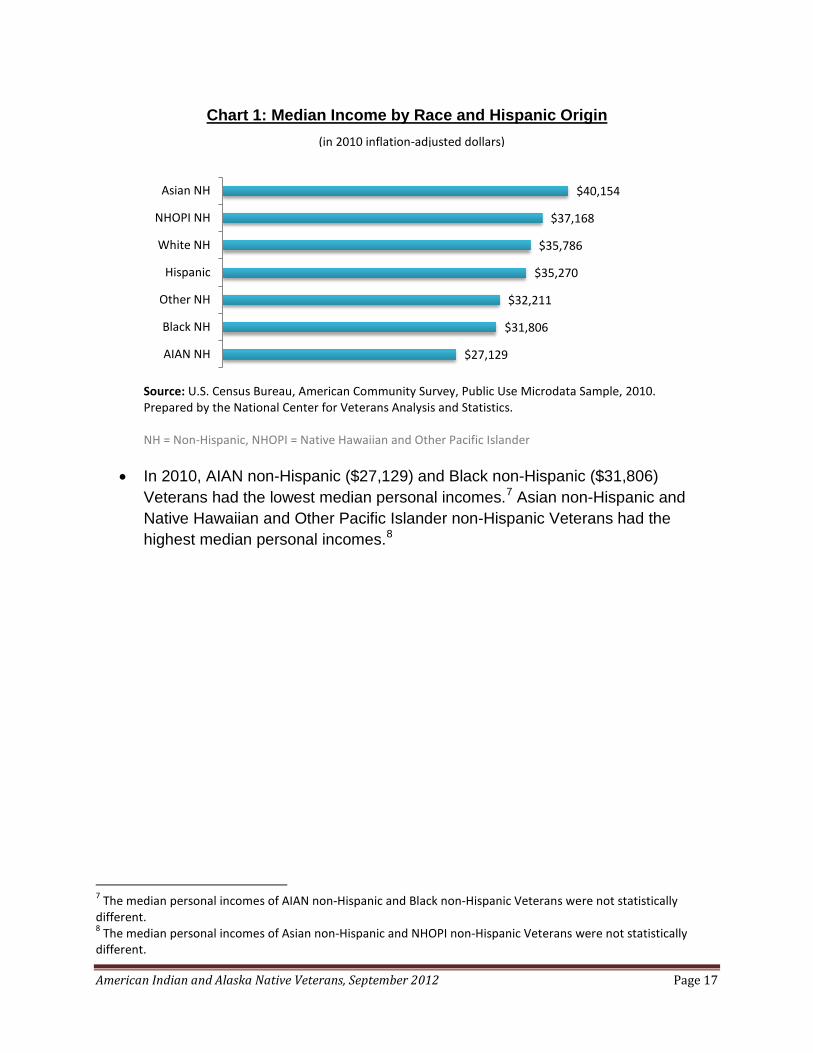
Source: U.S. Census Bureau, American Community Survey, Public Use Microdata Sample, 2010. Prepared by the National Center for Veterans Analysis and Statistics. NH = Non-Hispanic, NHOPI = Native Hawaiian and Other Pacific Islander
• In 2010, AIAN non-Hispanic ($27,129) and Black non-Hispanic ($31,806)
Veterans had the lowest median personal incomes.7 Asian non-Hispanic and Native Hawaiian and Other Pacific Islander non-Hispanic Veterans had the highest median personal incomes.8
7 The median personal incomes of AIAN non-Hispanic and Black non-Hispanic Veterans were not statistically different. 8 The median personal incomes of Asian non-Hispanic and NHOPI non-Hispanic Veterans were not statistically different.
$40,154
$37,168
$35,786
$35,270
$32,211
$31,806
$27,129
Asian NH
NHOPI NH
White NH
Hispanic
Other NH
Black NH
AIAN NH
Chart 1: Median Income by Race and Hispanic Origin
(in 2010 inflation-adjusted dollars)
American Indian and Alaska Native Veterans, September 2012 Page 18
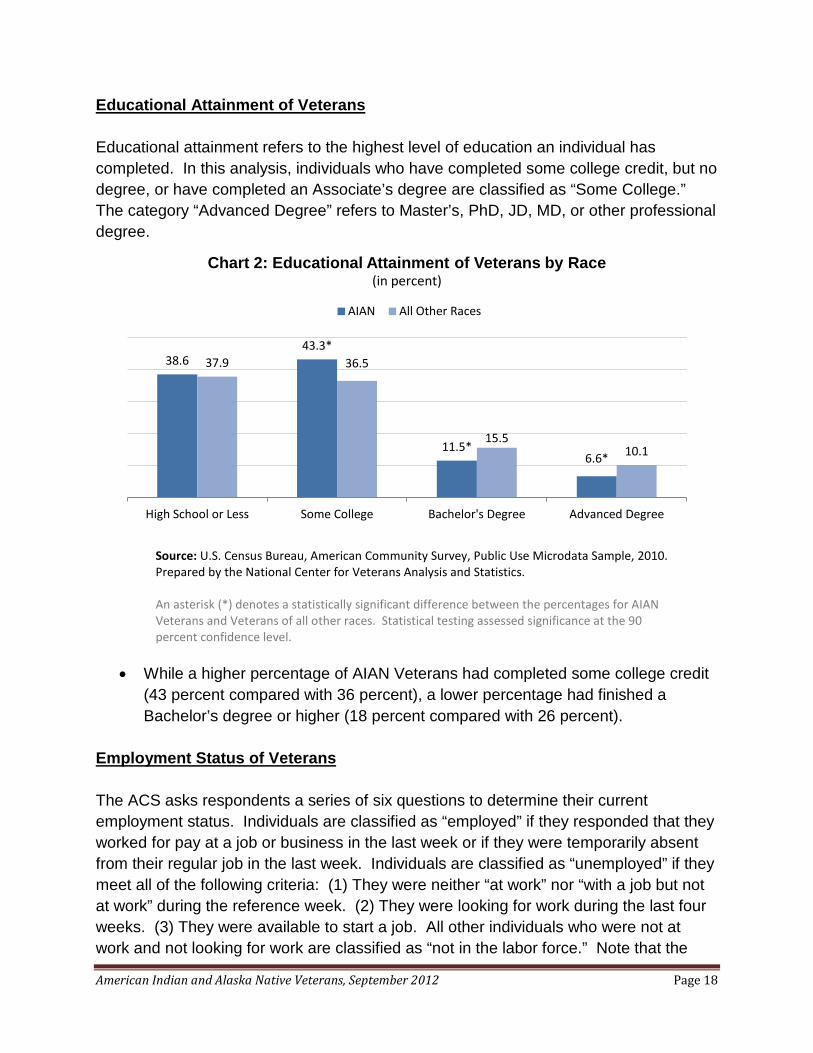
Educational Attainment of Veterans Educational attainment refers to the highest level of education an individual has completed. In this analysis, individuals who have completed some college credit, but no degree, or have completed an Associate’s degree are classified as “Some College.” The category “Advanced Degree” refers to Master’s, PhD, JD, MD, or other professional degree.
Source: U.S. Census Bureau, American Community Survey, Public Use Microdata Sample, 2010. Prepared by the National Center for Veterans Analysis and Statistics. An asterisk (*) denotes a statistically significant difference between the percentages for AIAN Veterans and Veterans of all other races. Statistical testing assessed significance at the 90 percent confidence level.
• While a higher percentage of AIAN Veterans had completed some college credit
(43 percent compared with 36 percent), a lower percentage had finished a Bachelor’s degree or higher (18 percent compared with 26 percent).
Employment Status of Veterans The ACS asks respondents a series of six questions to determine their current employment status. Individuals are classified as “employed” if they responded that they worked for pay at a job or business in the last week or if they were temporarily absent from their regular job in the last week. Individuals are classified as “unemployed” if they meet all of the following criteria: (1) They were neither “at work” nor “with a job but not at work” during the reference week. (2) They were looking for work during the last four weeks. (3) They were available to start a job. All other individuals who were not at work and not looking for work are classified as “not in the labor force.” Note that the
38.6 43.3*
11.5* 6.6*
37.9 36.5
15.5 10.1
High School or Less Some College Bachelor's Degree Advanced Degree
Chart 2: Educational Attainment of Veterans by Race (in percent)
AIAN All Other Races

American Indian and Alaska Native Veterans, September 2012 Page 19
percentage of Veterans who were unemployed is not the same thing as the unemployment rate of Veterans.
Source: U.S. Census Bureau, American Community Survey, Public Use Microdata Sample, 2010. Prepared by the National Center for Veterans Analysis and Statistics. An asterisk (*) denotes a statistically significant difference between the percentages for AIAN Veterans and Veterans of all other races. Statistical testing assessed significance at the 90 percent confidence level.
• In 2010, there was no statistically significant difference in the proportion of AIAN
Veterans and all other race Veterans who were employed. A higher percentage of AIAN Veterans 17 years and older were unemployed compared with all other Veterans (7 percent compared with 5 percent).
• In 2010, a lower percentage of AIAN Veterans (45 percent) were not in the labor force, compared with all other Veterans (49 percent) .
• A higher percentage unemployed suggests AIAN Veterans were more likely to be
actively looking for a job compared with all other Veterans. Given that AIAN Veterans are younger than all other races of Veterans combined, this could explain why they were still in the labor force.
47.5
7.1*
45.4* 46.2
4.9
48.9
Employed Unemployed Not in labor force
Chart 3: Employment Status of AIAN Veterans (in percent)
AIAN All Other Races
American Indian and Alaska Native Veterans, September 2012 Page 20
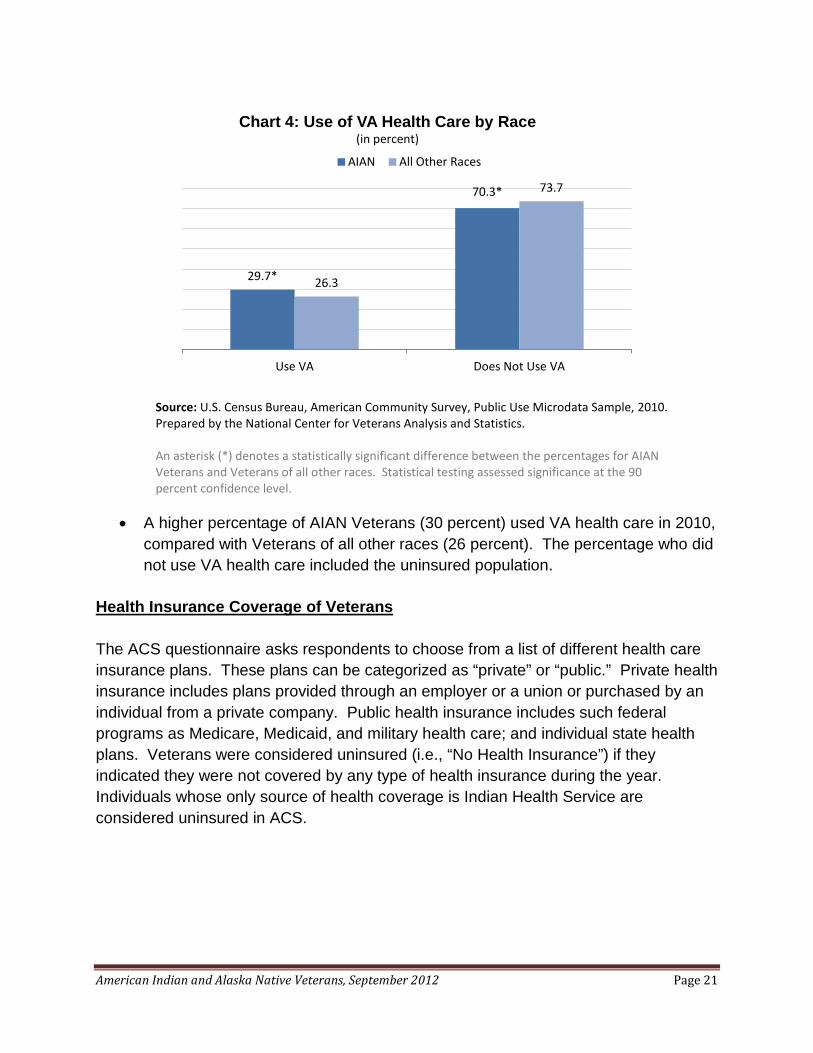
Section V: Veteran Health Status Overview The following tables examine the percentage of AIAN Veterans who use VA health care; what type(s) of insurance they have, if any; the percentage with a disability; and the percentage with a service-connected disability rating. These figures provide insight into the post-military health status of AIAN Veterans and their use of health care provided by VA. VA Health Care Usage The ACS questionnaire asks respondents about the type(s) of health care coverage they had in the past year. The question reads “Is this person CURRENTLY covered by any of the following types of health insurance or health coverage plans?” One of the possible responses is “VA (including those who have ever used or enrolled for VA health care).” For the purposes of this analysis, Veterans who answered “yes” to this category are considered to be users of VA health care. It should be noted that the estimates from ACS differ from usage statistics reported by VA because of the differences in definitions and the limitations of the survey data.
American Indian and Alaska Native Veterans, September 2012 Page 21
Source: U.S. Census Bureau, American Community Survey, Public Use Microdata Sample, 2010. Prepared by the National Center for Veterans Analysis and Statistics. An asterisk (*) denotes a statistically significant difference between the percentages for AIAN Veterans and Veterans of all other races. Statistical testing assessed significance at the 90 percent confidence level.
• A higher percentage of AIAN Veterans (30 percent) used VA health care in 2010, compared with Veterans of all other races (26 percent). The percentage who did not use VA health care included the uninsured population.
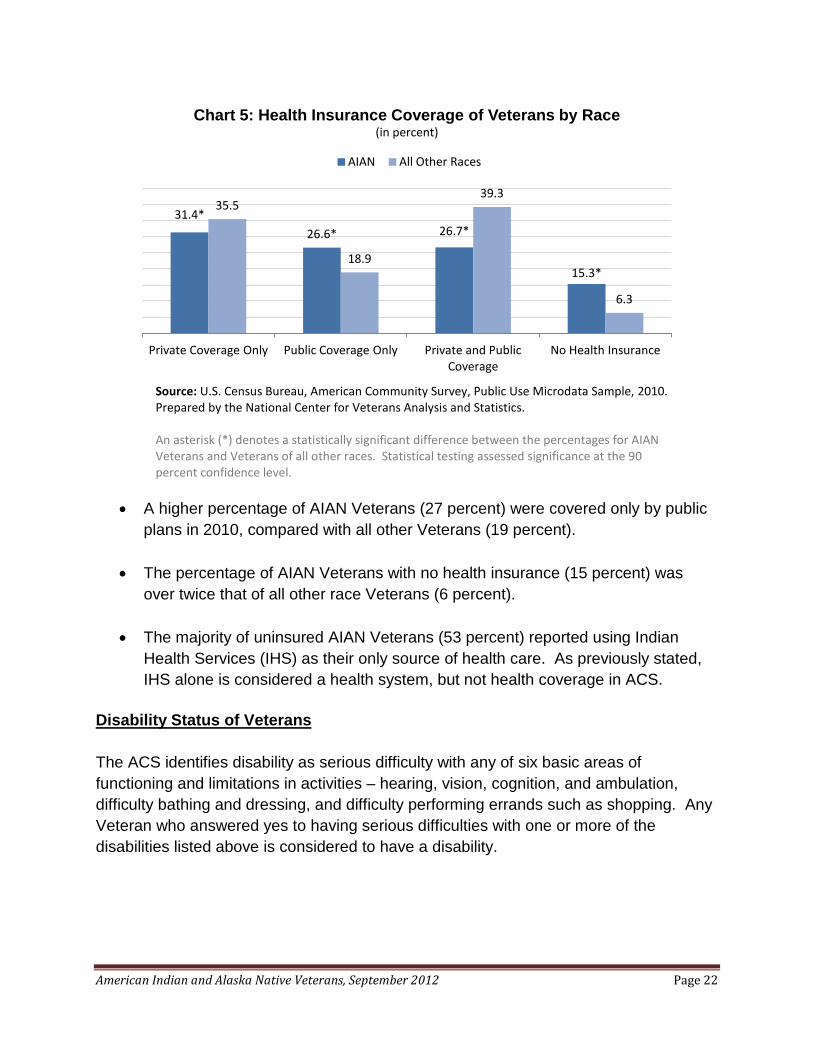
Health Insurance Coverage of Veterans The ACS questionnaire asks respondents to choose from a list of different health care insurance plans. These plans can be categorized as “private” or “public.” Private health insurance includes plans provided through an employer or a union or purchased by an individual from a private company. Public health insurance includes such federal programs as Medicare, Medicaid, and military health care; and individual state health plans. Veterans were considered uninsured (i.e., “No Health Insurance”) if they indicated they were not covered by any type of health insurance during the year. Individuals whose only source of health coverage is Indian Health Service are considered uninsured in ACS.
29.7*
70.3*
26.3
73.7
Use VA Does Not Use VA
Chart 4: Use of VA Health Care by Race (in percent)
AIAN All Other Races
American Indian and Alaska Native Veterans, September 2012 Page 22
Source: U.S. Census Bureau, American Community Survey, Public Use Microdata Sample, 2010. Prepared by the National Center for Veterans Analysis and Statistics. An asterisk (*) denotes a statistically significant difference between the percentages for AIAN Veterans and Veterans of all other races. Statistical testing assessed significance at the 90 percent confidence level.
• A higher percentage of AIAN Veterans (27 percent) were covered only by public
plans in 2010, compared with all other Veterans (19 percent).
• The percentage of AIAN Veterans with no health insurance (15 percent) was over twice that of all other race Veterans (6 percent).
• The majority of uninsured AIAN Veterans (53 percent) reported using Indian Health Services (IHS) as their only source of health care. As previously stated, IHS alone is considered a health system, but not health coverage in ACS.
Disability Status of Veterans The ACS identifies disability as serious difficulty with any of six basic areas of functioning and limitations in activities – hearing, vision, cognition, and ambulation, difficulty bathing and dressing, and difficulty performing errands such as shopping. Any Veteran who answered yes to having serious difficulties with one or more of the disabilities listed above is considered to have a disability.
31.4*
26.6* 26.7*
15.3*
35.5
18.9
39.3
6.3
Private Coverage Only Public Coverage Only Private and Public Coverage
No Health Insurance
Chart 5: Health Insurance Coverage of Veterans by Race (in percent)
AIAN All Other Races
American Indian and Alaska Native Veterans, September 2012 Page 23
Source: U.S. Census Bureau, American Community Survey, Public Use Microdata Sample, 2010. Prepared by the National Center for Veterans Analysis and Statistics. An asterisk (*) denotes a statistically significant difference between the percentages for AIAN Veterans and Veterans of all other races. Statistical testing assessed significance at the 90 percent confidence level.
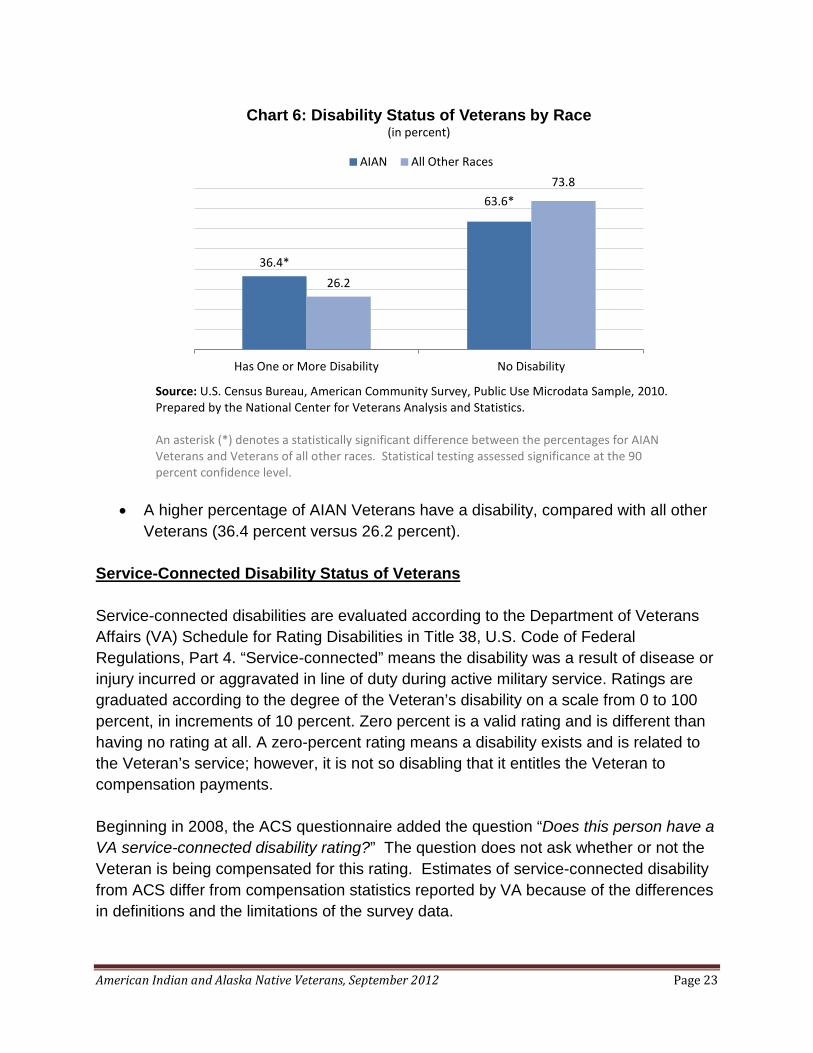
• A higher percentage of AIAN Veterans have a disability, compared with all other
Veterans (36.4 percent versus 26.2 percent). Service-Connected Disability Status of Veterans
Service-connected disabilities are evaluated according to the Department of Veterans Affairs (VA) Schedule for Rating Disabilities in Title 38, U.S. Code of Federal Regulations, Part 4. “Service-connected” means the disability was a result of disease or injury incurred or aggravated in line of duty during active military service. Ratings are graduated according to the degree of the Veteran’s disability on a scale from 0 to 100 percent, in increments of 10 percent. Zero percent is a valid rating and is different than having no rating at all. A zero-percent rating means a disability exists and is related to the Veteran’s service; however, it is not so disabling that it entitles the Veteran to compensation payments. Beginning in 2008, the ACS questionnaire added the question “Does this person have a VA service-connected disability rating?” The question does not ask whether or not the Veteran is being compensated for this rating. Estimates of service-connected disability from ACS differ from compensation statistics reported by VA because of the differences in definitions and the limitations of the survey data.
36.4*
63.6*
26.2
73.8
Has One or More Disability No Disability
Chart 6: Disability Status of Veterans by Race (in percent)
AIAN All Other Races
American Indian and Alaska Native Veterans, September 2012 Page 24
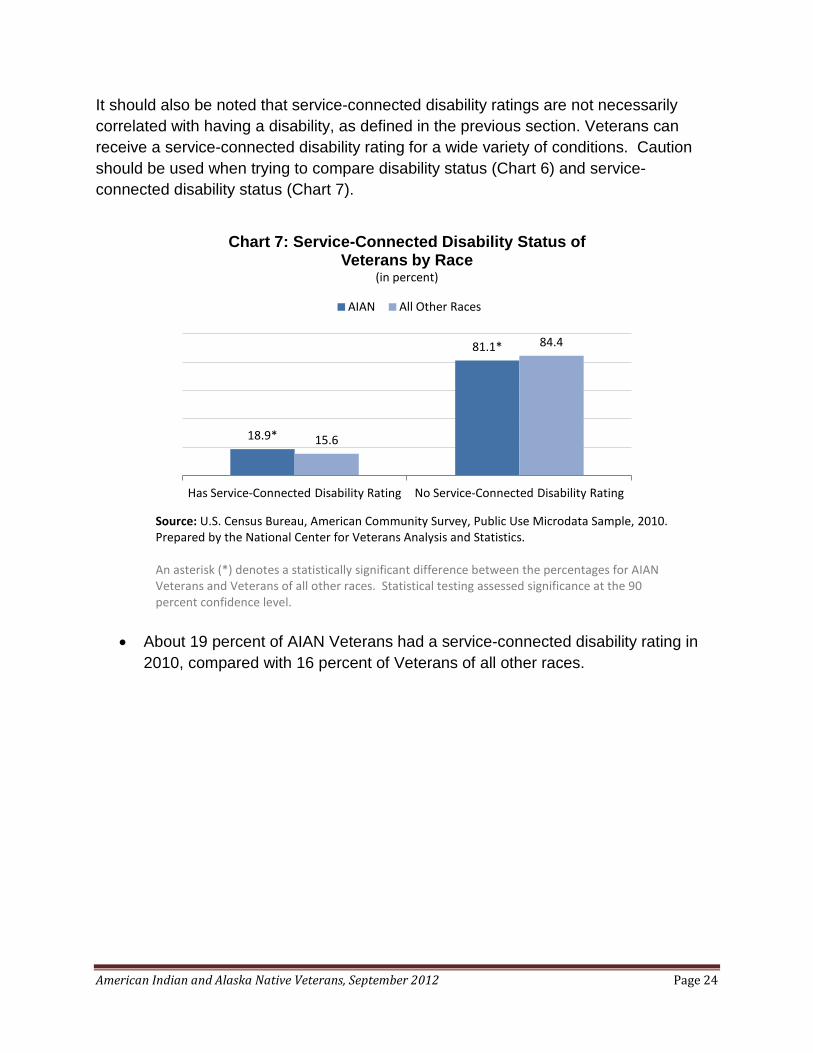
It should also be noted that service-connected disability ratings are not necessarily correlated with having a disability, as defined in the previous section. Veterans can receive a service-connected disability rating for a wide variety of conditions. Caution should be used when trying to compare disability status (Chart 6) and service-connected disability status (Chart 7).
Source: U.S. Census Bureau, American Community Survey, Public Use Microdata Sample, 2010. Prepared by the National Center for Veterans Analysis and Statistics. An asterisk (*) denotes a statistically significant difference between the percentages for AIAN Veterans and Veterans of all other races. Statistical testing assessed significance at the 90 percent confidence level.
• About 19 percent of AIAN Veterans had a service-connected disability rating in
2010, compared with 16 percent of Veterans of all other races.
18.9*
81.1*
15.6
84.4
Has Service-Connected Disability Rating No Service-Connected Disability Rating
Chart 7: Service-Connected Disability Status of Veterans by Race
(in percent)
AIAN All Other Races
American Indian and Alaska Native Veterans, September 2012 Page 25
Appendix A. Data Sources Census Bureau
• American Community Survey 2010 Public Use Microdata Sample The American Community Survey (ACS) is an annual household survey that provides data on the demographic, social, and economic characteristics of the U.S. population. It collects data annually on topics such as race, age, income, health insurance, education, Veteran status, and disability. Demographic and socio-economic tables in this report were produced from the ACS 2010 Public Use Microdata Sample (PUMS). ACS respondents had the choice of selecting one or more races for the survey. AIAN estimates reflect data from those respondents who only selected AIAN and did not select more than one race. Statistics from the ACS 2010 PUMS are estimates and should not be construed to be exact figures. Department of Defense Defense Manpower Data Center (DMDC) provided data from the following sources:
• Active Duty Master Personnel File
• Reserve Components Common Personnel Data System (RCCPDS)
American Indian and Alaska Native Veterans, September 2012 Page 26
Appendix B. Acronyms ACS American Community Survey
AIAN American Indian and Alaska Native
DMDC Defense Manpower Data Center
DoD Department of Defense
NHOPI Native Hawaiian and Other Pacific Islander
OEF Operation Enduring Freedom
OIF Operation Iraqi Freedom
OND Operation New Dawn
POS Period of Service
PUMS Public Use Microdata Sample
RCCPDS Reserve Components Common Personnel Data System
VA Department of Veterans Affairs
American Indian and Alaska Native Veterans, September 2012 Page 27
Appendix C. References Department of Defense, Native American Affairs, July 2003, “Native Alaska – Military Relations: 1867 to Current,” Washington, DC, prepared by J. H. Cloe, retrieved from: http://www.denix.osd.mil/na/upload/Military-History-in-Alaska.pdf. Department of Defense, United States Army, November 2010, “Honoring Native American, Alaska Native Heritage,” Washington, DC, retrieved from: http://www.army.mil/article/48472/honoring-native-american-alaska-native-heritage/. The White House, Office of the Press Secretary, November 2011, “Presidential Proclamation -- National Native American Heritage Month, 2011” Washington, DC, retrieved from: http://www.whitehouse.gov/the-press-office/2011/11/01/presidential-proclamation-national-native-american-heritage-month-2011.