Embed Size (px)
Citation preview

American Mega Trends
Arthur C. Nelson, Ph.D., FAICPPresidential Professor & Director
Metropolitan Research CenterUniversity of UtahOctober 28, 2009

America Grows200 million in 1968300 million in 2006400 million in 2032500 million in 2050
America adds 100 million people faster than any other nation except India and
Pakistan – But faster than China.
Source: Arthur C. Nelson, Presidential Professor & Director, Metropolitan Research Center, University of Utah.
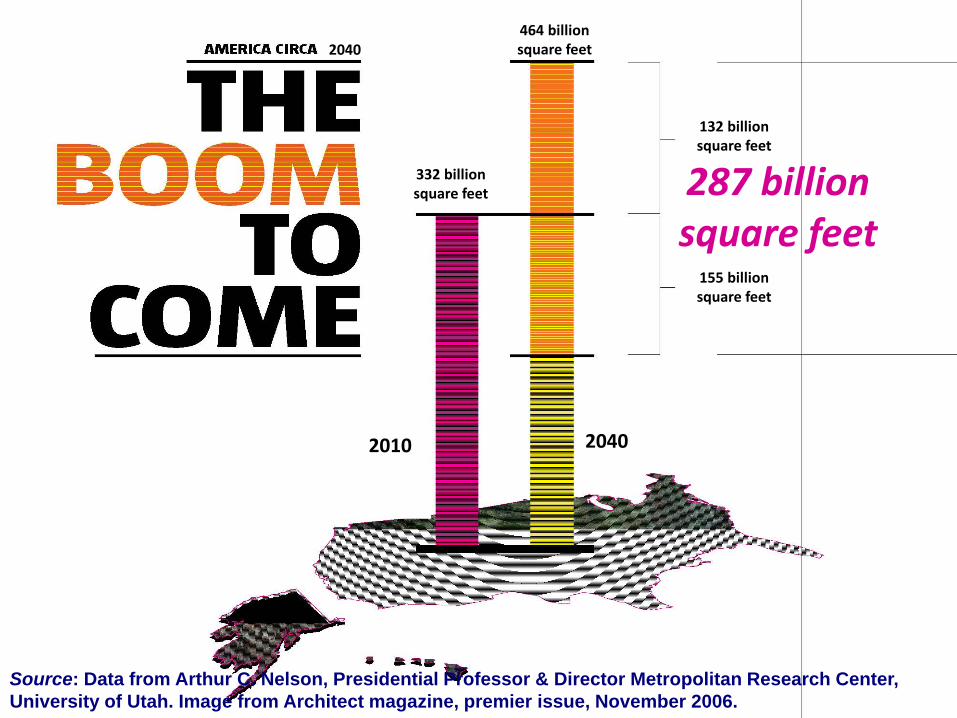
2040
20402010
332 billionsquare feet
464 billionsquare feet
132 billionsquare feet
155 billionsquare feet
287 billionsquare feet
Source: Data from Arthur C. Nelson, Presidential Professor & Director Metropolitan Research Center, University of Utah. Image from Architect magazine, premier issue, November 2006.

e: Arthur C. Nelson, Presidential Professor & Director, Metropolitan Research , University of Utah. Image from Architect magazine, November 2006.

Clearing Out the ExcessYear Demand Supply Balance2001 1,495k 1,603k 108k 2002 1,440k 1,705k 373k 2003 1,353k 1,848k 868k 2004 1,432k 1,956k 1,391k 2005 1,418k 2,068k 2,041k 2006 1,485k 1,801k 2,357k 2007 1,491k 1,355k 2,221k 2008 1,532k 906k 1,595k 2009 1,552k 600k 644k 2010 1,566k 900k (22k)
Source: Arthur C. Nelson, Presidential Professor & Director of Metropolitan Research, University of Utah.

Squeezing Out the Excess
Source: Arthur C. Nelson, Presidential Professor & Director of Metropolitan Research, University of Utah.


20th Century Metropolitan Form

Polk County FL Commuting Shed
Dots indicate where residents of Polk worked in 2003
Source: Dwayne Guthrie, Metropolitan Institute at Virginia Tech, based on Longitudinal Employer-Household Dynamics, US Census Bureau.

21st Century Megapolitan Form


Getting Ahead of the Curve
US 2005 2040Population 296 million 433 millionHousing Units 122 million 179 millionJobs 156 million 272 millionSource: Arthur C. Nelson, Presidential Professor & Director of Metropolitan Research,
University of Utah.
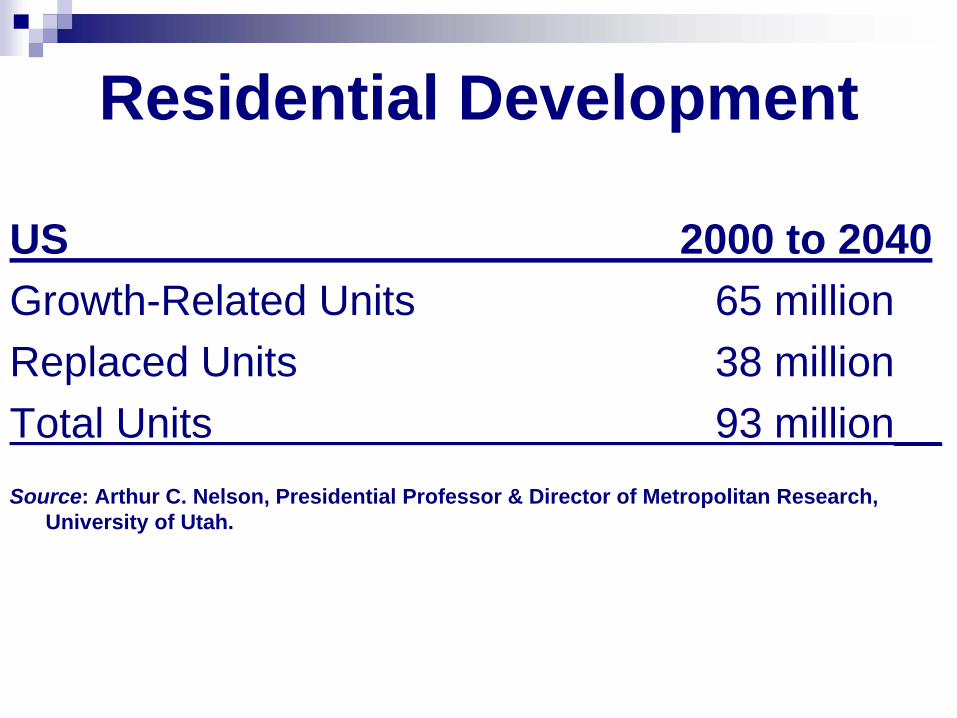
Residential Development
US 2000 to 2040Growth-Related Units 65 millionReplaced Units 38 millionTotal Units 93 million__Source: Arthur C. Nelson, Presidential Professor & Director of Metropolitan Research,
University of Utah.

Nonresidential Development
US 2000 to 2040Growth-Related Square Feet 35 billionReplaced Square Feet 102 billionTotal Square Feet 137 billionSource: Arthur C. Nelson, Presidential Professor & Director of Metropolitan Research,
University of Utah.

Life-Span of Building Function
Source: Arthur C. Nelson, Presidential Professor & Director of Metropolitan Research, University of Utah, based on DoE Commercial Buildings Energy Consumption Survey.

Bottom Line Construction2005-2040
USResidential $35 TrillionNonresidential $15 TrillionInfrastructure $10 TrillionTotal $60 Trillion
Source: Arthur C. Nelson, Presidential Professor & Director of Metropolitan Research, University of Utah.

Metropolitan Tucson 2005-2040Area 2005 2040 Change PercentPopulation 925k 1,631k 706k 76%Res. Units 383k 676k 293k
Replaced 102kTotal 395k 103%
Jobs 486k 937k 451k 93%Square Ft 205m 410m 205m
Replaced 420mTotal 625m 305%
Source: Arthur C. Nelson, Presidential Professor & Director of Metropolitan Research, University of Utah. Population and employment figures from Woods & Poole Economics (2008).

Bottom Line ConstructionTucson Metropolitan Area 2005-2040
Residential $125 BillionNonresidential $ 75 BillionInfrastructure $ 50 BillionTotal $250 Billion
Source: Arthur C. Nelson, Presidential Professor & Director of Metropolitan Research, University of Utah.

What About ….?
Telecommuting?Internet retailing?Emerging technologies?
And their effect on future space needs?

Telecommuting Promises
Higher productivityReduce traffic congestionReduce air pollution

Telecommuting Reality
Cabin fever Reduces productivityIncreases trips in am, noon, pm.Increases peak emissions with “cold” starts.
Census “work at home” telecommuting: 1990 = 3.0%2000 = 3.3%
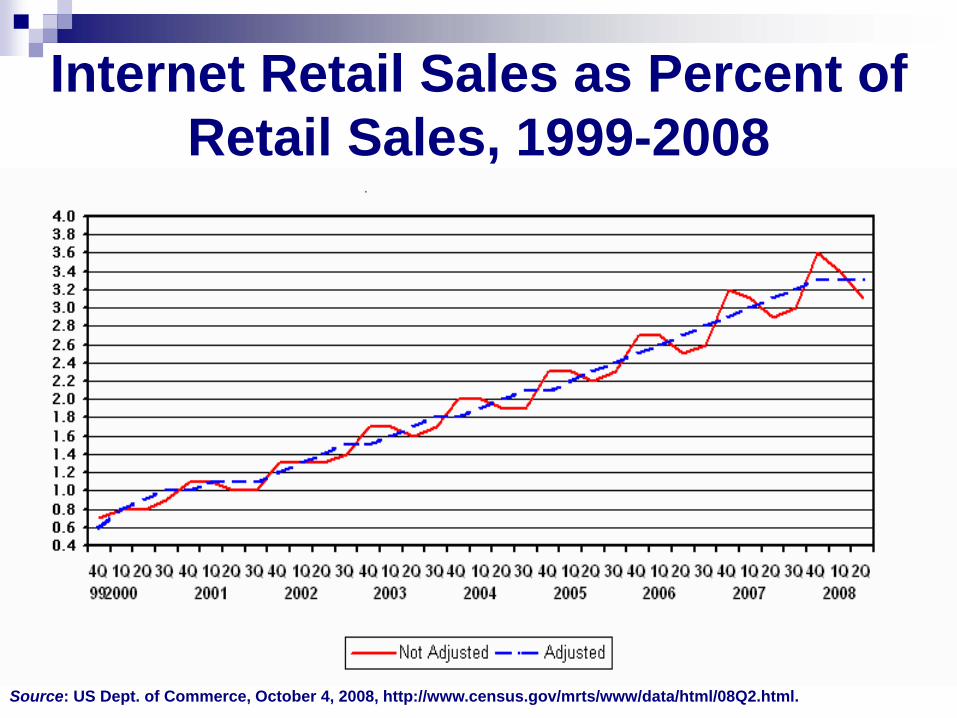
Internet Retail Sales as Percent of Retail Sales, 1999-2008
Source: US Dept. of Commerce, October 4, 2008, http://www.census.gov/mrts/www/data/html/08Q2.html.
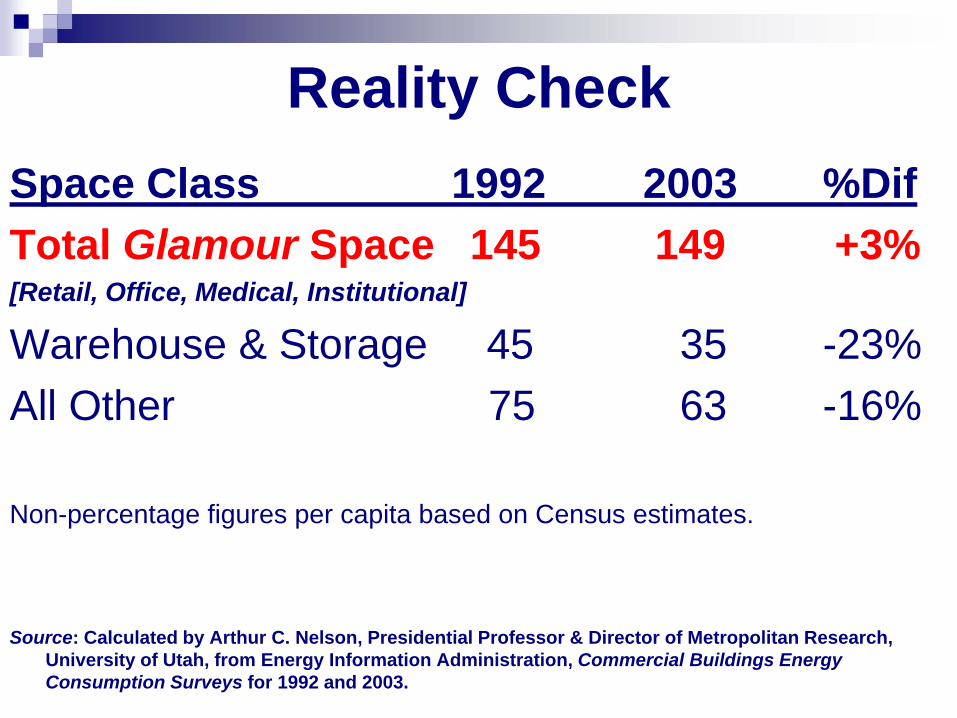
Reality CheckSpace Class 1992 2003 %DifTotal Glamour Space 145 149 +3%[Retail, Office, Medical, Institutional]
Warehouse & Storage 45 35 -23%All Other 75 63 -16%
Non-percentage figures per capita based on Census estimates.
Source: Calculated by Arthur C. Nelson, Presidential Professor & Director of Metropolitan Research, University of Utah, from Energy Information Administration, Commercial Buildings Energy Consumption Surveys for 1992 and 2003.

How Does It Grow?

Market Analysts Finding Changing Preferences
National Association of RealtorsNational Association of Home BuildersNationally Recognized Market Analysts
Urban Land InstituteLend Lease/PriceWaterhouseCoopers
Joint Center for Housing Policy at HarvardGolfing Buddies and Taxi Drivers

Households are ChangingHousehold Type 1960 2005 2040HH with Children 48% 32% 26%HH without Children 52% 68% 74%Single/Other HH 13% 31% 34%
Source: Arthur C. Nelson, Presidential Professor & Director of Metropolitan Research, University of Utah.

People Turning 65 Each Year[Figures in 000s]
Source: US Census Bureau – 65+ in the United States: 2005; Wan He, Manisha Sengupta, Victoria A. Velkoff, & Kimberly A DeBarros. December 2005.
1000
1500
2000
2500
3000
3500
4000
4500
1950
1955
1960
1965
1970
1975
1980
1985
1990
1995
2000
2005
2010
2015
2020
2025

What Futurists Tell UsBio-medical advances extend lifetimes.
Census adds 20 years : 76 to 96But that’s not all …
Actuarial tables extend to 120.Adulthood nearing 75% in non child-
rearing Gen-X & -Y making “family” location
decisions differently from parents

Buy-Sell Rates by Age Cohort
Source: Dowell Myers & SungHo Ryu, “Aging Baby Boomers and the Generational Housing Bubble: Foresight and Mitigation of an Epic Transition”, Journal of the American Planning Association 74(1): 1-17 (2007).

Relocation Choices of Seniors
Before AfterHousing Type Move MoveAttached 24% 54%Renter 20% 59%
Source: American Housing Survey 2003. New movers means moved in past year. Annual senior movers are about 5% of all senior households; 75%+ of all seniors will change housing type between ages 65 and 80.

Source: Dowell Myers & SungHo Ryu, “Aging Baby Boomers and the Generational Housing Bubble: Foresight and Mitigation of an Epic Transition”, Journal of the American Planning Association 74(1): 1-17 (2007). Figures for net buying or selling rate age.
BUY
SELL

Second-Home Market Overrated?Myth: Empty-nesters & seniors buy 2nd homesFact: Only 4% of HH 65+ have second homes70% of second home owners aged 35-64Detached new second home demand:
1990s = 900k2000s = 600k
2010s = 300k2020s = 200k
2030s = 100kReality: Wealth used for children’s homes
Source: Estimated by Arthur C. Nelson, Metropolitan Institute at Virginia Tech, from American Housing Survey and Second Homes: What, How Many, Who and Where? Harvard Joint Center for Housing (2001).

Housing Preference Surveys by Type, 1995-2004
Unit Type ShareAttached 38%
Apartments 14%Condos, Coops 9%*Townhouses 15%
Detached 62%Small Lot (<7,000 sf) 37%Large Lot (>7,000 sf) 25%
Source: Low range of surveys reviewed by Arthur C. Nelson, “Planning for a New Era,” Journal of the American Planning Association, Fall 2006.
*Toll Brothers shifting product mix to 15% condominium; WSJ 12/06.

Trend Demand 2005 - 204050% Attached (apartment, TH, condo, etc.)30% Detached small/cluster/zero-lot20% Conventional large-lot subdivision
80% = Traditional Urban Density
Even in Plano, Texas

Source: Arthur C. Nelson, Presidential Professor & Director, Metropolitan Research Center, University of Utah

Home Ownership Bias Can BackfireHeadlines
Indianapolis “most affordable” metro in 2005. But …
Median Home Value in 1991 = $143,000Median Home Value in 2005 = $125,000Change, 2005 Dollars = -$ 20,000Rate of Return Over Period = -13%
Source: Adapted from National Association of Home Builders, 2006. All figures in 2005 dollars.
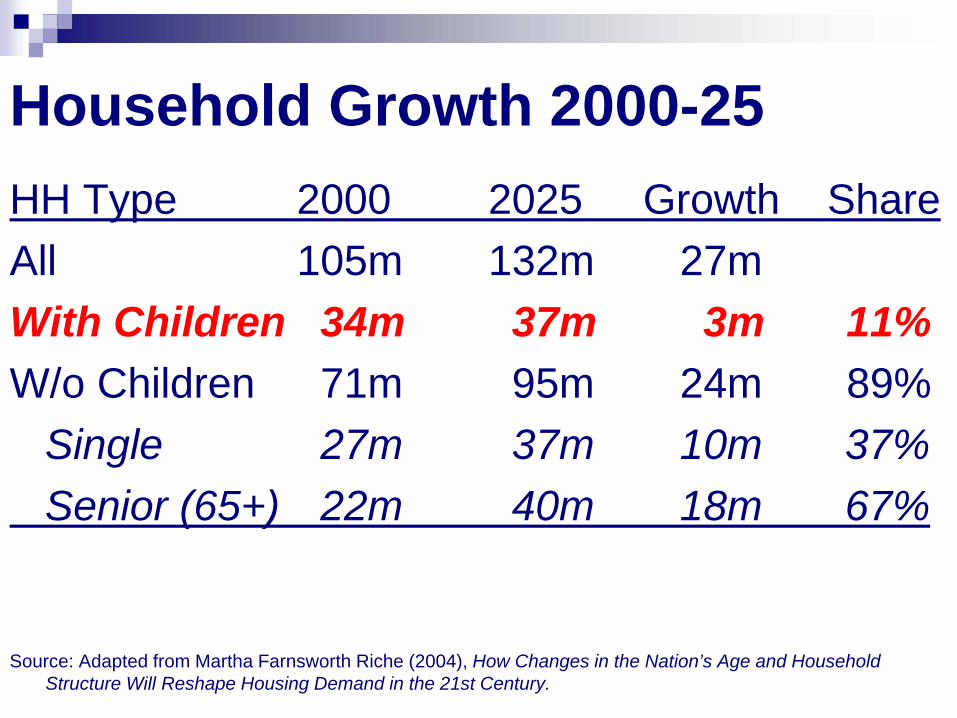
Household Growth 2000-25HH Type 2000 2025 Growth ShareAll 105m 132m 27mWith Children 34m 37m 3m 11%W/o Children 71m 95m 24m 89%
Single 27m 37m 10m 37%Senior (65+) 22m 40m 18m 67%
Source: Adapted from Martha Farnsworth Riche (2004), How Changes in the Nation’s Age and Household Structure Will Reshape Housing Demand in the 21st Century.
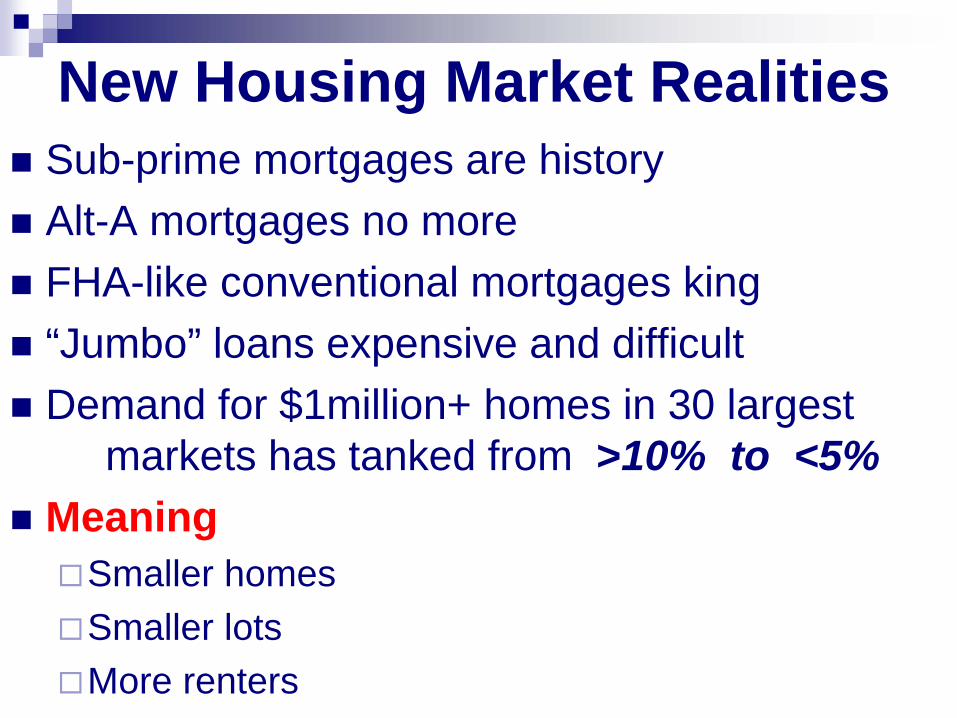
New Housing Market RealitiesSub-prime mortgages are historyAlt-A mortgages no moreFHA-like conventional mortgages king“Jumbo” loans expensive and difficultDemand for $1million+ homes in 30 largest
markets has tanked from >10% to <5%Meaning
Smaller homesSmaller lotsMore renters

Shifting Tenure Implications – US
Year Units %Owner Owner Renter2008 125M 67% 84M 41M2015 134M 64% 86M 48MChange 9M 2M 7MShare 25% 75%
Units are “year-round” and include occupied, vacant, transitional, and other units meant for year-round occupancy. Figure for 2008 estimated from American Housing Survey for the United States 2007.
Source: Arthur C. Nelson, Presidential Professor & Director, Metropolitan Research Center, University of Utah.
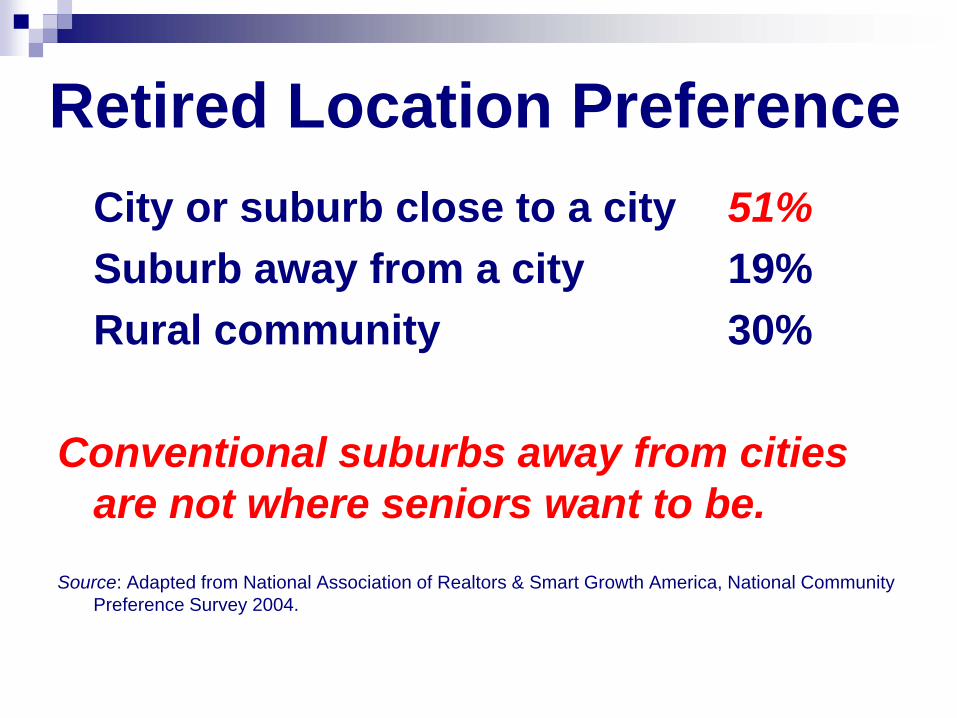
Retired Location PreferenceCity or suburb close to a city 51%Suburb away from a city 19%Rural community 30%
Conventional suburbs away from cities are not where seniors want to be.
Source: Adapted from National Association of Realtors & Smart Growth America, National Community Preference Survey 2004.

Emerging “Urbanity” Preferences
Source: National Association of Realtors, American Preference Survey 2004.

Suburban Fringe Mortgage Time Bomb?
Source: Michael Hudson, “The New Road to Serfdom.” Harpers (May 2006), p. 46. This graph depicts the total mortgage market as viewed by Hudson.

Fringe Values Eroding: Phoenix
Source: Arthur C. Nelson, Presidential Professor & Director of Metropolitan Research, University of Utah, based in Zillow analysis by Ceylan Oner.
Average Annual Appreciation 2004-2006

Fringe Foreclosure Pattern
DC MetroSubprimeOversupplyDevaluationEnergy prices
Metro Rail Access
Source: Arthur C. Nelson, Presidential Professor & Director of Metropolitan Research, University of Utah.

U.S. homes lost $2 trillion in value in '08
Les Christie, CNNMoney.com staff writer. Dec. 15, 2008: 11:02 AM ET

Do the MathPercent HH wanting transit access 40%Households 2040 172mHouseholds wanting transit 2040 70mHouseholds with transit 2000 6mHousehold transit growth 64mHouseholds 2000 112mHousehold growth 2000-2040 60m
Source: Arthur C. Nelson, Presidential Professor & Director, Metropolitan Research Center, University of Utah

The Opportunity
The New Promised Land?

Tear Up a Parking Lot,Rebuild Paradise
Large, flat and well drainedSingle, profit-motivated ownership
Major infrastructure in place4+ lane highway frontage “transit-ready”
Committed to commercial/mixed useCan turn NIMBYs into YIMBYs
Slide title phrase adapted from Joni Mitchell, Big Yellow Taxi, refrain: “Pave over paradise, put up a parking lot.”


http://www.cnu.org/sites/www.cnu.org/files/R0012614.jpg
The FutureSpeedway?

Re-Building CapacityCalculation Result“Ripe” Redevelopment Acres by 2040 6.0MMinimum Share Redeveloped 25%Redeveloped Acres 1.5M
15-25 dwellings @ 1,800sq.ft. 30-50 jobs @ 500sq.ft. 1.5FAR
Percent Residential Absorption min. 67%Percent Employment Absorption min. 75%

Source: Calthorpe (1993)
Transit Oriented Development Template10-minute walk or about 1500-2000 feet
The speed of a saunter or a walk-in-the-park.
District Boundary Definitions in TOD OrdinancesSource: Community Design + Architecture (2001)

Walking Distance BenchmarksSource: Ewing (1999)
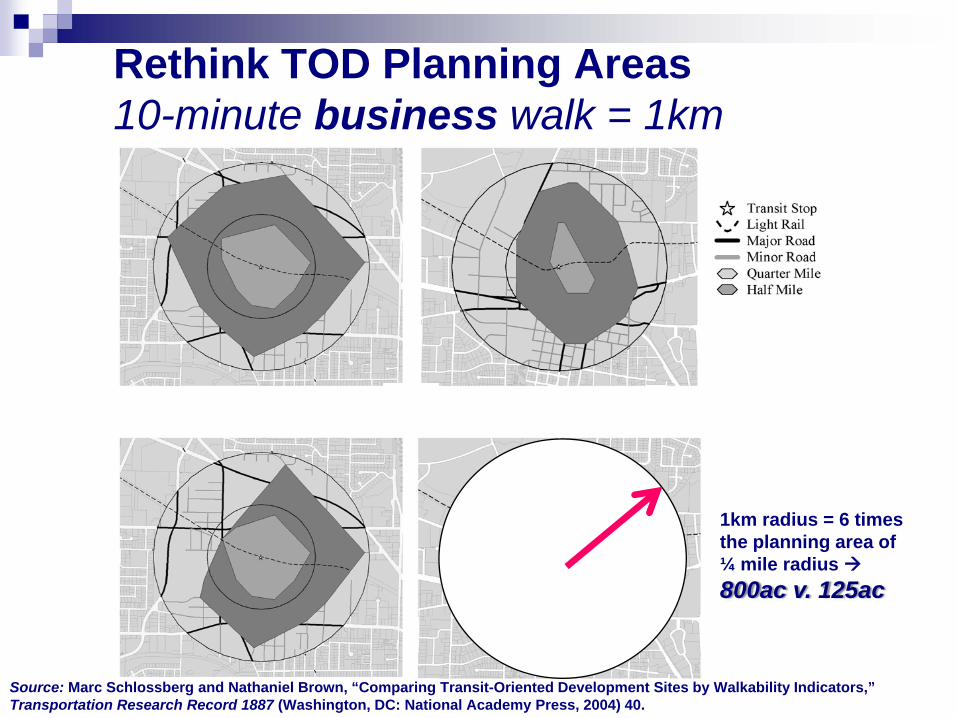
Rethink TOD Planning Areas10-minute business walk = 1km
1km radius = 6 times the planning area of ¼ mile radius 800ac v. 125ac
Source: Marc Schlossberg and Nathaniel Brown, “Comparing Transit-Oriented Development Sites by Walkability Indicators,” Transportation Research Record 1887 (Washington, DC: National Academy Press, 2004) 40.

Dallas Area Rapid Transit

“Downtown” Plano, TX
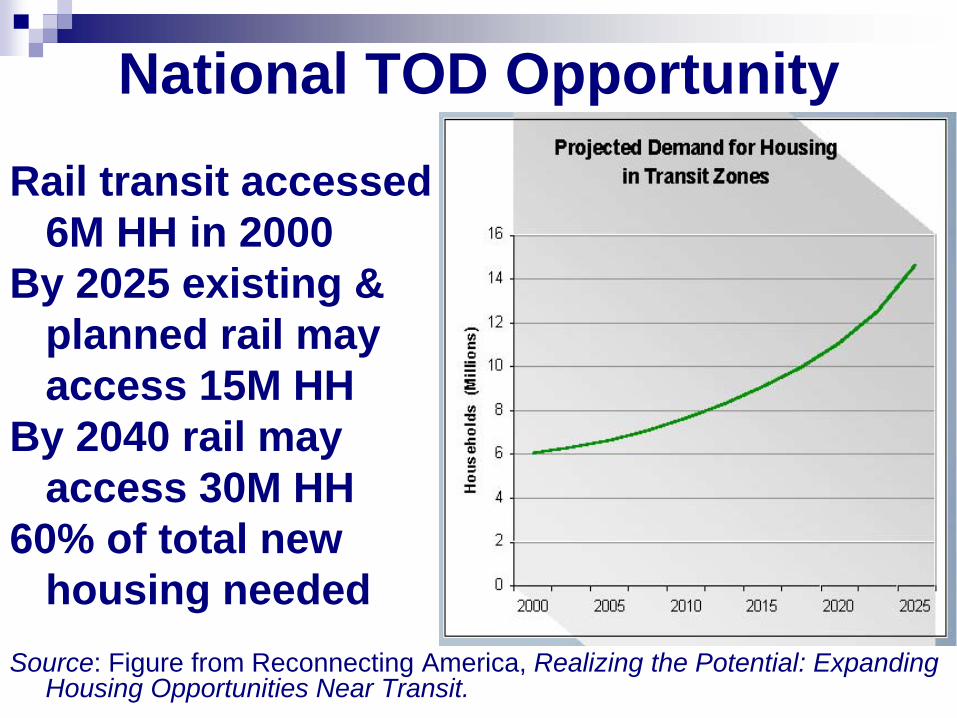
National TOD Opportunity
Rail transit accessed6M HH in 2000
By 2025 existing &planned rail mayaccess 15M HH
By 2040 rail mayaccess 30M HH
60% of total new housing needed
Source: Figure from Reconnecting America, Realizing the Potential: Expanding Housing Opportunities Near Transit.
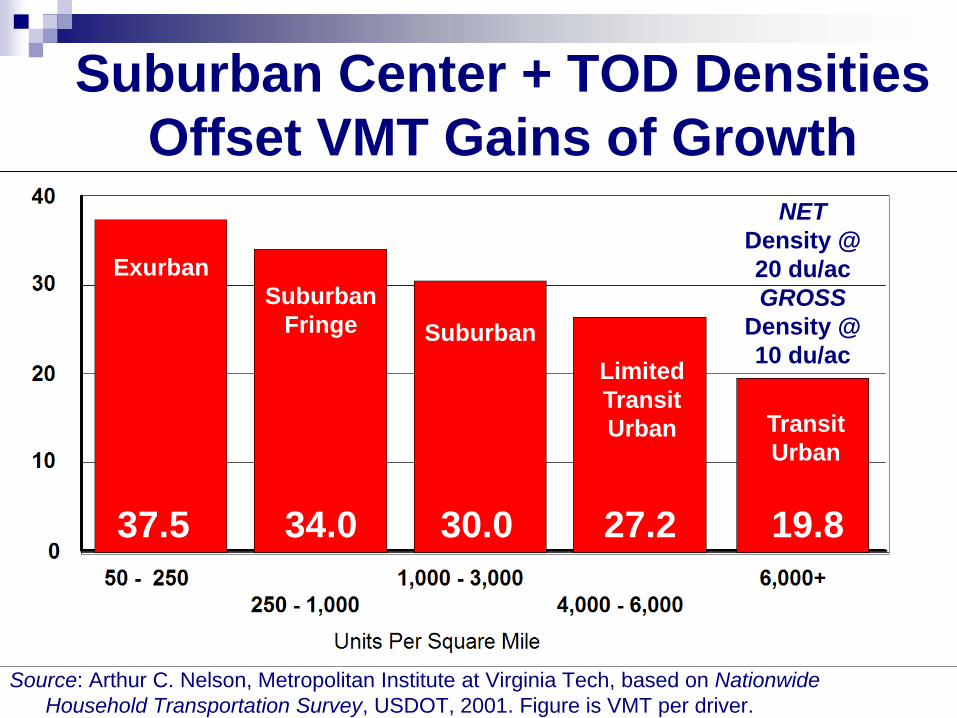
Suburban Center + TOD Densities Offset VMT Gains of Growth
Source: Arthur C. Nelson, Metropolitan Institute at Virginia Tech, based on Nationwide Household Transportation Survey, USDOT, 2001. Figure is VMT per driver.
NETDensity @ 20 du/acGROSS
Density @ 10 du/ac
37.5 34.0 30.0 27.2 19.8
ExurbanSuburban
Fringe SuburbanLimitedTransitUrban Transit
Urban

Mountain MegaTOD Market Absorption
1km planning radius = 800 acres
Megapolitan Area @ 10du/AcAlbuquerque 20%Denver 22%Las Vegas 10%Phoenix 19%Salt Lake 57%Mountain Megapolitans 24%

Tucson “New Urbanity” Demand1+% Downtown demand
15,000 people1+% Secondary center demand
15,000 people5+% Other urban transit access demand
75,000 people25+% Suburban transit access new community demand
400,000 people
70% of new all development must be in “New Urbanity” options to meet demand for the 1/3rd wanting them in 2040.
Source: Arthur C. Nelson, Presidential Professor & Director of Metropolitan Research, University of Utah.

THANK YOU