Embed Size (px)
Citation preview
http://apr.sagepub.com/American Politics Research
http://apr.sagepub.com/content/40/6/976The online version of this article can be found at:
DOI: 10.1177/1532673X12457809
2012 40: 976American Politics ResearchPaul Gronke and Peter Miller
BurchettVoting by Mail and Turnout in Oregon : Revisiting Southwell and
Published by:
http://www.sagepublications.com
can be found at:American Politics ResearchAdditional services and information for
http://apr.sagepub.com/cgi/alertsEmail Alerts:
http://apr.sagepub.com/subscriptionsSubscriptions:
http://www.sagepub.com/journalsReprints.navReprints:
http://www.sagepub.com/journalsPermissions.navPermissions:
http://apr.sagepub.com/content/40/6/976.refs.htmlCitations:
What is This?
- Oct 28, 2012Version of Record >>
at REED COLLEGE LIBRARY on June 5, 2013apr.sagepub.comDownloaded from
American Politics Research40(6) 976 –997
© The Author(s) 2012Reprints and permission:
sagepub.com/journalsPermissions.navDOI: 10.1177/1532673X12457809
http://apr.sagepub.com
457809 APR40610.1177/1532673X12457809American Politics ResearchGronke and Miller© The Author(s) 2011
Reprints and permission: http://www.sagepub.com/journalsPermissions.nav
1Reed College, Portland, OR, USA2University of California at Irvine, Irvine, CA, USA
Corresponding Author:Paul Gronke, Reed College, 3203 SE Woodstock Boulevard, Portland, OR 97202, USA Email: [email protected]
Voting by Mail and Turnout in Oregon: Revisiting Southwell and Burchett
Paul Gronke1 and Peter Miller2
Abstract
In the most widely cited result on the turnout effects of voting by mail, Southwell and Burchett report that Oregon’s system increased turnout by 10 percentage points. We attempt to replicate this finding and extend the analysis to additional years to test whether the originally reported effect is due to the novelty of the first three voting by mail elections in 1995 and 1996. We are unable to reproduce earlier findings, either via replication or extending the time series to include 2010 electoral data. We find evidence for a novelty effect when all elections between 1960 and 2010 are included in our analysis, and a consistent impact of voting by mail on turnout only in special elections.
Keywords
vote-by-mail, early voting, elections, turnout
Supporters of voting by mail (VBM)—systems where voters receive and return their ballots by mail—argue that VBM increases turnout and produces a more reflective, thoughtful electorate, reduces administrative costs, and produces a more accurate ballot count (Hamilton, 1988).1 The claims of increased procedural integrity are sustained by other analyses (Alvarez & Hall, 2004; Hanmer & Traugott, 2004; Traugott, 2004). The State of Oregon
at REED COLLEGE LIBRARY on June 5, 2013apr.sagepub.comDownloaded from
Gronke and Miller 977
claims a savings of 30% by transitioning away from polling places (Bradbury, 2006). Whether or not VBM improves the quality of democratic deliberation is more difficult to assess,2 but it is clear that Oregonians like the system (Southwell, 1998, 2004; Southwell & Burchett, 1997). Nationwide opinion on the matter is more divided. The 2008 Survey of the Performance of Ameri-can Elections found just 14.7% of respondents supported running elections fully by mail (Alvarez et al., 2009), while, in a separate poll, a higher percent-age (43.5%) supported VBM only as one additional voting option (Milyo, Konisky, & Richardson, 2009).
The discipline has also been divided on the turnout effects of VBM. The classic rational choice theory of turnout suggests voting is an irrational activity; a single vote has virtually no chance of being pivotal in an election of any appreciable size (Downs, 1957). However, voters may participate in an election for other, expressive reasons related to a sense of civic duty (Riker & Ordeshook, 1968); in other words, voters “consume” voting (Fiorina, 1976). Aldrich’s (1993) thoughtful review of the rational choice approach to turnout notes that voting is a low-cost, low-benefit activity, and choosing to vote is a decision made “at the margin,” responsive to minor changes in the cost and benefits side of the equation. The implications are that election reforms will have, at best, minor effects on turnout, particularly in Federal contests, where variations in voter information and candidate and party mobilization efforts explain most of the variation in turnout (Hanmer, 2009; Rosenstone & Hansen, 1993).
One of the most influential pieces on the turnout effects of VBM is an article by Southwell and Burchett (2000). Southwell and Burchett explicitly adopt the classic model’s predictions regarding the turnout effect of VBM (Southwell & Burchett, 2000, p. 17). They report a 10 percentage point increase in participation among Oregon voters based on three VBM elec-tions in 1995 and 1996. This piece has received widespread attention since its publication. Reform advocates such as the Vote by Mail Project (http://votebymailproject.org), Washington Secretary of State Sam Reed, and Oregon Secretary of State Kate Brown have cited Southwell and Burchett’s results as an argument in favor of fully VBM elections.3
To date, however, there has been no attempt to replicate this result. We worry about the generalizability of Southwell and Burchett’s result for three reasons. First, Oregon has always been a high turnout state. The average level of turnout among all eligible citizens in Oregon, considering primary and general elections, rose from 56.5% in 1990-1998 to 63.3% in 2000-2008.4 This compares to national figures of 45.5% and 51.2% for the same periods.5 The methodological implication of this disparity is that studies of turnout that
at REED COLLEGE LIBRARY on June 5, 2013apr.sagepub.comDownloaded from
978 American Politics Research 40(6)
compare Oregon to other states may attribute the higher level of turnout to VBM, when it may in fact be a product of other features of Oregon’s demo-graphic makeup and political culture.
The second reason to wonder about the generalizability of the results is that the circumstances surrounding the first three vote-by-mail elections were unique. The primary (December 1995) and general (January 1996) Senate contests attracted considerable local and national media attention because they were special elections to replace a Senator, Bob Packwood, resigning during his term due to charges of sexual harassment and ethics violations. The March 1996 presidential preference primary was a “beauty contest” with no delegates at stake—the only time Oregon had ever held such a contest. These conditions raise the possibility that the high turnout in these elections was a function of the political circumstances of the three elections rather than a product of administrative reform.
Third, the 2000 paper needs to be reevaluated because Southwell herself has called it into question. In two recent articles Southwell reports variously that VBM has a statistically significant impact on turnout only in primaries and special elections (Southwell, 2009, p. 214) or only in special elections (Southwell, 2010, p. 110).6 Laying the three articles next to one another, the number of elections, specifications, and conclusions are difficult to reconcile. We remark more on these inconsistencies later, and believe that this provides a strong rationale for an independent reexamination of the results.
VBM remains a hot topic in the election reform community. Unlike in 2000, when only a small number of states had either full VBM or no-excuse absentee balloting, 30 states and the District of Columbia now have these systems,7 and legislation is regularly proposed in Congress that would man-date no-excuse absentee balloting for all federal elections.8 Scholars have noted that no-excuse absentee voting systems experience much higher “ballot leakage” (Stewart, 2011) and “residual vote” (Gronke, Stewart, & Hicks, 2010) rates, while other critics point to the use of absentee ballots as a way commit fraud (Fund, 2008; Minnite, 2010, for a contrasting view). Nationwide, voters who cast a ballot by mail express lower levels of confi-dence that their vote will be counted as cast (Alvarez, Hall, & Llewellyn, 2008), and even in Oregon and Washington, those who remain opposed to vote by mail have less confidence than supporters (Stewart, 2011). Given the ongoing controversy, it is critical that we understand as fully as possible the costs and consequences of this policy reform. Thus, this article seeks to rep-licate Southwell and Burchett’s findings, to extend the original analysis through the 2010 general election, and to test for the possibility of “novelty effects” in the first few VBM contests.
at REED COLLEGE LIBRARY on June 5, 2013apr.sagepub.comDownloaded from
Gronke and Miller 979
A Brief History of VBM in Oregon
Oregon adopted VBM as a local option in 1987. VBM was first used on a statewide basis to administer a 1993 special election.9 By 1996, debates over VBM were in full force, but state legislators were wary of changing the rules of the electoral game. For elections officials, such as Secretary of State Phil Keisling, administering a “two-track” election system had become an administrative headache. Well over 80% of Oregonians were already voting via the absentee ballot, and Keisling (among others) saw no reason not to switch to a fully VBM system. The resignation of Senator Packwood gave Keisling the opportunity he needed; he ruled by adminis-trative decree that the statewide elections to replace Packwood would be conducted entirely by mail. Furthermore, because the 1996 presidential primary in Oregon was a “beauty contest” that did not allocate delegates, Keisling also had the authority to administer this election by mail. Thus, the first elections for a candidate for public office administered by mail were (a) the special Senate primary in December 1995, (b) a special Senate general election in January 1996, and (c) a presidential preference contest in March 1996. After two unsuccessful attempts by the state legislature to implement the reform, VBM was adopted for all elections after the citi-zenry passed Measure 60 in November 1998.
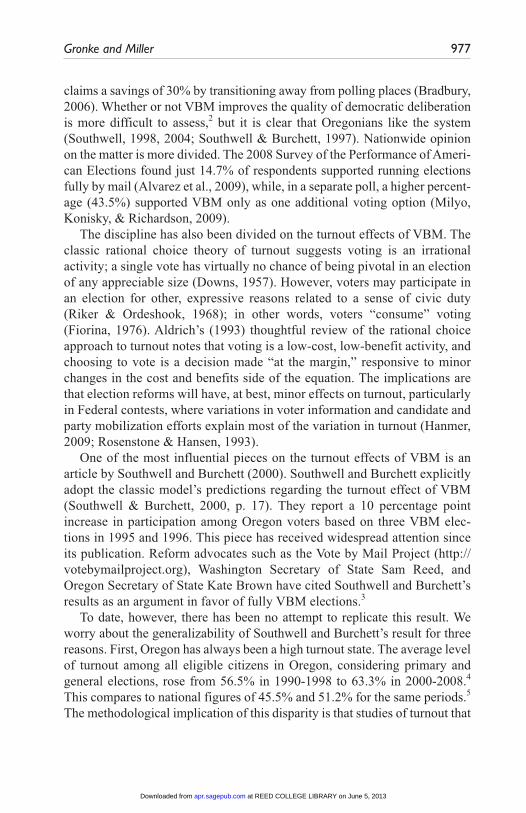
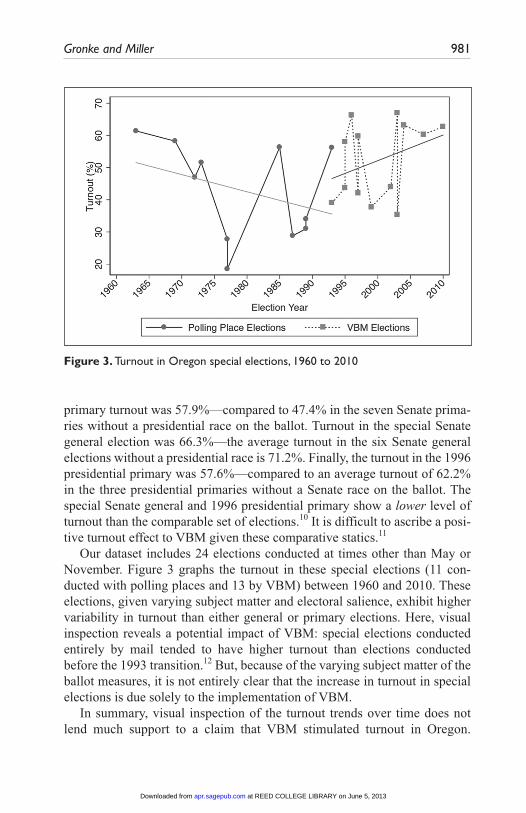
A first cut at assessing the role of VBM in boosting turnout is a simple visual inspection of turnout trends, and this does not lend much support to the claim that VBM boosted turnout. Figure 1 displays turnout rates in general elections in Oregon from 1960 to 2010. The vertical line at 1998 indicates when VBM was adopted for all statewide races. The January 1996 special Senate election—with the third lowest rate of voter turnout among the elections in the figure—is also indicated in relation to other elections in the time period. The best-fit lines indicate turnout in presidential and midterm election years has remained fairly stable at 81% and 71%, respectively, since 1960. The special Senate election sits, relative to the best-fit lines, slightly below the average turnout in midterm elections.
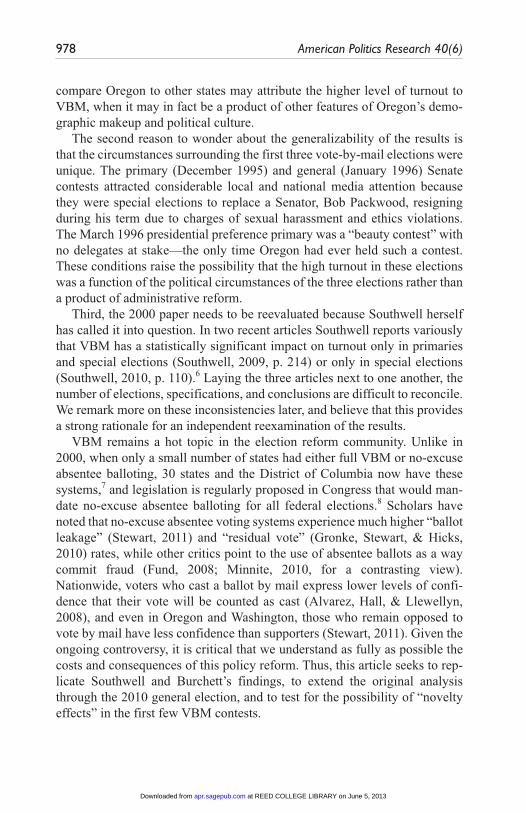
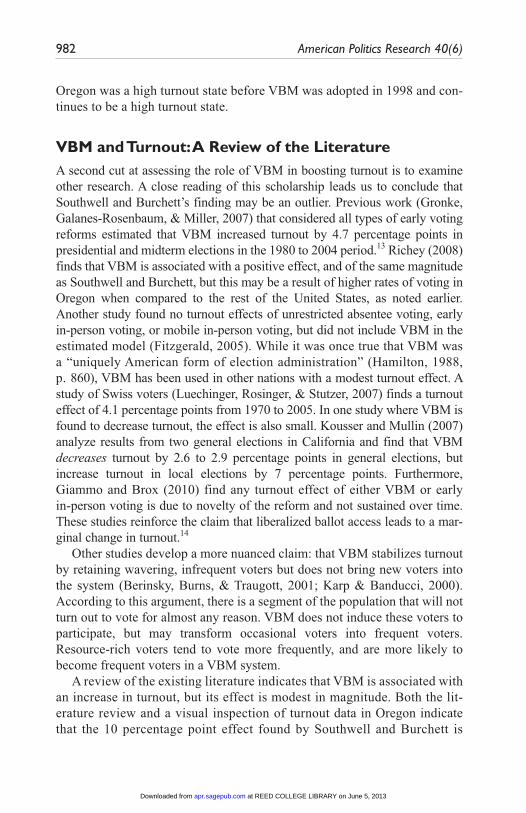
Figure 2 displays turnout rates for primary elections, the special Senate primary, and the 1996 presidential primary for the same time period. Voter turnout in these elections has steadily declined over time. This figure high-lights the distinctiveness of the 1995 Senate primary and 1996 presidential beauty contest, both of which deviate substantially from the trend line as well as the most proximate primary elections. The adoption of VBM does not appear to have affected the trend appreciably, although the 2008 primary election had about the same level of voter participation as the 1996 presiden-tial primary (58.3% and 57.6%, respectively).
at REED COLLEGE LIBRARY on June 5, 2013apr.sagepub.comDownloaded from
980 American Politics Research 40(6)
Figure 1. Turnout in Oregon general elections, 1960 to 2010
Figure 2. Turnout in Oregon primary elections, 1960 to 2010
One simple method to examine the link between turnout and VBM is to compare turnout in the first three VBM elections with average turnout in comparable elections from the 1960 to 1996 period. In the special Senate
at REED COLLEGE LIBRARY on June 5, 2013apr.sagepub.comDownloaded from
Gronke and Miller 981
primary turnout was 57.9%—compared to 47.4% in the seven Senate prima-ries without a presidential race on the ballot. Turnout in the special Senate general election was 66.3%—the average turnout in the six Senate general elections without a presidential race is 71.2%. Finally, the turnout in the 1996 presidential primary was 57.6%—compared to an average turnout of 62.2% in the three presidential primaries without a Senate race on the ballot. The special Senate general and 1996 presidential primary show a lower level of turnout than the comparable set of elections.10 It is difficult to ascribe a posi-tive turnout effect to VBM given these comparative statics.11
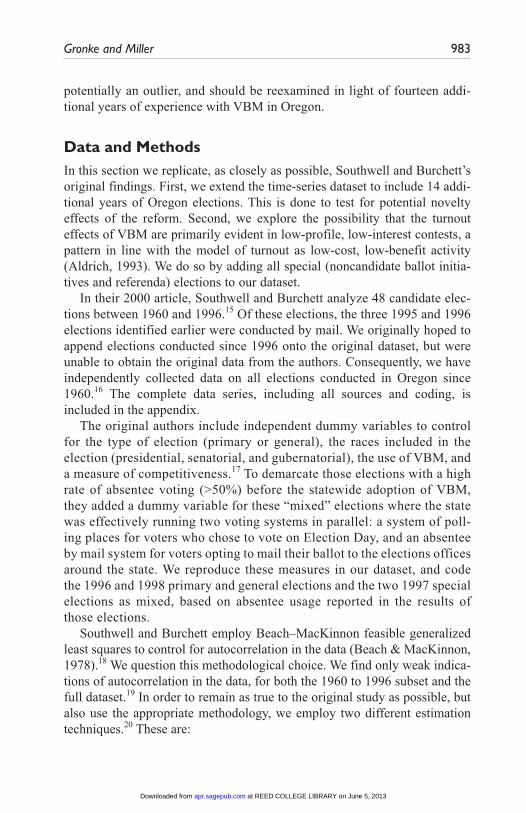
Our dataset includes 24 elections conducted at times other than May or November. Figure 3 graphs the turnout in these special elections (11 con-ducted with polling places and 13 by VBM) between 1960 and 2010. These elections, given varying subject matter and electoral salience, exhibit higher variability in turnout than either general or primary elections. Here, visual inspection reveals a potential impact of VBM: special elections conducted entirely by mail tended to have higher turnout than elections conducted before the 1993 transition.12 But, because of the varying subject matter of the ballot measures, it is not entirely clear that the increase in turnout in special elections is due solely to the implementation of VBM.
In summary, visual inspection of the turnout trends over time does not lend much support to a claim that VBM stimulated turnout in Oregon.
Figure 3. Turnout in Oregon special elections, 1960 to 2010
at REED COLLEGE LIBRARY on June 5, 2013apr.sagepub.comDownloaded from
982 American Politics Research 40(6)
Oregon was a high turnout state before VBM was adopted in 1998 and con-tinues to be a high turnout state.
VBM and Turnout: A Review of the LiteratureA second cut at assessing the role of VBM in boosting turnout is to examine other research. A close reading of this scholarship leads us to conclude that Southwell and Burchett’s finding may be an outlier. Previous work (Gronke, Galanes-Rosenbaum, & Miller, 2007) that considered all types of early voting reforms estimated that VBM increased turnout by 4.7 percentage points in presidential and midterm elections in the 1980 to 2004 period.13 Richey (2008) finds that VBM is associated with a positive effect, and of the same magnitude as Southwell and Burchett, but this may be a result of higher rates of voting in Oregon when compared to the rest of the United States, as noted earlier. Another study found no turnout effects of unrestricted absentee voting, early in-person voting, or mobile in-person voting, but did not include VBM in the estimated model (Fitzgerald, 2005). While it was once true that VBM was a “uniquely American form of election administration” (Hamilton, 1988, p. 860), VBM has been used in other nations with a modest turnout effect. A study of Swiss voters (Luechinger, Rosinger, & Stutzer, 2007) finds a turnout effect of 4.1 percentage points from 1970 to 2005. In one study where VBM is found to decrease turnout, the effect is also small. Kousser and Mullin (2007) analyze results from two general elections in California and find that VBM decreases turnout by 2.6 to 2.9 percentage points in general elections, but increase turnout in local elections by 7 percentage points. Furthermore, Giammo and Brox (2010) find any turnout effect of either VBM or early in-person voting is due to novelty of the reform and not sustained over time. These studies reinforce the claim that liberalized ballot access leads to a mar-ginal change in turnout.14
Other studies develop a more nuanced claim: that VBM stabilizes turnout by retaining wavering, infrequent voters but does not bring new voters into the system (Berinsky, Burns, & Traugott, 2001; Karp & Banducci, 2000). According to this argument, there is a segment of the population that will not turn out to vote for almost any reason. VBM does not induce these voters to participate, but may transform occasional voters into frequent voters. Resource-rich voters tend to vote more frequently, and are more likely to become frequent voters in a VBM system.
A review of the existing literature indicates that VBM is associated with an increase in turnout, but its effect is modest in magnitude. Both the lit-erature review and a visual inspection of turnout data in Oregon indicate that the 10 percentage point effect found by Southwell and Burchett is
at REED COLLEGE LIBRARY on June 5, 2013apr.sagepub.comDownloaded from
Gronke and Miller 983
potentially an outlier, and should be reexamined in light of fourteen addi-tional years of experience with VBM in Oregon.
Data and MethodsIn this section we replicate, as closely as possible, Southwell and Burchett’s original findings. First, we extend the time-series dataset to include 14 addi-tional years of Oregon elections. This is done to test for potential novelty effects of the reform. Second, we explore the possibility that the turnout effects of VBM are primarily evident in low-profile, low-interest contests, a pattern in line with the model of turnout as low-cost, low-benefit activity (Aldrich, 1993). We do so by adding all special (noncandidate ballot initia-tives and referenda) elections to our dataset.
In their 2000 article, Southwell and Burchett analyze 48 candidate elec-tions between 1960 and 1996.15 Of these elections, the three 1995 and 1996 elections identified earlier were conducted by mail. We originally hoped to append elections conducted since 1996 onto the original dataset, but were unable to obtain the original data from the authors. Consequently, we have independently collected data on all elections conducted in Oregon since 1960.16 The complete data series, including all sources and coding, is included in the appendix.
The original authors include independent dummy variables to control for the type of election (primary or general), the races included in the election (presidential, senatorial, and gubernatorial), the use of VBM, and a measure of competitiveness.17 To demarcate those elections with a high rate of absentee voting (>50%) before the statewide adoption of VBM, they added a dummy variable for these “mixed” elections where the state was effectively running two voting systems in parallel: a system of poll-ing places for voters who chose to vote on Election Day, and an absentee by mail system for voters opting to mail their ballot to the elections offices around the state. We reproduce these measures in our dataset, and code the 1996 and 1998 primary and general elections and the two 1997 special elections as mixed, based on absentee usage reported in the results of those elections.
Southwell and Burchett employ Beach–MacKinnon feasible generalized least squares to control for autocorrelation in the data (Beach & MacKinnon, 1978).18 We question this methodological choice. We find only weak indica-tions of autocorrelation in the data, for both the 1960 to 1996 subset and the full dataset.19 In order to remain as true to the original study as possible, but also use the appropriate methodology, we employ two different estimation techniques.20 These are:
at REED COLLEGE LIBRARY on June 5, 2013apr.sagepub.comDownloaded from
984 American Politics Research 40(6)
1. Ordinary least squares2. Models estimated via Prais–Winsten (AR[1])
Prais–Winsten should replicate the FGLS results of Southwell and Burchett. To make certain that we are estimating the same model using the same data, as well as to test our hypotheses, we report estimates for two sepa-rate datasets:
1. Data from 1960 to 1996 as originally reported by Southwell and Burchett
2. Data from 1960 to 2010 (including special elections)
We then broaden the scope of the analysis to include a study of all state-wide elections during the 1960 to 2010 period, including special elections (all ballot referrals and initiatives). While these variations are relatively elabo-rate, we think these are essential in order to fairly replicate the original analy-sis, account for the likely lower turnout in special elections, and to isolate any potential novelty effects of VBM.
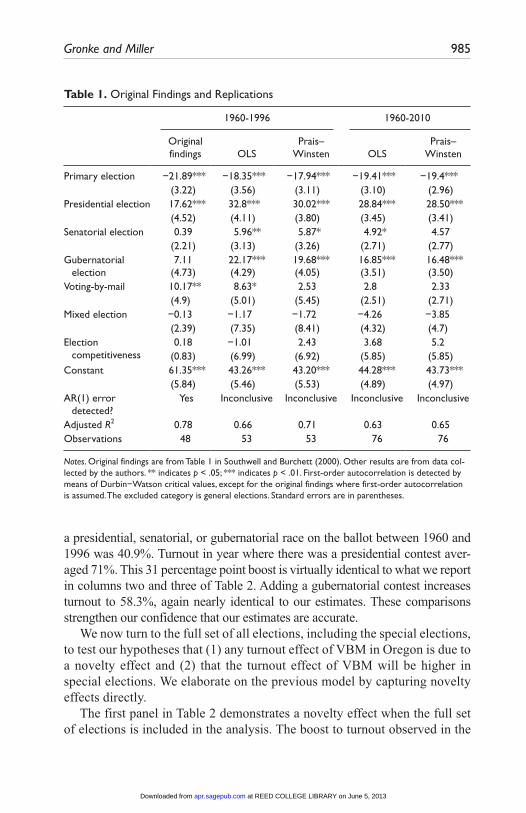
Replication ResultsThe findings of Southwell and Burchett and our replication of the 1960 to 1996 and 1960 to 2010 data are shown in Table 1. The most direct compari-son, we believe, is between column one and column three—Southwell and Burchett’s table 1 and our Prais–Winsten estimates for the same period. Two things are evident from this first set of results. First, we are unable to fully replicate Southwell and Burchett’s findings. The OLS results are closest to their estimates, but the Prais–Winsten estimation, which should replicate their FGLS results, produces only a small and statistically indiscernible impact of VBM on turnout. Using the full dataset, we continue to find a nonsignificant impact of VBM on turnout.
Our inability to replicate the original finding is troubling. We and the orig-inal authors are working from the same set of data—Oregon electoral statis-tics since 1960—but our findings, in large part, refute the original claim that VBM increases turnout.
It is possible, of course, that we have misunderstood or misestimated the model in some way—the different observation counts may indicate as much—but a manual inspection of the data series from this period provides support for our model and casts further doubt on the original estimation (because all the variables other than election competitiveness are dummy variables, making these comparisons is straightforward). The average turnout in elections without
at REED COLLEGE LIBRARY on June 5, 2013apr.sagepub.comDownloaded from
Gronke and Miller 985
a presidential, senatorial, or gubernatorial race on the ballot between 1960 and 1996 was 40.9%. Turnout in year where there was a presidential contest aver-aged 71%. This 31 percentage point boost is virtually identical to what we report in columns two and three of Table 2. Adding a gubernatorial contest increases turnout to 58.3%, again nearly identical to our estimates. These comparisons strengthen our confidence that our estimates are accurate.
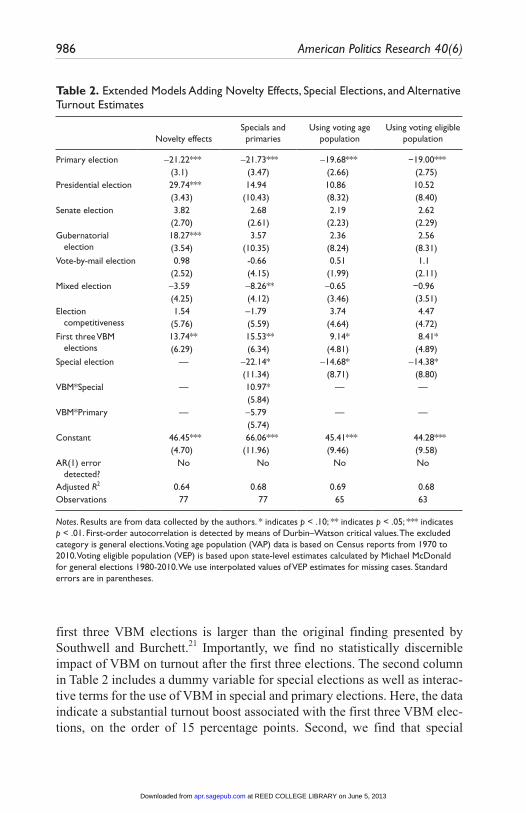
We now turn to the full set of all elections, including the special elections, to test our hypotheses that (1) any turnout effect of VBM in Oregon is due to a novelty effect and (2) that the turnout effect of VBM will be higher in special elections. We elaborate on the previous model by capturing novelty effects directly.
The first panel in Table 2 demonstrates a novelty effect when the full set of elections is included in the analysis. The boost to turnout observed in the
Table 1. Original Findings and Replications
1960-1996 1960-2010
Original findings OLS
Prais–Winsten OLS
Prais–Winsten
Primary election −21.89*** −18.35*** −17.94*** −19.41*** −19.4*** (3.22) (3.56) (3.11) (3.10) (2.96)Presidential election 17.62*** 32.8*** 30.02*** 28.84*** 28.50*** (4.52) (4.11) (3.80) (3.45) (3.41)Senatorial election 0.39 5.96** 5.87* 4.92* 4.57 (2.21) (3.13) (3.26) (2.71) (2.77)Gubernatorial
election 7.11
(4.73)22.17***(4.29)
19.68***(4.05)
16.85***(3.51)
16.48***(3.50)
Voting-by-mail 10.17** 8.63* 2.53 2.8 2.33 (4.9) (5.01) (5.45) (2.51) (2.71)Mixed election −0.13 −1.17 −1.72 −4.26 −3.85 (2.39) (7.35) (8.41) (4.32) (4.7)Election
competitiveness 0.18 −1.01 2.43 3.68 5.2
(0.83) (6.99) (6.92) (5.85) (5.85)Constant 61.35*** 43.26*** 43.20*** 44.28*** 43.73*** (5.84) (5.46) (5.53) (4.89) (4.97)AR(1) error
detected?Yes Inconclusive Inconclusive Inconclusive Inconclusive
Adjusted R2 0.78 0.66 0.71 0.63 0.65Observations 48 53 53 76 76
Notes. Original findings are from Table 1 in Southwell and Burchett (2000). Other results are from data col-lected by the authors. ** indicates p < .05; *** indicates p < .01. First-order autocorrelation is detected by means of Durbin−Watson critical values, except for the original findings where first-order autocorrelation is assumed. The excluded category is general elections. Standard errors are in parentheses.
at REED COLLEGE LIBRARY on June 5, 2013apr.sagepub.comDownloaded from
986 American Politics Research 40(6)
Table 2. Extended Models Adding Novelty Effects, Special Elections, and Alternative Turnout Estimates
Novelty effectsSpecials and primaries
Using voting age population
Using voting eligible population
Primary election −21.22*** −21.73*** −19.68*** −19.00*** (3.1) (3.47) (2.66) (2.75)Presidential election 29.74*** 14.94 10.86 10.52 (3.43) (10.43) (8.32) (8.40)Senate election 3.82 2.68 2.19 2.62 (2.70) (2.61) (2.23) (2.29)Gubernatorial
election 18.27*** 3.57 2.36 2.56(3.54) (10.35) (8.24) (8.31)
Vote-by-mail election 0.98 -0.66 0.51 1.1 (2.52) (4.15) (1.99) (2.11)Mixed election −3.59 −8.26** −0.65 −0.96 (4.25) (4.12) (3.46) (3.51)Election
competitiveness 1.54 −1.79 3.74 4.47
(5.76) (5.59) (4.64) (4.72)First three VBM
elections 13.74** 15.53** 9.14* 8.41*(6.29) (6.34) (4.81) (4.89)
Special election — −22.14* −14.68* −14.38* (11.34) (8.71) (8.80)VBM*Special — 10.97* — — (5.84) VBM*Primary — −5.79 — — (5.74) Constant 46.45*** 66.06*** 45.41*** 44.28*** (4.70) (11.96) (9.46) (9.58)AR(1) error
detected?No No No No
Adjusted R2 0.64 0.68 0.69 0.68Observations 77 77 65 63
Notes. Results are from data collected by the authors. * indicates p < .10; ** indicates p < .05; *** indicates p < .01. First-order autocorrelation is detected by means of Durbin–Watson critical values. The excluded category is general elections. Voting age population (VAP) data is based on Census reports from 1970 to 2010. Voting eligible population (VEP) is based upon state-level estimates calculated by Michael McDonald for general elections 1980-2010. We use interpolated values of VEP estimates for missing cases. Standard errors are in parentheses.
first three VBM elections is larger than the original finding presented by Southwell and Burchett.21 Importantly, we find no statistically discernible impact of VBM on turnout after the first three elections. The second column in Table 2 includes a dummy variable for special elections as well as interac-tive terms for the use of VBM in special and primary elections. Here, the data indicate a substantial turnout boost associated with the first three VBM elec-tions, on the order of 15 percentage points. Second, we find that special
at REED COLLEGE LIBRARY on June 5, 2013apr.sagepub.comDownloaded from
Gronke and Miller 987
elections (importantly, not including the two special Senate elections) display turnout 22 percentage points below the average general election. It is in the specials where we find a notable impact of VBM, reducing the turnout decline by about 11 percentage points. These effects are maintained regardless of whether we use OLS or Prais–Winsten.
Thus far, we have operationalized turnout as the proportion of registered voters casting a ballot. A second common conceptualization of turnout is based on the voting-age population, regardless of registration status. Other scholars have developed a third measure of turnout, measuring the “voting eligible” population that participates in an election (McDonald & Popkin, 2001). There is some reason to conclude an alternate measure of turnout may be appropriate in Oregon, as registered Democratic voters are more likely to be moved to the list of inactive voters by Republican election officials than fellow Republican voters (Dyck & Seabrook, 2009). To test the robustness of our results thus far, we estimate two additional models of turnout in Oregon using voting-age and voting-eligible population estimates. Table 2 includes these results. These results do not differ greatly from our main argument, that VBM has not increased turnout in Oregon.
ConclusionSince the election debacle of 2000, election administration in the United States has come under scrutiny by advocates, academics, and legislators at both the state and federal levels. One commonly suggested reform is VBM. Following the lead of Oregon, VBM will, its supporters claim, lower costs, improve efficiency, and increase voter turnout. We have focused on this last claim, attempting to replicate and extend one of the most commonly cited results, Southwell and Burchett’s (2000) article showing a 10 percentage point boost in turnout after the adoption of VBM.
We examined the result in three ways. First, we provided graphical displays of turnout in Oregon. Visual inspection revealed that the first three VBM elections were clearly outliers from long-term trends in turnout in the state. Second, we reviewed other academic studies of VBM, most of which showed a significant but small (2% to 4%) bump in turnout. Finally, we attempted as best we could to replicate and extend the results. Our analytical results demonstrated that the origi-nal 10 percentage point finding was a consequence of a novelty effect of the first three VBM contests and was not a long-term effect of the new voting system. Our final analysis shows that any turnout effects of VBM are most likely limited to subfederal contests, precisely where voter interest is lowest and the relative impact of a minor lowering of the costs of voting would be greatest.
at REED COLLEGE LIBRARY on June 5, 2013apr.sagepub.comDownloaded from
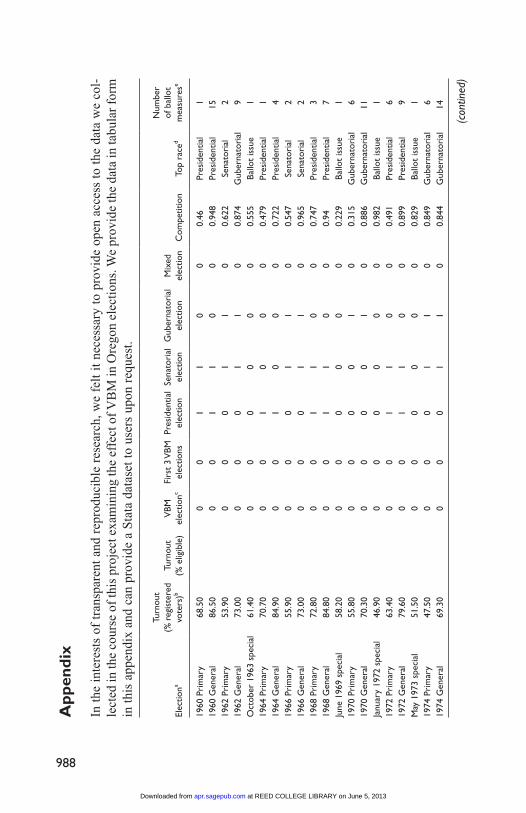
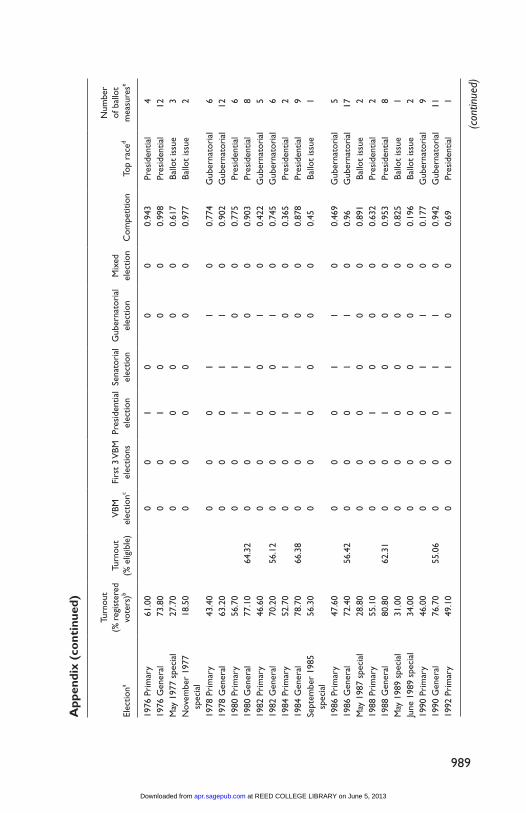
988
App
endi
x
In t
he i
nter
ests
of
tran
spar
ent
and
repr
oduc
ible
res
earc
h, w
e fe
lt i
t ne
cess
ary
to p
rovi
de o
pen
acce
ss t
o th
e da
ta w
e co
l-le
cted
in th
e co
urse
of
this
pro
ject
exa
min
ing
the
effe
ct o
f VB
M in
Ore
gon
elec
tion
s. W
e pr
ovid
e th
e da
ta in
tabu
lar
form
in
this
app
endi
x an
d ca
n pr
ovid
e a
Sta
ta d
atas
et to
use
rs u
pon
requ
est.
Elec
tiona
Turn
out
(%
reg
iste
red
vote
rs)b
Turn
out
(%
elig
ible
)V
BM
elec
tionc
Firs
t 3
VBM
el
ectio
nsPr
esid
entia
l el
ectio
nSe
nato
rial
el
ectio
nG
uber
nato
rial
el
ectio
nM
ixed
el
ectio
nC
ompe
titio
nTo
p ra
ced
Num
ber
of b
allo
t m
easu
rese
1960
Pri
mar
y68
.50
00
11
00
0.46
Pres
iden
tial
119
60 G
ener
al86
.50
00
11
00
0.94
8Pr
esid
entia
l15
1962
Pri
mar
y53
.90
00
01
10
0.62
2Se
nato
rial
219
62 G
ener
al73
.00
00
01
10
0.87
4G
uber
nato
rial
9O
ctob
er 1
963
spec
ial
61.4
00
00
00
00.
555
Ballo
t is
sue
119
64 P
rim
ary
70.7
00
01
00
00.
479
Pres
iden
tial
119
64 G
ener
al84
.90
00
10
00
0.72
2Pr
esid
entia
l4
1966
Pri
mar
y55
.90
00
01
10
0.54
7Se
nato
rial
219
66 G
ener
al73
.00
00
01
10
0.96
5Se
nato
rial
219
68 P
rim
ary
72.8
00
01
10
00.
747
Pres
iden
tial
319
68 G
ener
al84
.80
00
11
00
0.94
Pres
iden
tial
7Ju
ne 1
969
spec
ial
58.2
00
00
00
00.
229
Ballo
t is
sue
119
70 P
rim
ary
55.8
00
00
01
00.
315
Gub
erna
tori
al6
1970
Gen
eral
70.3
00
00
01
00.
886
Gub
erna
tori
al11
Janu
ary
1972
spe
cial
46.9
00
00
00
00.
982
Ballo
t is
sue
119
72 P
rim
ary
63.4
00
01
10
00.
491
Pres
iden
tial
619
72 G
ener
al79
.60
00
11
00
0.89
9Pr
esid
entia
l9
May
197
3 sp
ecia
l51
.50
00
00
00
0.82
9Ba
llot
issu
e1
1974
Pri
mar
y47
.50
00
01
10
0.84
9G
uber
nato
rial
619
74 G
ener
al69
.30
00
01
10
0.84
4G
uber
nato
rial
14
(con
tined
)
at REED COLLEGE LIBRARY on June 5, 2013apr.sagepub.comDownloaded from
989
Elec
tiona
Turn
out
(%
reg
iste
red
vote
rs)b
Turn
out
(%
elig
ible
)V
BM
elec
tionc
Firs
t 3
VBM
el
ectio
nsPr
esid
entia
l el
ectio
nSe
nato
rial
el
ectio
nG
uber
nato
rial
el
ectio
nM
ixed
el
ectio
nC
ompe
titio
nTo
p ra
ced
Num
ber
of b
allo
t m
easu
rese
1976
Pri
mar
y61
.00
00
10
00
0.94
3Pr
esid
entia
l4
1976
Gen
eral
73.8
00
01
00
00.
998
Pres
iden
tial
12M
ay 1
977
spec
ial
27.7
00
00
00
00.
617
Ballo
t is
sue
3N
ovem
ber
1977
sp
ecia
l18
.50
00
00
00
0.97
7Ba
llot
issu
e2
1978
Pri
mar
y43
.40
00
01
10
0.77
4G
uber
nato
rial
619
78 G
ener
al63
.20
00
01
10
0.90
2G
uber
nato
rial
1219
80 P
rim
ary
56.7
00
01
10
00.
775
Pres
iden
tial
619
80 G
ener
al77
.10
64.3
20
01
10
00.
903
Pres
iden
tial
819
82 P
rim
ary
46.6
00
00
01
00.
422
Gub
erna
tori
al5
1982
Gen
eral
70.2
056
.12
00
00
10
0.74
5G
uber
nato
rial
619
84 P
rim
ary
52.7
00
01
10
00.
365
Pres
iden
tial
219
84 G
ener
al78
.70
66.3
80
01
10
00.
878
Pres
iden
tial
9Se
ptem
ber
1985
sp
ecia
l56
.30
00
00
00
0.45
Ballo
t is
sue
1
1986
Pri
mar
y47
.60
00
01
10
0.46
9G
uber
nato
rial
519
86 G
ener
al72
.40
56.4
20
00
11
00.
96G
uber
nato
rial
17M
ay 1
987
spec
ial
28.8
00
00
00
00.
891
Ballo
t is
sue
219
88 P
rim
ary
55.1
00
01
00
00.
632
Pres
iden
tial
219
88 G
ener
al80
.80
62.3
10
01
00
00.
953
Pres
iden
tial
8M
ay 1
989
spec
ial
31.0
00
00
00
00.
825
Ballo
t is
sue
1Ju
ne 1
989
spec
ial
34.0
00
00
00
00.
196
Ballo
t is
sue
219
90 P
rim
ary
46.0
00
00
11
00.
177
Gub
erna
tori
al9
1990
Gen
eral
76.7
055
.06
00
01
10
0.94
2G
uber
nato
rial
1119
92 P
rim
ary
49.1
00
01
10
00.
69Pr
esid
entia
l1
(con
tinue
d)
App
endi
x (c
ont
inue
d)
at REED COLLEGE LIBRARY on June 5, 2013apr.sagepub.comDownloaded from
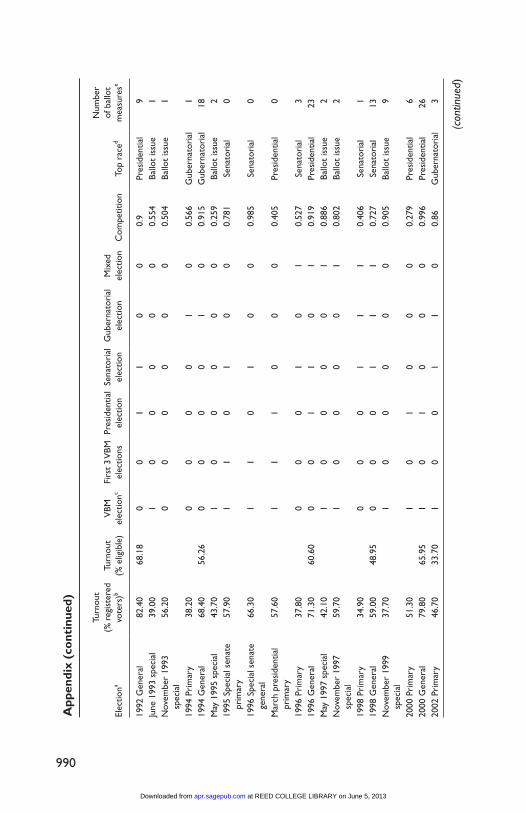
990
Elec
tiona
Turn
out
(%
reg
iste
red
vote
rs)b
Turn
out
(%
elig
ible
)V
BM
elec
tionc
Firs
t 3
VBM
el
ectio
nsPr
esid
entia
l el
ectio
nSe
nato
rial
el
ectio
nG
uber
nato
rial
el
ectio
nM
ixed
el
ectio
nC
ompe
titio
nTo
p ra
ced
Num
ber
of b
allo
t m
easu
rese
1992
Gen
eral
82.4
068
.18
00
11
00
0.9
Pres
iden
tial
9Ju
ne 1
993
spec
ial
39.0
01
00
00
00.
554
Ballo
t is
sue
1N
ovem
ber
1993
sp
ecia
l56
.20
00
00
00
0.50
4Ba
llot
issu
e1
1994
Pri
mar
y38
.20
00
00
10
0.56
6G
uber
nato
rial
119
94 G
ener
al68
.40
56.2
60
00
01
00.
915
Gub
erna
tori
al18
May
199
5 sp
ecia
l43
.70
10
00
00
0.25
9Ba
llot
issu
e2
1995
Spe
cial
sen
ate
prim
ary
57.9
01
10
10
00.
781
Sena
tori
al0
1996
Spe
cial
sen
ate
gene
ral
66.3
01
10
10
00.
985
Sena
tori
al0
Mar
ch p
resi
dent
ial
prim
ary
57.6
01
11
00
00.
405
Pres
iden
tial
0
1996
Pri
mar
y37
.80
00
01
01
0.52
7Se
nato
rial
319
96 G
ener
al71
.30
60.6
00
01
10
10.
919
Pres
iden
tial
23M
ay 1
997
spec
ial
42.1
01
00
00
10.
886
Ballo
t is
sue
2N
ovem
ber
1997
sp
ecia
l59
.70
10
00
01
0.80
2Ba
llot
issu
e2
1998
Pri
mar
y34
.90
00
01
11
0.40
6Se
nato
rial
119
98 G
ener
al59
.00
48.9
50
00
11
10.
727
Sena
tori
al13
Nov
embe
r 19
99
spec
ial
37.7
01
00
00
00.
905
Ballo
t is
sue
9
2000
Pri
mar
y51
.30
10
10
00
0.27
9Pr
esid
entia
l6
2000
Gen
eral
79.8
065
.95
10
10
00
0.99
6Pr
esid
entia
l26
2002
Pri
mar
y46
.70
33.7
01
00
11
00.
86G
uber
nato
rial
3
App
endi
x (c
ont
inue
d)
(con
tinue
d)
at REED COLLEGE LIBRARY on June 5, 2013apr.sagepub.comDownloaded from
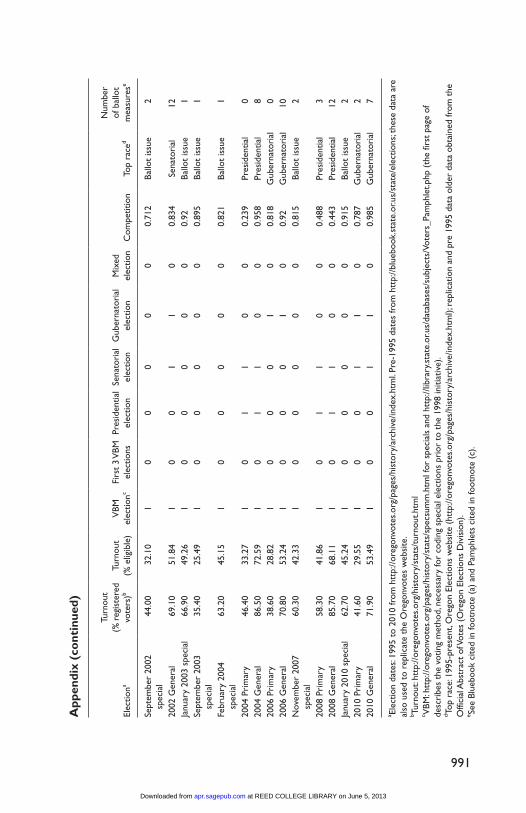
991
Elec
tiona
Turn
out
(%
reg
iste
red
vote
rs)b
Turn
out
(%
elig
ible
)V
BM
elec
tionc
Firs
t 3
VBM
el
ectio
nsPr
esid
entia
l el
ectio
nSe
nato
rial
el
ectio
nG
uber
nato
rial
el
ectio
nM
ixed
el
ectio
nC
ompe
titio
nTo
p ra
ced
Num
ber
of b
allo
t m
easu
rese
Sept
embe
r 20
02
spec
ial
44.0
032
.10
10
00
00
0.71
2Ba
llot
issu
e2
2002
Gen
eral
69.1
051
.84
10
01
10
0.83
4Se
nato
rial
12Ja
nuar
y 20
03 s
peci
al66
.90
49.2
61
00
00
00.
92Ba
llot
issu
e1
Sept
embe
r 20
03
spec
ial
35.4
025
.49
10
00
00
0.89
5Ba
llot
issu
e1
Febr
uary
200
4 sp
ecia
l63
.20
45.1
51
00
00
00.
821
Ballo
t is
sue
1
2004
Pri
mar
y46
.40
33.2
71
01
10
00.
239
Pres
iden
tial
020
04 G
ener
al86
.50
72.5
91
01
10
00.
958
Pres
iden
tial
820
06 P
rim
ary
38.6
028
.82
10
00
10
0.81
8G
uber
nato
rial
020
06 G
ener
al70
.80
53.2
41
00
01
00.
92G
uber
nato
rial
10N
ovem
ber
2007
sp
ecia
l60
.30
42.3
31
00
00
00.
815
Ballo
t is
sue
2
2008
Pri
mar
y58
.30
41.8
61
01
10
00.
488
Pres
iden
tial
320
08 G
ener
al85
.70
68.1
11
01
10
00.
443
Pres
iden
tial
12Ja
nuar
y 20
10 s
peci
al62
.70
45.2
41
00
00
00.
915
Ballo
t is
sue
220
10 P
rim
ary
41.6
029
.55
10
01
10
0.78
7G
uber
nato
rial
220
10 G
ener
al71
.90
53.4
91
00
11
00.
985
Gub
erna
tori
al7
a Elec
tion
date
s: 19
95 t
o 20
10 fr
om h
ttp:
//ore
gonv
otes
.org
/pag
es/h
isto
ry/a
rchi
ve/in
dex.
htm
l. Pr
e-19
95 d
ates
from
htt
p://b
lueb
ook.
stat
e.or
.us/
stat
e/el
ectio
ns; t
hese
dat
a ar
e al
so u
sed
to r
eplic
ate
the
Ore
gonv
otes
web
site
.b Tu
rnou
t: ht
tp://
oreg
onvo
tes.
org/
hist
ory/
stat
s/tu
rnou
t.htm
lc V
BM: h
ttp:
//ore
gonv
otes
.org
/pag
es/h
isto
ry/s
tats
/spe
csum
m.h
tml f
or s
peci
als
and
http
://lib
rary
.sta
te.o
r.us/
data
base
s/su
bjec
ts/V
oter
s_Pa
mph
let.p
hp (
the
first
pag
e of
de
scri
bes
the
votin
g m
etho
d, n
eces
sary
for
codi
ng s
peci
al e
lect
ions
pri
or t
o th
e 19
98 in
itiat
ive)
.d To
p ra
ce: 1
995-
pres
ent,
Ore
gon
Elec
tions
web
site
(ht
tp://
oreg
onvo
tes.
org/
page
s/hi
stor
y/ar
chiv
e/in
dex.
htm
l); r
eplic
atio
n an
d pr
e 19
95 d
ata
olde
r da
ta o
btai
ned
from
the
O
ffici
al A
bstr
act
of V
otes
(O
rego
n El
ectio
ns D
ivis
ion)
.e Se
e Bl
uebo
ok c
ited
in fo
otno
te (
a) a
nd P
amph
lets
cite
d in
foot
note
(c)
.
App
endi
x (c
ont
inue
d)
at REED COLLEGE LIBRARY on June 5, 2013apr.sagepub.comDownloaded from
992 American Politics Research 40(6)
Declaration of Conflicting InterestsThe authors declared no potential conflicts of interest with respect to the research, authorship, and/or publication of this article.
FundingThe authors received no financial support for the research, authorship, and/or publica-tion of this article.
Notes
1. It should be noted that not all “mail” ballots are necessarily returned by mail and not all ballots are cast “early.” In Oregon, between 15% and 25% of ballots are dropped off by hand on election day, and there is no tracking of how many ballots are dropped off in satellite locations such as public libraries.
2. Thompson (2004, 2008) claims that early voting is associated with a dilution of civic engagement. Conversely, Richey (2005) finds that voting by mail increases the level of political discussion, but this study is limited to just 1998 and 2000, and we have not found any other studies of this type.
3. The piece is the first article returned on a Google Scholar search of “vote-by-mail turnout” and has been cited 79 times. Search conducted on March 16, 2012.
4. Voting by mail was adopted on an experimental basis for two special elections in 1995 and 1996 and for a presidential preference primary in 1996. In 1998, voting by mail was adopted statewide by referendum. The figures reported here are for 1990 to 1998 for “before adoption” and 2000 to 2008 for “after adoption.” The magnitude of the change is similar if calculated for other periods.
5. Percentages calculated from voting eligible population figures are available at: http://elections.gmu.edu/voter_turnout.htm.
6. Southwell does note a “boost to turnout in presidential elections as a result of VBM (that) is somewhat remarkable” (Southwell, 2010, p. 111) and goes on to speculate that this may be due to the removal of the “bad day” phenomenon for habitual voters. The explanation does not work on two counts. First, theoreti-cally, a “bad day” phenomenon, if there is such an effect, would be more evident in midterm elections, where voter enthusiasm is generally lower, yet the results show a 15.5% decline in midterm turnout after the implementation of VBM. Second, the absolute effect of VBM, given a dummy variable specification, is the difference between the coefficient in non-VBM elections (0.174) and in VBM elections (0.263). It is not clear if Southwell was interpreting that difference as “remarkable,” but the result, 0.089, is statistically indiscernible from zero given the reported standard errors (Southwell, 2010, Table 2, p. 110).
at REED COLLEGE LIBRARY on June 5, 2013apr.sagepub.comDownloaded from
Gronke and Miller 993
7. A list of states with no-excuse absentee and fully VBM is available from the National Conference of State Legislatures’ “Absentee and Early Voting” page, http://www.ncsl.org/default.aspx?tabid=16604, accessed April 20, 2011.
8. The Voter Confidence and Increased Accessibility Act of 2009 (HR 2239), the Universal Right to Vote by Mail Act of 2009 (HR 1604) and the Universal Right to Vote by Mail Act of 2010 (S.3299) are three examples of Congres-sional action aiming to expand no-excuse absentee voting to all voters in the United States.
9. By “special election” we mean an election conducted at a time other than the regularly scheduled May primary and November general elections. Typically these special elections are called to put ballot measures (variously referred to as initiatives, referenda, or petitions) before the electorate. The 1995/1996 elections to replace Senator Bob Packwood and the “beauty contest” in March 1996 for the presidential primary are unique exceptions to this rule.
10. The seven Senate primaries without a presidential race are 1962, 1966, 1974, 1978, 1986, 1990, and 1996. The six Senate generals without a presidential race are 1962, 1966, 1974, 1978, 1986, and 1990. The three presidential primaries without a Senate race are 1964, 1976, and 1988.
11. These three figures are, in our mind, an important caveat to recent testimony given by Oregon Secretary of State Kate Brown before the Postal Commission, in which she claimed that VBM increases turnout, particularly in small, lower profile elections (Brown, 2010). It is possible that this statement is accurate with respect to specials, and we have not to date collected information on state legis-lative, county, or municipal contests, but with respect to statewide elections, the statement is not accurate.
12. As noted, Southwell came to the same conclusion in her two most published pieces (Southwell, 2009, 2010), which shows that voting by mail increases turn-out in Oregon only in special elections, but she finds no statistically significant impact of VBM in presidential, primary, or off-year elections (Southwell, 2009, p. 214).
13. Because only Oregon has voting by mail in the time period considered by this research, the estimate was essentially an estimate of the effect of VBM in that state, independent of the other covariates included in the model.
14. Another outlier study is that of David Magleby, who conducted one of the first studies of VBM, and found a turnout effect of 19% (Magelby, 1987). We surmise the Magleby’s work, which compares turnout from 1980 to 1984 in Oregon, Washington, and California may provide insight into how voting by mail, and by implication, other convenience voting reforms, interact with campaign intensity to affect turnout. The only elections in which voting by mail was legal during this period was for some local and special (ballot measure) elections, so essentially
at REED COLLEGE LIBRARY on June 5, 2013apr.sagepub.comDownloaded from
994 American Politics Research 40(6)
Magleby is comparing apples and oranges—voting by mail in local and ballot measures to turnout in federal elections where voting by mail was not allowed. In order to precisely estimate the effect of voting by mail on, say, a local election, we need to compare a federal election and a local election, both of which are admin-istered under voting by mail.
15. In the abstract of the paper and Table 1 of Southwell and Burchett report a sam-ple size of 48 elections, but the text reports 46 elections (Southwell & Burchett, 2000, p. 73). We are not sure which is the correct number; we find 38 candidate elections occurred between 1960 and 1996. Multiple cuts at the data indicate to us that they must have unwittingly included special elections in the original dataset; however, including these still does not result in 48 cases.
16. Professor Southwell generously provided a dataset covering a different time period (1980-2004), but after independent coding, we differed with her both on the number of elections that were conducted during this period and also on the coding of some elections. Our count of the total number of statewide elec-tions conducted from 1960 to 1996 is 38, excluding the three VBM specials in 1995/1996. If we count elections from 1960 to 1996 and include all elections, including all specials, our total count is 54, which is closer but not equal to the total reported in the 2000 article. We include special elections in our model in Table 1 because these results are a closer replication of the original find-ings than a model that excludes special elections. In addition, diagnostic tests described later make it clear that Southwell and Burchett must have included special elections. We have not focused on the 2009 and 2010 papers for reasons noted in the introduction, but the election totals in those papers also do not cor-respond to our data, and we were unable to obtain these data from Professor Southwell.
17. The original authors operationalize competitiveness as “the percentage differ-ence between the winner and the candidate finishing second in the statewide race on the ballot with the largest number of ballots cast” (Southwell & Burchett, 2000, p. 75). However, this really describes the noncompetitiveness of the elec-tion in question as low values of this measure actually indicate a close race. We quantify competition in general and special elections as:
Competition 1 1 2=
V V
B− −
where V1 and V
2 are the vote totals for the winner and runner-up, respectively, and
B is the total ballots cast in the race with the most ballots cast. For primary elections, we adapt the above formula to account for intraparty competition:
at REED COLLEGE LIBRARY on June 5, 2013apr.sagepub.comDownloaded from
Gronke and Miller 995
Competition 12
D1 D2
D
R1 R2
R=
V V
B+
V V
B−
− −
where D and R subscripts apply to the Democratic and Republican candidates, respectively. Competition is scaled from 0 to 1; 1 indicates an electoral result where the vote was evenly split between two candidates or issues (as competitive as possi-ble) and 0 indicates a case where one candidate or ballot measure captured every vote (no competition). In our data, competitiveness ranges between 0.117 and 0.998.
18. Prais–Winsten is analogous to Beach–MacKinnon and is readily available in cur-rent statistical packages (Beach–MacKinnon is unavailable in any current statis-tical program with which we are familiar).
19. The Durbin–Watson statistic in both the subset and full dataset is between the lower and upper critical values, an inconclusive result, although close to the upper bound indicating positive autocorrelation.
20. We test for first-order autocorrelation in each of our models. We present both OLS and Prais–Winsten estimates because most of the tests for autocorrelation are inconclusive.
21. One reason we do not observe a turnout effect of VBM in Table 1, but do see an effect in Table 2 is that, as Figure 2 makes clear, the 1995 special Senate primary and the 1996 presidential primary exhibited higher turnout than average, even when considering subsequent VBM elections.
References
Aldrich, J. H. (1993). Rational choice and turnout. American Journal of Political Sci-ence, 37, 246-278.
Alvarez, R. M., Ansolabehere, S., Berinsky, A., Lenz, G., Stewart, III, C., & Hall, T. (2009). The 2008 Survey of the Performance of American Elections. Washington, DC: Pew Center on the States. Retrieved from http://www.pewtrusts.org/our_work_report_detail.aspx?id=51164
Alvarez, R. M., & Hall, T. (2004). Point, click, and vote. Washington, DC: Brookings Institution Press.
Alvarez, R. M., Hall, T., & Llewellyn, M. (2008). Are Americans confident their bal-lots are counted? Journal of Politics, 70, 754-768.
Beach, C., & MacKinnon, J. (1978). A maximum likelihood procedure for regression with autocorrelated errors. Econometrica, 46(1), 51-58.
Berinsky, A. J., Burns, N., & Traugott, M. W. (2001). Who votes by mail? A dynamic model of the individual-level consequences of voting-by-mail systems. Public Opinion Quarterly, 65, 178-197.
at REED COLLEGE LIBRARY on June 5, 2013apr.sagepub.comDownloaded from
996 American Politics Research 40(6)
Bradbury, B. (2006, November 16). A better way to vote. Washington Post, p. B07.Brown, K. (2010, September 14). Statement by Oregon Secretary of State Kate
Brown before the Postal Regulatory Commission. Retrieved from www.prc.gov/Docs/69/69484/Brown2.pdf
Downs, A. (1957). An economic theory of democracy. New York, NY: Harper.Dyck, J., & Seabrook, N. (2009). The problem with voting-by-mail. Paper presented
to the Annual Meeting of the Midwest Political Science Association, Chicago, IL.Fiorina, M. (1976). The voting decision: instrumental and expressive aspects. Journal
of Politics, 38, 390-413.Fitzgerald, M. (2005). Greater convenience but not greater turnout—The impact of
alternative voting methods on electoral participation in the United States. American Politics Research, 33, 842-867.
Fund, J. (2008). Stealing elections: How voter fraud threatens our democracy. New York, NY: Encounter Books.
Giammo, J., & Brox, B. (2010). Reducing the costs of participation: Are states getting a return on early voting? Political Research Quarterly, 63, 295-303.
Gronke, P., Galanes-Rosenbaum, E., & Miller, P. (2007). Early voting and turnout. PS: Political Science and Politics, 40, 639-645.
Gronke, P., Stewart, C., III, & Hicks, J. (2010). Residual voting in Florida (Report of the Pew Center on the States). Washington, DC: Pew Charitable Trusts. Retrieved from http://www.pewcenteronthestates.org/uploadedFiles/Florida_Residual_Vote_report.pdf?n=3568
Hamilton, R. H. (1988). American all-mail balloting: A decade’s experience. Public Administration Review, 48, 860-866.
Hanmer, M. J. (2009). Discount voting: Voting registration reforms and their effects. New York, NY: Cambridge University Press.
Hanmer, M. J., & Traugott, M. W. (2004). The impact of voting by mail on voter behavior. American Politics Research, 32, 375-405.
Karp, J. A., & Banducci, S. A. (2000). Going postal: How all-mail elections influence turnout. Political Behavior, 22, 223-239.
Kousser, T., & Mullin, M. (2007). Does voting by mail increase participation? Using matching to analyze a natural experiment. Political Analysis, 15, 428-445.
Luechinger, S., Rosinger, M., & Stutzer, A. (2007). The impact of postal voting on par-ticipation: Evidence for Switzerland. Swiss Political Science Review, 13,167-202.
Magleby, D. (1987). Participation in mail ballot elections. Western Political Quar-terly, 40, 79-91.
McDonald, M., & Popkin, S. (2001). The myth of the vanishing voter. American Political Science Review, 95, 963-974.
Milyo, J., Konisky, D., & Richardson, L. (2009). What determines public approval of voting reforms? Paper presented at the Annual Meeting of the American Political Science Association, Toronto, Canada.
at REED COLLEGE LIBRARY on June 5, 2013apr.sagepub.comDownloaded from
Gronke and Miller 997
Minnite, L. (2010). The myth of voter fraud. Ithaca, NY: Cornell University Press.Richey, S. (2005). Who votes alone? The impact of voting by mail on political discus-
sion. Australian Journal of Political Science, 40, 435-442.Richey, S. (2008). Voting by mail: Turnout and institutional reform in Oregon. Social
Science Quarterly, 89, 902-915.Riker, W., & Ordeshook, P. (1968). A theory of the calculus of voting. American Polit-
ical Science Review, 62(1), 25-42.Rosenstone, S. J., & Hansen, J. M. (1993). Mobilization, participation, and democ-
racy in America. New York, NY: Macmillan.Southwell, P. (1998). Vote-by-mail in the state of Oregon. Willamette Law Review,
34, 345-356.Southwell, P. (2004). Five years later: A re-assessment of Oregon’s vote by mail elec-
toral process. PS: Politics and Political Science, 98(1), 89-93.Southwell, P. (2009). Analysis of the turnout effects of vote by mail elections,
1980-2007. Social Science Journal, 46, 211-217.Southwell, P. (2010). Voting behavior in vote-by-mail elections. Analyses of Social
Issues and Public Policy, 10(1), 106-115.Southwell, P., & Burchett, J. (1997). Survey of vote-by-mail senate election in the
state of Oregon. PS: Political Science & Politics, 30(1), 53-57.Southwell, P., & Burchett, J. (2000). The effect of all-mail elections on voter turnout.
American Politics Research, 28(1), 72-79.Stewart, C., III. (2011). Adding up the costs and benefits of voting by mail. Election
Law Journal, 10, 297-301.Thompson, D. (2004). Election time: Normative implications of temporal properties
of the electoral process in the United States. American Political Science Review, 98(1), 51-64.
Thompson, D. (2008). Election simultaneity: Expressing equal respect. Journal of Social Issues, 64, 487-501.
Traugott, M. W. (2004). Why electoral reform has failed: If you build it, will they come? In A. Crigler, M. Just, & E. McCaffery (Eds.), Rethinking the vote: The politics and prospects of American election reform (pp. 167-184). New York, NY: Oxford University Press.
Bios
Paul Gronke is a professor of Political Science at Reed College, founder and director of the Early Voting Information Center, and co-editor of the Election Law Journal.
Peter Miller is a doctoral candidate in Political Science at the University of California, Irvine and Podlich Fellow at the Center for the Study of Democracy.
at REED COLLEGE LIBRARY on June 5, 2013apr.sagepub.comDownloaded from