Embed Size (px)
Citation preview
American Samoa Power Authority: DEED Grant Final Report Prepared by Lena Perkins, Eric Stoutenburg, Gil Masters, and ASPA Staff
Project Title Sustainable Copra Oil Bioelectricity Production and Electrical Predesign to Support High Penetration of Variable Renewable Resources (Formerly “Creating Sustainable Markets through Biofuel Production from Local Feedstock”) Utility Name and Address American Samoa Power Authority 1st Road Airport Pago Pago, AS 96799
ASPA Key Personnel Andra Samoa: ASPA CEO, Phone: (684) 699-1234. Project director. Ted Le'iato: ASPA Power Generation Manager, Phone: (684) 699-4653. Contractor oversight. Taylor Savusa: ASPA Water Projects Director, Phone: (684) 699-1234. Contractor liaison and oversight. Kerini Peko: ASPA Employee, Phone: (684) 699-1234. Ofu and Olosega onsite contractor support. Manager on Ofu: ASPA Employee, Phone: (684) 699-1234. ASPA Manager Ofu and Olosega. Contractors Prof. Gil Masters: Professor of Civil & Environmental Engineering, Stanford University. Project director. Eric Stoutenburg: PhD Candidate, Atmosphere/Energy Program in Civil & Environmental Engineering, Stanford University. Responsible for siting wind anemometers and solar pyranometers; preliminary assessment of wind and solar on Ofu and Olosega for electrical generation and grid integration. Lena Perkins: (925) 708-6631. PhD Candidate, Thermosciences in Mechanical Engineering, Stanford University. Responsible for assessment of energy potential from Copra Oil as drop-in replacement for diesel, as well as diesel efficiency improvements. Project Subject Areas Copra oil, diesel electricity, biofuels, intermittent renewable integration, solar and wind energy, demand side management.
Description Assessment of sustainable copra oil as a drop-in fuel for diesel electricity production. Predesign assessment of electrical grid of Ofu-Olosega for integration of high penetration (20-80%) of variable renewable resources such as wind and solar power. Assessment of electricity usage on Ofu-Olosega, Ta’u, and Tutuila.
Dates 3/2010-3/2011: Original dates, revised to
3/2010-12/2011: Due to tsunami recovery efforts at ASPA
ASPA APPA DEED GRANT FINAL REPORT
1
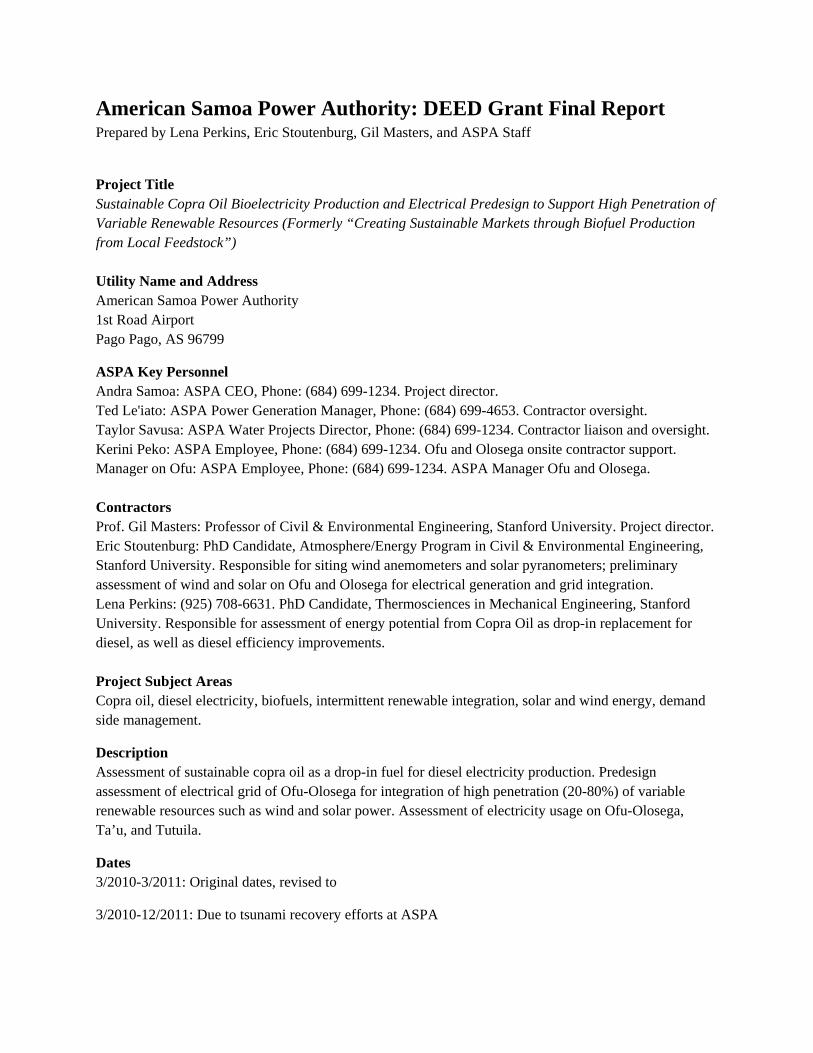
Executive Summary
The above graphic shows a schematic design of a potentially 100% renewable powered Ofu and Olosega electric power system. The key features are wind power, solar power, copra oil supplemented diesel fuel, and a pumped hydropower system for energy storage along with the potential for electric vehicles. We encourage the American Samoa Power Authority to consider such a visionary energy system for the following reasons:
1. Energy security: an energy system powered 100% by American Samoan energy protects the energy supply from geopolitical and supply disruptions. Increasing the diversity of energy sources from diesel to wind, solar, and copra oil helps protect the energy supply from natural disasters like cyclones, tsunamis, and earthquakes.
2. Reduce price volatility: a renewable energy supply system reduces electricity price volatility because the cost of installing renewables is essentially fixed by the installation cost and the fuel is free.
3. Environment: a renewable energy system does not produce air pollution like diesel generators. 4. Secure business model: Installing renewables is a secure, long term business model for the
American Samoa Power Authority because operating costs and price volatility are reduced. 5. Job growth: a renewable energy system requires new jobs in installing and maintaining wind
turbines, solar panels, and copra plantations. 6. Environmental, social, and economic justice: a renewable energy system provides American
Samoa with a self-sufficient energy supply and makes it no longer reliant on high priced diesel imports which are a net transfer of wealth out of American Samoa to foreign oil companies.
ASPA APPA DEED GRANT FINAL REPORT
2
This report follows the principles of renewable and efficient energy system design of (1) energy efficiency, (2) existing generator system efficiency improvements, (3) renewable energy, and (4) energy storage and electrification of transportation. From a cost perspective the first steps often cost the least and save the most and as such should be addressed first. Below are the recommendations contained in this report for the energy system redesign of the Ofu and Olosega electric power system:
Energy Efficiency
• Initiate an ASPA Sponsored Customer Energy Efficiency program to replace inefficient appliances and lighting in residences and the school on the islands.
• Right size the existing diesel generators to the load size on Ofu and Olosega to reduce the generator’s diesel consumption per kWh.
• Identify the distribution system losses and balance the three phase system.
Existing Diesel System Efficiency Improvements
• Purchase and install a smaller 100 kW diesel engine and generator set in the Ofu power plant
• It should run 55% more efficiently and save 35% in diesel fuel.
• Diesel fuel savings should pay for new genset and installation in about 3 months.
• A smaller generator will pair better with any future wind and solar installations.
Renewable Energy
• Only pursue any Copra Oil blend or Copra biodiesel after installing new smaller and more efficient 100 kW engine, otherwise no net cost savings will be realized until after 10 years.
• Cost estimation for restoring access to the former copra plantation on Olosega must be completed because it appears much of plantation is gone and access looks extremely expensive to restore.
• Investigate using woody byproducts of copra oil for electricity using a boiler and pre-designed steam turbine such as the Siemens SST-040. Municipal waste might also be disposed of if the boiler reached sufficient air quality requirements.
• Install an array of solar PV of up to 5 kW as part of a renewable energy fielding and test program. The recommended location is at the airport on Ofu.
• Install a 10 kW Bergey wind turbine with funding through the US DOE Wind for Schools program at the school on Olosega as part of a renewable energy fielding and test program and integrated into the science and math curriculum at the school. The estimated cost of electricity from such a turbine is $0.16 to $0.19/kWh, far lower than the cost of diesel electricity.
• Install a 34 meter NRG tower on Ofu at another candidate wind turbine(s) location prior to the installation of additional wind turbines after the first one at the school.
A 100% Renewable System – Energy Storage and Electric Vehicles
• Conduct survey work and a detailed feasibility study of the potential for a pumped hydropower system on Ofu for energy regulation and storage of renewable energy from wind and solar.
• Test the potential of a plug-in hybrid electric vehicle (PHEV) on the Ofu-Olosega power system as part of a vehicle-to-grid system. The best vehicle would be a PHEV utility vehicle operated by ASPA electric staff on the island.
ASPA APPA DEED GRANT FINAL REPORT
3
Table of Contents
1. Energy Efficiency
1.1. Observations and Analysis
1.2. Recommendations
2. Diesel Generators
2.1. Observations and Analysis
2.2. Recommendations
3. Copra Oil Production
3.1. Observations and Analysis
3.2. Recommendations
4. Solar Power
4.1. Observations and Analysis
4.2. Recommendations
5. Wind Power
5.1. Observations and Analysis
5.2. Recommendations
6. Achieving a 100-percent Renewables Grid on Ofu/Olosega
6.1. Observations and Analysis
6.2. Recommendations
ASPA APPA DEED GRANT FINAL REPORT
4
1. Energy Efficiency
1.1. Observations and Analysis
We began by gathering data on the efficiency of the current power generation and distribution system, as well as some representative examples of the kinds and efficiencies of loads being served. Coupled with data on the cost of supplying power and the prices being charged for that power we, not surprisingly, find tremendous potential for efficiency improvements.
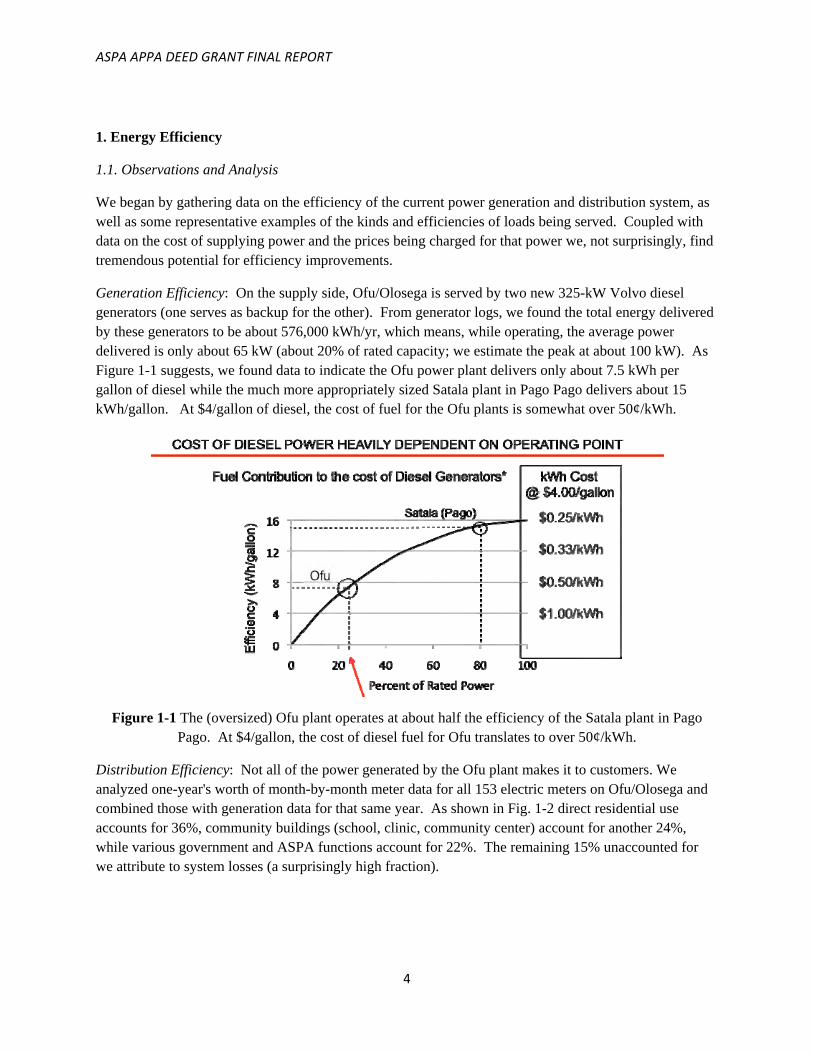
Generation Efficiency: On the supply side, Ofu/Olosega is served by two new 325-kW Volvo diesel generators (one serves as backup for the other). From generator logs, we found the total energy delivered by these generators to be about 576,000 kWh/yr, which means, while operating, the average power delivered is only about 65 kW (about 20% of rated capacity; we estimate the peak at about 100 kW). As Figure 1-1 suggests, we found data to indicate the Ofu power plant delivers only about 7.5 kWh per gallon of diesel while the much more appropriately sized Satala plant in Pago Pago delivers about 15 kWh/gallon. At $4/gallon of diesel, the cost of fuel for the Ofu plants is somewhat over 50¢/kWh.
Figure 1-1 The (oversized) Ofu plant operates at about half the efficiency of the Satala plant in Pago
Pago. At $4/gallon, the cost of diesel fuel for Ofu translates to over 50¢/kWh.
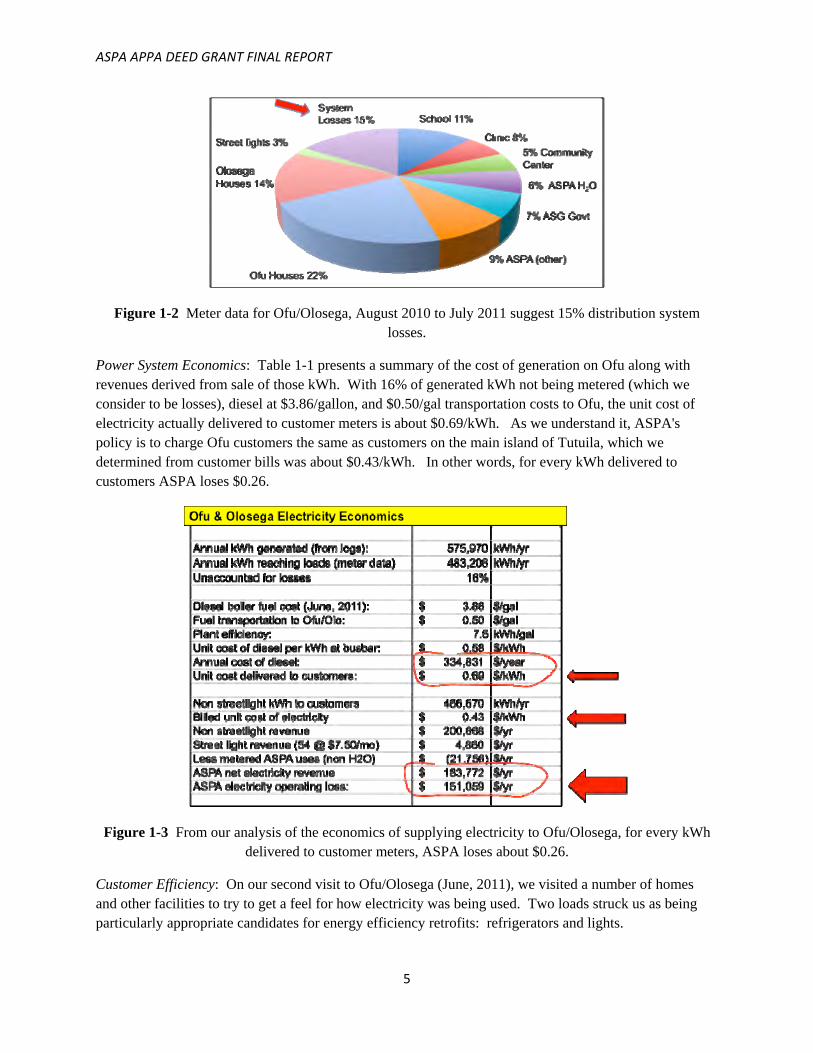
Distribution Efficiency: Not all of the power generated by the Ofu plant makes it to customers. We analyzed one-year's worth of month-by-month meter data for all 153 electric meters on Ofu/Olosega and combined those with generation data for that same year. As shown in Fig. 1-2 direct residential use accounts for 36%, community buildings (school, clinic, community center) account for another 24%, while various government and ASPA functions account for 22%. The remaining 15% unaccounted for we attribute to system losses (a surprisingly high fraction).
ASPA APPA DEED GRANT FINAL REPORT
5
Figure 1-2 Meter data for Ofu/Olosega, August 2010 to July 2011 suggest 15% distribution system losses.
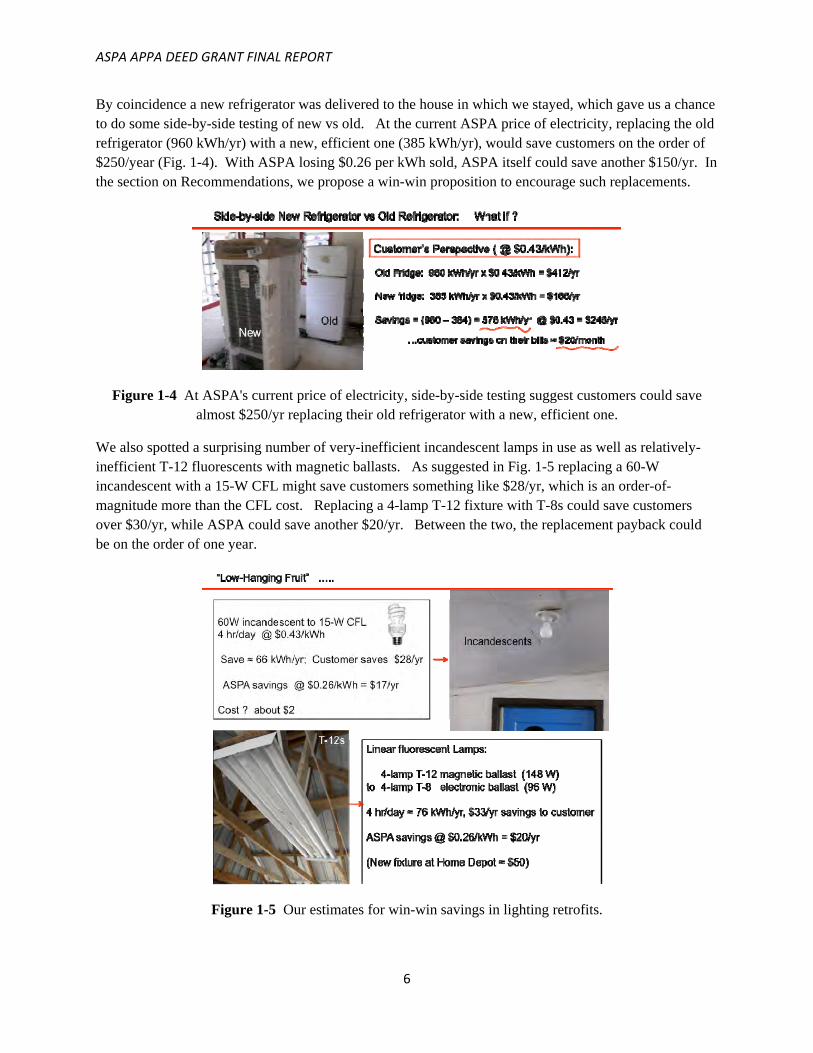
Power System Economics: Table 1-1 presents a summary of the cost of generation on Ofu along with revenues derived from sale of those kWh. With 16% of generated kWh not being metered (which we consider to be losses), diesel at $3.86/gallon, and $0.50/gal transportation costs to Ofu, the unit cost of electricity actually delivered to customer meters is about $0.69/kWh. As we understand it, ASPA's policy is to charge Ofu customers the same as customers on the main island of Tutuila, which we determined from customer bills was about $0.43/kWh. In other words, for every kWh delivered to customers ASPA loses $0.26.
Figure 1-3 From our analysis of the economics of supplying electricity to Ofu/Olosega, for every kWh delivered to customer meters, ASPA loses about $0.26.
Customer Efficiency: On our second visit to Ofu/Olosega (June, 2011), we visited a number of homes and other facilities to try to get a feel for how electricity was being used. Two loads struck us as being particularly appropriate candidates for energy efficiency retrofits: refrigerators and lights.
ASPA APPA DEED GRANT FINAL REPORT
6
By coincidence a new refrigerator was delivered to the house in which we stayed, which gave us a chance to do some side-by-side testing of new vs old. At the current ASPA price of electricity, replacing the old refrigerator (960 kWh/yr) with a new, efficient one (385 kWh/yr), would save customers on the order of $250/year (Fig. 1-4). With ASPA losing $0.26 per kWh sold, ASPA itself could save another $150/yr. In the section on Recommendations, we propose a win-win proposition to encourage such replacements.
Figure 1-4 At ASPA's current price of electricity, side-by-side testing suggest customers could save almost $250/yr replacing their old refrigerator with a new, efficient one.
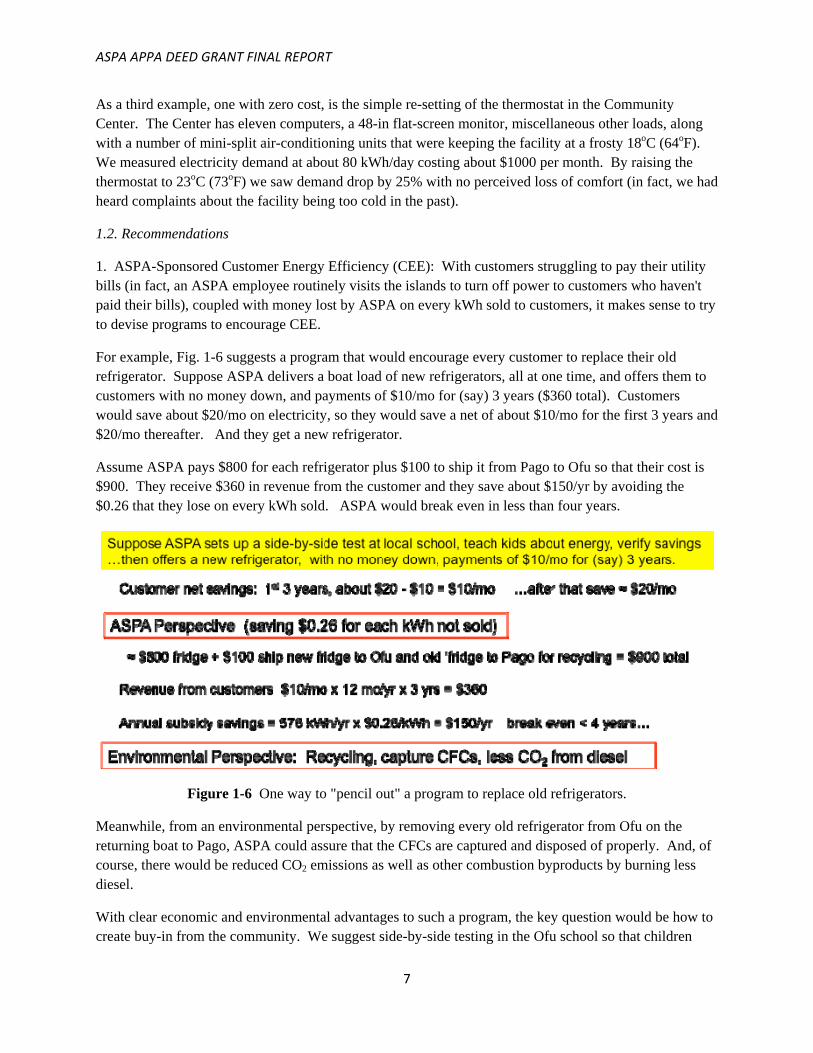
We also spotted a surprising number of very-inefficient incandescent lamps in use as well as relatively-inefficient T-12 fluorescents with magnetic ballasts. As suggested in Fig. 1-5 replacing a 60-W incandescent with a 15-W CFL might save customers something like $28/yr, which is an order-of-magnitude more than the CFL cost. Replacing a 4-lamp T-12 fixture with T-8s could save customers over $30/yr, while ASPA could save another $20/yr. Between the two, the replacement payback could be on the order of one year.
Figure 1-5 Our estimates for win-win savings in lighting retrofits.
ASPA APPA DEED GRANT FINAL REPORT
7
As a third example, one with zero cost, is the simple re-setting of the thermostat in the Community Center. The Center has eleven computers, a 48-in flat-screen monitor, miscellaneous other loads, along with a number of mini-split air-conditioning units that were keeping the facility at a frosty 18oC (64oF). We measured electricity demand at about 80 kWh/day costing about $1000 per month. By raising the thermostat to 23oC (73oF) we saw demand drop by 25% with no perceived loss of comfort (in fact, we had heard complaints about the facility being too cold in the past).
1.2. Recommendations
1. ASPA-Sponsored Customer Energy Efficiency (CEE): With customers struggling to pay their utility bills (in fact, an ASPA employee routinely visits the islands to turn off power to customers who haven't paid their bills), coupled with money lost by ASPA on every kWh sold to customers, it makes sense to try to devise programs to encourage CEE.
For example, Fig. 1-6 suggests a program that would encourage every customer to replace their old refrigerator. Suppose ASPA delivers a boat load of new refrigerators, all at one time, and offers them to customers with no money down, and payments of $10/mo for (say) 3 years ($360 total). Customers would save about $20/mo on electricity, so they would save a net of about $10/mo for the first 3 years and $20/mo thereafter. And they get a new refrigerator.
Assume ASPA pays $800 for each refrigerator plus $100 to ship it from Pago to Ofu so that their cost is $900. They receive $360 in revenue from the customer and they save about $150/yr by avoiding the $0.26 that they lose on every kWh sold. ASPA would break even in less than four years.
Figure 1-6 One way to "pencil out" a program to replace old refrigerators.
Meanwhile, from an environmental perspective, by removing every old refrigerator from Ofu on the returning boat to Pago, ASPA could assure that the CFCs are captured and disposed of properly. And, of course, there would be reduced CO2 emissions as well as other combustion byproducts by burning less diesel.
With clear economic and environmental advantages to such a program, the key question would be how to create buy-in from the community. We suggest side-by-side testing in the Ofu school so that children
ASPA APPA DEED GRANT FINAL REPORT
8
would not only learn something about energy by doing actual measurements themselves, but their knowledge could encourage parents to participate. Obviously, this pattern of ASPA involvement coupled with community meetings and activities in the school could apply to more than just the replacement of refrigerators.
2. ASPA Generation and Distribution Efficiency: While we can appreciate parts and maintenance advantages of using the same-sized diesel generators on Ofu as in Tutuila, even if a program of renewables isn't followed up on we suggest taking another look at replacing existing units with much smaller ones better matched to their loads.
3. Apparent Distribution System Losses: With perhaps as much as 15% of busbar power not making it to customers, we suggest a study to try to figure out where all that power is being lost. As a start, we noted that the 3-phase conductors are way out of balance. With such an unbalanced system, the neutral line will carry significant current. Since neutral lines are sometimes undersized there could be disproportionate losses.
One reason for the imbalance is the system transitions from three-phase to single-phase part way down the distribution line. It might be interesting to do an economic analysis of extending three-phases throughout the system.
ASPA APPA DEED GRANT FINAL REPORT
9
2. Diesel Generators
2.1. Observations and Analysis
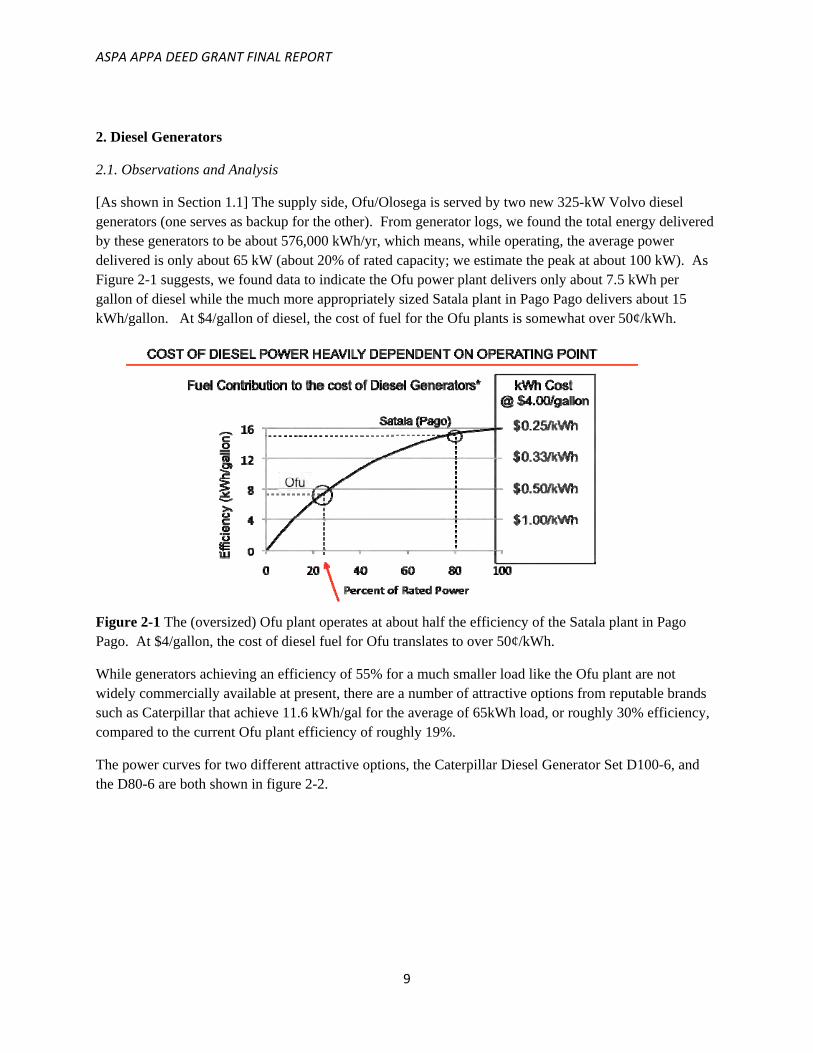
[As shown in Section 1.1] The supply side, Ofu/Olosega is served by two new 325-kW Volvo diesel generators (one serves as backup for the other). From generator logs, we found the total energy delivered by these generators to be about 576,000 kWh/yr, which means, while operating, the average power delivered is only about 65 kW (about 20% of rated capacity; we estimate the peak at about 100 kW). As Figure 2-1 suggests, we found data to indicate the Ofu power plant delivers only about 7.5 kWh per gallon of diesel while the much more appropriately sized Satala plant in Pago Pago delivers about 15 kWh/gallon. At $4/gallon of diesel, the cost of fuel for the Ofu plants is somewhat over 50¢/kWh.
Figure 2-1 The (oversized) Ofu plant operates at about half the efficiency of the Satala plant in Pago Pago. At $4/gallon, the cost of diesel fuel for Ofu translates to over 50¢/kWh.
While generators achieving an efficiency of 55% for a much smaller load like the Ofu plant are not widely commercially available at present, there are a number of attractive options from reputable brands such as Caterpillar that achieve 11.6 kWh/gal for the average of 65kWh load, or roughly 30% efficiency, compared to the current Ofu plant efficiency of roughly 19%.
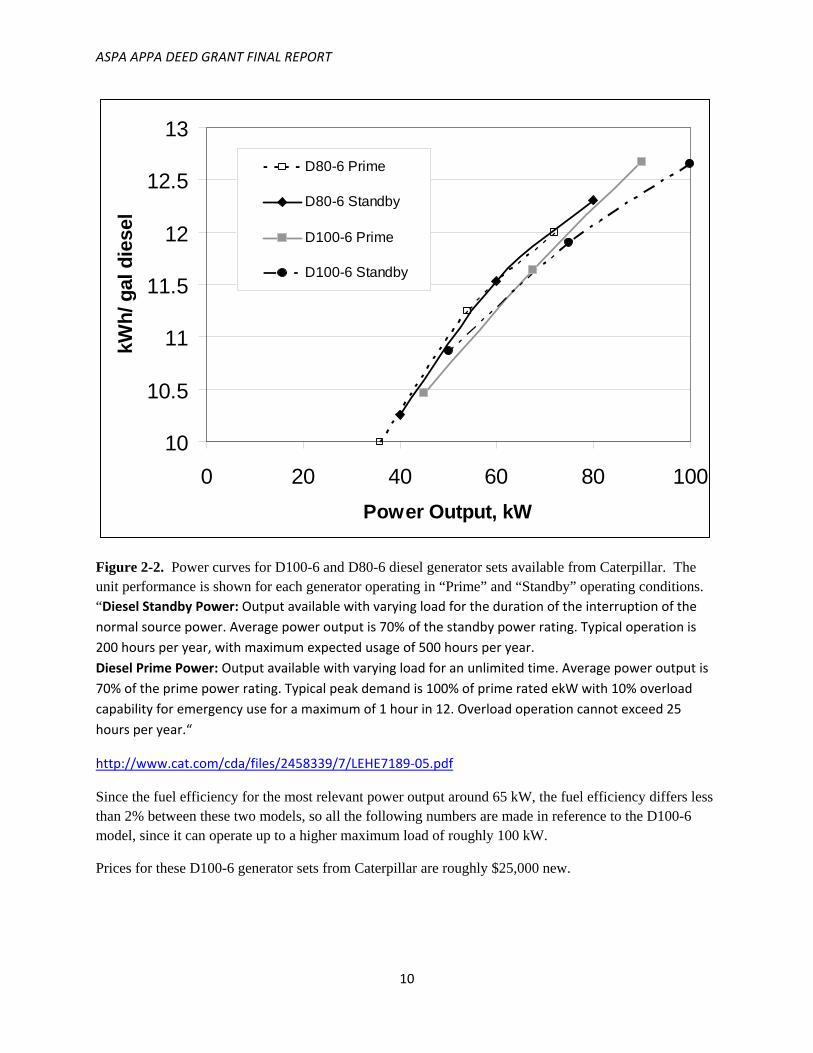
The power curves for two different attractive options, the Caterpillar Diesel Generator Set D100-6, and the D80-6 are both shown in figure 2-2.
ASPA APPA DEED GRANT FINAL REPORT
10
10
10.5
11
11.5
12
12.5
13
0 20 40 60 80 100
Power Output, kW
kWh
/ gal
die
sel
D80-6 Prime
D80-6 Standby
D100-6 Prime
D100-6 Standby
Figure 2-2. Power curves for D100-6 and D80-6 diesel generator sets available from Caterpillar. The unit performance is shown for each generator operating in “Prime” and “Standby” operating conditions. “Diesel Standby Power: Output available with varying load for the duration of the interruption of the normal source power. Average power output is 70% of the standby power rating. Typical operation is 200 hours per year, with maximum expected usage of 500 hours per year. Diesel Prime Power: Output available with varying load for an unlimited time. Average power output is 70% of the prime power rating. Typical peak demand is 100% of prime rated ekW with 10% overload capability for emergency use for a maximum of 1 hour in 12. Overload operation cannot exceed 25 hours per year.“
http://www.cat.com/cda/files/2458339/7/LEHE7189-05.pdf
Since the fuel efficiency for the most relevant power output around 65 kW, the fuel efficiency differs less than 2% between these two models, so all the following numbers are made in reference to the D100-6 model, since it can operate up to a higher maximum load of roughly 100 kW.
Prices for these D100-6 generator sets from Caterpillar are roughly $25,000 new.
ASPA APPA DEED GRANT FINAL REPORT
11
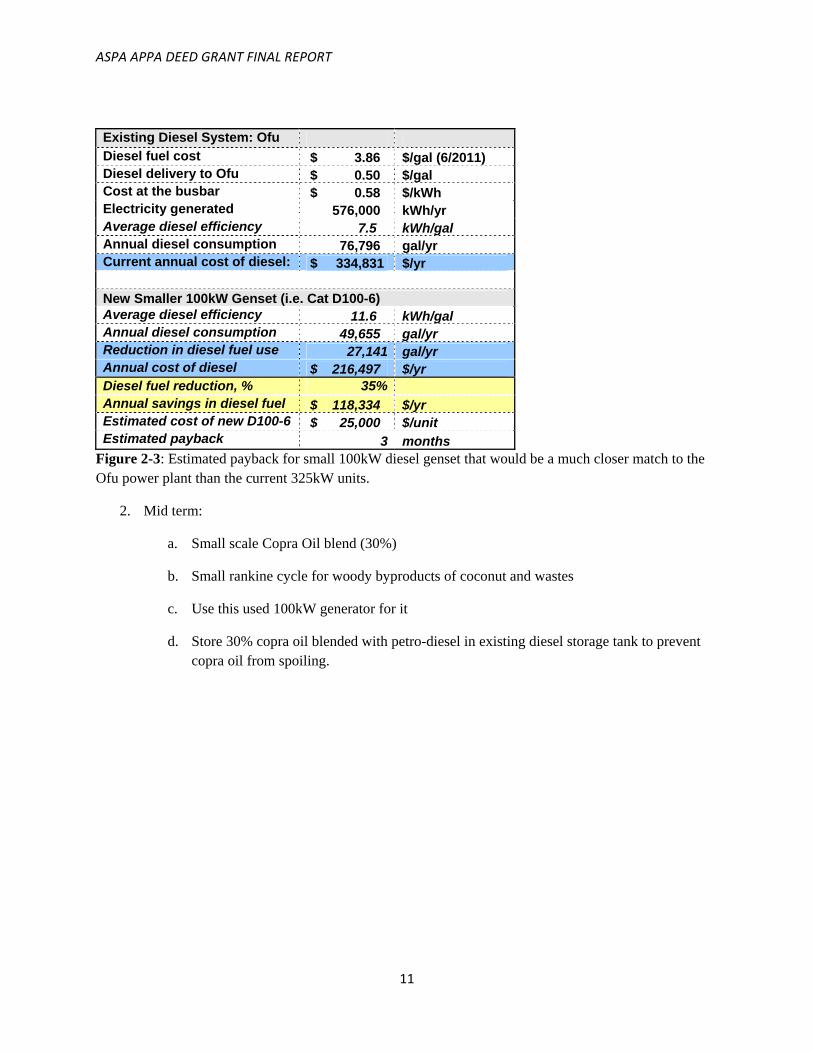
Existing Diesel System: Ofu Diesel fuel cost $ 3.86 $/gal (6/2011) Diesel delivery to Ofu $ 0.50 $/gal Cost at the busbar $ 0.58 $/kWh Electricity generated 576,000 kWh/yr Average diesel efficiency 7.5 kWh/gal Annual diesel consumption 76,796 gal/yr Current annual cost of diesel: $ 334,831 $/yr New Smaller 100kW Genset (i.e. Cat D100-6) Average diesel efficiency 11.6 kWh/gal Annual diesel consumption 49,655 gal/yr Reduction in diesel fuel use 27,141 gal/yr Annual cost of diesel $ 216,497 $/yr Diesel fuel reduction, % 35% Annual savings in diesel fuel $ 118,334 $/yr Estimated cost of new D100-6 $ 25,000 $/unit Estimated payback 3 months
Figure 2-3: Estimated payback for small 100kW diesel genset that would be a much closer match to the Ofu power plant than the current 325kW units.
2. Mid term:
a. Small scale Copra Oil blend (30%)
b. Small rankine cycle for woody byproducts of coconut and wastes
c. Use this used 100kW generator for it
d. Store 30% copra oil blended with petro-diesel in existing diesel storage tank to prevent copra oil from spoiling.
ASPA APPA DEED GRANT FINAL REPORT
12
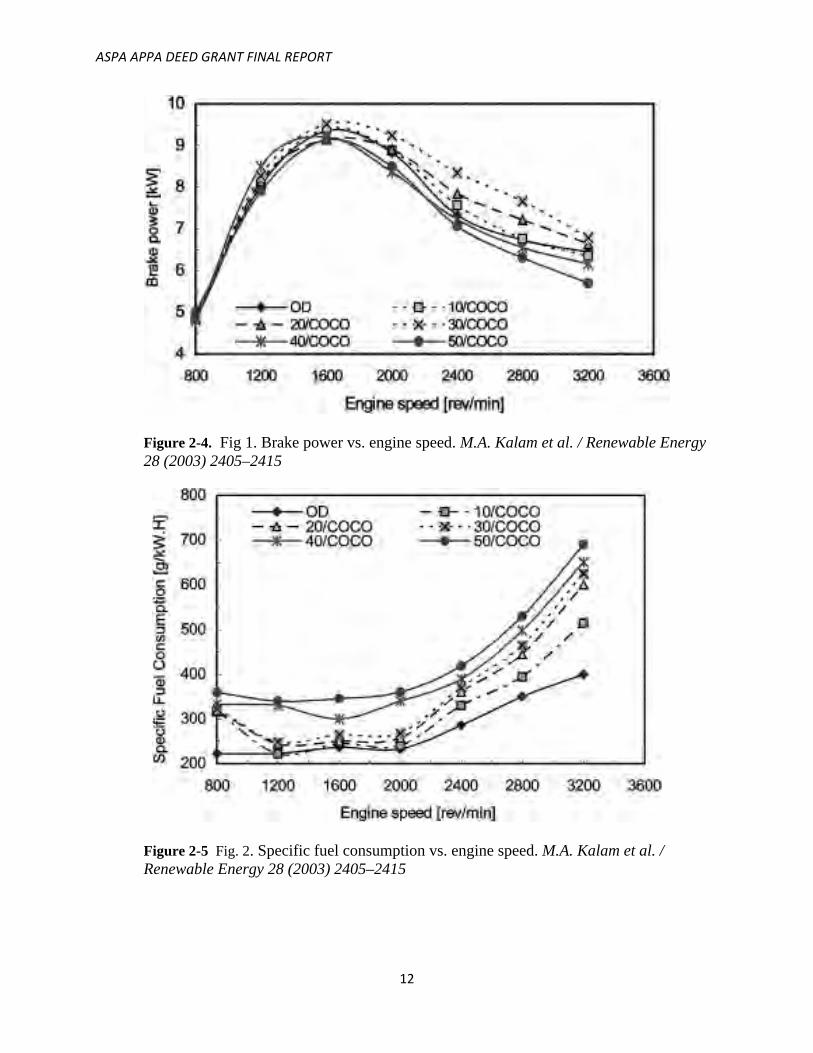
Figure 2-4. Fig 1. Brake power vs. engine speed. M.A. Kalam et al. / Renewable Energy 28 (2003) 2405–2415
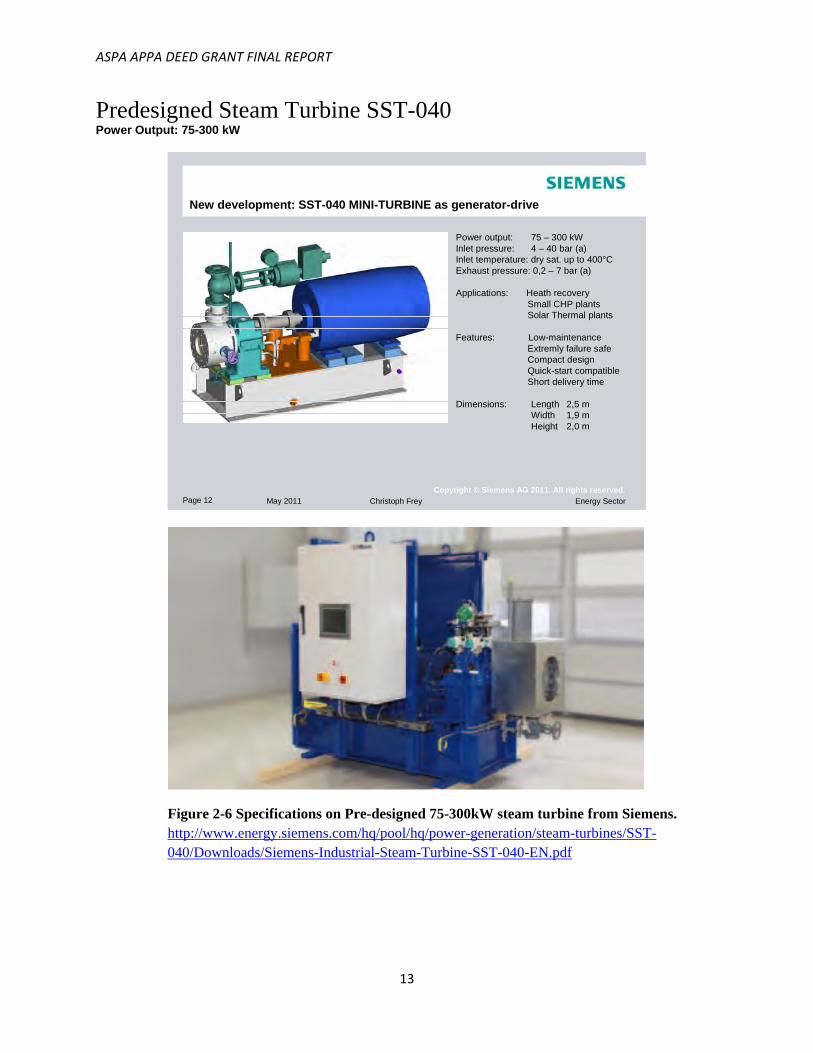
Figure 2-5 Fig. 2. Specific fuel consumption vs. engine speed. M.A. Kalam et al. / Renewable Energy 28 (2003) 2405–2415
ASPA APPA DEED GRANT FINAL REPORT
13
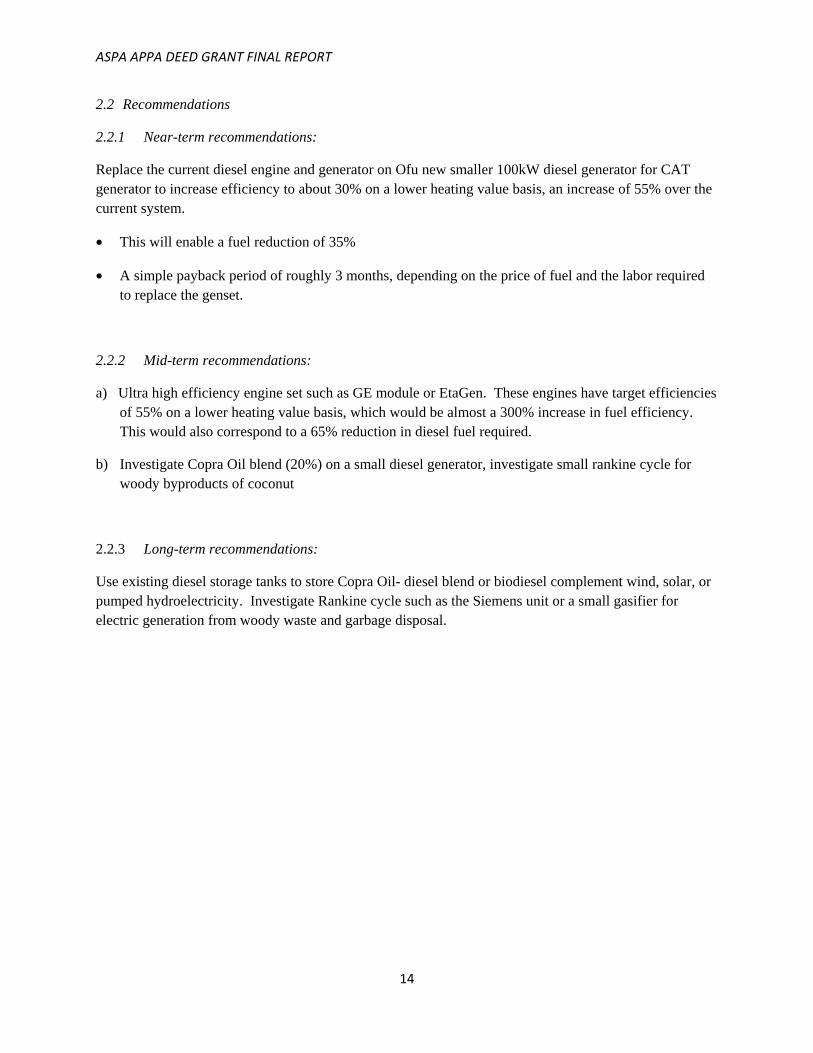
Predesigned Steam Turbine SST-040 Power Output: 75-300 kW
Page 12 May 2011 Energy Sector
Copyright © Siemens AG 2011. All rights reserved.
Christoph Frey
New development: SST-040 MINI-TURBINE as generator-drive
Power output: 75 – 300 kWInlet pressure: 4 – 40 bar (a)Inlet temperature: dry sat. up to 400°CExhaust pressure: 0,2 – 7 bar (a)
Applications: Heath recoverySmall CHP plantsSolar Thermal plants
Features: Low-maintenanceExtremly failure safeCompact designQuick-start compatibleShort delivery time
Dimensions: Length 2,5 mWidth 1,9 mHeight 2,0 m
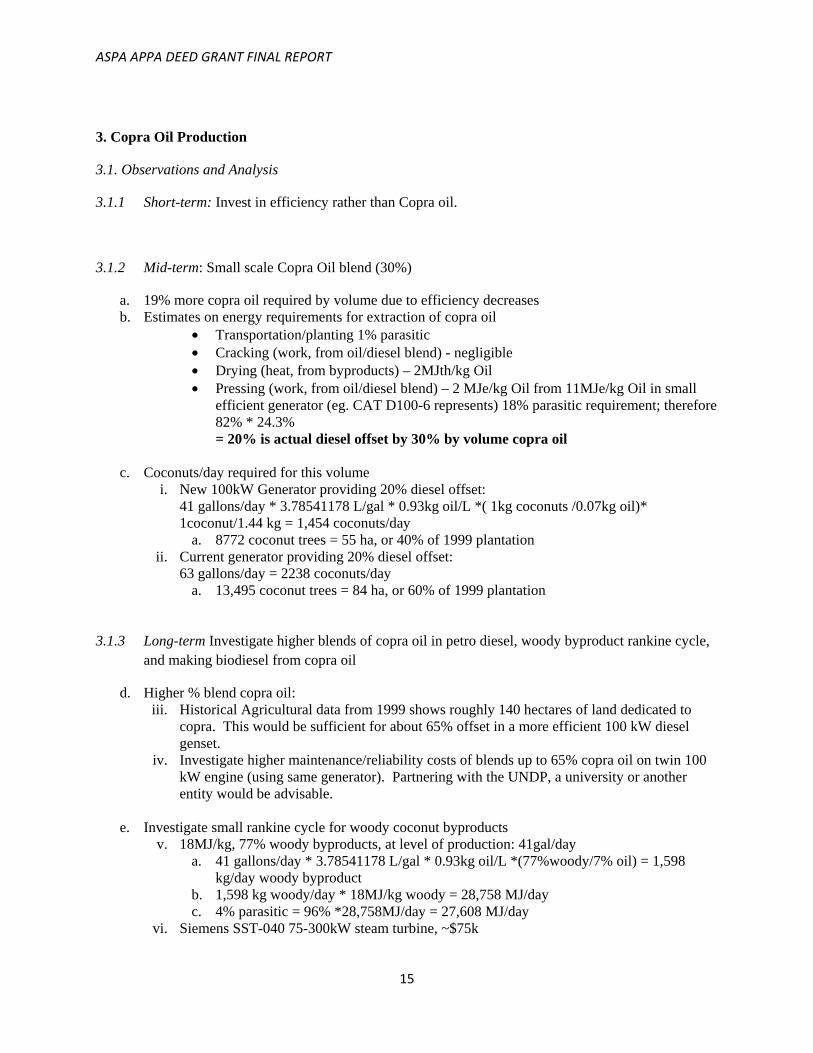
Figure 2-6 Specifications on Pre-designed 75-300kW steam turbine from Siemens. http://www.energy.siemens.com/hq/pool/hq/power-generation/steam-turbines/SST-040/Downloads/Siemens-Industrial-Steam-Turbine-SST-040-EN.pdf
ASPA APPA DEED GRANT FINAL REPORT
14
2.2 Recommendations
2.2.1 Near-term recommendations:
Replace the current diesel engine and generator on Ofu new smaller 100kW diesel generator for CAT generator to increase efficiency to about 30% on a lower heating value basis, an increase of 55% over the current system.
• This will enable a fuel reduction of 35%
• A simple payback period of roughly 3 months, depending on the price of fuel and the labor required to replace the genset.
2.2.2 Mid-term recommendations:
a) Ultra high efficiency engine set such as GE module or EtaGen. These engines have target efficiencies of 55% on a lower heating value basis, which would be almost a 300% increase in fuel efficiency. This would also correspond to a 65% reduction in diesel fuel required.
b) Investigate Copra Oil blend (20%) on a small diesel generator, investigate small rankine cycle for woody byproducts of coconut
2.2.3 Long-term recommendations:
Use existing diesel storage tanks to store Copra Oil- diesel blend or biodiesel complement wind, solar, or pumped hydroelectricity. Investigate Rankine cycle such as the Siemens unit or a small gasifier for electric generation from woody waste and garbage disposal.
ASPA APPA DEED GRANT FINAL REPORT
15
3. Copra Oil Production
3.1. Observations and Analysis
3.1.1 Short-term: Invest in efficiency rather than Copra oil.
3.1.2 Mid-term: Small scale Copra Oil blend (30%)
a. 19% more copra oil required by volume due to efficiency decreases b. Estimates on energy requirements for extraction of copra oil
• Transportation/planting 1% parasitic • Cracking (work, from oil/diesel blend) - negligible • Drying (heat, from byproducts) – 2MJth/kg Oil • Pressing (work, from oil/diesel blend) – 2 MJe/kg Oil from 11MJe/kg Oil in small
efficient generator (eg. CAT D100-6 represents) 18% parasitic requirement; therefore 82% * 24.3% = 20% is actual diesel offset by 30% by volume copra oil
c. Coconuts/day required for this volume i. New 100kW Generator providing 20% diesel offset:
41 gallons/day * 3.78541178 L/gal * 0.93kg oil/L *( 1kg coconuts /0.07kg oil)* 1coconut/1.44 kg = 1,454 coconuts/day
a. 8772 coconut trees = 55 ha, or 40% of 1999 plantation ii. Current generator providing 20% diesel offset:
63 gallons/day = 2238 coconuts/day a. 13,495 coconut trees = 84 ha, or 60% of 1999 plantation
3.1.3 Long-term Investigate higher blends of copra oil in petro diesel, woody byproduct rankine cycle,
and making biodiesel from copra oil
d. Higher % blend copra oil: iii. Historical Agricultural data from 1999 shows roughly 140 hectares of land dedicated to
copra. This would be sufficient for about 65% offset in a more efficient 100 kW diesel genset.
iv. Investigate higher maintenance/reliability costs of blends up to 65% copra oil on twin 100 kW engine (using same generator). Partnering with the UNDP, a university or another entity would be advisable.
e. Investigate small rankine cycle for woody coconut byproducts
v. 18MJ/kg, 77% woody byproducts, at level of production: 41gal/day a. 41 gallons/day * 3.78541178 L/gal * 0.93kg oil/L *(77%woody/7% oil) = 1,598
kg/day woody byproduct b. 1,598 kg woody/day * 18MJ/kg woody = 28,758 MJ/day c. 4% parasitic = 96% *28,758MJ/day = 27,608 MJ/day
vi. Siemens SST-040 75-300kW steam turbine, ~$75k
ASPA APPA DEED GRANT FINAL REPORT
16
a. ~75% eff boiler, 15% eff turbine = ~11% eff to electricity, which is 27,608 MJ/day = 36kW
b. The smallest commercially available rankine cycle from Siemens is sized for 75kW, so the woody byproducts alone would not be sufficient, perhaps plastics or other municipal solid waste could be added.
3.2. Recommendations
System modification: Small Generator
Copra Oil** Small Gen + Copra Oil**
Ultra high efficiency*
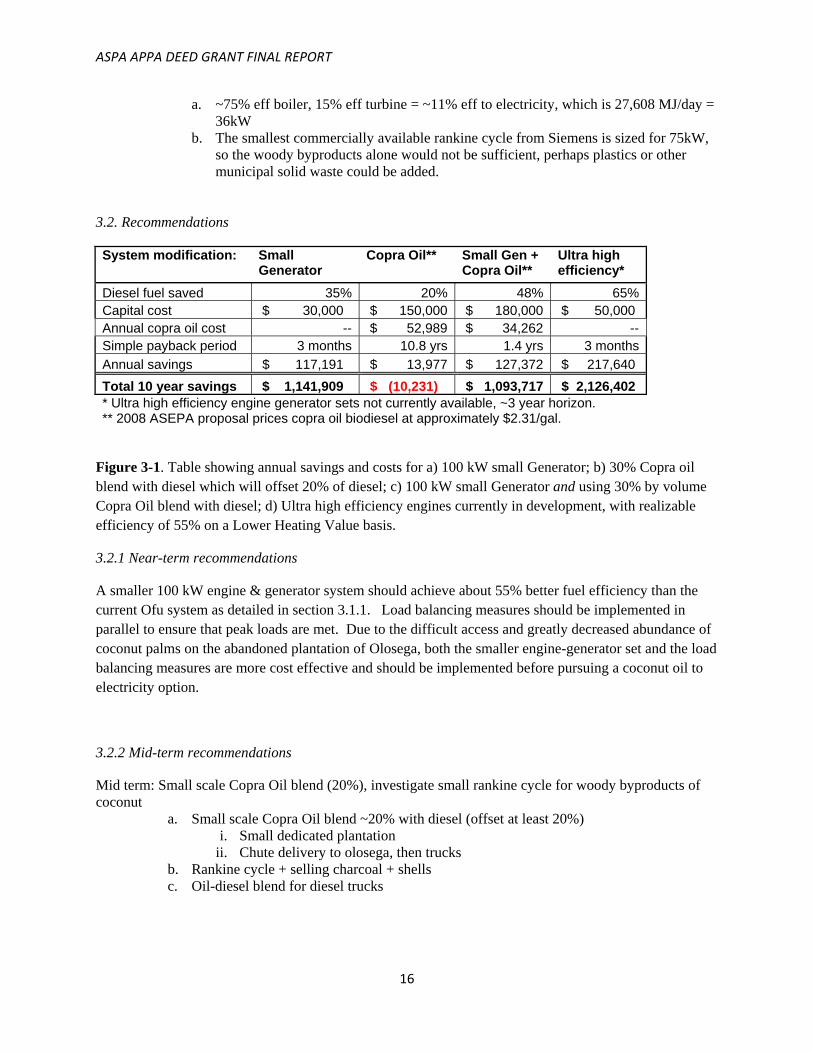
Diesel fuel saved 35% 20% 48% 65% Capital cost $ 30,000 $ 150,000 $ 180,000 $ 50,000 Annual copra oil cost -- $ 52,989 $ 34,262 -- Simple payback period 3 months 10.8 yrs 1.4 yrs 3 months
Annual savings $ 117,191 $ 13,977 $ 127,372 $ 217,640
Total 10 year savings $ 1,141,909 $ (10,231) $ 1,093,717 $ 2,126,402 * Ultra high efficiency engine generator sets not currently available, ~3 year horizon. ** 2008 ASEPA proposal prices copra oil biodiesel at approximately $2.31/gal.
Figure 3-1. Table showing annual savings and costs for a) 100 kW small Generator; b) 30% Copra oil blend with diesel which will offset 20% of diesel; c) 100 kW small Generator and using 30% by volume Copra Oil blend with diesel; d) Ultra high efficiency engines currently in development, with realizable efficiency of 55% on a Lower Heating Value basis.
3.2.1 Near-term recommendations
A smaller 100 kW engine & generator system should achieve about 55% better fuel efficiency than the current Ofu system as detailed in section 3.1.1. Load balancing measures should be implemented in parallel to ensure that peak loads are met. Due to the difficult access and greatly decreased abundance of coconut palms on the abandoned plantation of Olosega, both the smaller engine-generator set and the load balancing measures are more cost effective and should be implemented before pursuing a coconut oil to electricity option.
3.2.2 Mid-term recommendations
Mid term: Small scale Copra Oil blend (20%), investigate small rankine cycle for woody byproducts of coconut
a. Small scale Copra Oil blend ~20% with diesel (offset at least 20%) i. Small dedicated plantation
ii. Chute delivery to olosega, then trucks b. Rankine cycle + selling charcoal + shells c. Oil-diesel blend for diesel trucks
ASPA APPA DEED GRANT FINAL REPORT
17
3.2.3 Long-term recommendations
Long term: Evaluate Copra Oil blend economics with wind, solar hybrid, pumped storage, and rankine cycle for woody products and or waste.
a. Pumped hydro i. Allow the diesel generators to operate at peak efficiency all the time
ii. Could also enable 80-100% electricity supply from wind and solar b. Smaller scale storage/load balancing
i. UPS flywheel systems, flow batteries, etc…should be thoroughly studied ii. Evaluate economics of next generation flow batteries for load balancing.
iii. Non-toxic materials could be a good option for running diesel generators at optimal efficiency.
c. Copra Oil – diesel blends or biodiesel
i. Copra Oil has extremely large footprint, evaluate next to wind and solar a) Possibly intercrop dwarf trees with wind farm b) Copra Oil blends with diesel or biodiesel could be stored in existing diesel
tanks and used as emergency back-up fuel. ii. High temperature incinerator + Rankine cycle for wood waste, back up electricity
c) Back up 50-75 kW capacity if woody byproducts are sufficient
d. Biodiesel may be less economically favorable than copra oil diesel blends due to transportation requirements of imported product requirements
i. Biodiesel can be stored without the risk of going rancid ii. Perhaps a portable transesterification device for making biodiesel with ethanol
(not methanol) could be moved between Tau, Ofu, and Pago, to build up a local supply of biodiesel then stored in the tanks.
ASPA APPA DEED GRANT FINAL REPORT
18
4. Solar Power
4.1. Observations and Analysis
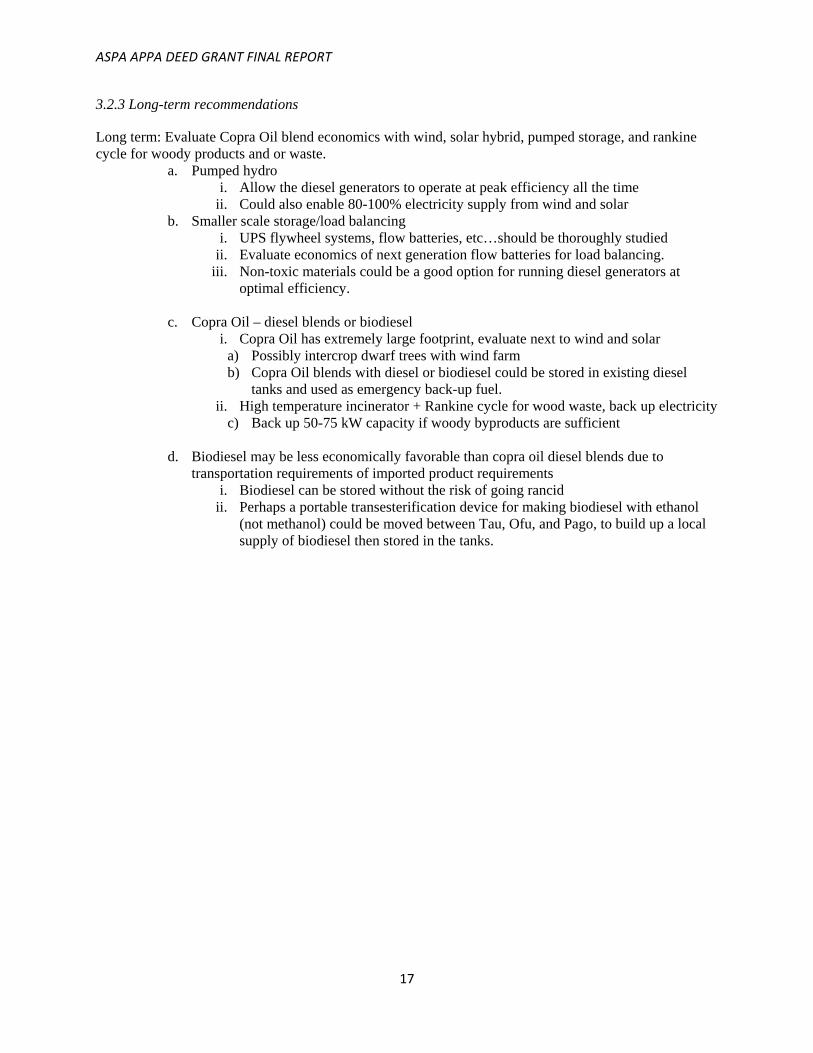
Two solar measurement stations were installed in March 2010 on Ofu and Olosega. The first was installed with the wind measurement station on the east side of the bridge between Ofu and Olosega. The second station was installed at the harbor on Ofu near the existing NWS weather station. Photos of the two stations are shown in figure 4-1. The first station measured solar irradiance from March 19, 2010 to August 4, 2011; however, a battery failure in the logger beginning August 2010 degraded the quality of the measurements. The second station measured solar irradiance from March 18, 2010 to June 19, 2010, when a logger setting turned off the logger and it didn’t record any measurements until it was corrected in August 2011.
Figure 4-1. Solar irradiance measurement stations on Ofu and Olosega.
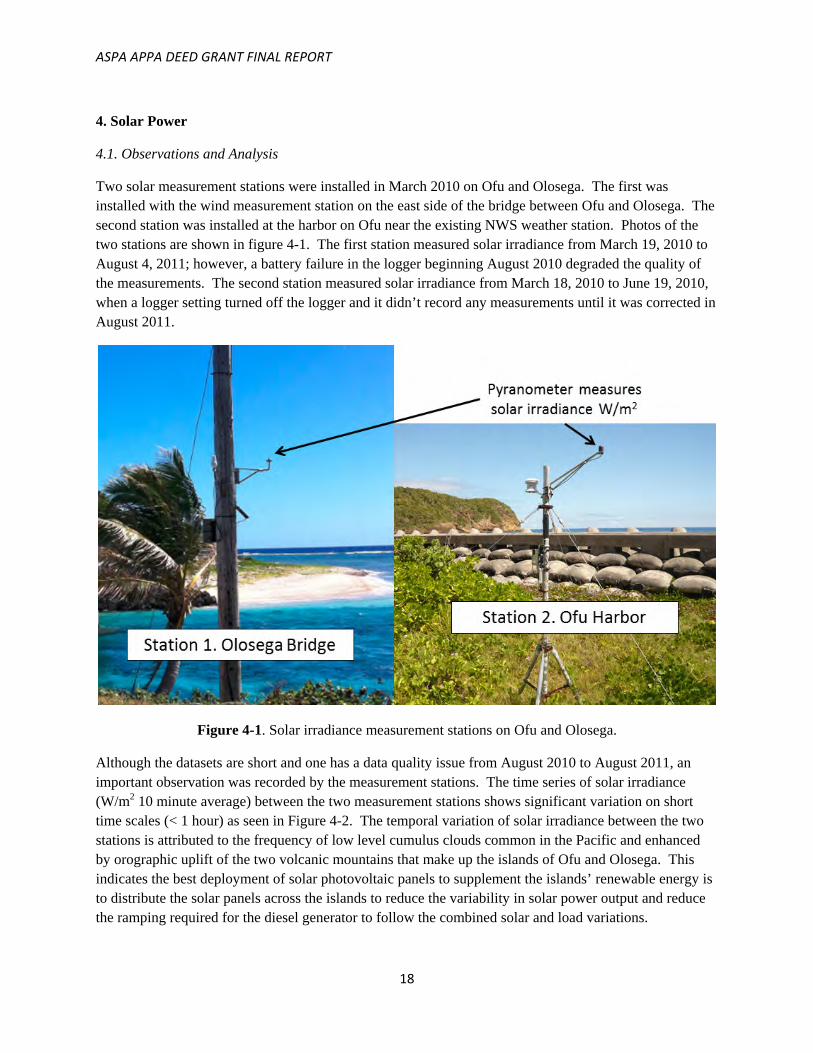
Although the datasets are short and one has a data quality issue from August 2010 to August 2011, an important observation was recorded by the measurement stations. The time series of solar irradiance (W/m2 10 minute average) between the two measurement stations shows significant variation on short time scales (< 1 hour) as seen in Figure 4-2. The temporal variation of solar irradiance between the two stations is attributed to the frequency of low level cumulus clouds common in the Pacific and enhanced by orographic uplift of the two volcanic mountains that make up the islands of Ofu and Olosega. This indicates the best deployment of solar photovoltaic panels to supplement the islands’ renewable energy is to distribute the solar panels across the islands to reduce the variability in solar power output and reduce the ramping required for the diesel generator to follow the combined solar and load variations.
ASPA APPA DEED GRANT FINAL REPORT
19
Figure 4-2. Variation in the solar resource across the islands of Ofu and Olosega.
4.2. Recommendations
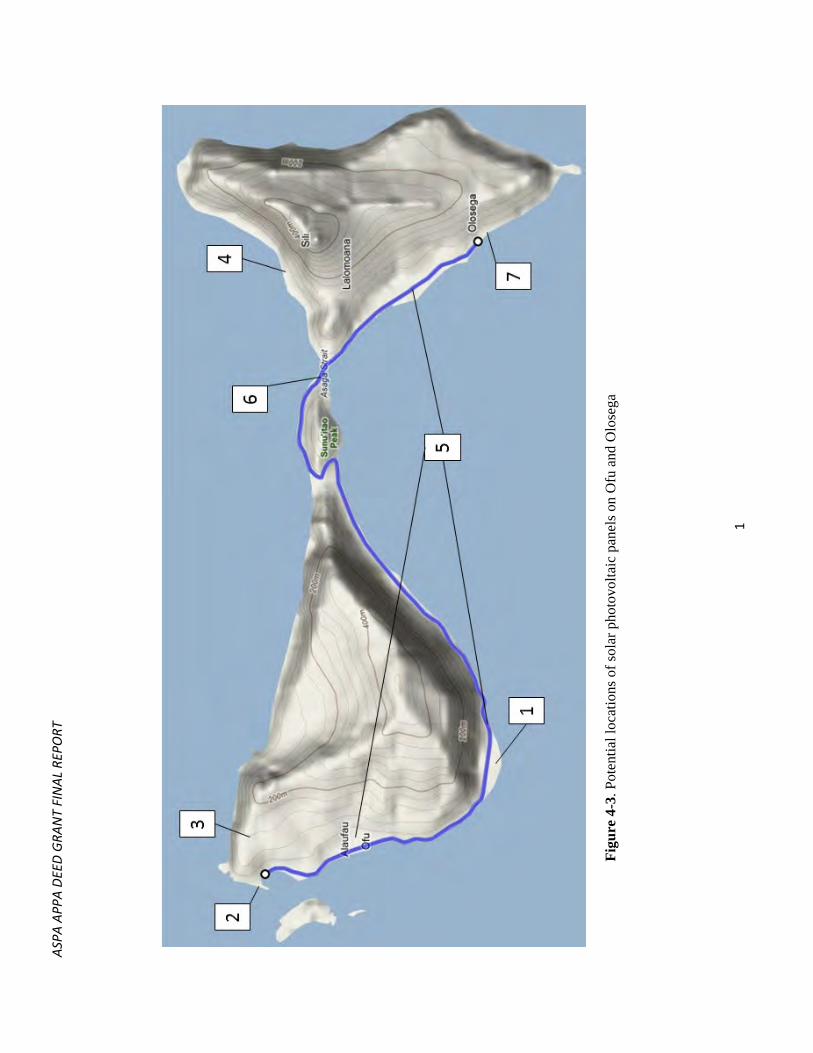
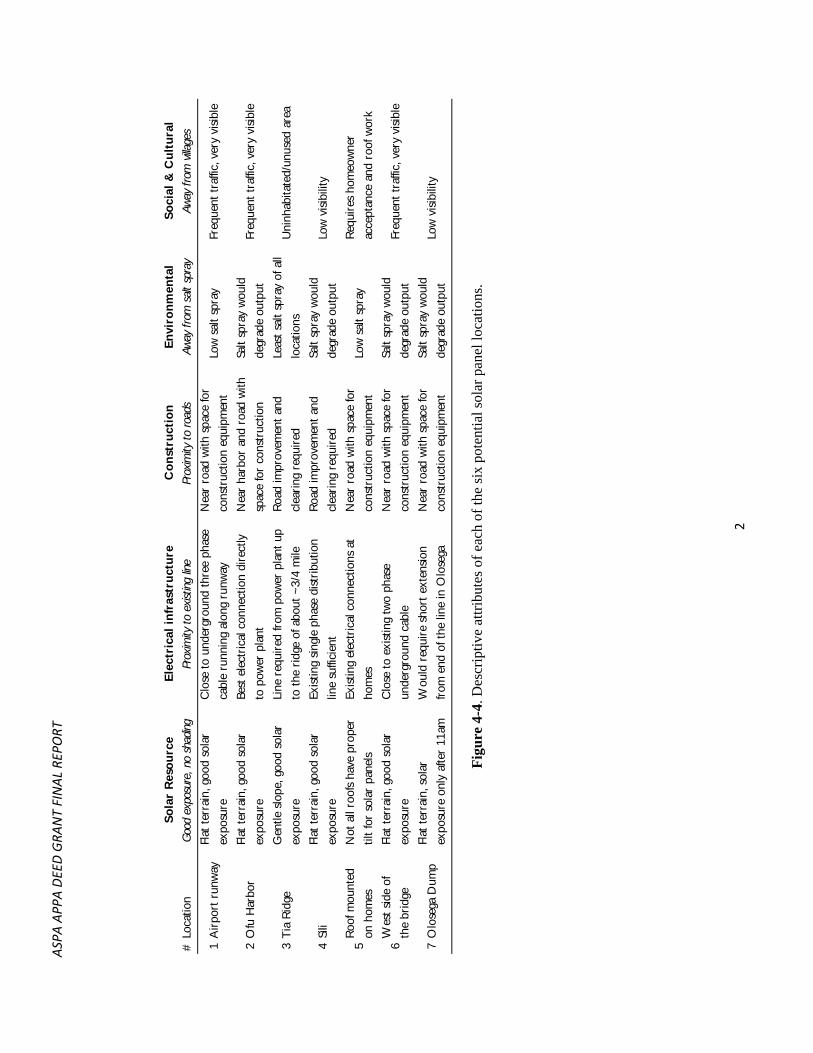
The equatorial South Pacific has a known solar resource and ASPA’s experience with solar on the main island of Tutuila suggest the immediate installation of solar panels on the islands of Ofu and Olosega is a cost effective supplement to reducing diesel fuel consumption. The Stanford team surveyed several potential solar photovoltaic panel sites on the islands. Ideal solar PV sites should have the following characteristics: (1) have little or no shading from buildings, trees, or mountains, (2) have flat or gentle slope land and be accessible from an existing road for construction and maintenance, (3) be sited near the existing electrical infrastructure for easy installation, (4) be sited away from the effects of sea spray and salt corrosion, and (5) be sited in a socially acceptable location and not compete with other land uses such as agriculture or recreation. Figure 4-3 indicates six possible locations and Figure 4-4 describes their characteristics. The airport location is strongly recommended as the best solar site and several airports around the world place low ground mounted solar panels at the edges of their runways.

ASPA APPA DEED GRANT FINAL REPORT
20
ASP
A A
PPA
DEE
D G
RAN
T FI
NA
L RE
PORT
1
Fig
ure
4-3
. Pot
enti
al lo
cati
ons
of s
olar
pho
tovo
ltai
c pa
nels
on
Ofu
and
Olo
sega
ASP
A A
PPA
DEE
D G
RAN
T FI
NA
L RE
PORT
2
So
lar
Res
ou
rce
Ele
ctri
cal
infr
astr
uct
ure
Co
nst
ruct
ion
En
viro
nm
enta
lS
oci
al &
Cu
ltu
ral
#Lo
catio
nGo
od e
xpos
ure,
no
shad
ingPr
oxim
ity to
exis
ting
line
Prox
imity
to ro
ads
Away
from
salt
spr
ayAw
ay fr
om v
illage
s
1A
irpo
rt r
unw
ayFl
at t
erra
in, g
ood
sola
r
expo
sure
Clo
se t
o un
derg
roun
d th
ree
phas
e
cabl
e ru
nnin
g al
ong
runw
ay
Nea
r ro
ad w
ith s
pace
for
cons
truc
tion
equi
pmen
tLo
w s
alt
spra
yFr
eque
nt t
raffi
c, v
ery
visi
ble
2O
fu H
arbo
rFl
at t
erra
in, g
ood
sola
r
expo
sure
Best
ele
ctri
cal c
onne
ctio
n di
rect
ly
to p
ower
pla
nt
Nea
r ha
rbor
and
roa
d w
ith
spac
e fo
r co
nstr
uctio
n
Salt
spra
y w
ould
degr
ade
outp
utFr
eque
nt t
raffi
c, v
ery
visi
ble
3T
ia R
idge
Gen
tle s
lope
, goo
d so
lar
expo
sure
Line
req
uire
d fr
om p
ower
pla
nt u
p
to t
he r
idge
of a
bout
~3/
4 m
ile
Roa
d im
prov
emen
t an
d
clea
ring
req
uire
d
Leas
t sa
lt sp
ray
of a
ll
loca
tions
Uni
nhab
itate
d/un
used
are
a
4Si
liFl
at t
erra
in, g
ood
sola
r
expo
sure
Exis
ting
sing
le p
hase
dis
trib
utio
n
line
suffi
cien
t
Roa
d im
prov
emen
t an
d
clea
ring
req
uire
d
Salt
spra
y w
ould
degr
ade
outp
utLo
w v
isib
ility
5R
oof m
ount
ed
on h
omes
Not
all
roof
s ha
ve p
rope
r
tilt
for
sola
r pa
nels
Exis
ting
elec
tric
al c
onne
ctio
ns a
t
hom
es
Nea
r ro
ad w
ith s
pace
for
cons
truc
tion
equi
pmen
tLo
w s
alt
spra
yR
equi
res
hom
eow
ner
acce
ptan
ce a
nd r
oof w
ork
6W
est
side
of
the
brid
ge
Flat
ter
rain
, goo
d so
lar
expo
sure
Clo
se t
o ex
istin
g tw
o ph
ase
unde
rgro
und
cabl
e
Nea
r ro
ad w
ith s
pace
for
cons
truc
tion
equi
pmen
t
Salt
spra
y w
ould
degr
ade
outp
utFr
eque
nt t
raffi
c, v
ery
visi
ble
7O
lose
ga D
ump
Flat
ter
rain
, sol
ar
expo
sure
onl
y af
ter
11am
Wou
ld r
equi
re s
hort
ext
ensi
on
from
end
of t
he li
ne in
Olo
sega
Nea
r ro
ad w
ith s
pace
for
cons
truc
tion
equi
pmen
t
Salt
spra
y w
ould
degr
ade
outp
utLo
w v
isib
ility
Fig
ure
4-4
. Des
crip
tive
att
ribu
tes
of e
ach
of th
e si
x po
tent
ial s
olar
pan
el lo
cati
ons.

ASP
A A
PPA
DEE
D G
RAN
T FI
NA
L RE
PORT
3
ASPA APPA DEED GRANT FINAL REPORT
1
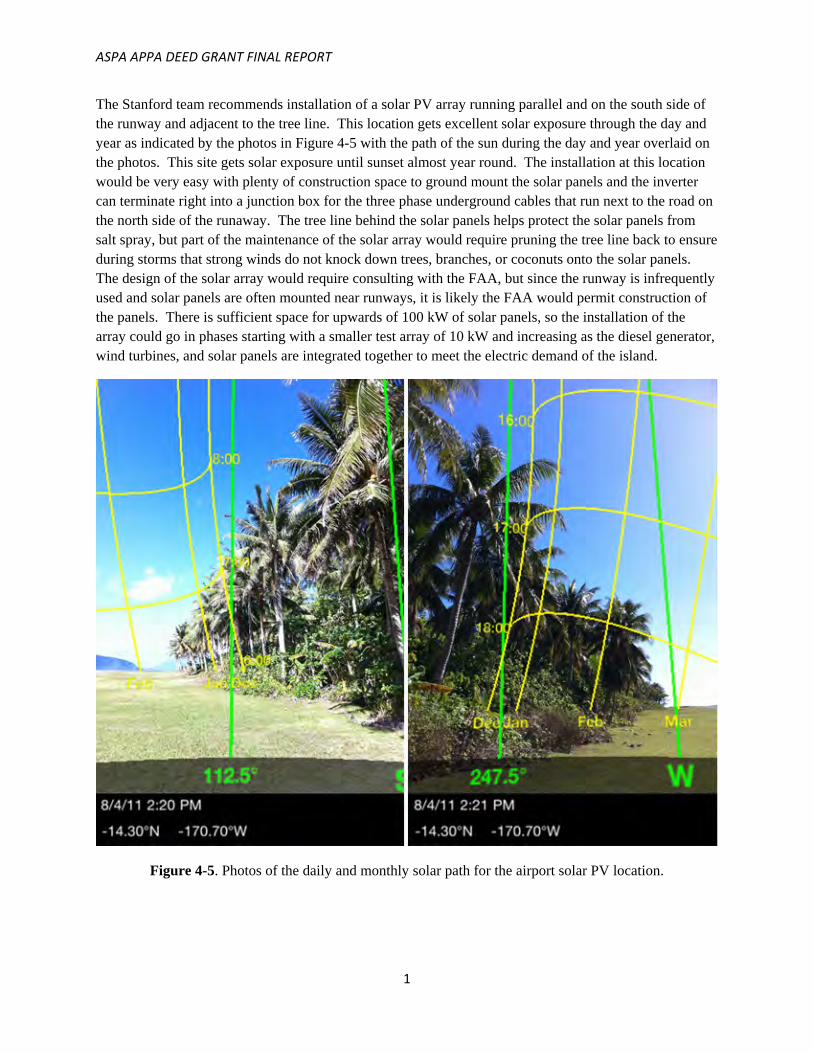
The Stanford team recommends installation of a solar PV array running parallel and on the south side of the runway and adjacent to the tree line. This location gets excellent solar exposure through the day and year as indicated by the photos in Figure 4-5 with the path of the sun during the day and year overlaid on the photos. This site gets solar exposure until sunset almost year round. The installation at this location would be very easy with plenty of construction space to ground mount the solar panels and the inverter can terminate right into a junction box for the three phase underground cables that run next to the road on the north side of the runaway. The tree line behind the solar panels helps protect the solar panels from salt spray, but part of the maintenance of the solar array would require pruning the tree line back to ensure during storms that strong winds do not knock down trees, branches, or coconuts onto the solar panels. The design of the solar array would require consulting with the FAA, but since the runway is infrequently used and solar panels are often mounted near runways, it is likely the FAA would permit construction of the panels. There is sufficient space for upwards of 100 kW of solar panels, so the installation of the array could go in phases starting with a smaller test array of 10 kW and increasing as the diesel generator, wind turbines, and solar panels are integrated together to meet the electric demand of the island.
Figure 4-5. Photos of the daily and monthly solar path for the airport solar PV location.
ASPA APPA DEED GRANT FINAL REPORT
2
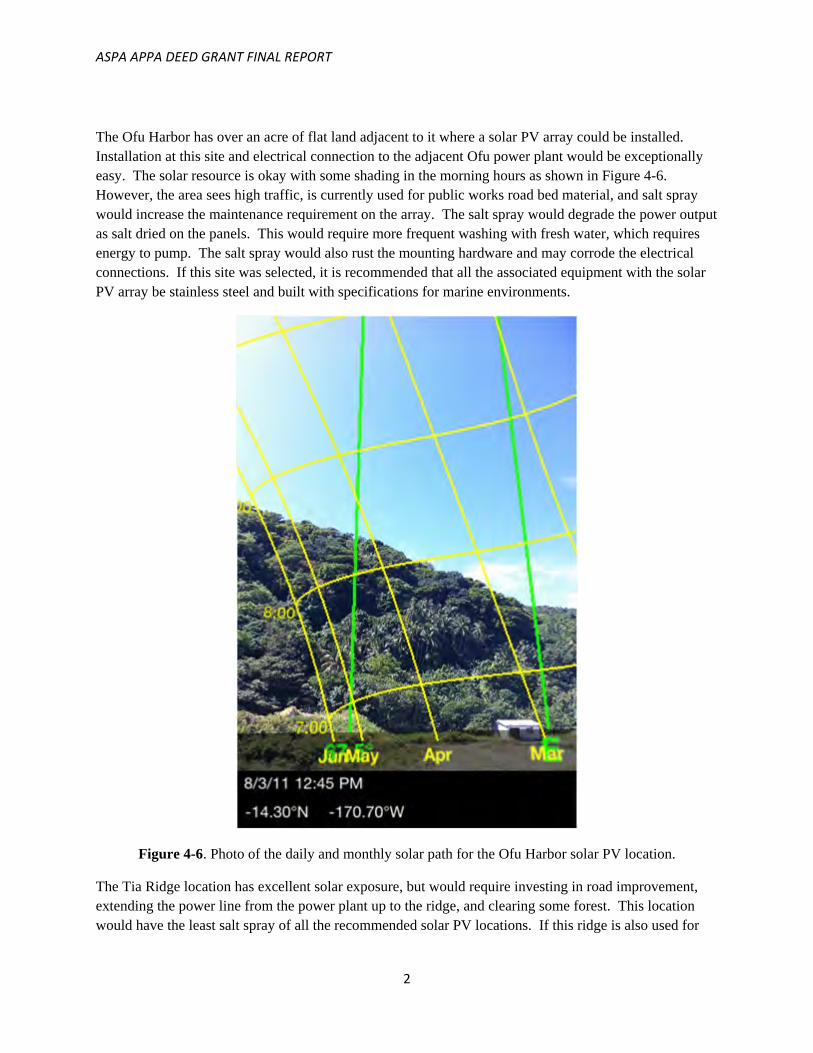
The Ofu Harbor has over an acre of flat land adjacent to it where a solar PV array could be installed. Installation at this site and electrical connection to the adjacent Ofu power plant would be exceptionally easy. The solar resource is okay with some shading in the morning hours as shown in Figure 4-6. However, the area sees high traffic, is currently used for public works road bed material, and salt spray would increase the maintenance requirement on the array. The salt spray would degrade the power output as salt dried on the panels. This would require more frequent washing with fresh water, which requires energy to pump. The salt spray would also rust the mounting hardware and may corrode the electrical connections. If this site was selected, it is recommended that all the associated equipment with the solar PV array be stainless steel and built with specifications for marine environments.
Figure 4-6. Photo of the daily and monthly solar path for the Ofu Harbor solar PV location.
The Tia Ridge location has excellent solar exposure, but would require investing in road improvement, extending the power line from the power plant up to the ridge, and clearing some forest. This location would have the least salt spray of all the recommended solar PV locations. If this ridge is also used for
ASPA APPA DEED GRANT FINAL REPORT
3
the installation of wind turbines as discussed in section 5, then it is recommended this site be further investigated.
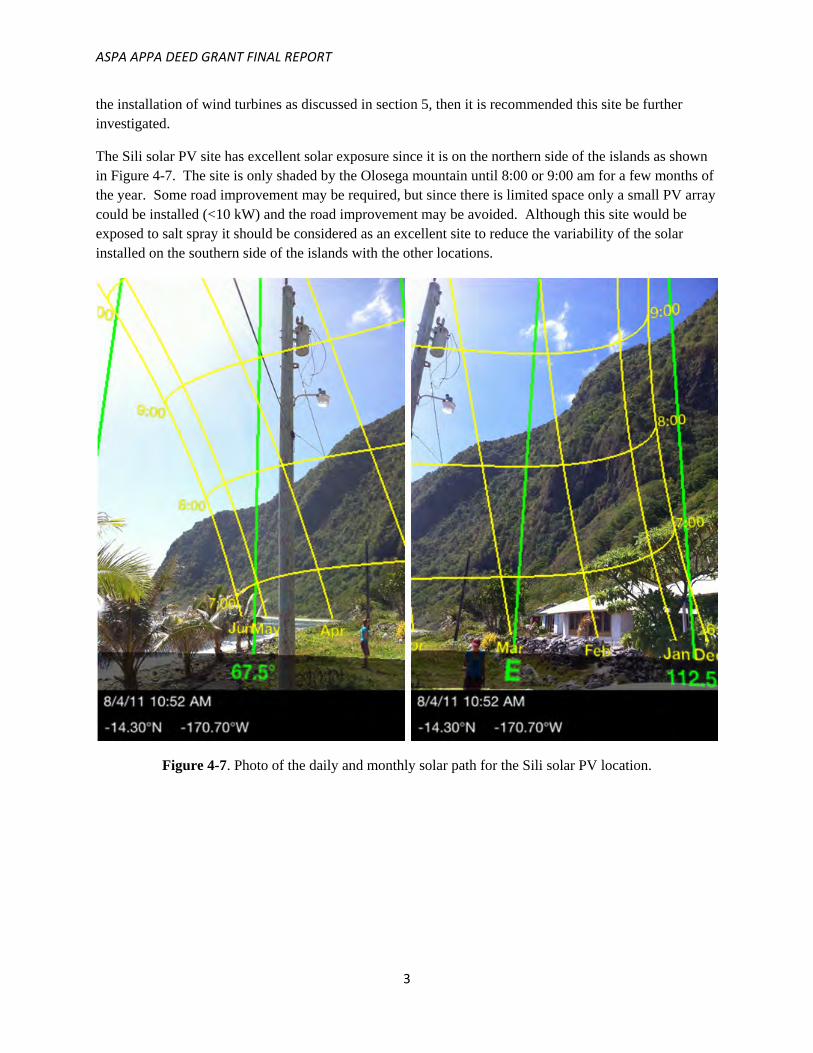
The Sili solar PV site has excellent solar exposure since it is on the northern side of the islands as shown in Figure 4-7. The site is only shaded by the Olosega mountain until 8:00 or 9:00 am for a few months of the year. Some road improvement may be required, but since there is limited space only a small PV array could be installed (<10 kW) and the road improvement may be avoided. Although this site would be exposed to salt spray it should be considered as an excellent site to reduce the variability of the solar installed on the southern side of the islands with the other locations.
Figure 4-7. Photo of the daily and monthly solar path for the Sili solar PV location.
ASPA APPA DEED GRANT FINAL REPORT
4
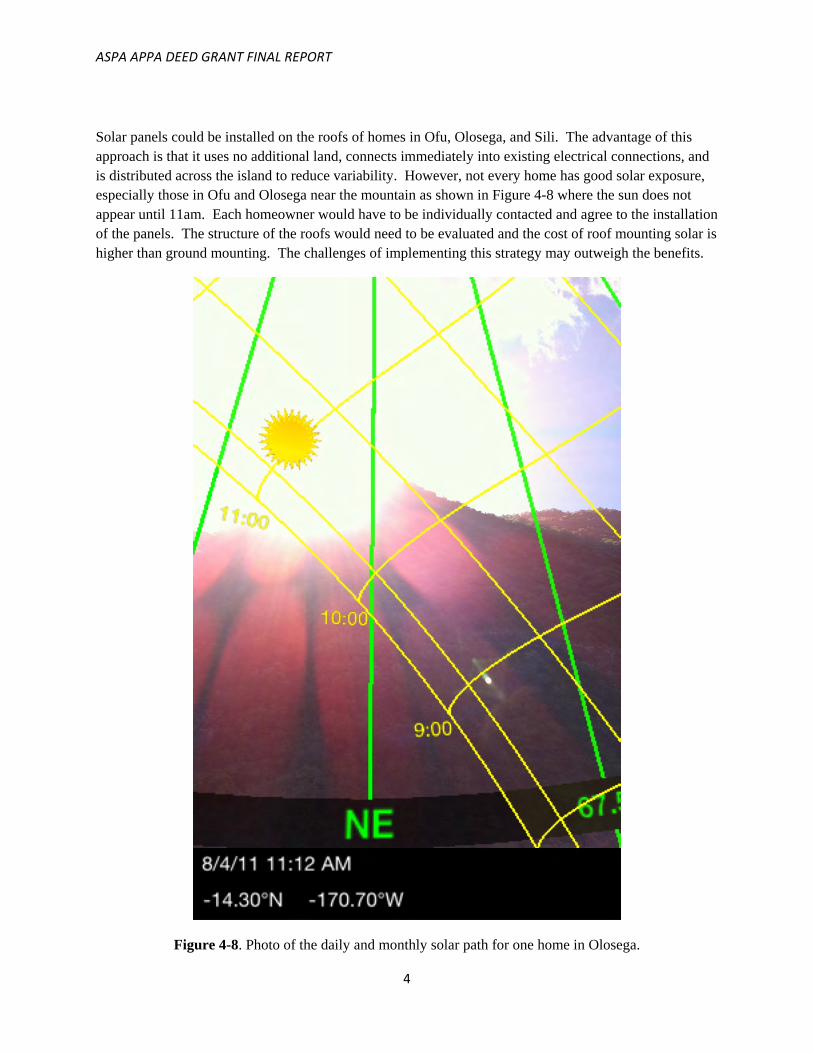
Solar panels could be installed on the roofs of homes in Ofu, Olosega, and Sili. The advantage of this approach is that it uses no additional land, connects immediately into existing electrical connections, and is distributed across the island to reduce variability. However, not every home has good solar exposure, especially those in Ofu and Olosega near the mountain as shown in Figure 4-8 where the sun does not appear until 11am. Each homeowner would have to be individually contacted and agree to the installation of the panels. The structure of the roofs would need to be evaluated and the cost of roof mounting solar is higher than ground mounting. The challenges of implementing this strategy may outweigh the benefits.
Figure 4-8. Photo of the daily and monthly solar path for one home in Olosega.
ASPA APPA DEED GRANT FINAL REPORT
5
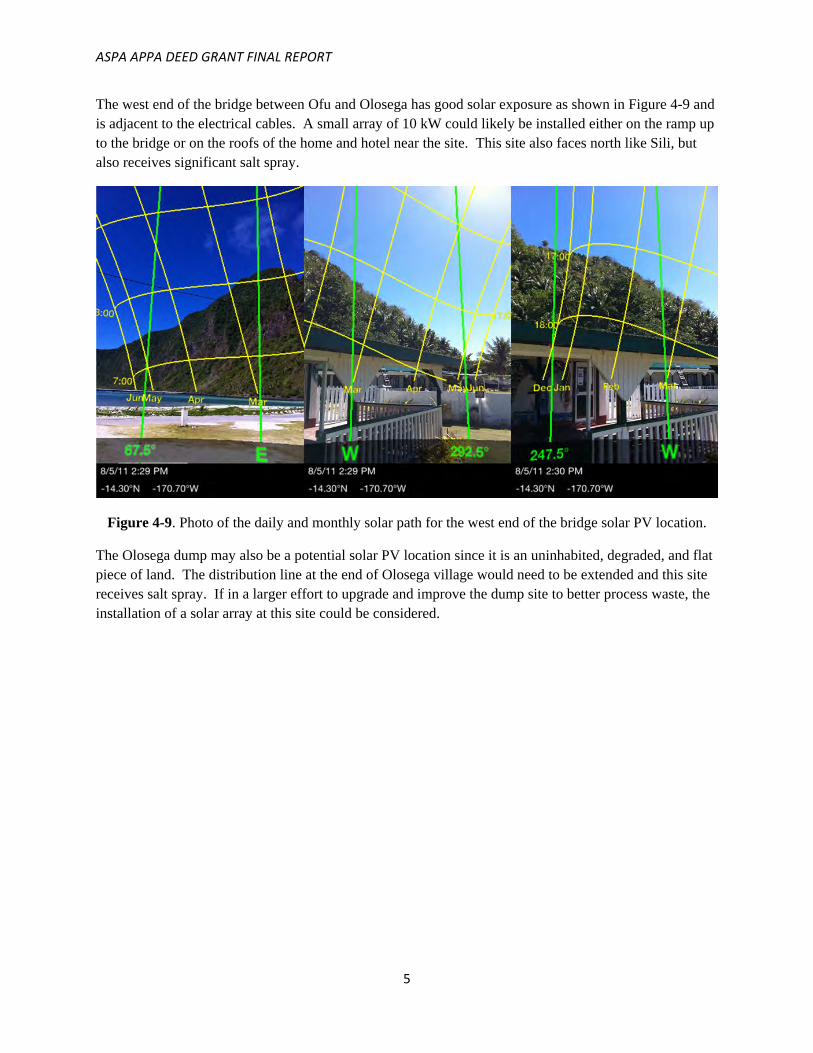
The west end of the bridge between Ofu and Olosega has good solar exposure as shown in Figure 4-9 and is adjacent to the electrical cables. A small array of 10 kW could likely be installed either on the ramp up to the bridge or on the roofs of the home and hotel near the site. This site also faces north like Sili, but also receives significant salt spray.
Figure 4-9. Photo of the daily and monthly solar path for the west end of the bridge solar PV location.
The Olosega dump may also be a potential solar PV location since it is an uninhabited, degraded, and flat piece of land. The distribution line at the end of Olosega village would need to be extended and this site receives salt spray. If in a larger effort to upgrade and improve the dump site to better process waste, the installation of a solar array at this site could be considered.
ASPA APPA DEED GRANT FINAL REPORT
6
5. Wind Power
5.1. Observations and Analysis
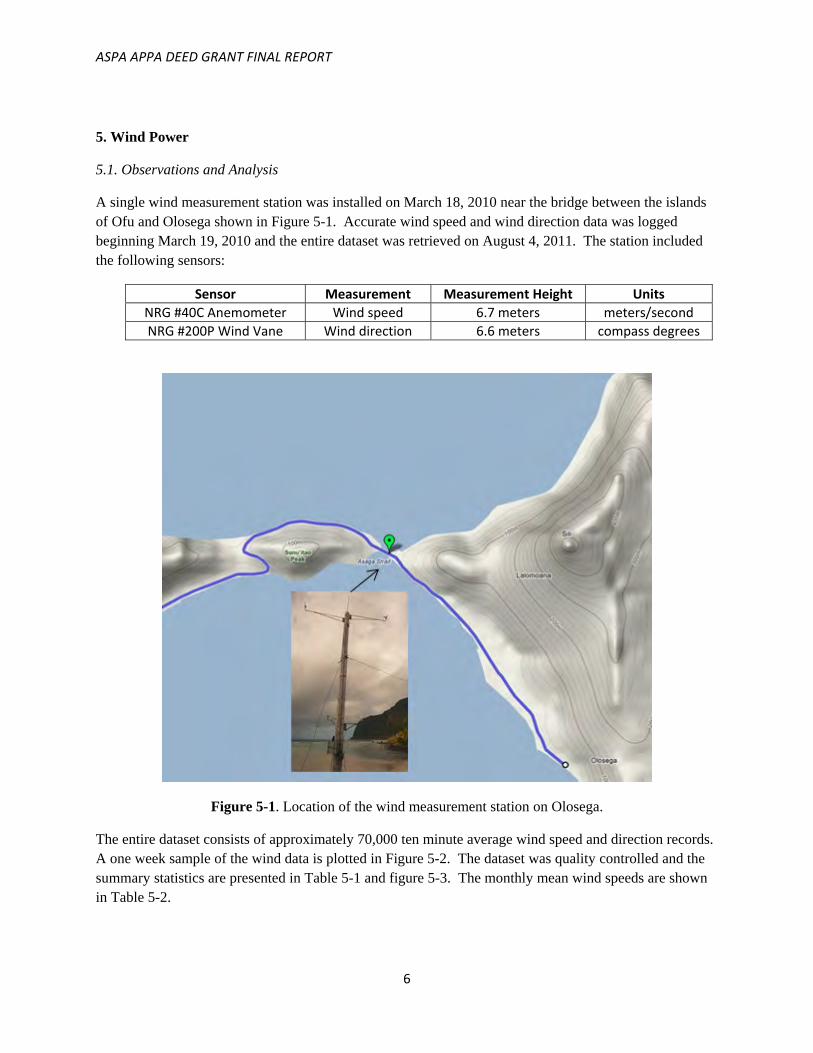
A single wind measurement station was installed on March 18, 2010 near the bridge between the islands of Ofu and Olosega shown in Figure 5-1. Accurate wind speed and wind direction data was logged beginning March 19, 2010 and the entire dataset was retrieved on August 4, 2011. The station included the following sensors:
Sensor Measurement Measurement Height Units NRG #40C Anemometer Wind speed 6.7 meters meters/second NRG #200P Wind Vane Wind direction 6.6 meters compass degrees
Figure 5-1. Location of the wind measurement station on Olosega.
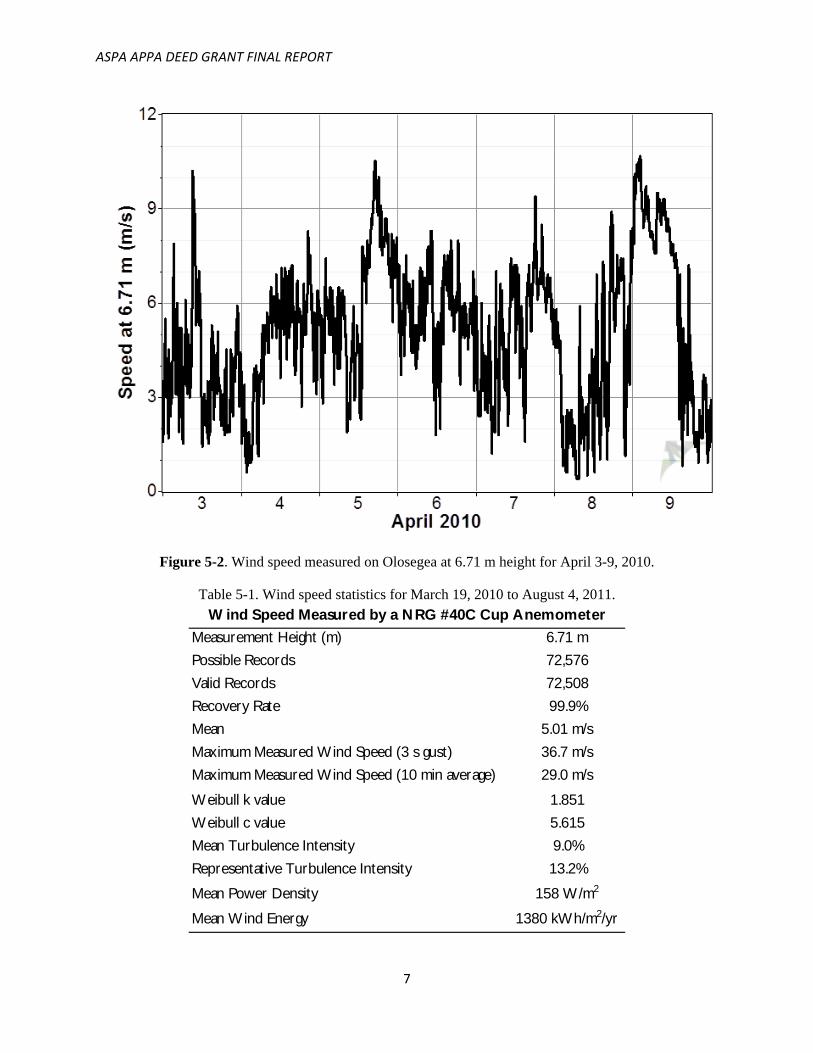
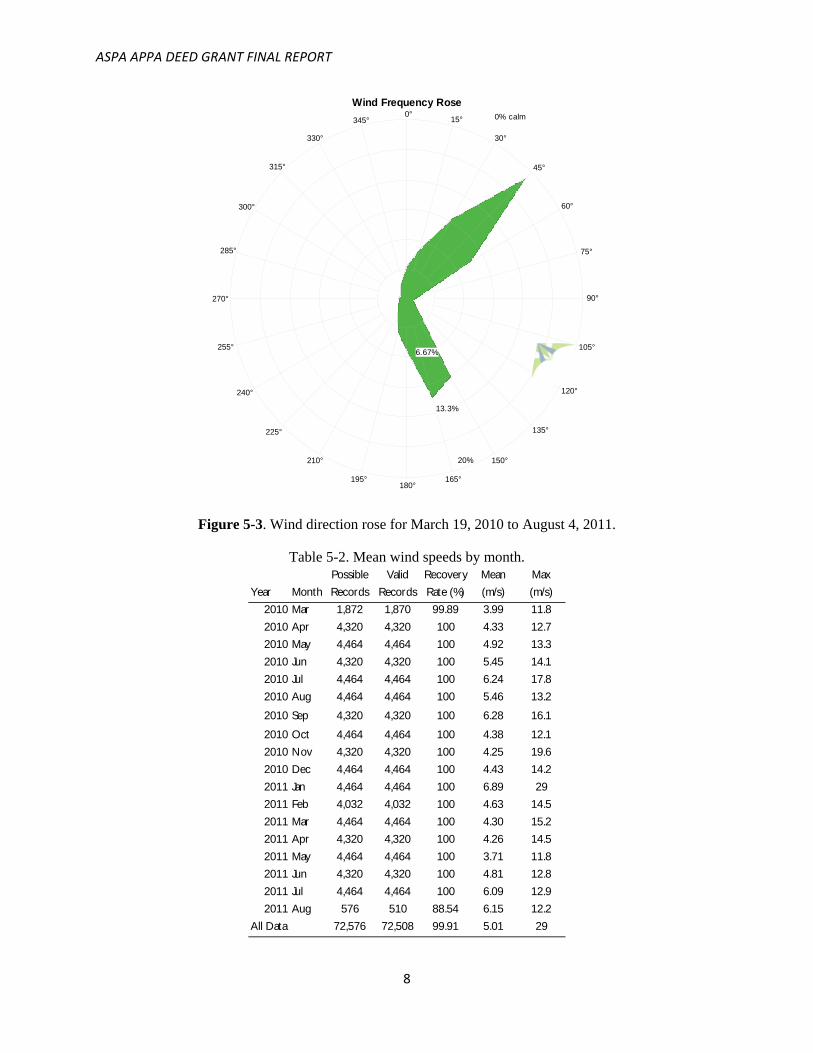
The entire dataset consists of approximately 70,000 ten minute average wind speed and direction records. A one week sample of the wind data is plotted in Figure 5-2. The dataset was quality controlled and the summary statistics are presented in Table 5-1 and figure 5-3. The monthly mean wind speeds are shown in Table 5-2.
ASPA APPA DEED GRANT FINAL REPORT
7
Figure 5-2. Wind speed measured on Olosegea at 6.71 m height for April 3-9, 2010.
Table 5-1. Wind speed statistics for March 19, 2010 to August 4, 2011.
Measurement Height (m) 6.71 m
Possible Records 72,576
Valid Records 72,508
Recovery Rate 99.9%
Mean 5.01 m/s
Maximum Measured Wind Speed (3 s gust) 36.7 m/s
Maximum Measured Wind Speed (10 min average) 29.0 m/s
Weibull k value 1.851
Weibull c value 5.615
Mean Turbulence Intensity 9.0%
Representative Turbulence Intensity 13.2%
Mean Power Density 158 W/m2
Mean Wind Energy 1380 kWh/m2/yr
W ind Speed Measured by a NRG #40C Cup Anemometer
ASPA APPA DEED GRANT FINAL REPORT
8
Wind Frequency Rose0°
15°
30°
45°
60°
75°
90°
105°
120°
135°
150°
165°180°
195°
210°
225°
240°
255°
270°
285°
300°
315°
330°
345° 0% calm
6.67%
13.3%
20%
Figure 5-3. Wind direction rose for March 19, 2010 to August 4, 2011.
Table 5-2. Mean wind speeds by month. Possible Valid Recovery Mean Max
Year Month Records Records Rate (%) (m/s) (m/s)
2010 Mar 1,872 1,870 99.89 3.99 11.8
2010 Apr 4,320 4,320 100 4.33 12.7
2010 May 4,464 4,464 100 4.92 13.3
2010 Jun 4,320 4,320 100 5.45 14.1
2010 Jul 4,464 4,464 100 6.24 17.8
2010 Aug 4,464 4,464 100 5.46 13.2
2010 Sep 4,320 4,320 100 6.28 16.1
2010 Oct 4,464 4,464 100 4.38 12.1
2010 Nov 4,320 4,320 100 4.25 19.6
2010 Dec 4,464 4,464 100 4.43 14.2
2011 Jan 4,464 4,464 100 6.89 29
2011 Feb 4,032 4,032 100 4.63 14.5
2011 Mar 4,464 4,464 100 4.30 15.2
2011 Apr 4,320 4,320 100 4.26 14.5
2011 May 4,464 4,464 100 3.71 11.8
2011 Jun 4,320 4,320 100 4.81 12.8
2011 Jul 4,464 4,464 100 6.09 12.9
2011 Aug 576 510 88.54 6.15 12.2
All Data 72,576 72,508 99.91 5.01 29
ASPA APPA DEED GRANT FINAL REPORT
9
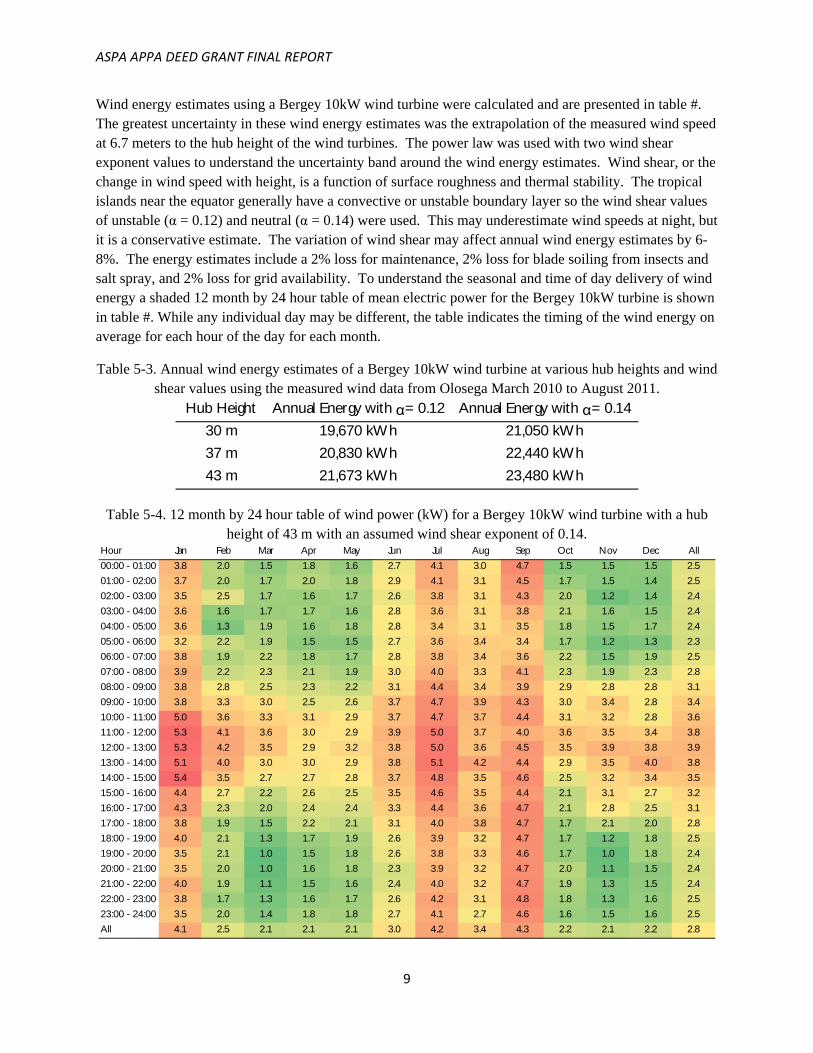
Wind energy estimates using a Bergey 10kW wind turbine were calculated and are presented in table #. The greatest uncertainty in these wind energy estimates was the extrapolation of the measured wind speed at 6.7 meters to the hub height of the wind turbines. The power law was used with two wind shear exponent values to understand the uncertainty band around the wind energy estimates. Wind shear, or the change in wind speed with height, is a function of surface roughness and thermal stability. The tropical islands near the equator generally have a convective or unstable boundary layer so the wind shear values of unstable (α = 0.12) and neutral (α = 0.14) were used. This may underestimate wind speeds at night, but it is a conservative estimate. The variation of wind shear may affect annual wind energy estimates by 6-8%. The energy estimates include a 2% loss for maintenance, 2% loss for blade soiling from insects and salt spray, and 2% loss for grid availability. To understand the seasonal and time of day delivery of wind energy a shaded 12 month by 24 hour table of mean electric power for the Bergey 10kW turbine is shown in table #. While any individual day may be different, the table indicates the timing of the wind energy on average for each hour of the day for each month.
Table 5-3. Annual wind energy estimates of a Bergey 10kW wind turbine at various hub heights and wind shear values using the measured wind data from Olosega March 2010 to August 2011.
Hub Height Annual Energy with α= 0.12 Annual Energy with α= 0.14
30 m 19,670 kWh 21,050 kWh
37 m 20,830 kWh 22,440 kWh
43 m 21,673 kWh 23,480 kWh
Table 5-4. 12 month by 24 hour table of wind power (kW) for a Bergey 10kW wind turbine with a hub height of 43 m with an assumed wind shear exponent of 0.14.
Hour Jan Feb Mar Apr May Jun Jul Aug Sep Oct Nov Dec All
00:00 - 01:00 3.8 2.0 1.5 1.8 1.6 2.7 4.1 3.0 4.7 1.5 1.5 1.5 2.5
01:00 - 02:00 3.7 2.0 1.7 2.0 1.8 2.9 4.1 3.1 4.5 1.7 1.5 1.4 2.5
02:00 - 03:00 3.5 2.5 1.7 1.6 1.7 2.6 3.8 3.1 4.3 2.0 1.2 1.4 2.4
03:00 - 04:00 3.6 1.6 1.7 1.7 1.6 2.8 3.6 3.1 3.8 2.1 1.6 1.5 2.4
04:00 - 05:00 3.6 1.3 1.9 1.6 1.8 2.8 3.4 3.1 3.5 1.8 1.5 1.7 2.4
05:00 - 06:00 3.2 2.2 1.9 1.5 1.5 2.7 3.6 3.4 3.4 1.7 1.2 1.3 2.3
06:00 - 07:00 3.8 1.9 2.2 1.8 1.7 2.8 3.8 3.4 3.6 2.2 1.5 1.9 2.5
07:00 - 08:00 3.9 2.2 2.3 2.1 1.9 3.0 4.0 3.3 4.1 2.3 1.9 2.3 2.8
08:00 - 09:00 3.8 2.8 2.5 2.3 2.2 3.1 4.4 3.4 3.9 2.9 2.8 2.8 3.1
09:00 - 10:00 3.8 3.3 3.0 2.5 2.6 3.7 4.7 3.9 4.3 3.0 3.4 2.8 3.4
10:00 - 11:00 5.0 3.6 3.3 3.1 2.9 3.7 4.7 3.7 4.4 3.1 3.2 2.8 3.6
11:00 - 12:00 5.3 4.1 3.6 3.0 2.9 3.9 5.0 3.7 4.0 3.6 3.5 3.4 3.8
12:00 - 13:00 5.3 4.2 3.5 2.9 3.2 3.8 5.0 3.6 4.5 3.5 3.9 3.8 3.9
13:00 - 14:00 5.1 4.0 3.0 3.0 2.9 3.8 5.1 4.2 4.4 2.9 3.5 4.0 3.8
14:00 - 15:00 5.4 3.5 2.7 2.7 2.8 3.7 4.8 3.5 4.6 2.5 3.2 3.4 3.5
15:00 - 16:00 4.4 2.7 2.2 2.6 2.5 3.5 4.6 3.5 4.4 2.1 3.1 2.7 3.2
16:00 - 17:00 4.3 2.3 2.0 2.4 2.4 3.3 4.4 3.6 4.7 2.1 2.8 2.5 3.1
17:00 - 18:00 3.8 1.9 1.5 2.2 2.1 3.1 4.0 3.8 4.7 1.7 2.1 2.0 2.8
18:00 - 19:00 4.0 2.1 1.3 1.7 1.9 2.6 3.9 3.2 4.7 1.7 1.2 1.8 2.5
19:00 - 20:00 3.5 2.1 1.0 1.5 1.8 2.6 3.8 3.3 4.6 1.7 1.0 1.8 2.4
20:00 - 21:00 3.5 2.0 1.0 1.6 1.8 2.3 3.9 3.2 4.7 2.0 1.1 1.5 2.4
21:00 - 22:00 4.0 1.9 1.1 1.5 1.6 2.4 4.0 3.2 4.7 1.9 1.3 1.5 2.4
22:00 - 23:00 3.8 1.7 1.3 1.6 1.7 2.6 4.2 3.1 4.8 1.8 1.3 1.6 2.5
23:00 - 24:00 3.5 2.0 1.4 1.8 1.8 2.7 4.1 2.7 4.6 1.6 1.5 1.6 2.5
All 4.1 2.5 2.1 2.1 2.1 3.0 4.2 3.4 4.3 2.2 2.1 2.2 2.8
ASPA APPA DEED GRANT FINAL REPORT
10
Table 5-4 shows the majority of wind energy is delivered during the day and especially the middle of the day around noon. The generation of electricity during these hours may support the lunch time demand for electric power for cooking. The season with the greatest wind energy production is June to September. January also has good wind energy production but this is from cyclones and storms, especially the storm measured on January 22-24, 2011. These events have high wind speeds for several days that increase the average power output over the month, which would otherwise have low wind power production comparable to December.
A preliminary economic analysis of the cost of wind generated electricity for a wind turbine located at or near the measured site indicates the levelized cost of wind generated electricity is between $0.16/kWh and $0.19/kWh. This is cost competitive with the existing diesel generator and an added benefit of wind power is that it has no fuel price volatility since the installed cost of the wind turbine represents nearly the entire cost of ownership of a small wind turbine, which requires very little maintenance. An Excel spreadsheet with the cost of energy analysis has been shared with ASPA. The analysis uses the measured wind data and the following assumptions:
• Total installed cost of the wind turbine including turbine, tower, shipping, and installation costs $67,155
• The wind turbine is purchased with a loan at 5% interest rate with a 10 year term
• A discount rate of 8%
• The wind turbine has an economic life of 15 years
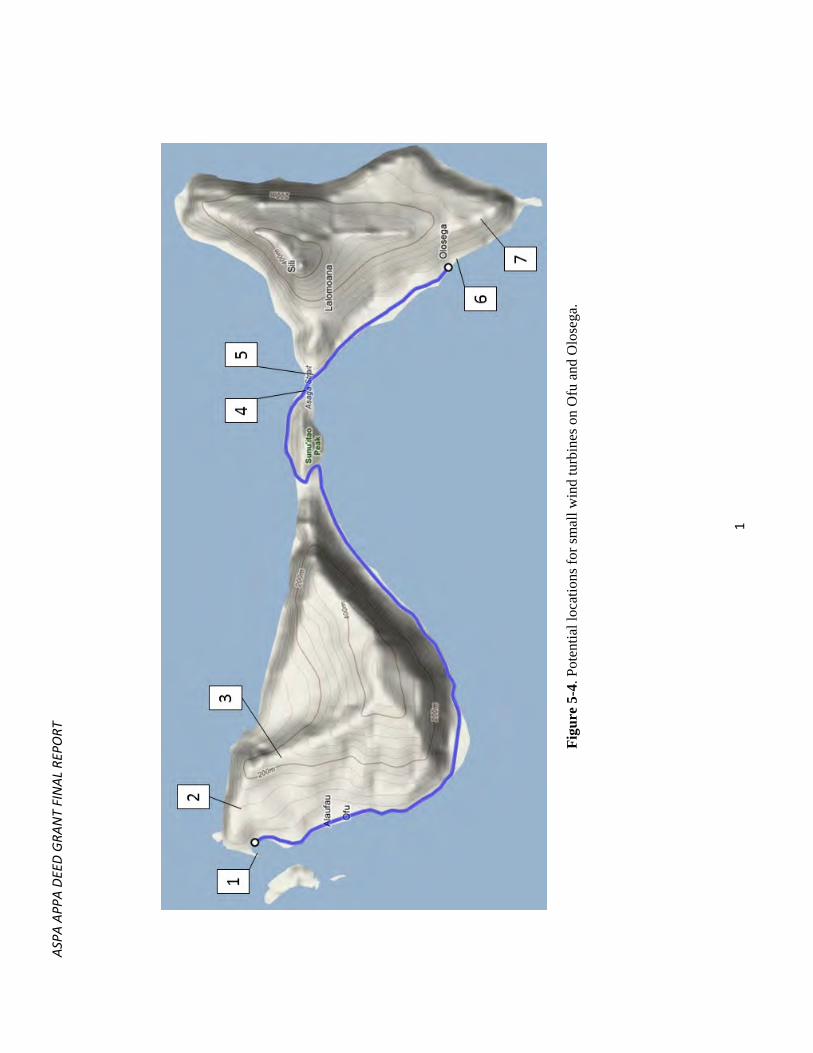
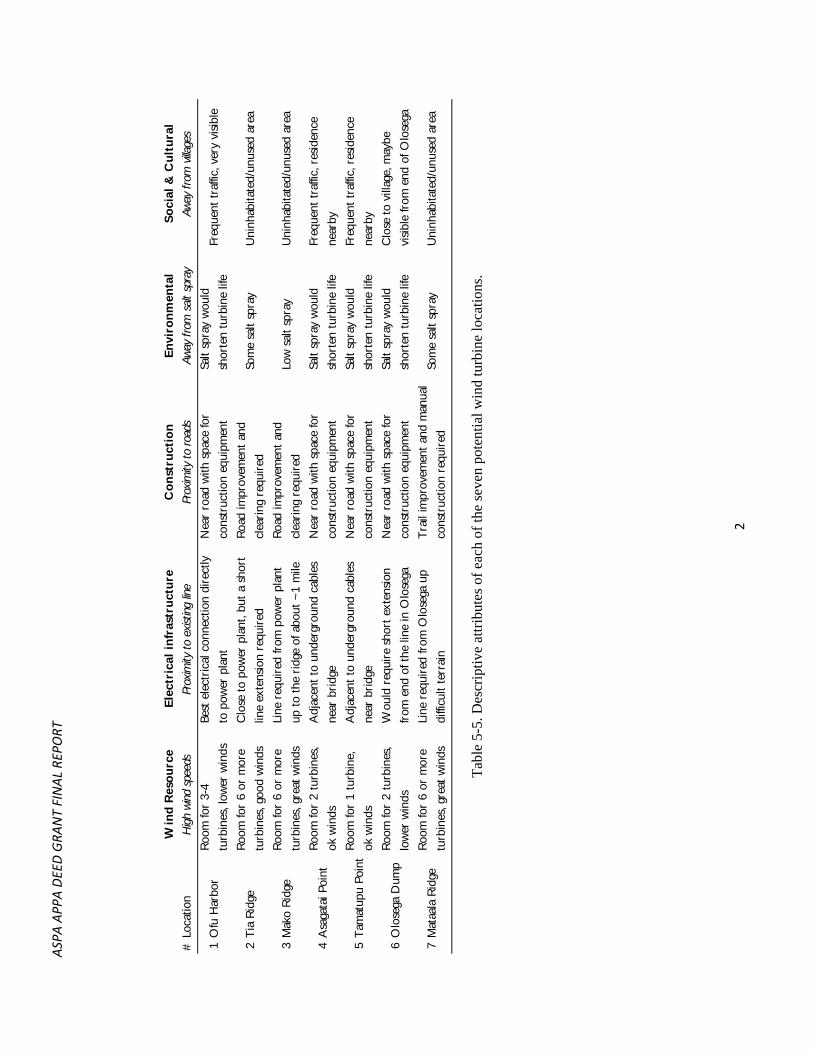
A map study and terrain walk of Ofu and Olosega in March 2010 and August 2011 indicates several potential locations for erecting small wind turbines. Locating wind turbines is an optimization process. The attributes of a good site include: (1) exposure to the best winds on the island, (2) close to the existing overhead distribution lines, (3) sited near the existing road for construction and maintenance access, (4) located away from the ocean to reduce salt spray exposure, and (5) suitable for the land owner and generally away from the population and archeological sites for safety and security. No potential wind turbine location has all these attributes, but seven possible locations are suggested on the Figure 5-4. The locations and their attributes are described in Table 5-5.

ASPA APPA DEED GRANT FINAL REPORT
11
ASP
A A
PPA
DEE
D G
RAN
T FI
NA
L RE
PORT
1
Fig
ure
5-4
. Pot
enti
al lo
cati
ons
for
smal
l win
d tu
rbin
es o
n O
fu a
nd O
lose
ga.
ASP
A A
PPA
DEE
D G
RAN
T FI
NA
L RE
PORT
2
Win
d R
eso
urc
eE
lect
rica
l in
fras
tru
ctu
reC
on
stru
ctio
nE
nvi
ron
men
tal
So
cial
& C
ult
ura
l
#Lo
catio
nH
igh w
ind s
peed
sPr
oxim
ity to
exis
ting
line
Prox
imity
to ro
ads
Away
from
salt
spr
ayAw
ay fr
om v
illage
s
1O
fu H
arbo
rR
oom
for
3-4
turb
ines
, low
er w
inds
Best
ele
ctri
cal c
onne
ctio
n di
rect
ly
to p
ower
pla
nt
Nea
r ro
ad w
ith s
pace
for
cons
truc
tion
equi
pmen
t
Salt
spra
y w
ould
shor
ten
turb
ine
life
Freq
uent
tra
ffic,
ver
y vi
sibl
e
2T
ia R
idge
Roo
m fo
r 6
or m
ore
turb
ines
, goo
d w
inds
Clo
se t
o po
wer
pla
nt, b
ut a
sho
rt
line
exte
nsio
n re
quir
ed
Roa
d im
prov
emen
t an
d
clea
ring
req
uire
dSo
me
salt
spra
yU
ninh
abita
ted/
unus
ed a
rea
3M
ako
Rid
geR
oom
for
6 or
mor
e
turb
ines
, gre
at w
inds
Line
req
uire
d fr
om p
ower
pla
nt
up t
o th
e ri
dge
of a
bout
~1
mile
Roa
d im
prov
emen
t an
d
clea
ring
req
uire
dLo
w s
alt
spra
yU
ninh
abita
ted/
unus
ed a
rea
4A
saga
tai P
oint
Roo
m fo
r 2
turb
ines
,
ok w
inds
Adj
acen
t to
und
ergr
ound
cab
les
near
bri
dge
Nea
r ro
ad w
ith s
pace
for
cons
truc
tion
equi
pmen
t
Salt
spra
y w
ould
shor
ten
turb
ine
life
Freq
uent
tra
ffic,
res
iden
ce
near
by
5T
amat
upu
Poin
tR
oom
for
1 tu
rbin
e,
ok w
inds
Adj
acen
t to
und
ergr
ound
cab
les
near
bri
dge
Nea
r ro
ad w
ith s
pace
for
cons
truc
tion
equi
pmen
t
Salt
spra
y w
ould
shor
ten
turb
ine
life
Freq
uent
tra
ffic,
res
iden
ce
near
by
6O
lose
ga D
ump
Roo
m fo
r 2
turb
ines
,
low
er w
inds
Wou
ld r
equi
re s
hort
ext
ensi
on
from
end
of t
he li
ne in
Olo
sega
Nea
r ro
ad w
ith s
pace
for
cons
truc
tion
equi
pmen
t
Salt
spra
y w
ould
shor
ten
turb
ine
life
Clo
se t
o vi
llage
, may
be
visi
ble
from
end
of O
lose
ga
7M
ataa
la R
idge
Roo
m fo
r 6
or m
ore
turb
ines
, gre
at w
inds
Line
req
uire
d fr
om O
lose
ga u
p
diffi
cult
terr
ain
Tra
il im
prov
emen
t an
d m
anua
l
cons
truc
tion
requ
ired
Som
e sa
lt sp
ray
Uni
nhab
itate
d/un
used
are
a
Tab
le 5
-5. D
escr
ipti
ve a
ttri
bute
s of
eac
h of
the
seve
n po
tent
ial w
ind
turb
ine
loca
tion
s.

ASP
A A
PPA
DEE
D G
RAN
T FI
NA
L RE
PORT
3
ASPA APPA DEED GRANT FINAL REPORT
1
5.2. Recommendations
The wind data indicates a sufficient wind energy resource exists to supply Ofu and Olosega with some wind generated electricity. The preliminary economic analysis suggested wind generated electricity is competitive or lower in cost than the existing diesel generated electricity. However, the wind data lacks sufficient vertical and spatial coverage to support a detailed economic analysis for installing turbines elsewhere on the island at locations that may be more appropriate than near the bridge. The following next steps are recommended to pursue wind power:
• Install a Bergey 10kW wind turbine on Olosega as part of a Department of Energy Wind for Schools program. The installation of a wind turbine will support science and math education at the Olosega elementary school, and if arranged as a net metering program can reduce the electricity bill of the school. The installation of this single wind turbine will also allow for field testing by ASPA of the electrical connection and integration of the wind turbine on the Ofu-Olosega electrical system prior to installing additional wind turbines elsewhere on the island. The installation of the wind turbine to support education goals will increase the probability of receiving a grant to support some or all of the costs of the wind turbine. This approach is a least cost, low risk way to field wind turbines and gain experience with them for ASPA.
• Identify an appropriate location from those suggested for the installation of several small wind turbines on Ofu or Olosega. Consult all relevant stakeholders on the island and within ASPA to approve the turbine location. Once the location(s) are selected, install a 30 meter or 50 meter meteorological tower to measure the wind speeds for at least one year. The NRG 34 meter tower package would likely be the most cost effective solution. It is important to measure the wind speed at multiple heights and preferably up to the hub height of the wind turbine. This wind measurement program will assist in finalizing the economic analysis required for the capital to install several wind turbines. A one year program should be sufficient.
ASPA APPA DEED GRANT FINAL REPORT
2
6. Achieving a 100-percent Renewables Grid on Ofu/Olosega
6.1. Observations and Analysis
The main difficulty with targeting 100% renewables for any grid is dealing with the need to continuously balance supply and demand. One way to do so is with a load-following biodiesel generator that complements the variable inputs from wind and solar. Another is to incorporate significant energy storage in the system. It is the latter approach that we explore in this section of our report.
6.1.1 Pumped-Hydro for Storage:
Three storage technologies come to mind: Solar-thermal storage coupled with concentrating solar power (CSP) systems, batteries, and pumped storage. CSP storage are complex, high-tech, and don’t easily scale down to small grids. Batteries are interesting, especially if they serve the dual purpose of powering electric vehicles (EVs) and, when plugged in, provide grid backup. Given the steep slopes along the shoreline of Ofu/Olosega, we decided to do some first-order calculations of the potential for pumped hydro (PH). PH involves tanks, pipes, valves and pumps--all straightforward technologies very familiar to ASPA staff and the local population itself, which we found to be a compelling argument in its favor.
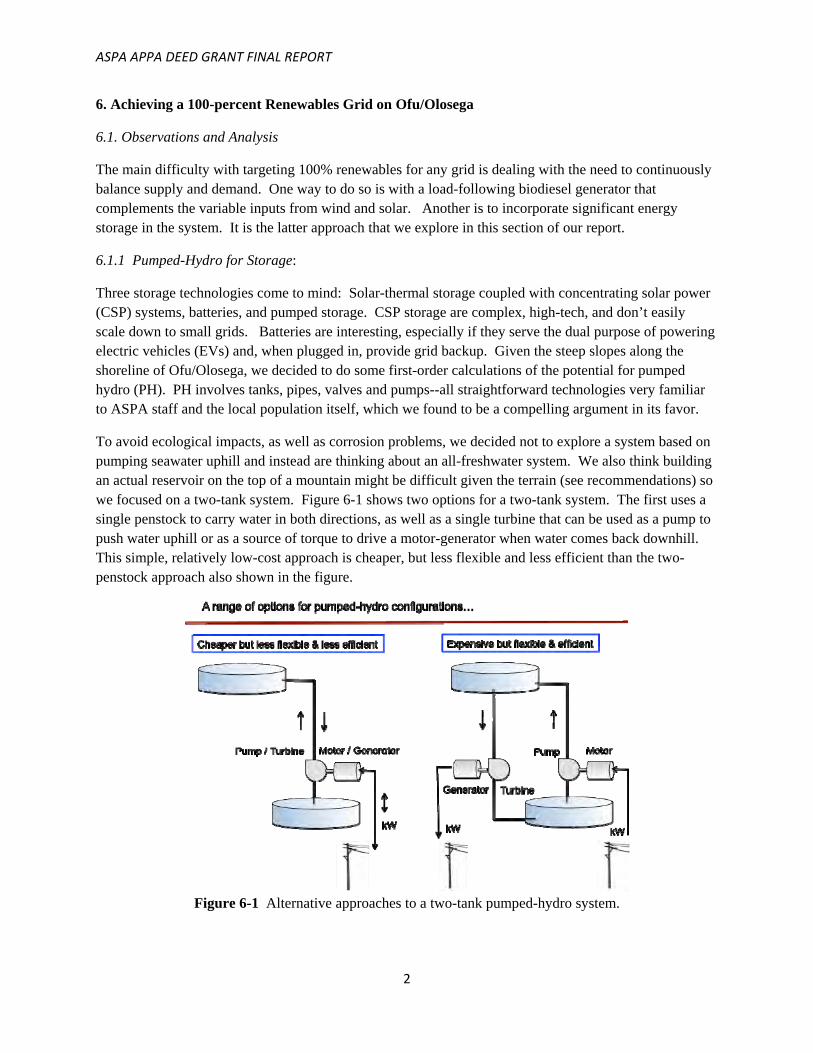
To avoid ecological impacts, as well as corrosion problems, we decided not to explore a system based on pumping seawater uphill and instead are thinking about an all-freshwater system. We also think building an actual reservoir on the top of a mountain might be difficult given the terrain (see recommendations) so we focused on a two-tank system. Figure 6-1 shows two options for a two-tank system. The first uses a single penstock to carry water in both directions, as well as a single turbine that can be used as a pump to push water uphill or as a source of torque to drive a motor-generator when water comes back downhill. This simple, relatively low-cost approach is cheaper, but less flexible and less efficient than the two-penstock approach also shown in the figure.
Figure 6-1 Alternative approaches to a two-tank pumped-hydro system.
ASPA APPA DEED GRANT FINAL REPORT
3
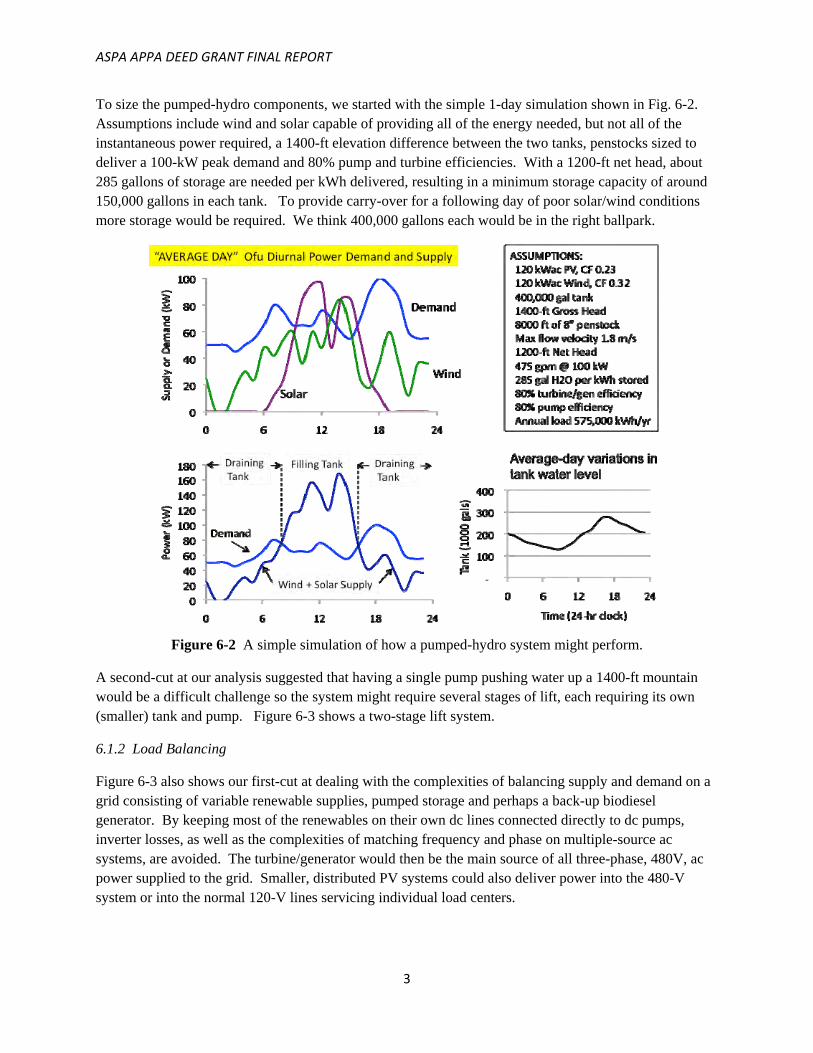
To size the pumped-hydro components, we started with the simple 1-day simulation shown in Fig. 6-2. Assumptions include wind and solar capable of providing all of the energy needed, but not all of the instantaneous power required, a 1400-ft elevation difference between the two tanks, penstocks sized to deliver a 100-kW peak demand and 80% pump and turbine efficiencies. With a 1200-ft net head, about 285 gallons of storage are needed per kWh delivered, resulting in a minimum storage capacity of around 150,000 gallons in each tank. To provide carry-over for a following day of poor solar/wind conditions more storage would be required. We think 400,000 gallons each would be in the right ballpark.
Figure 6-2 A simple simulation of how a pumped-hydro system might perform.
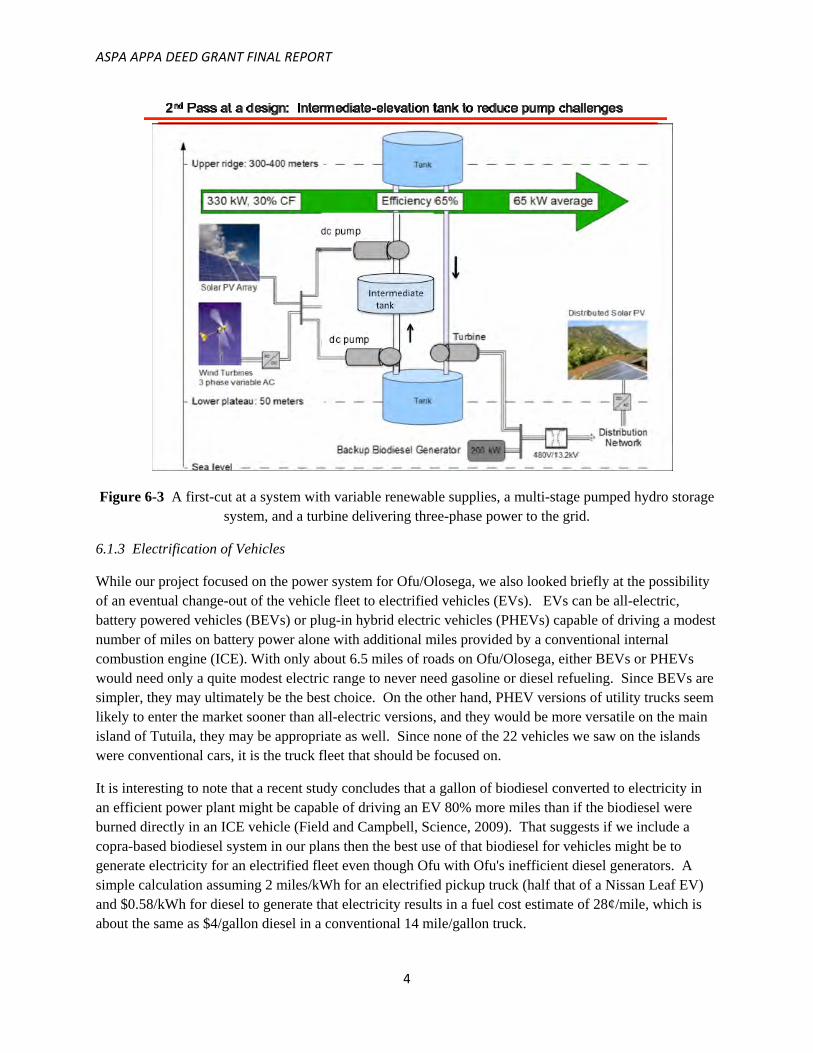
A second-cut at our analysis suggested that having a single pump pushing water up a 1400-ft mountain would be a difficult challenge so the system might require several stages of lift, each requiring its own (smaller) tank and pump. Figure 6-3 shows a two-stage lift system.
6.1.2 Load Balancing
Figure 6-3 also shows our first-cut at dealing with the complexities of balancing supply and demand on a grid consisting of variable renewable supplies, pumped storage and perhaps a back-up biodiesel generator. By keeping most of the renewables on their own dc lines connected directly to dc pumps, inverter losses, as well as the complexities of matching frequency and phase on multiple-source ac systems, are avoided. The turbine/generator would then be the main source of all three-phase, 480V, ac power supplied to the grid. Smaller, distributed PV systems could also deliver power into the 480-V system or into the normal 120-V lines servicing individual load centers.
ASPA APPA DEED GRANT FINAL REPORT
4
Figure 6-3 A first-cut at a system with variable renewable supplies, a multi-stage pumped hydro storage system, and a turbine delivering three-phase power to the grid.
6.1.3 Electrification of Vehicles
While our project focused on the power system for Ofu/Olosega, we also looked briefly at the possibility of an eventual change-out of the vehicle fleet to electrified vehicles (EVs). EVs can be all-electric, battery powered vehicles (BEVs) or plug-in hybrid electric vehicles (PHEVs) capable of driving a modest number of miles on battery power alone with additional miles provided by a conventional internal combustion engine (ICE). With only about 6.5 miles of roads on Ofu/Olosega, either BEVs or PHEVs would need only a quite modest electric range to never need gasoline or diesel refueling. Since BEVs are simpler, they may ultimately be the best choice. On the other hand, PHEV versions of utility trucks seem likely to enter the market sooner than all-electric versions, and they would be more versatile on the main island of Tutuila, they may be appropriate as well. Since none of the 22 vehicles we saw on the islands were conventional cars, it is the truck fleet that should be focused on.
It is interesting to note that a recent study concludes that a gallon of biodiesel converted to electricity in an efficient power plant might be capable of driving an EV 80% more miles than if the biodiesel were burned directly in an ICE vehicle (Field and Campbell, Science, 2009). That suggests if we include a copra-based biodiesel system in our plans then the best use of that biodiesel for vehicles might be to generate electricity for an electrified fleet even though Ofu with Ofu's inefficient diesel generators. A simple calculation assuming 2 miles/kWh for an electrified pickup truck (half that of a Nissan Leaf EV) and $0.58/kWh for diesel to generate that electricity results in a fuel cost estimate of 28¢/mile, which is about the same as $4/gallon diesel in a conventional 14 mile/gallon truck.
ASPA APPA DEED GRANT FINAL REPORT
5
Even photovoltaics as the source of electricity for an EV makes sense. Assuming $8/Wp for PVs, paid for with a 5%, 20-yr loan having a CRF of $0.08/yr, a 0.75 dc/ac de-rating factor, 5 kWh/m2-yr insolation (5 hrs/day of full sun), the cost of PV-electricity for a 2 mi/kWh pickup truck would be:
PV for EV cost =$8/Wdc x 0.080/yr x 1000Whr/2miles
0.75dc/ac x 5hr/day x 365day/yr= $0.23/mi
Thus, photovoltaics electricity for an EV pickup truck is cheaper (23¢/mile) than conventional $4/gallon diesel costing 28¢/mile.
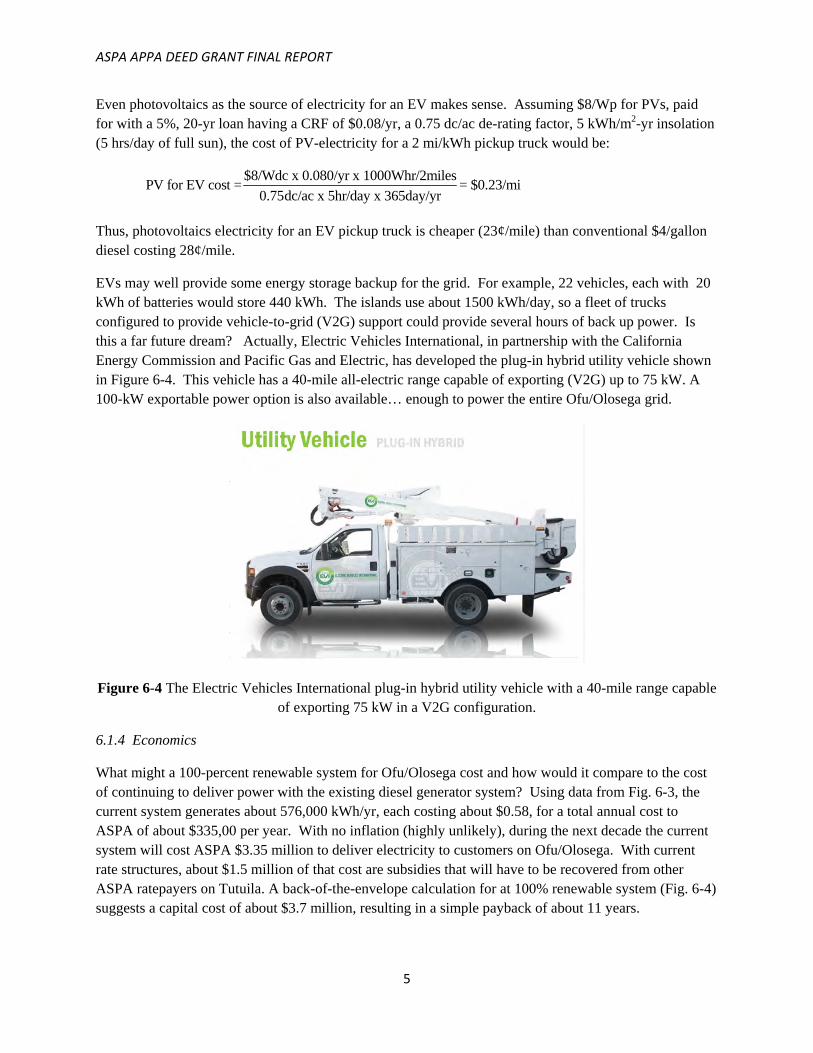
EVs may well provide some energy storage backup for the grid. For example, 22 vehicles, each with 20 kWh of batteries would store 440 kWh. The islands use about 1500 kWh/day, so a fleet of trucks configured to provide vehicle-to-grid (V2G) support could provide several hours of back up power. Is this a far future dream? Actually, Electric Vehicles International, in partnership with the California Energy Commission and Pacific Gas and Electric, has developed the plug-in hybrid utility vehicle shown in Figure 6-4. This vehicle has a 40-mile all-electric range capable of exporting (V2G) up to 75 kW. A 100-kW exportable power option is also available… enough to power the entire Ofu/Olosega grid.
Figure 6-4 The Electric Vehicles International plug-in hybrid utility vehicle with a 40-mile range capable of exporting 75 kW in a V2G configuration.
6.1.4 Economics
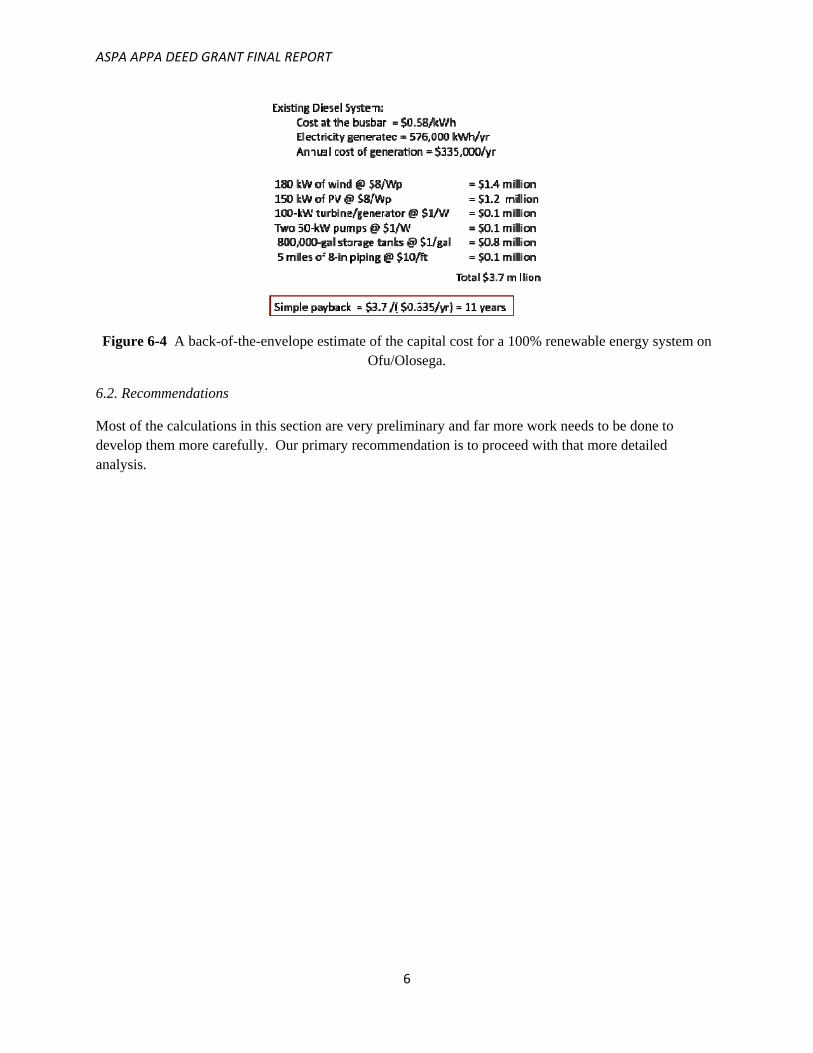
What might a 100-percent renewable system for Ofu/Olosega cost and how would it compare to the cost of continuing to deliver power with the existing diesel generator system? Using data from Fig. 6-3, the current system generates about 576,000 kWh/yr, each costing about $0.58, for a total annual cost to ASPA of about $335,00 per year. With no inflation (highly unlikely), during the next decade the current system will cost ASPA $3.35 million to deliver electricity to customers on Ofu/Olosega. With current rate structures, about $1.5 million of that cost are subsidies that will have to be recovered from other ASPA ratepayers on Tutuila. A back-of-the-envelope calculation for at 100% renewable system (Fig. 6-4) suggests a capital cost of about $3.7 million, resulting in a simple payback of about 11 years.
ASPA APPA DEED GRANT FINAL REPORT
6
Figure 6-4 A back-of-the-envelope estimate of the capital cost for a 100% renewable energy system on Ofu/Olosega.
6.2. Recommendations
Most of the calculations in this section are very preliminary and far more work needs to be done to develop them more carefully. Our primary recommendation is to proceed with that more detailed analysis.