Embed Size (px)
Citation preview

American Views of Spirituality
Survey of Over 2,000 American Adults
2
Methodology
The online survey of adult Americans was conducted September 23 – 26, 2011
A sample of an online panel representing the adult population of the US was invited to participate
Responses were weighted by region, party, age, race, religion, gender and education to more accurately reflect the population
3
Methodology Continued
The completed sample is 2,144 online surveys The sample provides 95% confidence that the
sampling error does not exceed +2.2% Margins of error are higher in sub-groups
Survey Responses
5
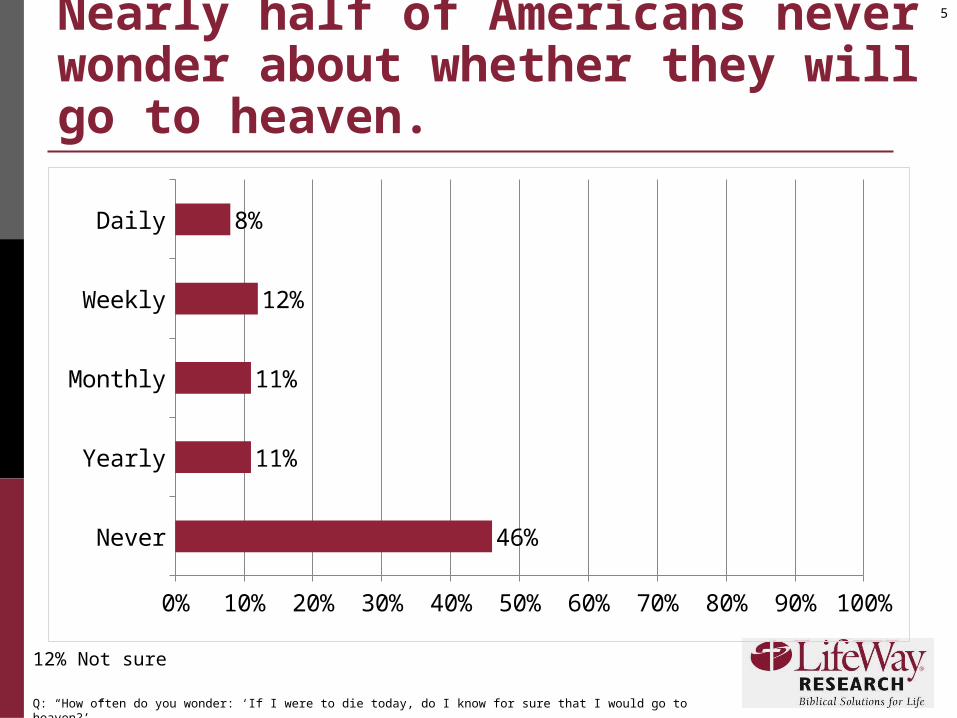
Nearly half of Americans never wonder about whether they will go to heaven.
Never
Yearly
Monthly
Weekly
Daily
0% 10% 20% 30% 40% 50% 60% 70% 80% 90% 100%
46%
11%
11%
12%
8%
12% Not sure
Q: “How often do you wonder: ‘If I were to die today, do I know for sure that I would go to heaven?’”
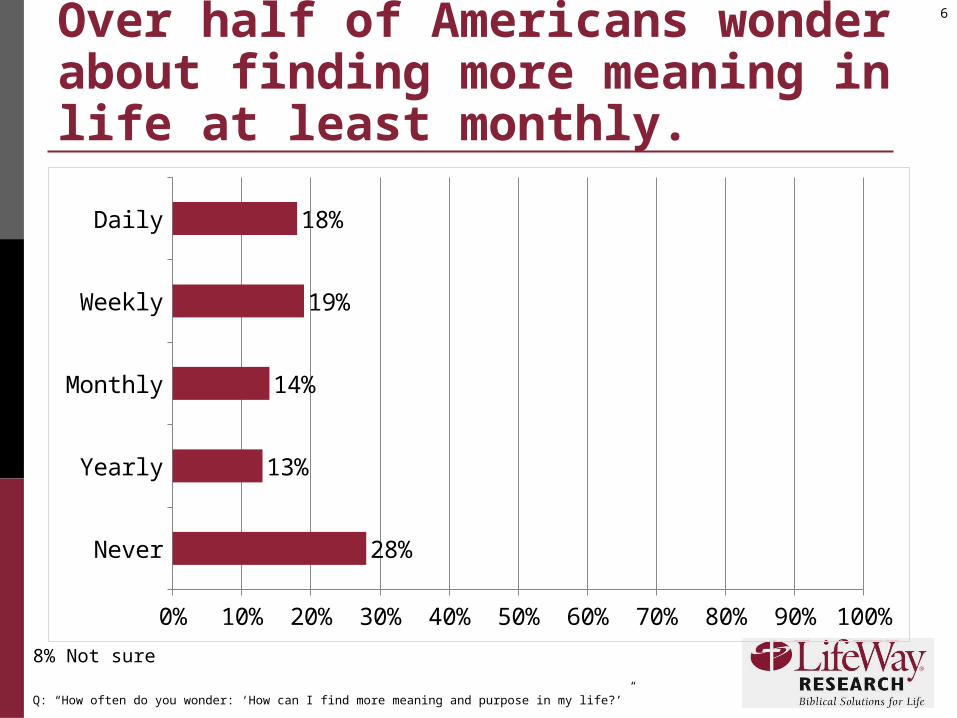
6Over half of Americans wonder about finding more meaning in life at least monthly.
Never
Yearly
Monthly
Weekly
Daily
0% 10% 20% 30% 40% 50% 60% 70% 80% 90% 100%
28%
13%
14%
19%
18%
8% Not sure
Q: “How often do you wonder: ‘How can I find more meaning and purpose in my life?’”
7
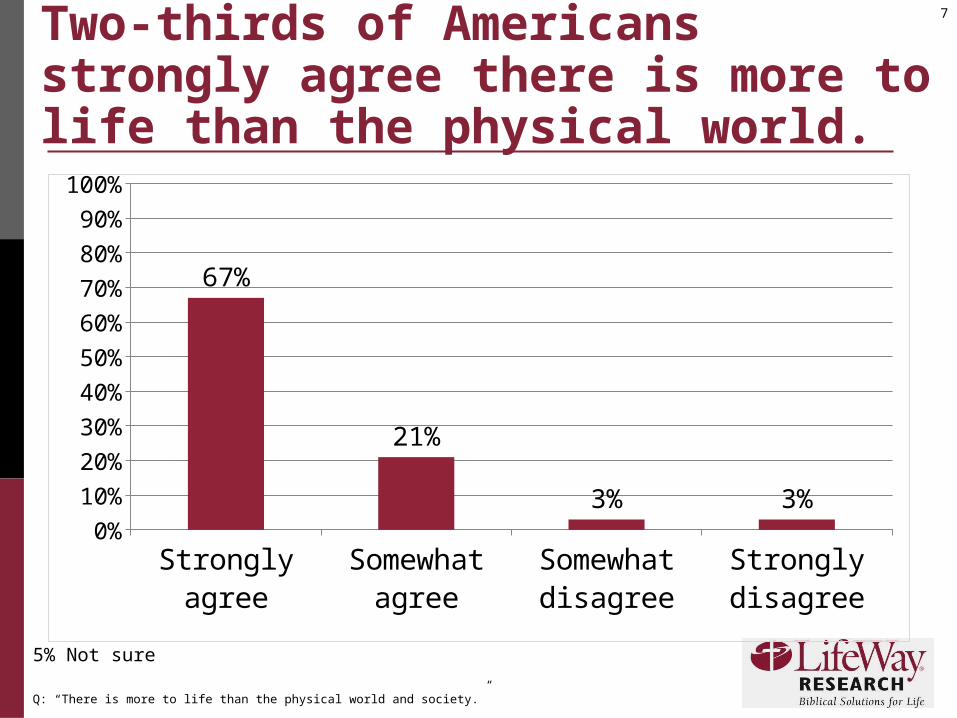
Two-thirds of Americans strongly agree there is more to life than the physical world.
Strongly agree
Somewhat agree
Somewhat disagree
Strongly disagree
0%
10%
20%
30%
40%
50%
60%
70%
80%
90%
100%
67%
21%
3% 3%
5% Not sure
Q: “There is more to life than the physical world and society.”
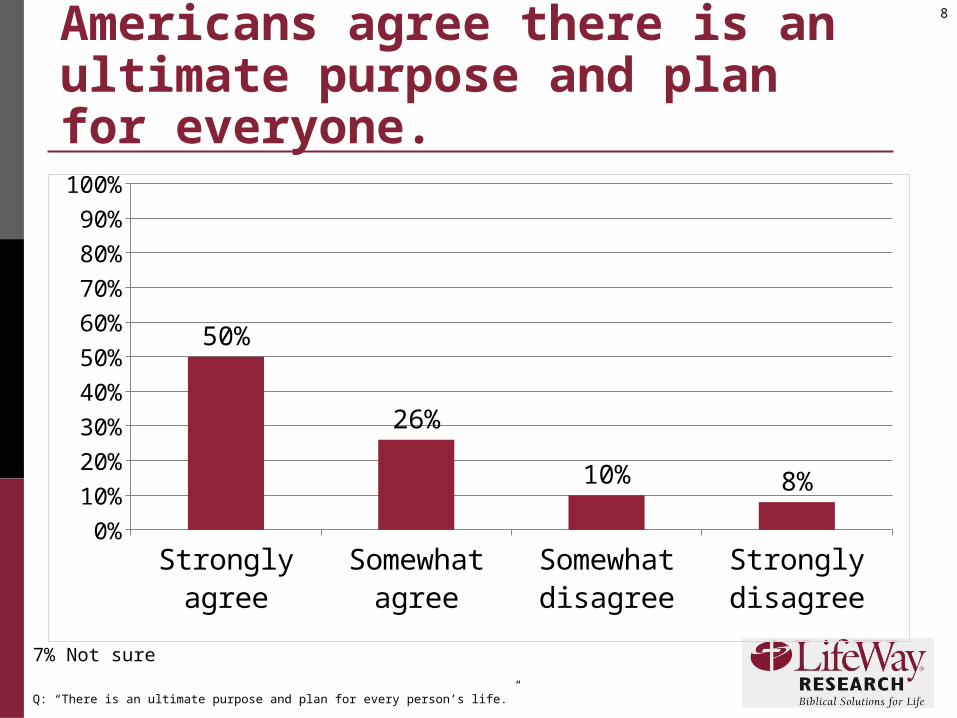
8Around three in four Americans agree there is an ultimate purpose and plan for everyone.
Strongly agree
Somewhat agree
Somewhat disagree
Strongly disagree
0%
10%
20%
30%
40%
50%
60%
70%
80%
90%
100%
50%
26%
10% 8%
7% Not sure
Q: “There is an ultimate purpose and plan for every person’s life.”
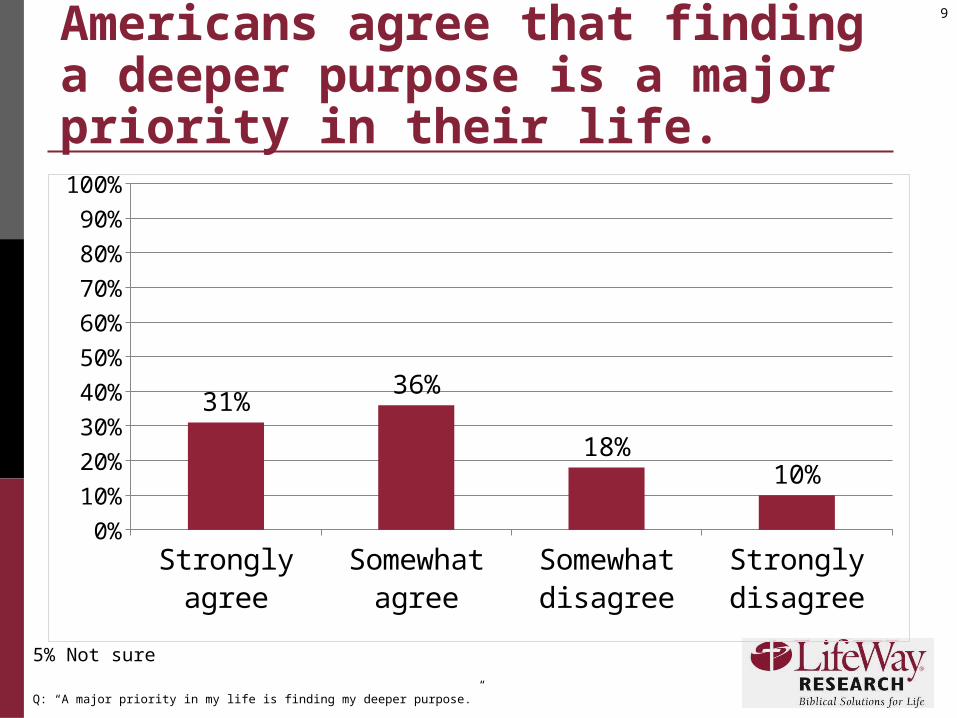
9About two-thirds of Americans agree that finding a deeper purpose is a major priority in their life.
Strongly agree
Somewhat agree
Somewhat disagree
Strongly disagree
0%
10%
20%
30%
40%
50%
60%
70%
80%
90%
100%
31%36%
18%10%
5% Not sure
Q: “A major priority in my life is finding my deeper purpose.”
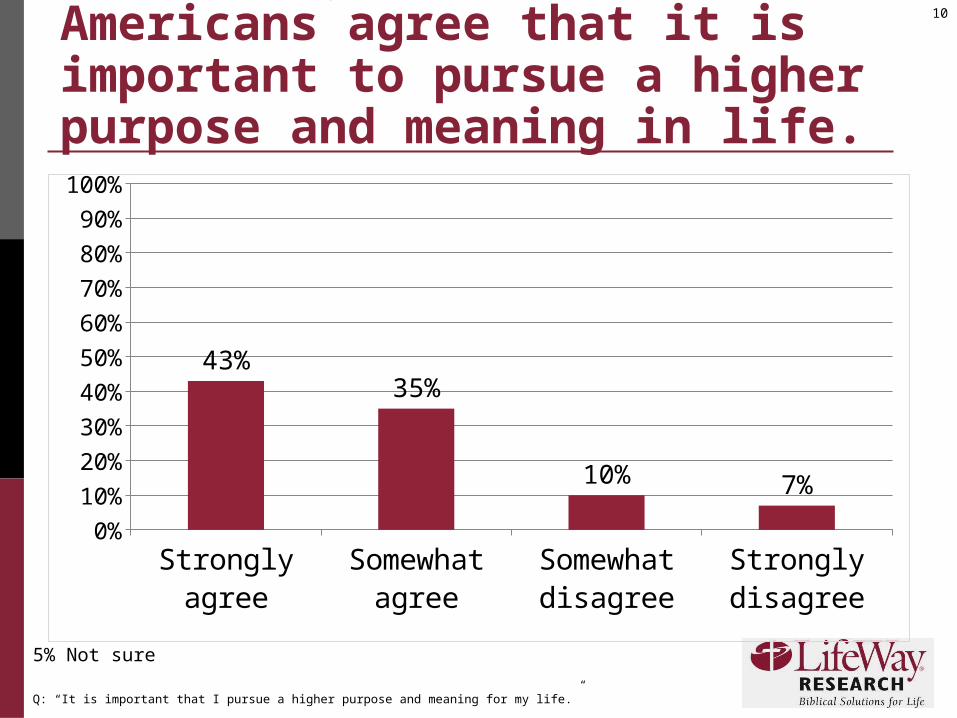
10Almost eight in ten Americans agree that it is important to pursue a higher purpose and meaning in life.
Strongly agree
Somewhat agree
Somewhat disagree
Strongly disagree
0%
10%
20%
30%
40%
50%
60%
70%
80%
90%
100%
43%35%
10% 7%
5% Not sure
Q: “It is important that I pursue a higher purpose and meaning for my life.”
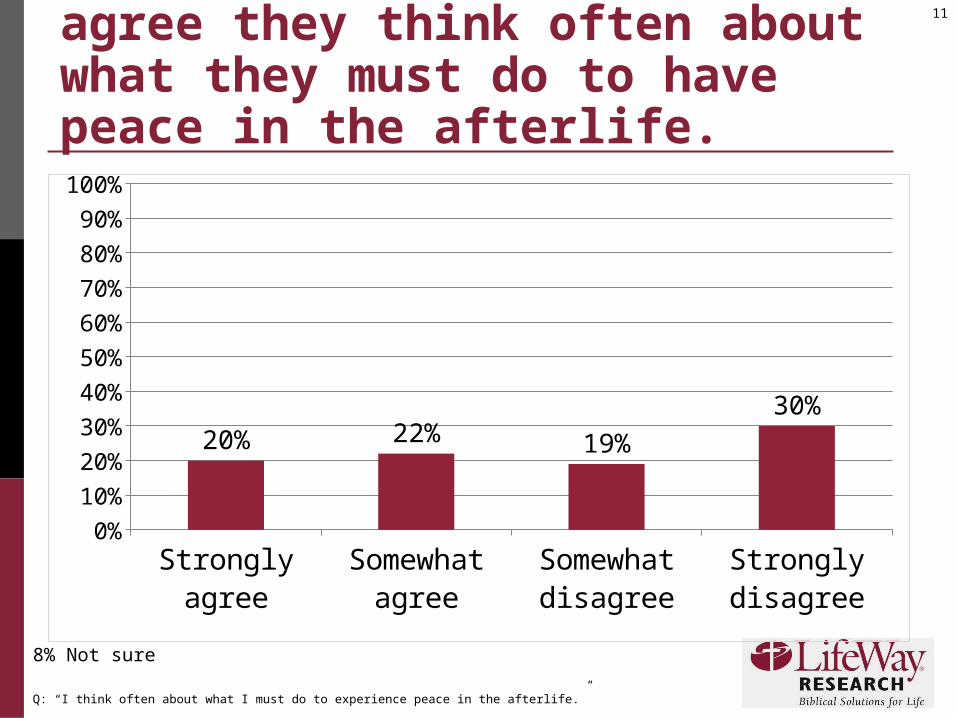
11Less than half of Americans agree they think often about what they must do to have peace in the afterlife.
Strongly agree
Somewhat agree
Somewhat disagree
Strongly disagree
0%
10%
20%
30%
40%
50%
60%
70%
80%
90%
100%
20% 22% 19%
30%
8% Not sure
Q: “I think often about what I must do to experience peace in the afterlife.”
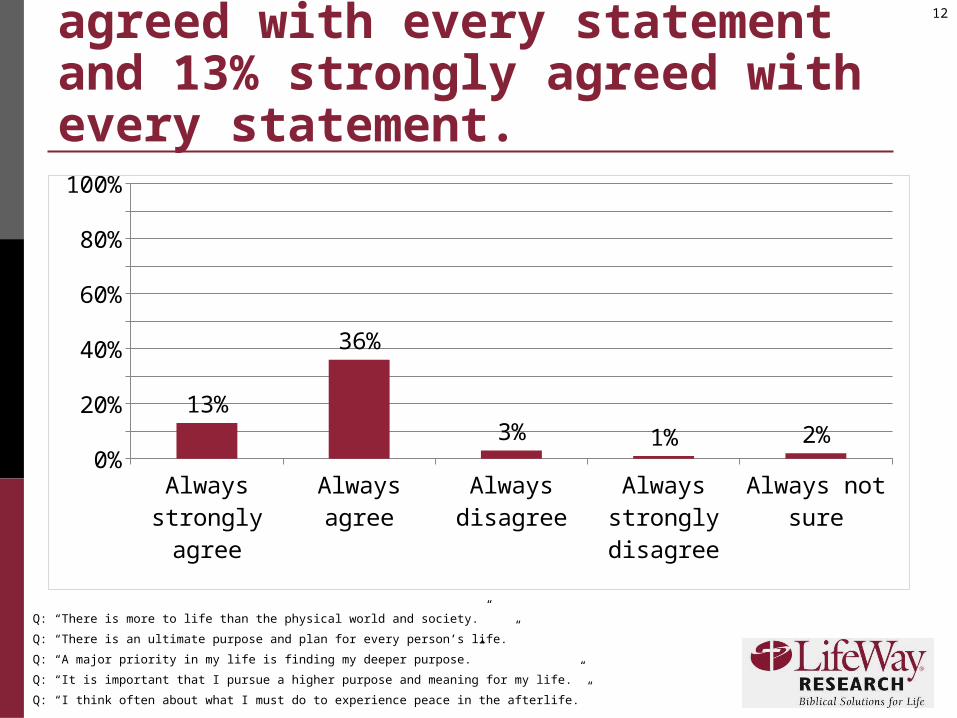
12Over a third of Americans agreed with every statement and 13% strongly agreed with every statement.
Always strongly agree
Always agree Always disagree
Always strongly disagree
Always not sure
0%10%20%30%40%50%60%70%80%90%
100%
13%
36%
3% 1% 2%
Q: “There is more to life than the physical world and society.”
Q: “There is an ultimate purpose and plan for every person’s life.”
Q: “A major priority in my life is finding my deeper purpose.”
Q: “It is important that I pursue a higher purpose and meaning for my life.”
Q: “I think often about what I must do to experience peace in the afterlife.”
13
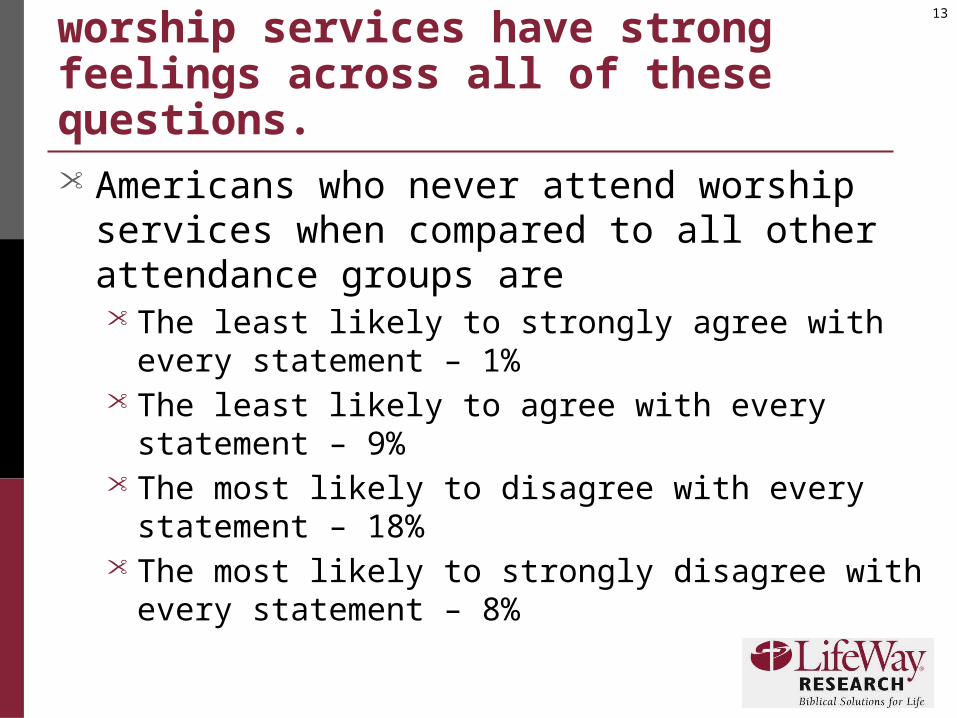
Americans who never attend worship services have strong feelings across all of these questions.• Americans who never attend worship services
when compared to all other attendance groups are• The least likely to strongly agree with every statement –
1%• The least likely to agree with every statement – 9%• The most likely to disagree with every statement – 18%• The most likely to strongly disagree with every
statement – 8%
14
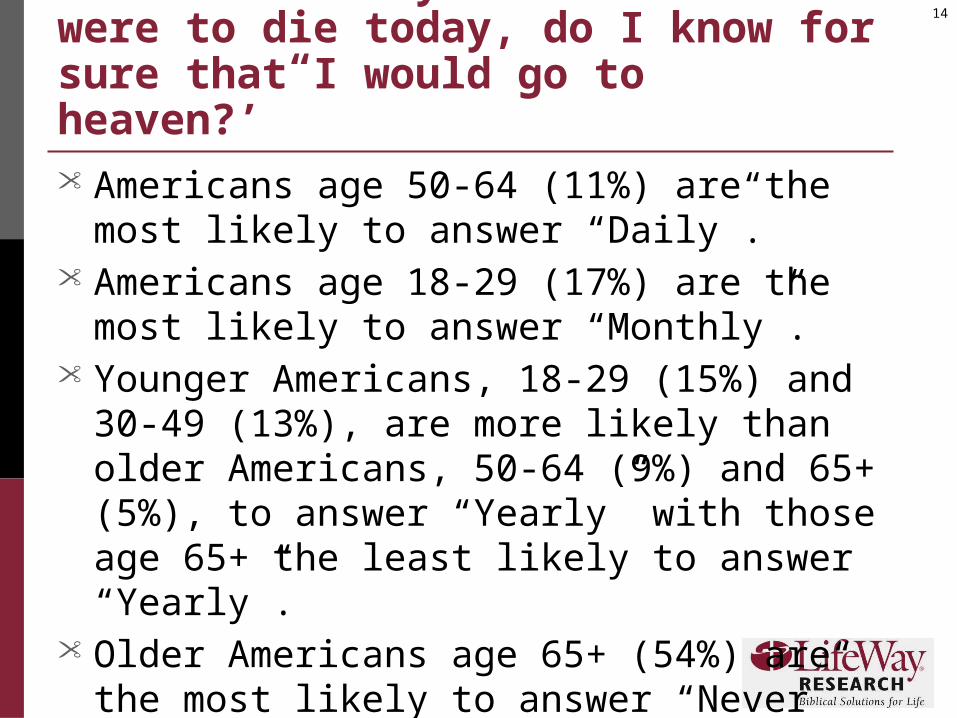
“How often do you wonder: ‘If I were to die today, do I know for sure that I would go to heaven?’”• Americans age 50-64 (11%) are the most likely
to answer “Daily”.• Americans age 18-29 (17%) are the most likely
to answer “Monthly”.• Younger Americans, 18-29 (15%) and 30-49
(13%), are more likely than older Americans, 50-64 (9%) and 65+ (5%), to answer “Yearly” with those age 65+ the least likely to answer “Yearly”.
• Older Americans age 65+ (54%) are the most likely to answer “Never” while Americans age 18-29 (36%) are the least likely.
15
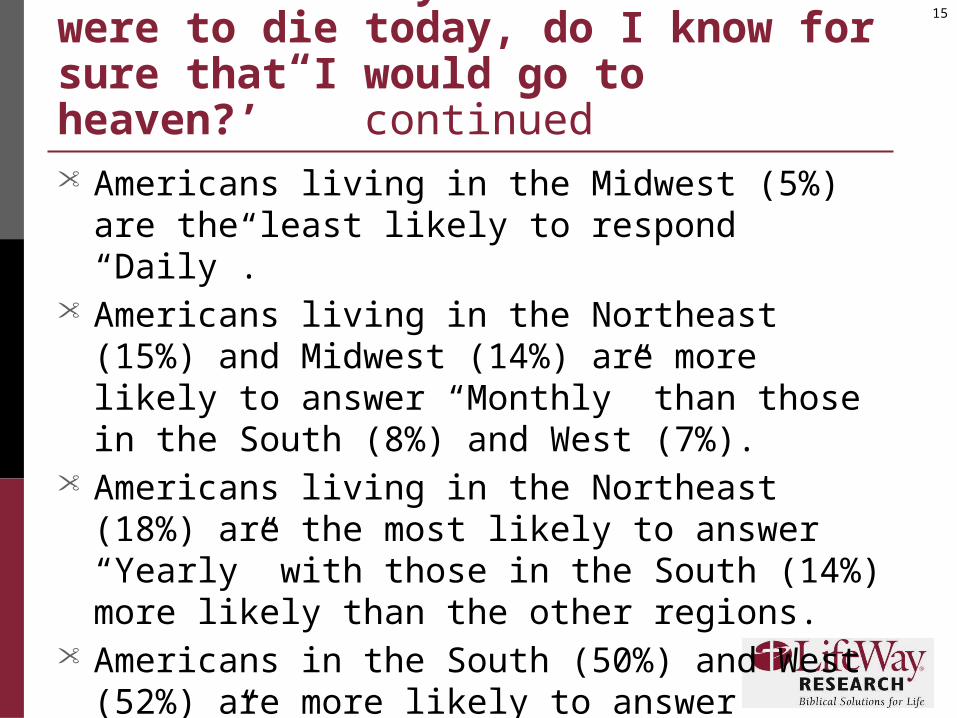
“How often do you wonder: ‘If I were to die today, do I know for sure that I would go to heaven?’” continued• Americans living in the Midwest (5%) are the least
likely to respond “Daily”.• Americans living in the Northeast (15%) and
Midwest (14%) are more likely to answer “Monthly” than those in the South (8%) and West (7%).
• Americans living in the Northeast (18%) are the most likely to answer “Yearly” with those in the South (14%) more likely than the other regions.
• Americans in the South (50%) and West (52%) are more likely to answer “Never” compared to those living in the Northeast (31%) and Midwest (45%) with those in the Northeast the least likely.
16
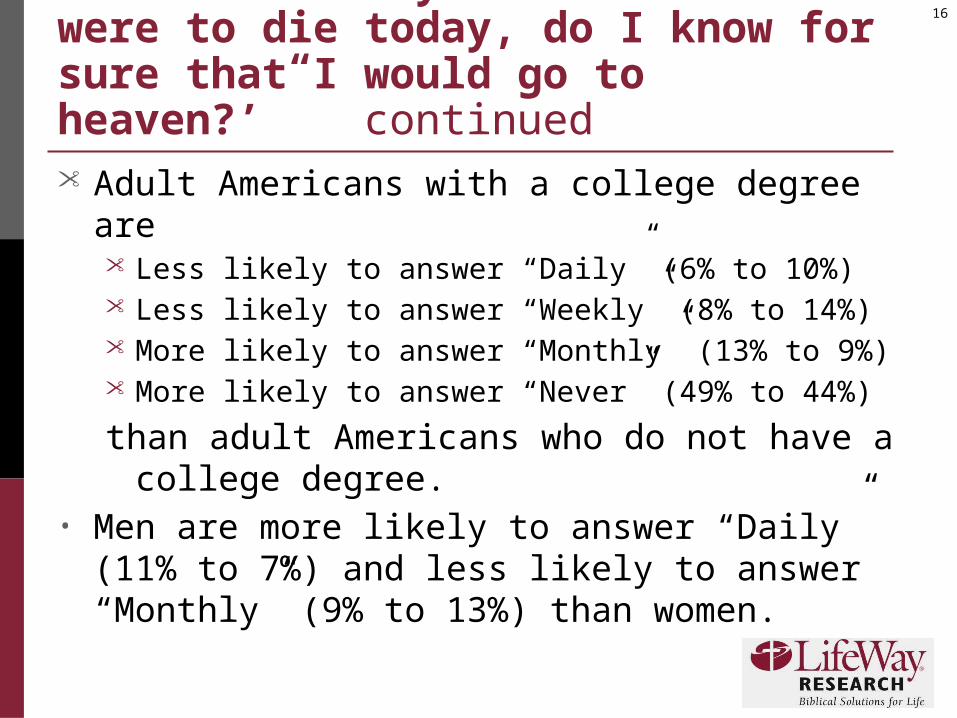
“How often do you wonder: ‘If I were to die today, do I know for sure that I would go to heaven?’” continued• Adult Americans with a college degree are
• Less likely to answer “Daily” (6% to 10%)• Less likely to answer “Weekly” (8% to 14%)• More likely to answer “Monthly” (13% to 9%)• More likely to answer “Never” (49% to 44%)
than adult Americans who do not have a college degree.
• Men are more likely to answer “Daily” (11% to 7%) and less likely to answer “Monthly” (9% to 13%) than women.
17
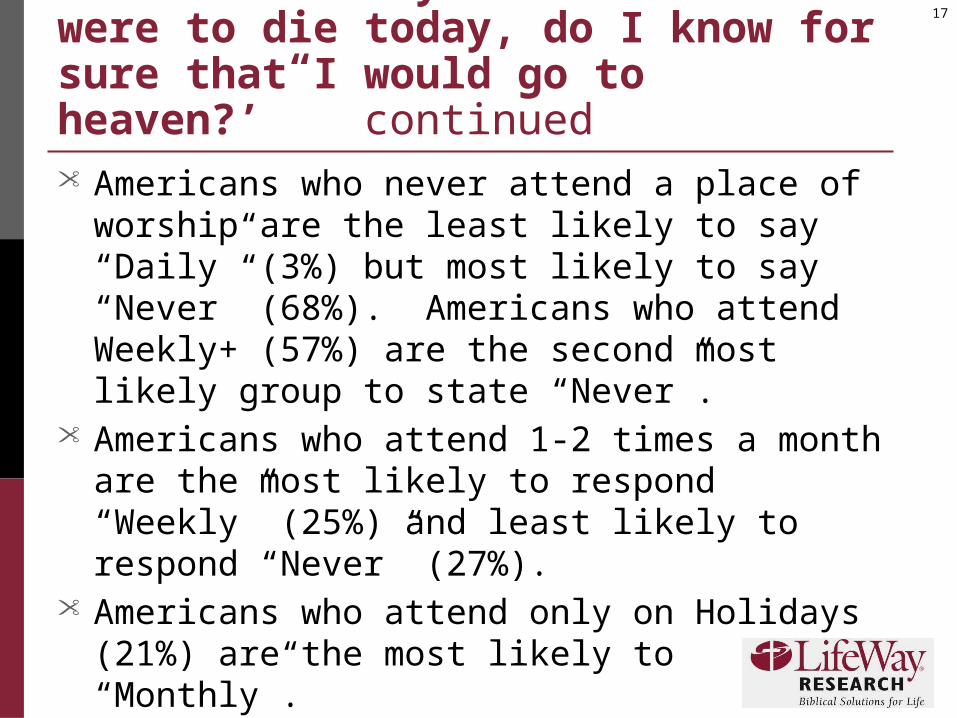
“How often do you wonder: ‘If I were to die today, do I know for sure that I would go to heaven?’” continued• Americans who never attend a place of worship are
the least likely to say “Daily” (3%) but most likely to say “Never” (68%). Americans who attend Weekly+ (57%) are the second most likely group to state “Never”.
• Americans who attend 1-2 times a month are the most likely to respond “Weekly” (25%) and least likely to respond “Never” (27%).
• Americans who attend only on Holidays (21%) are the most likely to “Monthly”.
18
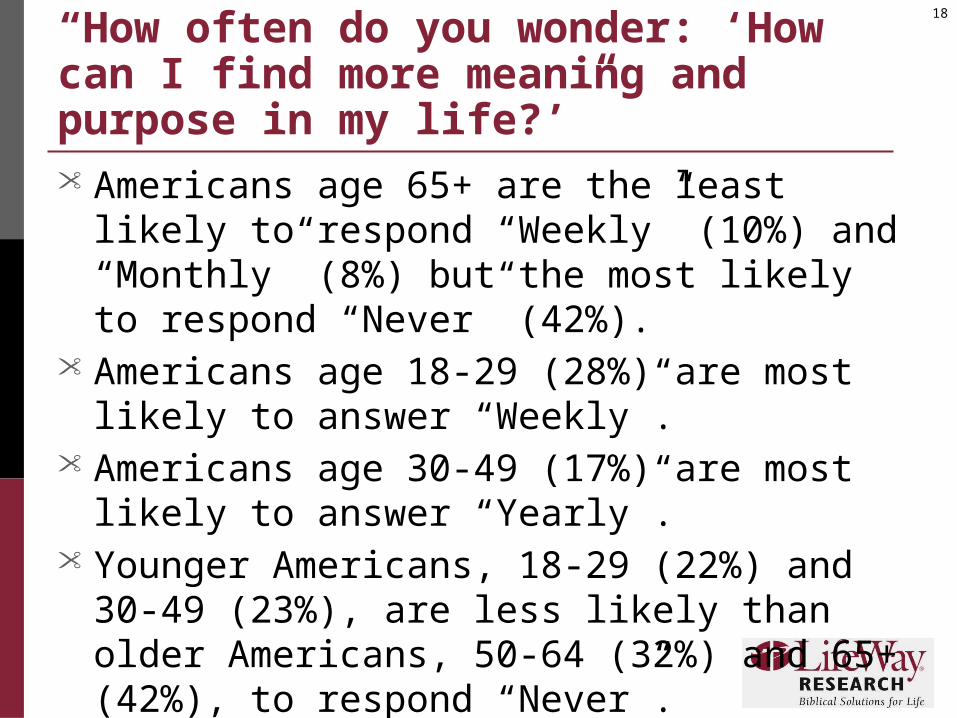
“How often do you wonder: ‘How can I find more meaning and purpose in my life?’”• Americans age 65+ are the least likely to
respond “Weekly” (10%) and “Monthly” (8%) but the most likely to respond “Never” (42%).
• Americans age 18-29 (28%) are most likely to answer “Weekly”.
• Americans age 30-49 (17%) are most likely to answer “Yearly”.
• Younger Americans, 18-29 (22%) and 30-49 (23%), are less likely than older Americans, 50-64 (32%) and 65+ (42%), to respond “Never”.
19
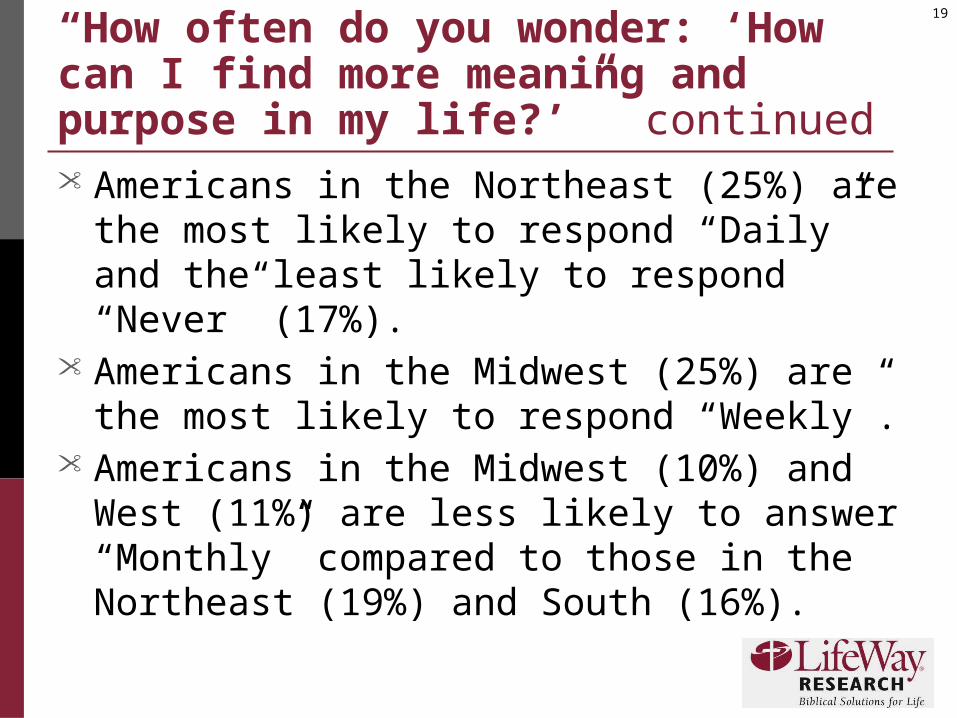
“How often do you wonder: ‘How can I find more meaning and purpose in my life?’” continued• Americans in the Northeast (25%) are the most
likely to respond “Daily” and the least likely to respond “Never” (17%).
• Americans in the Midwest (25%) are the most likely to respond “Weekly”.
• Americans in the Midwest (10%) and West (11%) are less likely to answer “Monthly” compared to those in the Northeast (19%) and South (16%).
20
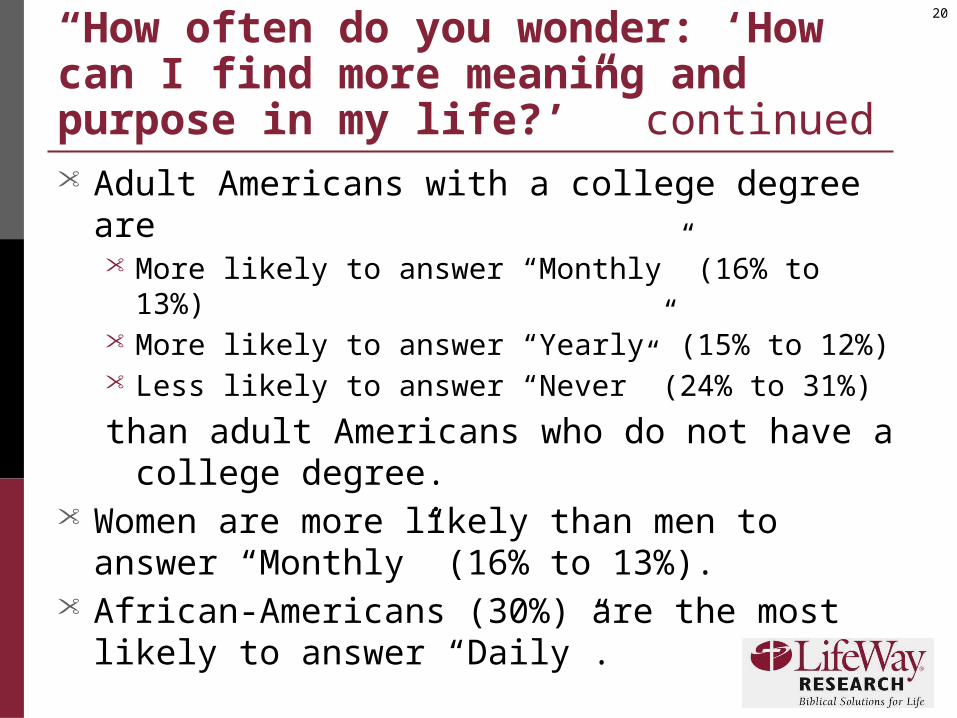
“How often do you wonder: ‘How can I find more meaning and purpose in my life?’” continued• Adult Americans with a college degree are
• More likely to answer “Monthly” (16% to 13%)• More likely to answer “Yearly” (15% to 12%)• Less likely to answer “Never” (24% to 31%)
than adult Americans who do not have a college degree.
• Women are more likely than men to answer “Monthly” (16% to 13%).
• African-Americans (30%) are the most likely to answer “Daily”.
21
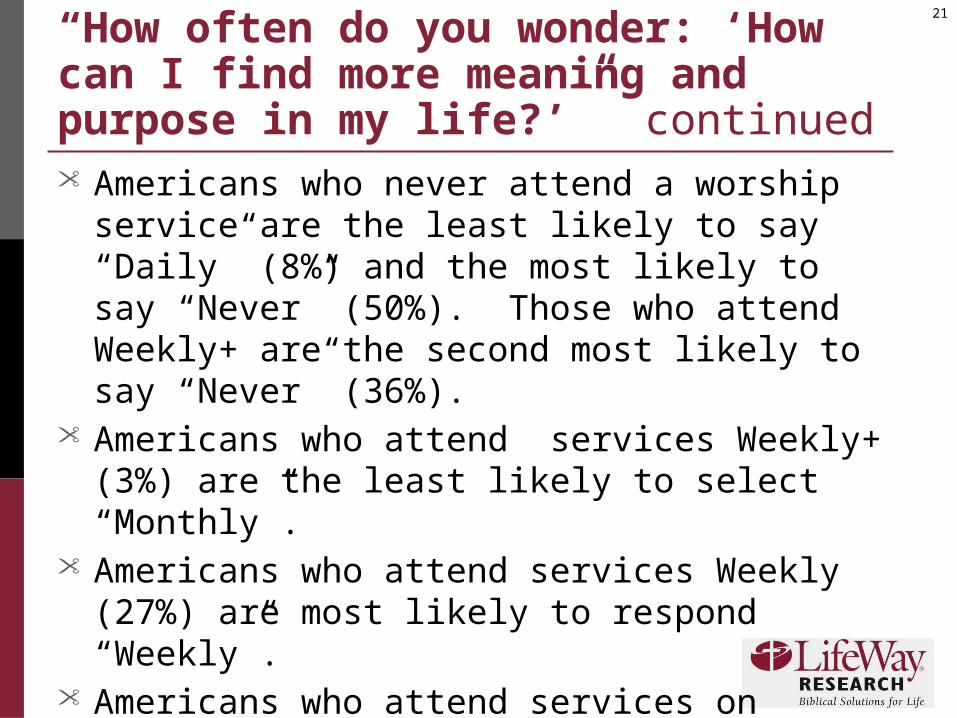
“How often do you wonder: ‘How can I find more meaning and purpose in my life?’” continued• Americans who never attend a worship service are
the least likely to say “Daily” (8%) and the most likely to say “Never” (50%). Those who attend Weekly+ are the second most likely to say “Never” (36%).
• Americans who attend services Weekly+ (3%) are the least likely to select “Monthly”.
• Americans who attend services Weekly (27%) are most likely to respond “Weekly”.
• Americans who attend services on Holidays (24%) are most likely to respond “Monthly”.
22
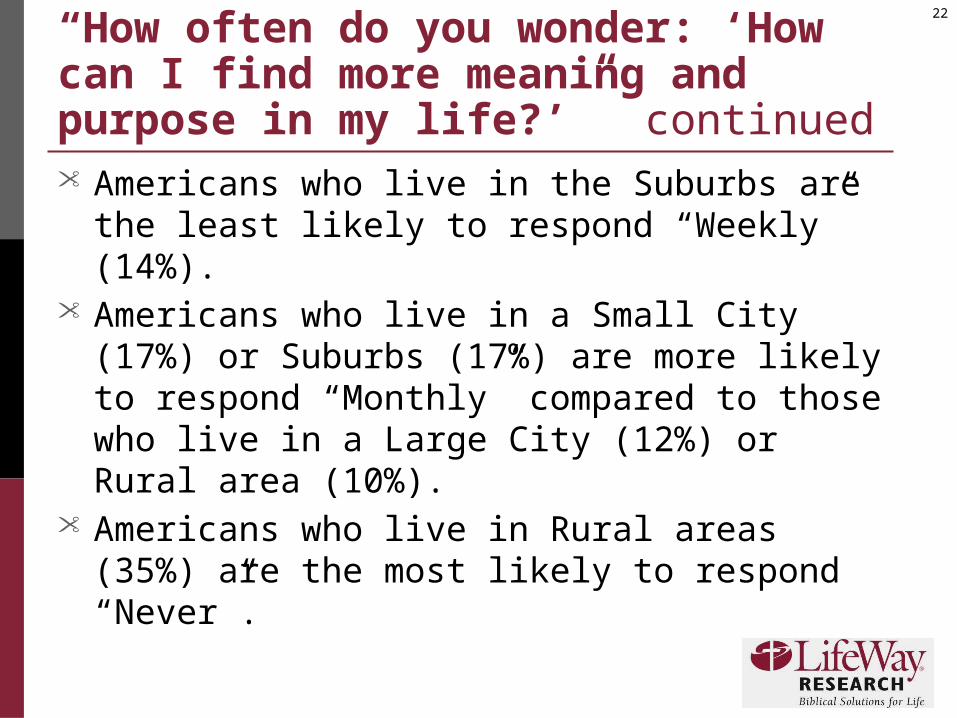
“How often do you wonder: ‘How can I find more meaning and purpose in my life?’” continued• Americans who live in the Suburbs are the least
likely to respond “Weekly” (14%).• Americans who live in a Small City (17%) or
Suburbs (17%) are more likely to respond “Monthly” compared to those who live in a Large City (12%) or Rural area (10%).
• Americans who live in Rural areas (35%) are the most likely to respond “Never”.
23
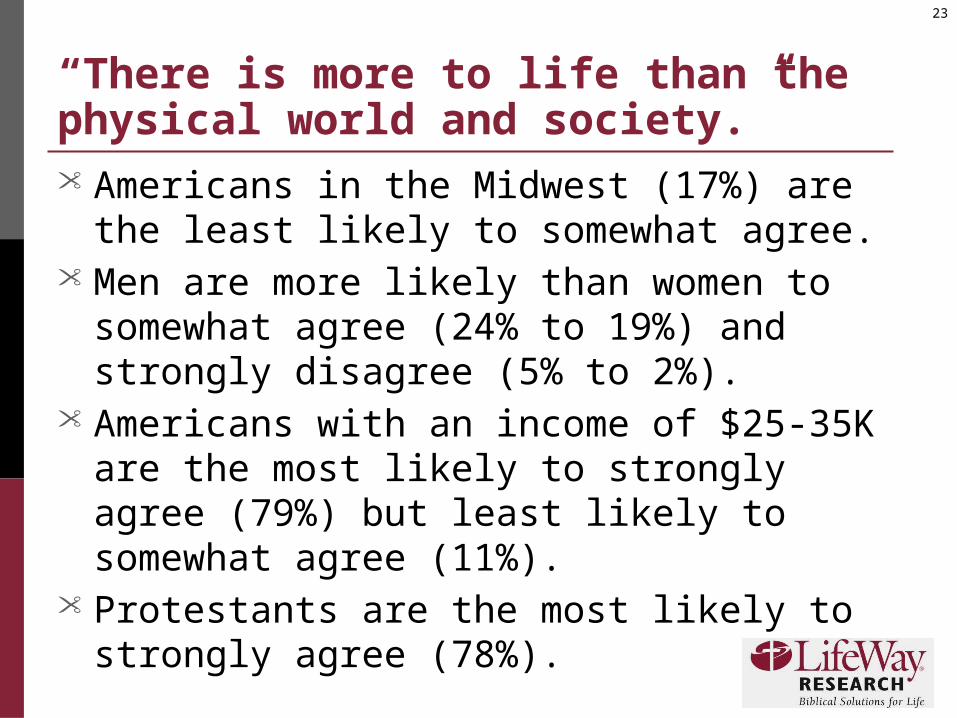
“There is more to life than the physical world and society.”• Americans in the Midwest (17%) are the least
likely to somewhat agree.• Men are more likely than women to somewhat
agree (24% to 19%) and strongly disagree (5% to 2%).
• Americans with an income of $25-35K are the most likely to strongly agree (79%) but least likely to somewhat agree (11%).
• Protestants are the most likely to strongly agree (78%).
24
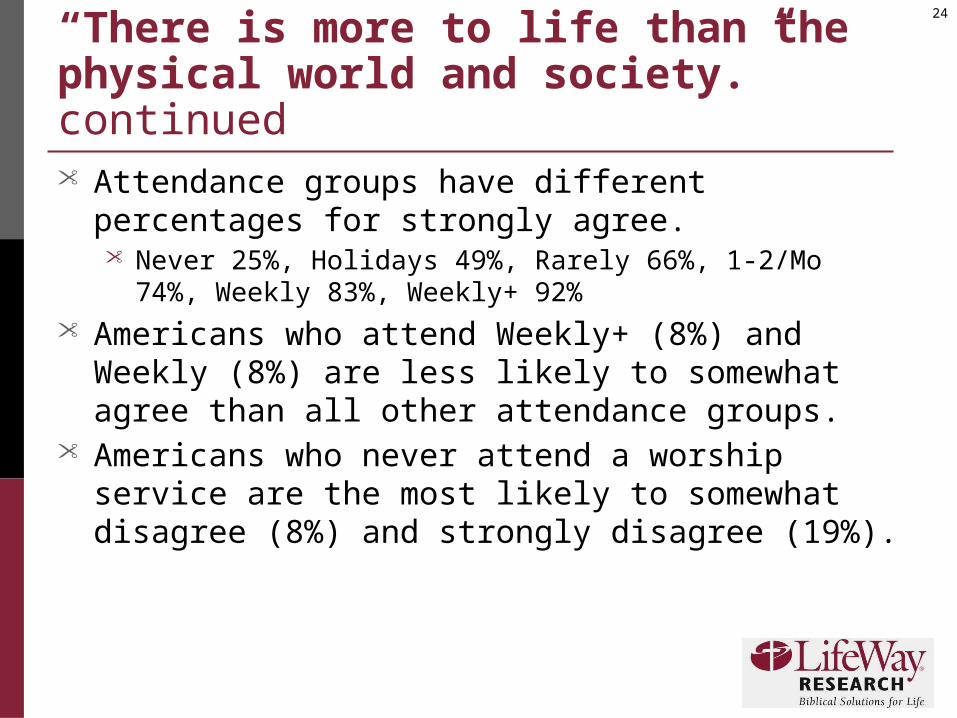
“There is more to life than the physical world and society.” continued• Attendance groups have different percentages for
strongly agree.• Never 25%, Holidays 49%, Rarely 66%, 1-2/Mo 74%, Weekly
83%, Weekly+ 92%• Americans who attend Weekly+ (8%) and Weekly (8%)
are less likely to somewhat agree than all other attendance groups.
• Americans who never attend a worship service are the most likely to somewhat disagree (8%) and strongly disagree (19%).
25
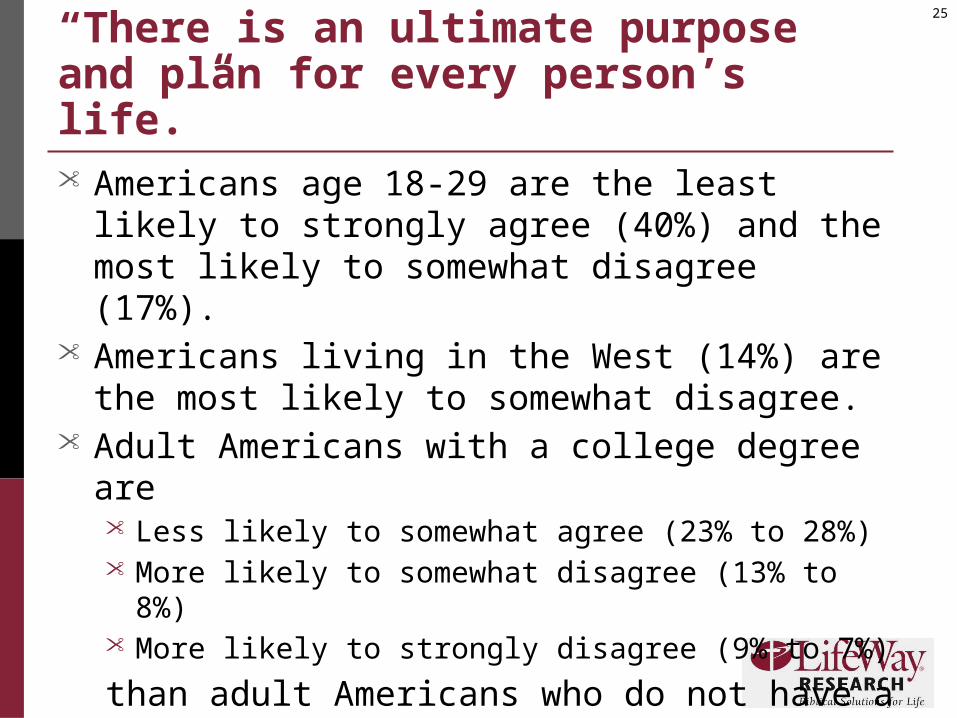
“There is an ultimate purpose and plan for every person’s life.”• Americans age 18-29 are the least likely to strongly
agree (40%) and the most likely to somewhat disagree (17%).
• Americans living in the West (14%) are the most likely to somewhat disagree.
• Adult Americans with a college degree are• Less likely to somewhat agree (23% to 28%)• More likely to somewhat disagree (13% to 8%)• More likely to strongly disagree (9% to 7%)
than adult Americans who do not have a college degree.
26
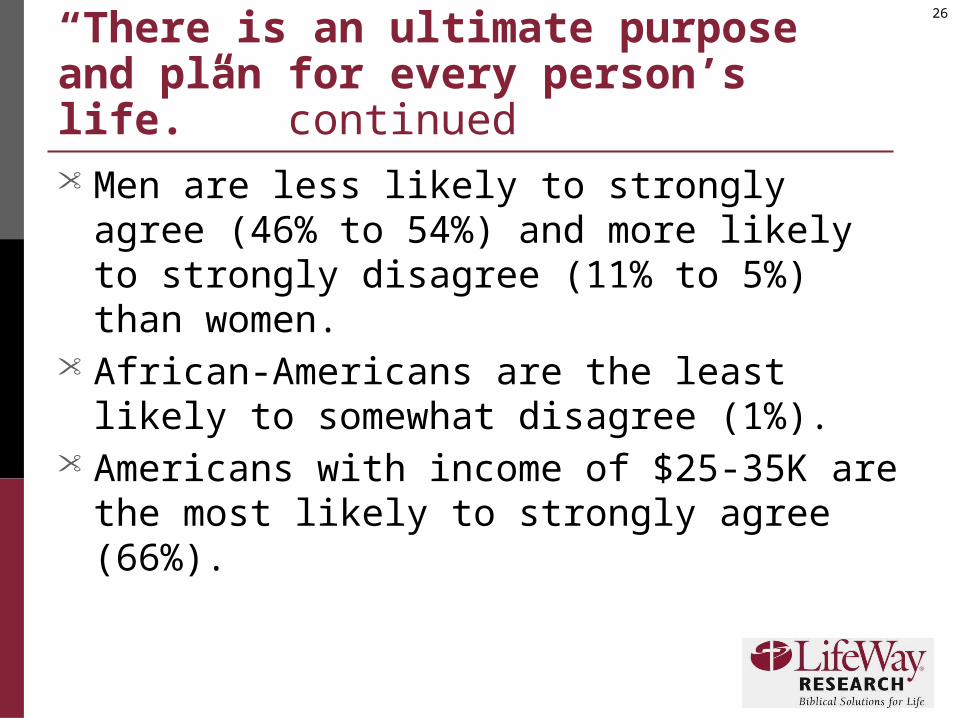
“There is an ultimate purpose and plan for every person’s life.” continued• Men are less likely to strongly agree (46% to
54%) and more likely to strongly disagree (11% to 5%) than women.
• African-Americans are the least likely to somewhat disagree (1%).
• Americans with income of $25-35K are the most likely to strongly agree (66%).
27
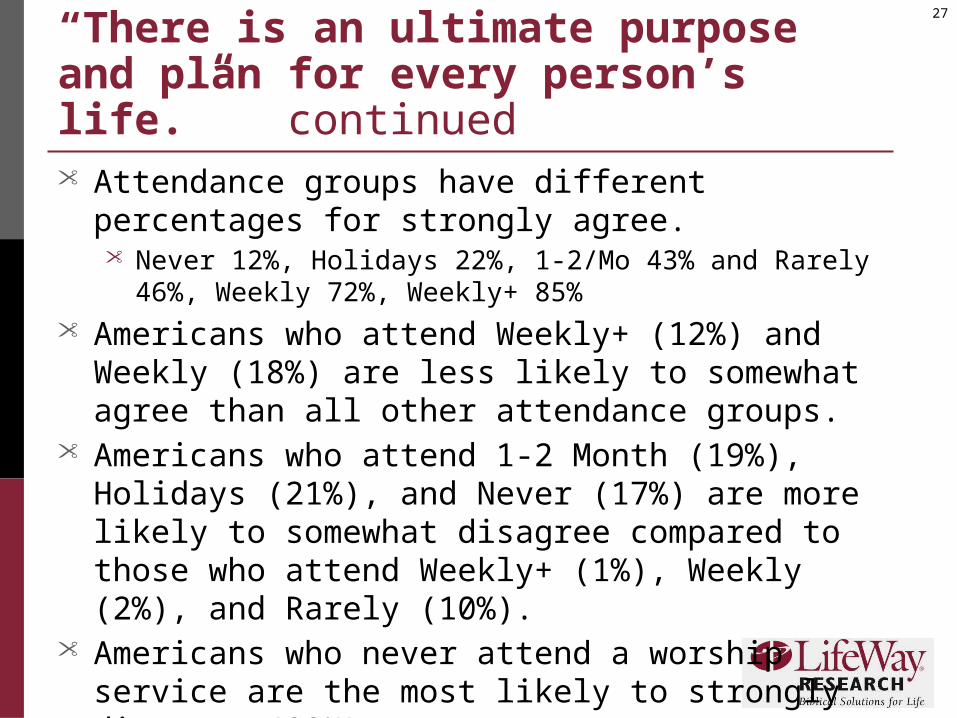
“There is an ultimate purpose and plan for every person’s life.” continued• Attendance groups have different percentages for
strongly agree.• Never 12%, Holidays 22%, 1-2/Mo 43% and Rarely 46%,
Weekly 72%, Weekly+ 85%• Americans who attend Weekly+ (12%) and Weekly
(18%) are less likely to somewhat agree than all other attendance groups.
• Americans who attend 1-2 Month (19%), Holidays (21%), and Never (17%) are more likely to somewhat disagree compared to those who attend Weekly+ (1%), Weekly (2%), and Rarely (10%).
• Americans who never attend a worship service are the most likely to strongly disagree (33%).
28
“There is an ultimate purpose and plan for every person’s life.” continued• Protestants (60%) are most likely to strongly agree with
Catholics (47%) more likely to strongly agree than Jewish (15%) and Other/None (28%).
• Protestants (2%) and Catholics (3%) are less likely to strongly disagree compared to Jewish (23%) and Other/None (27%).
29
“A major priority in my life is finding my deeper purpose.”• Americans age 18-29 are most likely to strongly
agree (36%) and least likely to somewhat disagree (12%).
• Older Americans, 50-64 (12%) and 65+ (17%), are more likely to strongly disagree than younger Americans, 18-29 (7%) and 30-49 (6%).
• Americans without a college degree are more likely to somewhat disagree (19% to 15%).
• Women are more likely than men to somewhat agree (41% to 32%) but less likely to somewhat disagree (15% to 21%) and strongly disagree (8% to 12%).
30
“A major priority in my life is finding my deeper purpose.” continued• Americans with income of $75-100K are the least likely
to strongly agree (18%) and most likely to somewhat agree (55%).
• Americans who attend Weekly+ (53%) or Weekly (39%) are more likely to strongly agree than those who attend 1-2/Mo (23%), Holidays (27%), Rarely (30%), and Never (8%). Note, those who attend Weekly+ are most likely while those who Never attend are least likely.
• Americans who attend 1-2/Mo are the most likely to somewhat agree (55%).
• Americans who never attend are the most likely to strongly disagree (30%).
31
“A major priority in my life is finding my deeper purpose.” continued• Protestants (7%) and Catholics (8%) are less likely
to strongly disagree than Jewish (19%) and Other/None (21%).
32
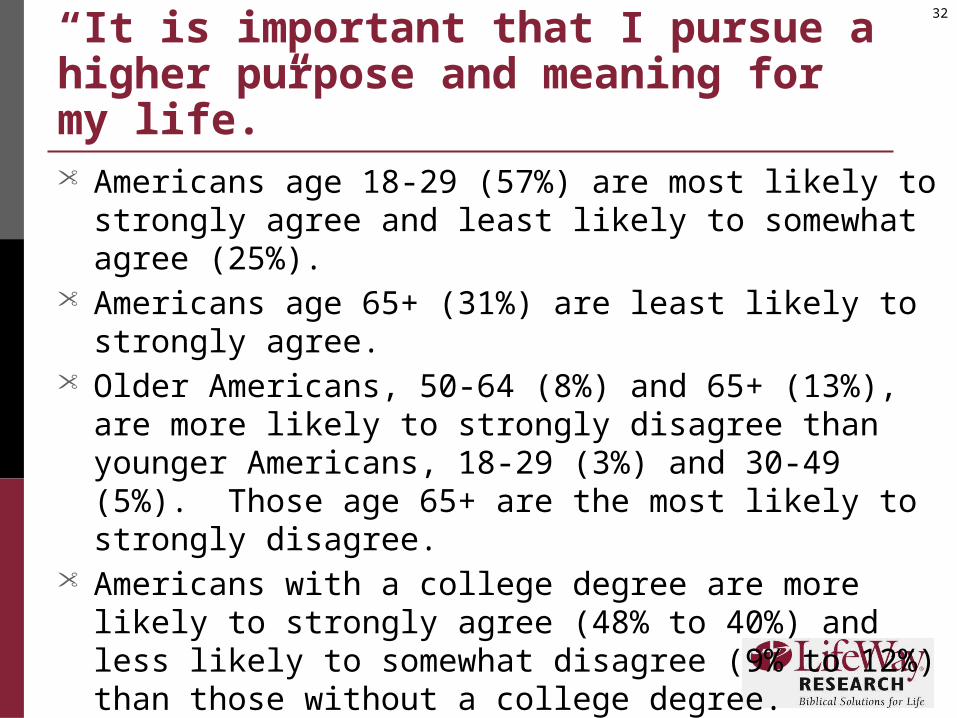
“It is important that I pursue a higher purpose and meaning for my life.”• Americans age 18-29 (57%) are most likely to strongly
agree and least likely to somewhat agree (25%).• Americans age 65+ (31%) are least likely to strongly agree.• Older Americans, 50-64 (8%) and 65+ (13%), are more
likely to strongly disagree than younger Americans, 18-29 (3%) and 30-49 (5%). Those age 65+ are the most likely to strongly disagree.
• Americans with a college degree are more likely to strongly agree (48% to 40%) and less likely to somewhat disagree (9% to 12%) than those without a college degree.
• Men are more likely to somewhat disagree (13% to 9%) and strongly disagree (8% to 6%) compared to females.
33
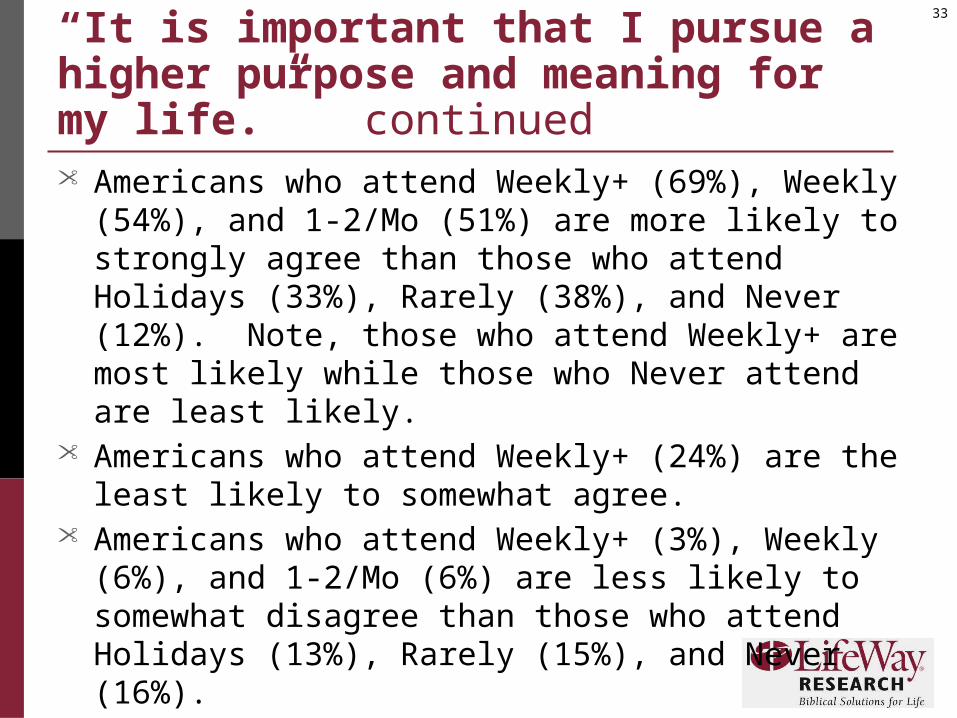
“It is important that I pursue a higher purpose and meaning for my life.” continued• Americans who attend Weekly+ (69%), Weekly (54%),
and 1-2/Mo (51%) are more likely to strongly agree than those who attend Holidays (33%), Rarely (38%), and Never (12%). Note, those who attend Weekly+ are most likely while those who Never attend are least likely.
• Americans who attend Weekly+ (24%) are the least likely to somewhat agree.
• Americans who attend Weekly+ (3%), Weekly (6%), and 1-2/Mo (6%) are less likely to somewhat disagree than those who attend Holidays (13%), Rarely (15%), and Never (16%).
• Americans who never attend are the most likely to strongly disagree (27%).
34
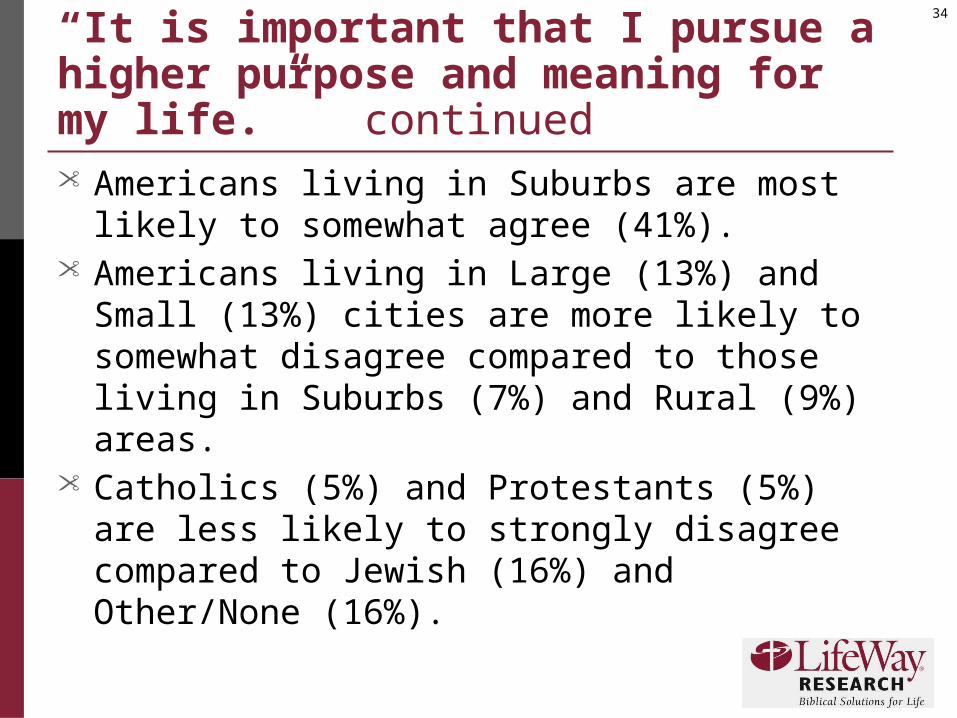
“It is important that I pursue a higher purpose and meaning for my life.” continued• Americans living in Suburbs are most likely to
somewhat agree (41%).• Americans living in Large (13%) and Small (13%)
cities are more likely to somewhat disagree compared to those living in Suburbs (7%) and Rural (9%) areas.
• Catholics (5%) and Protestants (5%) are less likely to strongly disagree compared to Jewish (16%) and Other/None (16%).
35
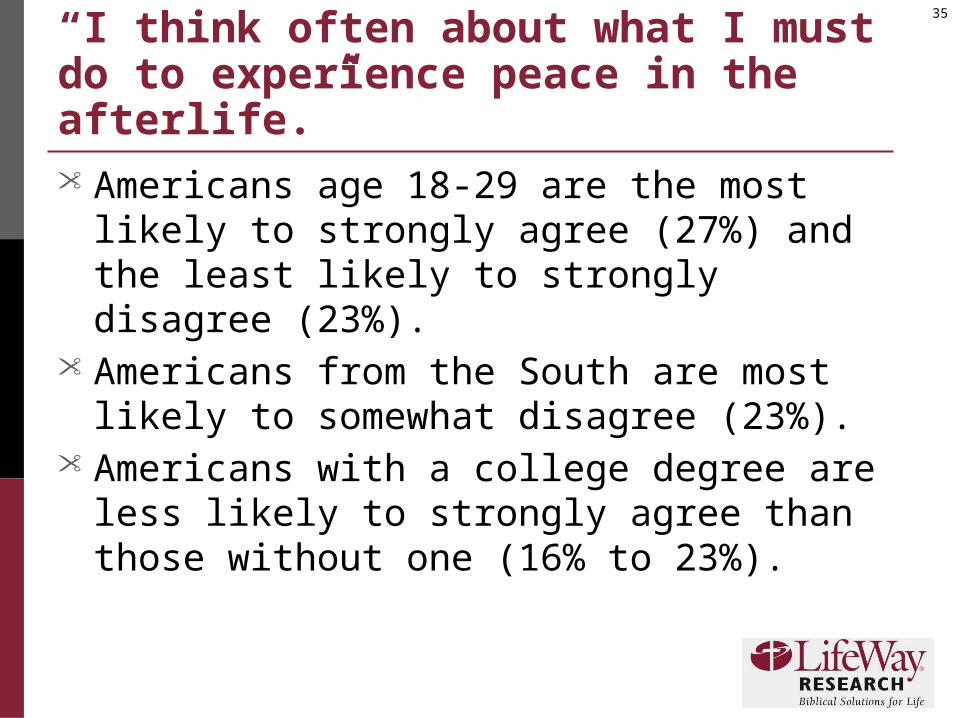
“I think often about what I must do to experience peace in the afterlife.”• Americans age 18-29 are the most likely to
strongly agree (27%) and the least likely to strongly disagree (23%).
• Americans from the South are most likely to somewhat disagree (23%).
• Americans with a college degree are less likely to strongly agree than those without one (16% to 23%).
36
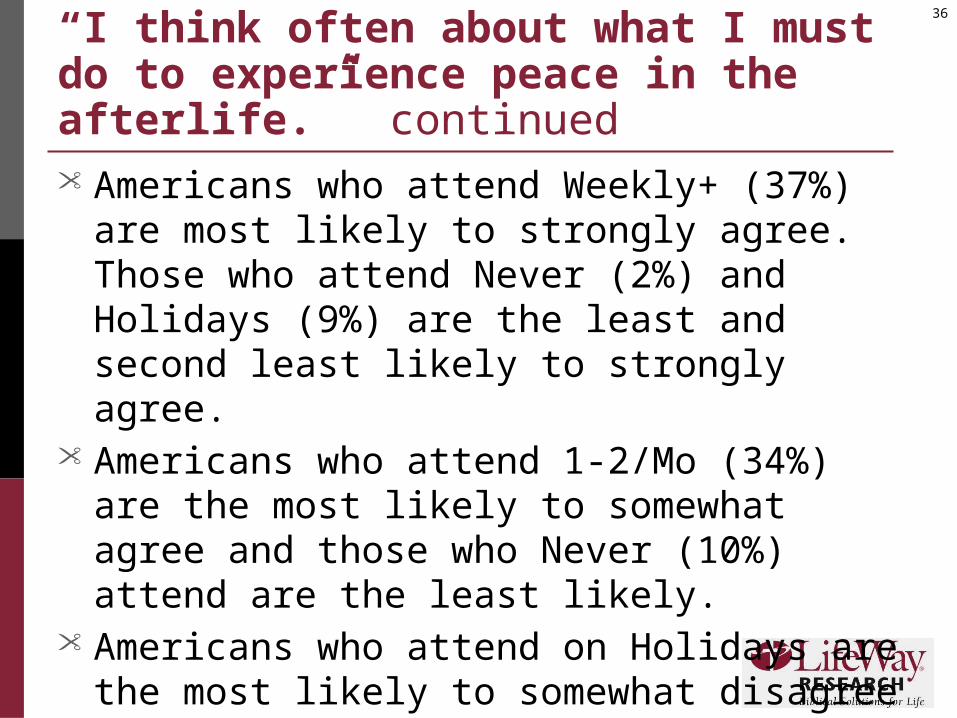
“I think often about what I must do to experience peace in the afterlife.” continued• Americans who attend Weekly+ (37%) are most
likely to strongly agree. Those who attend Never (2%) and Holidays (9%) are the least and second least likely to strongly agree.
• Americans who attend 1-2/Mo (34%) are the most likely to somewhat agree and those who Never (10%) attend are the least likely.
• Americans who attend on Holidays are the most likely to somewhat disagree (37%).
• Those who Never attend are the most likely to strongly disagree (63%).
37
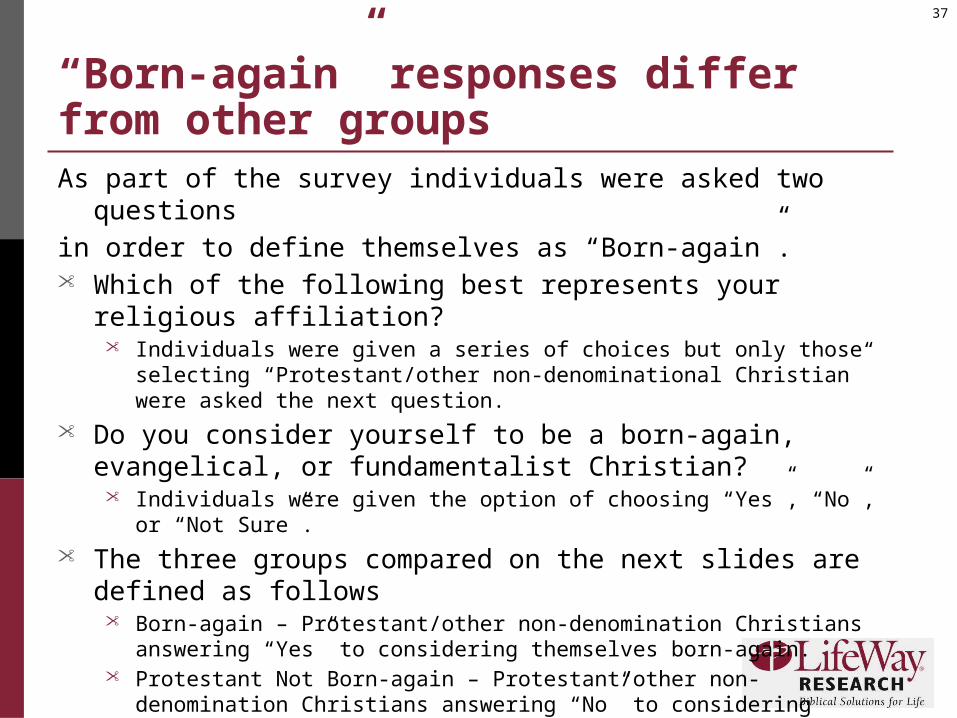
“Born-again” responses differ from other groupsAs part of the survey individuals were asked two questions
in order to define themselves as “Born-again”.• Which of the following best represents your religious affiliation?
• Individuals were given a series of choices but only those selecting “Protestant/other non-denominational Christian” were asked the next question.
• Do you consider yourself to be a born-again, evangelical, or fundamentalist Christian?
• Individuals were given the option of choosing “Yes”, “No”, or “Not Sure”.
• The three groups compared on the next slides are defined as follows
• Born-again – Protestant/other non-denomination Christians answering “Yes” to considering themselves born-again.
• Protestant Not Born-again – Protestant/other non-denomination Christians answering “No” to considering themselves born-again.
• Not Protestant – Individuals selecting anything excpet Protestant/other non-denomination Christians in representing religious affiliation.
38
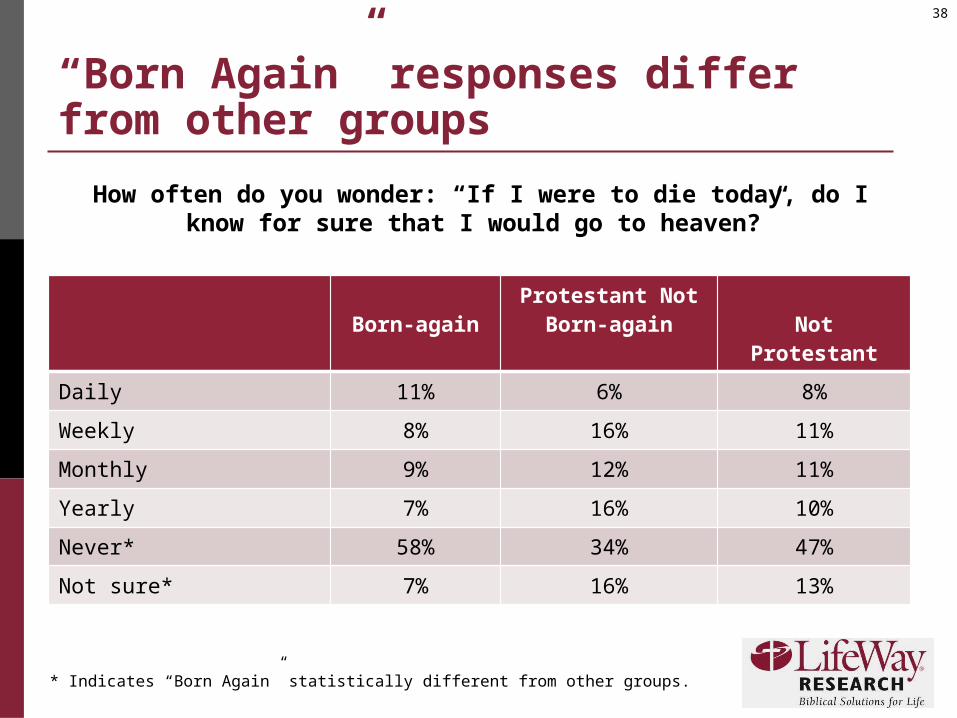
“Born Again” responses differ from other groups
Born-againProtestant Not
Born-again Not Protestant
Daily 11% 6% 8%
Weekly 8% 16% 11%
Monthly 9% 12% 11%
Yearly 7% 16% 10%
Never* 58% 34% 47%
Not sure* 7% 16% 13%
How often do you wonder: “If I were to die today, do I know for sure that I would go to heaven?”
* Indicates “Born Again” statistically different from other groups.
39
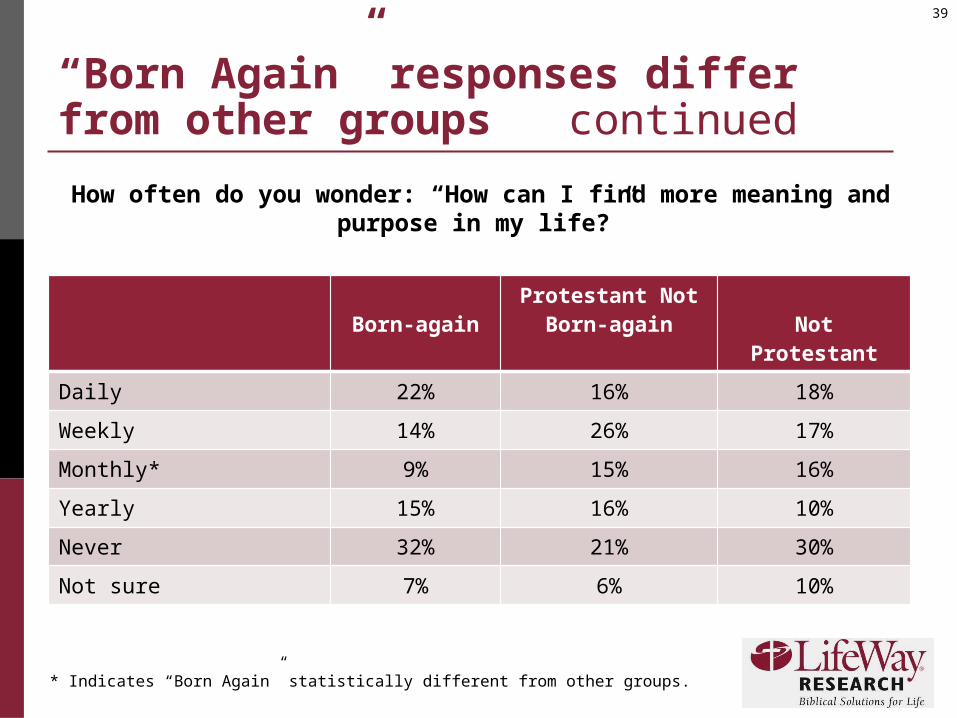
“Born Again” responses differ from other groups continued
Born-againProtestant Not
Born-again Not Protestant
Daily 22% 16% 18%
Weekly 14% 26% 17%
Monthly* 9% 15% 16%
Yearly 15% 16% 10%
Never 32% 21% 30%
Not sure 7% 6% 10%
How often do you wonder: “How can I find more meaning and purpose in my life?”
* Indicates “Born Again” statistically different from other groups.
40
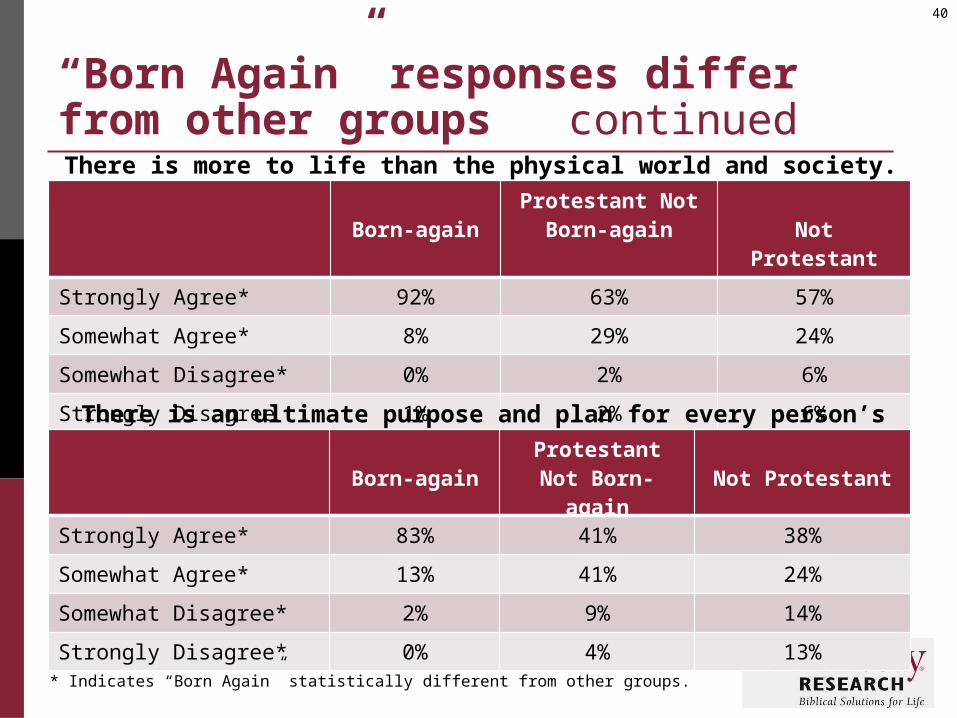
“Born Again” responses differ from other groups continued
Born-againProtestant Not
Born-again Not Protestant
Strongly Agree* 92% 63% 57%
Somewhat Agree* 8% 29% 24%
Somewhat Disagree* 0% 2% 6%
Strongly Disagree 1% 2% 6%
There is more to life than the physical world and society.
There is an ultimate purpose and plan for every person’s life.
Born-againProtestant Not
Born-again Not Protestant
Strongly Agree* 83% 41% 38%
Somewhat Agree* 13% 41% 24%
Somewhat Disagree* 2% 9% 14%
Strongly Disagree* 0% 4% 13%
* Indicates “Born Again” statistically different from other groups.
41
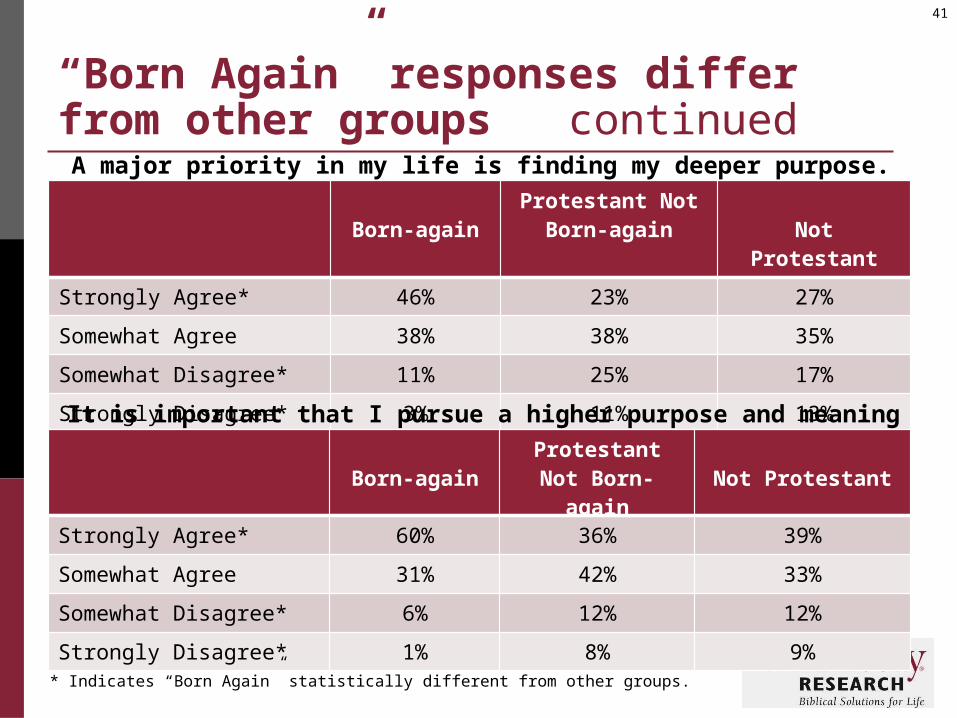
“Born Again” responses differ from other groups continued
Born-againProtestant Not
Born-again Not Protestant
Strongly Agree* 46% 23% 27%
Somewhat Agree 38% 38% 35%
Somewhat Disagree* 11% 25% 17%
Strongly Disagree* 3% 11% 13%
A major priority in my life is finding my deeper purpose.
It is important that I pursue a higher purpose and meaning for my life.
Born-againProtestant Not
Born-again Not Protestant
Strongly Agree* 60% 36% 39%
Somewhat Agree 31% 42% 33%
Somewhat Disagree* 6% 12% 12%
Strongly Disagree* 1% 8% 9%
* Indicates “Born Again” statistically different from other groups.
42
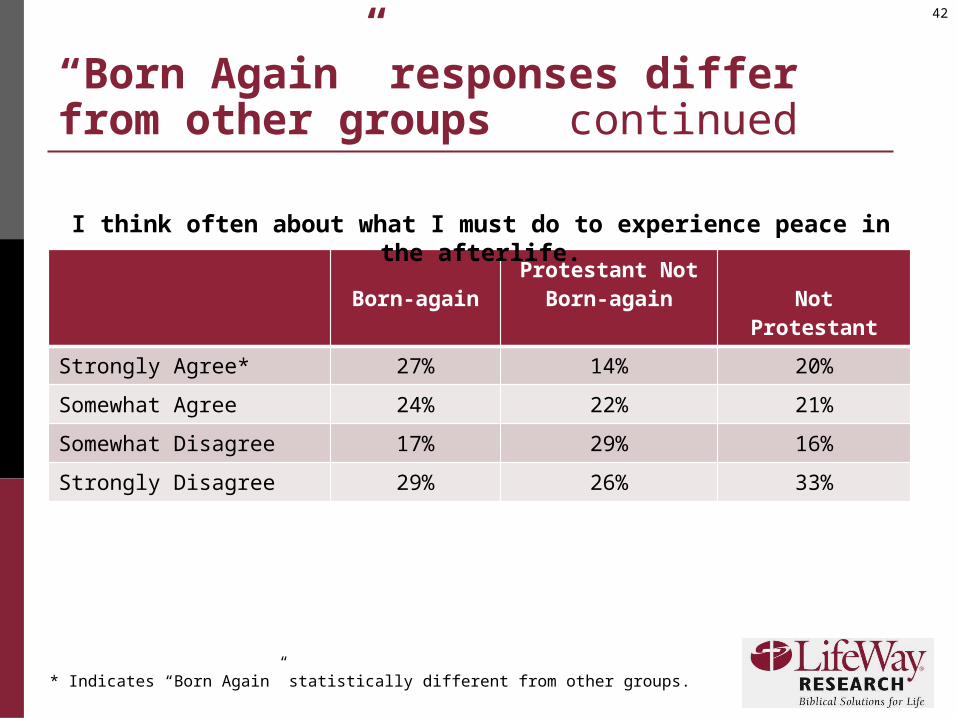
“Born Again” responses differ from other groups continued
Born-againProtestant Not
Born-again Not Protestant
Strongly Agree* 27% 14% 20%
Somewhat Agree 24% 22% 21%
Somewhat Disagree 17% 29% 16%
Strongly Disagree 29% 26% 33%
I think often about what I must do to experience peace in the afterlife.
* Indicates “Born Again” statistically different from other groups.
American Views of Spirituality
Survey of Over 2,000 American Adults