Embed Size (px)
Citation preview
3.1 Amino Acids 76
3.2 Peptides and Proteins 85
3.3 Working with Proteins 89
3.4 The Structure of Proteins: Primary Structure 96
Proteins mediate virtually every process that takes place in a cell, exhibiting an almost endless diversity of functions. To explore the molecular mechanism
of a biological process, a biochemist almost inevitably studies one or more proteins. Proteins are the most abundant biological macromolecules, occurring in all cells and all parts of cells. Proteins also occur in great variety; thousands of different kinds may be found in a single cell. As the arbiters of molecular function, pro-teins are the most important final products of the infor-mation pathways discussed in Part III of this book. Proteins are the molecular instruments through which genetic information is expressed. Relatively simple monomeric subunits provide the key to the structure of the thousands of different pro-teins. The proteins of every organism, from the simplest of bacteria to human beings, are constructed from the same ubiquitous set of 20 amino acids. Because each of
these amino acids has a side chain with distinctive chemical properties, this group of 20 precursor mole-cules may be regarded as the alphabet in which the language of protein structure is written. To generate a particular protein, amino acids are covalently linked in a characteristic linear sequence. What is most remarkable is that cells can produce proteins with strikingly different properties and activities by joining the same 20 amino acids in many different combinations and sequences. From these building blocks different organ-isms can make such widely diverse products as enzymes, hormones, antibodies, transporters, muscle fibers, the lens protein of the eye, feathers, spider webs, rhinoceros horn, milk proteins, antibiotics, mushroom poisons, and myriad other substances having distinct biological activi-ties (Fig. 3–1). Among these protein products, the enzymes are the most varied and specialized. As the cata-lysts of virtually all cellular reactions, enzymes are one of the keys to understanding the chemistry of life and thus provide a focal point for any course in biochemistry. Protein structure and function are the topics of this and the next three chapters. Here, we begin with a description of the fundamental chemical properties of amino acids, peptides, and proteins. We also consider how a biochemist works with proteins.
75
Amino Acids, Peptides, and Proteins
3
FIGURE 3–1 Some functions of proteins. (a) The light produced by fire-
flies is the result of a reaction involving the protein luciferin and ATP, cata-
lyzed by the enzyme luciferase (see Box 13–1). (b) Erythrocytes contain
large amounts of the oxygen-transporting protein hemoglobin. (c) The
protein keratin, formed by all vertebrates, is the chief structural component
of hair, scales, horn, wool, nails, and feathers. The black rhinoceros is near-
ing extinction in the wild because of the belief prevalent in some parts of
the world that a powder derived from its horn has aphrodisiac properties.
In reality, the chemical properties of powdered rhinoceros horn are no dif-
ferent from those of powdered bovine hooves or human fingernails.
c03AminoAcidsPeptidesAndProteins.indd Page 75 11/08/12 12:47 PM user-F408 /Users/user-F408/Desktop
(a) (c)(b)
Amino Acids, Peptides, and Proteins76
unique but is assigned to the amino acid that is most com-mon in proteins (for example, leucine is more common than lysine). For another four, the letter used is phonetically suggestive (RFYW: aRginine, Fenyl-alanine, tYrosine, tWip-tophan). The rest were harder to assign. Four (DNEQ) were assigned letters found within or suggested by their names (asparDic, asparagiNe, gluta-mEke, Q-tamine). That left
lysine. Only a few letters were left in the alphabet, and K was chosen because it was the closest to L. ■
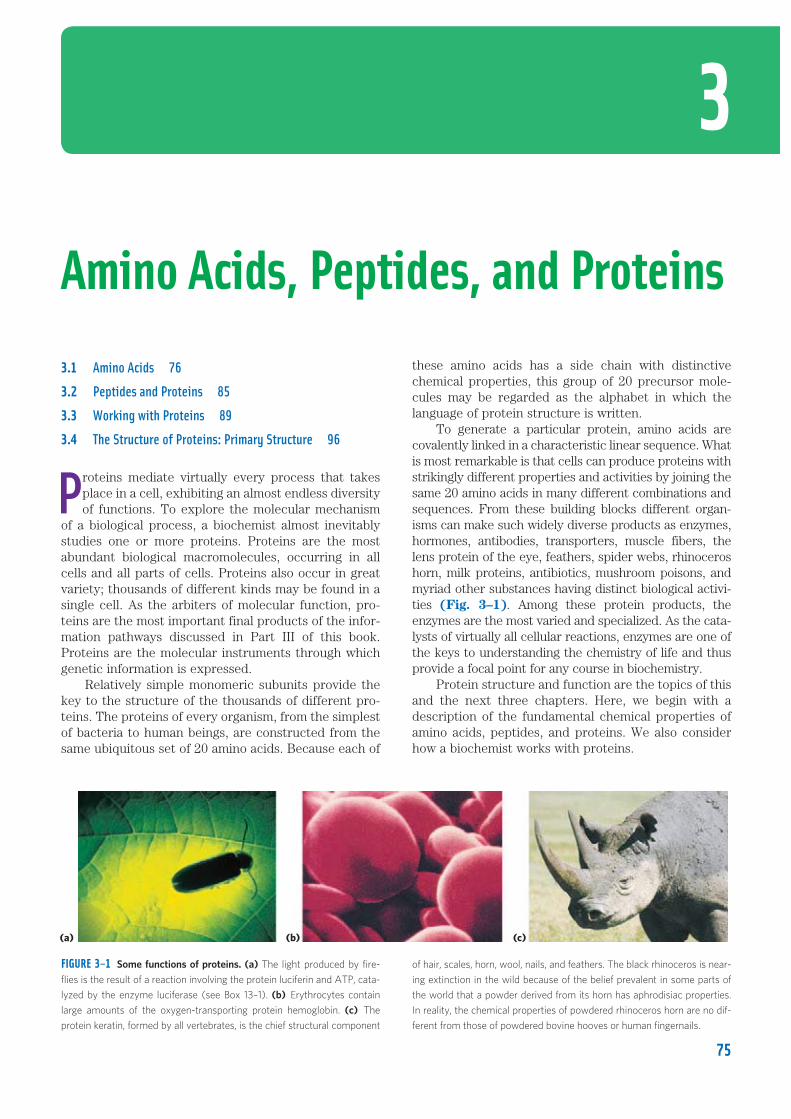
For all the common amino acids except glycine, the � carbon is bonded to four different groups: a car-boxyl group, an amino group, an R group, and a hydro-gen atom (Fig. 3–2; in glycine, the R group is another hydrogen atom). The �-carbon atom is thus a chiral center (p. 17). Because of the tetrahedral arrange-ment of the bonding orbitals around the �-carbon atom, the four different groups can occupy two unique spatial arrangements, and thus amino acids have two possible stereoisomers. Since they are nonsuperposable mirror images of each other (Fig. 3–3), the two forms
3.1 Amino Acids Protein Architecture—Amino Acids Proteins are polymers of amino acids, with each amino acid residue joined to its neighbor by a specific type of covalent bond. (The term “residue” reflects the loss of the elements of water when one amino acid is joined to another.) Proteins can be bro-ken down (hydrolyzed) to their constituent amino acids by a variety of methods, and the earliest studies of proteins naturally focused on the free amino acids derived from them. Twenty different amino acids are commonly found in proteins. The first to be discovered was asparagine, in 1806. The last of the 20 to be found, threonine, was not identified until 1938. All the amino acids have trivial or common names, in some cases derived from the source from which they were first isolated. Asparagine was first found in asparagus, and glutamate in wheat gluten; tyro-sine was first isolated from cheese (its name is derived from the Greek tyros, “cheese”); and glycine (Greek glykos, “sweet”) was so named because of its sweet taste.
Amino Acids Share Common Structural FeaturesAll 20 of the common amino acids are �-amino acids. They have a carboxyl group and an amino group bonded to the same carbon atom (the � carbon) (Fig. 3–2). They differ from each other in their side chains, or R groups, which vary in structure, size, and electric charge, and which influence the solubility of the amino acids in water. In addition to these 20 amino acids there are many less com-mon ones. Some are residues modified after a protein has been synthesized; others are amino acids present in living organisms but not as constituents of proteins. The com-mon amino acids of proteins have been assigned three-letter abbreviations and one-letter symbols (Table 3–1), which are used as shorthand to indicate the composition and sequence of amino acids polymerized in proteins.
KEY CONVENTION: The three-letter code is transparent, the abbreviations generally consisting of the first three letters of the amino acid name. The one-letter code was devised by Margaret Oakley Dayhoff, considered by many to be the founder of the field of bioinformatics. The one-letter code reflects an attempt to reduce the size of the data files (in an era of punch-card computing) used to describe amino acid sequences. It was designed to be easily memo-rized, and understanding its origin can help students do just that. For six amino acids (CHIMSV), the first letter of the amino acid name is unique and thus is used as the symbol. For five others (AGLPT), the first letter is not
Margaret Oakley Dayhoff,
1925–1983
FIGURE 3–2 General structure of an amino acid. This structure is common to
all but one of the �-amino acids. (Proline,
a cyclic amino acid, is the exception.) The
R group, or side chain (purple), attached
to the � carbon (gray) is different in each
amino acid.
FIGURE 3–3 Stereoisomerism in �-amino acids. (a) The two stereoiso-
mers of alanine, L- and D-alanine, are nonsuperposable mirror images of
each other (enantiomers). (b, c) Two different conventions for showing
the configurations in space of stereoisomers. In perspective formulas
(b), the solid wedge-shaped bonds project out of the plane of the paper,
the dashed bonds behind it. In projection formulas (c), the horizontal
bonds are assumed to project out of the plane of the paper, the vertical
bonds behind. However, projection formulas are often used casually and
are not always intended to portray a specific stereochemical configuration.
H3N�
COO�
CH3
H H C
COO�
�
CH3
N�
H3
L -Alanine D-Alanine
C
(c)
c03AminoAcidsPeptidesAndProteins.indd Page 76 11/08/12 12:47 PM user-F408 /Users/user-F408/Desktop
(a)
COO�
CH3CH3
CaCa
COO�
L-Alanine D-Alanine
H3N�
C
COO�
CH3
H H C
COO
CH3
N�
H3
(b) L -Alanine D-Alanine
NH3
�HHH3N�
COO�
R
Ca HH3N�
3.1 Amino Acids 77
confusing. The additional carbons in an R group are commonly designated �, �, �, ´, and so forth, proceed-ing out from the � carbon. For most other organic mol-ecules, carbon atoms are simply numbered from one end, giving highest priority (C-1) to the carbon with the substituent containing the atom of highest atomic number. Within this latter convention, the carboxyl
represent a class of stereoisomers called enantiomers (see Fig. 1–20). All molecules with a chiral center are also optically active—that is, they rotate plane-polarized light (see Box 1–2).
KEY CONVENTION: Two conventions are used to identify the carbons in an amino acid—a practice that can be
pKa values Abbreviation/ pK1 pK2 pKR Hydropathy Occurrence inAmino acid symbol M r* (OCOOH) (ONH�
3 ) (R group) pI index† proteins (%)‡
Nonpolar, aliphaticR groups
Glycine Gly G 75 2.34 9.60 5.97 20.4 7.2
Alanine Ala A 89 2.34 9.69 6.01 1.8 7.8
Proline Pro P 115 1.99 10.96 6.48 21.6 5.2
Valine Val V 117 2.32 9.62 5.97 4.2 6.6
Leucine Leu L 131 2.36 9.60 5.98 3.8 9.1
Isoleucine Ile I 131 2.36 9.68 6.02 4.5 5.3
Methionine Met M 149 2.28 9.21 5.74 1.9 2.3
AromaticR groups
Phenylalanine Phe F 165 1.83 9.13 5.48 2.8 3.9
Tyrosine Tyr Y 181 2.20 9.11 10.07 5.66 �1.3 3.2
Tryptophan Trp W 204 2.38 9.39 5.89 �0.9 1.4
Polar, unchargedR groups
Serine Ser S 105 2.21 9.15 5.68 �0.8 6.8
Threonine Thr T 119 2.11 9.62 5.87 �0.7 5.9
Cysteine¶ Cys C 121 1.96 10.28 8.18 5.07 2.5 1.9
Asparagine Asn N 132 2.02 8.80 5.41 �3.5 4.3
Glutamine Gln Q 146 2.17 9.13 5.65 �3.5 4.2
Positively chargedR groups
Lysine Lys K 146 2.18 8.95 10.53 9.74 �3.9 5.9
Histidine His H 155 1.82 9.17 6.00 7.59 �3.2 2.3
Arginine Arg R 174 2.17 9.04 12.48 10.76 �4.5 5.1
Negatively chargedR groups
Aspartate Asp D 133 1.88 9.60 3.65 2.77 �3.5 5.3
Glutamate Glu E 147 2.19 9.67 4.25 3.22 �3.5 6.3
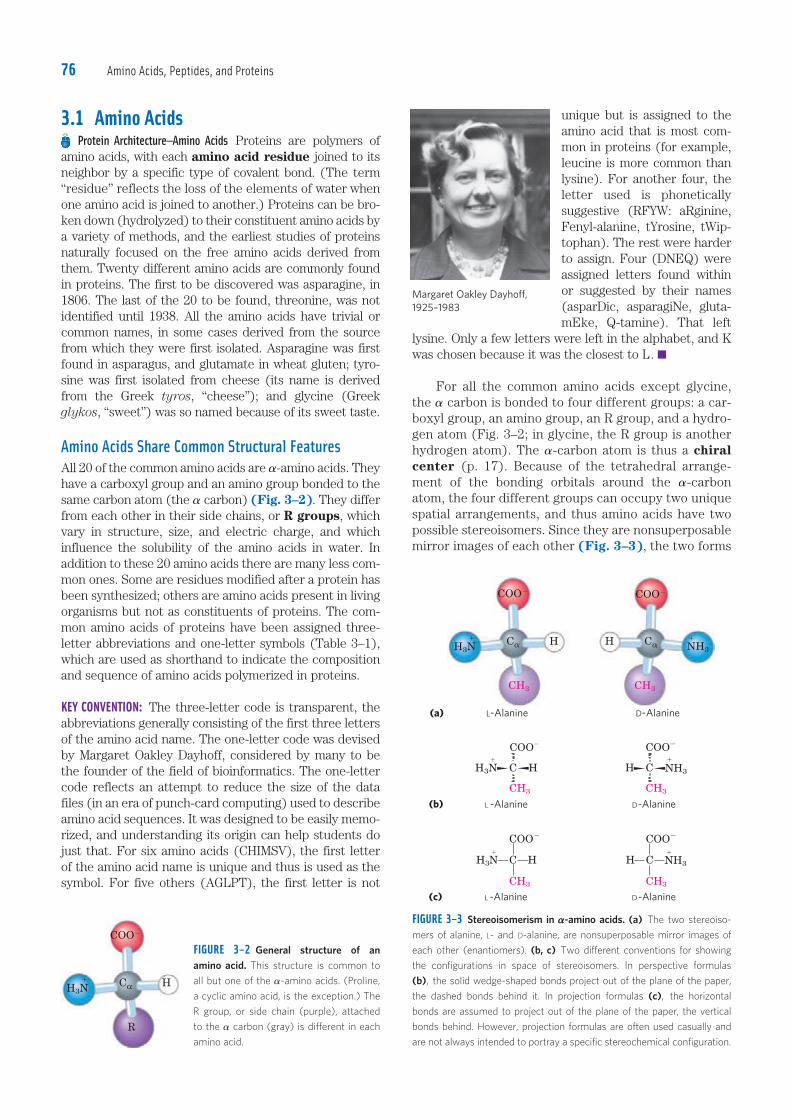
*Mr values reflect the structures as shown in Figure 3–5. The elements of water (Mr 18) are deleted when the amino acid is incorporated into a polypeptide.† A scale combining hydrophobicity and hydrophilicity of R groups. The values reflect the free energy (DG) of transfer of the amino acid side chain from a hydrophobic solvent to water. This
transfer is favorable (DG , 0; negative value in the index) for charged or polar amino acid side chains, and unfavorable (DG . 0; positive value in the index) for amino acids with nonpolar or
more hydrophobic side chains. See Chapter 11. From Kyte, J. & Doolittle, R.F. (1982) A simple method for displaying the hydropathic character of a protein. J. Mol. Biol. 157, 105–132.‡Average occurrence in more than 1,150 proteins. From Doolittle, R.F. (1989) Redundancies in protein sequences. In Prediction of Protein Structure and the Principles of Protein Conformation
(Fasman, G.D., ed.), pp. 599–623, Plenum Press, New York.¶Cysteine is generally classified as polar despite having a positive hydropathy index. This reflects the ability of the sulfhydryl group to act as a weak acid and to form a weak hydrogen bond with
oxygen or nitrogen.
TABLE 3–1 Properties and Conventions Associated with the Common Amino Acids Found in Proteins
c03AminoAcidsPeptidesAndProteins.indd Page 77 11/08/12 12:47 PM user-F408 /Users/user-F408/Desktop
Amino Acids, Peptides, and Proteins78
D designations were used for levorotatory (rotating plane-polarized light to the left) and dextrorotatory (rotating light to the right). However, not all L-amino acids are levorotatory, and the convention shown in Figure 3–4 was needed to avoid potential ambiguities about absolute configuration. By Fischer’s convention, L and D refer only to the absolute configuration of the four substituents around the chiral carbon, not to opti-cal properties of the molecule. Another system of specifying configuration around a chiral center is the RS system, which is used in the systematic nomenclature of organic chemistry and describes more precisely the configuration of molecules with more than one chiral center (p. 18).
The Amino Acid Residues in Proteins Are L StereoisomersNearly all biological compounds with a chiral center occur naturally in only one stereoisomeric form, either D or L. The amino acid residues in protein molecules are exclusively L stereoisomers. D-Amino acid residues have been found in only a few, generally small peptides, including some peptides of bacterial cell walls and cer-tain peptide antibiotics. It is remarkable that virtually all amino acid resi-dues in proteins are L stereoisomers. When chiral com-pounds are formed by ordinary chemical reactions, the result is a racemic mixture of D and L isomers, which are difficult for a chemist to distinguish and separate. But to a living system, D and L isomers are as different as the right hand and the left. The formation of stable, repeat-ing substructures in proteins (Chapter 4) generally requires that their constituent amino acids be of one stereochemical series. Cells are able to specifically syn-thesize the L isomers of amino acids because the active sites of enzymes are asymmetric, causing the reactions they catalyze to be stereospecific.
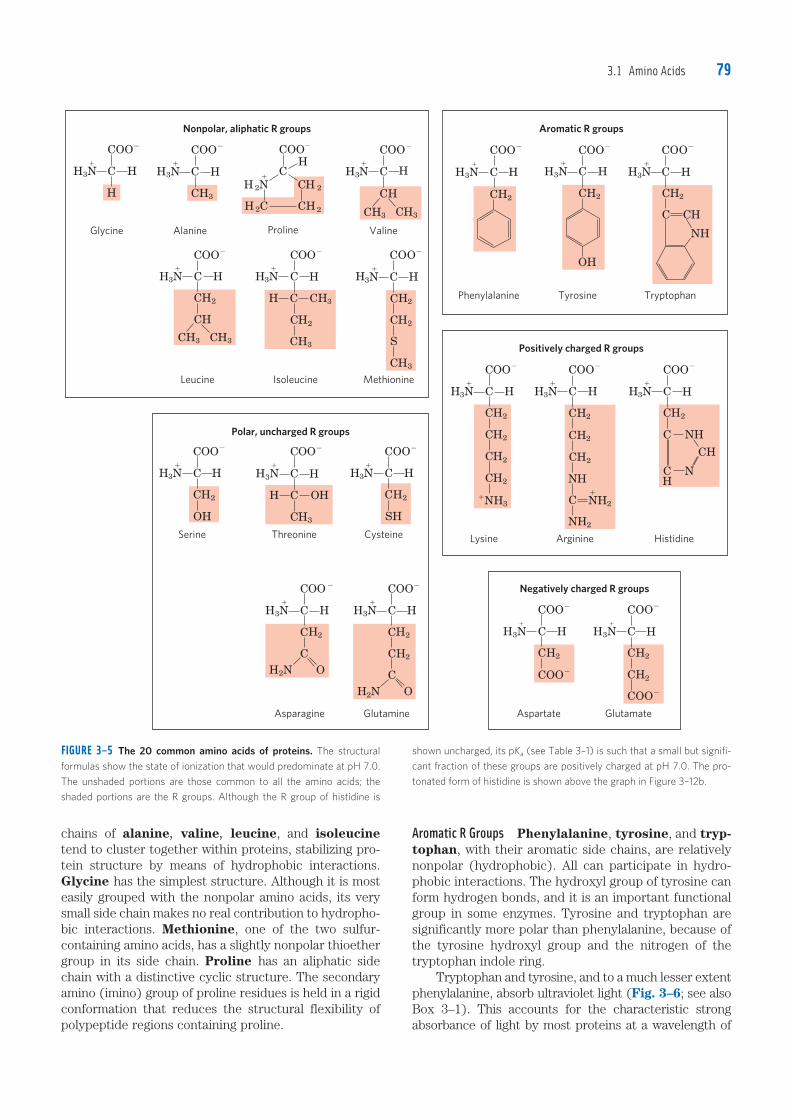
Amino Acids Can Be Classified by R GroupKnowledge of the chemical properties of the common amino acids is central to an understanding of biochemistry. The topic can be simplified by grouping the amino acids into five main classes based on the properties of their R groups (Table 3–1), particularly their polarity, or ten-dency to interact with water at biological pH (near pH 7.0). The polarity of the R groups varies widely, from nonpolar and hydrophobic (water-insoluble) to highly polar and hydrophilic (water-soluble). A few amino acids are some-what difficult to characterize or do not fit perfectly in any one group, particularly glycine, histidine, and cysteine. Their assignments to particular groupings are the results of considered judgments rather than absolutes. The structures of the 20 common amino acids are shown in Figure 3–5, and some of their properties are listed in Table 3–1. Within each class there are grada-tions of polarity, size, and shape of the R groups.
Nonpolar, Aliphatic R Groups The R groups in this class of amino acids are nonpolar and hydrophobic. The side
carbon of an amino acid would be C-1 and the � carbon would be C-2.
Lysine
CH2
�NH3
�OOC
�NH3
CH2CH2CH2CH2 3 4 5 61
edgba
In some cases, such as amino acids with heterocyclic R groups (such as histidine), the Greek lettering system is ambiguous and the numbering convention is there-fore used. For branched amino acid side chains, equiva-lent carbons are given numbers after the Greek letters. Leucine thus has �1 and �2 carbons (see the structure in Fig. 3–5). ■
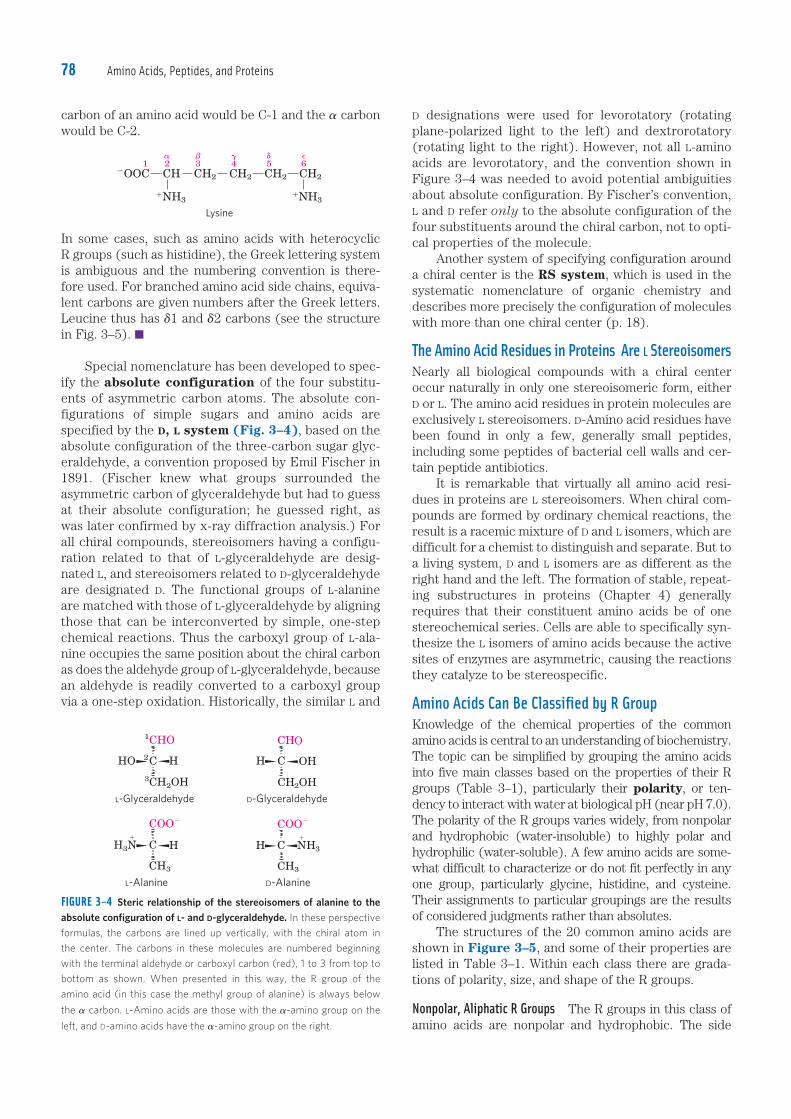
Special nomenclature has been developed to spec-ify the absolute configuration of the four substitu-ents of asymmetric carbon atoms. The absolute con-figurations of simple sugars and amino acids are specified by the D, L system (Fig. 3–4), based on the absolute configuration of the three-carbon sugar glyc-eraldehyde, a convention proposed by Emil Fischer in 1891. (Fischer knew what groups surrounded the asymmetric carbon of glyceraldehyde but had to guess at their absolute configuration; he guessed right, as was later confirmed by x-ray diffraction analysis.) For all chiral compounds, stereoisomers having a configu-ration related to that of L-glyceraldehyde are desig-nated L, and stereoisomers related to D-glyceraldehyde are designated D. The functional groups of L-alanine are matched with those of L-glyceraldehyde by aligning those that can be interconverted by simple, one-step chemical reactions. Thus the carboxyl group of L-ala-nine occupies the same position about the chiral carbon as does the aldehyde group of L-glyceraldehyde, because an aldehyde is readily converted to a carboxyl group via a one-step oxidation. Historically, the similar L and
FIGURE 3–4 Steric relationship of the stereoisomers of alanine to the absolute configuration of L- and D-glyceraldehyde. In these perspective
formulas, the carbons are lined up vertically, with the chiral atom in
the center. The carbons in these molecules are numbered beginning
with the terminal aldehyde or carboxyl carbon (red), 1 to 3 from top to
bottom as shown. When presented in this way, the R group of the
amino acid (in this case the methyl group of alanine) is always below
the � carbon. L-Amino acids are those with the �-amino group on the
left, and D-amino acids have the �-amino group on the right.
HO C
1CHO
3CH2OH
H H C
CHO
CH2OH
OH
H3N�
C
COO�
CH3
H H C
COO�
CH3
N�
H3
L-Glyceraldehyde
D-Alanine
2
D-Glyceraldehyde
L-Alanine
c03AminoAcidsPeptidesAndProteins.indd Page 78 11/08/12 12:47 PM user-F408 /Users/user-F408/Desktop
3.1 Amino Acids 79
chains of alanine, valine, leucine, and isoleucine tend to cluster together within proteins, stabilizing pro-tein structure by means of hydrophobic interactions. Glycine has the simplest structure. Although it is most easily grouped with the nonpolar amino acids, its very small side chain makes no real contribution to hydropho-bic interactions. Methionine, one of the two sulfur-containing amino acids, has a slightly nonpolar thioether group in its side chain. Proline has an aliphatic side chain with a distinctive cyclic structure. The secondary amino (imino) group of proline residues is held in a rigid conformation that reduces the structural flexibility of polypeptide regions containing proline.
Aromatic R Groups Phenylalanine, tyrosine, and tryp-tophan, with their aromatic side chains, are relatively nonpolar (hydrophobic). All can participate in hydro-phobic interactions. The hydroxyl group of tyrosine can form hydrogen bonds, and it is an important functional group in some enzymes. Tyrosine and tryptophan are significantly more polar than phenylalanine, because of the tyrosine hydroxyl group and the nitrogen of the tryptophan indole ring. Tryptophan and tyrosine, and to a much lesser extent phenylalanine, absorb ultraviolet light (Fig. 3–6; see also Box 3–1). This accounts for the characteristic strong absorbance of light by most proteins at a wavelength of
Nonpolar, aliphatic R groups
Glycine Alanine Valine
Aromatic R groups
Phenylalanine Tyrosine
Proline
Tryptophan
Polar, uncharged R groups
Serine
Positively charged R groups
Lysine Arginine Histidine
Negatively charged R groups
Aspartate GlutamateGlutamineAsparagine
Cysteine
H3N�
C
COO�
H
H H3N�
C
COO�
CH3
H H3N�
C
COO�
C
CH3 CH3
H
H
Leucine
H3N�
C
COO�
C
C
CH3 CH3
H
H2
H
Methionine
H3N�
C
COO�
C
C
S
CH3
H2
H2
H
H3N�
C
COO�
CH2
H
OH
Threonine
H3N�
C
COO�
H C
CH3
OH
H H3N�
C
COO�
C
SH
H2
H
H 2N�
H 2C
C
COO�
H
C
CH2
H 2
H3N�
C
COO�
C
COO�
H2
H H3N�
C
COO�
C
C
COO�
H2
H2
H
�N
C
C
C
C
H3N�
C
COO�
H
H2
H2
H2
H2
H3 C
N
C
C
C
H3N�
C
COO�
H
H2
H2
H2
H
NH2
N�
H2
H3N�
C
COO�
C
C
CH2N O
H2
H2
HH3N�
C
COO �
C
CH2N O
H2
H
H3N�
C
COO�
CH
C NH
2
H
CH
N
CH
H3N�
C
COO�
CH2
H H3N�
C
COO�
C
C CH
H2
H
NH
Isoleucine
H3
�
C
COO�
H C
C
CH3
H2
H
HN
C 3
H3N�
C
COO�
CH2
H
OH
FIGURE 3–5 The 20 common amino acids of proteins. The structural
formulas show the state of ionization that would predominate at pH 7.0.
The unshaded portions are those common to all the amino acids; the
shaded portions are the R groups. Although the R group of histidine is
shown uncharged, its pKa (see Table 3–1) is such that a small but signifi-
cant fraction of these groups are positively charged at pH 7.0. The pro-
tonated form of histidine is shown above the graph in Figure 3–12b.
c03AminoAcidsPeptidesAndProteins.indd Page 79 11/08/12 12:47 PM user-F408 /Users/user-F408/Desktop
Amino Acids, Peptides, and Proteins80
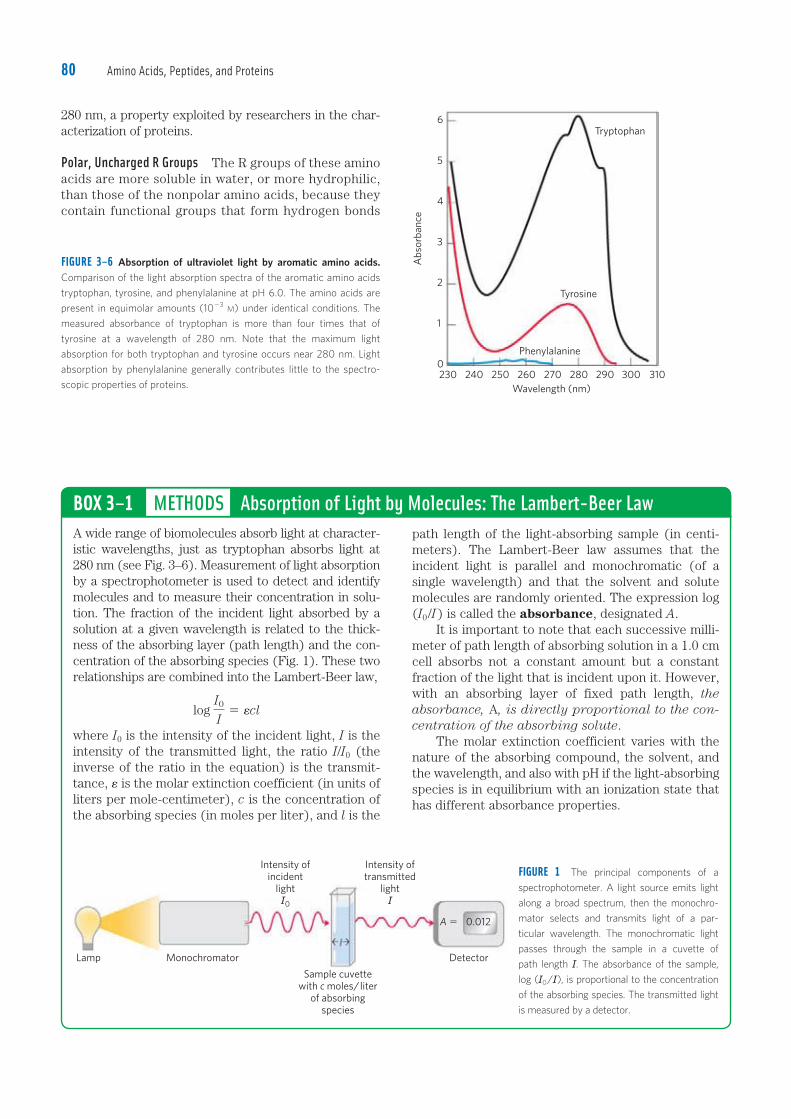
280 nm, a property exploited by researchers in the char-acterization of proteins.
Polar, Uncharged R Groups The R groups of these amino acids are more soluble in water, or more hydrophilic, than those of the nonpolar amino acids, because they contain functional groups that form hydrogen bonds
FIGURE 3–6 Absorption of ultraviolet light by aromatic amino acids. Comparison of the light absorption spectra of the aromatic amino acids
tryptophan, tyrosine, and phenylalanine at pH 6.0. The amino acids are
present in equimolar amounts (10�3 M) under identical conditions. The
measured absorbance of tryptophan is more than four times that of
tyrosine at a wavelength of 280 nm. Note that the maximum light
absorption for both tryptophan and tyrosine occurs near 280 nm. Light
absorption by phenylalanine generally contributes little to the spectro-
scopic properties of proteins.
A wide range of biomolecules absorb light at character-istic wavelengths, just as tryptophan absorbs light at 280 nm (see Fig. 3–6). Measurement of light absorption by a spectrophotometer is used to detect and identify molecules and to measure their concentration in solu-tion. The fraction of the incident light absorbed by a solution at a given wavelength is related to the thick-ness of the absorbing layer (path length) and the con-centration of the absorbing species (Fig. 1). These two relationships are combined into the Lambert-Beer law,
log I0
I5 ecl
where I0 is the intensity of the incident light, I is the intensity of the transmitted light, the ratio I/I0 (the inverse of the ratio in the equation) is the transmit-tance, � is the molar extinction coefficient (in units of liters per mole-centimeter), c is the concentration of the absorbing species (in moles per liter), and l is the
path length of the light-absorbing sample (in centi-meters). The Lambert-Beer law assumes that the incident light is parallel and monochromatic (of a single wavelength) and that the solvent and solute molecules are randomly oriented. The expression log (I0/I) is called the absorbance, designated A. It is important to note that each successive milli-meter of path length of absorbing solution in a 1.0 cm cell absorbs not a constant amount but a constant fraction of the light that is incident upon it. However, with an absorbing layer of fixed path length, the absorbance, A, is directly proportional to the con-centration of the absorbing solute. The molar extinction coefficient varies with the nature of the absorbing compound, the solvent, and the wavelength, and also with pH if the light-absorbing species is in equilibrium with an ionization state that has different absorbance properties.
BOX 3–1 METHODS Absorption of Light by Molecules: The Lambert-Beer Law
FIGURE 1 The principal components of a
spectrophotometer. A light source emits light
along a broad spectrum, then the monochro-
mator selects and transmits light of a par-
ticular wavelength. The monochromatic light
passes through the sample in a cuvette of
path length . The absorbance of the sample,
log ( 0/ ), is proportional to the concentration
of the absorbing species. The transmitted light
is measured by a detector.
c03AminoAcidsPeptidesAndProteins.indd Page 80 11/08/12 12:47 PM user-F408 /Users/user-F408/Desktop
Tryptophan
Wavelength (nm)
Abs
orba
nce
5
4
3
2
1
0
6
230 240 250 260 270 280 290 300 310
Intensity oftransmitted
light
DetectorMonochromatorLamp
Intensity ofincident
light0
Sample cuvettewith c moles/liter
of absorbingspecies
Tyrosine
Phenylalanine
0.012A �
3.1 Amino Acids 81
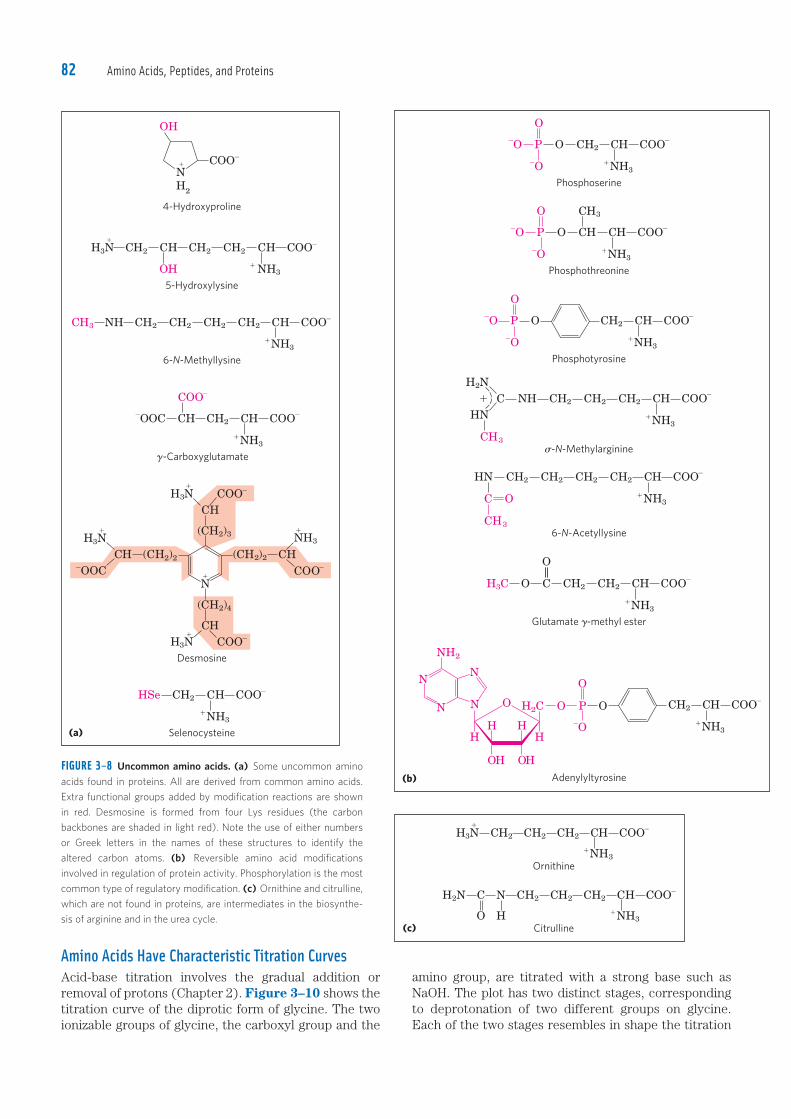
Uncommon Amino Acids Also Have Important FunctionsIn addition to the 20 common amino acids, proteins may contain residues created by modification of common residues already incorporated into a polypeptide (Fig. 3–8a). Among these uncommon amino acids are 4-hydroxyproline, a derivative of proline, and 5-hydroxylysine, derived from lysine. The former is found in plant cell wall proteins, and both are found in collagen, a fibrous protein of connective tissues. 6-N-Methyllysine is a constituent of myosin, a contrac-tile protein of muscle. Another important uncommon amino acid is �-carboxyglutamate, found in the blood-clotting protein prothrombin and in certain other pro-teins that bind Ca21 as part of their biological function. More complex is desmosine, a derivative of four Lys residues, which is found in the fibrous protein elastin. Selenocysteine is a special case. This rare amino acid residue is introduced during protein synthesis rather than created through a postsynthetic modifica-tion. It contains selenium rather than the sulfur of cys-teine. Actually derived from serine, selenocysteine is a constituent of just a few known proteins. Some amino acid residues in a protein may be modified transiently to alter the protein’s function. The addition of phosphoryl, methyl, acetyl, adenylyl, ADP-ribosyl, or other groups to particular amino acid residues can increase or decrease a protein’s activity (Fig. 3–8b). Phosphorylation is a particularly common regulatory modification. Covalent modification as a protein regula-tory strategy is discussed in more detail in Chapter 6. Some 300 additional amino acids have been found in cells. They have a variety of functions but are not all constituents of proteins. Ornithine and citrulline (Fig. 3–8c) deserve special note because they are key intermediates (metabolites) in the biosynthesis of argi-nine (Chapter 22) and in the urea cycle (Chapter 18).
Amino Acids Can Act as Acids and BasesThe amino and carboxyl groups of amino acids, along with the ionizable R groups of some amino acids, func-tion as weak acids and bases. When an amino acid lack-ing an ionizable R group is dissolved in water at neutral pH, it exists in solution as the dipolar ion, or zwitterion (German for “hybrid ion”), which can act as either an acid or a base (Fig. 3–9). Substances having this dual (acid-base) nature are amphoteric and are often called ampholytes (from “amphoteric electrolytes”). A sim-ple monoamino monocarboxylic �-amino acid, such as alanine, is a diprotic acid when fully protonated; it has two groups, the —COOH group and the —NH�
3 group, that can yield protons:
H
C COO�R
H
C COOHR
�NH3�NH3
�1 0 �1
H� H
C COO�R
NH2
H�
Netcharge:
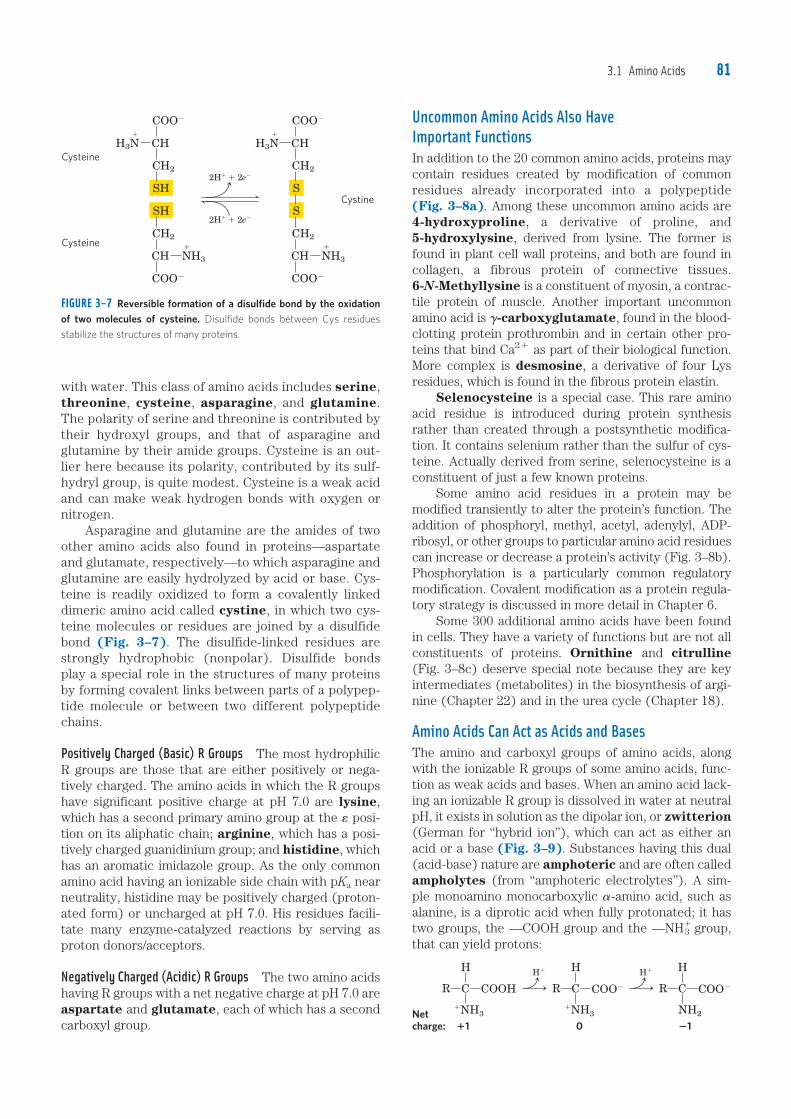
with water. This class of amino acids includes serine, threonine, cysteine, asparagine, and glutamine. The polarity of serine and threonine is contributed by their hydroxyl groups, and that of asparagine and glutamine by their amide groups. Cysteine is an out-lier here because its polarity, contributed by its sulf-hydryl group, is quite modest. Cysteine is a weak acid and can make weak hydrogen bonds with oxygen or nitrogen. Asparagine and glutamine are the amides of two other amino acids also found in proteins—aspartate and glutamate, respectively—to which asparagine and glutamine are easily hydrolyzed by acid or base. Cys-teine is readily oxidized to form a covalently linked dimeric amino acid called cystine, in which two cys-teine molecules or residues are joined by a disulfide bond (Fig. 3–7). The disulfide-linked residues are strongly hydrophobic (nonpolar). Disulfide bonds play a special role in the structures of many proteins by forming covalent links between parts of a polypep-tide molecule or between two different polypeptide chains.
Positively Charged (Basic) R Groups The most hydrophilic R groups are those that are either positively or nega-tively charged. The amino acids in which the R groups have significant positive charge at pH 7.0 are lysine, which has a second primary amino group at the � posi-tion on its aliphatic chain; arginine, which has a posi-tively charged guanidinium group; and histidine, which has an aromatic imidazole group. As the only common amino acid having an ionizable side chain with pKa near neutrality, histidine may be positively charged (proton-ated form) or uncharged at pH 7.0. His residues facili-tate many enzyme-catalyzed reactions by serving as proton donors/acceptors.
Negatively Charged (Acidic) R Groups The two amino acids having R groups with a net negative charge at pH 7.0 are aspartate and glutamate, each of which has a second carboxyl group.
FIGURE 3–7 Reversible formation of a disulfide bond by the oxidation of two molecules of cysteine. Disulfide bonds between Cys residues
stabilize the structures of many proteins.
CH
2H� � 2e�
2H� � 2e�
COO�
COO�
H3N
CH2
CH
CH2
SH
SH
Cysteine
Cystine
Cysteine
�
NH3
�
CH
COO�
COO�
H3N
CH2
CH
CH2
S
S
�
NH3
�
c03AminoAcidsPeptidesAndProteins.indd Page 81 11/08/12 12:47 PM user-F408 /Users/user-F408/Desktop
Amino Acids, Peptides, and Proteins82
amino group, are titrated with a strong base such as NaOH. The plot has two distinct stages, corresponding to deprotonation of two different groups on glycine. Each of the two stages resembles in shape the titration
Amino Acids Have Characteristic Titration CurvesAcid-base titration involves the gradual addition or removal of protons (Chapter 2). Figure 3–10 shows the titration curve of the diprotic form of glycine. The two ionizable groups of glycine, the carboxyl group and the
FIGURE 3–8 Uncommon amino acids. (a) Some uncommon amino
acids found in proteins. All are derived from common amino acids.
Extra functional groups added by modification reactions are shown
in red. Desmosine is formed from four Lys residues (the carbon
backbones are shaded in light red). Note the use of either numbers
or Greek letters in the names of these structures to identify the
altered carbon atoms. (b) Reversible amino acid modifications
involved in regulation of protein activity. Phosphorylation is the most
common type of regulatory modification. (c) Ornithine and citrulline,
which are not found in proteins, are intermediates in the biosynthe-
sis of arginine and in the urea cycle.
4-Hydroxyproline
H3N�
CH2 C
OH
H CH2 CH2 C� NH3
H COO�
5-Hydroxylysine
CH3 NH CH2 CH2 CH2 CH2 CH COO
6-N-Methyllysine
�OOC C
COO�
H CH2 C�NH3
H COO�
�-Carboxyglutamate
CH3N
�
�OOCH (CH2)2
CH3N
�COO�
H
(CH2)3
CN�
H3
COOH
C
(C
N�
H2)4
H3N�
COO�
H
Desmosine
HSe CH2 C�NH3
H COO�
�
Selenocysteine(a)
(CH2)2�
�NH3
OH
NH2
� COO�
N
N
(b)
Phosphoserine
�O�O
P
O
CH2 CO�NH3
H COO�
�-N-Methylarginine
C� CH2 C�NH3
H COO�
CH3
CH2CH2
H2N
HNNH
6-N-Acetyllysine
Phosphotyrosine
�O�O
P
O
O CH2 C�NH3
H COO�
Adenylyltyrosine
CH2 C�NH3
H COO�CH2CH2CH2
C
CH3
HN
O
Glutamate �-methyl ester
CH2 C�NH3
H COO�CH2COH3C
O
Phosphothreonine
�O�O
P
O 3
CO�NH3
H
CH
CH COO�
CH2 C�NH3
H COO�N
N
NH2
H
H
HH
OH O
H
O H2C O
O
OP�O
H3N CH2 CH2 CH2 C�
�
NH3
H COO�
Ornithine
H2N C
O
N
H
CH2 CH2 CH2 C�NH3
H COO�
Citrulline(c)
c03AminoAcidsPeptidesAndProteins.indd Page 82 13/08/12 9:14 AM user-F408 /Users/user-F408/Desktop
3.1 Amino Acids 83
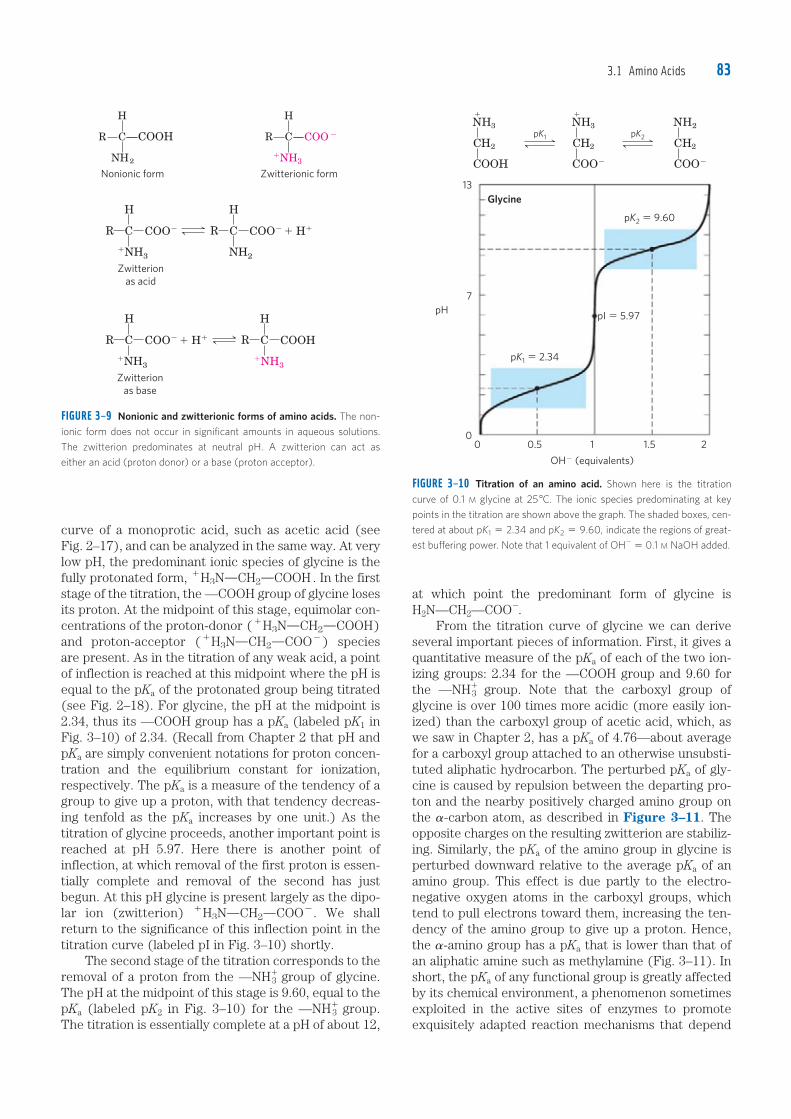
at which point the predominant form of glycine is H2N—CH2—COO�. From the titration curve of glycine we can derive several important pieces of information. First, it gives a quantitative measure of the pKa of each of the two ion-izing groups: 2.34 for the —COOH group and 9.60 for the —NH�
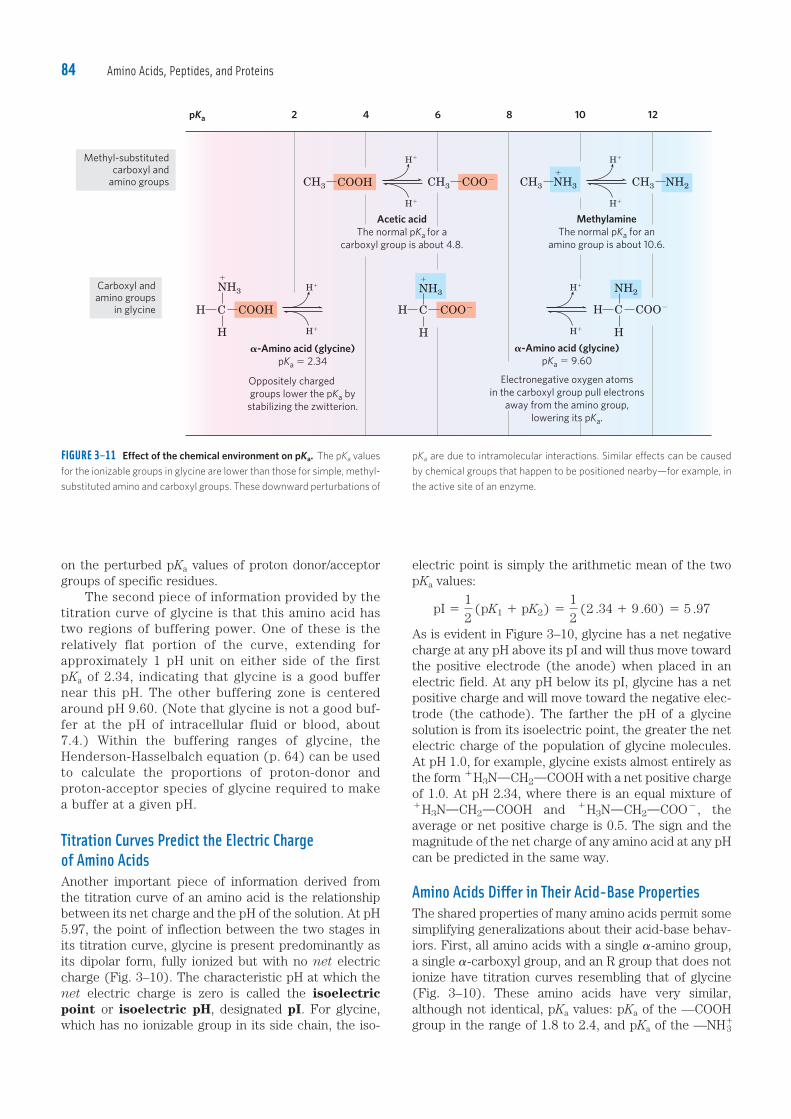
3 group. Note that the carboxyl group of glycine is over 100 times more acidic (more easily ion-ized) than the carboxyl group of acetic acid, which, as we saw in Chapter 2, has a pKa of 4.76—about average for a carboxyl group attached to an otherwise unsubsti-tuted aliphatic hydrocarbon. The perturbed pKa of gly-cine is caused by repulsion between the departing pro-ton and the nearby positively charged amino group on the �-carbon atom, as described in Figure 3–11. The opposite charges on the resulting zwitterion are stabiliz-ing. Similarly, the pKa of the amino group in glycine is perturbed downward relative to the average pKa of an amino group. This effect is due partly to the electro-negative oxygen atoms in the carboxyl groups, which tend to pull electrons toward them, increasing the ten-dency of the amino group to give up a proton. Hence, the �-amino group has a pKa that is lower than that of an aliphatic amine such as methylamine (Fig. 3–11). In short, the pKa of any functional group is greatly affected by its chemical environment, a phenomenon sometimes exploited in the active sites of enzymes to promote exquisitely adapted reaction mechanisms that depend
curve of a monoprotic acid, such as acetic acid (see Fig. 2–17), and can be analyzed in the same way. At very low pH, the predominant ionic species of glycine is the fully protonated form, 1H3NOCH2OCOOH . In the first stage of the titration, the —COOH group of glycine loses its proton. At the midpoint of this stage, equimolar con-centrations of the proton-donor (1H3NOCH2OCOOH) and proton-acceptor (1H3NOCH2OCOO2) species are present. As in the titration of any weak acid, a point of inflection is reached at this midpoint where the pH is equal to the pKa of the protonated group being titrated (see Fig. 2–18). For glycine, the pH at the midpoint is 2.34, thus its —COOH group has a pKa (labeled pK1 in Fig. 3–10) of 2.34. (Recall from Chapter 2 that pH and pKa are simply convenient notations for proton concen-tration and the equilibrium constant for ionization, respectively. The pKa is a measure of the tendency of a group to give up a proton, with that tendency decreas-ing tenfold as the pKa increases by one unit.) As the titration of glycine proceeds, another important point is reached at pH 5.97. Here there is another point of inflection, at which removal of the first proton is essen-tially complete and removal of the second has just begun. At this pH glycine is present largely as the dipo-lar ion (zwitterion) 1H3NOCH2OCOO2. We shall return to the significance of this inflection point in the titration curve (labeled pI in Fig. 3–10) shortly. The second stage of the titration corresponds to the removal of a proton from the —NH�
3 group of glycine. The pH at the midpoint of this stage is 9.60, equal to the pKa (labeled pK2 in Fig. 3–10) for the —NH�
3 group. The titration is essentially complete at a pH of about 12,
Nonionic form Zwitterionic form
C
NH2
R
H
COOH C
NH3
R
H
H
C COO
COO
R
NH3
H
C COOR
NH2
H
Zwitterionas acid
H
C COOHR
H
C COOR
NH3
H
NH3
Zwitterionas base
FIGURE 3–9 Nonionic and zwitterionic forms of amino acids. The non-
ionic form does not occur in significant amounts in aqueous solutions.
The zwitterion predominates at neutral pH. A zwitterion can act as
either an acid (proton donor) or a base (proton acceptor).
pK1 pK2
FIGURE 3–10 Titration of an amino acid. Shown here is the titration
curve of 0.1 M glycine at 258C. The ionic species predominating at key
points in the titration are shown above the graph. The shaded boxes, cen-
tered at about pK1 5 2.34 and pK2 5 9.60, indicate the regions of great-
est buffering power. Note that 1 equivalent of OH� 5 0.1 M NaOH added.
c03AminoAcidsPeptidesAndProteins.indd Page 83 11/08/12 12:47 PM user-F408 /Users/user-F408/Desktop
N�
N�
C
COOH
H2
H3
C
COO�
H2
H3 N
C
COO�
H2
H2
13
0.5
OH� (equivalents)
pH
00
7
21.51
Glycine
pK2 � 9.60
pK1 � 2.34
pI � 5.97
Amino Acids, Peptides, and Proteins84
electric point is simply the arithmetic mean of the two pKa values:
pI 512
(pK1 1 pK2) 512
(2 .34 1 9 .60) 5 5 .97
As is evident in Figure 3–10, glycine has a net negative charge at any pH above its pI and will thus move toward the positive electrode (the anode) when placed in an electric field. At any pH below its pI, glycine has a net positive charge and will move toward the negative elec-trode (the cathode). The farther the pH of a glycine solution is from its isoelectric point, the greater the net electric charge of the population of glycine molecules. At pH 1.0, for example, glycine exists almost entirely as the form 1H3NOCH2OCOOH with a net positive charge of 1.0. At pH 2.34, where there is an equal mixture of 1H3NOCH2OCOOH and 1H3NOCH2OCOO2, the average or net positive charge is 0.5. The sign and the magnitude of the net charge of any amino acid at any pH can be predicted in the same way.
Amino Acids Differ in Their Acid-Base PropertiesThe shared properties of many amino acids permit some simplifying generalizations about their acid-base behav-iors. First, all amino acids with a single �-amino group, a single �-carboxyl group, and an R group that does not ionize have titration curves resembling that of glycine (Fig. 3–10). These amino acids have very similar, although not identical, pKa values: pKa of the —COOH group in the range of 1.8 to 2.4, and pKa of the —NH�
3
on the perturbed pKa values of proton donor/acceptor groups of specific residues. The second piece of information provided by the titration curve of glycine is that this amino acid has two regions of buffering power. One of these is the relatively flat portion of the curve, extending for approximately 1 pH unit on either side of the first pKa of 2.34, indicating that glycine is a good buffer near this pH. The other buffering zone is centered around pH 9.60. (Note that glycine is not a good buf-fer at the pH of intracellular fluid or blood, about 7.4.) Within the buffering ranges of glycine, the Henderson-Hasselbalch equation (p. 64) can be used to calculate the proportions of proton-donor and proton-acceptor species of glycine required to make a buffer at a given pH.
Titration Curves Predict the Electric Charge of Amino AcidsAnother important piece of information derived from the titration curve of an amino acid is the relationship between its net charge and the pH of the solution. At pH 5.97, the point of inflection between the two stages in its titration curve, glycine is present predominantly as its dipolar form, fully ionized but with no net electric charge (Fig. 3–10). The characteristic pH at which the net electric charge is zero is called the isoelectric point or isoelectric pH, designated pI. For glycine, which has no ionizable group in its side chain, the iso-
NH3
Methyl-substituted
carboxyl and
amino groups
Acetic acidThe normal pKa for a
carboxyl group is about 4.8.
pKa 2 4 6 8 10 12
MethylamineThe normal pKa for an
amino group is about 10.6.
Carboxyl and
amino groups
in glycine
-Amino acid (glycine)pKa 2.34
Oppositely charged
groups lower the pKa by
stabilizing the zwitterion.
-Amino acid (glycine)pKa 9.60
Electronegative oxygen atoms
in the carboxyl group pull electrons
away from the amino group,
lowering its pKa.
CH3 COOH CH3 CH3COO
COOCH
H
NH2
COOCH
H
CH3 NH3 NH2
H
H
COOHH C
H
NH3
H
H
H
H
H
H
FIGURE 3–11 Effect of the chemical environment on pKa. The pKa values
for the ionizable groups in glycine are lower than those for simple, methyl-
substituted amino and carboxyl groups. These downward perturbations of
pKa are due to intramolecular interactions. Similar effects can be caused
by chemical groups that happen to be positioned nearby—for example, in
the active site of an enzyme.
c03AminoAcidsPeptidesAndProteins.indd Page 84 11/08/12 12:47 PM user-F408 /Users/user-F408/Desktop
3.2 Peptides and Proteins 85
acids except glycine is asymmetric, and thus amino acids can exist in at least two stereoisomeric forms. Only the L stereoisomers, with a configuration related to the absolute configuration of the reference molecule L-glyceraldehyde, are found in proteins.
� Other, less common amino acids also occur, either as constituents of proteins (through modification of common amino acid residues after protein synthesis) or as free metabolites.
� Amino acids can be classified into five types on the basis of the polarity and charge (at pH 7) of their R groups.
� Amino acids vary in their acid-base properties and have characteristic titration curves. Monoamino monocarboxylic amino acids (with nonionizable R groups) are diprotic acids (1H3NCH(R)COOH) at low pH and exist in several different ionic forms as the pH is increased. Amino acids with ionizable R groups have additional ionic species, depending on the pH of the medium and the pKa of the R group.
3.2 Peptides and ProteinsWe now turn to polymers of amino acids, the peptides and proteins. Biologically occurring polypeptides range in size from small to very large, consisting of two or three to thousands of linked amino acid residues. Our focus is on the fundamental chemical properties of these polymers.
Peptides Are Chains of Amino AcidsTwo amino acid molecules can be covalently joined through a substituted amide linkage, termed a peptide
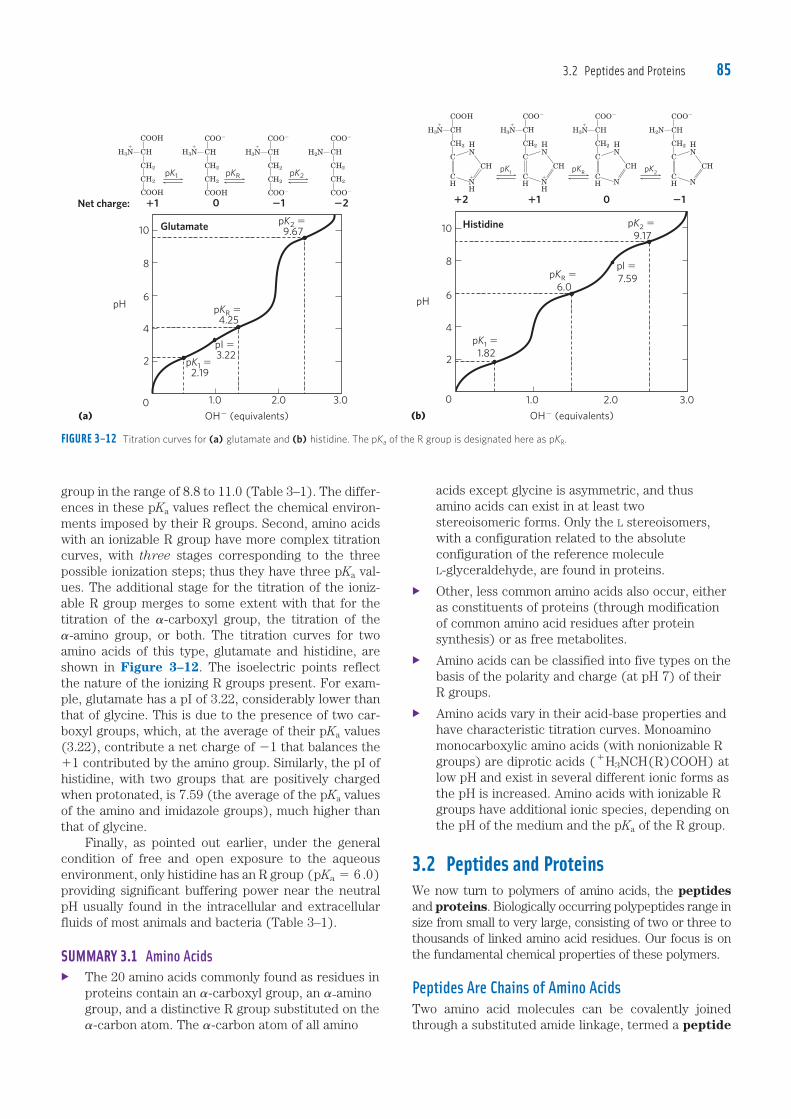
group in the range of 8.8 to 11.0 (Table 3–1). The differ-ences in these pKa values reflect the chemical environ-ments imposed by their R groups. Second, amino acids with an ionizable R group have more complex titration curves, with three stages corresponding to the three possible ionization steps; thus they have three pKa val-ues. The additional stage for the titration of the ioniz-able R group merges to some extent with that for the titration of the �-carboxyl group, the titration of the �-amino group, or both. The titration curves for two amino acids of this type, glutamate and histidine, are shown in Figure 3–12. The isoelectric points reflect the nature of the ionizing R groups present. For exam-ple, glutamate has a pI of 3.22, considerably lower than that of glycine. This is due to the presence of two car-boxyl groups, which, at the average of their pKa values (3.22), contribute a net charge of 21 that balances the 11 contributed by the amino group. Similarly, the pI of histidine, with two groups that are positively charged when protonated, is 7.59 (the average of the pKa values of the amino and imidazole groups), much higher than that of glycine. Finally, as pointed out earlier, under the general condition of free and open exposure to the aqueous environment, only histidine has an R group (pKa 5 6 .0) providing significant buffering power near the neutral pH usually found in the intracellular and extracellular fluids of most animals and bacteria (Table 3–1).
SUMMARY 3.1 Amino Acids� The 20 amino acids commonly found as residues in
proteins contain an �-carboxyl group, an �-amino group, and a distinctive R group substituted on the �-carbon atom. The �-carbon atom of all amino
FIGURE 3–12 Titration curves for (a) glutamate and (b) histidine. The pKa of the R group is designated here as pKR.
H3N�
N�
N�
C
COOH
C
C
COOH
H2
H2
H
pK1 pK2pKR
H3 C
COO�
C
C
COOH
H2
H2
H H3 C
COO�
C
C
COO�
H2
H2
H H2N C
COO�
C
C
COO�
H2
H2
H
Net charge: �1 0 �1 �2
10
8
6
4
2
0
Glutamate pK2 � 9.67
pKR � 4.25
pI � 3.22
pK1 � 2.19
1.0 2.0 3.0
pH
OH� (equivalents)(a)
H3N�
C
COOH
CH2
H H3N�
C
COO�
CH2
H H3N�
C
COO�
CH2
H H2N C
CH2
H
pK2 �
9.17
pl �
7.59pKR �
6.0
pK1 �
1.82
10
8
6
4
2
0 1.0 2.0 3.0
pH
OH� (equivalents)(b)
COO�
Histidine
pK1
pKR
pK2
�2 �1 0 �1
C
HN
CHCH N
�
H
C
HN
CHCH N
�
H
C
HN
CHCH N
C
HN
CHCH N
c03AminoAcidsPeptidesAndProteins.indd Page 85 11/08/12 12:47 PM user-F408 /Users/user-F408/Desktop
Amino Acids, Peptides, and Proteins86
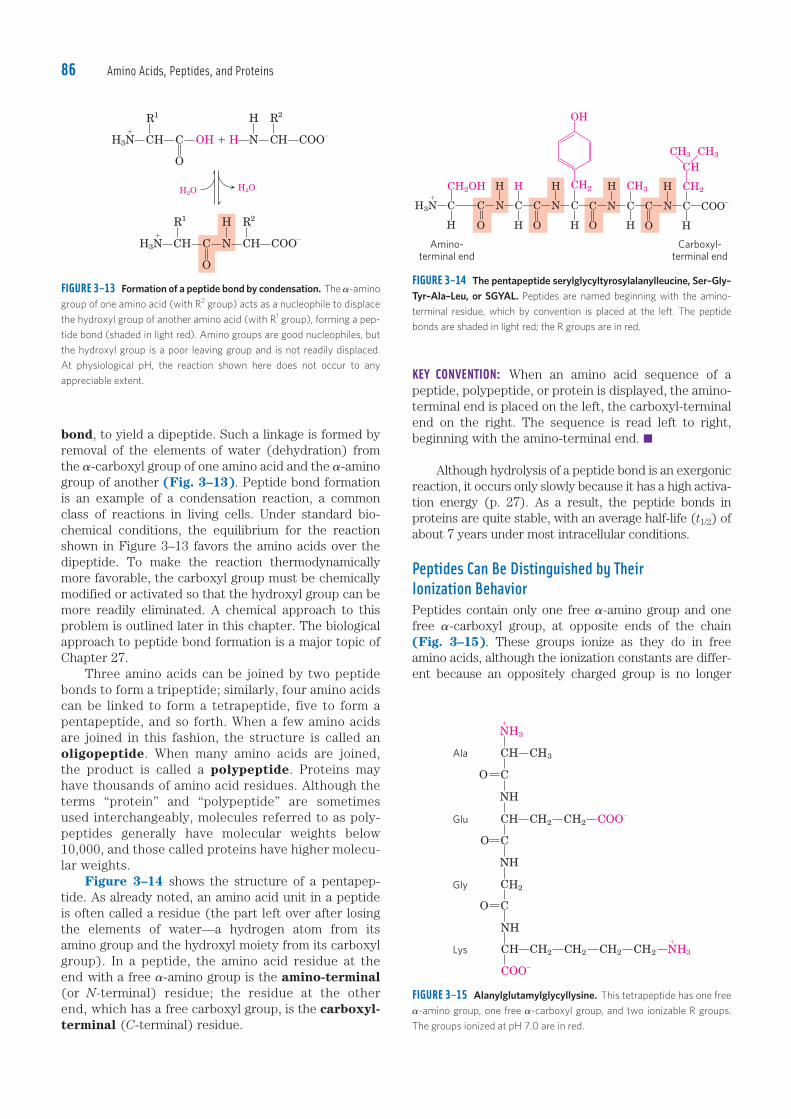
KEY CONVENTION: When an amino acid sequence of a peptide, polypeptide, or protein is displayed, the amino-terminal end is placed on the left, the carboxyl-terminal end on the right. The sequence is read left to right, beginning with the amino-terminal end. ■
Although hydrolysis of a peptide bond is an exergonic reaction, it occurs only slowly because it has a high activa-tion energy (p. 27). As a result, the peptide bonds in proteins are quite stable, with an average half-life (t1/2) of about 7 years under most intracellular conditions.
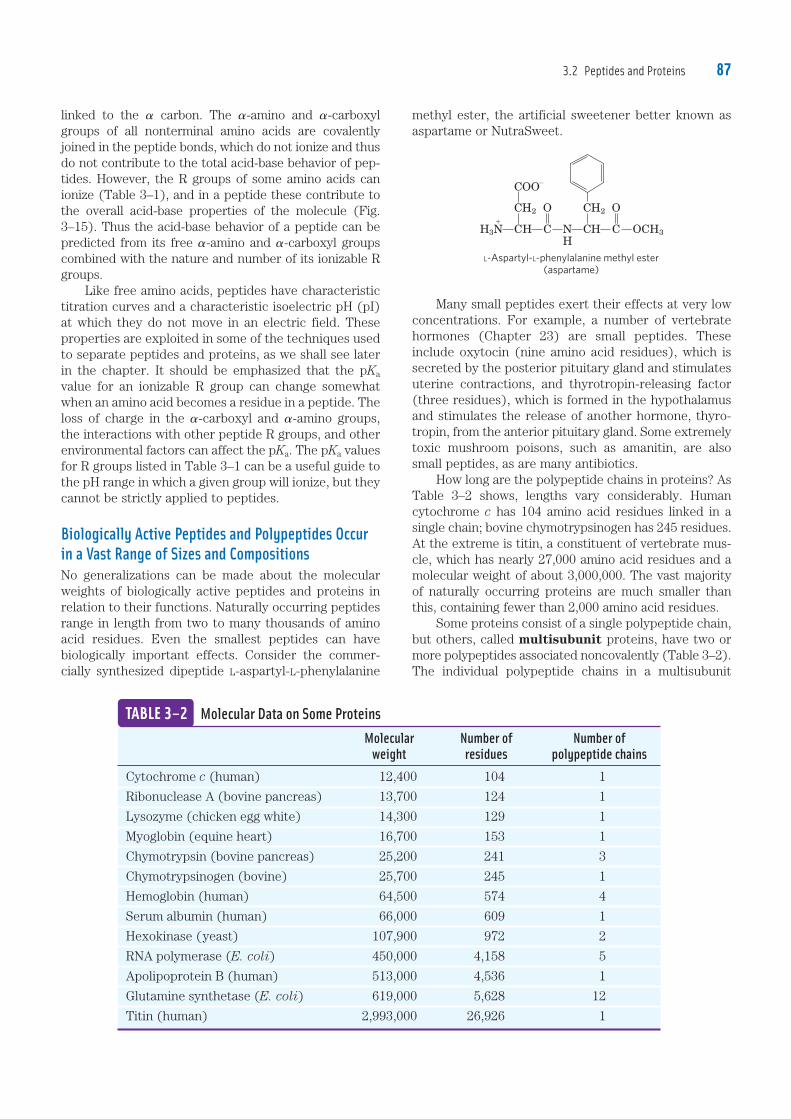
Peptides Can Be Distinguished by Their Ionization BehaviorPeptides contain only one free �-amino group and one free �-carboxyl group, at opposite ends of the chain (Fig. 3–15). These groups ionize as they do in free amino acids, although the ionization constants are differ-ent because an oppositely charged group is no longer
bond, to yield a dipeptide. Such a linkage is formed by removal of the elements of water (dehydration) from the �-carboxyl group of one amino acid and the �-amino group of another (Fig. 3–13). Peptide bond formation is an example of a condensation reaction, a common class of reactions in living cells. Under standard bio-chemical conditions, the equilibrium for the reaction shown in Figure 3–13 favors the amino acids over the dipeptide. To make the reaction thermodynamically more favorable, the carboxyl group must be chemically modified or activated so that the hydroxyl group can be more readily eliminated. A chemical approach to this problem is outlined later in this chapter. The biological approach to peptide bond formation is a major topic of Chapter 27. Three amino acids can be joined by two peptide bonds to form a tripeptide; similarly, four amino acids can be linked to form a tetrapeptide, five to form a pentapeptide, and so forth. When a few amino acids are joined in this fashion, the structure is called an oligopeptide. When many amino acids are joined, the product is called a polypeptide. Proteins may have thousands of amino acid residues. Although the terms “protein” and “polypeptide” are sometimes used interchangeably, molecules referred to as poly-peptides generally have molecular weights below 10,000, and those called proteins have higher molecu-lar weights. Figure 3–14 shows the structure of a pentapep-tide. As already noted, an amino acid unit in a peptide is often called a residue (the part left over after losing the elements of water—a hydrogen atom from its amino group and the hydroxyl moiety from its carboxyl group). In a peptide, the amino acid residue at the end with a free �-amino group is the amino-terminal (or N-terminal) residue; the residue at the other end, which has a free carboxyl group, is the carboxyl-terminal (C-terminal) residue.
FIGURE 3–13 Formation of a peptide bond by condensation. The �-amino
group of one amino acid (with R2 group) acts as a nucleophile to displace
the hydroxyl group of another amino acid (with R1 group), forming a pep-
tide bond (shaded in light red). Amino groups are good nucleophiles, but
the hydroxyl group is a poor leaving group and is not readily displaced.
At physiological pH, the reaction shown here does not occur to any
appreciable extent.
H3N�
C
R1
H C
O
OH � H N
H
C
R2
H COO�
H2OH2O
H3N�
C
R1
H C
O
N
H
C
R2
H COO�
FIGURE 3–14 The pentapeptide serylglycyltyrosylalanylleucine, Ser–Gly–Tyr–Ala–Leu, or SGYAL. Peptides are named beginning with the amino-
terminal residue, which by convention is placed at the left. The peptide
bonds are shaded in light red; the R groups are in red.
H3N�
C
CH2OH
H
C
O
N
H
C
H
H
C
O
N
H
C
CH2
H
C
O
N
H
C
CH3
H
C
OH
N
H
C
C
CCH3 CH3
H
H2
COO�
Amino-
terminal end
Carboxyl-
terminal end
O H
FIGURE 3–15 Alanylglutamylglycyllysine. This tetrapeptide has one free
�-amino group, one free �-carboxyl group, and two ionizable R groups.
The groups ionized at pH 7.0 are in red.
Ala
C
COO�
NH
O C
C
NH
O C
C
NH
O C
C
N�
H3
H CH3
H CH2 CH2 COO�
H2
H CH2 CH2 CH2 CH2 N�
H3Lys
Gly
Glu
c03AminoAcidsPeptidesAndProteins.indd Page 86 11/08/12 12:47 PM user-F408 /Users/user-F408/Desktop
3.2 Peptides and Proteins 87
methyl ester, the artificial sweetener better known as aspartame or NutraSweet.
H3N�
C
C
COO�
H2
H C
O
NH
C
CH2
H C
O
OCH3
L-Aspartyl-L-phenylalanine methyl ester
(aspartame)
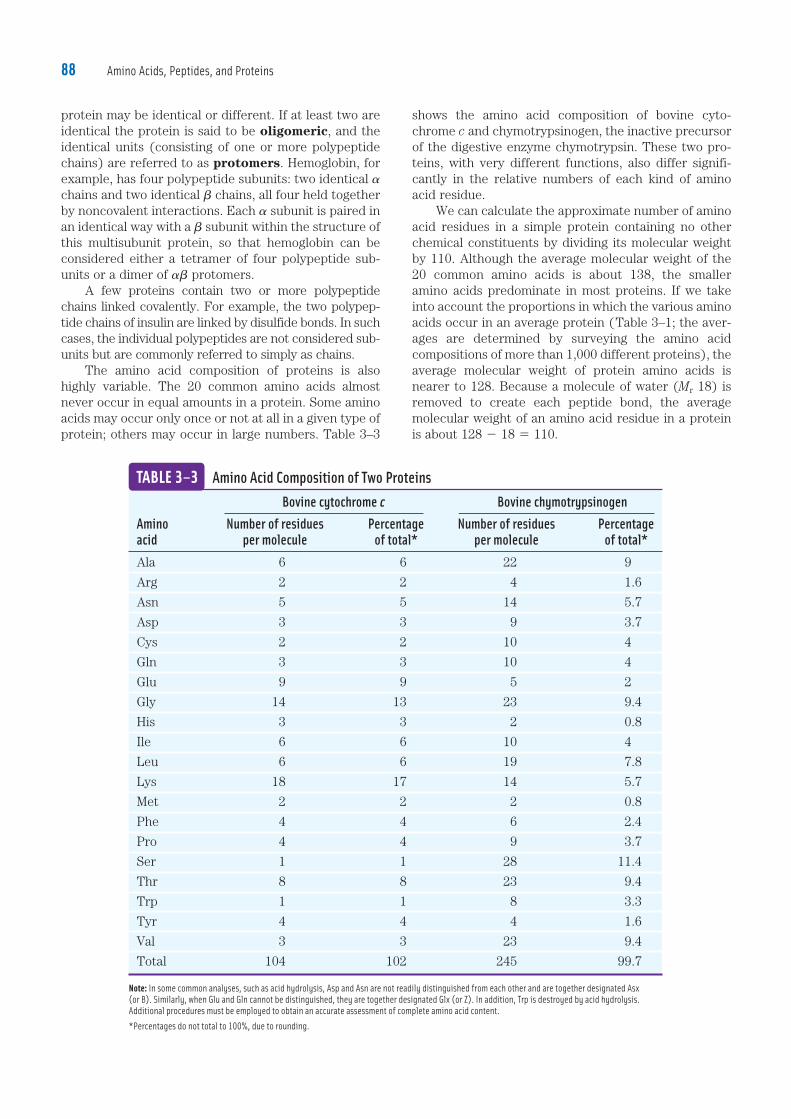
Many small peptides exert their effects at very low concentrations. For example, a number of vertebrate hormones (Chapter 23) are small peptides. These include oxytocin (nine amino acid residues), which is secreted by the posterior pituitary gland and stimulates uterine contractions, and thyrotropin-releasing factor (three residues), which is formed in the hypothalamus and stimulates the release of another hormone, thyro-tropin, from the anterior pituitary gland. Some extremely toxic mushroom poisons, such as amanitin, are also small peptides, as are many antibiotics. How long are the polypeptide chains in proteins? As Table 3–2 shows, lengths vary considerably. Human cytochrome c has 104 amino acid residues linked in a single chain; bovine chymotrypsinogen has 245 residues. At the extreme is titin, a constituent of vertebrate mus-cle, which has nearly 27,000 amino acid residues and a molecular weight of about 3,000,000. The vast majority of naturally occurring proteins are much smaller than this, containing fewer than 2,000 amino acid residues. Some proteins consist of a single polypeptide chain, but others, called multisubunit proteins, have two or more polypeptides associated noncovalently (Table 3–2). The individual polypeptide chains in a multisubunit
linked to the � carbon. The �-amino and �-carboxyl groups of all nonterminal amino acids are covalently joined in the peptide bonds, which do not ionize and thus do not contribute to the total acid-base behavior of pep-tides. However, the R groups of some amino acids can ionize (Table 3–1), and in a peptide these contribute to the overall acid-base properties of the molecule (Fig. 3–15). Thus the acid-base behavior of a peptide can be predicted from its free �-amino and �-carboxyl groups combined with the nature and number of its ionizable R groups. Like free amino acids, peptides have characteristic titration curves and a characteristic isoelectric pH (pI) at which they do not move in an electric field. These properties are exploited in some of the techniques used to separate peptides and proteins, as we shall see later in the chapter. It should be emphasized that the pKa value for an ionizable R group can change somewhat when an amino acid becomes a residue in a peptide. The loss of charge in the �-carboxyl and �-amino groups, the interactions with other peptide R groups, and other environmental factors can affect the pKa. The pKa values for R groups listed in Table 3–1 can be a useful guide to the pH range in which a given group will ionize, but they cannot be strictly applied to peptides.
Biologically Active Peptides and Polypeptides Occur in a Vast Range of Sizes and CompositionsNo generalizations can be made about the molecular weights of biologically active peptides and proteins in relation to their functions. Naturally occurring peptides range in length from two to many thousands of amino acid residues. Even the smallest peptides can have biologically important effects. Consider the commer-cially synthesized dipeptide L-aspartyl-L-phenylalanine
Molecular Number of Number of weight residues polypeptide chainsCytochrome c (human) 12,400 104 1
Ribonuclease A (bovine pancreas) 13,700 124 1
Lysozyme (chicken egg white) 14,300 129 1
Myoglobin (equine heart) 16,700 153 1
Chymotrypsin (bovine pancreas) 25,200 241 3
Chymotrypsinogen (bovine) 25,700 245 1
Hemoglobin (human) 64,500 574 4
Serum albumin (human) 66,000 609 1
Hexokinase (yeast) 107,900 972 2
RNA polymerase (E. coli) 450,000 4,158 5
Apolipoprotein B (human) 513,000 4,536 1
Glutamine synthetase (E. coli) 619,000 5,628 12
Titin (human) 2,993,000 26,926 1
TABLE 3–2 Molecular Data on Some Proteins
c03AminoAcidsPeptidesAndProteins.indd Page 87 11/08/12 12:47 PM user-F408 /Users/user-F408/Desktop
Amino Acids, Peptides, and Proteins88
shows the amino acid composition of bovine cyto-chrome c and chymotrypsinogen, the inactive precursor of the digestive enzyme chymotrypsin. These two pro-teins, with very different functions, also differ signifi-cantly in the relative numbers of each kind of amino acid residue. We can calculate the approximate number of amino acid residues in a simple protein containing no other chemical constituents by dividing its molecular weight by 110. Although the average molecular weight of the 20 common amino acids is about 138, the smaller amino acids predominate in most proteins. If we take into account the proportions in which the various amino acids occur in an average protein (Table 3–1; the aver-ages are determined by surveying the amino acid compositions of more than 1,000 different proteins), the average molecular weight of protein amino acids is nearer to 128. Because a molecule of water (Mr 18) is removed to create each peptide bond, the average molecular weight of an amino acid residue in a protein is about 128 2 18 5 110.
protein may be identical or different. If at least two are identical the protein is said to be oligomeric, and the identical units (consisting of one or more polypeptide chains) are referred to as protomers. Hemoglobin, for example, has four polypeptide subunits: two identical � chains and two identical � chains, all four held together by noncovalent interactions. Each � subunit is paired in an identical way with a � subunit within the structure of this multisubunit protein, so that hemoglobin can be considered either a tetramer of four polypeptide sub-units or a dimer of �� protomers. A few proteins contain two or more polypeptide chains linked covalently. For example, the two polypep-tide chains of insulin are linked by disulfide bonds. In such cases, the individual polypeptides are not considered sub-units but are commonly referred to simply as chains. The amino acid composition of proteins is also highly variable. The 20 common amino acids almost never occur in equal amounts in a protein. Some amino acids may occur only once or not at all in a given type of protein; others may occur in large numbers. Table 3–3
Bovine cytochrome c Bovine chymotrypsinogenAmino Number of residues Percentage Number of residues Percentage acid per molecule of total* per molecule of total*Ala 6 6 22 9
Arg 2 2 4 1.6
Asn 5 5 14 5.7
Asp 3 3 9 3.7
Cys 2 2 10 4
Gln 3 3 10 4
Glu 9 9 5 2
Gly 14 13 23 9.4
His 3 3 2 0.8
Ile 6 6 10 4
Leu 6 6 19 7.8
Lys 18 17 14 5.7
Met 2 2 2 0.8
Phe 4 4 6 2.4
Pro 4 4 9 3.7
Ser 1 1 28 11.4
Thr 8 8 23 9.4
Trp 1 1 8 3.3
Tyr 4 4 4 1.6
Val 3 3 23 9.4
Total 104 102 245 99.7
Note: In some common analyses, such as acid hydrolysis, Asp and Asn are not readily distinguished from each other and are together designated Asx
(or B). Similarly, when Glu and Gln cannot be distinguished, they are together designated Glx (or Z). In addition, Trp is destroyed by acid hydrolysis.
Additional procedures must be employed to obtain an accurate assessment of complete amino acid content.
*Percentages do not total to 100%, due to rounding.
TABLE 3–3 Amino Acid Composition of Two Proteins
c03AminoAcidsPeptidesAndProteins.indd Page 88 11/08/12 12:47 PM user-F408 /Users/user-F408/Desktop
3.3 Working with Proteins 89
researcher must be able to separate it from other pro-teins in pure form and must have the techniques to determine its properties. The necessary methods come from protein chemistry, a discipline as old as biochem-istry itself and one that retains a central position in biochemical research.
Proteins Can Be Separated and PurifiedA pure preparation is essential before a protein’s proper-ties and activities can be determined. Given that cells contain thousands of different kinds of proteins, how can one protein be purified? Classical methods for separat-ing proteins take advantage of properties that vary from one protein to the next, including size, charge, and bind-ing properties. These have been supplemented in recent decades by methods involving DNA cloning and genome sequencing that can simplify the process of protein puri-fication. The newer methods, presented in Chapter 9, often artificially modify the protein being purified, add-ing a few or many amino acid residues to one or both ends. Convenience thus comes at the price of potentially altering the activity of the purified protein. The purifica-tion of proteins in their native state (the form in which they function in the cell) usually relies on methods described here. The source of a protein is generally tissue or microbial cells. The first step in any protein purification procedure is to break open these cells, releasing their proteins into a solution called a crude extract. If necessary, differential centrifugation can be used to prepare subcellular fractions or to isolate specific organelles (see Fig. 1–8). Once the extract or organelle preparation is ready, various methods are available for purifying one or more of the proteins it contains. Commonly, the extract is subjected to treatments that separate the proteins into different fractions based on a property such as size or charge, a process referred to as fractionation. Early fractionation steps in a purification utilize differ-ences in protein solubility, which is a complex function of pH, temperature, salt concentration, and other factors.
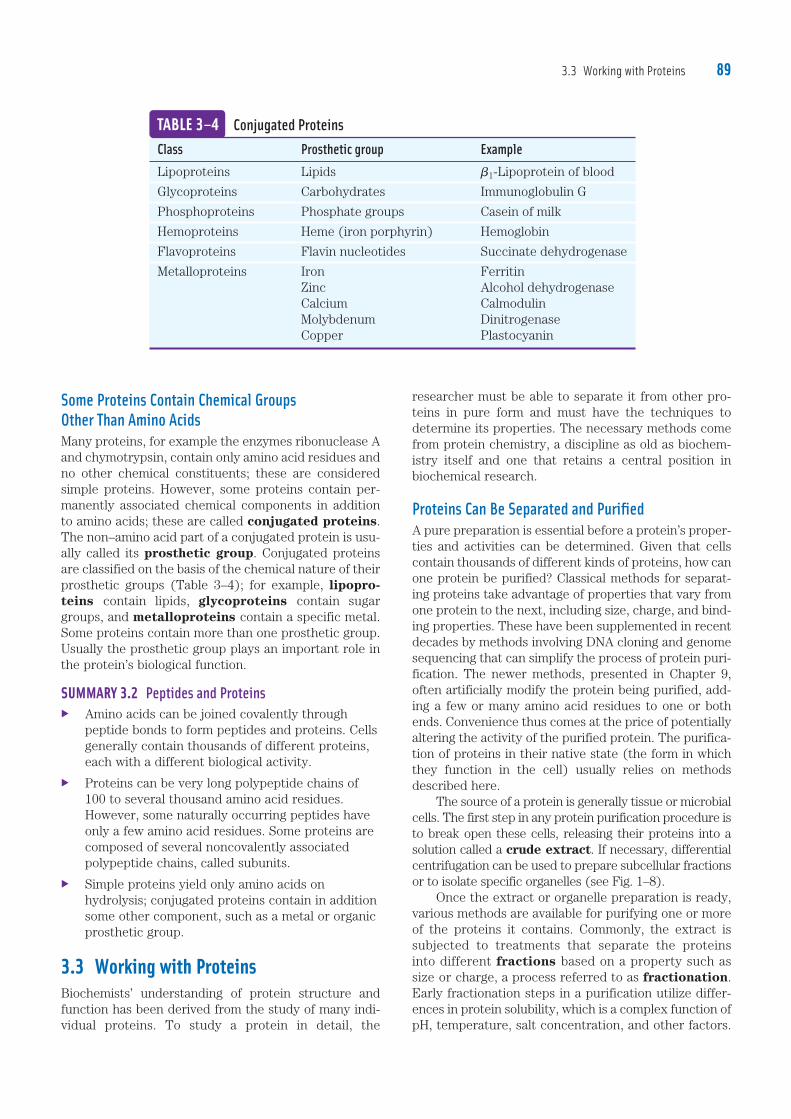
Some Proteins Contain Chemical Groups Other Than Amino AcidsMany proteins, for example the enzymes ribonuclease A and chymotrypsin, contain only amino acid residues and no other chemical constituents; these are considered simple proteins. However, some proteins contain per-manently associated chemical components in addition to amino acids; these are called conjugated proteins. The non–amino acid part of a conjugated protein is usu-ally called its prosthetic group. Conjugated proteins are classified on the basis of the chemical nature of their prosthetic groups (Table 3–4); for example, lipopro-teins contain lipids, glycoproteins contain sugar groups, and metalloproteins contain a specific metal. Some proteins contain more than one prosthetic group. Usually the prosthetic group plays an important role in the protein’s biological function.
SUMMARY 3.2 Peptides and Proteins� Amino acids can be joined covalently through
peptide bonds to form peptides and proteins. Cells generally contain thousands of different proteins, each with a different biological activity.
� Proteins can be very long polypeptide chains of 100 to several thousand amino acid residues. However, some naturally occurring peptides have only a few amino acid residues. Some proteins are composed of several noncovalently associated polypeptide chains, called subunits.
� Simple proteins yield only amino acids on hydrolysis; conjugated proteins contain in addition some other component, such as a metal or organic prosthetic group.
3.3 Working with ProteinsBiochemists’ understanding of protein structure and function has been derived from the study of many indi-vidual proteins. To study a protein in detail, the
Class Prosthetic group ExampleLipoproteins Lipids �1-Lipoprotein of blood
Glycoproteins Carbohydrates Immunoglobulin G
Phosphoproteins Phosphate groups Casein of milk
Hemoproteins Heme (iron porphyrin) Hemoglobin
Flavoproteins Flavin nucleotides Succinate dehydrogenase
Metalloproteins Iron Ferritin Zinc Alcohol dehydrogenase Calcium Calmodulin Molybdenum Dinitrogenase Copper Plastocyanin
TABLE 3–4 Conjugated Proteins
c03AminoAcidsPeptidesAndProteins.indd Page 89 11/08/12 12:47 PM user-F408 /Users/user-F408/Desktop
Amino Acids, Peptides, and Proteins90
caused both by separation of proteins with different prop-erties and by diffusional spreading. As the length of the column increases, the resolution of two types of protein with different net charges generally improves. However, the rate at which the protein solution can flow through
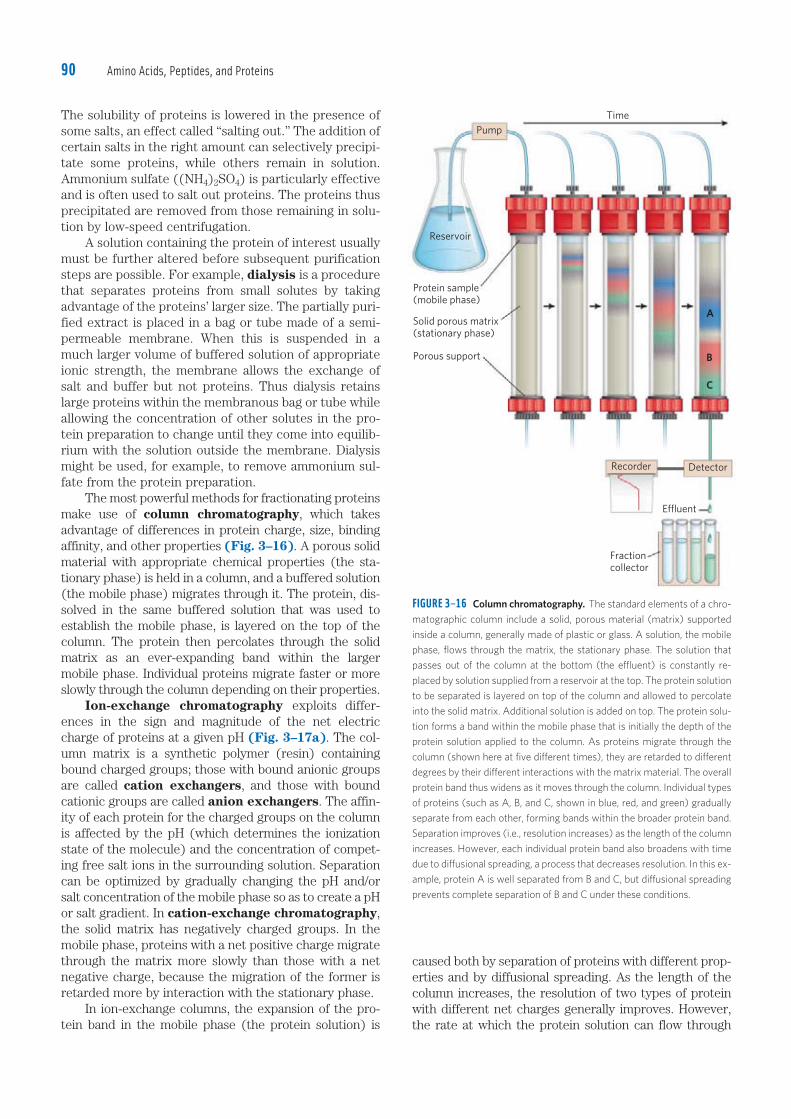
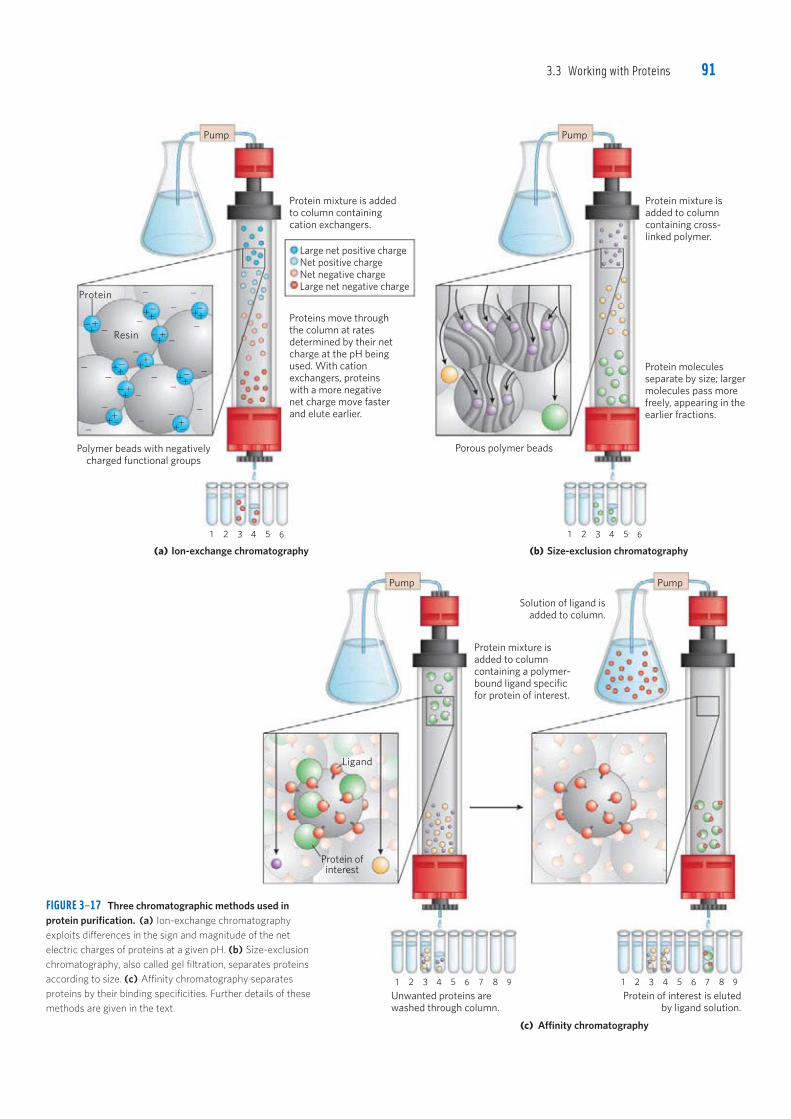
The solubility of proteins is lowered in the presence of some salts, an effect called “salting out.” The addition of certain salts in the right amount can selectively precipi-tate some proteins, while others remain in solution. Ammonium sulfate ((NH4)2SO4) is particularly effective and is often used to salt out proteins. The proteins thus precipitated are removed from those remaining in solu-tion by low-speed centrifugation. A solution containing the protein of interest usually must be further altered before subsequent purification steps are possible. For example, dialysis is a procedure that separates proteins from small solutes by taking advantage of the proteins’ larger size. The partially puri-fied extract is placed in a bag or tube made of a semi-permeable membrane. When this is suspended in a much larger volume of buffered solution of appropriate ionic strength, the membrane allows the exchange of salt and buffer but not proteins. Thus dialysis retains large proteins within the membranous bag or tube while allowing the concentration of other solutes in the pro-tein preparation to change until they come into equilib-rium with the solution outside the membrane. Dialysis might be used, for example, to remove ammonium sul-fate from the protein preparation. The most powerful methods for fractionating proteins make use of column chromatography, which takes advantage of differences in protein charge, size, binding affinity, and other properties (Fig. 3–16). A porous solid material with appropriate chemical properties (the sta-tionary phase) is held in a column, and a buffered solution (the mobile phase) migrates through it. The protein, dis-solved in the same buffered solution that was used to establish the mobile phase, is layered on the top of the column. The protein then percolates through the solid matrix as an ever-expanding band within the larger mobile phase. Individual proteins migrate faster or more slowly through the column depending on their properties. Ion-exchange chromatography exploits differ-ences in the sign and magnitude of the net electric charge of proteins at a given pH (Fig. 3–17a). The col-umn matrix is a synthetic polymer (resin) containing bound charged groups; those with bound anionic groups are called cation exchangers, and those with bound cationic groups are called anion exchangers. The affin-ity of each protein for the charged groups on the column is affected by the pH (which determines the ionization state of the molecule) and the concentration of compet-ing free salt ions in the surrounding solution. Separation can be optimized by gradually changing the pH and/or salt concentration of the mobile phase so as to create a pH or salt gradient. In cation-exchange chromatography, the solid matrix has negatively charged groups. In the mobile phase, proteins with a net positive charge migrate through the matrix more slowly than those with a net negative charge, because the migration of the former is retarded more by interaction with the stationary phase. In ion-exchange columns, the expansion of the pro-tein band in the mobile phase (the protein solution) is
FIGURE 3–16 Column chromatography. The standard elements of a chro-
matographic column include a solid, porous material (matrix) supported
inside a column, generally made of plastic or glass. A solution, the mobile
phase, flows through the matrix, the stationary phase. The solution that
passes out of the column at the bottom (the effluent) is constantly re-
placed by solution supplied from a reservoir at the top. The protein solution
to be separated is layered on top of the column and allowed to percolate
into the solid matrix. Additional solution is added on top. The protein solu-
tion forms a band within the mobile phase that is initially the depth of the
protein solution applied to the column. As proteins migrate through the
column (shown here at five different times), they are retarded to different
degrees by their different interactions with the matrix material. The overall
protein band thus widens as it moves through the column. Individual types
of proteins (such as A, B, and C, shown in blue, red, and green) gradually
separate from each other, forming bands within the broader protein band.
Separation improves (i.e., resolution increases) as the length of the column
increases. However, each individual protein band also broadens with time
due to diffusional spreading, a process that decreases resolution. In this ex-
ample, protein A is well separated from B and C, but diffusional spreading
prevents complete separation of B and C under these conditions.
c03AminoAcidsPeptidesAndProteins.indd Page 90 11/08/12 12:47 PM user-F408 /Users/user-F408/Desktop
Solid porous matrix
(stationary phase)
Pump
Recorder
Porous support
Reservoir
Protein sample
(mobile phase)
A
B
C
Effluent
Time
Fraction
collector
Detector
3.3 Working with Proteins 91
FIGURE 3–17 Three chromatographic methods used in protein purification. (a) Ion-exchange chromatography exploits differences in the sign and magnitude of the net electric charges of proteins at a given pH. (b) Size-exclusion chromatography, also called gel filtration, separates proteins according to size. (c) Affinity chromatography separates proteins by their binding specificities. Further details of these methods are given in the text.
c03AminoAcidsPeptidesAndProteins.indd Page 91 11/08/12 12:47 PM user-F408 /Users/user-F408/Desktop
��
��
�
�
�
�
��
��
��
�
��
�
�
�
��
��
�
�
�
�
�
�
�
��
��
��
��
�
��
�
�
��
�
�
�
Pump
Nelson/Cox
Lehninger Biochemistry, 6e
ISBN13: 1-4292-3414-8
Figure #3.17
Permanent figure # 319
1st pass
Polymer beads with negatively
charged functional groups
Protein mixture is added
to column containing
cation exchangers.
Protein mixture is
added to column
containing cross-
linked polymer.
1 2 3 4 5 6
Proteins move through
the column at rates
determined by their net
charge at the pH being
used. With cation
exchangers, proteins
with a more negative
net charge move faster
and elute earlier.
Protein molecules
separate by size; larger
molecules pass more
freely, appearing in the
earlier fractions.
Porous polymer beads
(c) Affinity chromatography
Protein of interest is eluted
by ligand solution.
Protein mixture is
added to column
containing a polymer-
bound ligand specific
for protein of interest.
Solution of ligand is
added to column.
(a) Ion-exchange chromatography (b) Size-exclusion chromatography
Pump
1 2 3 4 5 6
Pump
4 5 6 7 8 98 9
Unwanted proteins are
washed through column.
Pump
1 2 3 4 5 6 7 1 2 3
Protein ofinterest
Ligand
Large net positive charge
Net positive charge
Net negative charge
Large net negative charge
Resin
Protein
Amino Acids, Peptides, and Proteins92
ecule that resembles ATP to the beads in the column creates an affinity matrix that can help purify the pro-tein. As the protein solution moves through the column, ATP-binding proteins (including the protein of interest) bind to the matrix. After proteins that do not bind are washed through the column, the bound protein is eluted by a solution containing either a high concentration of salt or free ligand—in this case, ATP or an analog of ATP. Salt weakens the binding of the protein to the immobilized ligand, interfering with ionic interactions. Free ligand competes with the ligand attached to the beads, releasing the protein from the matrix; the protein product that elutes from the column is often bound to the ligand used to elute it. Chromatographic methods are typically enhanced by the use of HPLC, or high-performance liquid chromatography. HPLC makes use of high-pressure pumps that speed the movement of the protein mole-cules down the column, as well as higher-quality chro-matographic materials that can withstand the crushing force of the pressurized flow. By reducing the transit time on the column, HPLC can limit diffusional spread-ing of protein bands and thus greatly improve resolution. The approach to purification of a protein that has not previously been isolated is guided both by established precedents and by common sense. In most cases, several different methods must be used sequentially to purify a protein completely, each method separating proteins on the basis of different properties. For example, if one step separates ATP-binding proteins from those that do not bind ATP, then the next step must separate the various ATP-binding proteins on the basis of size or charge to isolate the particular protein that is wanted. The choice of methods is somewhat empirical, and many strategies may be tried before the most effective one is found. Trial and error can often be minimized by basing the new pro-cedure on purification techniques developed for similar proteins. Published purification protocols are available for many thousands of proteins. Common sense dictates that inexpensive procedures such as salting out be used first, when the total volume and the number of contami-nants are greatest. Chromatographic methods are often impractical at early stages, because the amount of chro-matographic medium needed increases with sample size. As each purification step is completed, the sample size generally becomes smaller (Table 3–5), making it feasible to use more sophisticated (and expensive) chromato-graphic procedures at later stages.
Proteins Can Be Separated and Characterized by ElectrophoresisAnother important technique for the separation of pro-teins is based on the migration of charged proteins in an electric field, a process called electrophoresis. These procedures are not generally used to purify proteins, because simpler alternatives are usually available and electrophoretic methods often adversely affect the
WORKED EXAMPLE 3–1 Ion Exchange of PeptidesA biochemist wants to separate two peptides by ion-exchange chromatography. At the pH of the mobile phase to be used on the column, one peptide (A) has a net charge of 23, due to the presence of more Glu and Asp residues than Arg, Lys, and His residues. Peptide B has a net charge of 11. Which peptide would elute first from a cation-exchange resin? Which would elute first from an anion-exchange resin?
Solution: A cation-exchange resin has negative charges and binds positively charged molecules, retarding their progress through the column. Peptide B, with its net positive charge, will interact more strongly than peptide A with the cation-exchange resin, and thus peptide A will elute first. On the anion-exchange resin, peptide B will elute first. Peptide A, being negatively charged, will be retarded by its interaction with the positively charged resin.
the column usually decreases with column length. And as the length of time spent on the column increases, the resolution can decline as a result of diffusional spreading within each protein band. As the protein-containing solu-tion exits a column, successive portions (fractions) of this effluent are collected in test tubes. Each fraction can be tested for the presence of the protein of interest as well as other properties, such as ionic strength or total protein concentration. All fractions positive for the protein of interest can be combined as the product of this chromato-graphic step of the protein purification.
Figure 3–17 shows two other variations of column chromatography in addition to ion exchange. Size-exclusion chromatography, also called gel filtration (Fig. 3–17b), separates proteins according to size. In this method, large proteins emerge from the column sooner than small ones—a somewhat counterintuitive result. The solid phase consists of cross-linked polymer beads with engineered pores or cavities of a particular size. Large proteins cannot enter the cavities and so take a shorter (and more rapid) path through the column, around the beads. Small proteins enter the cavities and are slowed by their more labyrinthine path through the column. Size-exclusion chromatography can also be used to approximate the size of a protein being purified, using methods similar to those described in Figure 3–19. Affinity chromatography is based on binding affinity (Fig. 3–17c). The beads in the column have a covalently attached chemical group called a ligand—a group or molecule that binds to a macromolecule such as a protein. When a protein mixture is added to the column, any protein with affinity for this ligand binds to the beads, and its migration through the matrix is retarded. For example, if the biological function of a protein involves binding to ATP, then attaching a mol-
c03AminoAcidsPeptidesAndProteins.indd Page 92 11/08/12 12:47 PM user-F408 /Users/user-F408/Desktop
3.3 Working with Proteins 93
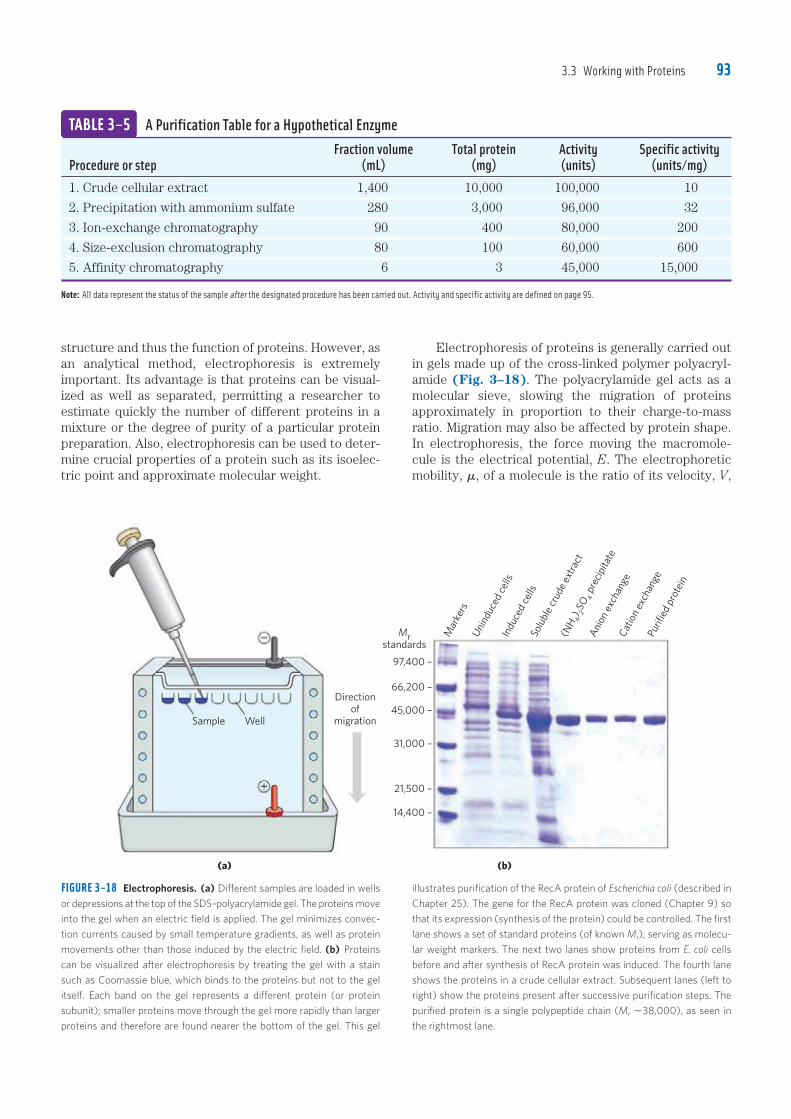
Electrophoresis of proteins is generally carried out in gels made up of the cross-linked polymer polyacryl-amide (Fig. 3–18). The polyacrylamide gel acts as a molecular sieve, slowing the migration of proteins approximately in proportion to their charge-to-mass ratio. Migration may also be affected by protein shape. In electrophoresis, the force moving the macromole-cule is the electrical potential, E. The electrophoretic mobility, �, of a molecule is the ratio of its velocity, V,
structure and thus the function of proteins. However, as an analytical method, electrophoresis is extremely important. Its advantage is that proteins can be visual-ized as well as separated, permitting a researcher to estimate quickly the number of different proteins in a mixture or the degree of purity of a particular protein preparation. Also, electrophoresis can be used to deter-mine crucial properties of a protein such as its isoelec-tric point and approximate molecular weight.
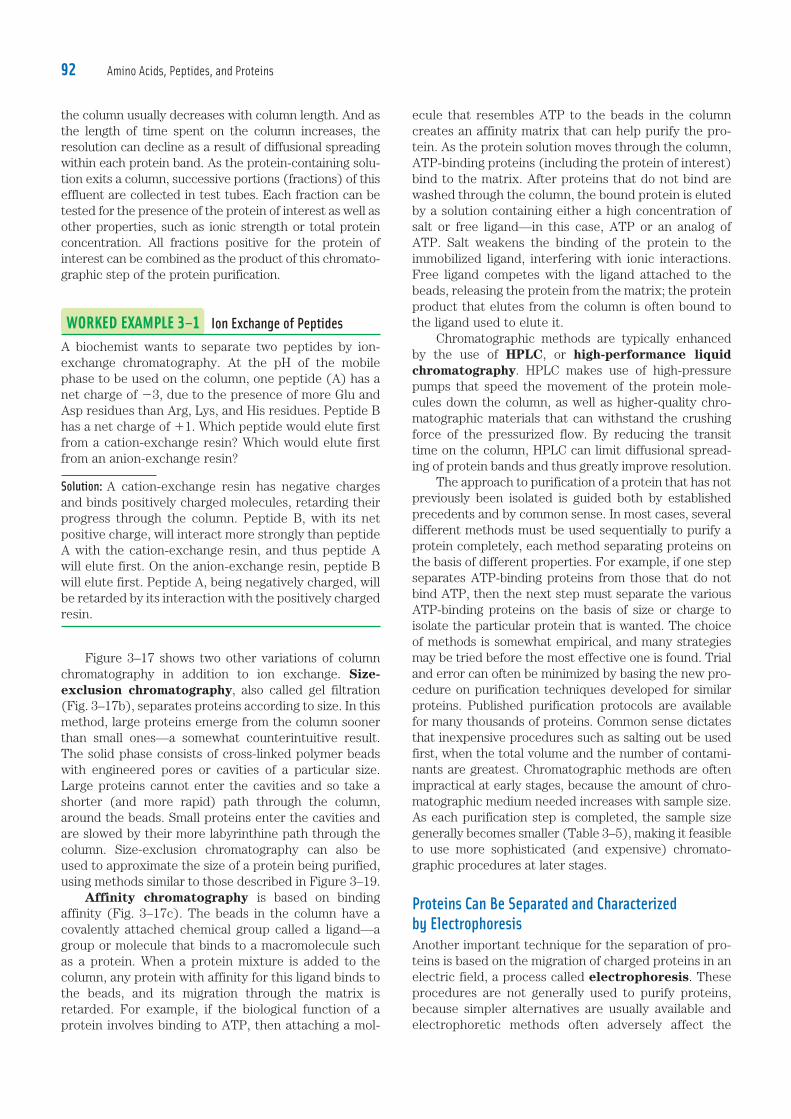
Fraction volume Total protein Activity Specific activityProcedure or step (mL) (mg) (units) (units/mg)1. Crude cellular extract 1,400 10,000 100,000 10
2. Precipitation with ammonium sulfate 280 3,000 96,000 32
3. Ion-exchange chromatography 90 400 80,000 200
4. Size-exclusion chromatography 80 100 60,000 600
5. Affinity chromatography 6 3 45,000 15,000
Note: All data represent the status of the sample after the designated procedure has been carried out. Activity and specific activity are defined on page 95.
TABLE 3–5 A Purification Table for a Hypothetical Enzyme
FIGURE 3–18 Electrophoresis. (a) Different samples are loaded in wells
or depressions at the top of the SDS–polyacrylamide gel. The proteins move
into the gel when an electric field is applied. The gel minimizes convec-
tion currents caused by small temperature gradients, as well as protein
movements other than those induced by the electric field. (b) Proteins
can be visualized after electrophoresis by treating the gel with a stain
such as Coomassie blue, which binds to the proteins but not to the gel
itself. Each band on the gel represents a different protein (or protein
subunit); smaller proteins move through the gel more rapidly than larger
proteins and therefore are found nearer the bottom of the gel. This gel
illustrates purification of the RecA protein of Escherichia coli (described in
Chapter 25). The gene for the RecA protein was cloned (Chapter 9) so
that its expression (synthesis of the protein) could be controlled. The first
lane shows a set of standard proteins (of known Mr), serving as molecu-
lar weight markers. The next two lanes show proteins from E. coli cells
before and after synthesis of RecA protein was induced. The fourth lane
shows the proteins in a crude cellular extract. Subsequent lanes (left to
right) show the proteins present after successive purification steps. The
purified protein is a single polypeptide chain (Mr ,38,000), as seen in
the rightmost lane.
c03AminoAcidsPeptidesAndProteins.indd Page 93 11/08/12 12:47 PM user-F408 /Users/user-F408/Desktop
Well
Direction
of
migration
(a)
Sample
(b)
97,400 –
66,200 –
45,000 –
31,000 –
21,500 –
14,400 –
Mrstandards
Mar
kers
Un
ind
uce
d c
ells
Ind
uce
d c
ells
Solu
ble
cru
de
extr
act
(NH
4) 2
SO4 p
reci
pit
ate
An
ion
exc
han
geC
atio
n e
xch
ange
Pu
rifi
ed p
rote
in
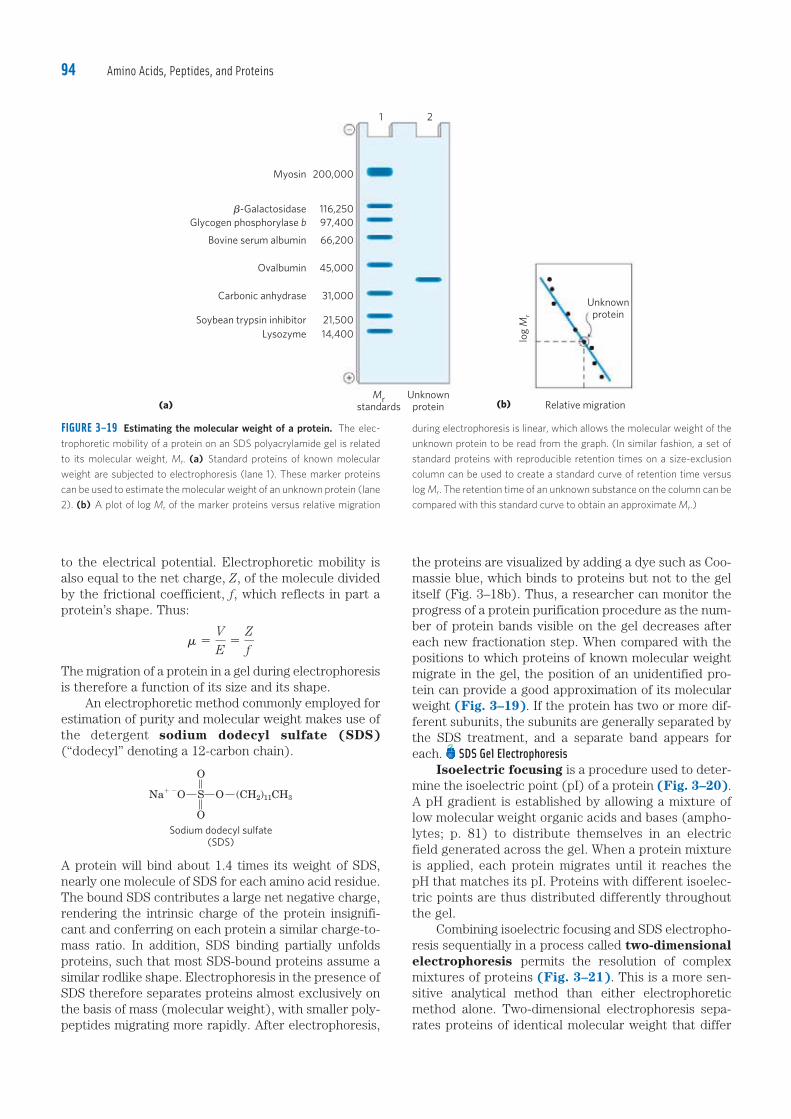
Amino Acids, Peptides, and Proteins94
the proteins are visualized by adding a dye such as Coo-massie blue, which binds to proteins but not to the gel itself (Fig. 3–18b). Thus, a researcher can monitor the progress of a protein purification procedure as the num-ber of protein bands visible on the gel decreases after each new fractionation step. When compared with the positions to which proteins of known molecular weight migrate in the gel, the position of an unidentified pro-tein can provide a good approximation of its molecular weight (Fig. 3–19). If the protein has two or more dif-ferent subunits, the subunits are generally separated by the SDS treatment, and a separate band appears for each. SDS Gel Electrophoresis Isoelectric focusing is a procedure used to deter-mine the isoelectric point (pI) of a protein (Fig. 3–20). A pH gradient is established by allowing a mixture of low molecular weight organic acids and bases (ampho-lytes; p. 81) to distribute themselves in an electric field generated across the gel. When a protein mixture is applied, each protein migrates until it reaches the pH that matches its pI. Proteins with different isoelec-tric points are thus distributed differently throughout the gel. Combining isoelectric focusing and SDS electropho-resis sequentially in a process called two-dimensional electrophoresis permits the resolution of complex mixtures of proteins (Fig. 3–21). This is a more sen-sitive analytical method than either electrophoretic method alone. Two-dimensional electrophoresis sepa-rates proteins of identical molecular weight that differ
FIGURE 3–19 Estimating the molecular weight of a protein. The elec-
trophoretic mobility of a protein on an SDS polyacrylamide gel is related
to its molecular weight, Mr. (a) Standard proteins of known molecular
weight are subjected to electrophoresis (lane 1). These marker proteins
can be used to estimate the molecular weight of an unknown protein (lane
2). (b) A plot of log Mr of the marker proteins versus relative migration
during electrophoresis is linear, which allows the molecular weight of the
unknown protein to be read from the graph. (In similar fashion, a set of
standard proteins with reproducible retention times on a size-exclusion
column can be used to create a standard curve of retention time versus
log Mr. The retention time of an unknown substance on the column can be
compared with this standard curve to obtain an approximate Mr.)
to the electrical potential. Electrophoretic mobility is also equal to the net charge, Z, of the molecule divided by the frictional coefficient, f, which reflects in part a protein’s shape. Thus:
� 5V
E5
Z
f
The migration of a protein in a gel during electrophoresis is therefore a function of its size and its shape. An electrophoretic method commonly employed for estimation of purity and molecular weight makes use of the detergent sodium dodecyl sulfate (SDS) (“dodecyl” denoting a 12-carbon chain).
(CH2)11CH3
O
SNa� �O O
O
Sodium dodecyl sulfate
(SDS)
A protein will bind about 1.4 times its weight of SDS, nearly one molecule of SDS for each amino acid residue. The bound SDS contributes a large net negative charge, rendering the intrinsic charge of the protein insignifi-cant and conferring on each protein a similar charge-to-mass ratio. In addition, SDS binding partially unfolds proteins, such that most SDS-bound proteins assume a similar rodlike shape. Electrophoresis in the presence of SDS therefore separates proteins almost exclusively on the basis of mass (molecular weight), with smaller poly-peptides migrating more rapidly. After electrophoresis,
c03AminoAcidsPeptidesAndProteins.indd Page 94 11/08/12 12:47 PM user-F408 /Users/user-F408/Desktop
200,000
116,250
97,400
66,200
45,000
31,000
21,500
14,400
Mrstandards
Unknown
protein
Myosin
�-Galactosidase
Glycogen phosphorylase b
Bovine serum albumin
Ovalbumin
Carbonic anhydrase
Soybean trypsin inhibitor
Lysozyme
1 2
(a)
log
Mr
Relative migration
Unknown
protein
(b)
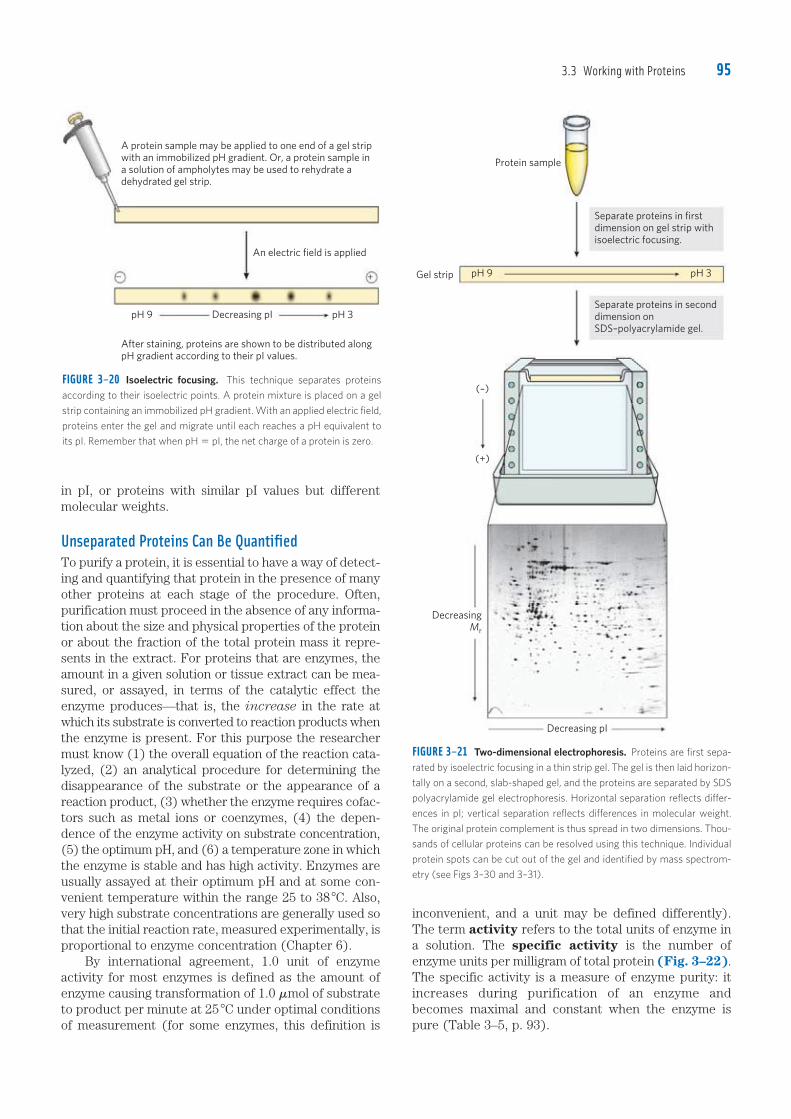
3.3 Working with Proteins 95
in pI, or proteins with similar pI values but different molecular weights.
Unseparated Proteins Can Be QuantifiedTo purify a protein, it is essential to have a way of detect-ing and quantifying that protein in the presence of many other proteins at each stage of the procedure. Often, purification must proceed in the absence of any informa-tion about the size and physical properties of the protein or about the fraction of the total protein mass it repre-sents in the extract. For proteins that are enzymes, the amount in a given solution or tissue extract can be mea-sured, or assayed, in terms of the catalytic effect the enzyme produces—that is, the increase in the rate at which its substrate is converted to reaction products when the enzyme is present. For this purpose the researcher must know (1) the overall equation of the reaction cata-lyzed, (2) an analytical procedure for determining the disappearance of the substrate or the appearance of a reaction product, (3) whether the enzyme requires cofac-tors such as metal ions or coenzymes, (4) the depen-dence of the enzyme activity on substrate concentration, (5) the optimum pH, and (6) a temperature zone in which the enzyme is stable and has high activity. Enzymes are usually assayed at their optimum pH and at some con-venient temperature within the range 25 to 38 8C. Also, very high substrate concentrations are generally used so that the initial reaction rate, measured experimentally, is proportional to enzyme concentration (Chapter 6). By international agreement, 1.0 unit of enzyme activity for most enzymes is defined as the amount of enzyme causing transformation of 1.0 �mol of substrate to product per minute at 25 8C under optimal conditions of measurement (for some enzymes, this definition is
FIGURE 3–20 Isoelectric focusing. This technique separates proteins
according to their isoelectric points. A protein mixture is placed on a gel
strip containing an immobilized pH gradient. With an applied electric field,
proteins enter the gel and migrate until each reaches a pH equivalent to
its pI. Remember that when pH 5 pI, the net charge of a protein is zero.
FIGURE 3–21 Two-dimensional electrophoresis. Proteins are first sepa-
rated by isoelectric focusing in a thin strip gel. The gel is then laid horizon-
tally on a second, slab-shaped gel, and the proteins are separated by SDS
polyacrylamide gel electrophoresis. Horizontal separation reflects differ-
ences in pI; vertical separation reflects differences in molecular weight.
The original protein complement is thus spread in two dimensions. Thou-
sands of cellular proteins can be resolved using this technique. Individual
protein spots can be cut out of the gel and identified by mass spectrom-
etry (see Figs 3–30 and 3–31).
inconvenient, and a unit may be defined differently). The term activity refers to the total units of enzyme in a solution. The specific activity is the number of enzyme units per milligram of total protein (Fig. 3–22). The specific activity is a measure of enzyme purity: it increases during purification of an enzyme and becomes maximal and constant when the enzyme is pure (Table 3–5, p. 93).
c03AminoAcidsPeptidesAndProteins.indd Page 95 11/08/12 12:47 PM user-F408 /Users/user-F408/Desktop
An electric field is applied
pH 9 pH 3Decreasing pI
� +
After staining, proteins are shown to be distributed along
pH gradient according to their pI values.
A protein sample may be applied to one end of a gel strip
with an immobilized pH gradient. Or, a protein sample in
a solution of ampholytes may be used to rehydrate a
dehydrated gel strip.
Protein sample
Gel strip
Decreasing pI
Decreasing
Mr
pH 9
(–)
(+)
pH 3
Separate proteins in first
dimension on gel strip with
isoelectric focusing.
Separate proteins in second
dimension on
SDS–polyacrylamide gel.
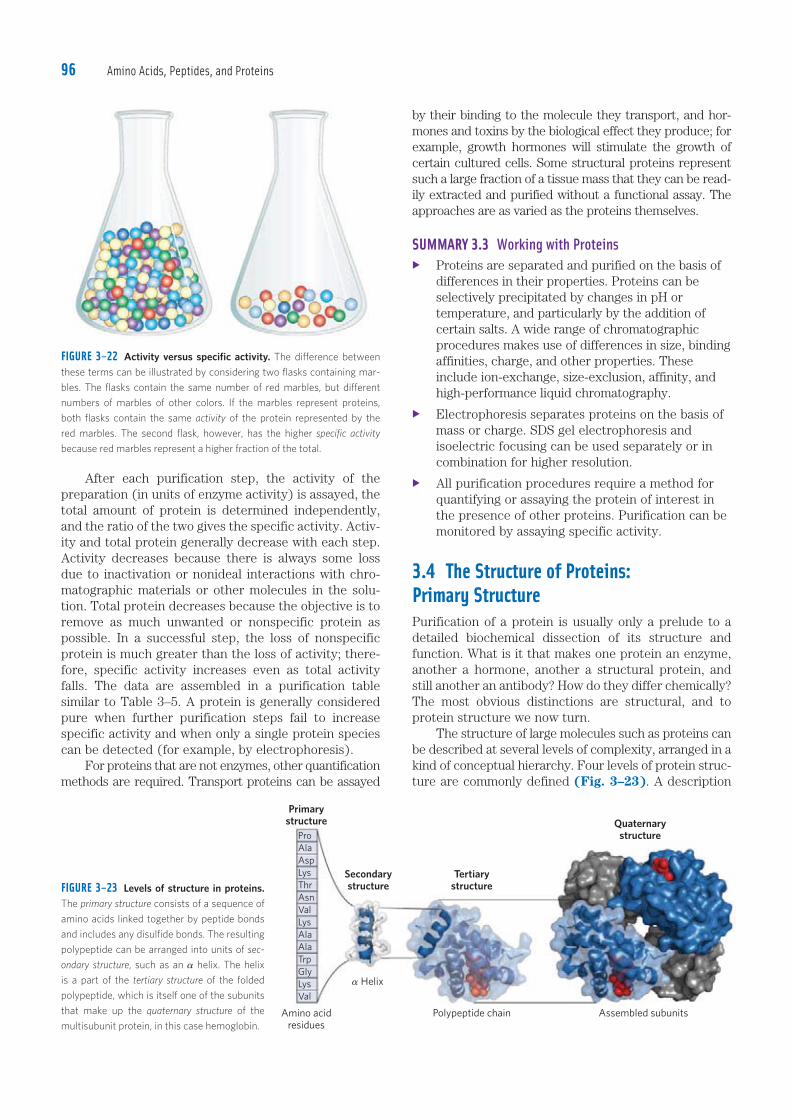
Amino Acids, Peptides, and Proteins96
by their binding to the molecule they transport, and hor-mones and toxins by the biological effect they produce; for example, growth hormones will stimulate the growth of certain cultured cells. Some structural proteins represent such a large fraction of a tissue mass that they can be read-ily extracted and purified without a functional assay. The approaches are as varied as the proteins themselves.
SUMMARY 3.3 Working with Proteins� Proteins are separated and purified on the basis of
differences in their properties. Proteins can be selectively precipitated by changes in pH or temperature, and particularly by the addition of certain salts. A wide range of chromatographic procedures makes use of differences in size, binding affinities, charge, and other properties. These include ion-exchange, size-exclusion, affinity, and high-performance liquid chromatography.
� Electrophoresis separates proteins on the basis of mass or charge. SDS gel electrophoresis and isoelectric focusing can be used separately or in combination for higher resolution.
� All purification procedures require a method for quantifying or assaying the protein of interest in the presence of other proteins. Purification can be monitored by assaying specific activity.
3.4 The Structure of Proteins: Primary StructurePurification of a protein is usually only a prelude to a detailed biochemical dissection of its structure and function. What is it that makes one protein an enzyme, another a hormone, another a structural protein, and still another an antibody? How do they differ chemically? The most obvious distinctions are structural, and to protein structure we now turn. The structure of large molecules such as proteins can be described at several levels of complexity, arranged in a kind of conceptual hierarchy. Four levels of protein struc-ture are commonly defined (Fig. 3–23). A description
After each purification step, the activity of the preparation (in units of enzyme activity) is assayed, the total amount of protein is determined independently, and the ratio of the two gives the specific activity. Activ-ity and total protein generally decrease with each step. Activity decreases because there is always some loss due to inactivation or nonideal interactions with chro-matographic materials or other molecules in the solu-tion. Total protein decreases because the objective is to remove as much unwanted or nonspecific protein as possible. In a successful step, the loss of nonspecific protein is much greater than the loss of activity; there-fore, specific activity increases even as total activity falls. The data are assembled in a purification table similar to Table 3–5. A protein is generally considered pure when further purification steps fail to increase specific activity and when only a single protein species can be detected (for example, by electrophoresis). For proteins that are not enzymes, other quantification methods are required. Transport proteins can be assayed
FIGURE 3–23 Levels of structure in proteins. The primary structure consists of a sequence of
amino acids linked together by peptide bonds
and includes any disulfide bonds. The resulting
polypeptide can be arranged into units of sec-
ondary structure, such as an � helix. The helix
is a part of the tertiary structure of the folded
polypeptide, which is itself one of the subunits
that make up the quaternary structure of the
multisubunit protein, in this case hemoglobin.
FIGURE 3–22 Activity versus specific activity. The difference between
these terms can be illustrated by considering two flasks containing mar-
bles. The flasks contain the same number of red marbles, but different
numbers of marbles of other colors. If the marbles represent proteins,
both flasks contain the same activity of the protein represented by the
red marbles. The second flask, however, has the higher specific activity
because red marbles represent a higher fraction of the total.
c03AminoAcidsPeptidesAndProteins.indd Page 96 11/08/12 12:47 PM user-F408 /Users/user-F408/Desktop
Primarystructure
Amino acid
residues
� Helix
Polypeptide chain
Pro
Ala
Asp
Lys
Thr
Asn
Val
Lys
Ala
Ala
Trp
Gly
Lys
Val
Secondarystructure
Tertiarystructure
Quaternarystructure
Assembled subunits
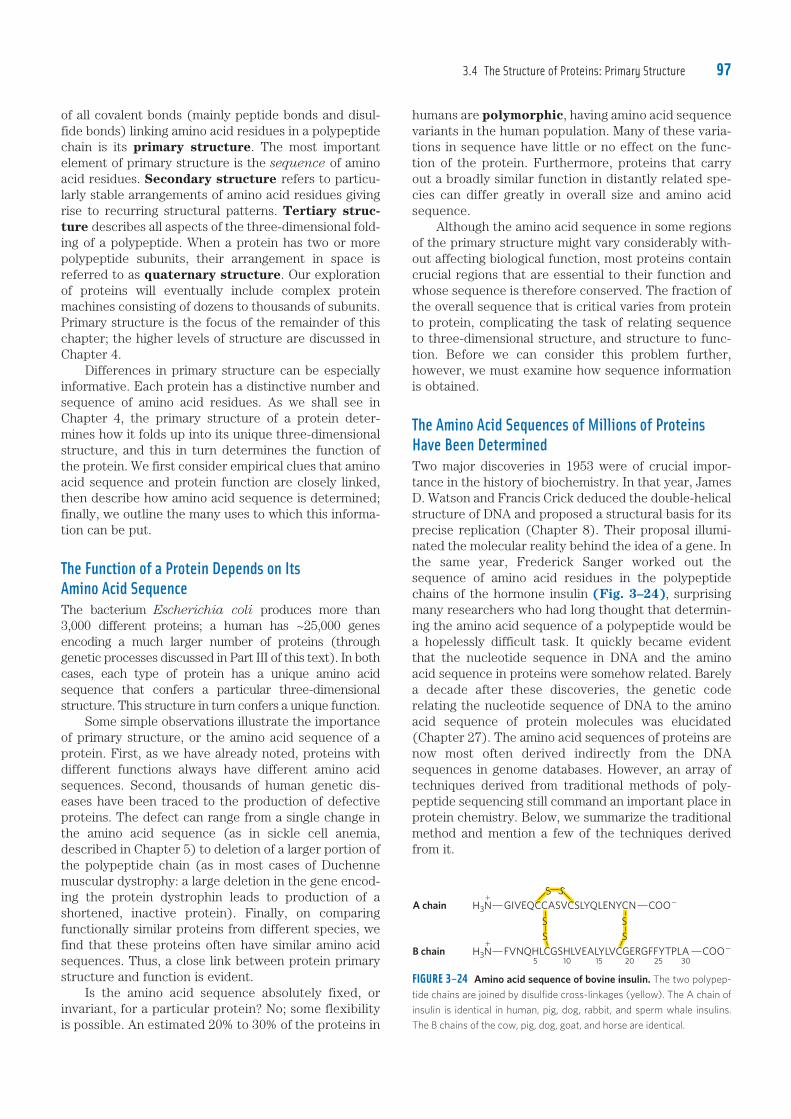
3.4 The Structure of Proteins: Primary Structure 97
humans are polymorphic, having amino acid sequence variants in the human population. Many of these varia-tions in sequence have little or no effect on the func-tion of the protein. Furthermore, proteins that carry out a broadly similar function in distantly related spe-cies can differ greatly in overall size and amino acid sequence. Although the amino acid sequence in some regions of the primary structure might vary considerably with-out affecting biological function, most proteins contain crucial regions that are essential to their function and whose sequence is therefore conserved. The fraction of the overall sequence that is critical varies from protein to protein, complicating the task of relating sequence to three-dimensional structure, and structure to func-tion. Before we can consider this problem further, however, we must examine how sequence information is obtained.
The Amino Acid Sequences of Millions of Proteins Have Been DeterminedTwo major discoveries in 1953 were of crucial impor-tance in the history of biochemistry. In that year, James D. Watson and Francis Crick deduced the double-helical structure of DNA and proposed a structural basis for its precise replication (Chapter 8). Their proposal illumi-nated the molecular reality behind the idea of a gene. In the same year, Frederick Sanger worked out the sequence of amino acid residues in the polypeptide chains of the hormone insulin (Fig. 3–24), surprising many researchers who had long thought that determin-ing the amino acid sequence of a polypeptide would be a hopelessly difficult task. It quickly became evident that the nucleotide sequence in DNA and the amino acid sequence in proteins were somehow related. Barely a decade after these discoveries, the genetic code relating the nucleotide sequence of DNA to the amino acid sequence of protein molecules was elucidated (Chapter 27). The amino acid sequences of proteins are now most often derived indirectly from the DNA sequences in genome databases. However, an array of techniques derived from traditional methods of poly-peptide sequencing still command an important place in protein chemistry. Below, we summarize the traditional method and mention a few of the techniques derived from it.
of all covalent bonds (mainly peptide bonds and disul-fide bonds) linking amino acid residues in a polypeptide chain is its primary structure. The most important element of primary structure is the sequence of amino acid residues. Secondary structure refers to particu-larly stable arrangements of amino acid residues giving rise to recurring structural patterns. Tertiary struc-ture describes all aspects of the three-dimensional fold-ing of a polypeptide. When a protein has two or more polypeptide subunits, their arrangement in space is referred to as quaternary structure. Our exploration of proteins will eventually include complex protein machines consisting of dozens to thousands of subunits. Primary structure is the focus of the remainder of this chapter; the higher levels of structure are discussed in Chapter 4. Differences in primary structure can be especially informative. Each protein has a distinctive number and sequence of amino acid residues. As we shall see in Chapter 4, the primary structure of a protein deter-mines how it folds up into its unique three-dimensional structure, and this in turn determines the function of the protein. We first consider empirical clues that amino acid sequence and protein function are closely linked, then describe how amino acid sequence is determined; finally, we outline the many uses to which this informa-tion can be put.
The Function of a Protein Depends on ItsAmino Acid SequenceThe bacterium Escherichia coli produces more than 3,000 different proteins; a human has ~25,000 genes encoding a much larger number of proteins (through genetic processes discussed in Part III of this text). In both cases, each type of protein has a unique amino acid sequence that confers a particular three-dimensional structure. This structure in turn confers a unique function. Some simple observations illustrate the importance of primary structure, or the amino acid sequence of a protein. First, as we have already noted, proteins with different functions always have different amino acid sequences. Second, thousands of human genetic dis-eases have been traced to the production of defective proteins. The defect can range from a single change in the amino acid sequence (as in sickle cell anemia, described in Chapter 5) to deletion of a larger portion of the polypeptide chain (as in most cases of Duchenne muscular dystrophy: a large deletion in the gene encod-ing the protein dystrophin leads to production of a shortened, inactive protein). Finally, on comparing functionally similar proteins from different species, we find that these proteins often have similar amino acid sequences. Thus, a close link between protein primary structure and function is evident. Is the amino acid sequence absolutely fixed, or invariant, for a particular protein? No; some flexibility is possible. An estimated 20% to 30% of the proteins in
FIGURE 3–24 Amino acid sequence of bovine insulin. The two polypep-
tide chains are joined by disulfide cross-linkages (yellow). The A chain of
insulin is identical in human, pig, dog, rabbit, and sperm whale insulins.
The B chains of the cow, pig, dog, goat, and horse are identical.
A chain COO�
S
S
S
S
S S
GIVEQCCASVCSLYQLENYCN
B chain
H3N
COO�FVNQHLCGSHLVEALYLVCGERGFFYTPLA5 10 15 20 25 30
�
H3N�
c03AminoAcidsPeptidesAndProteins.indd Page 97 11/08/12 12:47 PM user-F408 /Users/user-F408/Desktop
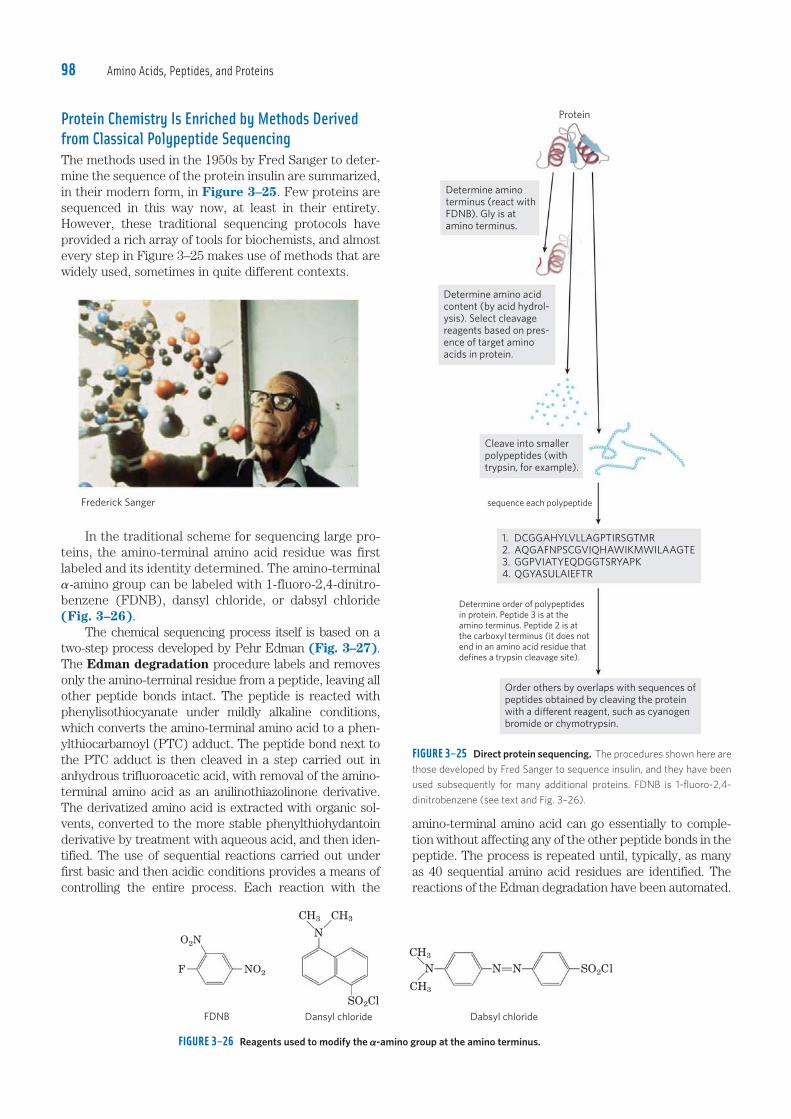
Amino Acids, Peptides, and Proteins98
Protein Chemistry Is Enriched by Methods Derived from Classical Polypeptide SequencingThe methods used in the 1950s by Fred Sanger to deter-mine the sequence of the protein insulin are summarized, in their modern form, in Figure 3–25. Few proteins are sequenced in this way now, at least in their entirety. However, these traditional sequencing protocols have provided a rich array of tools for biochemists, and almost every step in Figure 3–25 makes use of methods that are widely used, sometimes in quite different contexts.
FIGURE 3–26 Reagents used to modify the �-amino group at the amino terminus.
NG
CH3D
CH3
O2Cl
Dansyl chloride
NG
CH3
DCH3
NPN
Dabsyl chloride
S
O2ClS
O2N
NO2F
FDNB
Frederick Sanger
FIGURE 3–25 Direct protein sequencing. The procedures shown here are
those developed by Fred Sanger to sequence insulin, and they have been
used subsequently for many additional proteins. FDNB is 1-fluoro-2,4-
dinitrobenzene (see text and Fig. 3–26).
Determine amino
terminus (react with
FDNB). Gly is at
amino terminus.
Determine amino acid
content (by acid hydrol-
ysis). Select cleavage
reagents based on pres-
ence of target amino
acids in protein.
Cleave into smaller
polypeptides (with
trypsin, for example).
1. DCGGAHYLVLLAGPTIRSGTMR
2. AQGAFNPSCGVIQHAWIKMWILAAGTE
3. GGPVIATYEQDGGTSRYAPK
4. QGYASULAIEFTR
Order others by overlaps with sequences of
peptides obtained by cleaving the protein
with a di erent reagent, such as cyanogen
bromide or chymotrypsin.
Determine order of polypeptides
in protein. Peptide 3 is at the
amino terminus. Peptide 2 is at
the carboxyl terminus (it does not
end in an amino acid residue that
defines a trypsin cleavage site).
Protein
sequence each polypeptide
In the traditional scheme for sequencing large pro-teins, the amino-terminal amino acid residue was first labeled and its identity determined. The amino-terminal �-amino group can be labeled with 1-fluoro-2,4-dinitro-benzene (FDNB), dansyl chloride, or dabsyl chloride (Fig. 3–26). The chemical sequencing process itself is based on a two-step process developed by Pehr Edman (Fig. 3–27). The Edman degradation procedure labels and removes only the amino-terminal residue from a peptide, leaving all other peptide bonds intact. The peptide is reacted with phenylisothiocyanate under mildly alkaline conditions, which converts the amino-terminal amino acid to a phen-ylthiocarbamoyl (PTC) adduct. The peptide bond next to the PTC adduct is then cleaved in a step carried out in anhydrous trifluoroacetic acid, with removal of the amino-terminal amino acid as an anilinothiazolinone derivative. The derivatized amino acid is extracted with organic sol-vents, converted to the more stable phenylthiohydantoin derivative by treatment with aqueous acid, and then iden-tified. The use of sequential reactions carried out under first basic and then acidic conditions provides a means of controlling the entire process. Each reaction with the
amino-terminal amino acid can go essentially to comple-tion without affecting any of the other peptide bonds in the peptide. The process is repeated until, typically, as many as 40 sequential amino acid residues are identified. The reactions of the Edman degradation have been automated.
c03AminoAcidsPeptidesAndProteins.indd Page 98 11/08/12 12:47 PM user-F408 /Users/user-F408/Desktop
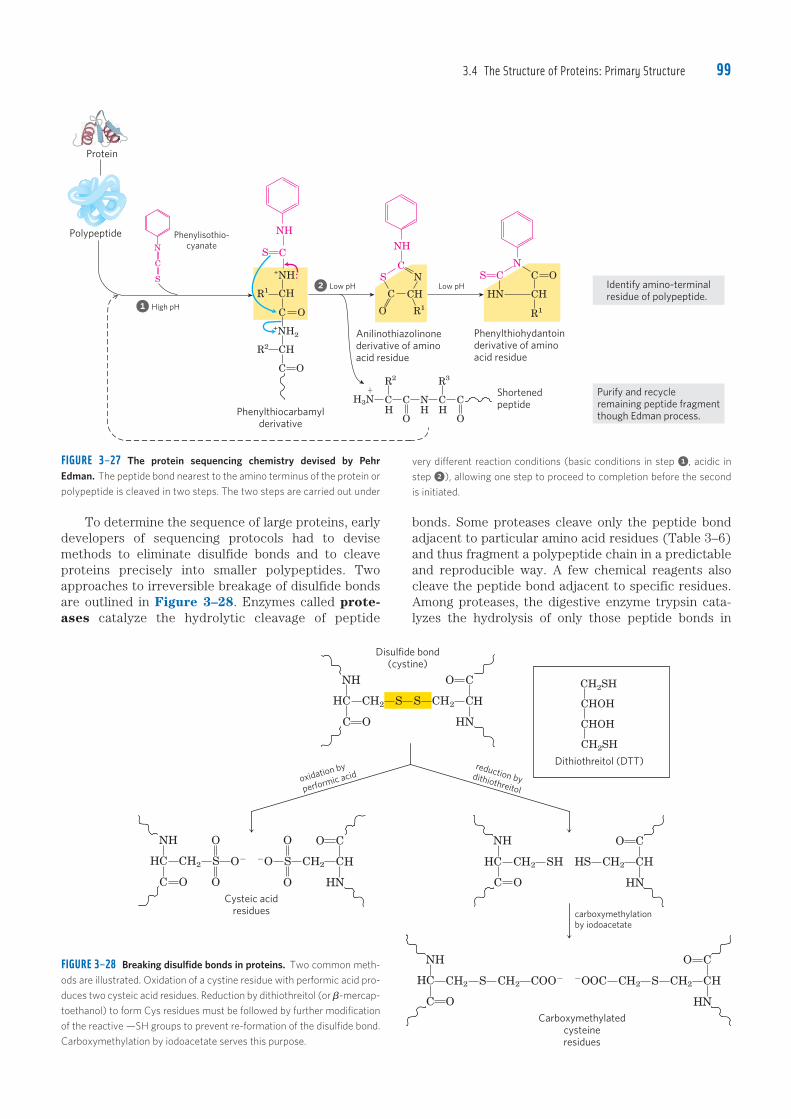
3.4 The Structure of Proteins: Primary Structure 99
bonds. Some proteases cleave only the peptide bond adjacent to particular amino acid residues (Table 3–6) and thus fragment a polypeptide chain in a predictable and reproducible way. A few chemical reagents also cleave the peptide bond adjacent to specific residues. Among proteases, the digestive enzyme trypsin cata-lyzes the hydrolysis of only those peptide bonds in
To determine the sequence of large proteins, early developers of sequencing protocols had to devise methods to eliminate disulfide bonds and to cleave proteins precisely into smaller polypeptides. Two approaches to irreversible breakage of disulfide bonds are outlined in Figure 3–28. Enzymes called prote-ases catalyze the hydrolytic cleavage of peptide
N
C
S
C
+NH..
R1 C
O
+NH2
R2 C
C
Phenylthiocarbamyl
derivative
O
H
H
CN
C
NH
S
HC
R1
Phenylthiohydantoin
derivative of amino
acid residue
O
S
NC
NH
S
CHC
R1O
Anilinothiazolinone
derivative of amino
acid residue
Shortened
peptide
R�
O
CH
CH
NH
C
2
O
CH3N
R3
Phenylisothio-
cyanate
Identify amino-terminal
residue of polypeptide.
C
NHPolypeptide
High pH1
Low pH2 Low pH
Purify and recycle
remaining peptide fragment
though Edman process.
Protein
FIGURE 3–27 The protein sequencing chemistry devised by Pehr Edman. The peptide bond nearest to the amino terminus of the protein or
polypeptide is cleaved in two steps. The two steps are carried out under
very different reaction conditions (basic conditions in step 1, acidic in
step 2), allowing one step to proceed to completion before the second
is initiated.
Disulfide bond
(cystine)
HC
NH
C O
CH2 S S CH2 C
O C
HN
H
oxidation by
performic acidreduction bydithiothreitol
HC
NH
C O
CH2 S
O
O
O� �O S
O
O
CH2 C
O C
HN
H HC
NH
C O
CH2 SH HS CH2 C
O C
HN
H
Cysteic acid
residues carboxymethylation
by iodoacetate
HC
NH
C O
CH2 S CH2 COO� �OOC CH2 S CH2 C
O C
HN
H
Carboxymethylated
cysteine
residues
CH2SH
CHOH
CHOH
CH2SH
Dithiothreitol (DTT)
FIGURE 3–28 Breaking disulfide bonds in proteins. Two common meth-
ods are illustrated. Oxidation of a cystine residue with performic acid pro-
duces two cysteic acid residues. Reduction by dithiothreitol (or �-mercap-
toethanol) to form Cys residues must be followed by further modification
of the reactive —SH groups to prevent re-formation of the disulfide bond.
Carboxymethylation by iodoacetate serves this purpose.
c03AminoAcidsPeptidesAndProteins.indd Page 99 28/08/12 11:51 AM user-F408 /Users/user-F408/Desktop
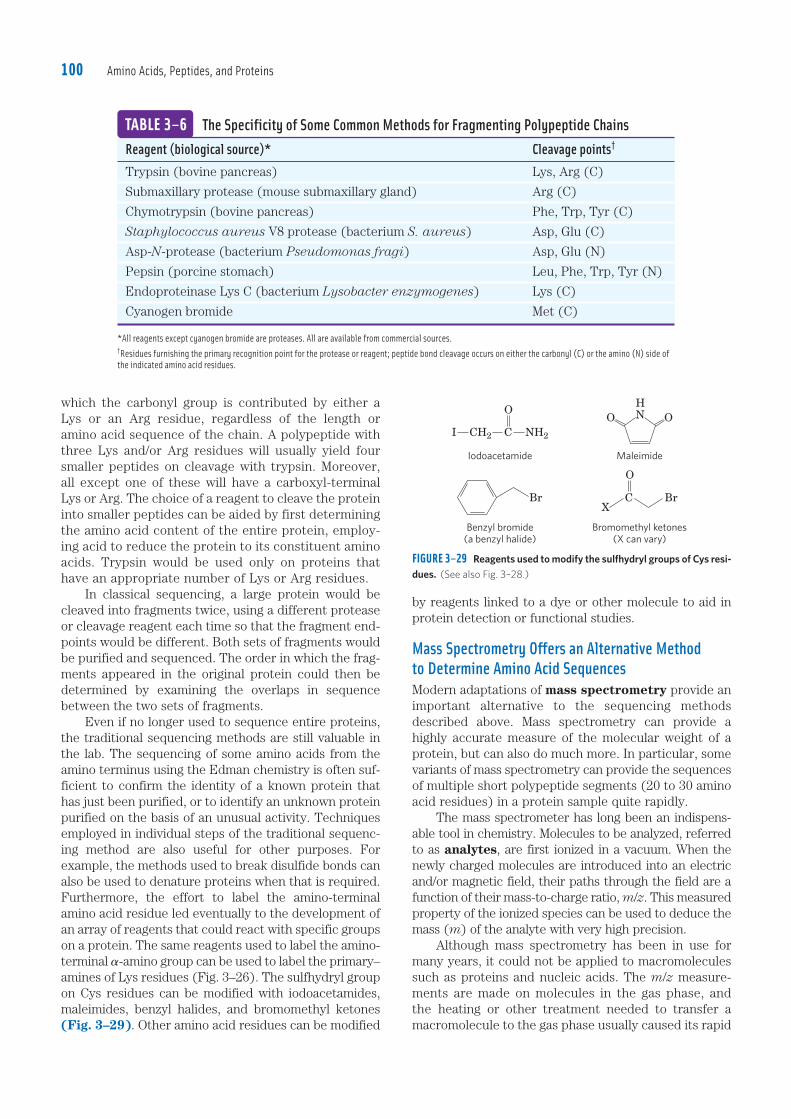
Amino Acids, Peptides, and Proteins100
by reagents linked to a dye or other molecule to aid in protein detection or functional studies.
Mass Spectrometry Offers an Alternative Method to Determine Amino Acid SequencesModern adaptations of mass spectrometry provide an important alternative to the sequencing methods described above. Mass spectrometry can provide a highly accurate measure of the molecular weight of a protein, but can also do much more. In particular, some variants of mass spectrometry can provide the sequences of multiple short polypeptide segments (20 to 30 amino acid residues) in a protein sample quite rapidly. The mass spectrometer has long been an indispens-able tool in chemistry. Molecules to be analyzed, referred to as analytes, are first ionized in a vacuum. When the newly charged molecules are introduced into an electric and/or magnetic field, their paths through the field are a function of their mass-to-charge ratio, m/z. This measured property of the ionized species can be used to deduce the mass (m) of the analyte with very high precision. Although mass spectrometry has been in use for many years, it could not be applied to macromolecules such as proteins and nucleic acids. The m/z measure-ments are made on molecules in the gas phase, and the heating or other treatment needed to transfer a macromolecule to the gas phase usually caused its rapid
which the carbonyl group is contributed by either a Lys or an Arg residue, regardless of the length or amino acid sequence of the chain. A polypeptide with three Lys and/or Arg residues will usually yield four smaller peptides on cleavage with trypsin. Moreover, all except one of these will have a carboxyl-terminal Lys or Arg. The choice of a reagent to cleave the protein into smaller peptides can be aided by first determining the amino acid content of the entire protein, employ-ing acid to reduce the protein to its constituent amino acids. Trypsin would be used only on proteins that have an appropriate number of Lys or Arg residues. In classical sequencing, a large protein would be cleaved into fragments twice, using a different protease or cleavage reagent each time so that the fragment end-points would be different. Both sets of fragments would be purified and sequenced. The order in which the frag-ments appeared in the original protein could then be determined by examining the overlaps in sequence between the two sets of fragments. Even if no longer used to sequence entire proteins, the traditional sequencing methods are still valuable in the lab. The sequencing of some amino acids from the amino terminus using the Edman chemistry is often suf-ficient to confirm the identity of a known protein that has just been purified, or to identify an unknown protein purified on the basis of an unusual activity. Techniques employed in individual steps of the traditional sequenc-ing method are also useful for other purposes. For example, the methods used to break disulfide bonds can also be used to denature proteins when that is required. Furthermore, the effort to label the amino-terminal amino acid residue led eventually to the development of an array of reagents that could react with specific groups on a protein. The same reagents used to label the amino-terminal �-amino group can be used to label the primary–amines of Lys residues (Fig. 3–26). The sulfhydryl group on Cys residues can be modified with iodoacetamides, maleimides, benzyl halides, and bromomethyl ketones (Fig. 3–29). Other amino acid residues can be modified
Reagent (biological source)* Cleavage points†
Trypsin (bovine pancreas) Lys, Arg (C)
Submaxillary protease (mouse submaxillary gland) Arg (C)
Chymotrypsin (bovine pancreas) Phe, Trp, Tyr (C)
Staphylococcus aureus V8 protease (bacterium S. aureus) Asp, Glu (C)
Asp-N-protease (bacterium Pseudomonas fragi) Asp, Glu (N)
Pepsin (porcine stomach) Leu, Phe, Trp, Tyr (N)
Endoproteinase Lys C (bacterium Lysobacter enzymogenes) Lys (C)
Cyanogen bromide Met (C)
*All reagents except cyanogen bromide are proteases. All are available from commercial sources.†Residues furnishing the primary recognition point for the protease or reagent; peptide bond cleavage occurs on either the carbonyl (C) or the amino (N) side of
the indicated amino acid residues.
TABLE 3–6 The Specificity of Some Common Methods for Fragmenting Polypeptide Chains
FIGURE 3–29 Reagents used to modify the sulfhydryl groups of Cys resi-dues. (See also Fig. 3–28.)
Iodoacetamide
Benzyl bromide
(a benzyl halide)
Bromomethyl ketones
(X can vary)
Maleimide
I CH2 C
O
NH2
Br
O
BrX
C
HNO O
c03AminoAcidsPeptidesAndProteins.indd Page 100 11/08/12 12:47 PM user-F408 /Users/user-F408/Desktop
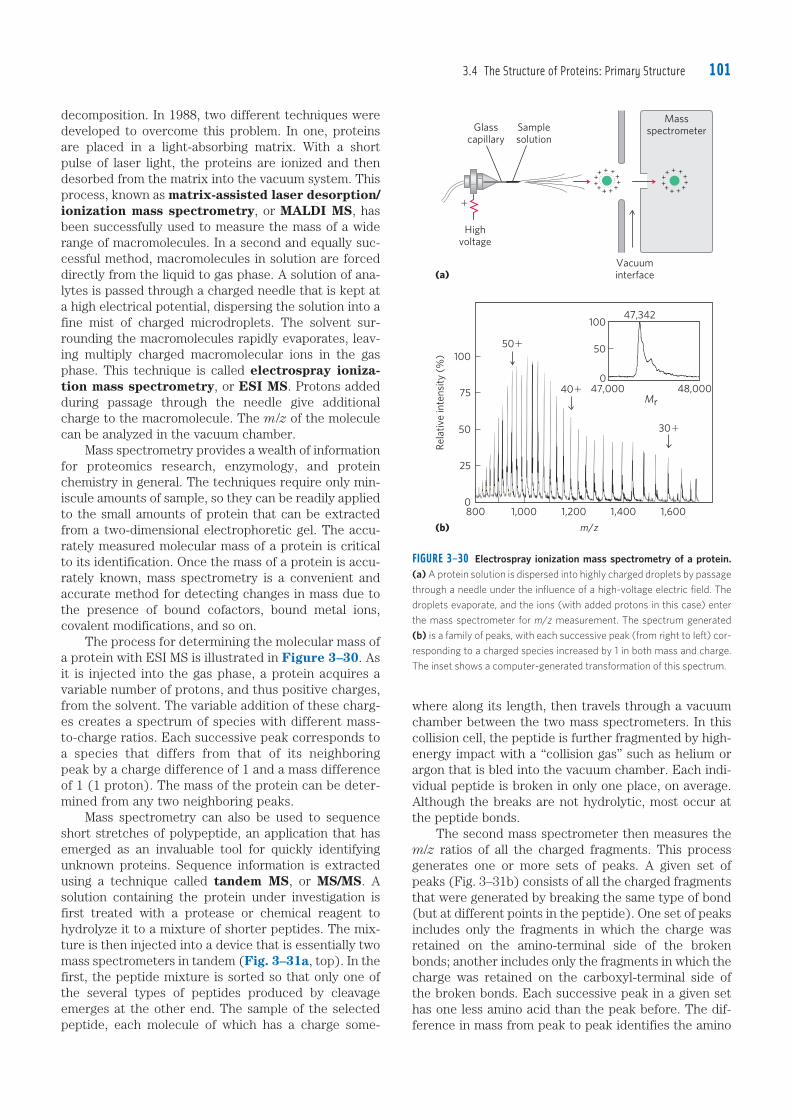
3.4 The Structure of Proteins: Primary Structure 101
where along its length, then travels through a vacuum chamber between the two mass spectrometers. In this collision cell, the peptide is further fragmented by high-energy impact with a “collision gas” such as helium or argon that is bled into the vacuum chamber. Each indi-vidual peptide is broken in only one place, on average. Although the breaks are not hydrolytic, most occur at the peptide bonds. The second mass spectrometer then measures the m/z ratios of all the charged fragments. This process generates one or more sets of peaks. A given set of peaks (Fig. 3–31b) consists of all the charged fragments that were generated by breaking the same type of bond (but at different points in the peptide). One set of peaks includes only the fragments in which the charge was retained on the amino-terminal side of the broken bonds; another includes only the fragments in which the charge was retained on the carboxyl-terminal side of the broken bonds. Each successive peak in a given set has one less amino acid than the peak before. The dif-ference in mass from peak to peak identifies the amino
decomposition. In 1988, two different techniques were developed to overcome this problem. In one, proteins are placed in a light-absorbing matrix. With a short pulse of laser light, the proteins are ionized and then desorbed from the matrix into the vacuum system. This process, known as matrix-assisted laser desorption/ionization mass spectrometry, or MALDI MS, has been successfully used to measure the mass of a wide range of macromolecules. In a second and equally suc-cessful method, macromolecules in solution are forced directly from the liquid to gas phase. A solution of ana-lytes is passed through a charged needle that is kept at a high electrical potential, dispersing the solution into a fine mist of charged microdroplets. The solvent sur-rounding the macromolecules rapidly evaporates, leav-ing multiply charged macromolecular ions in the gas phase. This technique is called electrospray ioniza-tion mass spectrometry, or ESI MS. Protons added during passage through the needle give additional charge to the macromolecule. The m/z of the molecule can be analyzed in the vacuum chamber. Mass spectrometry provides a wealth of information for proteomics research, enzymology, and protein chemistry in general. The techniques require only min-iscule amounts of sample, so they can be readily applied to the small amounts of protein that can be extracted from a two-dimensional electrophoretic gel. The accu-rately measured molecular mass of a protein is critical to its identification. Once the mass of a protein is accu-rately known, mass spectrometry is a convenient and accurate method for detecting changes in mass due to the presence of bound cofactors, bound metal ions, covalent modifications, and so on. The process for determining the molecular mass of a protein with ESI MS is illustrated in Figure 3–30. As it is injected into the gas phase, a protein acquires a variable number of protons, and thus positive charges, from the solvent. The variable addition of these charg-es creates a spectrum of species with different mass-to-charge ratios. Each successive peak corresponds to a species that differs from that of its neighboring peak by a charge difference of 1 and a mass difference of 1 (1 proton). The mass of the protein can be deter-mined from any two neighboring peaks. Mass spectrometry can also be used to sequence short stretches of polypeptide, an application that has emerged as an invaluable tool for quickly identifying unknown proteins. Sequence information is extracted using a technique called tandem MS, or MS/MS. A solution containing the protein under investigation is first treated with a protease or chemical reagent to hydrolyze it to a mixture of shorter peptides. The mix-ture is then injected into a device that is essentially two mass spectrometers in tandem (Fig. 3–31a, top). In the first, the peptide mixture is sorted so that only one of the several types of peptides produced by cleavage emerges at the other end. The sample of the selected peptide, each molecule of which has a charge some-
FIGURE 3–30 Electrospray ionization mass spectrometry of a protein. (a) A protein solution is dispersed into highly charged droplets by passage
through a needle under the influence of a high-voltage electric field. The
droplets evaporate, and the ions (with added protons in this case) enter
the mass spectrometer for m/z measurement. The spectrum generated
(b) is a family of peaks, with each successive peak (from right to left) cor-
responding to a charged species increased by 1 in both mass and charge.
The inset shows a computer-generated transformation of this spectrum.
Mass
spectrometer
100
50�
75
50R
ela
tiv
e i
nte
nsi
ty (
%)
25
0800 1,000 1,200
m/z
40�
100
50
047,000 48,000
47,342
30�
1,400 1,600
Mr
Vacuum
interface
Glass
capillary
Sample
solution
High
voltage
�
(b)
(a)
c03AminoAcidsPeptidesAndProteins.indd Page 101 11/08/12 12:48 PM user-F408 /Users/user-F408/Desktop
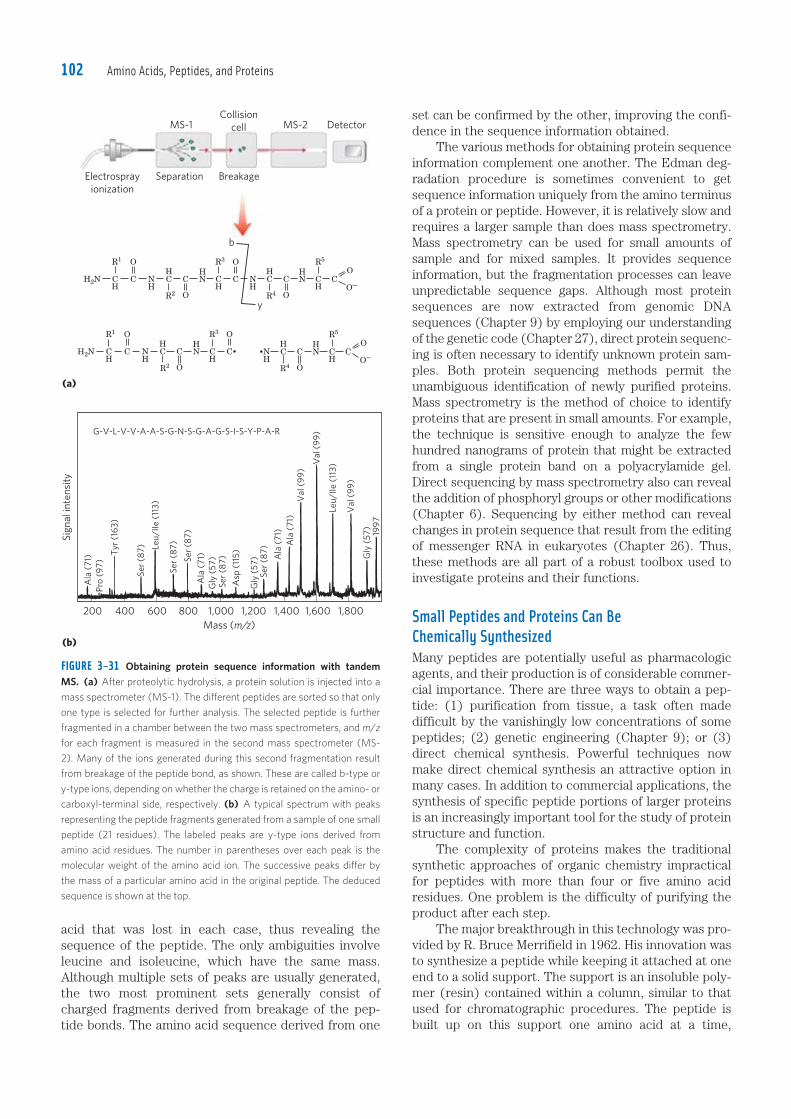
Amino Acids, Peptides, and Proteins102
set can be confirmed by the other, improving the confi-dence in the sequence information obtained. The various methods for obtaining protein sequence information complement one another. The Edman deg-radation procedure is sometimes convenient to get sequence information uniquely from the amino terminus of a protein or peptide. However, it is relatively slow and requires a larger sample than does mass spectrometry. Mass spectrometry can be used for small amounts of sample and for mixed samples. It provides sequence information, but the fragmentation processes can leave unpredictable sequence gaps. Although most protein sequences are now extracted from genomic DNA sequences (Chapter 9) by employing our understanding of the genetic code (Chapter 27), direct protein sequenc-ing is often necessary to identify unknown protein sam-ples. Both protein sequencing methods permit the unambiguous identification of newly purified proteins. Mass spectrometry is the method of choice to identify proteins that are present in small amounts. For example, the technique is sensitive enough to analyze the few hundred nanograms of protein that might be extracted from a single protein band on a polyacrylamide gel. Direct sequencing by mass spectrometry also can reveal the addition of phosphoryl groups or other modifications (Chapter 6). Sequencing by either method can reveal changes in protein sequence that result from the editing of messenger RNA in eukaryotes (Chapter 26). Thus, these methods are all part of a robust toolbox used to investigate proteins and their functions.
Small Peptides and Proteins Can Be Chemically SynthesizedMany peptides are potentially useful as pharmacologic agents, and their production is of considerable commer-cial importance. There are three ways to obtain a pep-tide: (1) purification from tissue, a task often made difficult by the vanishingly low concentrations of some peptides; (2) genetic engineering (Chapter 9); or (3) direct chemical synthesis. Powerful techniques now make direct chemical synthesis an attractive option in many cases. In addition to commercial applications, the synthesis of specific peptide portions of larger proteins is an increasingly important tool for the study of protein structure and function. The complexity of proteins makes the traditional synthetic approaches of organic chemistry impractical for peptides with more than four or five amino acid residues. One problem is the difficulty of purifying the product after each step. The major breakthrough in this technology was pro-vided by R. Bruce Merrifield in 1962. His innovation was to synthesize a peptide while keeping it attached at one end to a solid support. The support is an insoluble poly-mer (resin) contained within a column, similar to that used for chromatographic procedures. The peptide is built up on this support one amino acid at a time,
acid that was lost in each case, thus revealing the sequence of the peptide. The only ambiguities involve leucine and isoleucine, which have the same mass. Although multiple sets of peaks are usually generated, the two most prominent sets generally consist of charged fragments derived from breakage of the pep-tide bonds. The amino acid sequence derived from one
FIGURE 3–31 Obtaining protein sequence information with tandem MS. (a) After proteolytic hydrolysis, a protein solution is injected into a
mass spectrometer (MS-1). The different peptides are sorted so that only
one type is selected for further analysis. The selected peptide is further
fragmented in a chamber between the two mass spectrometers, and m/z
for each fragment is measured in the second mass spectrometer (MS-
2). Many of the ions generated during this second fragmentation result
from breakage of the peptide bond, as shown. These are called b-type or
y-type ions, depending on whether the charge is retained on the amino- or
carboxyl-terminal side, respectively. (b) A typical spectrum with peaks
representing the peptide fragments generated from a sample of one small
peptide (21 residues). The labeled peaks are y-type ions derived from
amino acid residues. The number in parentheses over each peak is the
molecular weight of the amino acid ion. The successive peaks differ by
the mass of a particular amino acid in the original peptide. The deduced
sequence is shown at the top.
(b)
R1
R2
CH
H2N
R3
CH
O
O
C
O
b
y
CN CH
R4
CH
CH
NH
O
O
O–C CN
HR5
CH
NH
R1
R2
CH
H2N
R3
CH
O
O
C
O
CN CH
R4
CH
CH
NH
O
O
O–C CN
HR5
CH
NH
(a)
c03AminoAcidsPeptidesAndProteins.indd Page 102 11/08/12 12:48 PM user-F408 /Users/user-F408/Desktop
MS-2 DetectorMS-1Collision
cell
Separation BreakageElectrosprayionization
Ala
(71
)Pr
o (9
7)
Tyr (
163)
Ser (
87) Le
u/IIe
(11
3)
Ser (
87)
Ser (
87)
Ala
(71
)G
ly (
57)
Asp
(11
5)Se
r (87
)
Gly
(57
)Se
r (87
) Ala
(71
)A
la (
71)
Val
(99
)
Val
(99
)
Gly
(57
)
Val
(99
)
Leu/
IIe (
113)
1997
Sign
al in
tens
ity
Mass (m/z)
G-V-L-V-V-A-A-S-G-N-S-G-A-G-S-I-S-Y-P-A-R
1,8001,6001,4001,2001,000800600400200
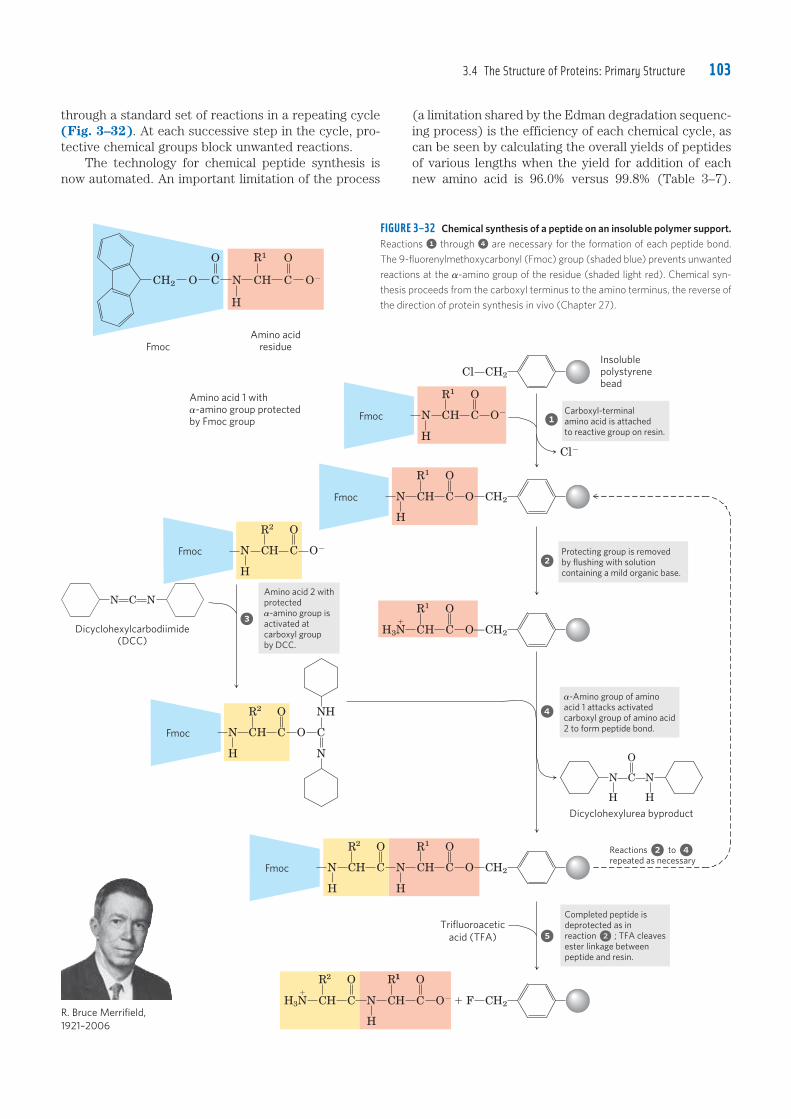
3.4 The Structure of Proteins: Primary Structure 103
FIGURE 3–32 Chemical synthesis of a peptide on an insoluble polymer support. Reactions 1 through 4 are necessary for the formation of each peptide bond.
The 9-fluorenylmethoxycarbonyl (Fmoc) group (shaded blue) prevents unwanted
reactions at the �-amino group of the residue (shaded light red). Chemical syn-
thesis proceeds from the carboxyl terminus to the amino terminus, the reverse of
the direction of protein synthesis in vivo (Chapter 27).
O�
R1
CH2 CHO N
H
C
O
Fmoc
Amino acid
residue
C
O
Amino acid 1 with
�-amino group protected
by Fmoc group
Cl CH2
Insoluble
polystyrene
bead
N
H
C
R1
H C
Cl�
N
H
C
R1
H C
O
O CH2
Protecting group is removed
by flushing with solution
containing a mild organic base.
�-Amino group of amino
acid 1 attacks activated
carboxyl group of amino acid
2 to form peptide bond.
N
H
C
O
N
HDicyclohexylurea byproduct
to
repeated as necessary
Completed peptide is
deprotected as in
reaction ; TFA cleaves
ester linkage between
peptide and resin.
N
H
C
R2
H C
O
O�
Amino acid 2 with
protected
�-amino group is
activated at
carboxyl group
by DCC.
H3 C
R1
H C
O
OOCH2
C
Dicyclohexylcarbodiimide
(DCC)
N
H
C
R2
H C
O
O C
NH
N
N
H
C
R2
H C
O
N
H
C
R1
H C
O
O CH2
H3N�
N�
C
R
H C
O
N
H
C
R2
H C
O
O� � F CH2
Trifluoroacetic
acid (TFA)
Carboxyl-terminal
amino acid is attached
to reactive group on resin.
1
2
4
5 2
2
3
Reactions 4
11
O
O�
N N
Fmoc
Fmoc
Fmoc
Fmoc
Fmoc
R. Bruce Merrifield,
1921–2006
through a standard set of reactions in a repeating cycle (Fig. 3–32). At each successive step in the cycle, pro-tective chemical groups block unwanted reactions. The technology for chemical peptide synthesis is now automated. An important limitation of the process
(a limitation shared by the Edman degradation sequenc-ing process) is the efficiency of each chemical cycle, as can be seen by calculating the overall yields of peptides of various lengths when the yield for addition of each new amino acid is 96.0% versus 99.8% (Table 3–7).
c03AminoAcidsPeptidesAndProteins.indd Page 103 06/09/12 10:43 AM user-F408 /Users/user-F408/Desktop
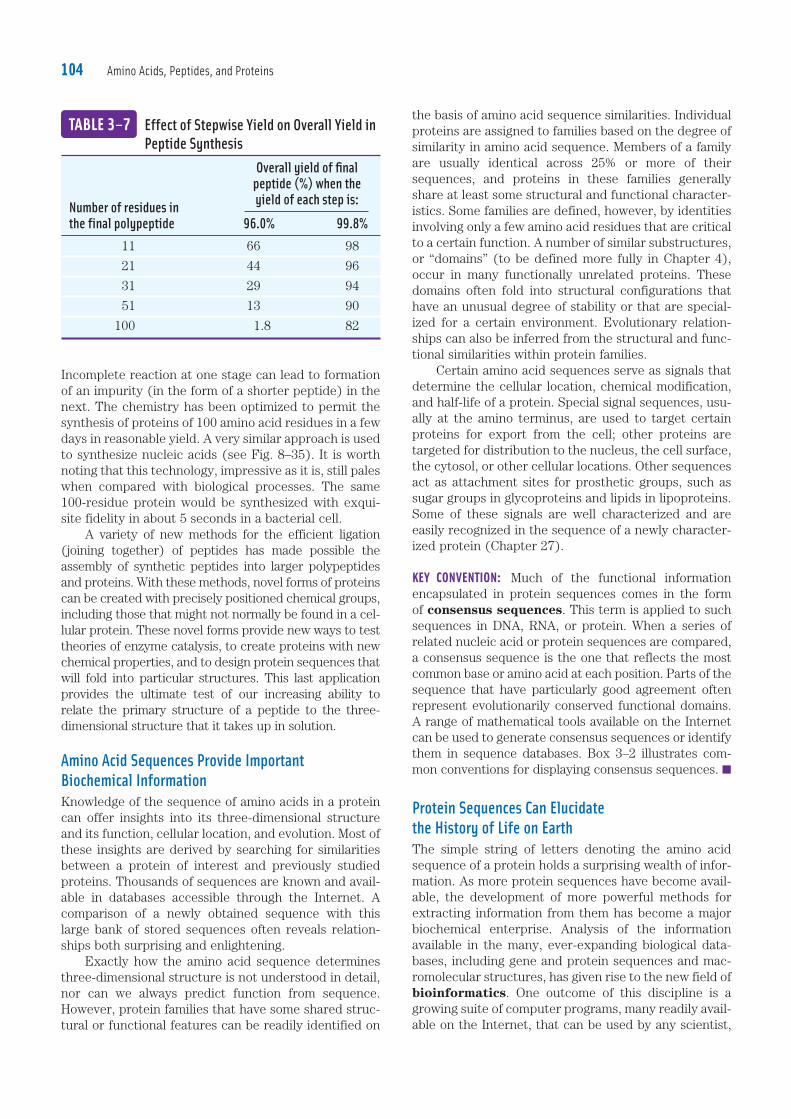
Amino Acids, Peptides, and Proteins104
the basis of amino acid sequence similarities. Individual proteins are assigned to families based on the degree of similarity in amino acid sequence. Members of a family are usually identical across 25% or more of their sequences, and proteins in these families generally share at least some structural and functional character-istics. Some families are defined, however, by identities involving only a few amino acid residues that are critical to a certain function. A number of similar substructures, or “domains” (to be defined more fully in Chapter 4), occur in many functionally unrelated proteins. These domains often fold into structural configurations that have an unusual degree of stability or that are special-ized for a certain environment. Evolutionary relation-ships can also be inferred from the structural and func-tional similarities within protein families. Certain amino acid sequences serve as signals that determine the cellular location, chemical modification, and half-life of a protein. Special signal sequences, usu-ally at the amino terminus, are used to target certain proteins for export from the cell; other proteins are targeted for distribution to the nucleus, the cell surface, the cytosol, or other cellular locations. Other sequences act as attachment sites for prosthetic groups, such as sugar groups in glycoproteins and lipids in lipoproteins. Some of these signals are well characterized and are easily recognized in the sequence of a newly character-ized protein (Chapter 27).
KEY CONVENTION: Much of the functional information encapsulated in protein sequences comes in the form of consensus sequences. This term is applied to such sequences in DNA, RNA, or protein. When a series of related nucleic acid or protein sequences are compared, a consensus sequence is the one that reflects the most common base or amino acid at each position. Parts of the sequence that have particularly good agreement often represent evolutionarily conserved functional domains. A range of mathematical tools available on the Internet can be used to generate consensus sequences or identify them in sequence databases. Box 3–2 illustrates com-mon conventions for displaying consensus sequences. ■
Protein Sequences Can Elucidate the History of Life on EarthThe simple string of letters denoting the amino acid sequence of a protein holds a surprising wealth of infor-mation. As more protein sequences have become avail-able, the development of more powerful methods for extracting information from them has become a major biochemical enterprise. Analysis of the information available in the many, ever-expanding biological data-bases, including gene and protein sequences and mac-romolecular structures, has given rise to the new field of bioinformatics. One outcome of this discipline is a growing suite of computer programs, many readily avail-able on the Internet, that can be used by any scientist,
Incomplete reaction at one stage can lead to formation of an impurity (in the form of a shorter peptide) in the next. The chemistry has been optimized to permit the synthesis of proteins of 100 amino acid residues in a few days in reasonable yield. A very similar approach is used to synthesize nucleic acids (see Fig. 8–35). It is worth noting that this technology, impressive as it is, still pales when compared with biological processes. The same 100-residue protein would be synthesized with exqui-site fidelity in about 5 seconds in a bacterial cell. A variety of new methods for the efficient ligation (joining together) of peptides has made possible the assembly of synthetic peptides into larger polypeptides and proteins. With these methods, novel forms of proteins can be created with precisely positioned chemical groups, including those that might not normally be found in a cel-lular protein. These novel forms provide new ways to test theories of enzyme catalysis, to create proteins with new chemical properties, and to design protein sequences that will fold into particular structures. This last application provides the ultimate test of our increasing ability to relate the primary structure of a peptide to the three-dimensional structure that it takes up in solution.
Amino Acid Sequences Provide Important Biochemical InformationKnowledge of the sequence of amino acids in a protein can offer insights into its three-dimensional structure and its function, cellular location, and evolution. Most of these insights are derived by searching for similarities between a protein of interest and previously studied proteins. Thousands of sequences are known and avail-able in databases accessible through the Internet. A comparison of a newly obtained sequence with this large bank of stored sequences often reveals relation-ships both surprising and enlightening. Exactly how the amino acid sequence determines three-dimensional structure is not understood in detail, nor can we always predict function from sequence. However, protein families that have some shared struc-tural or functional features can be readily identified on
Overall yield of fi nal peptide (%) when the
Number of residues in yield of each step is:
the final polypeptide 96.0% 99.8% 11 66 98
21 44 96
31 29 94
51 13 90
100 1.8 82
TABLE 3–7 Effect of Stepwise Yield on Overall Yield in Peptide Synthesis
c03AminoAcidsPeptidesAndProteins.indd Page 104 11/08/12 12:48 PM user-F408 /Users/user-F408/Desktop
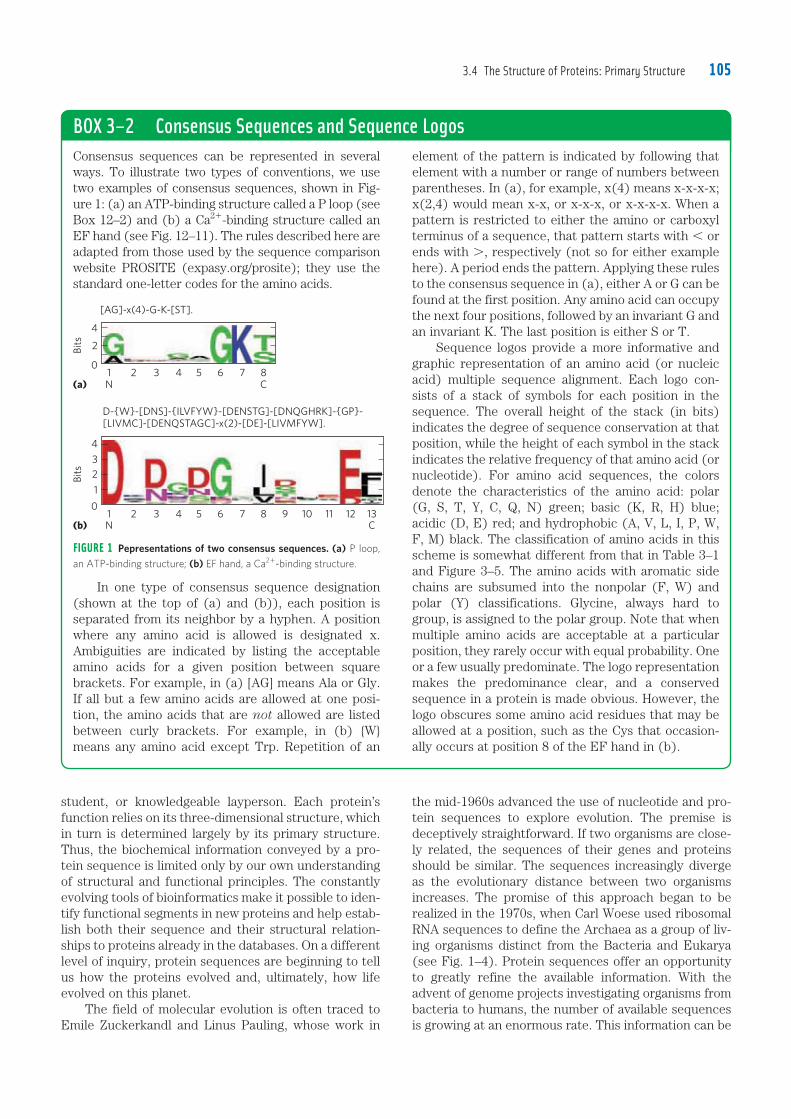
3.4 The Structure of Proteins: Primary Structure 105
the mid-1960s advanced the use of nucleotide and pro-tein sequences to explore evolution. The premise is deceptively straightforward. If two organisms are close-ly related, the sequences of their genes and proteins should be similar. The sequences increasingly diverge as the evolutionary distance between two organisms increases. The promise of this approach began to be realized in the 1970s, when Carl Woese used ribosomal RNA sequences to define the Archaea as a group of liv-ing organisms distinct from the Bacteria and Eukarya (see Fig. 1–4). Protein sequences offer an opportunity to greatly refine the available information. With the advent of genome projects investigating organisms from bacteria to humans, the number of available sequences is growing at an enormous rate. This information can be
student, or knowledgeable layperson. Each protein’s function relies on its three-dimensional structure, which in turn is determined largely by its primary structure. Thus, the biochemical information conveyed by a pro-tein sequence is limited only by our own understanding of structural and functional principles. The constantly evolving tools of bioinformatics make it possible to iden-tify functional segments in new proteins and help estab-lish both their sequence and their structural relation-ships to proteins already in the databases. On a different level of inquiry, protein sequences are beginning to tell us how the proteins evolved and, ultimately, how life evolved on this planet. The field of molecular evolution is often traced to Emile Zuckerkandl and Linus Pauling, whose work in
BOX 3–2 Consensus Sequences and Sequence LogosConsensus sequences can be represented in several ways. To illustrate two types of conventions, we use two examples of consensus sequences, shown in Fig-ure 1: (a) an ATP-binding structure called a P loop (see Box 12–2) and (b) a Ca2�-binding structure called an EF hand (see Fig. 12–11). The rules described here are adapted from those used by the sequence comparison website PROSITE (expasy.org/prosite); they use the standard one-letter codes for the amino acids.
element of the pattern is indicated by following that element with a number or range of numbers between parentheses. In (a), for example, x(4) means x-x-x-x; x(2,4) would mean x-x, or x-x-x, or x-x-x-x. When a pattern is restricted to either the amino or carboxyl terminus of a sequence, that pattern starts with , or ends with ., respectively (not so for either example here). A period ends the pattern. Applying these rules to the consensus sequence in (a), either A or G can be found at the first position. Any amino acid can occupy the next four positions, followed by an invariant G and an invariant K. The last position is either S or T. Sequence logos provide a more informative and graphic representation of an amino acid (or nucleic acid) multiple sequence alignment. Each logo con-sists of a stack of symbols for each position in the sequence. The overall height of the stack (in bits) indicates the degree of sequence conservation at that position, while the height of each symbol in the stack indicates the relative frequency of that amino acid (or nucleotide). For amino acid sequences, the colors denote the characteristics of the amino acid: polar (G, S, T, Y, C, Q, N) green; basic (K, R, H) blue; acidic (D, E) red; and hydrophobic (A, V, L, I, P, W, F, M) black. The classification of amino acids in this scheme is somewhat different from that in Table 3–1 and Figure 3–5. The amino acids with aromatic side chains are subsumed into the nonpolar (F, W) and polar (Y) classifications. Glycine, always hard to group, is assigned to the polar group. Note that when multiple amino acids are acceptable at a particular position, they rarely occur with equal probability. One or a few usually predominate. The logo representation makes the predominance clear, and a conserved sequence in a protein is made obvious. However, the logo obscures some amino acid residues that may be allowed at a position, such as the Cys that occasion-ally occurs at position 8 of the EF hand in (b).
FIGURE 1 Pepresentations of two consensus sequences. (a) P loop,
an ATP-binding structure; (b) EF hand, a Ca2�-binding structure.
(a)
D-{W}-[DNS]-{ILVFYW}-[DENSTG]-[DNQGHRK]-{GP}-
[LIVMC]-[DENQSTAGC]-x(2)-[DE]-[LIVMFYW].
[AG]-x(4)-G-K-[ST].
(b)4 5 6 7 8 9 10 11 12 1321
CN3
4
3
1
0
2
Bit
s
4 5 6 7 8C
21N
3
4
0
2Bit
s
In one type of consensus sequence designation (shown at the top of (a) and (b)), each position is separated from its neighbor by a hyphen. A position where any amino acid is allowed is designated x. Ambiguities are indicated by listing the acceptable amino acids for a given position between square brackets. For example, in (a) [AG] means Ala or Gly. If all but a few amino acids are allowed at one posi-tion, the amino acids that are not allowed are listed between curly brackets. For example, in (b) {W} means any amino acid except Trp. Repetition of an
c03AminoAcidsPeptidesAndProteins.indd Page 105 11/08/12 12:48 PM user-F408 /Users/user-F408/Desktop
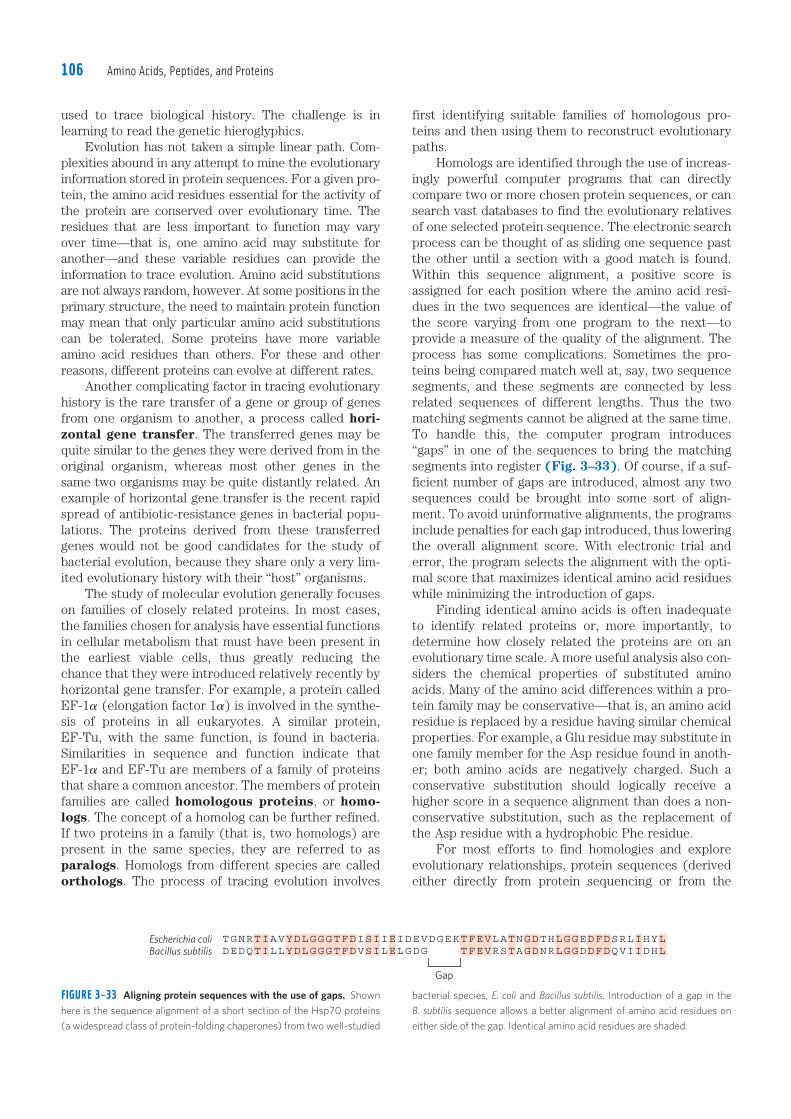
Amino Acids, Peptides, and Proteins106
first identifying suitable families of homologous pro-teins and then using them to reconstruct evolutionary paths. Homologs are identified through the use of increas-ingly powerful computer programs that can directly compare two or more chosen protein sequences, or can search vast databases to find the evolutionary relatives of one selected protein sequence. The electronic search process can be thought of as sliding one sequence past the other until a section with a good match is found. Within this sequence alignment, a positive score is assigned for each position where the amino acid resi-dues in the two sequences are identical—the value of the score varying from one program to the next—to provide a measure of the quality of the alignment. The process has some complications. Sometimes the pro-teins being compared match well at, say, two sequence segments, and these segments are connected by less related sequences of different lengths. Thus the two matching segments cannot be aligned at the same time. To handle this, the computer program introduces “gaps” in one of the sequences to bring the matching segments into register (Fig. 3–33). Of course, if a suf-ficient number of gaps are introduced, almost any two sequences could be brought into some sort of align-ment. To avoid uninformative alignments, the programs include penalties for each gap introduced, thus lowering the overall alignment score. With electronic trial and error, the program selects the alignment with the opti-mal score that maximizes identical amino acid residues while minimizing the introduction of gaps. Finding identical amino acids is often inadequate to identify related proteins or, more importantly, to determine how closely related the proteins are on an evolutionary time scale. A more useful analysis also con-siders the chemical properties of substituted amino acids. Many of the amino acid differences within a pro-tein family may be conservative—that is, an amino acid residue is replaced by a residue having similar chemical properties. For example, a Glu residue may substitute in one family member for the Asp residue found in anoth-er; both amino acids are negatively charged. Such a conservative substitution should logically receive a higher score in a sequence alignment than does a non-conservative substitution, such as the replacement of the Asp residue with a hydrophobic Phe residue. For most efforts to find homologies and explore evolutionary relationships, protein sequences (derived either directly from protein sequencing or from the
used to trace biological history. The challenge is in learning to read the genetic hieroglyphics. Evolution has not taken a simple linear path. Com-plexities abound in any attempt to mine the evolutionary information stored in protein sequences. For a given pro-tein, the amino acid residues essential for the activity of the protein are conserved over evolutionary time. The residues that are less important to function may vary over time—that is, one amino acid may substitute for another—and these variable residues can provide the information to trace evolution. Amino acid substitutions are not always random, however. At some positions in the primary structure, the need to maintain protein function may mean that only particular amino acid substitutions can be tolerated. Some proteins have more variable amino acid residues than others. For these and other reasons, different proteins can evolve at different rates. Another complicating factor in tracing evolutionary history is the rare transfer of a gene or group of genes from one organism to another, a process called hori-zontal gene transfer. The transferred genes may be quite similar to the genes they were derived from in the original organism, whereas most other genes in the same two organisms may be quite distantly related. An example of horizontal gene transfer is the recent rapid spread of antibiotic-resistance genes in bacterial popu-lations. The proteins derived from these transferred genes would not be good candidates for the study of bacterial evolution, because they share only a very lim-ited evolutionary history with their “host” organisms. The study of molecular evolution generally focuses on families of closely related proteins. In most cases, the families chosen for analysis have essential functions in cellular metabolism that must have been present in the earliest viable cells, thus greatly reducing the chance that they were introduced relatively recently by horizontal gene transfer. For example, a protein called EF-1� (elongation factor 1�) is involved in the synthe-sis of proteins in all eukaryotes. A similar protein, EF-Tu, with the same function, is found in bacteria. Similarities in sequence and function indicate that EF-1� and EF-Tu are members of a family of proteins that share a common ancestor. The members of protein families are called homologous proteins, or homo-logs. The concept of a homolog can be further refined. If two proteins in a family (that is, two homologs) are present in the same species, they are referred to as paralogs. Homologs from different species are called orthologs. The process of tracing evolution involves
FIGURE 3–33 Aligning protein sequences with the use of gaps. Shown
here is the sequence alignment of a short section of the Hsp70 proteins
(a widespread class of protein-folding chaperones) from two well-studied
bacterial species, E. coli and Bacillus subtilis. Introduction of a gap in the
B. subtilis sequence allows a better alignment of amino acid residues on
either side of the gap. Identical amino acid residues are shaded.
Escherichia coliBacillus subtilis
Gap
c03AminoAcidsPeptidesAndProteins.indd Page 106 11/08/12 12:48 PM user-F408 /Users/user-F408/Desktop
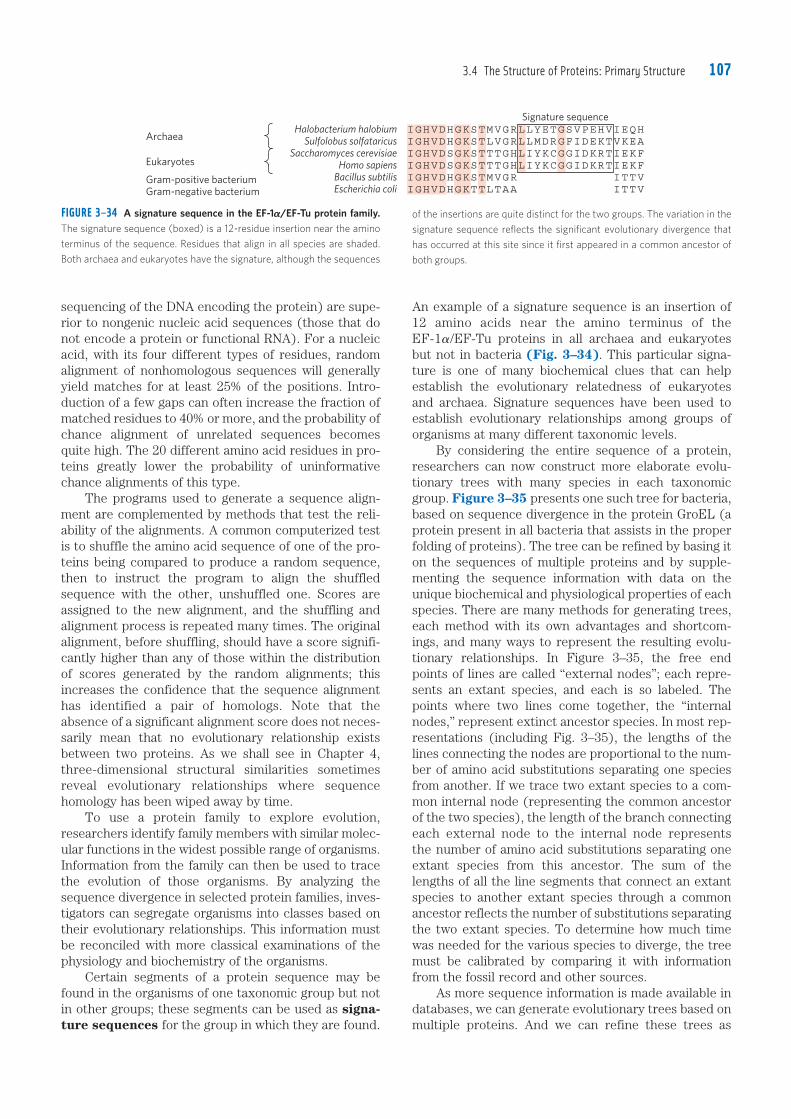
3.4 The Structure of Proteins: Primary Structure 107
An example of a signature sequence is an insertion of 12 amino acids near the amino terminus of the EF-1�/EF-Tu proteins in all archaea and eukaryotes but not in bacteria (Fig. 3–34). This particular signa-ture is one of many biochemical clues that can help establish the evolutionary relatedness of eukaryotes and archaea. Signature sequences have been used to establish evolutionary relationships among groups of organisms at many different taxonomic levels. By considering the entire sequence of a protein, researchers can now construct more elaborate evolu-tionary trees with many species in each taxonomic group. Figure 3–35 presents one such tree for bacteria, based on sequence divergence in the protein GroEL (a protein present in all bacteria that assists in the proper folding of proteins). The tree can be refined by basing it on the sequences of multiple proteins and by supple-menting the sequence information with data on the unique biochemical and physiological properties of each species. There are many methods for generating trees, each method with its own advantages and shortcom-ings, and many ways to represent the resulting evolu-tionary relationships. In Figure 3–35, the free end points of lines are called “external nodes”; each repre-sents an extant species, and each is so labeled. The points where two lines come together, the “internal nodes,” represent extinct ancestor species. In most rep-resentations (including Fig. 3–35), the lengths of the lines connecting the nodes are proportional to the num-ber of amino acid substitutions separating one species from another. If we trace two extant species to a com-mon internal node (representing the common ancestor of the two species), the length of the branch connecting each external node to the internal node represents the number of amino acid substitutions separating one extant species from this ancestor. The sum of the lengths of all the line segments that connect an extant species to another extant species through a common ancestor reflects the number of substitutions separating the two extant species. To determine how much time was needed for the various species to diverge, the tree must be calibrated by comparing it with information from the fossil record and other sources. As more sequence information is made available in databases, we can generate evolutionary trees based on multiple proteins. And we can refine these trees as
sequencing of the DNA encoding the protein) are supe-rior to nongenic nucleic acid sequences (those that do not encode a protein or functional RNA). For a nucleic acid, with its four different types of residues, random alignment of nonhomologous sequences will generally yield matches for at least 25% of the positions. Intro-duction of a few gaps can often increase the fraction of matched residues to 40% or more, and the probability of chance alignment of unrelated sequences becomes quite high. The 20 different amino acid residues in pro-teins greatly lower the probability of uninformative chance alignments of this type. The programs used to generate a sequence align-ment are complemented by methods that test the reli-ability of the alignments. A common computerized test is to shuffle the amino acid sequence of one of the pro-teins being compared to produce a random sequence, then to instruct the program to align the shuffled sequence with the other, unshuffled one. Scores are assigned to the new alignment, and the shuffling and alignment process is repeated many times. The original alignment, before shuffling, should have a score signifi-cantly higher than any of those within the distribution of scores generated by the random alignments; this increases the confidence that the sequence alignment has identified a pair of homologs. Note that the absence of a significant alignment score does not neces-sarily mean that no evolutionary relationship exists between two proteins. As we shall see in Chapter 4, three-dimensional structural similarities sometimes reveal evolutionary relationships where sequence homology has been wiped away by time. To use a protein family to explore evolution, researchers identify family members with similar molec-ular functions in the widest possible range of organisms. Information from the family can then be used to trace the evolution of those organisms. By analyzing the sequence divergence in selected protein families, inves-tigators can segregate organisms into classes based on their evolutionary relationships. This information must be reconciled with more classical examinations of the physiology and biochemistry of the organisms. Certain segments of a protein sequence may be found in the organisms of one taxonomic group but not in other groups; these segments can be used as signa-ture sequences for the group in which they are found.
FIGURE 3–34 A signature sequence in the EF-1�/EF-Tu protein family. The signature sequence (boxed) is a 12-residue insertion near the amino
terminus of the sequence. Residues that align in all species are shaded.
Both archaea and eukaryotes have the signature, although the sequences
Halobacterium halobiumSulfolobus solfataricus
Saccharomyces cerevisiaeHomo sapiens
Bacillus subtilisEscherichia coli
Archaea
Eukaryotes
Gram-positive bacterium
Gram-negative bacterium
Signature sequence
of the insertions are quite distinct for the two groups. The variation in the
signature sequence reflects the significant evolutionary divergence that
has occurred at this site since it first appeared in a common ancestor of
both groups.
c03AminoAcidsPeptidesAndProteins.indd Page 107 11/08/12 12:48 PM user-F408 /Users/user-F408/Desktop
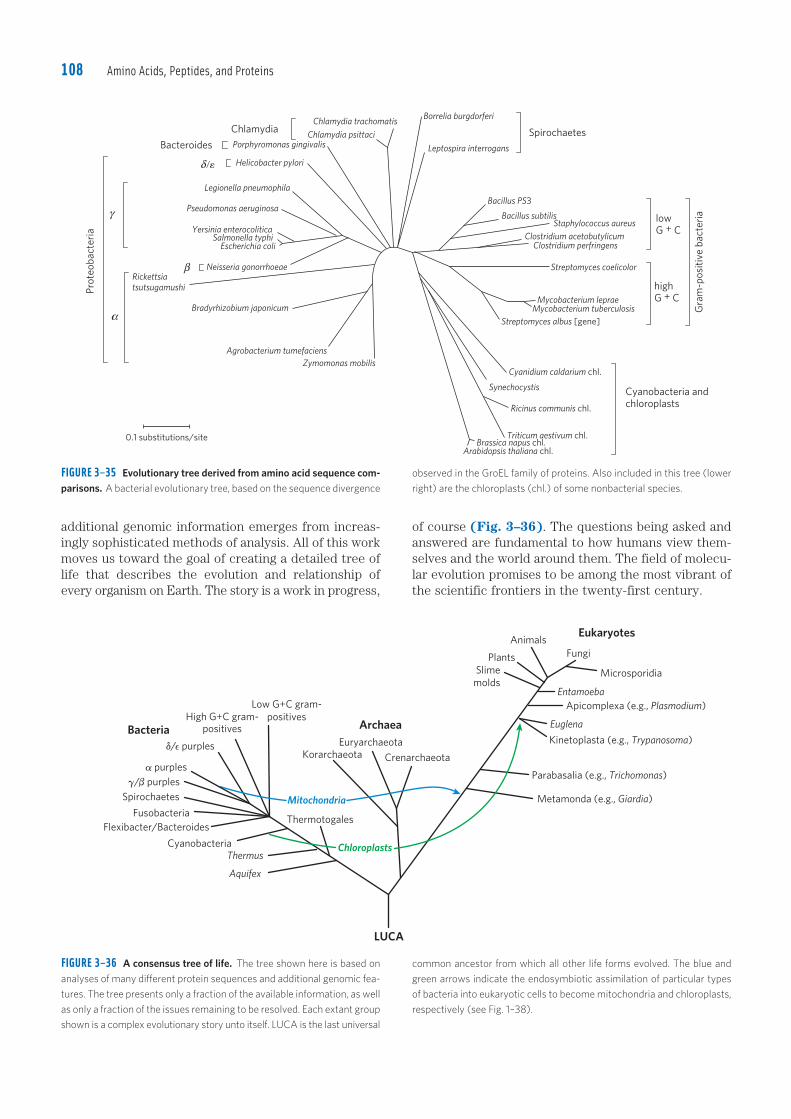
Amino Acids, Peptides, and Proteins108
of course (Fig. 3–36). The questions being asked and answered are fundamental to how humans view them-selves and the world around them. The field of molecu-lar evolution promises to be among the most vibrant of the scientific frontiers in the twenty-first century.
additional genomic information emerges from increas-ingly sophisticated methods of analysis. All of this work moves us toward the goal of creating a detailed tree of life that describes the evolution and relationship of every organism on Earth. The story is a work in progress,
Euryarchaeota
Crenarchaeota
Chloroplasts
Mitochondria
Thermotogales
Metamonda (e.g., Giardia)
Parabasalia (e.g., Trichomonas)
Kinetoplasta (e.g., Trypanosoma)
Apicomplexa (e.g., Plasmodium)
Euglena
Entamoeba
Microsporidia
Fungi
Animals
Plants
Slime
molds
Korarchaeota
Low G+C gram-
positivesHigh G+C gram-
positives
d/e purples
a purples
Spirochaetes
Fusobacteria
Flexibacter/Bacteroides
Cyanobacteria
Thermus
Aquifex
g/b purples
Eukaryotes
Archaea
LUCA
Bacteria
FIGURE 3–36 A consensus tree of life. The tree shown here is based on
analyses of many different protein sequences and additional genomic fea-
tures. The tree presents only a fraction of the available information, as well
as only a fraction of the issues remaining to be resolved. Each extant group
shown is a complex evolutionary story unto itself. LUCA is the last universal
common ancestor from which all other life forms evolved. The blue and
green arrows indicate the endosymbiotic assimilation of particular types
of bacteria into eukaryotic cells to become mitochondria and chloroplasts,
respectively (see Fig. 1–38).
Leptospira interrogans
Borrelia burgdorferi
Spirochaetes
Bacillus PS3
Bacillus subtilisStaphylococcus aureus
Clostridium acetobutylicumClostridium perfringens
Streptomyces albus [gene]
Streptomyces coelicolor
Mycobacterium lepraeMycobacterium tuberculosis
lowG + C
highG + C
Gra
m-p
ositi
ve b
acte
ria
Cyanobacteria andchloroplasts
Cyanidium caldarium chl.
Synechocystis
Ricinus communis chl.
Triticum aestivum chl.Brassica napus chl.
Arabidopsis thaliana chl.
Zymomonas mobilis
Agrobacterium tumefaciens
0.1 substitutions/site
Bradyrhizobium japonicum
Rickettsia
tsutsugamushi
Neisseria gonorrhoeae
Yersinia enterocoliticaSalmonella typhi
Escherichia coli
Pseudomonas aeruginosa
Legionella pneumophila
Helicobacter pylori
Porphyromonas gingivalis
Chlamydia trachomatis
Chlamydia psittaciChlamydia
Bacteroides
Prot
eoba
cter
ia
g
a
b
d��
FIGURE 3–35 Evolutionary tree derived from amino acid sequence com-parisons. A bacterial evolutionary tree, based on the sequence divergence
observed in the GroEL family of proteins. Also included in this tree (lower
right) are the chloroplasts (chl.) of some nonbacterial species.
c03AminoAcidsPeptidesAndProteins.indd Page 108 11/08/12 12:48 PM user-F408 /Users/user-F408/Desktop
109Further Reading
Further Reading
Amino AcidsDougherty, D.A. (2000) Unnatural amino acids as probes of protein structure and function. Curr. Opin. Chem. Biol. 4, 645–652.
Kreil, G. (1997) D-Amino acids in animal peptides. Annu. Rev. Biochem. 66, 337–345.
Details the occurrence of these unusual stereoisomers of amino acids.
Meister, A. (1965) Biochemistry of the Amino Acids, 2nd edn, Vols 1 and 2, Academic Press, Inc., New York.
Encyclopedic treatment of the properties, occurrence, and metabolism of amino acids.
Peptides and ProteinsCreighton, T.E. (1992) Proteins: Structures and Molecular Properties, 2nd edn, W. H. Freeman and Company, New York.
Very useful general source.
Working with ProteinsDunn, M.J. & Corbett, J.M. (1996) Two-dimensional polyacrylamide gel electrophoresis. Methods Enzymol. 271, 177–203.
A detailed description of the technology.
Kornberg, A. (1990) Why purify enzymes? Methods Enzymol. 182, 1–5.
The critical role of classical biochemical methods in a new age.
Scopes, R.K. (1994) Protein Purification: Principles and Practice, 3rd edn, Springer-Verlag, New York.
A good source for more complete descriptions of the principles underlying chromatography and other methods.
Protein Primary Structure and EvolutionAndersson, L., Blomberg, L., Flegel, M., Lepsa, L., Nilsson, B., & Verlander, M. (2000) Large-scale synthesis of peptides. Biopolymers 55, 227–250.
A discussion of approaches to manufacturing peptides as pharmaceuticals.
Dell, A. & Morris, H.R. (2001) Glycoprotein structure determination by mass spectrometry. Science 291, 2351–2356.
Glycoproteins can be complex; mass spectrometry is a preferred method for sorting things out.
Delsuc, F., Brinkmann, H., & Philippe, H. (2005) Phylogenomics and the reconstruction of the tree of life. Nat. Rev. Genet. 6, 361–375.
Gogarten, J.P. & Townsend, J.P. (2005) Horizontal gene transfer, genome innovation and evolution. Nat. Rev. Microbiol. 3, 679–687.
Gygi, S.P. & Aebersold, R. (2000) Mass spectrometry and proteomics. Curr. Opin. Chem. Biol. 4, 489–494.
Uses of mass spectrometry to identify and study cellular proteins.
Koonin, E.V., Tatusov, R.L., & Galperin, M.Y. (1998) Beyond complete genomes: from sequence to structure and function. Curr. Opin. Struct. Biol. 8, 355–363.
A good discussion about the possible uses of the increasing amount of information on protein sequences.
Li, W.-H. & Graur, D. (2000) Fundamentals of Molecular Evolution, 2nd edn, Sinauer Associates, Inc., Sunderland, MA.
A very readable text describing methods used to analyze protein and nucleic acid sequences. Chapter 5 provides one of the best
SUMMARY 3.4 The Structure of Proteins: Primary Structure� Differences in protein function result from
differences in amino acid composition and sequence. Some variations in sequence may occur in a particular protein, with little or no effect on its function.
� Amino acid sequences are deduced by fragmenting polypeptides into smaller peptides with reagents known to cleave specific peptide bonds; determining the amino acid sequence of each fragment by the automated Edman degradation procedure; then ordering the peptide fragments by finding sequence overlaps between fragments generated by different reagents. A protein sequence can also be deduced from the nucleotide sequence of its corresponding gene in DNA, or by mass spectrometry.
� Short proteins and peptides (up to about 100 residues) can be chemically synthesized. The peptide is built up, one amino acid residue at a time, while tethered to a solid support.
� Protein sequences are a rich source of information about protein structure and function, as well as the evolution of life on Earth. Sophisticated methods are being developed to trace evolution by analyzing the resultant slow changes in amino acid sequences of homologous proteins.
amino acids 76residue 76R group 76chiral center 76enantiomers 76absolute configuration 78D, L system 78polarity 78absorbance, A 80zwitterion 81isoelectric pH (isoelectric
point, pI) 84peptide 85protein 85peptide bond 85oligopeptide 86polypeptide 86oligomeric protein 88protomer 88conjugated protein 89prosthetic group 89crude extract 89fraction 89
fractionation 89dialysis 90column chromatography 90ion-exchange
chromatography 90size-exclusion
chromatography 92affinity chromatography 92high-performance liquid
chromatography (HPLC) 92
electrophoresis 92sodium dodecyl sulfate
(SDS) 94isoelectric focusing 94specific activity 95primary structure 97secondary structure 97tertiary structure 97quaternary structure 97Edman degradation 98proteases 99MALDI MS 101
Key Terms
Terms in bold are defined in the glossary.
ESI MS 101consensus sequence 104bioinformatics 104horizontal gene
transfer 106
homologous proteins 106homologs 106paralogs 106orthologs 106signature sequence 107
c03AminoAcidsPeptidesAndProteins.indd Page 109 28/08/12 6:10 PM user-F408 /Users/user-F408/Desktop
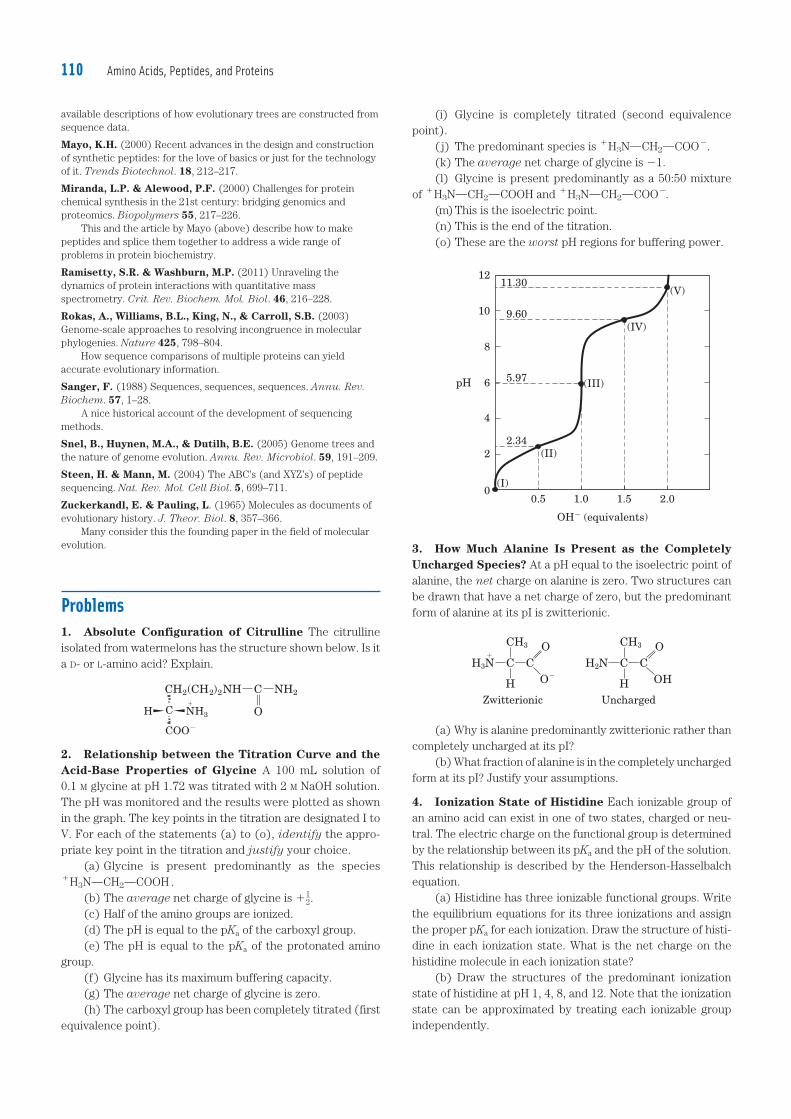
Amino Acids, Peptides, and Proteins110
(i) Glycine is completely titrated (second equivalence point).
( j) The predominant species is 1H3NOCH2OCOO2.(k) The average net charge of glycine is 21.(l) Glycine is present predominantly as a 50:50 mixture
of 1H3NOCH2OCOOH and 1H3NOCH2OCOO2.(m) This is the isoelectric point.(n) This is the end of the titration.(o) These are the worst pH regions for buffering power.
11.30(V)
9.60(IV)
(III)
2.34
(I)
(II)
5.97
12
2
4
6
8
00.5
OH� (equivalents)
pH
1.0 1.5 2.0
10
3. How Much Alanine Is Present as the Completely Uncharged Species? At a pH equal to the isoelectric point of alanine, the net charge on alanine is zero. Two structures can be drawn that have a net charge of zero, but the predominant form of alanine at its pI is zwitterionic.
�C
CH3
H3N
H
CO
O�
Zwitterionic Uncharged
C
CH3
H2N
H
CO
OH
(a) Why is alanine predominantly zwitterionic rather than completely uncharged at its pI?
(b) What fraction of alanine is in the completely uncharged form at its pI? Justify your assumptions.
4. Ionization State of Histidine Each ionizable group of an amino acid can exist in one of two states, charged or neu-tral. The electric charge on the functional group is determined by the relationship between its pKa and the pH of the solution. This relationship is described by the Henderson-Hasselbalch equation.
(a) Histidine has three ionizable functional groups. Write the equilibrium equations for its three ionizations and assign the proper pKa for each ionization. Draw the structure of histi-dine in each ionization state. What is the net charge on the histidine molecule in each ionization state?
(b) Draw the structures of the predominant ionization state of histidine at pH 1, 4, 8, and 12. Note that the ionization state can be approximated by treating each ionizable group independently.
available descriptions of how evolutionary trees are constructed from sequence data.
Mayo, K.H. (2000) Recent advances in the design and construction of synthetic peptides: for the love of basics or just for the technology of it. Trends Biotechnol. 18, 212–217.
Miranda, L.P. & Alewood, P.F. (2000) Challenges for protein chemical synthesis in the 21st century: bridging genomics and proteomics. Biopolymers 55, 217–226.
This and the article by Mayo (above) describe how to make peptides and splice them together to address a wide range of problems in protein biochemistry.
Ramisetty, S.R. & Washburn, M.P. (2011) Unraveling the dynamics of protein interactions with quantitative mass spectrometry. Crit. Rev. Biochem. Mol. Biol. 46, 216–228.
Rokas, A., Williams, B.L., King, N., & Carroll, S.B. (2003) Genome-scale approaches to resolving incongruence in molecular phylogenies. Nature 425, 798–804.
How sequence comparisons of multiple proteins can yield accurate evolutionary information.
Sanger, F. (1988) Sequences, sequences, sequences. Annu. Rev. Biochem. 57, 1–28.
A nice historical account of the development of sequencing methods.
Snel, B., Huynen, M.A., & Dutilh, B.E. (2005) Genome trees and the nature of genome evolution. Annu. Rev. Microbiol. 59, 191–209.
Steen, H. & Mann, M. (2004) The ABC’s (and XYZ’s) of peptide sequencing. Nat. Rev. Mol. Cell Biol. 5, 699–711.
Zuckerkandl, E. & Pauling, L. (1965) Molecules as documents of evolutionary history. J. Theor. Biol. 8, 357–366.
Many consider this the founding paper in the field of molecular evolution.
Problems
1. Absolute Configuration of Citrulline The citrulline isolated from watermelons has the structure shown below. Is it a D- or L-amino acid? Explain.
C C
O
)H (CH NH2 NH22 2
P
H C N�
H3
COO�
2. Relationship between the Titration Curve and the Acid-Base Properties of Glycine A 100 mL solution of 0.1 M glycine at pH 1.72 was titrated with 2 M NaOH solution. The pH was monitored and the results were plotted as shown in the graph. The key points in the titration are designated I to V. For each of the statements (a) to (o), identify the appro-priate key point in the titration and justify your choice.
(a) Glycine is present predominantly as the species 1H3NOCH2OCOOH .
(b) The average net charge of glycine is 112.
(c) Half of the amino groups are ionized.(d) The pH is equal to the pKa of the carboxyl group.(e) The pH is equal to the pKa of the protonated amino
group.(f) Glycine has its maximum buffering capacity.(g) The average net charge of glycine is zero.(h) The carboxyl group has been completely titrated (first
equivalence point).
c03AminoAcidsPeptidesAndProteins.indd Page 110 11/08/12 12:48 PM user-F408 /Users/user-F408/Desktop
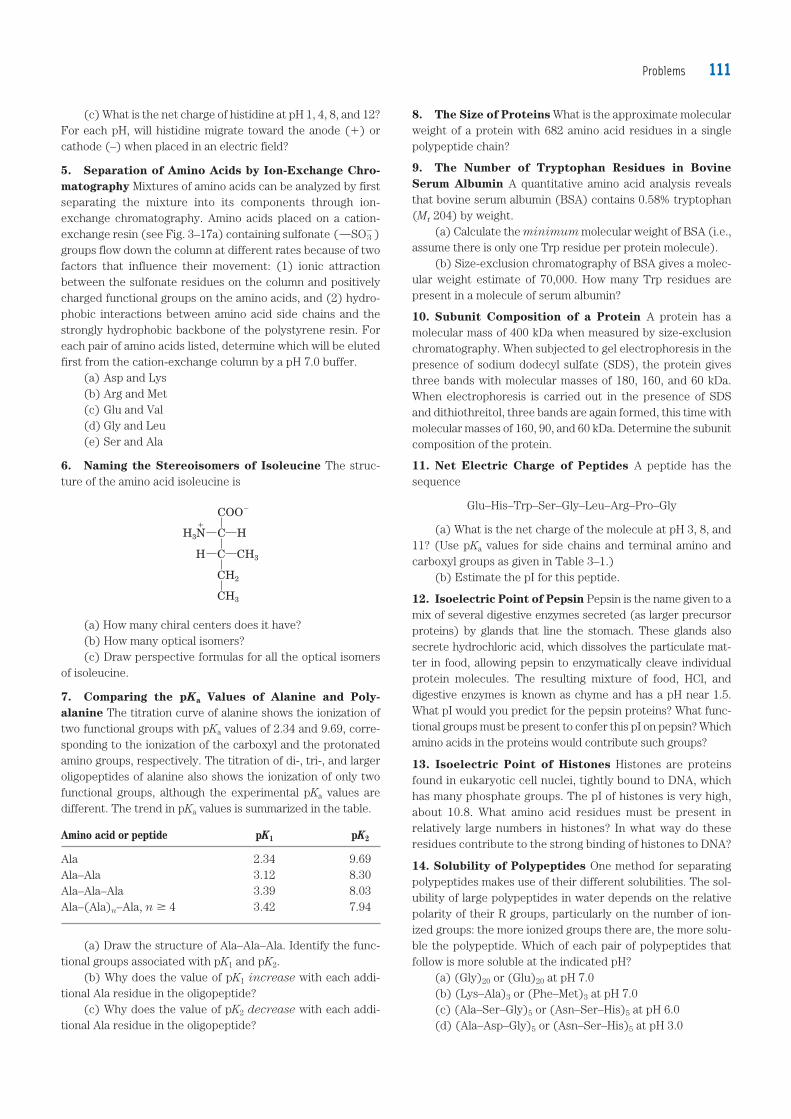
111Problems
8. The Size of Proteins What is the approximate molecular weight of a protein with 682 amino acid residues in a single polypeptide chain?
9. The Number of Tryptophan Residues in Bovine Serum Albumin A quantitative amino acid analysis reveals that bovine serum albumin (BSA) contains 0.58% tryptophan (Mr 204) by weight.
(a) Calculate the minimum molecular weight of BSA (i.e., assume there is only one Trp residue per protein molecule).
(b) Size-exclusion chromatography of BSA gives a molec-ular weight estimate of 70,000. How many Trp residues are present in a molecule of serum albumin?
10. Subunit Composition of a Protein A protein has a molecular mass of 400 kDa when measured by size-exclusion chromatography. When subjected to gel electrophoresis in the presence of sodium dodecyl sulfate (SDS), the protein gives three bands with molecular masses of 180, 160, and 60 kDa. When electrophoresis is carried out in the presence of SDS and dithiothreitol, three bands are again formed, this time with molecular masses of 160, 90, and 60 kDa. Determine the subunit composition of the protein.
11. Net Electric Charge of Peptides A peptide has the sequence
Glu–His–Trp–Ser–Gly–Leu–Arg–Pro–Gly
(a) What is the net charge of the molecule at pH 3, 8, and 11? (Use pKa values for side chains and terminal amino and carboxyl groups as given in Table 3–1.)
(b) Estimate the pI for this peptide.
12. Isoelectric Point of Pepsin Pepsin is the name given to a mix of several digestive enzymes secreted (as larger precursor proteins) by glands that line the stomach. These glands also secrete hydrochloric acid, which dissolves the particulate mat-ter in food, allowing pepsin to enzymatically cleave individual protein molecules. The resulting mixture of food, HCl, and digestive enzymes is known as chyme and has a pH near 1.5. What pI would you predict for the pepsin proteins? What func-tional groups must be present to confer this pI on pepsin? Which amino acids in the proteins would contribute such groups?
13. Isoelectric Point of Histones Histones are proteins found in eukaryotic cell nuclei, tightly bound to DNA, which has many phosphate groups. The pI of histones is very high, about 10.8. What amino acid residues must be present in relatively large numbers in histones? In what way do these residues contribute to the strong binding of histones to DNA?
14. Solubility of Polypeptides One method for separating polypeptides makes use of their different solubilities. The sol-ubility of large polypeptides in water depends on the relative polarity of their R groups, particularly on the number of ion-ized groups: the more ionized groups there are, the more solu-ble the polypeptide. Which of each pair of polypeptides that follow is more soluble at the indicated pH?
(a) (Gly)20 or (Glu)20 at pH 7.0(b) (Lys–Ala)3 or (Phe–Met)3 at pH 7.0(c) (Ala–Ser–Gly)5 or (Asn–Ser–His)5 at pH 6.0(d) (Ala–Asp–Gly)5 or (Asn–Ser–His)5 at pH 3.0
(c) What is the net charge of histidine at pH 1, 4, 8, and 12? For each pH, will histidine migrate toward the anode (1) or cathode (–) when placed in an electric field?
5. Separation of Amino Acids by Ion-Exchange Chro-matography Mixtures of amino acids can be analyzed by first separating the mixture into its components through ion-exchange chromatography. Amino acids placed on a cation-exchange resin (see Fig. 3–17a) containing sulfonate (OSO2
3 ) groups flow down the column at different rates because of two factors that influence their movement: (1) ionic attraction between the sulfonate residues on the column and positively charged functional groups on the amino acids, and (2) hydro-phobic interactions between amino acid side chains and the strongly hydrophobic backbone of the polystyrene resin. For each pair of amino acids listed, determine which will be eluted first from the cation-exchange column by a pH 7.0 buffer.
(a) Asp and Lys(b) Arg and Met(c) Glu and Val(d) Gly and Leu(e) Ser and Ala
6. Naming the Stereoisomers of Isoleucine The struc-ture of the amino acid isoleucine is
H C
H3NH
C
COO�
H
CH2
CH3
CH3
(a) How many chiral centers does it have?(b) How many optical isomers?(c) Draw perspective formulas for all the optical isomers
of isoleucine.
7. Comparing the pKa Values of Alanine and Poly-alanine The titration curve of alanine shows the ionization of two functional groups with pKa values of 2.34 and 9.69, corre-sponding to the ionization of the carboxyl and the protonated amino groups, respectively. The titration of di-, tri-, and larger oligopeptides of alanine also shows the ionization of only two functional groups, although the experimental pKa values are different. The trend in pKa values is summarized in the table.
Amino acid or peptide pK1 pK2
Ala 2.34 9.69Ala–Ala 3.12 8.30Ala–Ala–Ala 3.39 8.03Ala–(Ala)n–Ala, n $ 4 3.42 7.94
(a) Draw the structure of Ala–Ala–Ala. Identify the func-tional groups associated with pK1 and pK2.
(b) Why does the value of pK1 increase with each addi-tional Ala residue in the oligopeptide?
(c) Why does the value of pK2 decrease with each addi-tional Ala residue in the oligopeptide?
c03AminoAcidsPeptidesAndProteins.indd Page 111 11/08/12 12:48 PM user-F408 /Users/user-F408/Desktop
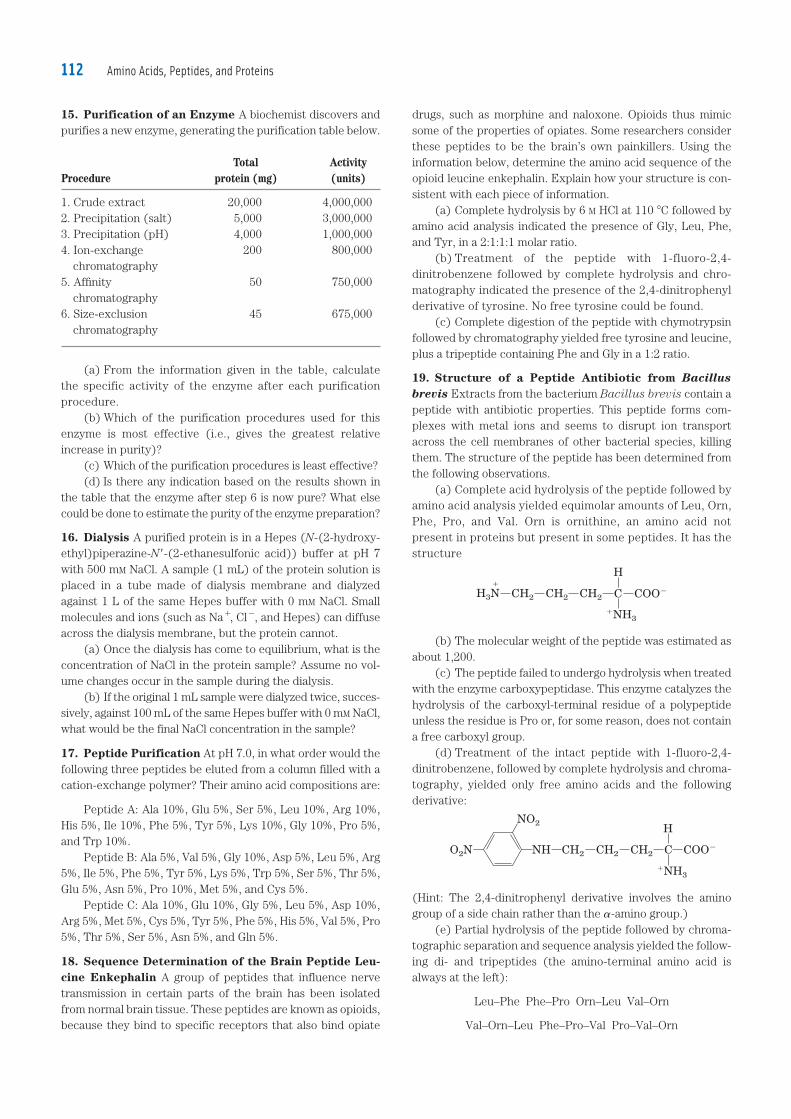
Amino Acids, Peptides, and Proteins112
drugs, such as morphine and naloxone. Opioids thus mimic some of the properties of opiates. Some researchers consider these peptides to be the brain’s own painkillers. Using the information below, determine the amino acid sequence of the opioid leucine enkephalin. Explain how your structure is con-sistent with each piece of information.
(a) Complete hydrolysis by 6 M HCl at 110 8C followed by amino acid analysis indicated the presence of Gly, Leu, Phe, and Tyr, in a 2:1:1:1 molar ratio.
(b) Treatment of the peptide with 1-fluoro-2,4-dinitrobenzene followed by complete hydrolysis and chro-matography indicated the presence of the 2,4-dinitrophenyl derivative of tyrosine. No free tyrosine could be found.
(c) Complete digestion of the peptide with chymotrypsin followed by chromatography yielded free tyrosine and leucine, plus a tripeptide containing Phe and Gly in a 1:2 ratio.
19. Structure of a Peptide Antibiotic from Bacillus brevis Extracts from the bacterium Bacillus brevis contain a peptide with antibiotic properties. This peptide forms com-plexes with metal ions and seems to disrupt ion transport across the cell membranes of other bacterial species, killing them. The structure of the peptide has been determined from the following observations.
(a) Complete acid hydrolysis of the peptide followed by amino acid analysis yielded equimolar amounts of Leu, Orn, Phe, Pro, and Val. Orn is ornithine, an amino acid not present in proteins but present in some peptides. It has the structure
CH2 CH2 CH2 C COO�H3N
H
�NH3
�
(b) The molecular weight of the peptide was estimated as about 1,200.
(c) The peptide failed to undergo hydrolysis when treated with the enzyme carboxypeptidase. This enzyme catalyzes the hydrolysis of the carboxyl-terminal residue of a polypeptide unless the residue is Pro or, for some reason, does not contain a free carboxyl group.
(d) Treatment of the intact peptide with 1-fluoro-2,4-dinitrobenzene, followed by complete hydrolysis and chroma-tography, yielded only free amino acids and the following derivative:
NO2
CH2 CH2
�NH3
O2N COO�CH2NH C
H
(Hint: The 2,4-dinitrophenyl derivative involves the amino group of a side chain rather than the �-amino group.)
(e) Partial hydrolysis of the peptide followed by chroma-tographic separation and sequence analysis yielded the follow-ing di- and tripeptides (the amino-terminal amino acid is always at the left):
Leu–Phe Phe–Pro Orn–Leu Val–Orn
Val–Orn–Leu Phe–Pro–Val Pro–Val–Orn
15. Purification of an Enzyme A biochemist discovers and purifies a new enzyme, generating the purification table below.
Total Activity Procedure protein (mg) (units)
1. Crude extract 20,000 4,000,0002. Precipitation (salt) 5,000 3,000,0003. Precipitation (pH) 4,000 1,000,0004. Ion-exchange 200 800,000 chromatography5. Affi nity 50 750,000 chromatography6. Size-exclusion 45 675,000 chromatography
(a) From the information given in the table, calculate the specific activity of the enzyme after each purification procedure.
(b) Which of the purification procedures used for this enzyme is most effective (i.e., gives the greatest relative increase in purity)?
(c) Which of the purification procedures is least effective?(d) Is there any indication based on the results shown in
the table that the enzyme after step 6 is now pure? What else could be done to estimate the purity of the enzyme preparation?
16. Dialysis A purified protein is in a Hepes (N-(2-hydroxy-ethyl)piperazine-N9-(2-ethanesulfonic acid)) buffer at pH 7 with 500 mM NaCl. A sample (1 mL) of the protein solution is placed in a tube made of dialysis membrane and dialyzed against 1 L of the same Hepes buffer with 0 mM NaCl. Small molecules and ions (such as Na1, Cl2, and Hepes) can diffuse across the dialysis membrane, but the protein cannot.
(a) Once the dialysis has come to equilibrium, what is the concentration of NaCl in the protein sample? Assume no vol-ume changes occur in the sample during the dialysis.
(b) If the original 1 mL sample were dialyzed twice, succes-sively, against 100 mL of the same Hepes buffer with 0 mM NaCl, what would be the final NaCl concentration in the sample?
17. Peptide Purification At pH 7.0, in what order would the following three peptides be eluted from a column filled with a cation-exchange polymer? Their amino acid compositions are:
Peptide A: Ala 10%, Glu 5%, Ser 5%, Leu 10%, Arg 10%, His 5%, Ile 10%, Phe 5%, Tyr 5%, Lys 10%, Gly 10%, Pro 5%, and Trp 10%. Peptide B: Ala 5%, Val 5%, Gly 10%, Asp 5%, Leu 5%, Arg 5%, Ile 5%, Phe 5%, Tyr 5%, Lys 5%, Trp 5%, Ser 5%, Thr 5%, Glu 5%, Asn 5%, Pro 10%, Met 5%, and Cys 5%. Peptide C: Ala 10%, Glu 10%, Gly 5%, Leu 5%, Asp 10%, Arg 5%, Met 5%, Cys 5%, Tyr 5%, Phe 5%, His 5%, Val 5%, Pro 5%, Thr 5%, Ser 5%, Asn 5%, and Gln 5%.
18. Sequence Determination of the Brain Peptide Leu-cine Enkephalin A group of peptides that influence nerve transmission in certain parts of the brain has been isolated from normal brain tissue. These peptides are known as opioids, because they bind to specific receptors that also bind opiate
c03AminoAcidsPeptidesAndProteins.indd Page 112 11/08/12 12:48 PM user-F408 /Users/user-F408/Desktop
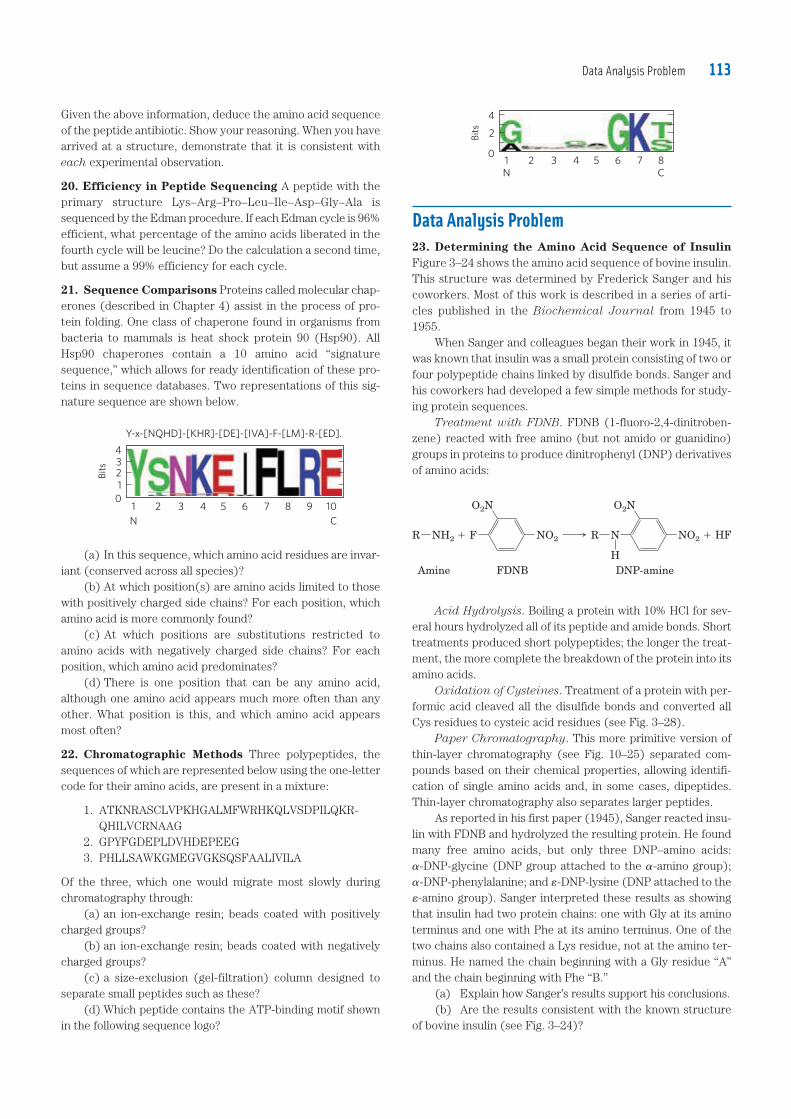
113Data Analysis Problem
4 5 6 7 8C
21N
3
4
0
2Bits
Data Analysis Problem
23. Determining the Amino Acid Sequence of Insulin Figure 3–24 shows the amino acid sequence of bovine insulin. This structure was determined by Frederick Sanger and his coworkers. Most of this work is described in a series of arti-cles published in the Biochemical Journal from 1945 to 1955.
When Sanger and colleagues began their work in 1945, it was known that insulin was a small protein consisting of two or four polypeptide chains linked by disulfide bonds. Sanger and his coworkers had developed a few simple methods for study-ing protein sequences.
Treatment with FDNB. FDNB (1-fluoro-2,4-dinitroben-zene) reacted with free amino (but not amido or guanidino) groups in proteins to produce dinitrophenyl (DNP) derivatives of amino acids:
� HF�
O2N
NO2N
H
RNH2R
O2N
NO2F
Amine FDNB DNP-amine
Acid Hydrolysis. Boiling a protein with 10% HCl for sev-eral hours hydrolyzed all of its peptide and amide bonds. Short treatments produced short polypeptides; the longer the treat-ment, the more complete the breakdown of the protein into its amino acids.
Oxidation of Cysteines. Treatment of a protein with per-formic acid cleaved all the disulfide bonds and converted all Cys residues to cysteic acid residues (see Fig. 3–28).
Paper Chromatography. This more primitive version of thin-layer chromatography (see Fig. 10–25) separated com-pounds based on their chemical properties, allowing identifi-cation of single amino acids and, in some cases, dipeptides. Thin-layer chromatography also separates larger peptides.
As reported in his first paper (1945), Sanger reacted insu-lin with FDNB and hydrolyzed the resulting protein. He found many free amino acids, but only three DNP–amino acids: �-DNP-glycine (DNP group attached to the �-amino group); �-DNP-phenylalanine; and ́ -DNP-lysine (DNP attached to the ´-amino group). Sanger interpreted these results as showing that insulin had two protein chains: one with Gly at its amino terminus and one with Phe at its amino terminus. One of the two chains also contained a Lys residue, not at the amino ter-minus. He named the chain beginning with a Gly residue “A” and the chain beginning with Phe “B.”
(a) Explain how Sanger’s results support his conclusions.(b) Are the results consistent with the known structure
of bovine insulin (see Fig. 3–24)?
Given the above information, deduce the amino acid sequence of the peptide antibiotic. Show your reasoning. When you have arrived at a structure, demonstrate that it is consistent with each experimental observation.
20. Efficiency in Peptide Sequencing A peptide with the primary structure Lys–Arg–Pro–Leu–Ile–Asp–Gly–Ala is sequenced by the Edman procedure. If each Edman cycle is 96% efficient, what percentage of the amino acids liberated in the fourth cycle will be leucine? Do the calculation a second time, but assume a 99% efficiency for each cycle.
21. Sequence Comparisons Proteins called molecular chap-erones (described in Chapter 4) assist in the process of pro-tein folding. One class of chaperone found in organisms from bacteria to mammals is heat shock protein 90 (Hsp90). All Hsp90 chaperones contain a 10 amino acid “signature sequence,” which allows for ready identification of these pro-teins in sequence databases. Two representations of this sig-nature sequence are shown below.
Y-x-[NQHD]-[KHR]-[DE]-[IVA]-F-[LM]-R-[ED].
4 5 6 7 8 9 1021N C
3
43
10
2Bits
(a) In this sequence, which amino acid residues are invar-iant (conserved across all species)?
(b) At which position(s) are amino acids limited to those with positively charged side chains? For each position, which amino acid is more commonly found?
(c) At which positions are substitutions restricted to amino acids with negatively charged side chains? For each position, which amino acid predominates?
(d) There is one position that can be any amino acid, although one amino acid appears much more often than any other. What position is this, and which amino acid appears most often?
22. Chromatographic Methods Three polypeptides, the sequences of which are represented below using the one-letter code for their amino acids, are present in a mixture:
1. ATKNRASCLVPKHGALMFWRHKQLVSDPILQKR-QHILVCRNAAG
2. GPYFGDEPLDVHDEPEEG3. PHLLSAWKGMEGVGKSQSFAALIVILA
Of the three, which one would migrate most slowly during chromatography through:
(a) an ion-exchange resin; beads coated with positively charged groups?
(b) an ion-exchange resin; beads coated with negatively charged groups?
(c) a size-exclusion (gel-filtration) column designed to separate small peptides such as these?
(d) Which peptide contains the ATP-binding motif shown in the following sequence logo?
c03AminoAcidsPeptidesAndProteins.indd Page 113 28/08/12 11:52 AM user-F408 /Users/user-F408/Desktop
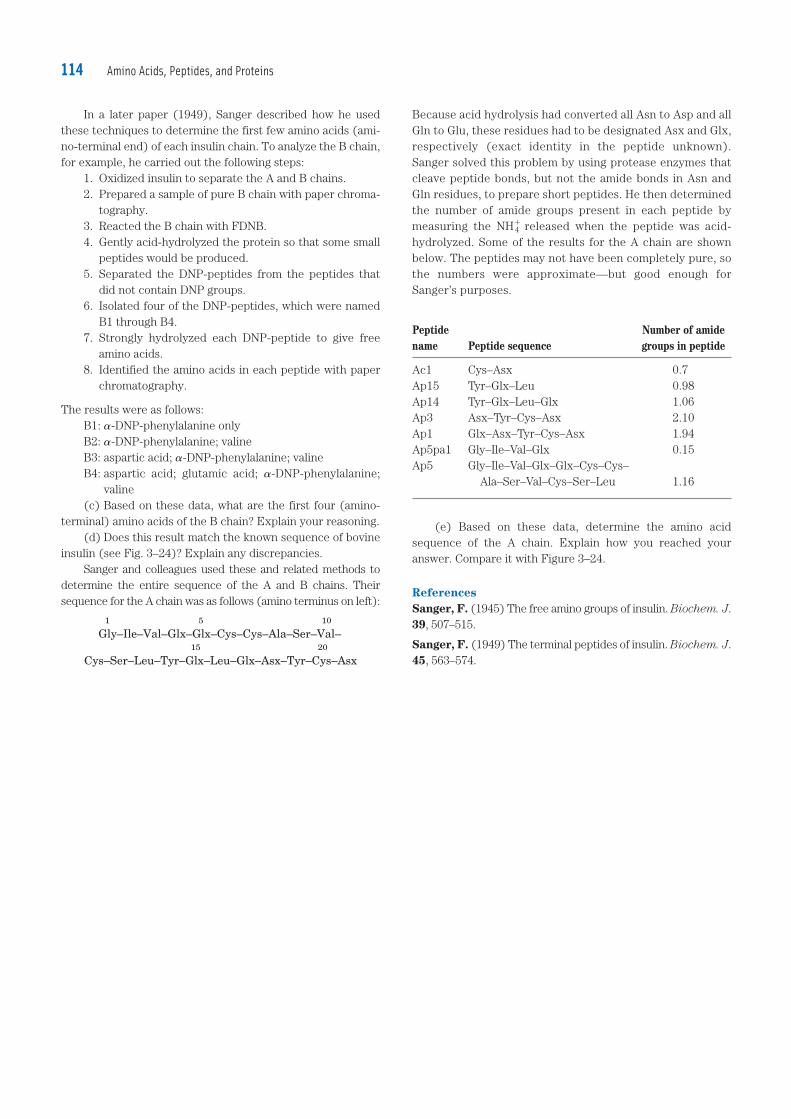
Amino Acids, Peptides, and Proteins114
Because acid hydrolysis had converted all Asn to Asp and all Gln to Glu, these residues had to be designated Asx and Glx, respectively (exact identity in the peptide unknown). Sanger solved this problem by using protease enzymes that cleave peptide bonds, but not the amide bonds in Asn and Gln residues, to prepare short peptides. He then determined the number of amide groups present in each peptide by measuring the NH�
4 released when the peptide was acid-hydrolyzed. Some of the results for the A chain are shown below. The peptides may not have been completely pure, so the numbers were approximate—but good enough for Sanger’s purposes.
Peptide Number of amide name Peptide sequence groups in peptide
Ac1 Cys–Asx 0.7Ap15 Tyr–Glx–Leu 0.98Ap14 Tyr–Glx–Leu–Glx 1.06Ap3 Asx–Tyr–Cys–Asx 2.10Ap1 Glx–Asx–Tyr–Cys–Asx 1.94Ap5pa1 Gly–Ile–Val–Glx 0.15Ap5 Gly–Ile–Val–Glx–Glx–Cys–Cys– Ala–Ser–Val–Cys–Ser–Leu 1.16
(e) Based on these data, determine the amino acid sequence of the A chain. Explain how you reached your answer. Compare it with Figure 3–24.
ReferencesSanger, F. (1945) The free amino groups of insulin. Biochem. J. 39, 507–515.
Sanger, F. (1949) The terminal peptides of insulin. Biochem. J. 45, 563–574.
In a later paper (1949), Sanger described how he used these techniques to determine the first few amino acids (ami-no-terminal end) of each insulin chain. To analyze the B chain, for example, he carried out the following steps:
1. Oxidized insulin to separate the A and B chains.2. Prepared a sample of pure B chain with paper chroma-
tography.3. Reacted the B chain with FDNB.4. Gently acid-hydrolyzed the protein so that some small
peptides would be produced.5. Separated the DNP-peptides from the peptides that
did not contain DNP groups.6. Isolated four of the DNP-peptides, which were named
B1 through B4.7. Strongly hydrolyzed each DNP-peptide to give free
amino acids.8. Identified the amino acids in each peptide with paper
chromatography.
The results were as follows:B1: �-DNP-phenylalanine onlyB2: �-DNP-phenylalanine; valineB3: aspartic acid; �-DNP-phenylalanine; valineB4: aspartic acid; glutamic acid; �-DNP-phenylalanine;
valine(c) Based on these data, what are the first four (amino-
terminal) amino acids of the B chain? Explain your reasoning.(d) Does this result match the known sequence of bovine
insulin (see Fig. 3–24)? Explain any discrepancies.Sanger and colleagues used these and related methods to
determine the entire sequence of the A and B chains. Their sequence for the A chain was as follows (amino terminus on left):
Gly–Ile–Val–Glx–Glx–Cys–Cys–Ala–Ser–Val–1051
2015
Cys–Ser–Leu–Tyr–Glx–Leu–Glx–Asx–Tyr–Cys–Asx
c03AminoAcidsPeptidesAndProteins.indd Page 114 11/08/12 12:48 PM user-F408 /Users/user-F408/Desktop