Embed Size (px)
Citation preview
AMPRIONMARKET REPORT 2021CURRENT TRENDS AND DEVELOPMENTS OF THE
MARKET AND GRID SITUATION

2 | CONTENTS
AMPRION MARKET REPORT 2021
CONTENTS | 3
CONTENTS
EXECUTIVE SUMMARY 4
INTRODUCTION 8
1. CURRENT TREND IN GENERATION
ADEQUACY IN GERMANY 11
2. EXTRAORDINARY OCCURRENCES –
IMPACT OF COVID-19 PANDEMIC 17
3. MARKET ANALYSIS 2020 20
4. GRID OPERATION ANALYSIS 2020 37
5. FUTURE DEVELOPMENTS 42
7. CONCLUSION AND OUTLOOK 47
LIST OF ABBREVIATIONS 50
4 | EXECUTIVE SUMMARY EXECUTIVE SUMMARY | 5
AMPRION MARKET REPORT 2021AMPRION MARKET REPORT 2021
EXECUTIVE SUMMARY
As the energy infrastructure is a key enabler of the European energy transition, transmission system operators (TSOs) play an important role in reaching the European Green Deal objectives as well as in the implementation of a functioning internal energy market. Tackling climate change and achieving climate neutrality by 2050 poses significant challenges for the entire European energy system. On a national level, the German energy system is undergoing an unprecedented transformation. Electricity production from nuclear energy and coal will be phased out while an increasing share of renewable energies is integrated into the system. As generation and consumption in the transmission system must always be in equilibrium in order to keep the network stable, the task of ensuring this is the case will become much more demanding for the transmission system operators. Even in times of such a dynamic and changing environment, TSOs are ensuring a 24/7 electricity supply and are thus enabling the energy transition. Efficient cooperation is a key prerequisite for this. Therefore, TSOs are jointly and cooperatively working around the clock to ensure a secure network, promoting security and crosszonal trade within the entire European electricity system.
Amprion is – and has been for decades – an integral part of this cooperation. We have been engaged in a large number of regional and European system operation, grid planning and market integration initiatives. Our involvement in these initiatives has always been based on a close, trustful and construc tive collaboration with our neighbouring TSOs, National Regulatory Authorities (NRAs), ACER (the Agency for the Cooperation of Energy Regulators), power exchanges, a vast
number of market parties and our association ENTSOE (European Network of Transmission System Operators for Electricity). In a nut -
shell, close mutual cooperation is in our DNA.
However, 2020 was an unprecedented year in every respect. The effects of the Covid19 pandemic came along with a particular challenge for our society and for each one of us. Furthermore, the shutdown of public life in large parts of Europe over many months also had a huge impact on the energy sector, resulting in1:
• The lowest gross electricity consump tion (544 TWh) in Germany since the year 19992
• The highest share of renewable energies in electricity generation (49%) of Germany ever
• The lowest electricity prices (€32/MWh) since the introduction of FlowBased Market Coupling (FB MC) in Central Western Europe (CWE) in 2015
• The lowest gas prices (€12/MWh) since 20043
• The highest electricity imports (31 TWh of dayahead commercial exchanges) in Germany since the introduction of FB MC in CWE
• The highest price convergence (52% at max. ± €1/MWh) in CWE since the introduction of FB MC in CWE
• The highest amount of hours with negative electricity prices in Germany (298 h) since the introduction of FB MC in CWE
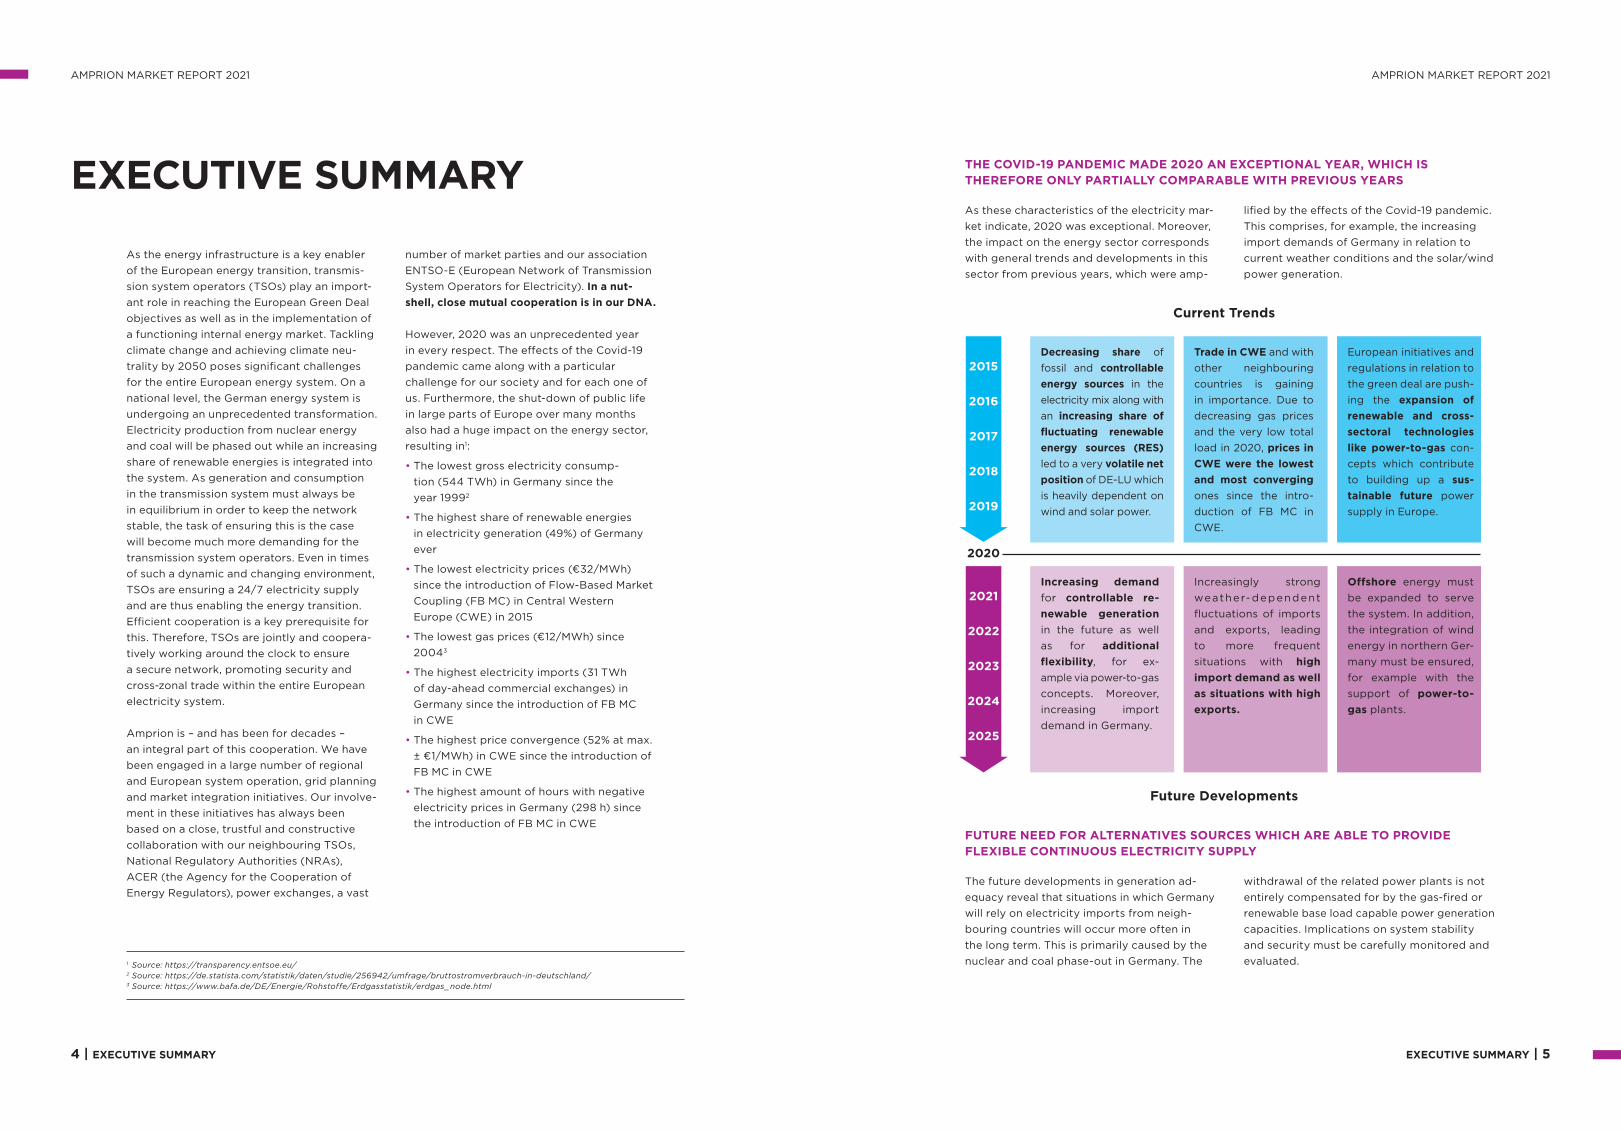
As these characteristics of the electricity market indicate, 2020 was exceptional. Moreover, the impact on the energy sector corresponds with general trends and developments in this sector from previous years, which were amp
lified by the effects of the Covid19 pandemic. This comprises, for example, the increasing import demands of Germany in relation to current weather conditions and the solar/wind power generation.
The future developments in generation adequacy reveal that situations in which Germany will rely on electricity imports from neighbouring countries will occur more often in the long term. This is primarily caused by the nuclear and coal phaseout in Germany. The
withdrawal of the related power plants is not entirely compensated for by the gasfired or renewable base load capable power generation capacities. Implications on system stability and security must be carefully monitored and evaluated.
THE COVID-19 PANDEMIC MADE 2020 AN EXCEPTIONAL YEAR, WHICH IS THEREFORE ONLY PARTIALLY COMPARABLE WITH PREVIOUS YEARS
FUTURE NEED FOR ALTERNATIVES SOURCES WHICH ARE ABLE TO PROVIDE FLEXIBLE CONTINUOUS ELECTRICITY SUPPLY
1 Source: https://transparency.entsoe.eu/2 Source: https://de.statista.com/statistik/daten/studie/256942/umfrage/bruttostromverbrauch-in-deutschland/3 Source: https://www.bafa.de/DE/Energie/Rohstoffe/Erdgasstatistik/erdgas_node.html
Decreasing share of fossil and controllable energy sources in the electricity mix along with an increasing share of
fluctuating renewable
energy sources (RES)
led to a very volatile net
position of DELU which is heavily dependent on wind and solar power.
Trade in CWE and with other neighbouring countries is gaining in importance. Due to decreasing gas prices and the very low total load in 2020, prices in
CWE were the lowest
and most converging ones since the introduction of FB MC in CWE.
European initiatives and regulations in relation to the green deal are pushing the expansion of
renewable and cross-
sectoral technologies
like power-to-gas concepts which contribute to building up a sus-
tainable future power supply in Europe.
Increasing demand for controllable re-
newable generation in the future as well as for additional
flexibility, for ex ample via powertogas concepts. Moreover, increasing import demand in Germany.
Increasingly strong weatherdependent fluctuations of imports and exports, leading to more frequent situations with high
import demand as well
as situations with high
exports.
Offshore energy must be expanded to serve the system. In addition, the integration of wind energy in northern Germany must be ensured, for example with the support of power-to-
gas plants.
2015
2016
2017
2018
2019
2020
2021
2022
2023
2024
2025
Current Trends
Future Developments

6 | EXECUTIVE SUMMARY EXECUTIVE SUMMARY | 7
AMPRION MARKET REPORT 2021
Especially during the summer months, the capability of selfsupply of Germany is increasingly dependent on wind power generation, which is statistically lower than in the winter months. In summer 2020, electricity imports of Germany reached nearly 12 GW in several hours. The highest imports in 2020 have taken place from France, the Netherlands, Switzerland and Denmark. Frequently, there were also transit flows monitored from these
countries via Germany to Austria, Poland and the Czech Republic. During the winter months, the German balance of trade is gener ally characterised by exports based on high wind power generation. However, in situations with low wind power generation in combination with a higher average load during winter, Germany will also increasingly rely on imports in future.
Due to a combination of low loads across Europe, low gas prices and increasing shares of solar and wind power generation, prices in CWE were the lowest since introduction of FB MC. Moreover, price convergence in CWE reached the highest level ever monitored and indicates a very wellfunctioning electricity
In summary, the results show that the European electricity market is already working quite well and Europe is becoming more and more interconnected. With regard to national energy systems, it is still necessary to ensure a secure, affordable and renewable energy supply for a sustainable future. For this reason, future challenges such as generation and transmission adequacy have to be tackled.
Amprion is very aware of its legal obligations and its role in the European energy system.
market. However, the general grid situation in 2020 also led to an amplified trend towards hours with negative prices in hours with high power generation of fluctuating renewable energies, which is sign for a lack of flexibility in current power generation.
In order to strengthen electricity trade in Europe and to enable the transition towards a fully renewable and sustainable energy supply, Amprion is substantially investing in expanding and reinforcing the existing transmission grid. In addition, Amprion further increases system planning expertise in the field of efficient and sustainable concepts for the integration of renewable offshore energy and sector coupling with power togas technologies.
LOW NET POSITIONS OF CWE BIDDING ZONES AND INCREASING IMPORT DEMAND IN GERMANY DURING SUMMER 2020
LOWEST AVERAGE DAY-AHEAD PRICES AND HIGHEST PRICE CONVERGENCE SINCE INTRODUCTION OF FB MC IN CWE
CONSEQUENCE: AMPRION IS INVESTING 24 BILLION EUROS OVER THE NEXT TEN YEARS

8 | INTRODUCTION INTRODUCTION | 9
AMPRION MARKET REPORT 2021
INTRODUCTION
This market report provides evidence of the dynamic electricity market environment in which Amprion operates together with many other institutions.
The report highlights the significant mutual benefits resulting from Amprion’s strong and steadily enhanced cooperation with TSOs, power exchanges and market parties of the CWE region and beyond.
Energy Markets – The Concept of Energy
Time Frames and Flow-Based Market
Coupling
Electricity is a commodity for which no efficient storage facility exists, thus it needs to be produced at the point in time at which it is consumed. Trading of electricity takes place before and after this point in time. Figure A in Annex ‘Overview Electricity Markets in Europe’ gives an overview of the current trading time sequence in wholesale and balancing markets. In sequential order, energy can be traded one or more years before the delivery (forward and futures markets) up to the day after the actual delivery. While in the dayahead market energy is traded one day before real time, the intraday market enables market participants to correct their nominations closer to the time of delivery. Further information regarding the flowbased market coupling concept can be found via the Amprion homepage (link below).
Further information: https://www.amprion.net/Market/MarketReport/
Amprion connects electricity markets across borders
Core
AMPRION Amprion is one of four transmission system operators in Germany. Our extrahighvoltage network (380 kV and 220 kV) is 11,000 kilometres long and transports electricity across an area that extends from Lower Saxony to the Alps. Around a third of Germany’s economic output is generated there. Today, Amprion’s grid is interconnected with other transmission grids within Germany and also with the Netherlands, Belgium, Luxembourg, France, Switzerland and Austria. With ALEGrO, the first interconnection between Germany and Belgium has been operational since midNovember 2020.
OUTLOOK COREIn terms of market integration, Amprion will continue its strong commitment to the ongoing activities in the capacity calculation regions CWE and Core. The latter will encompass the implementation of a flowbased capacity calculation and allocation at all Core borders for the dayahead (and at a later stage intraday) time frame and longterm capacity calculation. Concepts of organising and further enhancing crosszonal redispatch and sharing of the related costs amongst TSOs are currently being developed. We are confident that the current close cooperation amongst all involved TSOs and regulatory authorities will result in adequate and acceptable solutions for all parties involved.
CENTRAL WESTERN EUROPE (CWE)In order to achieve the target model of a single European electricity market, local markets have been gradually integrated and coupled at a regional level as from 2006 with the first market coupling of the Belgian, Dutch and French dayahead markets. The latest major step towards the target model was the introduction of FlowBased Market Coup ling (FB MC) in CWE back in 2015. Currently, TSOs are working on the introduction of FB MC in the capacity calculation region (CCR) Core, which encompasses Eastern Europe in addition to Central and Western Europe.
CWE
AMPRION MARKET REPORT 2021

10 | CURRENT TREND IN GENERATION ADEQUACY IN GERMANY CURRENT TREND IN GENERATION ADEQUACY IN GERMANY | 11
AMPRION MARKET REPORT 2021AMPRION MARKET REPORT 2021
1. CURRENT TREND IN GENERATION ADEQUACY IN GERMANY
4 E.g. Generation Adequacy Assessment (PLEF); Midterm Adequacy Forecast (MAF)
5 See also Amprion Market Report 2020, Chapter 1 Development of the security of supply situation focusing on Germany: Leistungsbilanz-bericht of the four German TSOs
6 Source: ENTSO-E Transparency Platform, NEP Szenariorahmen (2019) (https://www.netzentwicklungsplan.de/sites/default/files/ paragraphs-files/Szenariorahmen_2019-2030_Genehmigung_0_0.pdf)
THE DECREASE OF CONVENTIONAL CONTROLLABLE ELECTRICITY PRODUCTION CAPACITY WILL HAVE FUNDAMENTAL CONSEQUENCES FOR THE ELECTRICITY MARKET AND GENERATION PATTERN
In 2020, as in the past years and decades, a continuous balance between electricity supply and demand has always been guaranteed by sufficient conventional electricity generation from coal, nuclear and gasfired power plants. These conventional energy sources have been providing the flexibility of con tinuously adjusting their generation to the overall demand. The policy trend towards carbonneutral electricity production has already led to a decrease in conventional generation capacity. This trend will continue and a flexi ble continuous electricity supply will have to be provided by alternatives sources in the future.
For the coming years, various European analyses4 still show a comparatively high level of security of supply. However, there is a clear trend indicating future import needs in Germany. In the next few years, Germany
might end up in the situation that its electricity demand coverage can, during some hours only be ensured by imports (see in Figure 1 dashed line ‘highest peak load’)5.
FUTURE NEED FOR ALTERNATIVES SOURCES WHICH ARE ABLE TO PROVIDE FLEXIBLE CONTINUOUS ELECTRICITY SUPPLY
250
200
150
100
50
0
vo
lati
le
2015 2020 2025
Solar
Wind (onshore)
Wind (offshore)
Hydro
Biomass
Natural gas
Coal
Nuclear
Others
Inst
. ca
pa
cit
y i
n G
W
Figure 1: Installed power generation capacity in Germany 2015, 2020 and 20256
Highest peak load (2015–2020)
co
ntr
oll
ab
le
Year

12 | CURRENT TREND IN GENERATION ADEQUACY IN GERMANY CURRENT TREND IN GENERATION ADEQUACY IN GERMANY | 13
AMPRION MARKET REPORT 2021AMPRION MARKET REPORT 2021
10 Source: https://transparency.entsoe.eu/
7 It should also be noted that the graphs on installed capacities (Figure 1) do not take into consideration outages of power plants due to failures or maintenance requirements. The amount of outages depends on the season and historically lies between 10–20% of the installed capacity.
8 Source: https://transparency.entsoe.eu/
9 Source: https://transparency.entsoe.eu/
Figure 1 indicates the decrease of conventional controllable electricity production capacity with fundamental consequences for the electricity market and generation pattern7:
• In 2020 lignite and hard coal together contributed only 24% of net electricity generation, less than wind power (wind offshore and onshore 25.4%). In the past five years, coalfired power generation has nearly halved (214 TWh in 2015 and 119 TWh in 2020)8. This is a consequence of the coal phaseout in Germany. All coal generation capacities are to be closed by 2038. Tenders are organised in order to determine the coal power plant decommissioning time and compensation payments. Even the modern coalfired power plants such as the one in Moorburg successfully participated in the first of these decommissioning tenders. This power station will be taken off the grid in 2021 after only five years of operation. Further to these regulatory measures, rising
CO2 prices and low gas prices are providing incentives not only for hard coalfired power plants but increasingly also for lignitefired power plants to leave the market.
• In parallel to the coal phaseout in Germany, nuclear generation capacities will be shut down by the end of 2022, which leads to a further decrease in conventional capacities of 8.1 GW compared to the end of 2020.
The decreasing share of coal and nuclear energy production will have to be replaced by an increasing share of volatile generation capacities such as wind and solar energy in the coming years. In 2020, the share of electricity generated from renewable energies has already reached almost 50%. Figure 2 highlights the increasing dependency of the German electricity generation on renewable energies and illustrates the monthly average share of renewable energy generation in Germany from 2018 until 2020.
Sh
are
RE
in
ne
t e
lectr
icit
y
ge
ne
rati
on
[%
]
70
60
50
40
30
20
10
0
Figure 2: Share renewable energy generation in Germany 2018–20209
2018 2019 2020
Ja
nu
ary
Fe
bru
ary
Ma
rch
Ap
ril
May
Ju
ne
Ju
ly
Au
gu
st
Se
pte
mb
er
Oc
tob
er
No
ve
mb
er
De
ce
mb
er
Ja
nu
ary
Fe
bru
ary
Ma
rch
Ap
ril
May
Ju
ne
Ju
ly
Au
gu
st
Se
pte
mb
er
Oc
tob
er
No
ve
mb
er
De
ce
mb
er
Ja
nu
ary
Fe
bru
ary
Ma
rch
Ap
ril
May
Ju
ne
Ju
ly
Au
gu
st
Se
pte
mb
er
Oc
tob
er
No
ve
mb
er
De
ce
mb
er
43
.3
32
.9 38
.7 46
.0
47.0
39
.8
37.5
40
.0
40
.1
35
.4 43
.9
41.
0
40
.1 51.
8
46
.9
47.8
49
.6
43
.4
42
.9
45
.0
43
.8
36
.9 48
.9 61.
5
55
.3
57.5
56
.0
48
.8
48
.8
44
.5
41.
6
49
.0
41.
3
41.
1
47.8
35
.6
While the overall share of renewable energy generation is constantly increasing, their availability varying significantly depending on daytime, season and general weather condi tions. Figure 3 illustrates this by comparing the generation pattern for the day with the hour with the highest share of renewable energy production in 2020 (84% of net electricity generation on 04 July at 12 a.m.) to the day with the hour with the lowest renewable energy production (14% of net electricity generation on 27 November at 6 a.m.). These values refer to aggregated electricity generation of all renewable energy sources (including wind, solar, biomass, hydro and others). The German energy
tran sition is based mainly on the massive expansion of fluctuating renewable energy sources (i.e. wind onshore, wind offshore and solar). Considering only these fluctuating renewable energy sources, on 04 July at 12 a.m. 74% of net electricity generation and on 27 November at 6 a.m. only 1% was generated by wind and solar.
In addition, Figure 3 shows that situations with very low wind and solar power generation do not occur only in single hours. Instead, they can last for days and even weeks. An appropriate backup must be available for such times.
Wind
Solar
Other RES
Conventional generation
Figure 3: Days with the lowest and highest renewable power generation in Germany 202010
Ge
ne
rati
on
in
GW
70
60
50
40
30
20
10
0
Ge
ne
rati
on
in
GW
70
60
50
40
30
20
10
0
00:00 03:00 06:00 09:00 12:00 15:00 18:00 21:00 24:00
Daytime on 27 November 2020
Daytime on 4 July 2020
72%volatile RES
14%total RES
1%volatile RES
84%total RES

CURRENT TREND IN GENERATION ADEQUACY IN GERMANY | 15
AMPRION MARKET REPORT 2021AMPRION MARKET REPORT 2021
14 | CURRENT TREND IN GENERATION ADEQUACY IN GERMANY
The current electricity system has been reliant on large power stations close to demand centres. Those power stations could provide local ancillary services, i.e. reactive power, and support grid voltage at dedicated locations. With the closure of those power plants this support will no longer be available. Together with the progressive expansion of renewable energies and longerdistance electricity transmission, there is an increased demand for alternative support in the form of new controllable
compensation systems. Further information regarding the challenges of voltage control are analysed in Chapter 4.2 of this report.
It is essential that balancing responsible parties provide their contributions to such an overall balanced electricity system. In order to achieve this target, the market framework needs to provide the right incentives for balancing groups to balance their energy injections and withdrawals at all times.
Similar efforts to achieve the Paris Climate Agreement targets and to shut down conventional capacities are being made in other countries across Europe. Exemplarily, France and UK have announced a coal phaseout by the end of 2022 and 2024, respectively, which would reduce conventional generation by 3 GW in France11 and by 5.3 GW in Great Britain12. Besides that, a nuclear phaseout by 2025 is being discussed in Belgium,
potentially reducing conventional generation by 5.9 GW13. In the interconnected European electricity system, such individual changes in the generation capacities in different countries have a substantial impact on the overall European security of supply during scarcity situations. In order to assess the current and future European security of supply situation, Amprion is particularly involved in respective ENTSOE analyses.
The previously shown generation adequacy situation does not consider whether the grid is capable of transporting the capacity (transmission adequacy). Current security of supply reports and analyses, in general, do not con sider gridrelated restrictions. However, insuffi cient transmission capacity currently requires market interventions on an almost daily basis as described in Chapter 4.1. Grid reserve power plants are contracted and activated for this purpose. Additional gridrelieving measures such as operating equipment for active power flow control has been and will be installed over the next years. However, the potential for further shortterm grid optimisation has its limits. An adequate level of transmission capacity can only be ensured by mid and longterm expansion of the transmission grid. Realising the relevant grid expansion projects included in the network development plan and defined in applicable legislation is therefore required and mandatory.
Security of supply has to be ensured also in situations, with low renewable electricity production (e.g. in the investigated week in Chapter 3.2). In such situations flexible gas fired power stations could support electricity generated by renewables. In order to develop the infrastructure required for this purpose, the currently independent gridplanning
processes of the electricity and gas infrastructure should in future be closely aligned.
The European Green Deal accelerates the transformation of the European energy system to enable a fully integrated climateneutral system by 2050. As infrastructure is a key enabler of the European energy transition, European TSOs play an important role in meeting the objectives of the Green Deal and in implementing a functioning internal energy market. Due to the usually high fullload hours of offshore wind farms, this technology is expected to contribute to the overall security of supply more than other renewable energy sources in future by generating electricity on a rather constant level. The grid connection of those offshore wind farms should be located as close as possible to the demand centres in order to provide customers with direct access to electricity supply. For this reason, the offshore grid connection to the shore is just one aspect. It is important to have integrated grid concepts which consider the further transport of the offshore wind power to the regions with high electricity demand. In order to ensure the optimal interlinkage of offshore wind farms a modular offshore grid should be installed in Europe in the long term. See also Chapter 5 of this report for further information on the topic.
HIGH LEVEL OF SECURITY OF SUPPLY REQUIRES SUFFICIENT TRANSMISSION CAPACITY OF THE GRID
ASPECTS OF SYSTEM STABILITY MUST BE CONSISTENTLY TAKEN INTO ACCOUNT IN SYSTEM DESIGN
NOT ONLY IN GERMANY, BUT ALSO IN OTHER EUROPEAN COUNTRIES, A DECREASING TREND IN CONVENTIONAL POWER PLANTS IS VISIBLE
11 See ‘France to close Havre coal power plant in April 2021’: https://www.reuters.com/article/us-france-electricity-coal/france-to-close- havre-coal-power-plant-in-april-2021-idUSKBN1Z91IO
12 UK brings forward coal phase-out to 2024: https://www.argusmedia.com/en/news/2064277-uk-brings-forward-coal-phaseout-to-2024
13 See ‘Electrabel calls for clarity on Belgian phase-out’: https://www.world-nuclear-news.org/Articles/Electrabel-calls-for-clarity-on- Belgian-phase-out
OUTLOOK IN EUROPE
Security of supply has to be ensured at all times, also in situations with low renewable electricity production (e.g. November day in Figure 3 or the investigated week in Chapter 3.2). In such situations flexible gas (hydrogen)fired power stations could in future support electricity generated by renewables. In order to develop the infrastructure required for this purpose, the currently independent grid planning processes of the electricity and gas infrastructure should in future be closely aligned.
Renewable energy plants will also have to contribute to security supply in the future, for example by combining them with flexible storage facilities. Consumerside flexibility, (aligned with the volatile feedin of renewable energies) will have to play a stronger role. From 2025 onwards, high electricity demand (peak load indicated in Figure 1 for the reference years 2015 until 2020) can no longer be ensured solely by conventional and controllable power plants.

AMPRION MARKET REPORT 2021AMPRION MARKET REPORT 2021
16 | EXTRAORDINARY OCCURRENCES – IMPACT OF COVID-19 PANDEMIC EXTRAORDINARY OCCURRENCES – IMPACT OF COVID-19 PANDEMIC | 17
2. EXTRAORDINARY OCCURRENCES – IMPACT OF COVID-19 PANDEMIC
THE COVID19 PANDEMIC HAS SIGNIFICANT EFFECTS ON THE ELECTRICITY SYSTEM AND THE ENERGY MARKET
The Covid19 pandemic made 2020 an exceptional year in terms of many areas of everyday life, including effects on the electricity supply and markets. To give an overview of these extraordinary effects and the resulting lockdown measures, this chapter highlights some key figures.
The lockdown measures across much of Europe in the beginning of 2020 had a significant impact on the electricity markets. The actual total electricity demand fell sharply in many countries and in particular also in Germany shortly after the first lockdown, i.e. in the last weeks of March and the months of April and May 2020. Figure 4a shows this substantial change for a representative week in April 2020.
These clear differences on the demand side persisted during the lockdown period (i.e. in April and May around a 10% decrease in the actual total load). During the summer the actual total load adjusted back to previous years’ levels and reached a level comparable to 2019 in August. Over the whole year of 2020, a decrease of 3% in actual total load could be observed for Germany (478 TWh in 2020 compared to 490 TWh in 2019)14.
Not only the decrease in actual total load but also a mild winter and an oversupply of gas15
resulting in an extreme decrease in gas prices caused a significant change in the generation structure. The aforementioned effects resulted in the following deviations compared to 2019: on the one hand, the share of electricity generated by lignite reduced by –19%, hard coal by –27% and nuclear by –14%, but on the other hand, an increase in gas by +8%, solar by +9%, onshore wind by +3% and offshore wind generation by +11% could be observed. Firstly, this can be explained by the sharply decreased natural gas prices (–24% compared to 2019 and almost –36% compared to 2018). The corresponding merit order shift ‘coalgas switch’ resulted in lower prices in all countries – which also led to more similar prices due to the flattening of the merit order. Secondly, the share of renewable energies in net elec
THE COVID-19 PANDEMIC MADE 2020 AN EXCEPTIONAL YEAR, WHICH IS THEREFORE ONLY PARTIALLY COMPARABLE WITH PREVIOUS YEARS
14 Actual total load = actual total load (including losses without stored energy) = net generation – exports + imports – absorbed energy – net generation is preferred, however gross generation could be used where it is available with greater precision (Source: ENTSO-E transparency platform)
15 See ‘Der europäische Energiemarkt zwischen Zusammenbruch und schneller Erholung’ – EMW - Dr. Philipp Eggert, Trianel; 02.02.2021: On an already oversupplied European gas market, new LNG from the USA kept arriving during the winter. According to GIE data, gas storage levels in Europe were 88% full at the beginning of January. At the end of March, storage levels were at 54%. Normal would have been around 35%.

AMPRION MARKET REPORT 2021AMPRION MARKET REPORT 2021
18 | EXTRAORDINARY OCCURRENCES – IMPACT OF COVID-19 PANDEMIC EXTRAORDINARY OCCURRENCES – IMPACT OF COVID-19 PANDEMIC | 19
Figure 4: Impact of Covid-19 and the resulting lockdown measures on total actual load
and power generation in Germany as well as on net positions and electricity prices in
CWE in an example week (6 until 13 April)19
Ho
url
y i
mp
ort
/exp
ort
(D
A S
CE
) in
GW
10
7.5
5
2.5
0
-2.5
–5Ne
t p
osi
tio
n i
n C
WE
in
GW
Net position
Import/export
To
tal
actu
al
loa
d i
n
Ge
rma
ny i
n G
W
70
60
50
40
30
Load
10
5
0
–5
–10
07 08 09 10 11 12 13
80
70
60
50
40
30
20
10
0
–10
06Apr
2020 Date
DA-prices
Ele
ctr
icit
y D
A-p
rice
s
in C
WE
in
¤/M
Wh
70
60
50
40
30
20
10
0
Po
we
r g
en
era
tio
n i
n
Ge
rma
ny i
n G
W
Generation18
16 See ‘Jahresauswertung Agora Energiewende’ in 2020, greenhouse gas emissions decreased. The main reasons for the lower emissions are the economic crisis (low energy demand, lower industrial production, slump in transport demand), higher CO
2 prices in EU emissions
trading and a mild winter.
17 See https://ec.europa.eu/energy/sites/ener/files/documents/quarterly_report_on_european_electricity_markets_q_2_2020.pdf
18 Share of power generation in the illustrated week: solar 19%, wind onshore 16%, wind offshore 4%, other renewable 16%, nuclear 15%, gas 9%, coal (lignite and hard) 17%
19 Source: https://transparency.entsoe.eu/
tricity generation reached a peak of 49.4% in 2020. Especially wind and solar generation increased significantly. The corresponding shift away from fossil fuels led to a decrease in greenhouse gas emissions of approx. 80 million tonnes of CO2eq and will thus be about 42.3% below the 1990 level16.
The pandemic and resulting lockdown measures imposed particular challenges on grid operators who had to manage increased volumes of fluctuating renewable energy in a lowdemand environment with fewer thermal power plants at the same time. Examples of this are the minimum and maximum shares of renewable energies that occurred in 2020. The range is vast, with 84% on 4 July and only 14% on 27 November (see Chapter 1). Overall, networks coped with the situation well and proved their ability to handle high levels of renewable penetration, which at times crossed 60% in Italy, 70% in Spain and the already mentioned 84% in Germany17.
The following graphs in Figure 4 (ae; top to bottom) proves the exceptional effects of the Covid19 pandemic based on analyses of the example week 6 to 13 April 2020:
• Figure 4a: The actual total load of Germany in 2020 (pink line) decreased significantly compared to the previous years (2015–2019), which are represented by the pink shaded area.
• Figure 4b: The power generation pattern in Germany during this week can be characterised by low wind power generation and average PV generation.
• Figure 4c: This situation is reflected by the net positions of France and Germany, which correspond to the overall effects. Figure 4c shows the correlation between the German and France net positions (taking into account
all CWE borders). While Germany was mainly importing during this week, France compensated for this with an average net export position of approx. 7,000 MW. However, at the end of the depicted week (i.e. 12 April), situations occurred in which the reverse situation was visible. On 12 April at 5 a.m. Germany was importing with a net position of –2,400 MW, while France was export ing (net position of +10,200 MW). A few hours later at 1 p.m. the opposite picture emerged: Germany was exporting (net position of +9,000 MW) and France was importing (net position of –1,500 MW). Chapter 3 of this report covers in more detail these strong fluctuations in the net position and the underlying effects.
• Figure 4d: In order to give an overview of how the commercial exchanges behaved during this April week, Figure 4d demonstrates Germany’s bilateral commercial exchanges with all neighbouring countries revealing massive transit flows. German imports from France, Denmark and Switzerland are simultaneously offset by exports from Germany to Austria and the Czech Republic.
• Figure 4e: The corresponding dayahead electricity prices in CWE also show significant fluctuations, with the very low average dayahead price during the week of only €19/MWh. However, the weekly average dayahead price in the German bidding zone (€21/MWh) was slightly higher than the average CWE prices, reflecting the strong imports. As a result, the lowest dayahead prices (€14.4/MWh) were observed in France during this week. Furthermore, the observed price convergence in the week was approx. 35.1% and thus much lower than the average in 2020. This is an indicator for trade limiting network elements and is a result of the exceptional grid situation in Europe based on the national lockdowns.
AT BE DE-LU FR NL
Range 2015–2019
2020
AT BE DE-LU FR NL
Wind
Solar
Others
DE net position DE ➞ AT DE ➞ BE DE ➞ CH DE ➞ CZ DE ➞ DK DE ➞ FR DE ➞ LU DE ➞ NL DE ➞ NO DE ➞ PL DE ➞ SE

20 | MARKET ANALYSIS 2020 MARKET ANALYSIS 2020 | 21
AMPRION MARKET REPORT 2021AMPRION MARKET REPORT 2021
20 Source: https://transparency.entsoe.eu/
Explanation: One representative Lockdown week (6 to 13 April), one representative import week (13 to 20 July) and one representative export week (14 to 21 December) were analysed in detail.
3. MARKET ANALYSIS 2020
3.1 EXPORTS AND IMPORTS IN CWE
LOW ELECTRICITY DEMAND AMPLIFIES MARKET TRENDS FROM 2019.
This chapter seeks to analyse and explain our main observations and the key trends in the electricity wholesale market in 2020. With our control area located in the heart of CWE, our market monitoring is focussed mainly on this region, where Amprion provides fundamental contributions to European electricity trade and FB MC. Since the golive of the ALEGrO cable in November 2020, which represents the first interconnection between the German and Belgian transmission grid, Amprion is now interconnected with every foreign TSO in CWE. This particular role in Germany and CWE requires our strong commitment to CWE and the overall European electricity market.
We analyse electricity exports and imports by monitoring the dayahead net positions of all bidding zones in this region. In general, these net positions show the difference between all flows out of a particular bidding zone (exports) or into a particular bidding zone (imports) at one particular point in time. A positive net position indicates a (net) exporting bidding zone, while a negative net position shows a (net) importing bidding
zone. In order to show the main effects of the electricity wholesale market, our analysis is focussed on flows which are exchanged between bidding zones the day before the actual production and consumption takes place. These flows are determined by the dayahead market which is where currently the major part of electricity trading takes place. Figure 5 illustrates the moving weekly average of CWE net positions in 2019 and 2020.
Figure 5: Comparison of day-ahead net positions in CWE in 2019 and 202020
(considering all country borders except DC interconnectors, moving weekly averages)
10
8
6
4
2
0
–2
–4
-6
Ne
t p
osi
tio
n i
n C
WE
in
GW
Date
Lockdown Import Export
AT BE DE-LU FR NL
Ja
nu
ary
Fe
bru
ary
Ma
rch
Ap
ril
May
Ju
ne
Ju
ly
Au
gu
st
Se
pte
mb
er
Oc
tob
er
No
ve
mb
er
De
ce
mb
er
Ja
nu
ary
Fe
bru
ary
Ma
rch
Ap
ril
May
Ju
ne
Ju
ly
Au
gu
st
Se
pte
mb
er
Oc
tob
er
No
ve
mb
er
De
ce
mb
er
Germany’s past high net exports of 36.8 TWh in 2019 have decreased by 39.3% to 22.3 TWh in 2020. These German net imports are composed of imports which have increased to 30.9 TWh (+36.8%) in 2020 and exports which have decreased to 53.2 TWh (–10.3%). As already in 2019, Germany has been a net importer during several weeks in the summer time from May to October.
LOW NET POSITIONS OF CWE BIDDING ZONES AND INCREASING IMPORT DEMAND IN GERMANY DURING SUMMER 2020
In both years, the net position of the German/Luxembourgian (DELU) bidding zone is consistently high during winter months and low during summer months. In 2019, the low German power generation was especially compensated for by the French (FR) bidding zone with an average net position of around +6,400 MW from July till October 2019 (for
In order to provide more details of the market behaviour in particular export and import situations, the following Chapters 3.2 & 3.3
comparison: the average net position of DELU was around +400 MW in this period). However, summer months in 2020 stand out due to comparatively low net positions not only in Germany, but in particular also in France (e.g. average net position of FR: +750 MW, DE: –300 MW from July till October 2020).
will focus on one representative import week in July and one representative export week in December (cf. Figure 5).
… decrease of
net exports
of Germany
in 2020.
2019 2020
-39.3%

AMPRION MARKET REPORT 2021AMPRION MARKET REPORT 2021
22 | MARKET ANALYSIS 2020 MARKET ANALYSIS 2020 | 23
21 Only 6.5% of the max. overall wind power generation in 2020: 47,700 MW
22 Peak overall PV production in 2020: 30,300 MW, peak generation during the particular week 15,100 MW
23 Average generation from lignite plus hard coal power plants was around 12,900 MW and natural gas power generation was around 8,600 MW
24 Which sum up to 708 GWh over the whole week
25 Maximum: €58.7/MWh in DE-LU at 16/07/2020 10 a.m.; minimum: €15.0/MWh in BE at 20/07/2020 12 a.m.
26 In 74.5% of hours the maximum price deviation is below ±€1/MWh in CWE and the maximum deviation is ±€10.9/MWh reached on 20/07/2020 at 12 a.m.
27 Source: https://transparency.entsoe.eu/
3.2 FOCUS SUMMER 2020 – GERMANY BECOMING A NET IMPORTER
HIGH IMPORTS FROM FRANCE, NETHERLANDS, SWITZERLAND AND DENMARK DURING SUMMER 2020
As in the summer of 2019, also in the summer months of May, July and August 2020, Germany was importing significantly from France, Netherlands, Switzerland and Denmark. For a better understanding of this phenomenon, Figure 6 provides some insights into one of these weeks, from 13 to 20 July 2020, in which Germany relied heavily on imports.
In order to explain market behaviour in such situations, the following reflects the interdependencies between load, generation, dayahead wholesale prices as well as imports and exports.
The graph at the top shows the total actual grid load in Germany which has been slightly lower than in the last years. In nearly every hour, the load in 2020 has been lower than the lowest value of this hour in comparable calendar weeks from 2015 to 2019 (grey shaded areas, on average: –5%). This is still a result of Covid19 pandemic and the related restrictions in Germany.
While low loads are usually related to a surplus in generation, this has not been the case due to comparatively low generation of wind power and belowaverage PV generation. For comparison, the hourly wind generation of onshore plus offshore power plants in Germany during this week was on average at 3,100 MW21. Despite usually high PV generation in July, on 15 and 16 July 2020 also the PV generation was comparatively low with an hourly average generation of around 8,100 MW22.
The gap between demand and comparatively low generation from wind and PV has been
filled partly by coal and gas power generation23. Furthermore, net imports have reached a level of on average 4,200 MW per hour24. Figure 6 shows that the CWE net position of DELU during this week remains negative (importing), except for a few hours on Monday, Saturday and Sunday around noon. When taking a look at the dayahead scheduled commercial exchanges at all country borders (beyond CWE only), it becomes obvious upon which countries Germany has been relying. With a total amount of 461 GWh, the highest net imports have come from the Netherlands with a 4,500 MW peak, followed by France (276 GWh total, 5,700 MW peak), Denmark (218 GWh total, 1,900 MW peak) and Switzerland (119 GWh total, 2,800 MW peak).
Although trading volumes in CWE have been high, the average dayahead whole sale prices were just slightly above average at around €35/MWh in CWE25 with a high degree of price convergence of around 75%26. Consequently, there were only 47 limiting CNECs (critical network elements and contingencies) monitored in CWE over the whole week, which have limited trade in CWE. Furthermore, none of those CNECs refers to internal network elements of Amprion.
Ne
t p
osi
tio
n i
n C
WE
in
GW
7.5
5
2.5
0
-2.5
-5
-7.5
-10
AT BE DE-LU FR NL
Net position
To
tal
actu
al
loa
d i
n
Ge
rma
ny i
n G
W
70
60
50
40
30
Range 2015–2019
2020
Load
DA-prices
Po
we
r g
en
era
tio
n i
n
Ge
rma
ny i
n G
W
70
60
50
40
30
20
10
0
Wind
Solar
Others
Generation
Ho
url
y i
mp
ort
/exp
ort
(D
A S
CE
) in
GW
Import/export
DE net position DE ➞ AT DE ➞ BE DE ➞ CH DE ➞ CZ DE ➞ DK DE ➞ FR DE ➞ LU DE ➞ NL DE ➞ NO DE ➞ PL DE ➞ SE
10
5
0
–5
–10
Figure 6: Example summer week with net imports to Germany27
Ele
ctr
icit
y D
A-p
rice
s
in C
WE
in
¤/M
Wh
14 15 16 17 18 19 2013Jul
2020 Date
80
70
60
50
40
30
20
10
0
–10
AT BE DE-LU FR NL
AMPRION MARKET REPORT 2021AMPRION MARKET REPORT 2021
24 | MARKET ANALYSIS 2020 MARKET ANALYSIS 2020 | 25
28 With a peak at 36,000 MW. The average wind power generation over December 2020 was around 15,600 MW in contrast to 20,400 MW in 2019.
29 With a peak at 10,500 MW
30 Please note: the peak load in the winter week was 71.5 GW whereas the peak load in the summer week (chapter 3.2) was 67.0 GW.
31 Maximum: €76.1/MWh in AT on 17/12/2020 at 6 p.m.; minimum: €0.0/MWh in DE-LU on 21/12/2020 at 11 p.m.
32 In only 22.9% of hours it the maximum price deviation below ±€1/MWh in CWE and the maximum deviation is ±€22.6/MWh reached on 21/12/2020 at 11 p.m.
33 Source: https://transparency.entsoe.eu/21/12/2020 at 11 p.m.
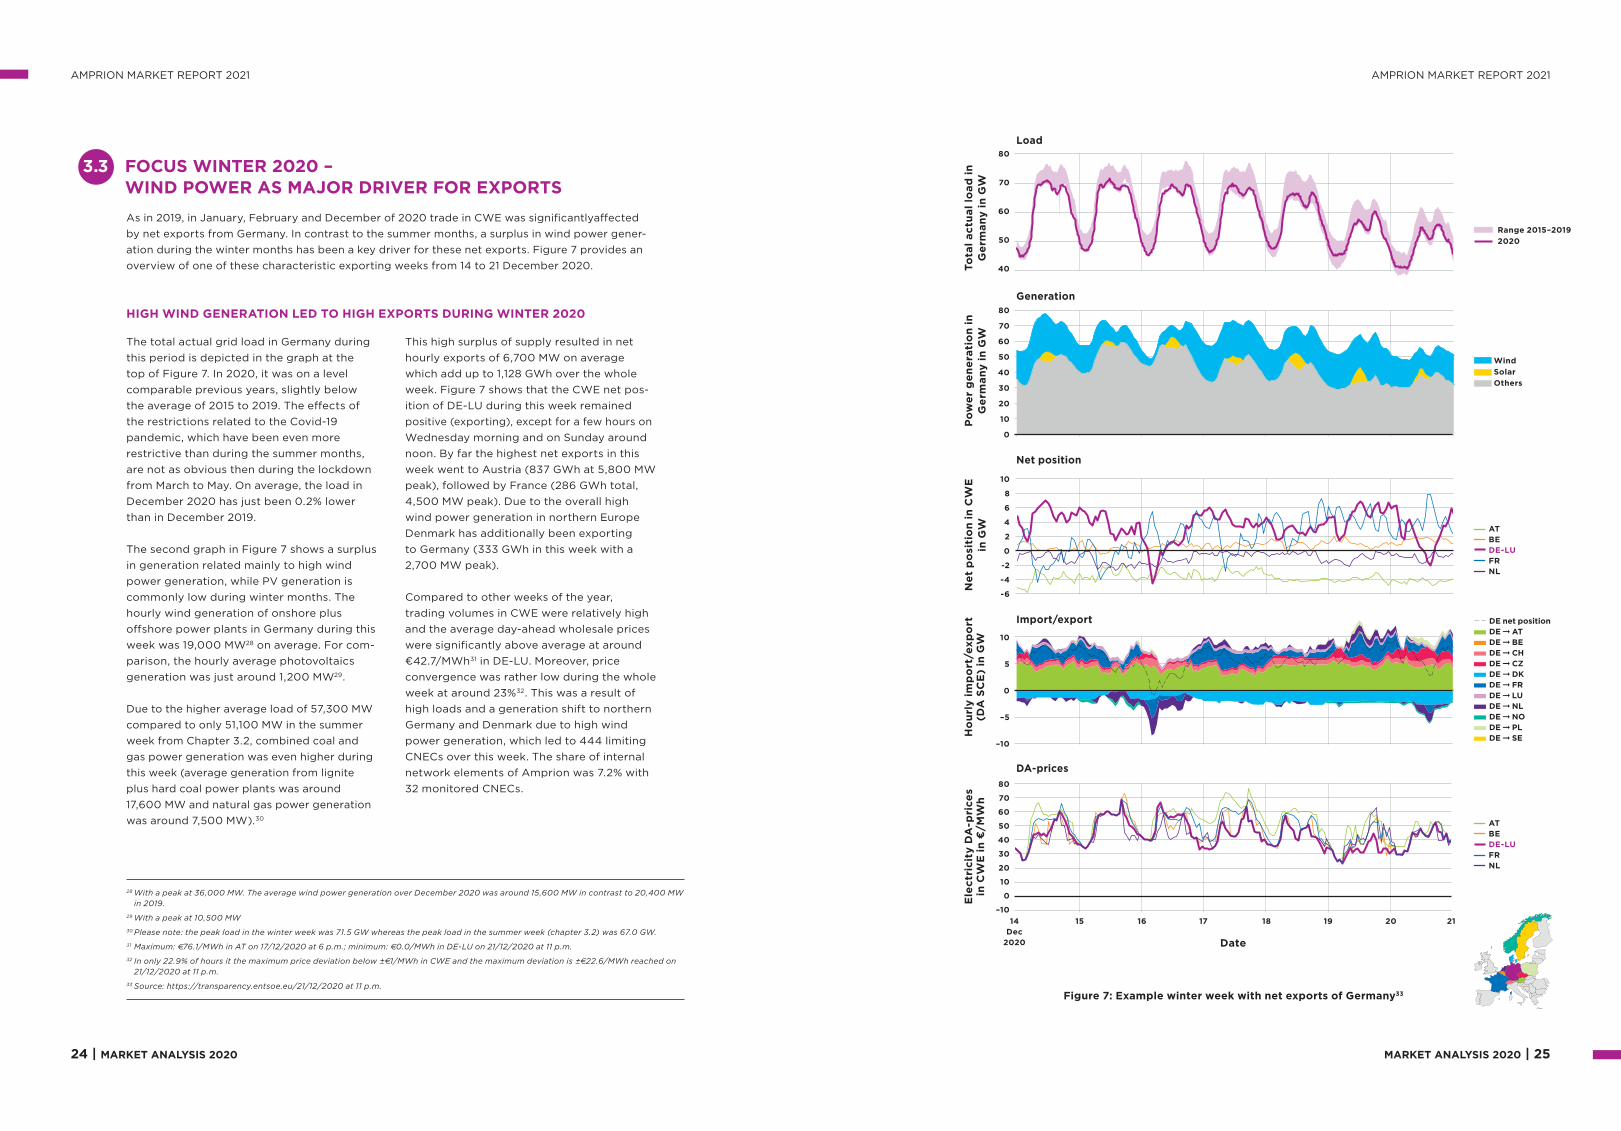
3.3 FOCUS WINTER 2020 – WIND POWER AS MAJOR DRIVER FOR EXPORTS
HIGH WIND GENERATION LED TO HIGH EXPORTS DURING WINTER 2020
As in 2019, in January, February and December of 2020 trade in CWE was significantlyaffected by net exports from Germany. In contrast to the summer months, a surplus in wind power generation during the winter months has been a key driver for these net exports. Figure 7 provides an overview of one of these characteristic exporting weeks from 14 to 21 December 2020.
The total actual grid load in Germany during this period is depicted in the graph at the top of Figure 7. In 2020, it was on a level comparable previous years, slightly below the average of 2015 to 2019. The effects of the restrictions related to the Covid19 pandemic, which have been even more restrictive than during the summer months, are not as obvious then during the lockdown from March to May. On average, the load in December 2020 has just been 0.2% lower than in December 2019.
The second graph in Figure 7 shows a surplus in generation related mainly to high wind power generation, while PV generation is commonly low during winter months. The hourly wind generation of onshore plus offshore power plants in Germany during this week was 19,000 MW28 on average. For comparison, the hourly average photovoltaics generation was just around 1,200 MW29.
Due to the higher average load of 57,300 MW compared to only 51,100 MW in the summer week from Chapter 3.2, combined coal and gas power generation was even higher during this week (average generation from lignite plus hard coal power plants was around 17,600 MW and natural gas power generation was around 7,500 MW).30
This high surplus of supply resulted in net hourly exports of 6,700 MW on average which add up to 1,128 GWh over the whole week. Figure 7 shows that the CWE net position of DELU during this week remained positive (exporting), except for a few hours on Wednesday morning and on Sunday around noon. By far the highest net exports in this week went to Austria (837 GWh at 5,800 MW peak), followed by France (286 GWh total, 4,500 MW peak). Due to the overall high wind power generation in northern Europe Denmark has additionally been exporting to Germany (333 GWh in this week with a 2,700 MW peak).
Compared to other weeks of the year, trading volumes in CWE were relatively high and the average dayahead wholesale prices were significantly above average at around €42.7/MWh31 in DELU. Moreover, price convergence was rather low during the whole week at around 23%32. This was a result of high loads and a generation shift to northern Germany and Denmark due to high wind power generation, which led to 444 limiting CNECs over this week. The share of internal network elements of Amprion was 7.2% with 32 monitored CNECs.
Figure 7: Example winter week with net exports of Germany33
Po
we
r g
en
era
tio
n i
n
Ge
rma
ny i
n G
W
80
70
60
50
40
30
20
10
0
Wind
Solar
Others
AT BE DE-LU FR NL
Ne
t p
osi
tio
n i
n C
WE
in
GW
10
8
6
4
2
0
-2
-4
-6
Ho
url
y i
mp
ort
/exp
ort
(D
A S
CE
) in
GW 10
5
0
–5
–10
15 16 17 18 19 20 2114Dec
2020 Date
AT BE DE-LU FR NL
Ele
ctr
icit
y D
A-p
rice
s
in C
WE
in
¤/M
Wh
80
70
60
50
40
30
20
10
0
–10
To
tal
actu
al
loa
d i
n
Ge
rma
ny i
n G
W
80
70
60
50
40
Range 2015–2019
2020
DA-prices
Import/export DE net position DE ➞ AT DE ➞ BE DE ➞ CH DE ➞ CZ DE ➞ DK DE ➞ FR DE ➞ LU DE ➞ NL DE ➞ NO DE ➞ PL DE ➞ SE
Net position
Load
Generation

AMPRION MARKET REPORT 2021AMPRION MARKET REPORT 2021
26 | MARKET ANALYSIS 2020 MARKET ANALYSIS 2020 | 27
3.4 INCREASING TREND OF PRICE CONVERGENCE IN CWE
LOWEST AVERAGE DAY-AHEAD PRICES AND HIGHEST PRICE CONVERGENCE SINCE INTRODUCTION OF FB MC IN CWE
As explained in Chapter 2, the Covid19 pandemic led to a 3.2% decrease in the total actual load in Germany. The share of renewable energies in power generation increased to 49.3% compared to 2019 and natural gas prices sank by –26%. Similar effects can be seen in other European countries. All of these factors led to a significant decrease in average dayahead prices in CWE from around €39.5/MWh in 2019 to just €32/MWh in 2020, continuing the trend of decreasing prices since 2018. Furthermore, the span between the average prices of CWE bidding zones decreased as well, from €3.2/MWh in 2019 to €2.7/MWh in 2020. In both years, the average dayahead prices in DELU were the lowest in CWE of €37.7/MWh in 2019 and €30.5/MWh in 2020. The highest prices in 2019 were observed in NL of €41.2/MWh. In 2020, the highest prices were observed in AT of €33.1/MWh. The development of dayahead prices in CWE is summarised in Table 1.
The highest CWE dayahead prices in 2020 were monitored on 21 September at 7 p.m. of €200.0/MWh in all CWE bidding zones. The lowest price was monitored on 13 April at 2 p.m. of –€115.3/MWh in BE. For comparison, the highest price in 2019 was €121.5/MWh in whole CWE and the lowest was –€500/MWh in BE.
Although such an extremely negative price as in 2019 did not occur in 2020, the overall amount of hours with negative prices increased by 41% to 298 h. The amount of hours with at least six continuous hours with
negative prices increased as well by 56% to 192 h. Again, this trend can be attributed to an increasing share of fluctuating renewable energies paired with a low load in 2020 due to the Covid19 pandemic.
In the case of sufficient crosszonal exchange capacities, no price differences between CWE bidding zones should occur. If commercial exchanges are limited by transmission constraints, prices between CWE bidding zones diverge. Accordingly, price convergence is an indicator of the level of market integration in the CWE region.
34 Source: https://transparency.entsoe.eu/
Bidding zone 2016 2017
2018 (DE-LU-AT)
2018 (DE-LU)
2019 2020
AT 59.91 40.05 33.14
BE 36.61 44.58 49.94 71.06 39.34 31.88
DE-LU 52.59 37.66 30.47
DE-LU-AT 28.98 34.18 41.72
FR 36.74 44.96 45.97 62.72 39.45 32.20
NL 32.24 39.30 49.80 60.60 41.19 32.24
Table 1: Day-ahead average price levels in CWE (in €/MWh)34
3%… increase in
hours with full
price conver-
gence in CWE
in 2020.
The reduction of price differences within a region is one of the main targets of market coupling. Sufficient crosszonal transmission capacities are a crucial prerequisite for achieving price convergence (i.e. where price differences equal zero).
The steady increase of hours with full price convergence in CWE provides evidence of the significant contribution of CWE TSOs in making transmission capacity available to the market, thereby achieving a costefficient balancing of supply and demand across the region35.
An overall increasing trend for price convergence in CWE is observed (cf. Figure 8). Whilethe full price convergence in CWE reached 49% in 2019 for a maximum price span of ±€1/MWh, a further increase to 52% has been observed in 2020.
In order to provide a more detailed evaluation of the CWE electricity market efficiency, different price deviation thresholds and combinations of bidding
zones have been further investigated in Figure 8. Both full price convergence in all five bidding zones and partial price convergence in only two to four bidding zones has been assessed. The results show that the level of convergence has raised in every category compared to 2019. In case of increasing threshold levels from ±€1/MWh to ±€5/MWh, the hours of full price convergence in all five bidding zones increase to 75.2%. For three out of five bidding zones already 77.5% of the hours converge below or equal to ± €1/MWh and in 97.3% of the hours below or equal to ±€5/MWh.
35 Other fundamental factors also significantly impact the market and prices as well. Examples are in particular the considerable changes in the generation mix described in this report (i.e. the decommissioning of conventional generation units and the increase of renewable energy production).
36 Source: https://transparency.entsoe.eu/
Figure 8: Price convergence in CWE in 2020 and differentiation
between full and partial price convergence36
In x bidding zones
+¤1/MWh (2019 – ref.) - +¤1/MWh - +¤3/MWh - +¤5/MWh -
Pri
ce
Co
nv
erg
en
ce
in
CW
E i
n 2
02
0
(Ho
urs
pe
r y
ea
r)
Full price convergence
5 BZs 4 BZs 3 BZs 2 BZs
Partial price convergence100%
80%
60%
40%
20%
0%
65
% 79
% 93
%
100
%
52
% 62
% 78
% 96
%
75
% 89
%
97
%
100
%
Pri
ce
co
nve
rge
nce
in
CW
E
(sh
are
of
ho
urs
pe
r ye
ar)
96
%
49
%
57
% 74
%

AMPRION MARKET REPORT 2021AMPRION MARKET REPORT 2021
28 | MARKET ANALYSIS 2020 MARKET ANALYSIS 2020 | 29
42 Report on the result of monitoring the margin available for cross-zonal electricity trade in the EU in the first semester of 2020
43 E.g. focus only on the day-ahead timeframe without consideration of long-term, intraday and balancing capacity; no full consideration of electricity exchanges with non-EU countries; exclusive focus only on some particularly low-margin network elements
44 Reaching full price convergence [i.e. 100% of all hours] is not an objective as such, because it would require overinvestment in network infrastructures’, ACER Market Monitoring Report 2020 on page 23
37 Instead, they have to be considered in the complex environment of changes, not only in the transmission capacity between bidding zones, but also with regards to changes in CO
2 and fuel prices as well as RES infeed, plant availabilities, electricity demand and weather
conditions.
38 Regulation (EU) 2019/943
39 A transmission network element is called “critical” when it is considered relevant for the European Market Coupling
40 cf. Article 16(8) of Regulation (EU) 2019/943
41 cf. Article 15 of Regulation (EU) 2019/943
Transmission capacity targets are one of the core elements of a piece of recently released legislation called ‘Clean Energy for All Europeans Package’ (CEP)38 which entered into force on 4 July 2019. One of its main provisions is that at least 70% of the capacity of internal and crosszonal critical39 network elements has to be made available for crosszonal electricity trading from 1 January 202040.
Germany, as well as Poland, the Netherlands, Romania and Austria, will not implement this 70% target immediately. These countries have opted for an exemption clause, a socalled ‘Action Plan’41. This Action Plan sets capacity targets which will start at a lower level and successively increase to 70% by 31 December 2025. Table 2 shows this increasing path (the linear trajectory).
EXCURSUS ON EU TRANSMISSION CAPACITY TARGET: GERMAN ACTION PLAN AND 70% TARGET
It is difficult to quantify the impact of the individual factors for this convergence rate as they cannot be analysed on a standalone basis37. The provision of an adequate transmission capacity level by TSOs does, however, positively impact the price convergence rate and hence market integration.
In addition to the 11.5% capacity target for 2020, Amprion has guaranteed the 20% minimum capacity introduced in the CWE region in April 2018 in compliance with system
security standards. Amprion has been able to fulfil both capacity targets on all CNECs at all times during 2020.
2020 2021 2022 2023 2024 2025 From31/12/2025
German CNECs in Core
11.5 21.3 31.0 40.8 50.5 60.3 70.0
Table 2: Percentage of the capacity of critical network elements
(CNECs) for Germany in the CCR Core
% of the capacity of critical network elements (CNECs)
Providing a sufficient and appropriate level of transmission capacity for European electricity trading is an essential joint European energy policy goal. Amprion shares and fully supports this target of further market integration. Yet the currently applied general target values may require some further analytical assessment.
In particular, the consideration of the following three economic principles seems to be beneficial:
• Minimum capacity targets have an effect only if their application leads to a provision of additional virtual trading capacity on network elements which are limiting the electricity market.
• In such cases, value is created only if the welfare gains due to increased crosszonal trading do outweigh the redispatch costs to cope with the overloads resulting from providing virtual trading capacities to the market.
• Minimum capacity targets can only serve as a transitionary solution, while targetoriented investment into network infrastructure is the superior way in the long run.
On a yearly basis, ACER releases a market monitoring report on the appropriateness of transmission capacity provision to the European market42. This report questions whether the transmission capacity provided by European TSOs in 2020 was sufficient, in particular with regard to the 70% capacity target. While this apparent shortcoming of transmission capacity provision can be explained by some specific analytical assumptions which ACER has taken43, ACER’s report also explicitly
excludes full (100%) price convergence as a target of European market integration44.
Our analysis has shown the increasing price convergence in CWE where during the year 2020 in 52% of all hours a full price convergence (± €1 /MWh) was achieved (cf. Figure 8 on page 27). Together with a further 13% of all hours with at least moderate price convergence (± €3/MWh), the CWE market was nearly unconstrained during 65% of all hours (cf. Figure 8 on page 27).
This existing high price convergence rate has been achieved by providing the 20% minimum capacity target applied in the CWE region as well as the 11.5% minimum capacity target included in the Clean Energy Package. Providing additional transmission capacity in compliance with the linear trajectory values indicated in Table 2 would increase price convergence levels even further. Such an increase would, however, require the use of costly remedial actions, a subject which will be discussed in the subsequent chapters. Ultimately, this also raises the question of the efficiency of such additional costly remedial measures, since their costs would have to be compared to the achievable gains and benefits, i.e. further increasing price convergence.
DO CEP MINIMUM TARGETS FOR CROSS-ZONAL TRADING CAPACITY CREATE VALUE FOR EUROPE?
AMPRION MARKET REPORT 2021AMPRION MARKET REPORT 2021
30 | MARKET ANALYSIS 2020 MARKET ANALYSIS 2020 | 31
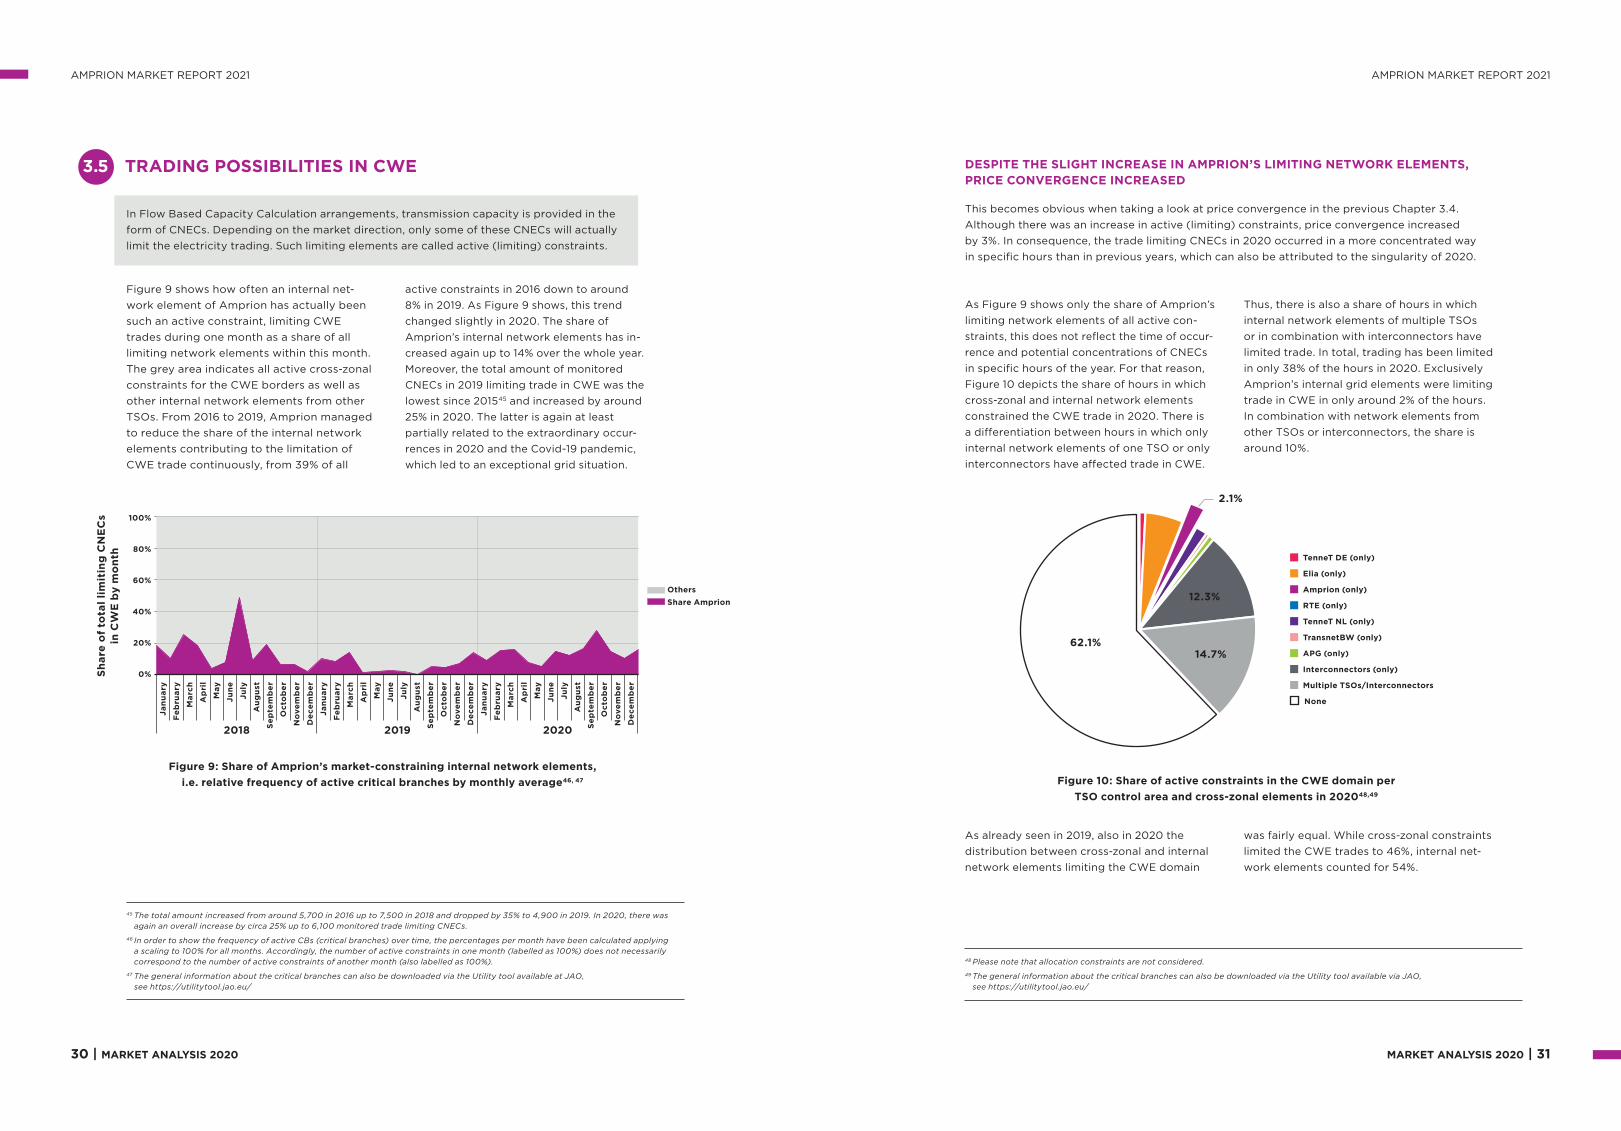
3.5 TRADING POSSIBILITIES IN CWE
Figure 9 shows how often an internal network element of Amprion has actually been such an active constraint, limiting CWE trades during one month as a share of all limiting network elements within this month. The grey area indicates all active crosszonal constraints for the CWE borders as well as other internal network elements from other TSOs. From 2016 to 2019, Amprion managed to reduce the share of the internal network elements contributing to the limitation of CWE trade continuously, from 39% of all
active constraints in 2016 down to around 8% in 2019. As Figure 9 shows, this trend changed slightly in 2020. The share of Amprion’s internal network elements has increased again up to 14% over the whole year. More over, the total amount of monitored CNECs in 2019 limiting trade in CWE was the lowest since 201545 and increased by around 25% in 2020. The latter is again at least partially related to the extraordinary occurrences in 2020 and the Covid19 pandemic, which led to an exceptional grid situation.
In Flow Based Capacity Calculation arrangements, transmission capacity is provided in the form of CNECs. Depending on the market direction, only some of these CNECs will actually limit the electricity trading. Such limiting elements are called active (limiting) constraints.
Figure 9: Share of Amprion’s market-constraining internal network elements,
i.e. relative frequency of active critical branches by monthly average46, 47
Sh
are
of
tota
l li
mit
ing
CN
EC
s
in C
WE
by m
on
th
100%
80%
60%
40%
20%
0%
2018 2019 2020
Ja
nu
ary
Fe
bru
ary
Ma
rch
Ap
ril
May
Ju
ne
Ju
ly
Au
gu
st
Se
pte
mb
er
Oc
tob
er
No
ve
mb
er
De
ce
mb
er
Ja
nu
ary
Fe
bru
ary
Ma
rch
Ap
ril
May
Ju
ne
Ju
ly
Au
gu
st
Se
pte
mb
er
Oc
tob
er
No
ve
mb
er
De
ce
mb
er
Ja
nu
ary
Fe
bru
ary
Ma
rch
Ap
ril
May
Ju
ne
Ju
ly
Au
gu
st
Se
pte
mb
er
Oc
tob
er
No
ve
mb
er
De
ce
mb
er
Others
Share Amprion
45 The total amount increased from around 5,700 in 2016 up to 7,500 in 2018 and dropped by 35% to 4,900 in 2019. In 2020, there was again an overall increase by circa 25% up to 6,100 monitored trade limiting CNECs.
46 In order to show the frequency of active CBs (critical branches) over time, the percentages per month have been calculated applying a scaling to 100% for all months. Accordingly, the number of active constraints in one month (labelled as 100%) does not necessarily correspond to the number of active constraints of another month (also labelled as 100%).
47 The general information about the critical branches can also be downloaded via the Utility tool available at JAO, see https://utilitytool.jao.eu/
48 Please note that allocation constraints are not considered.
49 The general information about the critical branches can also be downloaded via the Utility tool available via JAO, see https://utilitytool.jao.eu/
This becomes obvious when taking a look at price convergence in the previous Chapter 3.4. Although there was an increase in active (limiting) constraints, price convergence increased by 3%. In consequence, the trade limiting CNECs in 2020 occurred in a more concentrated way in specific hours than in previous years, which can also be attributed to the singularity of 2020.
As Figure 9 shows only the share of Amprion’s limiting network elements of all active constraints, this does not reflect the time of occurrence and potential concentrations of CNECs in specific hours of the year. For that reason, Figure 10 depicts the share of hours in which crosszonal and internal network elements constrained the CWE trade in 2020. There is a differentiation between hours in which only internal network elements of one TSO or only interconnectors have affected trade in CWE.
As already seen in 2019, also in 2020 the distribution between crosszonal and internal network elements limiting the CWE domain
Thus, there is also a share of hours in which internal network elements of multiple TSOs or in combination with interconnectors have limited trade. In total, trading has been limited in only 38% of the hours in 2020. Exclusively Amprion’s internal grid elements were limiting trade in CWE in only around 2% of the hours. In combination with network elements from other TSOs or interconnectors, the share is around 10%.
was fairly equal. While crosszonal constraints limited the CWE trades to 46%, internal network elements counted for 54%.
DESPITE THE SLIGHT INCREASE IN AMPRION’S LIMITING NETWORK ELEMENTS, PRICE CONVERGENCE INCREASED
Figure 10: Share of active constraints in the CWE domain per
TSO control area and cross-zonal elements in 202048,49
TenneT DE (only)
Elia (only)
Amprion (only)
RTE (only)
TenneT NL (only)
TransnetBW (only)
APG (only)
Interconnectors (only)
Multiple TSOs/Interconnectors
None
2.1%
12.3%
14.7%62.1%

AMPRION MARKET REPORT 2021AMPRION MARKET REPORT 2021
32 | MARKET ANALYSIS 2020 MARKET ANALYSIS 2020 | 33
Figure 11: Location of major active critical branches in FB MC of Amprion in 2020 as a
share of hours per year in which a sufficient capacity for cross-zonal trade is reached
NL
BE
LU
FR
CHAT
DE
0–95%
95–96%
96–97%
97–98%
98–99%
99–100%
100%
Legend
Unlimited trade
(in hours per year)
50 Available at: https://www.amprion.net/Strommarkt/Marktbericht/
The geographical location of the limiting Amprion elements in 2020 is shown in Figure 11.
With regard to internal elements, a particular focus lies on the northwestern area of the Amprion grid, which is influenced mainly by north German wind generation. In the last Amprion Market Report50, we showed that, in particular, the socalled ‘Emsland transmission lines’ were affected by the high wind power generation in northern Germany. In March 2019, the dynamic line rating (cf. Chapter 5) was introduced on these lines between TenneT DE and Amprion, resulting in a much lower need for redispatch measures and fewer limitations of trade in CWE in 2020.
Now, the remaining limiting network elements in this area are located near the DENL border around Gronau. The location of those limiting constraints indicates that congestion within Amprion is caused mainly by on and offshore wind as well as the importexport situation. Other major constraints can be found at the
southwest border to the French control zone (Vigy lines) and located close to Frankfurt (around Buerstadt). In case of the Vigy lines, the monitoring results of 2020 show that these lines solely constrain trade in import situations from France to Germany. Such effects can be related to specific locations of power plants, for example if power plants are located close to the border or crossborder lines like the Vigy lines.
Lower exports have led to a lower utilisation of Amprion’s transmission grid and therefore also to a lower restriction of the CWE trades. This finding is confirmed by the comparison of one particular week in July in which Germany was importing (Chapter 3.2) and a week in December in which Germany was continuously exporting (Chapter 3.3). The comparison shows that price convergence was higher in import situations where no Amprion CNECs were active and limiting CWE trade. During the characteristic export week, 32 internal Amprion CNECs were constraining the CWE market for 7.2% of the time.

AMPRION MARKET REPORT 2021AMPRION MARKET REPORT 2021
3.6 EXCURSUS: INTRODUCTION OF THE BALANCING ENERGY MARKET
Balancing service providers are offering two different, but closely connected, services to the grid: Balancing capacity and balancing energy. Balancing capacity is basically the ‘promise’ to be able to increase or decrease the generation on short notice, if this is necessary to balance the power system. The balancing energy is the amount of energy which is then actually activated on short notice for balancing purposes. So far, there has been a common market for balancing energy and capacity in Germany – and only accepted balancing capacity bids were allowed to offer balancing energy as shown in Figure 12. Since November last year, there have been six separate auctions for balancing energy every day – in which all balancing service providers could offer balancing energy, independent of their balancing capacity bids. Balancing service providers that have been awarded on the balancing capacity market have to participate in the balancing energy market at least with the procured volume. At the same time, the price limit for balancing energy was increased from €9,999/MWh to €99,999/MWh.
As the separation of the markets should increase the competition on the balancing energy market, lower balancing energy prices were expected. So far, the opposite has been observed: The liquidity in the market remained low and the prices for balancing energy increased significantly. Apparently, the intraday wholesale market is currently more profitable than the (intraday) balancing energy market, causing the low liquidity in the latter market segment. Since midJanuary, the old price limit of €9,999/MWh has been reintroduced, and so far also the price level for balancing energy seems to return to the price levels before the introduction of the balancing energy market.
With the separation of the balancing energy and balancing capacity market, Amprion and the other German TSOs are pursuing the way towards the target market described in the European guideline for electricity balancing. The next steps towards this goal will follow this year: The European aFRR (automatic Frequency Restoration Reserve) collaboration PICASSO will be connectionready towards the end of 2021/early 2022. Consequently, German TSOs will introduce 15minute balancing energy products, increasing the number of daily balancing energy auctions from 6 to 96.
34 | MARKET ANALYSIS 2020 MARKET ANALYSIS 2020 | 35
Figure 12: Process flow chart of balancing energy market introduced in 2020
Before November 2020 Since start of balancing energy market
Day-Ahead
AuctionBalancing energy
Day-AheadDelivery Day Delivery Day
AuctionBalancingenergy and capacity
AuctionBalancing capacity
AuctionBalancing energyAuction
Balancing energyAuctionBalancing energyAuction
Balancing energyAuctionBalancing energy

36 | GRID OPERATION ANALYSIS 2020 GRID OPERATION ANALYSIS 2020 | 37
AMPRION MARKET REPORT 2021AMPRION MARKET REPORT 2021
4. GRID OPERATION ANALYSIS 2020
4.1 REDISPATCH
INCREASING OPERATIONAL CHALLENGES DUE TO HIGHER SHARES OF FLUCTUATING RENEWABLE ENERGIES
In Chapter 3, the impact of transmission capacities on the electricity market has been analysed and described. The actual availability of these transmission capacities has to be ensured in realtime grid operation which is discussed in this Chapter 4. The overloading of grid elements and critical voltage situations have to be avoided by applying remedial actions, i.e. changing the grid topology and taking redispatch measures.
The generation of electricity at particular locations in the grid causes electrical load flows. In the event such load flows exceed the technical limitations on particular network elements, the power generation pattern has to be changed. This process is called redispatching, where TSOs must reduce power generation at dedicated locations in the grid
in order to alleviate the power flow on constrained network elements51. The two main driving forces of the German redispatch are wind infeed and the load as well as the supply situation in the south of Germany with significant power flows into this southern area.
IN 2020, REDISPATCH VOLUMES AND COSTS IN GERMANY WERE AT A RELATIVELY STABLE LEVEL AND COMPARABLE TO 2019 VALUES
51 In order to keep electricity generation and demand in balance, power generation has to be increased in other less constrained areas.
52 The reasons for the low redispatch volumes in 2019 (among others: low CO2 price as well as high non-availability of offshore
converter stations and as a result lower offshore wind infeed with correspondingly congestion of e.g. the ‘Emsland transmission lines’) were analysed and summarised in Chapter 4.2 of the previous Amprion Market Report from 2020 (https://www.amprion.net/Market/Market-Report/Market-Report-2020/).
In 2020, there were not any extraordin ary redispatch volumes in Germany. They increased slightly in comparison to 2019 where volumes were particularly low52. The latest observed trend of rising redispatch volumes and costs in 2020 is inconspicuous. The main reason for the increase is the higher infeed of renewables into the grid in combination with transits to southern Germany and other European countries, which leads to high load flows and
congestions. For the Amprion grid operation, congestions on the northern transmission lines (e.g. Emsland transmission lines, which are very sensitive to wind power generation in northern Germany as shown in Chapter 3.5) play a significant role.
Figure 13 illustrates the monthly redispatch volumes and costs for Germany with a focus on the Amprion share for the years 2018, 2019

AMPRION MARKET REPORT 2021AMPRION MARKET REPORT 2021
and 2020. For the whole of Germany as well as for Amprion, a moderate increase in redispatch volumes can be observed. Within this moderate increase, for Amprion the volume of voltageinduced redispatch, which increased
tenfold in 202053, deserves particular attention. An explanation of voltage induced redispatch and the associated effects and challenges of voltage control is provided in the following Chapter 4.2.
38 | GRID OPERATION ANALYSIS 2020 GRID OPERATION ANALYSIS 2020 | 39
250
200
150
100
50
0
Re
dis
pa
tch
co
sts
in ¤
mil
l.
Figure 13: Total monthly redispatch volumes and costs54
for Germany (including RES curtailment)55
Amprion Other DE TSOs
4,000
3,500
3,000
2,500
2,000
1,500
1,000
500
0Re
dis
pa
tch
vo
lum
es
in G
Wh
2018 2019 2020
Ja
nu
ary
Fe
bru
ary
Ma
rch
Ap
ril
May
Ju
ne
Ju
ly
Au
gu
st
Se
pte
mb
er
Oc
tob
er
No
ve
mb
er
De
ce
mb
er
Ja
nu
ary
Fe
bru
ary
Ma
rch
Ap
ril
May
Ju
ne
Ju
ly
Au
gu
st
Se
pte
mb
er
Oc
tob
er
No
ve
mb
er
De
ce
mb
er
Ja
nu
ary
Fe
bru
ary
Ma
rch
Ap
ril
May
Ju
ne
Ju
ly
Au
gu
st
Se
pte
mb
er
Oc
tob
er
No
ve
mb
er
De
ce
mb
er
RD volumes
RD costs
53 Already in 2019 the volume of voltage induced redispatch of Amprion increased sixteen times compared to 2018.
54 Volumes are presented according to the instructing principle (i.e. in which control area power plants have been started in order to cure redispatch. Amprion does not instruct RES curtailment and this data is therefore missing in the volumes for Amprion. Costs are presented according to the requester principle (i.e. what costs did incur in order to cure the requested redispatch).
55 Disclaimer: The data shown in the graph may differ from RD figures published elsewhere (e.g. EMFIP report), as other sources sometimes contain assumptions for additional costs that have not yet been invoiced. The graph published here contains only the additional costs actually invoiced.
4.2 CHALLENGES REGARDING VOLTAGE CONTROL
SYSTEM OPERATION FACES INCREASING OPERATIONAL CHALLENGES REGARDING VOLTAGE CONTROL DUE TO BOTH HIGH AND LOW VOLTAGE LEVELS AS WELL AS VOLTAGE FLUCTUATIONS
The aim of the voltage control is to maintain grid voltages within the operational voltage limits of 390–420 kV for the 380 kV level and 220–245 kV for the 220 kV level. Stable voltage in the grid is one necessary basis for the effective and efficient regulation of the power flow. Thus, voltage control means keeping the electrical network in a stable and operable condition as well as keeping electrical losses to a minimum. For this purpose, system control centres must control the reactive power infeed of power plants and operates additionally with different gridrelated measures, such as tap changing of transformers, operation of reactive power compensation units, power plants or converters, topology changes or switching off lowloaded lines. If these measures are not sufficient, marketrelated measures such as a voltagerelated redispatch might be activated.
During recent years, system operation has faced increasing operational challenges in terms of voltage control due to situations with persistent high or low voltage levels as well
as such situations with unexpected voltage fluctuations. On the one hand, this effect is driven by high powerflow transits, especially in a northsouth direction, which lead to high grid utilisations associated with high reactive power demands. On the other hand, major power plants are operating for fewer hours, especially in situations where high wind power infeeds cause powerflow transits in a northsouth direction. Other major power plants are going to be removed from the system and will be decommissioned. Thus, these power plants are no longer available for reactive power compensation and the total reactive power reserves of the system decrease. The resulting reactive power demands have to be compensated for by remaining active power plants or reactive power compensation units in order to maintain a constant voltage level within the operational limits. A lack of reactive power can lead to a decreasing or increasing voltage level outside the operational limits, which might, in the worst case, result in a voltage collapse.

AMPRION MARKET REPORT 2021AMPRION MARKET REPORT 2021
40 | GRID OPERATION ANALYSIS 2020 GRID OPERATION ANALYSIS 2020 | 41
High voltage levels:
An increasing number of periods with high voltage levels occur especially in offpeak situations such as weekends or holidays. Due to the decrease in load caused by the Covid19 pandemic, this effect became particularly apparent during the Easter holidays 2020 (09–14 April 2020).
During this period, a large part of the available reactive power from power plants and reactive power compensation units within the control area of Amprion were activated in order keep the voltage within the operational limits. Another tool of system operation that was used in this situation is the switching off of low loaded lines. This measure allows to decrease the system voltage, since the charging capacity of switched off lines is omitted and the increasing power flow on remaining overhead lines results in an increasing inductive power demand. During this specific situation up to 18 lowloaded lines with a total length of more than 1,000 km were put out of operation for reactive power compensation purposes. At this point all gridrelated measures had been activated considering the n1criterion
and the local stability of power plants. Despite the utilisation of comprehensive countermeasures, the voltage band was occasionally exceeded at individual points of the grid which clearly shows the need for reactive power compensation units at the trans mission grid level.
Low voltage levels:
Figure 14 shows the voltage profiles exemplary for 27 July 2020. During this day a high infeed from wind power plants in northern Germany caused high power transits from north to south. At approximately 6 p.m., system operation had already activated reactive power reserves based on the wind forecast in order to raise the voltage level in advance. In the following hours, the increasing northsouth transits due to the increasing wind power infeed caused the voltage to decrease. As a consequence, system operation increased the voltage level again by activating additional reactive power reserves. However, due to the high grid utilisation, the voltage level remained relatively low and volatile, especially in the southern part of the grid (e.g. Hoheneck).
Figure 15: Voltage fluctuations related to the
simultaneous change of infeed from generation units
420
415
410
405
400
5:45 6:00 6:15
Vo
lta
ge
in
kV
Hanekenfähr Bürstadt Rommerskirchen
Mon., 16 November Thur., 19 November Mon., 23 November
Hoheneck Weißenthurm
5:45 6:00 6:15 5:45 6:00 6:15
Voltage fluctuations:
Another challenge regarding voltage control is voltage fluctuations, which are related to the simultaneous change of infeed from generation units and which have occurred more frequently in the last years. This effect can be related to, for example, market incentives for directly marketed generation units or restrictions of operating hours due to noise protection. Figure 15 shows three example situations in which a voltage drop of up to 5 kV within few minutes occurred, when several wind power plants in northern Germany started their operation at 6 a.m. due to noise protection restrictions during nighttimes. In such situations, dynamic reactive power reserves
Amprion approaches the challenges regarding voltage control in different ways. By developing new methods for predicting the reactive power demand of the future system, new reactive power components and their location can be planned at crucial points in the grid in advance. Up to the year 2023, Amprion is planning to build 22 new reactive power compensation units with a total capacity of almost 5,200 MVAr. In addition, Amprion works on a system for dynamic security assessments
are essential to limit the voltage fluctuations. Thus, system operation keeps dynamic reactive power reserves available at all times. The increasing number of similar situations and their rising impact on the system show the increasing need for dynamic reactive power reserves at the transmission grid level. Furthermore, beside these nonfault effects, the impacts on the reactive power demand and voltage due to grid faults need to be taken into account anytime. Here reactive power reserves are also needed to handle grid faults and to support a return to a stable operation point. That is why the system operator not only keeps dynamic power reserves for power flow fluctuations, but also for possible grid faults.
which allows realtime voltage stability assessments during system operation and the determination of operational countermeasures. Moreover, new curative measures for stabilising the voltage level in emergency situations are developed and implemented. All these actions will contribute towards maintaining a stable system operation in the future as the number and impact of the previously described situations increases.
Figure 14: Voltage profiles during high north-south
power transits on 27 July 2020
418
416
414
412
410
408
406
404
402
400
8.00 10.00 12.00 14.00 16.00 18.00 20.00 22.00 0.00
25
20
15
10
5
0
Vo
lta
ge
in
kV
Win
d p
ow
er g
en
era
tion
in G
W
Hanekenfähr Bürstadt Rommerskirchen
Mon., 27 July
Hoheneck Weißenthurm Wind power Germany

AMPRION MARKET REPORT 2021
5. FUTURE DEVELOPMENTS
Further development and improvement of the existing electricity grid is the core business of TSOs, and in particular, an increase in transmission capacity, a reduction in congestions and an enhancement of trading capabilities. In 2021 and beyond, Amprion will support crosszonal trading by taking several additional measures.
The previous chapters have illustrated the main CWE market trends and Amprion’s operational activities in supporting current and future market integration. This section provides a short summary of Amprion’s planned future grid reinforcements and expansions. Strengthening our grid is an essential prerequisite for integrating renewables and alleviating the transmission constraints described in Chapter 3.5 and 3.6 which will accommodate further domestic and European electricity exchange. In the longer term, our plans will also pave the way for a fully integrated carbonneutral energy system by 2050 which is envisaged by the European Green Deal.
REINFORCEMENT AND EXPANSION OF THE EXISTING POWER GRID
Since 2015, Amprion received the permit granting for about 530 km of transmission lines. Furthermore, 457 km of the transmission lines that Amprion has to build based on the EnLAG56 and BBPlG57 have already been built by the end of 2020. Amprion is supporting the market by strengthening and extending its grid infrastructure by more than 1,500 km
FOR THE TRANSFORMATION OF THE EUROPEAN ENERGY SYSTEM, NEW CONCEPTS FOR THE INTEGRATION OF RENEWABLE OFFSHORE ENERGY AND SECTOR COUPLING ARE NECESSARY
42 | FUTURE DEVELOPMENTS
56 EnLAG = Energieleitungsausbaugesetz
57 BBPIG = Bundesbedarfsplangesetz
58 The Federal Requirements Plan Act which lists the transmission projects that are legally defined through the German parliament. The German TSO are obliged to implement these projects.
59 The update of the Federal Requirement Plan Act in 2021
AMPRION MARKET REPORT 2021
Figure 16:
Amprion’s overall concept
for the integration of offshore
energy and power-to-gas
This figure is only schematic and
con ceptual. It does not necessarily cor-
respond to any concrete grid planning.
Offshore connection
HVDC lines
Offshore grid
Amprion AC grid
Offshore wind power
Onshore wind power
PtG plant
in the next ten years. Two of Amprion’s light house projects are HVDC (highvoltage direct current) links from Emden in northern Germany to Osterath in western Germany and from Osterath to Philippsburg in southern Germany. These projects are known as the ANord project and the Ultranet project – one of the future cornerstones of the German transmission grid. Both projects are included in relevant legislation58. While the ANord project is planned as an underground cable system, the Ultranet project is planned as a hybrid system using the same pylons for DC lines in parallel to the already existing AC lines.
Considering the future developments in the German and European energy system up to 2030, the national grid development plan 2019 identified the need for an additional DC corridor from northern Germany to western Germany by 2030 (Corridor B – North). Amprion has already started the initial steps to develop this corridor, and the project is also included in the relevant legislation59. In the recent national grid development plan 2021, the need for one further DC corridor from northern Germany to the Frankfurt Area has been identified (Corridor B – South). Figure 16 shows all the planned DC projects of Amprion. These projects will support the German and European energy transition by effectively integrating the massively expanding wind power generation in northern Germany (as shown in Chapter 3.3) into the grid. In total, Amprion is planning grid investments of 24 billion euros over the next decade.
FUTURE DEVELOPMENTS | 43
AMPRION IS CONTRIBUTING TO THE TRANSFORMATION OF THE EUROPEAN ENERGY SYSTEM BY EXPANDING AND REINFORCING THE EXISTING TRANSMISSION GRID AND VIA NEW CONCEPTS FOR THE INTEGRATION OF RENEWABLE OFF SHORE ENERGY AND SEC TOR COUPLING WITH POWERTOGAS TECHNOLOGIES.

AMPRION MARKET REPORT 2021AMPRION MARKET REPORT 2021
44 | FUTURE DEVELOPMENTS FUTURE DEVELOPMENTS | 45
The integration of our ALEGrO project has marked a milestone for the CWE Market Coup ling and further increases the trading possibilities in CWE as mentioned in Chapter 3.5. The first day of commercial operation was for business day 18 November 2020 (allocation day 17 November 2020). ALEGrO represents the first connection between
Belgium and Germany and will play a major role in bringing the European electricity market closer together. Spanning a distance of 90 km, the highvoltage underground cable uses HVDC transmission technology and strengthens the security of supply in both countries and beyond. It is capable of carrying around 1,000 megawatts (MW) of power.
INTEGRATION OF THE ALEGRO DC-INTERCONNECTOR AS A MILESTONE IN ADVANCED AND FUTURE MARKET COUPLING
Further to building new infrastructure, Amprion is continuously optimising the use of its existing grid. For this purpose, we have introduced dynamic line ratings on several of our transmission lines, allowing higher electricity transmission under favourable weather conditions, i.e. low temperatures60. This measure allows for an increase in thermal limits of more than 20%, in particular during cold weather conditions which are usually associated with a high demand for electricity. In addition to the practical implementation of the network elements, the legal requirements according to §43f EnWG must be fulfilled. Especially different measures are necessary to keep voltage inductions into parallel infrastructures (e.g. gas pipelines) below certain threshold values.
Amprion’s dynamic line rating concept has been applied particularly to those network elements which have been constraining the CWE FB MC (cf. Figure 11 on page 32). In March 2019, the concept was introduced on
the Emsland transmission lines (Dörpen – Hanekenfähr) between TenneT DE and Amprion which have been a major bottleneck in the market (cf. Chapter 3.5. on page 30 to 33). This route also forms the crucial connection of the offshore HVDC converters in Dörpen to the AC grid in North RhineWestphalia. By increasing the maximum transmission capacity of the Emsland line by 25%, the need for redispatching has been significantly reduced, increasing the opportunities for offshore wind infeed in this area.
In order to further improve the impact of the weatherdependent operation of overhead lines on capacity and redispatch reduction, the next phase of the dynamic line rating concept has already been initiated. For this purpose, Amprion plans to install 200 weather stations by the end of 2022. Their measurements will allow for a better parameterisation of network models applied in operational congestion management processes.
FURTHER DEVELOPMENT OF THE DYNAMIC LINE RATING
60 Lower temperatures generally allow higher electricity transmission since the sag of overhead lines reduces. This allows for an increase in the maximum permissible power flow on a critical network element (Fmax) which is derived from the maximum current on a critical network element (Imax). Imax is the physical (thermal) limit of the critical network element, which depends on installed components (conductor, bundle, instrument transformer, etc.) and the weather conditions.
INNOVATIONS IN OFFSHORE RES INTEGRATION
We have shown the already existing high market impact of wind power generation (cf. example week described in Chapter 3.3). There are ambitious plans to extend this wind power generation further, both on a national and European level, and in particular targeted at offshore wind. For an efficient and flexible utilisation of this wind power generation, an integrated offshore and onshore system needs to be established stepwise. This future system will be a combination of offshore connection systems, partly up to the domestic load centres, as well as national and international offshore HVDC corridors. The diversity of such a setup needs to be considered within a modular structure and implemented
stepwise. Existing national and international planning processes still play a role in this context. They will be implemented autonomously but in close cooperation by all European partners. Only such a consideration of existing domestic plans and processes will ensure, simplify and accelerate the implementation of both European and domestic offshore wind power targets. Amprion is a partner in the Eurobar Initiative, where we are developing such concepts and are making them a reality with our European partners. Eurobar is following the idea that interfaces will be standardised for the upcoming generation of offshore connection technologies – making them ‘offshore grid ready’.
MULTI-SECTORIAL PLANNING SUPPORT
Our market analysis has shown that there are times with excessive renewable energy production, while at other times, renewable production falls short of the demand for electricity (cf. example days described in Chapter 1). This trend will increase with a higher share of renewable electricity generation. In particular, at times when, in future, demand falls short of excessive renewable electricity production, sector coupling technologies come into play. Sectors that were previously decoupled could then be connected and form an integrated energy system. Such an inte grated system needs a holistic system planning process that combines the current individual planning processes for energy infrastructure in a multisectoral way to ensure an affordable, effective and efficient energy transition in line with the European climate goals.
Beyond conventional grid planning, within ENTSOE Amprion has therefore developed the concept of MultiSectorial Planning Support (MSPS) together with several European partners. This holistic approach will link the nowadays separated planning processes of electricity and gas infrastructures. It will start with the identification of joint scenarios follow ed by economic and technical assessments aimed at finding different pathways to find a costefficient overall ‘one system’ solution.
In light of long lead times (several years) from the planning processes to the realisation of infrastructure, the approach should be implemented as soon as possible. This implementation of a synchronised planning process should take place both on European and national level.
In terms of powertogas facilities, their location determines how energy is trans ported – in the form of electricity or gas. As both ways result in different costs, the location of those facilities has to be considered in the planning processes. Furthermore, Amprion has developed a flexible operational strategy. At any given point in time, the strategy would determine the use of green electricity either as electricity consumption or the production of hydrogen (electricitygas switch). Together with our project partner OGE (Open Grid Europe), Amprion has furthermore set up the ´hybridge´ project to develop the powertogas technology to an industrial scale. The aims of the ´hybridge project´ are a combination of the technology scaleup and its systemsupportive operational use. We have pushed the project to a level that we could enter the permission phase. However, without a clear regulatory basis from politics we cannot realise the project.

46 | CONCLUSION AND OUTLOOK CONCLUSION AND OUTLOOK | 47
AMPRION MARKET REPORT 2021AMPRION MARKET REPORT 2021
6. CONCLUSION AND OUTLOOK
THE CURRENT DYNAMIC DEVELOPMENTS IN THE ELECTRICITY SYSTEM AND MARKET WILL CONTINUE OVER THE NEXT DECADES
This Market Report provides evidence of the dynamic electricity market environment in which Amprion operates together with many other institutions. It starts with an illustration of current and future changes in the electricity production pattern. The year 2020 was an exceptional year in many respects, with the outbreak of a global pandemic probably having a significant impact on the entire electricity system. The lockdown measures across much of Europe at the beginning of 2020 had significant impacts on the electricity market. The effects, such as a significant drop in energy demand and further changes in the generation mix, have been analysed and presented at the beginning of this report. All further analyses and comparisons with previous years are therefore characterised by the partly overlapping effect of the Covid19 pandemic. Nevertheless, some effects have further intensified in 2020 and in particular the increasing German imports in the summer months should be noticed. The net position of the DELU bidding zone is consistently high (exporting) during winter months and low (importing) during summer months. As in 2019, Germany became a net importer in several weeks during the summertime from May to October 2020. Some very specific situations (for example, high German imports in the summer) are analysed in detail in the report. The German net position is strongly dependent on the wind and solar infeed and shows rapid changes even within a few hours of a day.
The current dynamic developments will persist into the future. To accommodate the changing generation pattern, to facilitate the integration of renewables into the system and to ensure the physical transmission of increasing market
flows across Germany and Europe, Amprion is continuously enhancing and optimising its grid. The new interconnector ALEGrO went operational at the end of 2020. Since the golive of ALEGrO, which represents the first interconnection between the German and Belgian transmission grid, the Amprion grid is now interconnected with every foreign CWE TSO. This special role in Germany and in CWE is accompanied by our significant commitment to the European electricity market.
The European Green Deal accelerates the transformation of the European energy system to enable a fully integrated climateneutral system by 2050. As infrastructure is a key enabler of the European energy transition, European TSOs play an important role in meeting the objec tives of the Green Deal and in implementing a functioning internal energy market.
The role and capacity of the electricity grid as the backbone of the decarbonisation of all energy sectors is becoming increasingly important. By promoting the integration of renewables and enabling the integration of new clean energy technologies to plug into the energy system – including offshore renewable energy and hydrogen – the power grid is crucial to a reliable, affordable and sustainable energy system.
Decarbonisation by 2050 requires the planning of tomorrow’s infrastructure and development of sustainable concepts already today. With a view to making our transmission network fit for purpose and futureproof, we at Amprion think in the long term, take innovations into account and adapt our system planning in a continuous and flexible manner.

AMPRION MARKET REPORT 2021AMPRION MARKET REPORT 2021
48 | CONCLUSION AND OUTLOOK CONCLUSION AND OUTLOOK | 49
In order to secure a balanced and stable electricity system across Europe, strength ening, reinforcing and optimising the electricity grids are crucial prerequisites for a successful and efficient integration of renewables. For this purpose, Amprion is planning grid investments of 24 billion euros over the next decade. Achieving this goal requires local acceptance for the timely implementation of infrastructure projects and an adequate regulatory framework for investments, as well as investment certainty. A legislative and regulatory (financial) framework that actively supports the development of European energy infrastructure is therefore essential and should be promoted through the TENE revision.
The envisaged expansion of renewables will not be sufficient by itself and the electrical energy system of today will have to be enhanced. More flexibility, for example through seasonal storage and innovative concepts such as sector coupling and integration, is needed to make the energy system fit for purpose and decarbonised for the future. Here the TSOs can also be important enablers and market integrators for the energy transition process, using such instruments in a targeted and thus efficient manner.
An increasingly coupled and integrated energy system would be a strong support for achieving decarbonisation targets in other sectors (buildings, heat, transport and industry). This requires coherent infrastructure planning at national, regional and European level. The European grid should be jointly planned in the future by the electricity and gas TSOs.
Security of supply, sustainability and costs must be reconciled. In order to ensure a further reduction of CO2 emissions in line with the EU targets, while maintaining Europe’s security of supply and industrial competitiveness, crosssectoral approaches and technology diversity and neutrality, as well as flexible regulation are required. Since innovation requires the timely setting of a stable framework and the right incentives, an appropriate legal framework needs to be set up.

AMPRION MARKET REPORT 2021AMPRION MARKET REPORT 2021
50 | LIST OF ABBREVIATIONS SUMMARY | 51
LIST OF ABBREVIATIONS
ACER Agency for the Cooperation of Energy Regulators
aFRR Automatic Frequency Restoration ReserveALEGrO Aachen Liège Electricity Grid
OverlayCB Critical BranchCBCO Critical Branch Critical OutageCCR Capacity Calculation RegionCEE Central Eastern EuropeCEP Clean Energy Package CNE Critical Network ElementCNEC Critical Network Element and
ContingenciesCWE Central Western EuropeDA DayAheadENTSO-E European Network of
Transmission System Operators for Electricity
EU European Union FB MC FlowBased Market Coupling
Fmax Maximum Allowable Power FlowFref Reference Flow FRM Flow Reliability MarginHVDC HighVoltage Direct CurrentID IntradayImax Maximum Current on a Critical
Network ElementLTA LongTerm AllocationMAF Midterm Adequacy ForecastNRA National Regulatory AuthorityPST Phase Shifter TransformerPTDFs Power Transfer Distribution
FactorsRAM Remaining Available MarginRE Renewable EnergyRES Renewable Energy SourcesSIDC Single Intraday CouplingTEN-E TransEuropean Networks for
EnergyTSO Transmission System OperatorXBID CrossBorder Intraday Project
CONTACT
Lena Breuer
Amprion GmbH Economic Grid ManagementInternational AffairsRobertSchumanStraße 744263 Dortmund, Germany
Dr Peter Lopion
Amprion GmbH Economic Grid ManagementInternational AffairsRobertSchumanStraße 744263 Dortmund, Germany
IMPRINT
PUBLISHER Amprion GmbHPhone +49 (0) 231 584 914 109Fax +49 (0) 231 584 914 188Email [email protected]
CONCEPTION AND DESIGN artwork Hermann Eimers www.eimersartwork.de
PRINTING
Woeste Druck, Essen
PHOTOS Günther Bayerl (cover, back cover)Mustafasen, iStock (pages 2, 3)Frank Peterschröder (page 7)Wirestock, Freepik (page 10)Kjpargeter, Freepik (page 16)Daniel Schumann (page 35)Peter H., Pixabay (page 36)Daniel Schumann (page 46)Paul Langrock (page 49)
FURTHER INFORMATION IS AVAILABLE AT
www.amprion.net/Market/MarketReport/

Amprion GmbH
RobertSchumanStraße 744263 DortmundGermany May 2021