Embed Size (px)
Citation preview
8/13/2019 Amr Codecs
http://slidepdf.com/reader/full/amr-codecs 1/6
Impact of the GSM AMR Speech Codec on Formant Information Important to
Forensic Speaker Identification
Bernard J Guillemin, Catherine I Watson
Department of Electrical & Computer Engineering
The University of Auckland, Auckland, New Zealand
[email protected], [email protected]
Abstract
The Adaptive Multi-Rate (AMR) codec was standardized for the Global System
Mobile Communication (GSM) network in 1999. It is also the mandatory speech
codec to the Third Generation Wide Band Code Division Multiple Access (3G
WCDMA) systems. Its use in digital cellular telephony, if not already widespread,will soon become so. This paper reports on work in progress to examine the impact of
the narrowband version of this codec, at its various bit rates, on acoustic parameters
in the speech signal important for the task of forensic speaker identification (FSI).
The acoustic parameters specifically discussed in this paper are the first three formant
frequencies. We present representative examples of input and output distributions and
error scatter plots for Fi for the single word utterance ‘left’ for both a male and female
speaker. It is shown that though the impact on these parameters as a function of bit
rate can be quite significant, there is no consistent trend. However, there are clear
gender differences, likely caused by differences in pitch, with higher pitch female
speech being affected significantly more by the codec than that of lower pitch male
speech. In general formant frequencies are decreased by the codec, particularly in the
case of high-frequency formants. These findings are significant to the FSI task and
sound a distinct note of caution when analyzing speech that has been transmitted
over the cell phone network utilizing this particular codec.
1. Introduction
Forensic Speaker Identification (FSI) commonly
involves comparison of one or more samples of an
unknown voice, usually an individual alleged to have
committed an offence and referred to as the offender,
with one or more samples of a known voice, namely the
suspect. From the standpoint of a legal process, both
prosecution and defense are then concerned with
determining the likelihood that the two samples have
come from the same person, and thus be able to eitheridentify the suspect as the offender, or eliminate them
from further suspicion (Rose 2002). It is generally
accepted that a joint auditory-acoustic phonetic
approach is required for such tasks, with the auditory
analysis generally preceeding the acoustic (Nolan
1997).
As distinct from other forms of speaker
identification and verification, FSI brings with it its own
set of difficulties and challenges, among them being the
general lack of control over the offender and suspect
samples being compared (Rose 2002). This in turn often
significantly limits the mix of acoustic parameters that
can be reliably utilized. Two such parameter sets widely
used in FSI are vowel F-pattern and long-term
fundamental frequency, F0. The first of these is usually
limited to comparison of the centre frequencies of the
first two or three formants in individual vowel
segments, whereas for the latter the primary dimensions
are mean and standard deviation (Rose 2002).
There is an added complication with FSI, which
occurs in the majority of cases, that the samples being
analysed, particularly those of the offender, have been
acquired after transmission over the cell phone network.
The associated wireless channel is far from ideal, its
highly bandlimited characteristic being a key factor.The cell phone network incorporates a speech codec as
part of the solution to this problem, the primary function
of which is to compress the speech signal into a low bit-
rate stream. At the transmitter end the speech signal is
analysed into a reduced parameter set which is then
transmitted across the channel. At the receiving end the
speech signal is synthesized from this reduced
parameter set, resulting in input and output speech
signals which may well differ in respect to acoustic
parameters important to FSI. It is the extent of these
differences which is examined in this paper, and
Proceedings of the 11th Australian International Conference on Speech Science & Technology, ed. Paul Warren & Catherine I. Watson. ISBN 0 9581946 2 9
University of Auckland, New Zealand. December 6-8, 2006. Copyright, Australian Speech Science & Technology Association Inc.
Accepted after abstract only review
PAGE 483
8/13/2019 Amr Codecs
http://slidepdf.com/reader/full/amr-codecs 2/6
specifically the impact on the frequencies of the first
three formants.
Though the results presented here are very
preliminary, they suggest an impact which in some
cases can be quite significant.
There are a variety of codecs currently in use in cell
phone networks. The Adaptive Multi-Rate (AMR)codec has been chosen for this investigation because it
was standardized for use in Global System Mobile
Communication (GSM) networks in 1999. It is also the
mandatory speech codec for the Third Generation Wide
Band Code Division Multiple Access (3G WCDMA)
systems. Thus, its use in digital cellular telephony, if not
already widespread, will soon become so. The
narrowband versions of this codec has been chosen for
this phase of the investigation, the intention being to
extend this to the wideband version at a later stage.
An overview of the GSM AMR codec is given in
Section 2, followed by a discussion of the impact of
telephony in general on the task of FSI in Section 3.The experimental setup used in this investigation is
given in Section 4, followed by results and discussion in
Section 5.
2. Overview of the GSM AMR codec
Speech coders used for mobile telephony allocate a
certain number of bits for source coding (ie.,
compression) and channel coding (i.e., protection
against errors caused by noise and interference on the
radio link). The GSM AMR codec is unique from its
predecessors, such as the GSM Full Rate, Half Rate and
Enhanced Full Rate coders, in that there is no longerone fixed relationship between source coding and
channel coding bits. Rather, the coder has a number of
different modes, each with a different relationship. The
basic idea is that the AMR codec can adapt dynamically
to different interference conditions on the channel by
switching modes and thereby increase the bits allocated
to channel coding as the interference increases while
reducing those allocated to source coding.
In this respect, the narrowband AMR codec can
dynamically choose between eight source coding bit
rates: 4.75, 5.15, 5.90, 6.70, 7.40, 7.95, 10.20 and 12.20
kbits/s (refer 3GPP - 3rd Generation Partnership Project
website: http://www.3gpp.org/). The correspondingratio between source coding to channel coding varies
from roughly 50:50 for good channel conditions down
to 20:80 for poor conditions. Thus effectively the AMR
codec consists of eight separate sub-codecs, each
optimized for a particular bit rate.
Each sub-codec is based upon the code-excited
linear predictive (CELP) model which extracts the
parameters of the speech signal in terms of LP filter
coefficients, adaptive and fixed codebooks’ indices and
gains associated with the standard source filter model of
speech production (Schroeder and Atal 1985). It is
important to note, though, that the effective number of
bits allocated to each of these parameters changes for
each sub-codec, with each being designed with the
overall goal of achieving the best perceptual speech
quality, rather than maintaining the integrity of the
individual acoustic parameters that make up the speech
signal.Given that the GSM AMR codec can dynamically
switch between these sub-codecs depending upon
channel conditions, it follows that the effective quality
of reproduction of both the vowel F-patterns and F0 is
constantly changing.
3. Impact of telephony on FSI
Moye (1979) and more recently Rose (2003) noted that
telephone transmission does introduce a variety of
distortions into the acoustic signal which can negatively
impact upon FSI. Kunzel (2001) showed that the
bandpass characteristics of the transmission channel(350-3400 Hz.) can introduce errors into the
measurement of formant frequencies. Of particular
concern in this regard is the attenuation of low
frequency energy on the measurement of the frequency
of the first formant, F1, in those vowels having a low F1
value. He shows that the frequency of F1 is significantly
higher (by as much as 14%) when measured from
speech transmitted over the telephone network than
from direct recording.
The speech coding systems (e.g., CELP, LPC and
GSM) used in both landline as well as mobile telephony
also negatively impact upon the measurement of both
vowel F-patterns as well as F0 (Assaleh 1996, Phythianet al 1997).
There also appears to be degradation issues specific
to the mobile network. One early study by McClelland
(2000) has suggested that the measurement of F0 for
mobile calls may be increased by as much as 30 Hz.
over the same measurement for landline calls. A more
recent study by Byrne & Foulkes (2004) has examined
the effect of the mobile phone network on the
measurement of vowel formants. They have shown that
the increase in the measurement of F1 may be as high as
29%, rather than 14% observed for the landline
network, with individual shifts being as high as 60%.
It is important to note that the study reported herediffers from that of Byrne & Foulkes (2004) in that we
have focused on the impact of the codec alone on the
formant frequencies, whereas they examined the impact
between input and output of the mobile phone network
as a whole, which includes the codec as one
component.
In this regard, the authors of this paper previously
examined the impact of this particular codec on F0
(Guillemin, Watson & Dowler 2005). It was shown
that although the mean of F0 is not greatly affected by
this codec at the different bit rates at which the codec
Proceedings of the 11th Australian International Conference on Speech Science & Technology, ed. Paul Warren & Catherine I. Watson. ISBN 0 9581946 2 9
University of Auckland, New Zealand. December 6-8, 2006. Copyright, Australian Speech Science & Technology Association Inc.
Accepted after abstract only review
PAGE 484
8/13/2019 Amr Codecs
http://slidepdf.com/reader/full/amr-codecs 3/6
operates, the standard deviation of F0 can sometimes be
increased significantly. Percentage increases of up to
76% were observed in that study, these in part being
caused by the codec sometimes changing the voicing
probability for individual frames. We observed that in
about 7% of cases, unvoiced frames had been
reclassified as voiced, the converse happening in about2% of cases.
4. Experimental setup
The speech corpus used in this study was the route
database, developed by Williams & Watson (1999),
consisting of the spontaneous speech from speakers
giving instructions on how to get from a set point to 7
different destinations. This was chosen because it was
felt that it more closely represented conversational
speech such as that typical of mobile phone recordings.
There were 8 speakers, all spoke Australian English and
were aged between 20 to 40 years: 3 female (referred toas fa, fb and fc) and 5 male (referred to as ma, mb, mc,
md, and me). Recordings were made using a high
quality Sony ECM-44B lapel-pin microphone and
stored in 16-bit uniform PCM format at a sampling rate
of 11 kHz.
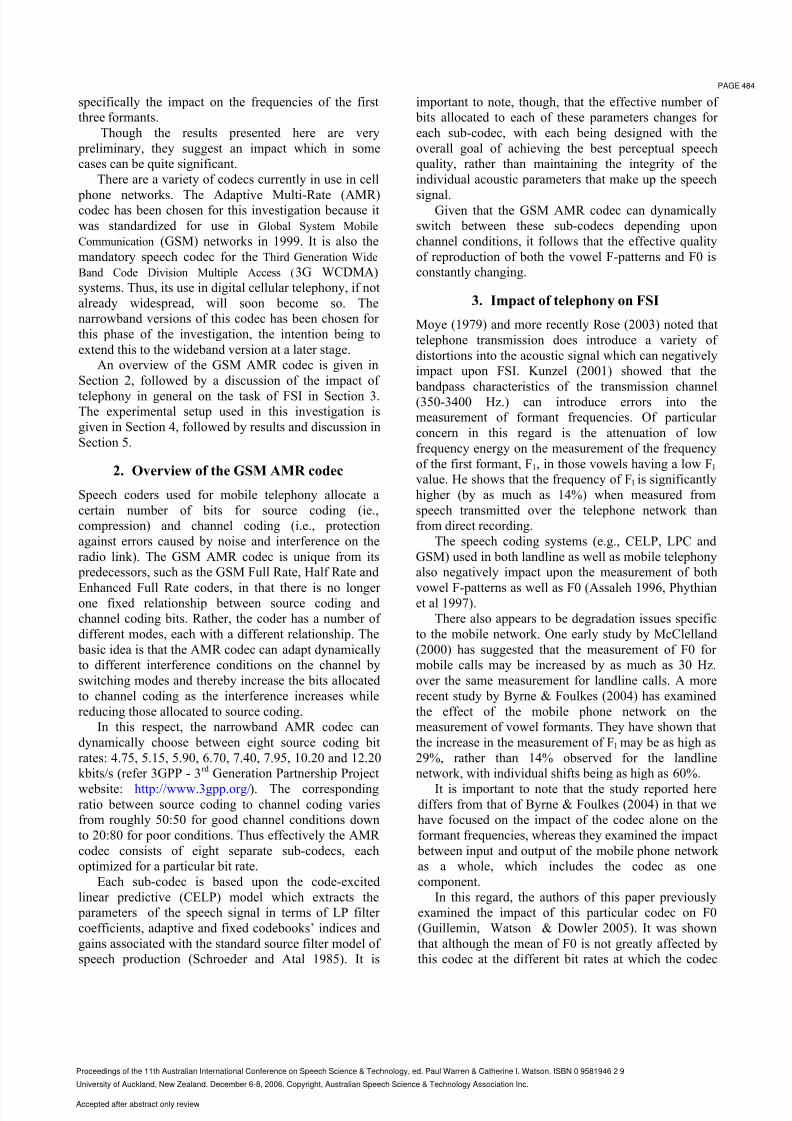
Figure 1 shows the experimental setup used for this
study. It has two separate processing paths, one which
performed a formant frequency tracking on the original
11 kHz speech signal, the other on the signal that had
passed through the codec. The speech that was
processed through the codec was first down sampled to
8 kHz and converted into13-bit uniform PCM to
conform to the codec’s input requirements. It was then passed sequentially through the coder and decoder
sections of the AMR codec, before being up sampled
again to 11 kHz, 16-bit uniform PCM prior to being
input to the feature tracker. The original speech was
also passed through the same formant tracker, the
outputs from the two formant trackers then being input
to an analysis package in order to compare the resulting
statistics.
Speech
f s=11kHz
Down
Sample
11→ 8kHzCoder Decoder
AMR Codec Up
Sample
8→11kHz
Formant
Tracker
(ESPS)
Analysis
Package(EMU/R)
Formant
Tracker
(ESPS)
Speech
f s=11kHz
Down
Sample
11→ 8kHzCoder Decoder
AMR Codec Up
Sample
8→11kHz
Formant
Tracker
(ESPS)
Analysis
Package(EMU/R)
Formant
Tracker
(ESPS)
Speech
f s=11kHz
Down
Sample
11→ 8kHz
Down
Sample
11→ 8kHzCoder Decoder
AMR Codec Up
Sample
8→11kHz
Up
Sample
8→11kHz
Formant
Tracker
(ESPS)
Formant
Tracker
(ESPS)
Analysis
Package(EMU/R)
Analysis
Package(EMU/R)
Formant
Tracker
(ESPS)
Formant
Tracker
(ESPS)
Figure 1: Diagram of experimental setup
Though the AMR codec can dynamically change
between its various bit rates depending upon channel
conditions, in this study the speech of each of the
speakers was passed through the codec eight times, the
codec being fixed at one of its eight bit rates for each
pass. This permitted the impact of each of the coder’s
sub-codecs to be examined separately. We used an
ANSI-C implementation of the AMR codec (refer 3GPP
- 3rd
Generation Partnership Project website).
We used the ESPS formant tracker from the EMU
speech database system (Cassidy 2005) with a frame
size of 100ms. The analysis of the resulting formantfrequencies was done using R (Leisch 2005) in
conjunction with the EMU speech library (Cassidy
2005).
For each speaker we had between 53 -118 seconds
of input speech data. From this spontaneous speech we
selected four isolated words for analysis, namely ‘left’,
‘right’, ‘go’ and ‘turn’. These were chosen because each
occurred relatively frequently for all speakers (on
average about 8 tokens/word for each of the speakers),
thus giving us a number of tokens of each word for
analysis. In addition, these words were likely to be in
stressed positions in phrases and hence not suffering
from reduction.The words were extracted from the recordings and
segmented into 100ms frames. For the voiced frames,
the first three formants were tracked. For each speaker,
and for each word, the probability density distributions
of F1, F2 and F3 were obtained, both from the original
speech data and from the speech data that had passed
through the codec at each of the 8 codec bit rates. In
addition, for each speaker and for each word, scatter
plots were obtained comparing the formant data from
the input speech with that produced by the codec. As
was mentioned previously in respect to our earlier work
on pitch (Guillemin, Watson & Dowler 2005), for a
small percentage of frames the codec changes their
voicing probability. When undertaking the formant
tracking, we were careful, therefore, to restrict our
analysis to voiced frames where the voicing probability
had not changed. An analysis of the impact of the codec
as a function of frequency was then performed on the
resulting data.
5. Results and discussion
Representative analysis results showing the impact of
the codec on the frequency of the 1st formant for the
word ‘left’ are shown in Fig. 2. Results are shown for
one of the female speakers (fa) and one of the malespeakers (mb), these results being chosen because they
are representative of differences linked to gender (i.e.,
pitch). The number of tokens of the word ‘left’ for
speakers fa and fb were 6 and 9, respectively.
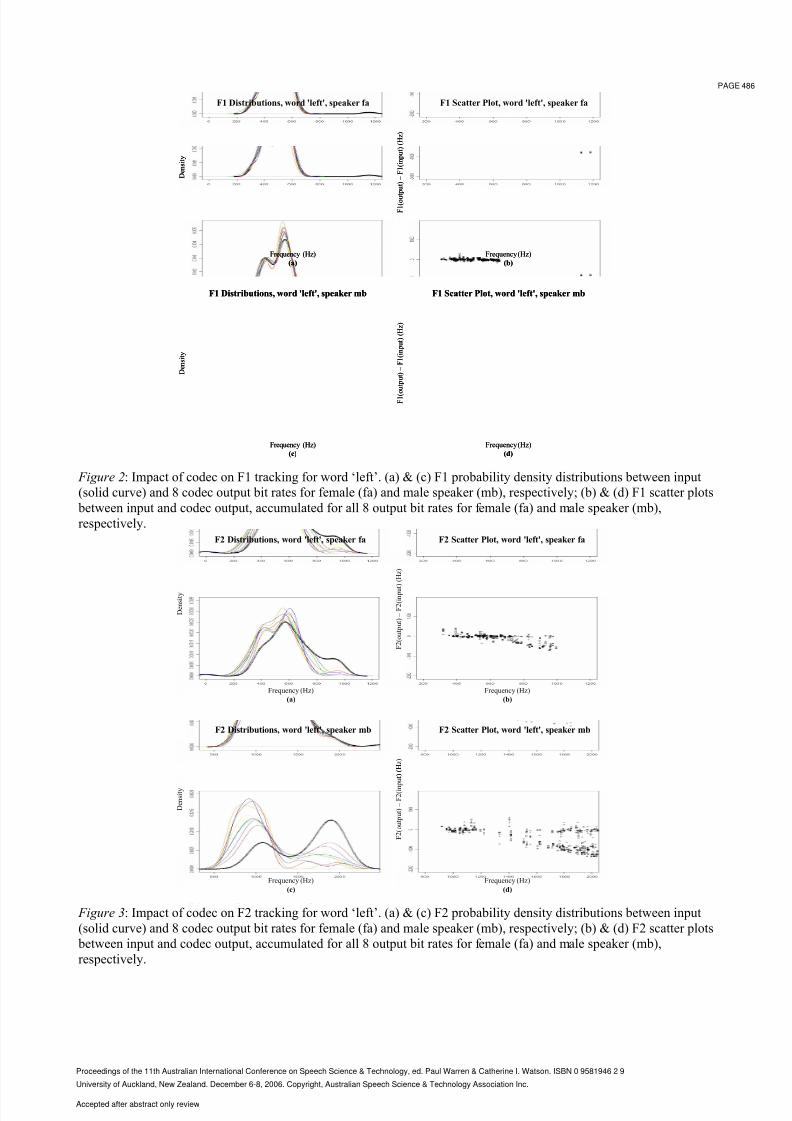
Figure 2(a) shows the probability density
distributions of F1 for the female speaker, fa. The solid
curve shows the F1 probability density distribution for
the input speech, with the other curves corresponding to
the probability density distributions for the codec output
at each of the 8 codec bit rates. During our study we
observed no consistent trend in respect to the impact at
Proceedings of the 11th Australian International Conference on Speech Science & Technology, ed. Paul Warren & Catherine I. Watson. ISBN 0 9581946 2 9
University of Auckland, New Zealand. December 6-8, 2006. Copyright, Australian Speech Science & Technology Association Inc.
Accepted after abstract only review
PAGE 485
8/13/2019 Amr Codecs
http://slidepdf.com/reader/full/amr-codecs 4/6
F1 Distributions, word 'left', speaker fa
F1 Distributions, word 'left', speaker mb
F1 Scatter Plot, word 'left', speaker fa
F1 Scatter Plot, word 'left', speaker mb
Frequency (Hz)
(a)
Frequency (Hz)
(b)
Frequency (Hz)
(c)
Frequency (Hz)
(d)
D e n s i t y
D e n s i t y
F 1 ( o
u t p u t ) – F 1 ( i n p u t ) ( H z )
F 1 ( o u t p u t ) – F 1 ( i n p u t ) ( H z )
Figure 2: Impact of codec on F1 tracking for word ‘left’. (a) & (c) F1 probability density distributions between input
(solid curve) and 8 codec output bit rates for female (fa) and male speaker (mb), respectively; (b) & (d) F1 scatter plots
between input and codec output, accumulated for all 8 output bit rates for female (fa) and male speaker (mb),
respectively.F2 Distributions, word 'left', speaker fa
F2 Distributions, word 'left', speaker mb
F2 Scatter Plot, word 'left', speaker fa
F2 Scatter Plot, word 'left', speaker mb
Frequency (Hz)
(a)
Frequency (Hz)
(b)
Frequency (Hz)
(c)
Frequency (Hz)
(d)
D e n s i t y
D e n s i t y
F 2 ( o u t p u t ) – F 2 ( i n p u t ) ( H z )
F 2 ( o u t p u t ) – F 2 ( i n p u t ) ( H z )
F2 Distributions, word 'left', speaker fa
F2 Distributions, word 'left', speaker mb
F2 Scatter Plot, word 'left', speaker fa
F2 Scatter Plot, word 'left', speaker mb
Frequency (Hz)
(a)
Frequency (Hz)
(b)
Frequency (Hz)
(c)
Frequency (Hz)
(d)
D e n s i t y
D e n s i t y
F 2 ( o u t p u t ) – F 2 ( i n p u t ) ( H z )
F 2 ( o u t p u t ) – F 2 ( i n p u t ) ( H z )
Figure 3: Impact of codec on F2 tracking for word ‘left’. (a) & (c) F2 probability density distributions between input
(solid curve) and 8 codec output bit rates for female (fa) and male speaker (mb), respectively; (b) & (d) F2 scatter plots
between input and codec output, accumulated for all 8 output bit rates for female (fa) and male speaker (mb),
respectively.
Proceedings of the 11th Australian International Conference on Speech Science & Technology, ed. Paul Warren & Catherine I. Watson. ISBN 0 9581946 2 9
University of Auckland, New Zealand. December 6-8, 2006. Copyright, Australian Speech Science & Technology Association Inc.
Accepted after abstract only review
PAGE 486
8/13/2019 Amr Codecs
http://slidepdf.com/reader/full/amr-codecs 5/6
F3 Distributions, word 'left', speaker fa
F3 Distributions, word 'left', speaker mb
F3 Scatter Plot, word 'left', speaker fa
F3 Scatter Plot, word 'left', speaker mb
Frequency (Hz)
(a)
Frequency (Hz)
(b)
Frequency (Hz)
(c)
Frequency (Hz)
(d)
D e n s i t y
D e n s i t y
F 3 (
o u t p u t ) – F 3 ( i n p u t ) ( H z )
F 3 ( o u
t p u t ) – F 3 ( i n p u t ) ( H z )
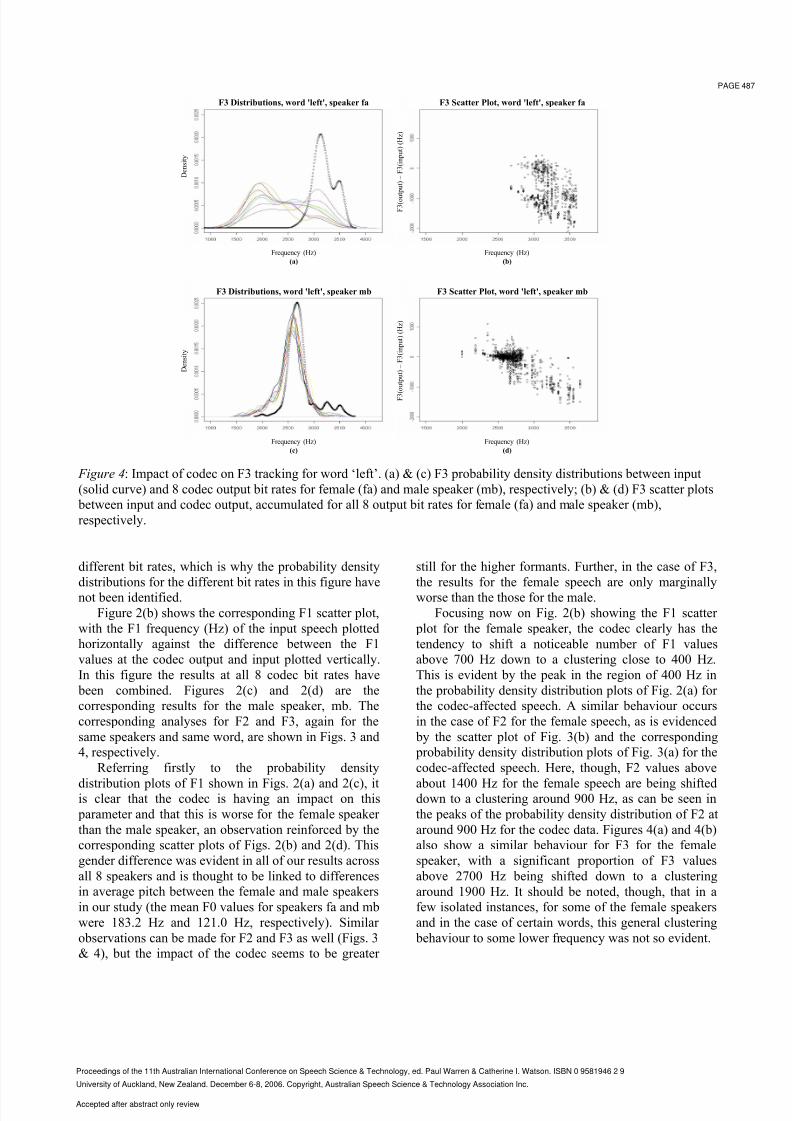
Figure 4: Impact of codec on F3 tracking for word ‘left’. (a) & (c) F3 probability density distributions between input
(solid curve) and 8 codec output bit rates for female (fa) and male speaker (mb), respectively; (b) & (d) F3 scatter plots
between input and codec output, accumulated for all 8 output bit rates for female (fa) and male speaker (mb),
respectively.
different bit rates, which is why the probability density
distributions for the different bit rates in this figure have
not been identified.
Figure 2(b) shows the corresponding F1 scatter plot,
with the F1 frequency (Hz) of the input speech plotted
horizontally against the difference between the F1
values at the codec output and input plotted vertically.
In this figure the results at all 8 codec bit rates have
been combined. Figures 2(c) and 2(d) are the
corresponding results for the male speaker, mb. The
corresponding analyses for F2 and F3, again for the
same speakers and same word, are shown in Figs. 3 and
4, respectively.
Referring firstly to the probability density
distribution plots of F1 shown in Figs. 2(a) and 2(c), itis clear that the codec is having an impact on this
parameter and that this is worse for the female speaker
than the male speaker, an observation reinforced by the
corresponding scatter plots of Figs. 2(b) and 2(d). This
gender difference was evident in all of our results across
all 8 speakers and is thought to be linked to differences
in average pitch between the female and male speakers
in our study (the mean F0 values for speakers fa and mb
were 183.2 Hz and 121.0 Hz, respectively). Similar
observations can be made for F2 and F3 as well (Figs. 3
& 4), but the impact of the codec seems to be greater
still for the higher formants. Further, in the case of F3,
the results for the female speech are only marginally
worse than the those for the male.
Focusing now on Fig. 2(b) showing the F1 scatter
plot for the female speaker, the codec clearly has the
tendency to shift a noticeable number of F1 values
above 700 Hz down to a clustering close to 400 Hz.
This is evident by the peak in the region of 400 Hz in
the probability density distribution plots of Fig. 2(a) for
the codec-affected speech. A similar behaviour occurs
in the case of F2 for the female speech, as is evidenced
by the scatter plot of Fig. 3(b) and the corresponding
probability density distribution plots of Fig. 3(a) for the
codec-affected speech. Here, though, F2 values above
about 1400 Hz for the female speech are being shifteddown to a clustering around 900 Hz, as can be seen in
the peaks of the probability density distribution of F2 at
around 900 Hz for the codec data. Figures 4(a) and 4(b)
also show a similar behaviour for F3 for the female
speaker, with a significant proportion of F3 values
above 2700 Hz being shifted down to a clustering
around 1900 Hz. It should be noted, though, that in a
few isolated instances, for some of the female speakers
and in the case of certain words, this general clustering
behaviour to some lower frequency was not so evident.
Proceedings of the 11th Australian International Conference on Speech Science & Technology, ed. Paul Warren & Catherine I. Watson. ISBN 0 9581946 2 9
University of Auckland, New Zealand. December 6-8, 2006. Copyright, Australian Speech Science & Technology Association Inc.
Accepted after abstract only review
PAGE 487
8/13/2019 Amr Codecs
http://slidepdf.com/reader/full/amr-codecs 6/6
We observed that it was rare to see this same
behaviour for the male speech. Indeed, though the
scatter plot of F3 for the male speaker (Fig. 4(b)) shows
that a downward-shift in frequency is taking place, a
clustering from high frequency to some lower frequency
is not occurring, as is evidenced by the probability
density distribution plots for the codec-affected speechshown in Fig. 4(c).
Overall, formant frequencies tend to be decreased as
a result of passing through the codec. In fact, we
observed downward shifts in F1, F2 and F3 of up to
70% in isolated cases for the three female speakers over
the four words used in this investigation.
6. Conclusions
One worrying conclusion from this study, in respect to
undertaking FSI on speech that has been recorded after
transmission over the GSM mobile phone network, isthat the GSM AMR codec used in these networks can
in some cases have a major, and often unpredictable,
impact upon the measurement of formant frequencies.
There are clear gender differences, with female speech
(i.e., high pitch) being affected significantly more by
the codec than male speech (i.e., low pitch). Formant
frequencies (F1, F2 & F3) tend to be decreased. Further,
and particularly in respect to the female speech, the
codec seems to have the tendency to shift formant
frequencies from one part of the frequency band down
to another. Shifts of 500 Hz or more were quite
common in our investigation. The reasons for these
shifts, in terms of the way in which the codec isoperating, are not at all clear at this stage. But it would
be interesting to look at formant bandwidths, as
apparent shifts in formant frequencies may in fact be
linked to difficulties in peak picking associated with the
process of locating the formants. Finally, in terms of the
behaviour described above, there appears to be no
consistent trend, as a function of the various bit rates at
which this codec can operate.
Given that it is becoming increasingly common for
those engaged in FSI to be undertaking there analysis
on speech that has been recorded from cell phone
conversations, the results of this study, albeit very preliminary, are of major concern.
7. References
Assaleh, K. T. (1996). Automatic evaluation of speaker
recognizability of coded speech. International
Conference on Acoustics Speech and Signal Processing
1, 475-478.
Byrne, C. and Foulkes, P. (2004). The mobile phone effect on
vowel formants. Speech, Language and the Law 11/1, 83-
102.
Cassidy, S. (2005). The EMU speech data base. Retrieved on
22 November 2006, last retrieved from
http://emu.sourceforge.net/.
Guillemin, B.J., Watson, C. I. and Dowler, S. (2005). Impact
of the GSM AMR speech codec on acoustic parameters
used in forensic speaker identification. 8th International
Symposium on DSP and Communications Systems (DSPCS’2005), Noosa Heads, Australia, 61-66.
Kunzel, H.J. (2001). Beware of the telephone effect: the
influence of telephone transmission on the measurement
of formant frequencies, Forensic Linguistics 8/1, 80-99.
Leisch, F. (2005). The comprehensive R archive network.
Retrieved on 22 November 2006, last retrieved from
http://cran.r-project.org/.
McClelland, E. (2000). Familial similarity in voices. BAAP
Colloquium, University of Glasgow.
Moye, L.S. (1979). Study of the effects on speech analysis of
the types of degradation occurring in telephony. Harlow:
Standard Telecommunication Laboratories Monograph,Vol. 1.
Nolan, F. (1997). Speaker Recognition and Forensic
Phonetics (pp. 744-767). In Hardcastle and Laver (Eds.).
Phythian, M., Ingram, J. and Sridharan, S. (1997), Effects of
speech coding on text-dependent speaker recognition.
IEEE Region Ten Conference, 137-140.
Rose, P.J. (2002). Forensic Speaker Identification, Taylor &
Frances, London & New York.
Rose, P.J. (2003). The technical comparison of forensic voice
samples (Ch. 99). In I. Freckelton & H. Selby (Eds.),
Expert Evidence, Sydney: Thomson Lawbook Company.
Schroeder, M.R. and Atal, B.S (1985). Code-excited linear
prediction (CELP): high quality speech at very low bit
rates. Proceedings of the International Conference on
Acoustics Speech and Signal Processing, 937-940.
Williams, S. and Watson, C.I. (1999). A profile of the
discourse and intonational structures of route
descriptions. 6th European Conference on Speech
Communication and Technology, (Eurospeech’99),
1659-1662.
3GPP - 3rd Generation Partnership Project. Retrieved on 22
November 2006, last retrieved from http://www.3gpp.org/.
Proceedings of the 11th Australian International Conference on Speech Science & Technology, ed. Paul Warren & Catherine I. Watson. ISBN 0 9581946 2 9
University of Auckland, New Zealand. December 6-8, 2006. Copyright, Australian Speech Science & Technology Association Inc.
PAGE 488


![Network Working Group J. Sjoberg Audio Codecs Adaptive Multi-Rate Wideband (AMR-WB) speech codec [3] was originally developed by 3GPP to be used in GSM and 3G cellular systems.Authors:](https://img.pdfslide.net/doc/110x75/5ac12d3f7f8b9a213f8cca69/network-working-group-j-sjoberg-audio-codecs-adaptive-multi-rate-wideband-amr-wb.jpg)