Embed Size (px)
Citation preview

An Action Plan for Fixing the Specialized High School Admissions Process
Office of the Bronx Borough President Ruben Diaz Jr.
May 2012

2
Introduction
In late 2009, the Office of Bronx Borough President Ruben Diaz Jr. organized
stakeholders into three affinity groups that, together, make up the Bronx Education Consortium
(BEC). Each group is charged with identifying promising practices, barriers to performance and
resources to close the educational achievement gap in the Bronx. They meet regularly with
Borough President Diaz to articulate issues and design solutions regarding educational
performance in the Bronx. One of the outcomes of the BEC was the first ever Bronx Education
Summit, “From Cradle to Career.” Held on October 15, 2011, the Summit featured workshops, a
panel of prominent education leaders and keynote speeches from New York City Schools
Chancellor Dennis Walcott and Dr. Diane Ravitch, a best-selling author and highly regarded
education reformer. This action plan is an outgrowth of that summit.
Bronx enrollment in gifted and talented (G&T) programs has been a focus of the BEC for
the last two years, and was an important issue raised at the Bronx Education Summit. In 2011, a
total of 14,086 pre-school students from across the City sat for the G&T placement test for
students entering kindergarten, an increase of 1,632 (11.5 percent) from the previous year. The
BEC took a leadership role in promoting the exam, which historically saw a small percentage of
Bronx students sit for the test. In the Bronx, 1,475 total pre-K students sat for the test, an
increase of 254 (17.2 percent) from the previous year.
The number of Bronx students taking the test increased at a rate outpacing the rest of the
City. Unfortunately, we saw only a modest improvement in Bronx students qualifying. In 2011,
a total of 245 Bronx students qualified for kindergarten G&T programs, up slightly from 230
students in 2010. However, the number of Bronx students eligible for more rigorous Citywide
G&T programs saw a sharp decline, from 111 total students in 2010 down to 88 in 2011.

3
Moreover, those Bronx students who do qualify for G&T programs are often inadequately
serviced by the Department of Education (DOE). In 2011, fewer than 25 students qualified for
G&T programs in three Bronx school districts (7, 9 and 12). As a result, the DOE did not offer
G&T classes in those districts.
We see similar issues at the middle school level, resulting in Bronx students being
underrepresented at New York City’s top public high schools. In fact, a majority of the students
at our borough’s two premiere public high schools--the Bronx High School of Science and the
High School for American Studies at Lehman College--do not reside in the Bronx. The trend is
perpetuated by inadequate preparation of Bronx students for the Specialized High Schools
Admissions Test (SHSAT), the sole metric for determining acceptance into eight out of nine
Specialized High Schools. On February 11, 2011, the City announced that 5,404 students
received an offer to a specialized school, compared to the 5,261 students the year before. In that
year, approximately 28,000 students sat for the exam citywide. As noted in The New York Times
in 2009:
“racial and ethnic imbalances show up in the populations of the eight high schools
requiring the exam . . . [T]he city school system is about 40 percent Hispanic, 32 percent
black, 14 percent Asian and 14 percent white. But at Stuyvesant High School, for
instance, more than two-thirds of its 3,247 students are Asian (up from 48 percent in
1999). Three percent are Hispanic, and two percent are black.”i
According to 2010 Census Data, the Bronx accounts for 16 percent of the City’s population. It is
more than 30 percent Black and over 50 percent Hispanic, a group that is not only younger than
the overall population but is projected to increase faster than any other racial group. A study
conducted by the Community Service Society concluded that Hispanic children currently
comprise 33.9 percent of New York City’s six-and-under population. Of the City’s population
aged 16-and-under, Hispanic children constitute the largest share with 34.1 percent.ii Moreover,

4
Hispanic and Black children comprise more than 60.5 percent of the population under 16.iii
However, only 333 Bronx students received an invitation to attend a specialized high school. If
the invitations had simply reflected the City’s population, the Bronx would have received almost
three times as many seats (See chart on Page 8). The 2012 numbers produced similar results.
About the Specialized High Schools
The SHSAT is a timed multiple-choice test with two sections, verbal and math, that must
be completed in a total of 2 hours and 30 minutes. In the first section, students demonstrate their
verbal reasoning and reading comprehension by ordering sentences to form a coherent
paragraph, answering questions of logical reasoning, and analyzing and interpreting texts. In the
second section, students demonstrate their math skills by answering computational and word
questions that require arithmetic, algebra, probability, statistics, geometry, and trigonometry (on
the Grade 9 test only). The Specialized High Schools are:
1. Queens High School for the Sciences at York College
2. Staten Island Technical High School
3. Fiorello H. LaGuardia High School of Music & Art and Performing Arts
4. High School for Mathematics, Science and Engineering at City College
(Manhattan)
5. Stuyvesant High School
6. Bronx High School of Science
7. High School of American Studies at Lehman College (Bronx)
8. Brooklyn Technical High School
9. The Brooklyn Latin School
SHSI Background
The Department of Education initially began to address the increased underrepresentation
of Black and Hispanic students at these high schools in 1995, under then-Chancellor Ramon
Cortines. “At the time, the numbers were actually better than they are now: Bronx Science’s
enrollment was 10.7% black and 9.2% Hispanic; Stuyvesant’s was 4.8% black and 4.3%
Hispanic.”iv

5
v
However, the Specialized High Schools Institute (SHSI) has had poor results in achieving its
goals, and has had to reassess its eligibility criteria due to litigation. This year the DOE will offer
the SHSI at four Bronx sites and, beginning in 2012, will enroll sixth and seventh grade students.
While the programs are run by the principals in the schools they are housed, recruitment tactics
and eligibility criteria are set by the DOE.
The Specialized High Schools are the top schools in our public system, and
underrepresentation of Bronx students in these schools perpetuates poverty and prohibits upward
mobility. Without changes to the current eligibility criteria of the SHSI, unequal access to
educational opportunity will only worsen. For example, the SHSI eligibility criteria require
applicants to have a minimum of 90 percent attendance in the previous school year. This is
problematic for the Bronx because of its nation leading asthma rates and other health concerns.
The New York City Department of Health has determined that the asthma hospitalization rate for
Bronx children is 70 percent higher than the rest of the city, and 700 percent higher than the rest

6
of New York State (excluding New York City).vi
Asthma is the leading cause of school
absenteeism in the Bronx.vii
An “analysis of Department of Education (DOE) data found that more than 20 percent of the city’s
elementary school pupils were chronically absent during the 2007–08 school year—that is, they missed at
least 20 days of the 185-day school year. In districts serving poor neighborhoods, the numbers are even
higher. In the south and central Bronx, in central Harlem, and in several neighborhoods in central
Brooklyn, 30 percent or more of the pupils were chronically absent, according to the analysis. In contrast,
only 5.2 percent of pupils were chronically absent in District 26, which serves the middle class
neighborhood of Bayside, Queens.”viii
Among ethnic groups in New York City, Latino and Black middle school students have
the highest asthma rates, with 20.1% and 20% respectively.ix
Otherwise eligible children have
been and continue to be precluded from the program, further aggravating the underrepresentation
of Bronx children in these schools.
The Bronx has six of the city’s school districts (numbers 7 through 12). Districts 7, 9 and
12 are among the poorest in the country, and District 10 is one of the largest in New York State.
However, the seat allocation for the SHSI assigned 100 total seats to Districts 7, 9 and 12. It also
assigned 100 seats each to Districts 8, 10, and 11. Consequently, the seat distribution creates
unequal access to students all across the Bronx. The three districts with the greatest need will
have to share 100 seats. Also, students in the largest district will have significantly greater
competition for seats relative to other students in the Bronx and the City as a whole.

7
Below are the students to SHSI seat ratios:
Ratio of Students to SHSI Seats for All Bronx Districts
District 2012 - 6th graders
Ratio of
Students to Seats
7 1,341
9 2,891
12 1,800
7,9, and 12 6,032 Ratio = 60:1
11 3,081 Ratio = 30:1
8 2,229 Ratio = 22:1
10 4, 035 Ratio = 40:1
A closer look at SHSI enrollment demonstrates that its reach is marginal and is, in fact,
perpetuating the problem. SHSI participants that received an offer to attend a specialized high
school were less than 7% of the total number of offerees in 2011 and 2010, and less than 5% in
2009. Enrollment by ethnicity was also unreflective of the city’s population. Hispanic
enrollment has dropped in half, from 414 in 2009 to 209 in 2011. White enrollment increased
from 49 to 67, then decreased to 57 in years 2009, 2010 and 2011 respectively. Asian enrollment
more than tripled, from 156 to 481 in one year from 2009 to 2010, then dropped slightly to 421
in 2011 (See chart on pages 17-18). Black enrollment declined by a smaller margin, going from
260 in 2009, to 227 in 2010, and again 227 in 2011.

8
Magnitude of Inequality of Educational Opportunity
The SHSI by itself will not remedy the underrepresentation of Bronx students at the
Specialized High Schools, given the severity of the problem. In an attempt to quantify the
distortion, we reviewed the number of offers to specialized high schools by borough from 2008
and 2012, and then compared them to what those numbers would have looked like if they aligned
with the actual population using recent United States Census American Community Survey data
as the benchmark:
Population Estimates by Borough for 2000 and 2010
Borough 2000 2010 % of Total
Bronx 1,332,650 1,397,287 16.65%
Brooklyn 2,465,326 2,567,098 30.59%
Manhattan 1,537,195 1,629,054 19.41%
Queens 2,229,379 2,306,712 27.49%
Staten Island 443,728 491,730 5.86%
New York City 8,008,278 8,391,881 100%
Data Set: 2009 Population Estimates , American Community Survey
We found that over each of the last five years the Bronx has, on average, received about a third
of the number of seats it should have received if these numbers reflected the borough’s share of
the actual population, or an absolute loss of 2,858 seats that should have gone to Bronx children.
Comparing Actual and Adjusted SHSI Seats for the Bronx from 2008-2012
Year Actual Adjusted Absolute Variation
Percentage of
Actual Seats
Relative to Adjusted
2012 322 908 -586 35.46%
2011 333 915 -582 36.39%
2010 354 891 -537 39.73%
2009 294 889 -595 33.07%
2008 316 874 -558 36.16%
Total 1,619 4,477 -2858

9
Comparing Actual and Adjusted Total Test Takers for All Boroughs for 2012
Bronx Brooklyn Manhattan Queens Staten Island Total
Actual 4,693 9,197 3,352 8,487 1,883 27,612
Adjusted 4,677 8,460 5,357 7,535 1,582 27,611
Variation +16 +737 -2005 +952 +301
Moreover, we found significant drop off in Bronx students sitting for the exam after 2009, which
coincides with the court order settlement entered on November 26, 2008, in regards to a lawsuit
filed in the U.S. District Court for the Eastern District of New York by the Center for Individual
Rights (CIR) alleging racial discrimination in the implementation of SHSI admissions. We
subtracted the actual number of SHSAT test takers from the adjusted for borough population
numbers, then averaged the 2008 and 2009 numbers and compared them to the average of 2010
through 2012 numbers:
Adjusted Borough Numbers for SHSI Test Takers from 2008-2012
Bronx Brooklyn Manhattan Queens Staten Island
2012 -16 -737 2,005 -952 -301
2011 82 -1,019 2,059 -888 -233
2010 28 -949 1,783 -642 -219
Average 31 -902 1,949 -827 -251
2009 378 -739 1,256 -750 -144
2008 414 -911 1,174 -479 -198
Average 396 -825 1,215 -615 -171 1 Actual number of SHSAT test takers subtracted from the adjusted for borough population numbers and then averaged
The Bronx had the most significant drop off in terms of average variation between the actual and
adjusted numbers. Prior to the court ordered settlement, SHSI policies were geared at enrolling
Black and Hispanic students. Consequently, Bronx students were sitting for the exam in greater

10
numbers. It should also be noted that Brooklyn and Queens would respectively have about 800
and 900 fewer students a year sit for the test if the numbers reflected their borough’s population.
In addition to fewer Bronx students sitting for the exam, the underrepresentation of Bronx
students at Specialized High Schools is further exacerbated by insufficient preparation for the
SHSAT. As noted in The Stuyvesant Spectator, many, if not most, of the current students at
Stuyvesant participated in some sort of prep course:
“Every Stuyvesant student was admitted by scoring high enough on the SHSAT. Many of these students
prepared for the exam by taking SHSAT prep classes and spending their weekends or summers doing
practice tests. A provocative trend is that most of the students who take preparatory classes come from
Asian families . . . In largely East Asian communities such as Flushing and Chinatown, test prep centers,
like Aim Academy and Mega Academy, boast their statistics of Specialized High School entrants.”x
Indeed, an entire private industry has surfaced to prepare children for the SHSAT. We
researched these programs and found over 25 entities providing SHSAT classes, which is by no
means an exhaustive list (See chart on pages 24-27). In fact, many of these programs do not
advertise and rely solely on word of mouth. Using the 25 programs we were able to identify as a
sample group, our analysis found that most of these programs do not provide services in the
Bronx. Even if Bronx parents were to travel to another borough, such as Queens, which houses
the vast majority of these programs, the costs are prohibitive. Overall, prep programs, including
those offered by popular behemoths such as Kaplan and Princeton Review, were highly unlikely
to divulge data on the number of students who took their programs and those that were accepted
to a Specialized High School.
For those prep programs that offer one-on-one instruction on a per hour basis, the average
cost per session was roughly $162.50. Generally, instructors suggested a minimum of 20 hours
of instruction, though that decision was to be made at the parents' discretion. Other programs
only offered one-on-one instruction packages, dictated by a set price and number of hours.

11
Group sessions proved just as diverse in scope. The majority of classes were offered on a
semester basis, with schedules beginning in March/April for Spring, June/July for Summer, and
September for Fall. While some prep programs did admit to seeing the occasional 6th grader in
their class, these programs were intended for students studying in 7th grade and preparing to take
the SHSAT in the Fall. The range for group sessions varied from $399.00 to $3,600 per
semester. Furthermore, more than 64 percent (9/14) of the prep programs that offered group
tutoring were located in Queens. During phone interviews, employees admitted that the majority
of their clientele was comprised of local Queens residents. Only three of the 14 prep programs
offering group tutoring were located in the Bronx, and all only provided one classroom location.
However, we did discern from phone interviews with program employees that Bronx
students are a rarity among attending students. This is confirmation of the economic duality that
permeates the Bronx. There are, in fact, Bronx families who not only know about test preparation
services offered throughout the City but also have the financial means to pay for out-of-Borough
preparation. The scarcity of Bronx students in these test prep programs substantiates our
assertion that Bronx families are either uninformed of these services, cannot afford to pay for
them, or a combination of both. The dearth of Bronx students in these programs is indicative of
the income disparity that exists among Bronx families, regardless of race.xi
Contrary to the
perception of poverty that permeates assumptions about the economic status of Bronx families,
2010 Census Data shows that over 37 percent of families make over $49,000 in annual income.
For these families, seeking out-of-borough test prep is a nuisance but not an impossibility. For
the remaining 62.7 percent of Bronx families whose average annual income is $36,000, however,
test prep services remain allusive.
12
The ideal solution would provide services for both income populations and will require
immediate and long term collaboration between the Department of Education and individually-
run test prep businesses. There is a high demand for these services, but a scarcity in supply. The
DOE created the SHSI for the express purpose of providing test prep services for families who
could not afford private sector prices. The DOE, however, has proven resilient in its reluctance to
venture into the Bronx.
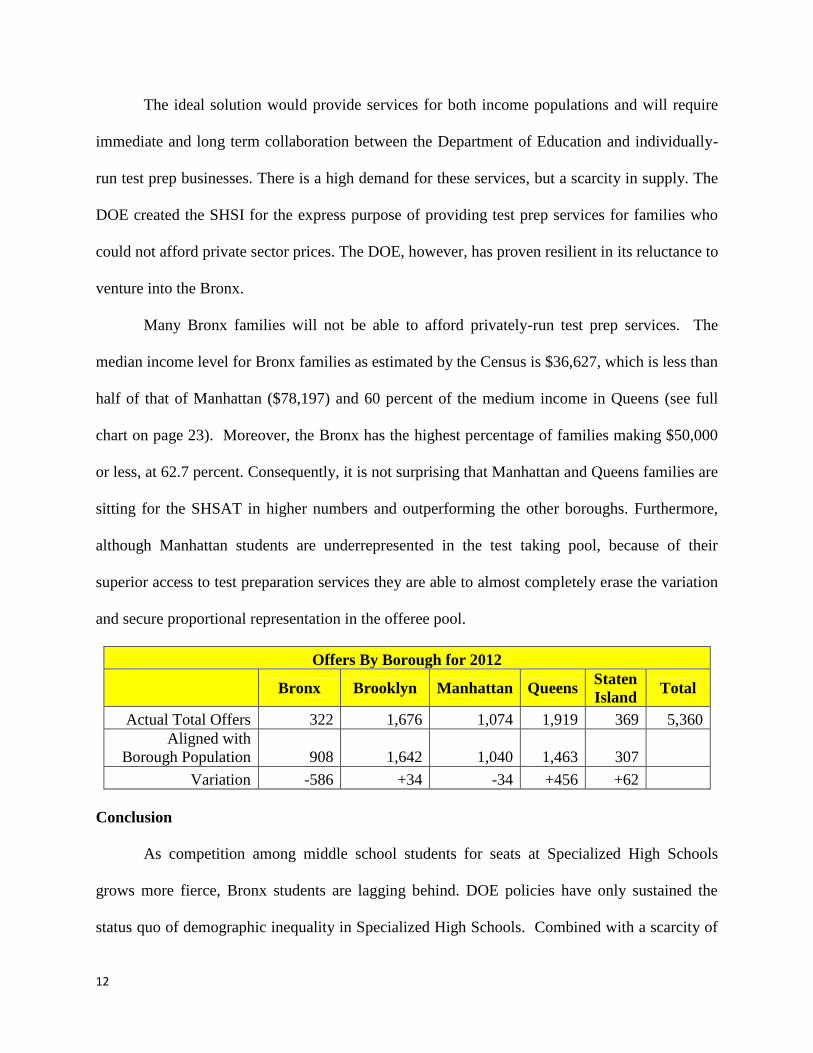
Many Bronx families will not be able to afford privately-run test prep services. The
median income level for Bronx families as estimated by the Census is $36,627, which is less than
half of that of Manhattan ($78,197) and 60 percent of the medium income in Queens (see full
chart on page 23). Moreover, the Bronx has the highest percentage of families making $50,000
or less, at 62.7 percent. Consequently, it is not surprising that Manhattan and Queens families are
sitting for the SHSAT in higher numbers and outperforming the other boroughs. Furthermore,
although Manhattan students are underrepresented in the test taking pool, because of their
superior access to test preparation services they are able to almost completely erase the variation
and secure proportional representation in the offeree pool.
Offers By Borough for 2012
Bronx Brooklyn Manhattan Queens
Staten
Island Total
Actual Total Offers 322 1,676 1,074 1,919 369 5,360
Aligned with
Borough Population 908 1,642 1,040 1,463 307
Variation -586 +34 -34 +456 +62
Conclusion
As competition among middle school students for seats at Specialized High Schools
grows more fierce, Bronx students are lagging behind. DOE policies have only sustained the
status quo of demographic inequality in Specialized High Schools. Combined with a scarcity of

13
adequate and affordable SHSAT preparatory programs, these policies have resulted in an ill-
prepared and ill-equipped Bronx student body.
Students have a greater chance at academic success and future economic mobility if they
engage in rigorous academic learning and preparation, as outlined in “Unclogging,
Strengthening, and Insulating the Bronx Educational Pipeline,” a policy paper published by the
Bronx Borough President’s Office in March 2012. A significant majority of Bronx students must
overcome disadvantages that their peers in other boroughs do not have to face. Among those are
prevalence of severe health issues, such as asthma, which prevent them from maintaining high
attendance rates; poor community and parental support, and a lack of institutional preparation
programs to help them excel. Improvements in the quality of education Bronx students receive
can only occur if the DOE is determined to make the necessary changes that will provide Bronx
students with the opportunities that will allow them to excel at the SHSAT and earn coveted SHS
seats.
The Specialized High Schools’ reliance on the SHSAT as the sole means of determining
who gains admittance is outdated and inconsistent with how most, if not all, high performing
academic institutions select a student body. Our city’s elite private secondary schools, like
Horace Mann, Dalton, and Riverdale County Day School, do not rely exclusively on the SSAT to
pick their students. More and more colleges are placing less value on SAT scores, and no ABA
accredited law school would ever look at just an LSAT to admit a student. For example, many of
the nation’s universities have become participants in the Posse Scholars program, including, but
not limited to Vanderbilt University, Middlebury College, Brandeis University and UC Berkeley.
A recent profile in The New York Times highlighted their success, noting that their students are
high achieving despite lower average SAT scores:

14
“Most Posse Scholars would not have qualified for their colleges by the normal criteria. Posse Scholars’
combined median reading and math SAT score is only 1050, while the median combined score at the
colleges Posse students attend varies from 1210 to 1475. Nevertheless, they succeed. Ninety percent of
Posse Scholars graduate — half of them on the dean’s list and a quarter with academic honors. A survey of
20 years of alumni found that nearly 80 percent of the respondents said they had founded or led groups or
clubs. There are only 40 Posse Scholars among Bryn Mawr’s 1,300 students, but a Posse student has won
the school’s best all-around student award three times in the past seven years. Posse is changing the way
universities look at qualifications for college, and what makes for college success.”xii
Just as these universities have found high performing candidates by going beyond the SAT, we
cannot allow the SHSAT to continue to be the lone criterion for the Specialized High Schools.
Students in the poorest school districts should be incentivized and rewarded for high
performance in the classrooms, rather than excluded from a quality high school because of a
largely imperfect test. The following recommendations should be enacted by the DOE:

15
Recommendations:
The DOE and Bronx organizations must partner to ensure that a SHSI site, or its
equivalent, should exist in each Bronx school district.
The number of seats at each district should reflect the size of the school district, not an
arbitrary number assigned to each site. Instead, the DOE should implement a consistent
district size to seat ratio.
The 90 percent attendance criterion should be removed from the eligibility standards for
the SHSI.
Priorities for seat allocation should be given to those that demonstrate significant
financial need though a more objective metric than Title I free lunch, be it W2s, pay
stubs, food stamps/EBT, etc..
Multiple pathways for automatic admission to a Specialized High School should be
implemented, including, but not limited to:
1) The top 5% of each Bronx middle school graduation class should be given an
automatic seat at a Specialized High School. This will serve as an explicit
incentive to children and drive performance.
2) Currently, Fiorello H. LaGuardia High School is the only Specialized High
School that allows audition and submission of a portfolio. A comparable
opportunity should be allowed for math and science portfolios.
3) As noted in recently introduced Bill Assembly 09064/Senate 6589, we
recommend the DOE “establish procedures and standards for the admission to the
special high schools of the city district, including the grade point averages of
applicants, personal statements of interest submitted by applicants and such other

16
factors as the city board shall determine to be necessary.” This Bill has been was
introduced by Assemblyman Karim Camara, cosponsored by Assembly Members
Peter Rivera, Jeffrion Aubry, Rafael Espinal, Marcos Crespo, Felix Ortiz, Annette
Robinson, Samuel Roberts, Naomi Rivera, Robert Rodriguez, Nick Perry, David
Weprin. The multi-sponsors include William Boyland, Vanessa Gibson, Carl
Heastie, and Michelle Schimel. The Bill was introduced in the Senate by Senator
Adriano Espaillat.
The top 15% of each Bronx middle school’s 5th
and 6th
grades should be given automatic
offers into a SHSI program.
The number of seats at Specialized High Schools needs to increase, either by expanding
the existing schools or creating more Specialized High Schools. For example, in 2011,
28,281 students sat for the SHSAT, of which only 5,404 (or 19 percent) were extended
offers. This is too low.
The DOE must create another citywide middle school in the Bronx that will cater to high-
achieving Bronx students.
Gifted and talented admissions should be expanded to include the top 20 percent of first
grade test takers Citywide, rather than the current 10 percent. This will double the
number of students exposed to higher level academic work at an early age.
All students who qualify for a gifted and talented program should be guaranteed a seat in
a gifted and talented program.

17
*Unknown column includes private/parochial students, multi-racial students and students whose parents
refused to sign the application
**Last year cohort was recruited by the former regions. Additional students were not recruited to fill
attrition (Court Order)
SHSI Participant (P)/Test Taker (TT) Data
Year SHSI
Participants
Ps who took
test
% of Ps
who did not
take test
Total
TTs who
received
offer
% of
TTs who
received
offer
Total
students
received
an offer
% of
offerees
who were
SHSI
grads
2011
Asian 421 418 0.71% 259 61.96%
Black 227 204 10.13% 38 18.63%
Hispanic 209 189 9.57% 39 20.63%
White 57 49 14.04% 19 38.78%
Native
American/
Unknown*
18 4 77.78% 2 50.00%
Total 932 864 7.30% 357 41.32% 5,404 6.61%
2010
Asian 481 413 14.14% 246 59.56%
Black 227 151 33.48% 31 20.53%
Hispanic 155 127 18.06% 31 24.41%
White 67 51 23.88% 20 39.22%
Native
American/
Unknown*
38 2 94.74% 1 50.00%
Total 968 744 23.14% 329 44.22% 5,261 6.25%
2009**
Asian 156 153 1.92% 96 62.75%
Black 260 218 16.15% 47 21.56%
Hispanic 414 315 23.91% 50 15.87%
White 49 44 10.20% 18 40.91%
Native
American/
Unknown*
97 18 81.44% 7 38.89%
Total 976 748 23.36% 218 5,246
18
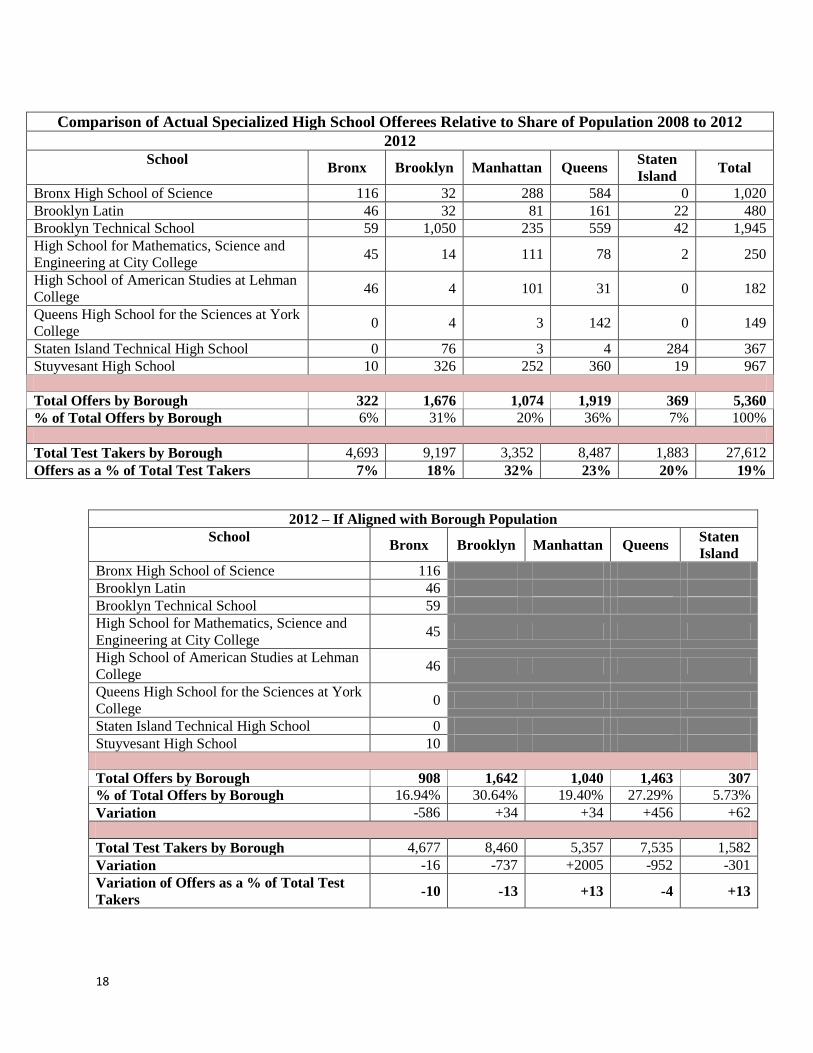
Comparison of Actual Specialized High School Offerees Relative to Share of Population 2008 to 2012
2012
School Bronx Brooklyn Manhattan Queens
Staten
Island Total
Bronx High School of Science 116 32 288 584 0 1,020
Brooklyn Latin 46 32 81 161 22 480
Brooklyn Technical School 59 1,050 235 559 42 1,945
High School for Mathematics, Science and
Engineering at City College 45 14 111 78 2 250
High School of American Studies at Lehman
College 46 4 101 31 0 182
Queens High School for the Sciences at York
College 0 4 3 142 0 149
Staten Island Technical High School 0 76 3 4 284 367
Stuyvesant High School 10 326 252 360 19 967
Total Offers by Borough 322 1,676 1,074 1,919 369 5,360
% of Total Offers by Borough 6% 31% 20% 36% 7% 100%
Total Test Takers by Borough 4,693 9,197 3,352 8,487 1,883 27,612
Offers as a % of Total Test Takers 7% 18% 32% 23% 20% 19%
2012 – If Aligned with Borough Population
School Bronx Brooklyn Manhattan Queens
Staten
Island
Bronx High School of Science 116
Brooklyn Latin 46
Brooklyn Technical School 59
High School for Mathematics, Science and
Engineering at City College 45
High School of American Studies at Lehman
College 46
Queens High School for the Sciences at York
College 0
Staten Island Technical High School 0
Stuyvesant High School 10
Total Offers by Borough 908 1,642 1,040 1,463 307
% of Total Offers by Borough 16.94% 30.64% 19.40% 27.29% 5.73%
Variation -586 +34 +34 +456 +62
Total Test Takers by Borough 4,677 8,460 5,357 7,535 1,582
Variation -16 -737 +2005 -952 -301
Variation of Offers as a % of Total Test
Takers -10 -13 +13 -4 +13

19
2011
School Bronx Brooklyn Manhattan Queens
Staten
Island Total
Bronx High School of Science 134 39 280 590 1 1,044
Brooklyn Latin 48 178 106 224 16 572
Brooklyn Technical School 63 1,029 250 555 54 1,951
High School for Mathematics, Science and
Engineering at City College 33 14 99 81 1 228
High School of American Studies at Lehman
College 43 2 108 24 0 177
Queens High School for the Sciences at York
College 0 5 3 134 1 143
Staten Island Technical High School 0 60 3 2 287 352
Stuyvesant High School 12 346 199 351 29 937
Total Offers by Borough 333 1,673 1,048 1,961 389 5,404
% of Total Offers by Borough 6% 31% 19% 36% 7% 100%
Total Test Takers by Borough 4,709 9,684 3,428 8,606 1,854 28,281
Offers as a % of Total Test Takers 7% 17% 31% 23% 21% 19%
2011 – If Aligned with Borough Population
School Bronx Brooklyn Manhattan Queens
Staten
Island
Bronx High School of Science 117
Brooklyn Latin 97
Brooklyn Technical School 330
High School for Mathematics, Science and
Engineering at City College 39
High School of American Studies at Lehman
College 30
Queens High School for the Sciences at York
College 24
Staten Island Technical High School 60
Stuyvesant High School 159
Total Offers by Borough 915 1,656 1,048 1,475 310
% of Total Offers by Borough 16.94% 30.64% 19.40% 27.29% 5.73%
Variation -582 +17 0 +486 +79
Total Test Takers by Borough 4,791 8,665 5,487 7,718 1,621
Variation +82 -1,019 +2,059 -888 -233
Variation of Offers as a % of Total Test
Takers -10 -14 +12 -4 +13

20
2010
School Bronx Brooklyn Manhattan Queens
Staten
Island Total
Bronx High School of Science 134 42 281 592 2 1,051
Brooklyn Latin 49 184 116 165 28 542
Brooklyn Technical School 56 1,019 208 528 48 1,859
High School for Mathematics, Science and
Engineering at City College 42 17 72 48 0 179
High School of American Studies at Lehman
College 54 2 103 19 0 178
Queens High School for the Sciences at York
College 0 2 1 148 0 151
Staten Island Technical High School 0 48 2 1 292 343
Stuyvesant High School 19 333 223 355 28 958
Total Offers by Borough 354 1,647 1,006 1,856 398 5,261
% of Total Offers by Borough 7% 31% 19% 35% 8% 100%
Total Test Takers by Borough 4,566 9,258 3,478 8,042 1,773 27,117
Offers as a % of Total Test Takers 8% 18% 29% 23% 22% 19%
2010 – If Aligned with Borough Population
School Bronx Brooklyn Manhattan Queens
Staten
Island
Bronx High School of Science 178
Brooklyn Latin 92
Brooklyn Technical School 315
High School for Mathematics, Science and
Engineering at City College 30
High School of American Studies at Lehman
College 30
Queens High School for the Sciences at York
College 26
Staten Island Technical High School 58
Stuyvesant High School 162
Total Offers by Borough 891 1,612 1,021 1,436 301
% of Total Offers by Borough 16.94% 30.64% 19.40% 27.29% 5.73%
Variation -537 +35 +15 +420 +97
Total Test Takers by Borough 4,594 8,309 5,261 7.400 1,554
Variation +28 -949 +1,783 -642 -219
Variation of Offers as a % of Total Test
Takers -9 -12 +10 -4 +16

21
2009
School Bronx Brooklyn Manhattan Queens
Staten
Island Total
Bronx High School of Science 110 25 338 571 2 1,046
Brooklyn Latin 42 153 127 166 27 515
Brooklyn Technical School 57 1,003 262 506 32 1,860
High School for Mathematics, Science and
Engineering at City College 25 11 90 48 1 175
High School of American Studies at Lehman
College 48 2 94 30 0 174
Queens High School for the Sciences at York
College 1 5 9 149 0 164
Staten Island Technical High School 0 57 9 2 264 332
Stuyvesant High School 11 265 288 394 22 980
Total Offers by Borough 294 1,521 1,217 1,866 348 5,246
% of Total Offers by Borough 6% 29% 23% 36% 7% 100%
Total Test Takers by Borough 4,307 9,212 4,109 8,297 1,729 27,654
Offers as a % of Total Test Takers 7% 17% 30% 22% 20% 19%
2009 – If Aligned with Borough Population
School Bronx Brooklyn Manhattan Queens
Staten
Island
Bronx High School of Science 177
Brooklyn Latin 87
Brooklyn Technical School 315
High School for Mathematics, Science and
Engineering at City College 30
High School of American Studies at Lehman
College 29
Queens High School for the Sciences at York
College 28
Staten Island Technical High School 56
Stuyvesant High School 166
Total Offers by Borough 889 1,607 1,018 1,432 301
% of Total Offers by Borough 16.94% 30.64% 19.40% 27.29% 5.73%
Variation -595 -86 -199 +434 +47
Total Test Takers by Borough 4,685 8,473 5,365 7,547 1,585
Variation +378 -739 +1,256 -750 -144
Variation of Offers as a % of Total Test
Takers -9 -12 +10 -4 +16

22
2008
School Bronx Brooklyn Manhattan Queens
Staten
Island Total
Bronx High School of Science 108 34 321 609 1 1,073
Brooklyn Latin 52 125 104 132 16 429
Brooklyn Technical School 37 984 280 483 48 1,832
High School for Mathematics, Science and
Engineering at City College 33 18 87 37 2 177
High School of American Studies at Lehman
College 63 2 86 27 0 178
Queens High School for the Sciences at York
College 2 4 5 189 0 200
Staten Island Technical High School 0 34 9 2 232 277
Stuyvesant High School 21 274 318 355 24 992
Total Offers by Borough 316 1,475 1,210 1,834 323 5,158
% of Total Offers by Borough 6% 29% 23% 36% 6% 100%
Total Test Takers by Borough 3,969 8,838 3,845 7,540 1,681 25,873
Offers as a % of Total Test Takers 8% 17% 31% 24% 19% 20%
2008 – If Aligned with Borough Population
School Bronx Brooklyn Manhattan Queens
Staten
Island
Bronx High School of Science 182
Brooklyn Latin 73
Brooklyn Technical School 310
High School for Mathematics, Science and
Engineering at City College 30
High School of American Studies at Lehman
College 30
Queens High School for the Sciences at York
College 34
Staten Island Technical High School 47
Stuyvesant High School 168
Total Offers by Borough 874 1,580 1,001 1,408 296
% of Total Offers by Borough 16.94% 30.64% 19.40% 27.29% 5.73%
Variation -558 -105 -209 +426 +27
Total Test Takers by Borough 4,383 7,927 5,019 7,061 1,483
Variation +414 -911 +1174 -479 -198
Variation of Offers as a % of Total Test
Takers -9 -12 +10 -4 +16

23
Bronx County, New
York
Kings County, New
York
New York County,
New York
Queens County,
New York
Richmond County,
New York
INCOME AND BENEFITS (IN
2010 INFLATION-ADJUSTED
DOLLARS)
Estimate Percent Estimate Percent Estimate Percent Estimate Percent Estimate Percent
Families 314,618 314,618 580,453 580,453 305,679 305,679 527,729 527,729 124,237 124,237
Less than $10,000 42,503 13.5% 52,700 9.1% 19,382 6.3% 26,955 5.1% 6,797 5.5%
$10,000 to $14,999 24,479 7.8% 34,708 6.0% 12,302 4.0% 18,655 3.5% 2,444 2.0%
$15,000 to $24,999 48,536 15.4% 65,194 11.2% 27,974 9.2% 49,143 9.3% 7,235 5.8%
$25,000 to $34,999 35,198 11.2% 66,306 11.4% 24,079 7.9% 50,054 9.5% 8,334 6.7%
$35,000 to $49,999 46,511 14.8% 86,695 14.9% 29,842 9.8% 71,188 13.5% 11,322 9.1%
Total 62.7% 52.6% 37.2% 40.9% 29.1%
$50,000 to $74,999 51,090 16.2% 93,018 16.0% 34,271 11.2% 101,812 19.3% 19,808 15.9%
$75,000 to $99,999 29,454 9.4% 59,051 10.2% 25,776 8.4% 72,458 13.7% 16,461 13.2%
$100,000 to $149,999 24,535 7.8% 71,399 12.3% 37,165 12.2% 84,859 16.1% 28,452 22.9%
$150,000 to $199,999 7,736 2.5% 27,929 4.8% 23,884 7.8% 32,510 6.2% 13,700 11.0%
$200,000 or more 4,576 1.5% 23,453 4.0% 71,004 23.2% 20,095 3.8% 9,684 7.8%
Median family income (dollars) $36,627 (X) $46,671 (X) $78,197 (X) $60,438 (X) $82,406 (X)
Mean family income (dollars) $49,786 (X) $68,504 (X) $159,324 (X) $76,004 (X) $97,598 (X)

24
Name of
Program
Website Classes offered in
the Bronx- Y/N
*Only Group
Classes
Queens Manhattan Staten Island Brooklyn Group Tutoring
+ Costs
Individual
Tutoring +
Costs
Kaplan
http://www.kaptest.com/K
8/SHSAT/Tutoring/shsat-
private-tutoring.html
Y- 1-Fordham
University, 441 East
Fordham Road, Bx,
NY 10458 Y-Mult Y-Mult Y-Mult Y-Mult $849-1199 $2599-3599
Princeton
Review
http://www.princetonrevie
w.com/ChooseProducts.as
px?&zipcode=10456&testt
ype=TAG&producttype=T
UT
Y-1 Manhattan
College Y-Mult Y-Mult N Y-1 $1,599 $1500-6300
Elite
Academy www.eliteacademy.com N
Y- 136-56
39th Avenue,
LL Flushing,
Queens, NY
11354 N N N
$1680/semester
(fall or spring-
Sat 9-1);
$1595/Summer
(6 1/2 wks,
Mon-Thurs)
N- Only
Group Test
Prep; no
Individual
Tutoring
Aim
Academy
http://www.aimacademyus
a.org N
Y- 3621
Prince Street
Flushing, NY
11364 N N N
$1300/Summer
(7 wks, Mon-Fri)
or
$1400/Summer
(Sat, 9-3pm)
N- Only
Group Test
Prep; no
Individual
Tutoring
Mega
Academy
http://www.mega-
academy.com/index-2.html N
Y- 65-01
Kissena Blvd.
Flushing, NY
11367 N N N
$1318/Summer
(7 wks, Mon-Fri)
30 stud/group
N- Only
Group Test
Prep; no
Individual
Tutoring
Khan's
Tutorial
http://khanstutorial.com/in
dex.php/services/view/2
Y- affiliate program
at Castle Hill
Y- 171-16
Hillside Ave,
Jamaica, NY;
and 23018
Broadway,
Astoria, NY N N N
Start September
60 wk package
$3600 upfront;
$75/class for
total = $4500;
max 25 stud/gp.
N- Only
Group Test
Prep; no
Individual
Tutoring
SHSAT
Prep www.shsatprep.com N N N Y N $975.00
Tutors of
Oxford
http://www.tutorsofoxford.
com/lessondetails.htm N N
Y- 356 E 50th
Street New
York, NY 10022 N N NA NA

25
Science
Schools
Initiative
(SSI) www.the-initiative.org N N
Y- 157 Prince St.
1st Fl. New
York, NY
10012; classes
held at CUMC N N
FREE- Funds
allotted in
school budget
MS80
(inconjuncti
on with SSI)
Kweller
Prep
http://www.kwellerprep.co
m/ N
Y- 104-40
Queens Blvd,
Forest Hills,
NY 11375 N N N
Y-
$2,999/Summe
r (8 wks)
Guarantees
entrance to
Stuyvesant
for $10,000
PrepMate
www.prepmate.com/SHSA
T N
Y- 143-30
38th Ave, Ste
1-G, Flushing,
NY 11354
Y- 344 West
38th St, NY,
NY, 10018 N N Yes
Caddell
Prep
www.sinytutor.com/shsat-
test-prep N N N
Y- 38 Genesee
St, SI, NY
10301 N
$950 40hr
package; max
6 stud/class;
summer
classes before
8th grade N
Cates
Tutoring
http://www.catestutoring.c
om/test-
preparation/tests/shsat-test-
prep.html N N
Y- 122 W 27 St.
12 Fl, NY, NY
10001 N
Y- 45
Main
Street, Ste.
309,
Brooklyn,
NY 11201
Y- Small
Groups
Brownstone
Tutors
http://www.brownstonetut
ors.com/test_prep/shsat/ N N
Y- 275 Madison
Ave, 4th Fl, New
York, NY 10016 N
Y- 354
Court
Street,
First Floor,
Brooklyn,
NY 11231 N
Enrichment
class (for
6th + 7th
graders):
$180/hr
Test Prep
(mid. 7th
grade-
summer
before 8th):
$200/hr

26
Amlon
Tutors
http://www.nytutoring.com
/testprep/sshsat/sshsat.html NA NA NA NA NA N
$85/hr; min.
20 hr
package
A List
Education
http://alisteducation.com/te
st-prep-admissions/isee-
ssat-shsat NA NA NA NA NA
Y- Small
groups created
by
participants;
not offered by
organization;
discount
offered for
every
additional
student, up to
5/gp
$175-300/hr
- packages
can be
purchased
for 12/18/
prp 36 hours
Kuei Luck
Test Prep
http://kueiluck.com/article/
index/id/237 N
Y- 195-05
69th Ave,
Fresh
Meadows, NY
11365 N N N
Y-
$2200/Summe
r (7 wks, Mon-
Fri) or $2200/
Wknd Mock
Exam +
Review (6
wks, Sat +
Sun, 9-12pm) N
Baruch
College of
Continuing
and
Professional
Studies
http://www.baruched.com/
shop/catalog.aspx?id=257 N N
Y- 55 Lexington
Ave, B1-116,
New York, NY
10010 N N Y-
Y- Price
available
upon
request
Janine Avril
http://www.janineavril.co
m/2011/07/shsat-prep.html N N N N N N
Ind. Only -
Price
available
upon
request
Kent
Prepatory http://www.kentprep.com/ N
194-11A
Northern Blvd,
Bayside, NY,
11358 N N N

27
Next Level
Learning
Center
http://www.nyclearn.com/?
q=shsat N N
Y- 850 7th
Avenue, NY,
NY N N N Ind. Only
Partners
With
Parents
http://partnerswithparents.c
om/2011-02/shsat-tutoring N N
Y- 131 West
72nd St, NY,
NY N N
Y- $799/Fall
or Spring
semesters (12
wks, 30 hrs) N
Kennedy
Test Prep
www.kennedyexcellencein
testprep.com N
Y- 135-20
35th Ave,
Flushing, NY,
11354 N N N
Y-$599
Fall/Summer
semester
(7wks, 10
classes, 30 hrs) N
NY
Academics
www.tutornewyorkcity.co
m/shsat-test-prep.htm NA NA NA NA NA
Y- $599/Fall
or Summer (30
hrs. over 7
wks
Y- $65-
70/hr

28

29

30
Acknowledgements
Our office would like to recognize the outstanding contributions on this paper by Christina Dumitrescu, Macaulay Honors College and
Lehman College, CUNY 2011. Her research and passion for education reform were a great help on this report and we wish her all the
best in her future endeavors.
i Javier Hernandez, Gap Persists in Test for Specialized High Schools, The New York Times, (February 6, 2009).
ii Treschan, Lazar. Latino Youth in New York City. School, Work, and Income Trends for New York’s Largest Group of Young People. Community Service
Society (October 2010), at 5. iii
Ibid. iv John Garvey, Finally Doing Something about Specialized High School Admissions, Gotham Schools, (March 10, 2010)
v Rachel Kim, Maria Gindler and Ben Garner, Racial Disparity at Stuyvesant, The Spectator – Stuyvesant High School Paper, (December 1, 2008), sighting
Sociologist Jennifer Jennings. vi
Andrea Diaz & Coralia Barrios, The Bronx: In Search of a Breath of Fresh Air, March 2007. Available at http://www.thebronxjournal.com/the-bronx-in-
search-of-a-breath-of-fresh-air/. See also generally New York State Department of Health, County Health Indicator Profiles (2004-2008). Available at
http://www.health.ny.gov/statistics/chip/bronx.htm#bronx (showing 166.6 cases per 100,000 persons in 2008, an increase over the previous two years). vii
Bob Kappstatter, New Asthma Van is a Breath of Fresh Air, NY Daily News, March 19, 2002. Available at http://articles.nydailynews.com/2002-03-
19/local/18198084_1_mobile-clinic-asthma-breath-of-fresh-air. viii
Kim Nauer, Andrew White and Rajeev Yerneni, Strengthening Schools by Strengthening Families, The New School, (October 2008) at 7. ix
Ramos, Melissa, Franklin, Noah, Suleiman Gonzalez, Layla, and Abina-Sotomayor, Keren. The State of Latino Families in New York 2011: An Overview of
Health, Education, Juvenile Justice and Child Welfare Issues. The Committee for Hispanic Children and Families, Inc. (March 2011), at 18. x JENNY FUNG and TEN-YOUNG GUH Despite SHSAT Racial Demographics, Students Favor the Individual over Ethnicity, The Spectator – Stuyvesant High
School Paper, (November 15, 2010). xi
Reardon, Sean and Bischoff, Kendra. Growth in the Residential Segregation of Families by Income, 1970-2009. US 2010 Project (November 2011), at 2. xii
Tina Rosenburg, Beyond SATs, Finding Success in Numbers, The New York Times, February 15, 2012,