Embed Size (px)
Citation preview

The Pennsylvania State University
The Graduate School
Department of Mechanical and Nuclear Engineering
AN ALL-OPTICAL PRESSURE SENSOR FOR NUCLEAR POWER PLANT
APPLICATIONS
A Thesis in
Mechanical Engineering
by
Jonathan Paul Bednar
2012 Jonathan Paul Bednar
Submitted in Partial Fulfillment
of the Requirements
for the Degree of
Master of Science
May 2012

ii
The thesis of Jonathan Paul Bednar was reviewed and approved* by the following:
Martin W. Trethewey
Arthur L. Glenn Professor
Professor of Mechanical Engineering
Thesis Co-Advisor
Karl M. Reichard
Assistant Professor of Acoustics
Research Associate, Applied Research Laboratory
Thesis Co-Advisor
Eric R. Marsh
Professor of Mechanical Engineering
Karen A. Thole
Professor of Mechanical Engineering
Head of the Department of Mechanical and Nuclear Engineering
* Signatures are on file in the Graduate School

iii
Abstract
An average nuclear power plant in the United States contains between 1,000 and 2,000 pressure
transmitters. The use of capacitance cell nuclear pressure transmitters in these high temperature
environments degrades integrated sensing electronics and limits the transmitter’s usable life. An
all-optical pressure sensor would remove the transducer interface and communication electronics
from the sensing environment— extending the sensor’s life and reducing sensor maintenance and
lifecycle costs.
This paper presents the design and experimental evaluation of a fiber Bragg grating optical
pressure transducer. The primary transduction mechanism of this design relates pressure in a
fluid filled pipe to sensing diaphragm strain using optical diaphragm strain measurements.
Similar to capacitance cell pressure transmitter designs, the proposed pressure transducer is
susceptible to measurement bias induced by temperature perturbations. To minimize
measurement bias, a fiber Bragg grating temperature compensation sensor is used to calculate a
temperature independent diaphragm strain measurement.
The transducer design was fabricated and thermal experiments were conducted while the sensing
diaphragm was mechanically unconstrained in a thermal chamber. During these experiments, the
sensing diaphragm’s temperature corrected strain was calculated while the ambient temperature
was perturbed. An experimentally developed coefficient of thermal expansion was found to
improve the accuracy of strain temperature compensation. Testing also showed that the time
dependence of strain compensation caused the fiber Bragg grating sensing diaphragm to
ultimately exhibit 4x the maximum temperature error expected from a capacitance cell pressure
transmitter in the same environment.
The assembled pressure transducer was experimentally evaluated using a hydraulic test system.
The transducer’s sensitivity between 0 and 1,200 psig was experimentally determined to be 1.64
. A multi-step pressure experiment was conducted to confirm the transducer’s measurement
repeatability. During this test, the maximum difference between pressure measurements made
using the optical transducer and reference instrumentation was 44.3 psi. The mean measurement

iv
difference for this test was 19.0 psi. A capacitance cell pressure transmitter in similar conditions
is expected to have an overall measurement accuracy of ± 2.5 psi.
The largest source of measurement error from the fiber Bragg grating pressure transducer is
likely to be the time dependent, transient response of diaphragm strain temperature compensation
measurements. Future development of the pressure transducer concept should focus on reducing
temperature compensation errors. Given this improvement, the proposed fiber Bragg grating
pressure transducer has significant potential for nuclear power plant applications.

v
Table of Contents
List of Figures .......................................................................................................... vii
List of Tables ........................................................................................................... xi
Acknowledgements .................................................................................................. xii
Chapter 1 Introduction ............................................................................................. 1
1.1 Problem Statement ...................................................................................... 3
1.2 Objectives ................................................................................................... 4 1.3 Scope .......................................................................................................... 5
1.4 Overview ..................................................................................................... 6
Chapter 2 Background .............................................................................................. 8
2.1 Review of the Capacitance Cell Pressure Transmitter Design ...................... 8 2.2 Methods of All-Optical Strain Measurement ................................................ 11
2.3 Strain and Temperature Sensing Using Fiber Bragg Gratings....................... 13 2.4 Methods for Temperature Correction for Fiber Bragg Grating Strain
Measurements ............................................................................................ 18 2.5 Review of Existing Fiber Bragg Grating Pressure Transducer Designs ........ 22
Chapter 3 Optical Pressure Transducer Design ......................................................... 26
3.1 Mechanical Design ...................................................................................... 26
3.2 Design and Modeling of Sensing Diaphragm ............................................... 30 3.2.1 Preliminary Diaphragm Design .......................................................... 30
3.2.2 Diaphragm Design Modeling and Development ................................. 32 3.2.3 Finite Element Model Validation ....................................................... 36
3.3 Fabricated Pressure Transducer ................................................................... 39
Chapter 4 Experimental Demonstration of Strain Measurement Correction .............. 41
4.1 Testing Objectives and Experiment ............................................................. 41 4.2 Measurement and Calculations .................................................................... 44
4.3 Results and Discussion ................................................................................ 46 4.3.1 Unforced Thermal Environment Testing ............................................ 46
4.3.2 Thermal Step Change Testing ............................................................ 50 4.3.3 Experimental Evaluation of the Coefficient of Thermal Expansion .... 53
4.4 Summary of Experimental Results ............................................................... 58
Chapter 5 Experimental Demonstration of Transducer’s Coupled Response ............. 60
5.1 Testing Objectives and Experiment ............................................................. 60 5.2 Measurement and Calculations .................................................................... 63

vi
5.3 Results and Discussion ................................................................................ 66 5.3.1 Pressure Transducer Calibration Testing ............................................ 66
5.3.2 Calibration Repeatability Experiment ................................................ 70 5.4 Summary of Experimental Results ............................................................... 73
Chapter 6 Conclusions ............................................................................................. 75
6.1 All-Optical Pressure Transducer Design and Secondary Effects ................... 75
6.2 Experimental Pressure Transducer Performance .......................................... 76 6.3 Feasibility of Fiber Bragg Grating Pressure Transducer for Nuclear Power
Plant Applications ...................................................................................... 77 6.4 Areas of Future Work .................................................................................. 78
Bibliography ............................................................................................................ 79
Appendix- pressure transducer design specifications ................................................ 84

vii
LIST OF FIGURES
Figure 1. The Emerson Rosemount 1153 Series B Alphaline Nuclear Pressure
Transmitter (Left), and the 1154 Alphaline Nuclear Pressure Transmitter
(Right) [6, 7] ..................................................................................................... 2
Figure 2. The qualified life of Rosemount’s 1153 Series B and 1154 Alphaline
Nuclear Pressure Transmitters over ambient temperature [6, 7] ......................... 4
Figure 3. Schematic of the Emerson Rosemount 1153 Series B Alphaline Nuclear
Pressure Transmitter [6] .................................................................................... 8
Figure 4. Block diagram of a capacitance cell pressure transmitter .......................... 9
Figure 5. Schematic of a typical capacitance cell pressure transmitter diaphragm
design [11] ........................................................................................................ 10
Figure 6. Block diagram of a fiber Bragg grating based pressure transmitter............ 13
Figure 7. Effects of an optical fiber Bragg grating on broad band incident light
[40] ................................................................................................................... 14
Figure 8. The temperature compensated pressure sensing scheme proposed by
[18] ................................................................................................................... 19
Figure 9. Technical drawing of a Micron Optics os4100 temperature
compensation sensor which is used to measure changes in temperature- this
sensor is mounted laterally to the fiber direction [38] ........................................ 20
Figure 10. Technical drawing of a Micron Optics os3110 strain sensor which is
used to measure strain lateral to the fiber [39] ................................................... 21
Figure 11. Micron Optics os3155 integrated strain and temperature compensation
optical fiber Bragg grating sensor ...................................................................... 21
Figure 12. Experimental pressure sensor design which relates applied pressure to
strain as measured by a fiber Bragg grating strain sensor [30]............................ 22
Figure 13. Temperature independent optical Bragg grating pressure sensor design
[31] ................................................................................................................... 23
Figure 14. Schematic of a dual-shell pressure sensor concept designed by [17] ....... 24
viii
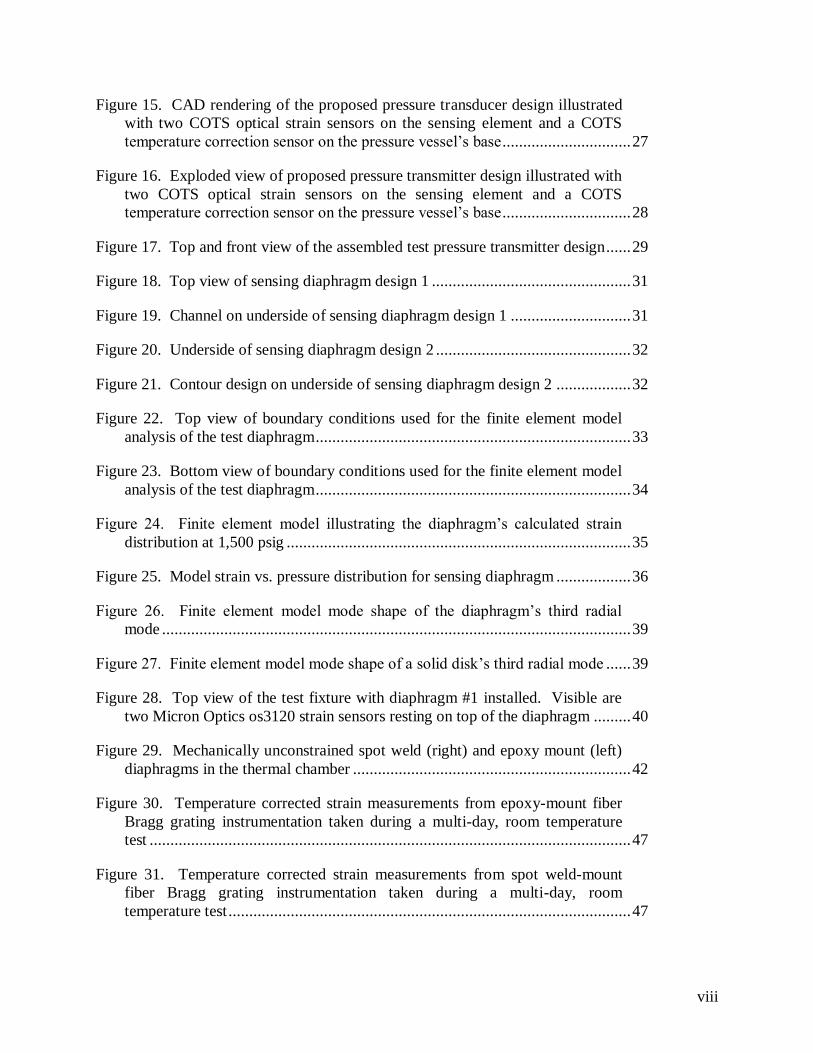
Figure 15. CAD rendering of the proposed pressure transducer design illustrated
with two COTS optical strain sensors on the sensing element and a COTS
temperature correction sensor on the pressure vessel’s base ............................... 27
Figure 16. Exploded view of proposed pressure transmitter design illustrated with
two COTS optical strain sensors on the sensing element and a COTS
temperature correction sensor on the pressure vessel’s base ............................... 28
Figure 17. Top and front view of the assembled test pressure transmitter design ...... 29
Figure 18. Top view of sensing diaphragm design 1 ................................................ 31
Figure 19. Channel on underside of sensing diaphragm design 1 ............................. 31
Figure 20. Underside of sensing diaphragm design 2 ............................................... 32
Figure 21. Contour design on underside of sensing diaphragm design 2 .................. 32
Figure 22. Top view of boundary conditions used for the finite element model
analysis of the test diaphragm ............................................................................ 33
Figure 23. Bottom view of boundary conditions used for the finite element model
analysis of the test diaphragm ............................................................................ 34
Figure 24. Finite element model illustrating the diaphragm’s calculated strain
distribution at 1,500 psig ................................................................................... 35
Figure 25. Model strain vs. pressure distribution for sensing diaphragm .................. 36
Figure 26. Finite element model mode shape of the diaphragm’s third radial
mode ................................................................................................................. 39
Figure 27. Finite element model mode shape of a solid disk’s third radial mode ...... 39
Figure 28. Top view of the test fixture with diaphragm #1 installed. Visible are
two Micron Optics os3120 strain sensors resting on top of the diaphragm ......... 40
Figure 29. Mechanically unconstrained spot weld (right) and epoxy mount (left)
diaphragms in the thermal chamber ................................................................... 42
Figure 30. Temperature corrected strain measurements from epoxy-mount fiber
Bragg grating instrumentation taken during a multi-day, room temperature
test .................................................................................................................... 47
Figure 31. Temperature corrected strain measurements from spot weld-mount
fiber Bragg grating instrumentation taken during a multi-day, room
temperature test ................................................................................................. 47

ix
Figure 32. Temperature and corrected strain measurements from epoxy mount
fiber Bragg grating instrumentation taken during a multi-day forced
temperature test ................................................................................................. 50
Figure 33. Temperature and corrected strain measurements from spot weld mount
fiber Bragg grating instrumentation taken during a multi-day forced
temperature test ................................................................................................. 51
Figure 34. Effects of varying the coefficient of thermal expansion on temperature
corrected strain measurements ........................................................................... 54
Figure 35. Re-calculated corrected strain observed during the unforced thermal
test .................................................................................................................... 55
Figure 36. Re-calculated corrected strain observed during the unforced thermal
test .................................................................................................................... 55
Figure 37. Scaled corrected time history after a 20 ambient temperature step ...... 56
Figure 38. Hydraulic system flowchart .................................................................... 61
Figure 39. Side view of fiber Bragg grating pressure transmitter in pressure
testing environment ........................................................................................... 62
Figure 40. Spot weld fiber Bragg grating sensing diaphragm installed in the
pressure transmitter housing .............................................................................. 63
Figure 41. Transduction calibration experiment corrected strain and reference
pressure time histories ....................................................................................... 67
Figure 42. Comparison of the experimental and finite element model pressure
calibration curves .............................................................................................. 68
Figure 43. Temperature of hydraulic flow observed during the coupled response
test .................................................................................................................... 69
Figure 44. Corrected strain vs. pressure scatter observed during the repeatability
test .................................................................................................................... 71
Figure 45. Recorded reference pressure (red) and experimental model-calculated
pressure (blue) observed during the calibration model repeatability test ............. 72
Figure 46. Detailed drawing for manufacture- pressure transducer base page 1 of
3 ........................................................................................................................ 85
Figure 47. Detailed drawing for manufacture- pressure transducer base page 2 of
3 ........................................................................................................................ 85

x
Figure 48. Detailed drawing for manufacture- pressure transducer base page 3 of
3 ........................................................................................................................ 85
Figure 49. Detailed drawing for manufacture- pressure transducer collar ................. 85
Figure 50. Detailed drawing for manufacture- pressure transducer diaphragm ......... 85

xi
LIST OF TABLES
Table 1. The first 5 radial modes of the diaphragm calculated using geometrically
simplified analytical calculations and the exact diaphragm finite element
model ................................................................................................................ 38
Table 2. The first 5 radial modes of the diaphragm calculated using geometrically
simplified analytical calculations and geometrically simplified finite element
model ................................................................................................................ 38
Table 3. Table of instrumentation used during environmental chamber testing ........ 45
Table 4. Reduction in corrected strain excursion at the peak temperature
excursion observed between 11/12 and 11/13 .................................................... 49
Table 5. Reduction in corrected strain excursion during the 11/17 temperature
excursion ........................................................................................................... 52
Table 6. Table of instrumentation used during pressure testing ................................ 65

xii
ACKNOWLEDGEMENTS
This work was supported by the Electric Power Research Institute, Inc. (EPRI). The content of
the information does not necessarily reflect the position or policy of EPRI , and no official
endorsement should be inferred.
I would like to thank Mark Turner (Research Engineer, The Applied Research Laboratory) for
contributing a large effort to the end goal of this project. Specifically, these efforts include a
majority of the design of the optical pressure transducer and test systems as well as guiding me
to find physical meaning in experimental data.
I would like to thank Dr. Karl Reichard (Thesis Co-Advisor and Research Associate, The
Applied Research Laboratory) and Dr. Martin Trethewey (Thesis Co-Advisor and Professor of
Mechanical Engineering, Penn State University) for their leadership, guidance, insight, and
patience throughout this work.
In addition, I would like to thank the Complex Systems Monitoring and Automation Department
at The Applied Research Laboratory whose individuals have given me innumerable hands on
learning opportunities throughout the past four years.

1
Chapter 1 Introduction
Nuclear power generation in The United States of America accounts for more than 30% of the
total global nuclear energy production. There are currently 104 nuclear reactors used for power
generation in the USA. In 2010, these reactors output a net 807 billion kWh of power. Such an
electrical output makes the USA the world’s largest producer of nuclear power [1].
The need to meet power requirements of the U.S. population supports the growth of the nuclear
power generation industry. In 1980, nuclear power plants generated 11% of the total electrical
output in the USA. By 2008, this number had increased to more than 20%. Nuclear energy in
the U.S. is only second to coal-fired power plants, which contributed 45% of the US’s total
electric output in 2008 [1].
Because the nuclear power generation industry in the U.S supplies such a large portion of the
country’s total electrical output, plant functionality and efficiency are integral. A typical nuclear
power plant contains between 1,000 and 2,000 pressure and differential pressure transmitters,
depending on the number of that plant’s coolant loops [2]. Absolute, gage, and differential
pressure measurements are all used to monitor pressure in plant sensing lines.
In 1989, the usable life of a certain class of nuclear pressure transmitters was noted in a letter
written by the Nuclear Regulatory Commission (NRC). This letter documents that a single
nuclear power plant—the Northeast Utilities’ Millstone Nuclear Power Station, Unit 3—
observed five differential pressure transmitter failures between 1986 and 1987. Over these two
years, the output of capacitance cell transmitters was observed to deviate from redundant sensor
measurements [3]. Two examples of capacitance cell pressure transducers are illustrated in
Figure 1.

2
In March 2011, the largest earthquake ever to be recorded in Japan caused a nuclear emergency
at the Fukushima Daiichi Nuclear Power Plant. The events which occurred during and after this
disaster highlight the importance of sensor functionality and power consumption in emergency
conditions. After the earthquake occurred, emergency power systems were used to cool Reactors
1, 2, and 3 in an attempt to avoid full meltdown [4]. Unfortunately, the plant’s secondary reserve
energy systems were unable to keep the recently active reactors cool after a tsunami flooded the
primary reserve power system [5]. If a nuclear power plant were required to operate on a
reduced power supply for a prolonged period of time, a power-efficient sensory grid would help
conserve emergency energy reserves. In addition, pressure sensors with improved high-
temperature accuracy may improve recovery potential from a near-meltdown condition.
Capacitance cell pressure transducer designs require integrated measurement and signal
conditioning electronics. In nuclear power plant applications these pressure transmitters are
employed in high temperature environments. Over time, high temperature operating conditions
degrade the units’ internal sensing electronics. As such, the need for integrated electronics limits
the qualified life of capacitance cell pressure transmitters is limited by operating temperature [6,
7].
Figure 1. The Emerson Rosemount 1153 Series B Alphaline Nuclear Pressure Transmitter
(Left), and the 1154 Alphaline Nuclear Pressure Transmitter (Right) [6, 7]

3
When possible, sensing lines are used to distance pressure transmitters from extremely temperate
environments. Both liquid-filled and gas-filled sensing lines are used. One drawback for the use
of sensing lines, however, is response time—which varies depending on the length and type of
sensing line. Average sensing line lengths range from 10 to 50 meters—but can be as long as
300 meters. It is common for sensing lines to contain voids, blockages, or freeze, which also
affects the accuracy of pressure measurements [2].
Throughout the past 20 years, significant achievements have been realized in the US nuclear
power plant industry’s operational efficiency by improving plant maintenance [1]. The limited
life of the existing class of capacitance cell pressure transducers, though, has not been fully
addressed. Between 4 and 6 new nuclear power plants are expected to come on-line by 2020 [1].
To create a reliable nuclear power generation network, existing and emerging nuclear energy
reactor designs require pressure measurement technology that is not presently available.
1.1 Problem Statement
The life of pressure sensors/transmitters currently used in nuclear power plants is limited by
degradation of embedded electronics over time. As an example, the qualified life for the
electronics in the Rosemount 1153 Series B and 1154 Alphaline Nuclear Pressure Transmitters
decreases linearly from 10 years at an operating temperature of 120 to less than 3 years at an
operating temperature over 145 [6]. A plot of the qualified life of these pressure transmitters’
modules and electronics is illustrated in Figure 2.

4
The electronics in these pressure transducers are required to provide a remote readout of pressure
measurements, they drive the lifecycle cost of the installation. A suitable replacement for this
existing pressure sensing technology would be required to provide the same remote sensing
capability without introducing lifecycle limitations imposed by sensing electronics.
1.2 Objectives
Similar uses of pressure transducers in other high temperature applications offer little insight into
a suitable replacement pressure transmitter for a nuclear power plant environment. As an
example, both gallium phosphate piezoelectric instrumentation [8] and wireless data
transmission [9] have been used to quantify/transmit air flow pressure measurements in turbine
engines. Although each of these technologies has intrinsic benefits, pressure transducers used in
nuclear power plant applications need to offer robust, static pressure measurements. In a nuclear
power plant, it is unlikely that wireless data transmissions would be capable of breaching thick
containment walls. Moreover, a dynamic pressure sensor such as a gallium phosphate
Figure 2. The qualified life of Rosemount’s 1153
Series B and 1154 Alphaline Nuclear Pressure
Transmitters over ambient temperature [6, 7]

5
piezoelectric transducer would offer little benefit in an application which requires static
measurements.
An alternative remote sensing capability may be provided by optical fiber based sensors. All-
optical fiber sensors are sensors in which both the transduction mechanism and signal
transmission are implemented optically. Optical fiber sensors do not require signal conditioning
electronics at the sensing location to provide standoff monitoring. Removing the transducer
interface and communication electronics from areas where the pressure sensors are located
would eliminate electromagnetic interference in measurement wires, significantly extend sensor
life-time, and reduce sensor maintenance and lifecycle costs.
The work presented in this thesis represents one part of a larger research program whose goal is
to develop technologies to reduce operating costs and improve safety in nuclear power plants
through improvements in instrumentation. The research presented in this paper has four
objectives:
1. Design a pressure transducer which uses all-optical instrumentation to remotely measure
pressure in a fluid filled pipe.
2. Experimentally evaluate secondary effects on transducer pressure measurements.
3. Evaluate the optical pressure transducer’s performance relative to a commercially
available nuclear grade pressure transmitter.
4. Assess the optical pressure transducer’s potential for nuclear power plant applications.
1.3 Scope
This research will focus on an experimental demonstration and investigation into the feasibility
of an all-optical pressure sensing device. Before fabrication, the proposed pressure transducer’s
diaphragm strain response is validated with a finite element analysis using an established
modeling/numerical analysis software package. After fabrication, the proposed pressure
transducer is instrumented using Commercial off the Shelf (COTS) optical sensors and tested in
a laboratory environment.

6
Experimental demonstration and reference instrumentation of the pressure transducer are
completed using resources readily available in the laboratory environment. A closed-loop
hydraulic system is used to evaluate the pressure transducer at a number of test pressures
between 0 and 1,200 psig. An environmental chamber is used to evaluate the unconstrained
sensing diaphragm’s measured strain response in thermally controlled test conditions. MATLAB
is used for all post-processing and data analysis.
1.4 Overview
The work presented in this thesis describes the design and experimental evaluation of an all-
optical nuclear pressure transducer. Chapter 2 reviews numerous methods of all-optical strain
measurement. This background is used to select a sensing method which is appropriate for use
in a nuclear grade pressure sensing device. Calculations relevant to wavelength modulated
optical strain and temperature compensation sensors are provided. Existing fiber Bragg grating
pressure transducer concepts are reviewed and methods for temperature compensation of fiber
Bragg grating strain measurements are evaluated. Ultimately, the reviewed designs were each
found to be deficient for a nuclear power plant application.
Chapter 3 presents the design of the proposed fiber Bragg grating pressure transducer whose
primary method of transduction is the optical measurement of strain on a sensing diaphragm.
The sensing diaphragm design is developed using finite element modeling and a model
validation is presented.
The largest secondary effect on measurements from the fiber Bragg grating transducer design is
temperature change. An experimental demonstration of thermal correction for diaphragm strain
measurements is provided in Chapter 4. Further experimental results are provided which suggest
that a developed effective coefficient of thermal expansion for the sensing diaphragm improves
strain measurement correction. Experimentally observed corrected strain measurement bias is
compared to a capacitance cell pressure transmitter’s operational specifications to provide a
quantitative evaluation of the fiber Bragg grating transducer design.

7
The assembled pressure transducer’s coupled thermal/mechanical response is experimentally
evaluated using a hydraulic pressure system in Chapter 5. Tests are conducted to examine the
fiber Bragg grating transducer’s measurement repeatability and accuracy. The transducer’s
observed measurement accuracy is compared to that of a capacitance cell pressure transmitter’s
operational specifications to provide a quantitative evaluation of the proposed all-optical design.
The insights gained during experimental testing of the fiber Bragg grating pressure transducer
provide potential for the design to be developed into a nuclear grade pressure transducer.
Pressure measurement biases may be significantly reduced with further investigation into sources
of the strain measurement correction inaccuracies and systematic strain biases observed during
testing.

8
Chapter 2 Background
2.1 Review of the Capacitance Cell Pressure Transmitter Design
The usable life of capacitance cell pressure transmitters employed in nuclear power plants is
largely limited by their need for integrated sensing electronics. Because these electronics are
required at the sensing location, they are subjected to extreme temperate environments which can
degrade life. The Rosemount 1153 Series B Alphaline Nuclear Pressure Transmitter is a
capacitance cell pressure transmitter that is specifically designed for use in nuclear power plants.
A schematic of the Rosemount 1153 Series B is illustrated in Figure 3.
The Rosemount 1153 Series B senses pressure changes using a standard internal differential
capacitance cell and outputs a 4-20 mA DC current. The transmitter’s capacitance cell is isolated
from sensing line flow using a sealed isolating diaphragm and non-conductive silicone oil. The
transmitter’s electronic design uses a 32 kHz, 30 Vp-p reference current driver in an attempt to
minimize internal EMI [10].
Figure 3. Schematic of the Emerson Rosemount 1153
Series B Alphaline Nuclear Pressure Transmitter [6]

9
Capacitance cell pressure transducers are one of the types of pressure sensors which achieve
transduction by relating internal sensing diaphragm strain to the pressure that caused that
movement. Capacitance cell pressure transmitters sense the displacement of a diaphragm
(usually metal or metal-coated quartz) which is located between two capacitor plates. An AC
reference current is supplied by a power source and passed across the series capacitors. Changes
in diaphragm displacement relative to the capacitor plates causes the capacitance cell’s output
current to change proportionally. The amplitude of the rectified DC output current can
ultimately be correlated to the system’s input pressure. A block diagram which illustrates the
basic functionality of a capacitance cell pressure transducer is provided in Figure 4.
The output of capacitance cell pressure transducers is sensitive to both input pressure and
ambient temperature. Temperature changes can cause current through the cell’s signal
conditioning electronics to change. To overcome this problem, precision capacitance cell
pressure transmitter designs use thermistors to electronically correct for the effects of
temperature on output current. As such, a transmitter’s output sensitivity at a variety of
temperature ranges is frequently supplied in its performance specifications. Ambient
temperature also degrades the system’s sensing electronics, and ultimately limits the
transmitter’s usable life.
Figure 4. Block diagram of a capacitance cell pressure transmitter

10
Figure 5 illustrates a typical pressure transmitter capacitance cell design.
An analysis of this design suggests that thermal expansion/contraction of the unit’s sensing
diaphragm will not affect differential current output.
An inherent problem in capacitance cell pressure transmitter designs is internal and transmission
line electromagnetic interference (EMI). The effects of internal EMI are minimized by using a
moderate amplitude reference current source. Twisted pair transmission lines, a broken ground
loop, or shielded transmission cable can also be used to minimize transmission line EMI.
Capacitance cell pressure transducers are favored for their ability to sense wide ranges of
pressures and their ability to be configured to measure absolute, gage, and differential pressures
by changing the capacitance cell’s reference pressure. Newer designs of capacitance cell
pressure transducers are reported to have relatively low drift (0.1% to .01% of full scale) and are
more resistant to the effects of vibration [11].
Figure 5. Schematic of a typical capacitance cell pressure
transmitter diaphragm design [11]

11
2.2 Methods of All-Optical Strain Measurement
An all-optical pressure transducer design would eliminate capacitance cell transmitter designs’
need for integrated signal conditioning electronics and replace electrical data transmission lines
with optical fibers to eliminate EMI concerns.
To better understand what type of all-optical sensor would be best for such a pressure transducer
design, consideration should be given to the various types of all-optical instrumentation.
Types of all-optical instrumentation are categorized in two ways. First, optical fiber sensors are
classified as either intrinsic or extrinsic. Intrinsic sensors use a portion (or the entire length) of
an optical fiber as a sensing device. The primary benefits of intrinsic sensors are that light never
leaves the sensing fiber and that they can be multiplexed. These characteristics make intrinsic
sensors choice for dirty and smart-structure applications. Extrinsic fiber sensors, on the other
hand, alter the path of light using an external device such as mirrors or glass. Typically, extrinsic
fiber sensors can be easily modified with additional hardware to modify, transform, or simplify
the measurand making them more sensitive than intrinsic sensors [12].
All-optical sensors are also categorized by how their sensing is achieved. Wavelength
modulated sensors measure a change in reflected or transmitted light wavelength [12]. As broad
band light is transmitted down an optical fiber with a section of periodic interference in the
core’s refractive index, both constructive and destructive interference will occur in the reflected
light. Reflected light at wavelengths other than the grating frequency will be out of phase and
thus tends to cancel. Reflected light with a center wavelength equal to the grating’s frequency,
however, will be in phase and constructively sum [13]. The most common type of wavelength
modulated sensors are fiber Bragg grating sensors. One primary benefit of fiber Bragg grating
sensors is their high sensitivity to changes in strain and/or temperature.
A second type of all-optical sensor is a phase modulated (interferometric) sensor. There are
three common types of interferometer sensors: (1) the Mach-Zender, (2) the Michelson, and (3)
the Fabry-Perot. Although intrinsic variations exist, phase modulated sensors are typically
12
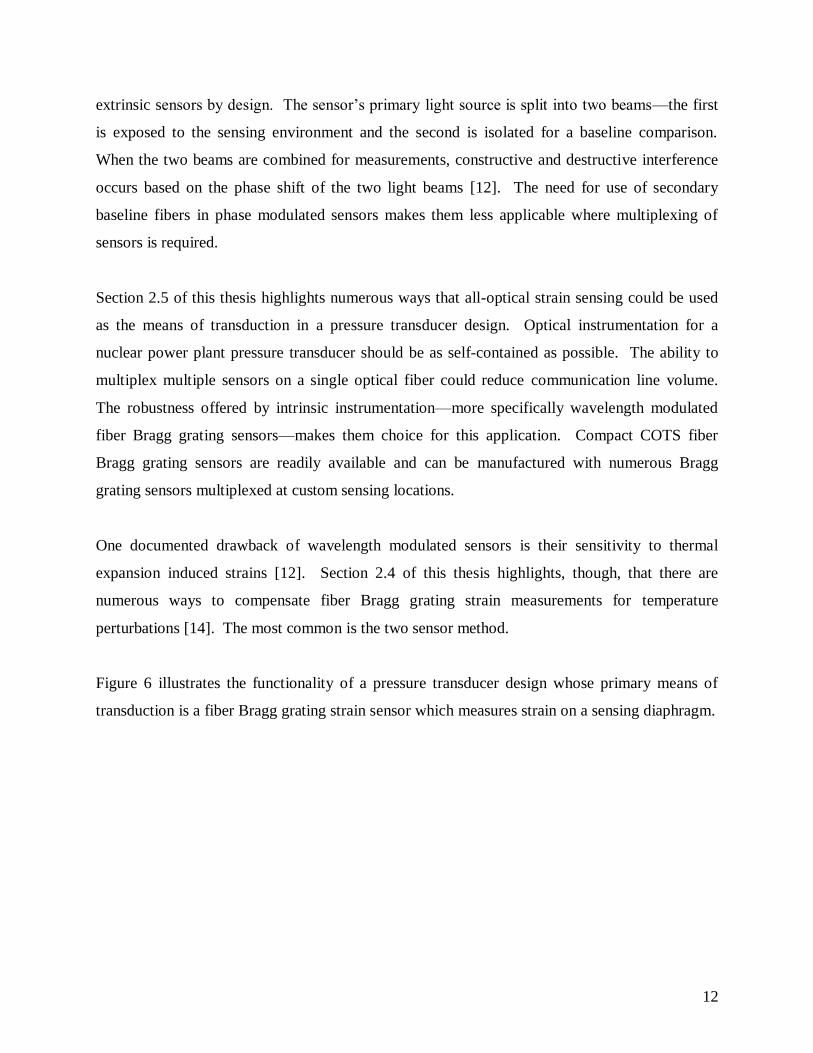
extrinsic sensors by design. The sensor’s primary light source is split into two beams—the first
is exposed to the sensing environment and the second is isolated for a baseline comparison.
When the two beams are combined for measurements, constructive and destructive interference
occurs based on the phase shift of the two light beams [12]. The need for use of secondary
baseline fibers in phase modulated sensors makes them less applicable where multiplexing of
sensors is required.
Section 2.5 of this thesis highlights numerous ways that all-optical strain sensing could be used
as the means of transduction in a pressure transducer design. Optical instrumentation for a
nuclear power plant pressure transducer should be as self-contained as possible. The ability to
multiplex multiple sensors on a single optical fiber could reduce communication line volume.
The robustness offered by intrinsic instrumentation—more specifically wavelength modulated
fiber Bragg grating sensors—makes them choice for this application. Compact COTS fiber
Bragg grating sensors are readily available and can be manufactured with numerous Bragg
grating sensors multiplexed at custom sensing locations.
One documented drawback of wavelength modulated sensors is their sensitivity to thermal
expansion induced strains [12]. Section 2.4 of this thesis highlights, though, that there are
numerous ways to compensate fiber Bragg grating strain measurements for temperature
perturbations [14]. The most common is the two sensor method.
Figure 6 illustrates the functionality of a pressure transducer design whose primary means of
transduction is a fiber Bragg grating strain sensor which measures strain on a sensing diaphragm.

13
This mechanics of this design are similar to that of a capacitance cell transducer but eliminate the
need for integrated electronics. An optical interrogator is used to measure the reflected Bragg
wavelengths from two multiplexed sensors using a single optical fiber. This design employs the
two sensor method of strain measurement temperature compensation. As such, an optical
temperature compensation sensor is used to correct strain measurements for temperature
perturbations. Because optical fibers are used for all data transmission, there would be no
concerns with EMI.
2.3 Strain and Temperature Sensing Using Fiber Bragg Gratings
Fiber Bragg grating strain and temperature sensor designs take advantage of an optical Bragg
grating’s interference with incident light. A Bragg grating is a periodic variation in an optical
fiber’s refractive index [15]. The effects of a Bragg grating on incident light are analogous to a
band pass filter— light coherent with the fiber grating’s frequency will be constructively
reflected while all other wavelengths will tend to cancel. As Bragg gratings on optical fibers are
strained or compressed, the grating’s frequency, and therefore the center wavelength of reflected
light, is altered. In this way, fiber strain is linearly correlated to the center wavelength of the
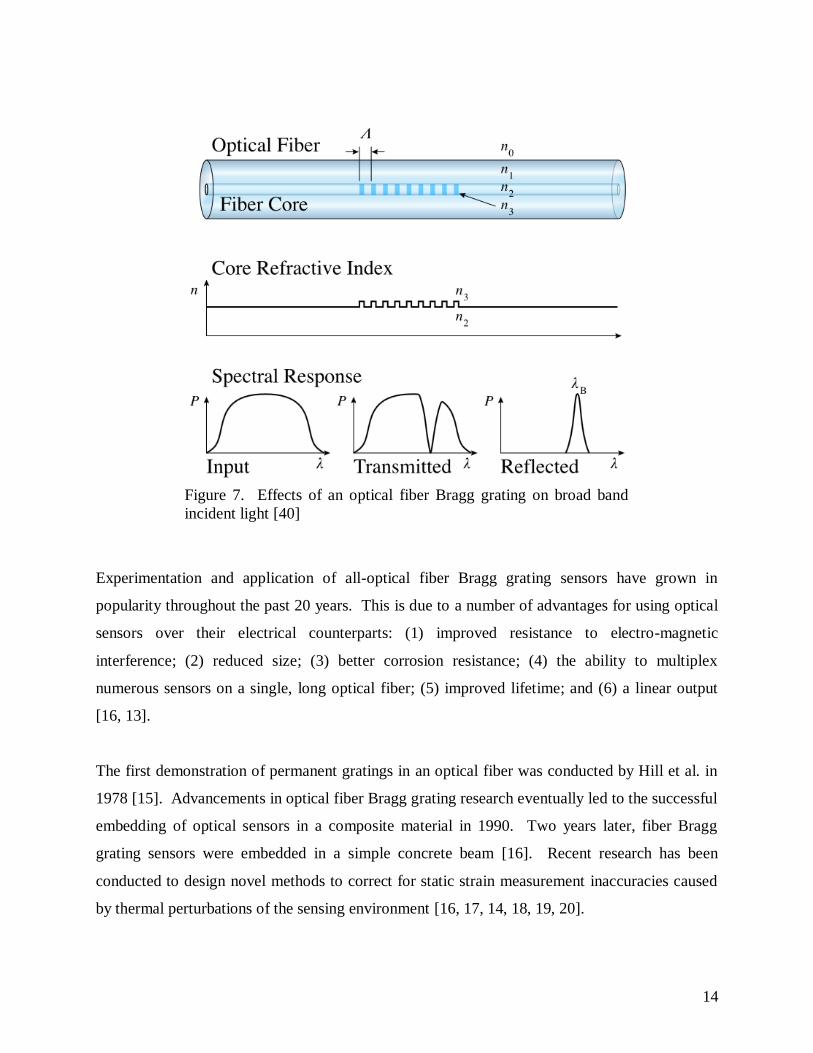
reflected light [13]. The effects of Bragg gratings on incident broadband light are illustrated
below in Figure 7.
Figure 6. Block diagram of a fiber Bragg grating based pressure transmitter
14
Experimentation and application of all-optical fiber Bragg grating sensors have grown in
popularity throughout the past 20 years. This is due to a number of advantages for using optical
sensors over their electrical counterparts: (1) improved resistance to electro-magnetic
interference; (2) reduced size; (3) better corrosion resistance; (4) the ability to multiplex
numerous sensors on a single, long optical fiber; (5) improved lifetime; and (6) a linear output
[16, 13].
The first demonstration of permanent gratings in an optical fiber was conducted by Hill et al. in
1978 [15]. Advancements in optical fiber Bragg grating research eventually led to the successful
embedding of optical sensors in a composite material in 1990. Two years later, fiber Bragg
grating sensors were embedded in a simple concrete beam [16]. Recent research has been
conducted to design novel methods to correct for static strain measurement inaccuracies caused
by thermal perturbations of the sensing environment [16, 17, 14, 18, 19, 20].
Figure 7. Effects of an optical fiber Bragg grating on broad band
incident light [40]

15
A study of power transmission line health monitoring exemplifies the utility of fiber Bragg
grating sensors. In one application, a single fiber optic cable was used to monitor for strain
imposed by snow accumulation on a 30 km length of transmission line. Ten sensors were
multiplexed on a single 30 km long fiber. Even with such a remote sensing offset, measurements
taken from the optical fiber showed no significant signal degradation or interference [16].
In the nuclear power industry, the capability of optical fiber Bragg strain gages to describe the
behavior of a containment structure was demonstrated by [21]. Fiber optic Bragg grating strain
sensors were used to instrument the containment structure before a Structural Integrity Test
(SIT). The results of this study showed that the strain measurements collected during the SIT
showed close agreement to the results of a Finite Element Model (FEM). These experiments
were demonstrated in at the Uljin nuclear power plant in South Korea and showed the benefits of
optical instrumentation—which would offer a longer life than standard foil strain gages.
The effects of short and long-term radiation exposure of optical Bragg gratings and fibers have
been examined by [22] and [23], respectively. The work published by [22] in 1998, examines
the parameters of a fiber Bragg grating temperature sensor after exposure to high levels
(>1MGy) of short term Gamma-radiation. The results of this study suggest that the amplitude
and width of the sensor’s optical Bragg resonance remained unchanged after it was subjected to
the radiation exposure. A change of less than 25 pm in the sensor’s Bragg wavelength was,
however, observed. This change limited the accuracy of the sensor’s temperature sensitivity
coefficient to 3%. One notable recommendation from this study was the use of radiation
resistant (radiation-hardened) optical fibers in future work.
The long-term use of fiber Bragg grating sensors in a nuclear reactor was directly examined by
[23] in 2009. Bragg gratings were written on two types of optical fibers and used as temperature
sensors in the BR1 nuclear reactor for 8 years. During this time, the sensors were irradiated with
a gamma-dose of ~10 MGy and thermally cycled between 10 and 80 . At the conclusion of the
study, measurements taken using the irradiated optical Bragg grating sensors matched those
taken by reference thermocouples. The results of this study suggest that fiber Bragg gratings

16
would be suitable for long-term use in nuclear installations where they would be subject to
limited gamma-dosing.
These studies show that fiber Bragg grating instrumentation has been established in structural
monitoring applications and has already been considered for use in nuclear power plants. The
life of fiber Bragg grating sensors should not be limited in low gamma-dosing power plant
environments such as coolant line pressure measurement applications. Before a fiber Bragg
grating pressure transducer design can be proposed, consideration should be given to fiber Bragg
grating pressure transducer designs which have already been evaluated.
Optical fiber Bragg grating sensors are indiscriminate of mechanical and thermal strain
perturbations. Mechanically induced strain occurs when an applied load causes the sensor’s
Bragg grating pattern to longitudinally stretch or compress. Isothermal actuation causes a
change in the Bragg grating’s reflected wavelength— — which is calculated by
( )
( ) Eq. 1
Where is the applied longitudinal strain, is the wavelength of light reflected by the Bragg
grating at zero strain, and is the effective photoelastic constant [24]. The effective
photoelastic constant of an optical fiber is calculated using
[ ( )] Eq. 2
Where is the optical core’s effective index of refraction, is Poisson’s ratio, and are
components of the strain optic tensor [13].
Similarly, the wavelength of light reflected by an optical fiber’s Bragg grating can be altered by
a thermal strain on the optical fiber. Thermal strain in an optical sensor occurs when the
temperature of the optical fiber is changed. A temperature change of any material causes

17
expansion or contraction proportional to that material’s coefficient of thermal expansion.
Changes in the wavelength of light reflected by an optical fiber’s Bragg gratings in the absence
of mechanical strain can be calculated using
( )
( ) Eq. 3
Where is the coefficient of thermal expansion for the optical fiber material, is the
thermooptic coefficient of the optical fiber, and is a change in the Bragg grating’s
temperature [24].
Thus, perturbations in the wavelength of light reflected by an optical sensor’s Bragg gratings are
related to changes in both the applied longitudinal strain and the optical material’s temperature:
( )
( ) ( ) Eq. 4
Optical fiber Bragg grating strain sensors are affixed to the objects whose strain or temperature
change they are monitoring. These objects also expand or contract with changes in temperature.
As a result, the wavelength of light reflected by an optical fiber Bragg grating sensor affixed to a
material is calculated with:
( )
( ) ( ) Eq. 5
Where is the coefficient of thermal expansion for the material on which the optic
sensor is attached.
Eq. 5 can be re-arranged to calculate the longitudinal strain on a material as measured by the
change in reflected light’s wavelength in an optical fiber Bragg strain sensor:

18
( ) ( )
( )
Eq. 6
In practice, measurements are taken from fiber Bragg grating sensors using COTS fiber Bragg
grating sensor interrogators. Interrogators such as the Micron Optics sm125 use internal tuned
lasers to interrogate an optical fiber’s Bragg gratings and record the reflected wavelength [25].
Such interrogators are typically capable of discriminating between the Bragg wavelengths of
multiplexed sensors. The Micron Optics sm125 allows users to scale Bragg grating wavelength
changes to engineering units both onboard and in post processing algorithms.
2.4 Methods for Temperature Correction for Fiber Bragg Grating Strain Measurements
It applications where static strain measurements are desired, it is often necessary to calculate a
temperature independent strain measurement. Numerous methods to calculate a mechanically
applied strain have been described by [14, 18, 20], reviewed by [26], and applied in structural
health monitoring applications [16, 27, 28]. The most relevant are described below.
The first technique for optical strain measurement temperature correction uses a tapered optical
fiber with chirped Bragg gratings to measure a temperature independent strain, and has been
explored by [14]. Strain applied to an optical fiber which is tapered at the location of Bragg
gratings would cause chirping of the grating’s periodicity. Optical interrogation of such a fiber
would result in a spectrum having an effective bandwidth. Although temperature changes in the
fiber would cause a shift in the mean of this band, the band’s effective width would only depend
on the applied strain. Experimental analysis of this concept has proven its success. Although
promising, this technique would not be ideal to use in the design of an all-optical pressure
transducer because it only corrects strain measurements for changes in the optical fiber’s
temperature. As a result, there would be no way to account for thermal expansion or
compression of the material to which it is affixed.

19
The idea that temperature compensation for fiber Bragg grating pressure sensor designs has not
been successfully solved was identified by [18] in 2006. A concept for temperature
compensation in an optical pressure transducer was subsequently offered. A schematic of this
concept is illustrated in Figure 8. This design compensates for thermal expansion and
contraction in the sensing fiber by pre-tensioning it between metals whose thermal expansion
characteristics are equal and opposite to those of the fiber. In this way, the
expansion/contraction of the materials negates thermal effects observed in measurements taken
by the fiber.
Thermal testing of this pressure transducer design suggested that it functions as modeled.
Although this concept is viable in a laboratory setting, it would not offer the robustness and
compact packaging required for a pressure transducer application.
To measure a temperature compensated bending strain on a beam, [20] affixed two fiber Bragg
grating strain sensors on the top and bottom surfaces of a cantilever. The assumption of equi-
thermal sensors was made. When a bending moment was applied to the beam, the mechanically
applied strain was calculated by halving the difference in measurements made by the two
sensors. This concept is similar to the most common concept for temperature correction, which
has been used in a select number of structural health monitoring applications.
The last and most simple technique for temperature compensation of optical strain measurements
is to use a strain-decoupled fiber Bragg grating temperature compensation sensor to measure
Figure 8. The temperature compensated pressure
sensing scheme proposed by [18]

20
changes in temperature. Temperature compensation sensors are mounted lateral to the fiber
direction. In this way, temperature compensation sensors are unaffected by mechanical strain
applied in the fiber direction, but are still susceptible to the same thermal effects of their strain
counterparts.
Temperature change, , is used to calculate a thermal correction factor, , using Eq. 7. is
subtracted from raw strain measurements to calculate thermally independent strain using Eq. 8.
( )
( )
Eq. 7
( )
( )
Eq. 8
Two examples of COTS optical fiber Bragg grating strain and temperature compensation sensors
are illustrated in Figure 9 and Figure 10. These sensors are designed and produced by Micron
Optics.
Figure 9. Technical drawing of a Micron Optics os4100 temperature compensation sensor which
is used to measure changes in temperature- this sensor is mounted laterally to the fiber direction
[38]
21
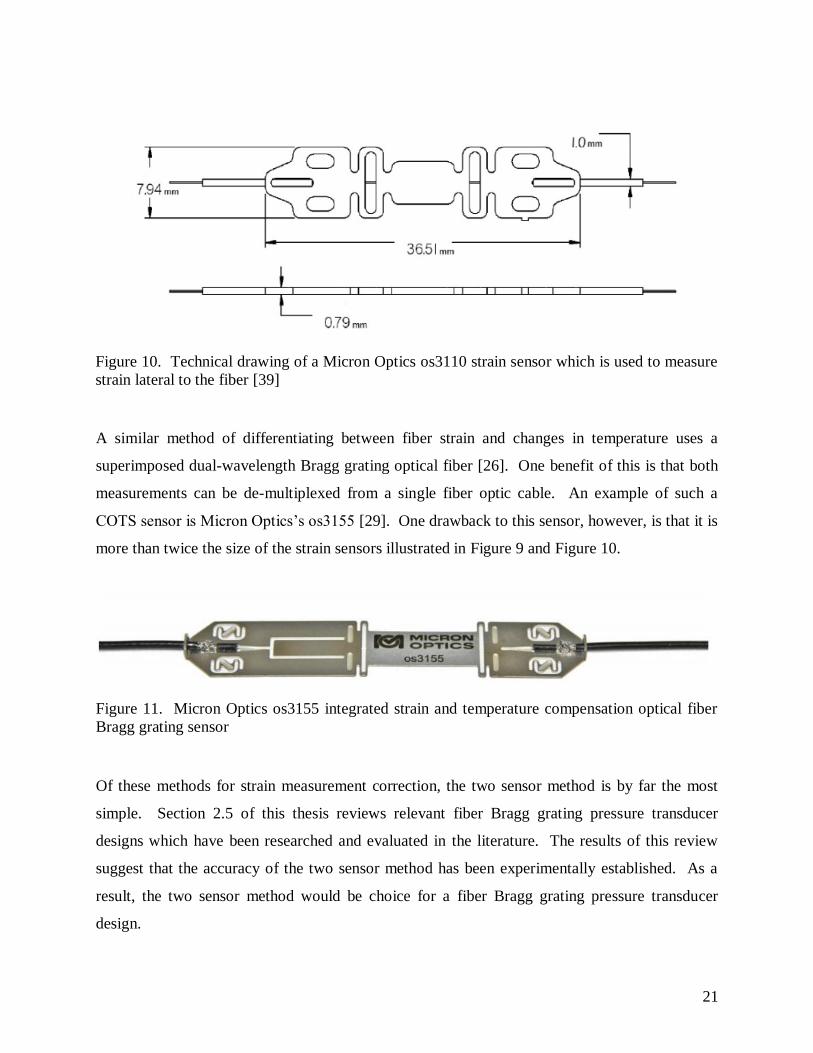
A similar method of differentiating between fiber strain and changes in temperature uses a
superimposed dual-wavelength Bragg grating optical fiber [26]. One benefit of this is that both
measurements can be de-multiplexed from a single fiber optic cable. An example of such a
COTS sensor is Micron Optics’s os3155 [29]. One drawback to this sensor, however, is that it is
more than twice the size of the strain sensors illustrated in Figure 9 and Figure 10.
Of these methods for strain measurement correction, the two sensor method is by far the most
simple. Section 2.5 of this thesis reviews relevant fiber Bragg grating pressure transducer
designs which have been researched and evaluated in the literature. The results of this review
suggest that the accuracy of the two sensor method has been experimentally established. As a
result, the two sensor method would be choice for a fiber Bragg grating pressure transducer
design.
Figure 10. Technical drawing of a Micron Optics os3110 strain sensor which is used to measure
strain lateral to the fiber [39]
Figure 11. Micron Optics os3155 integrated strain and temperature compensation optical fiber
Bragg grating sensor

22
2.5 Review of Existing Fiber Bragg Grating Pressure Transducer Designs
At the present, no suitable COTS fiber Bragg grating pressure transducer exists. Resent
literature, though, highlights concepts which have been considered and evaluated.
An experimental pressure sensing device documented in 2001 by [30] relates measurements
made by a fiber Bragg grating strain sensor to external pressure which is applied to a polymer. A
schematic of this design is illustrated in Figure 12.
Pressure is applied to the transducer’s polymer interface which, in turn, expands or contracts the
sensing fiber. When this pressure transducer is actuated, strain is measured by the fiber Bragg
grating which is encapsulated in a polymer and aluminum housing. Testing showed that this
concept had substantial pressure sensitivity, but it lacks a means for strain measurement
temperature compensation [30].
This concept was advanced in 2007 by [31] to create a temperature independent fiber Bragg
grating pressure sensor. The modified design is similar to that presented by [30], but requires
that the Bragg grating is only submerged to its midpoint in polymer. A schematic of this design
is illustrated in Figure 13.
Figure 12. Experimental pressure sensor
design which relates applied pressure to
strain as measured by a fiber Bragg grating
strain sensor [30]

23
This design is based on the assumption that both halves of the Bragg grating are at the same
temperature while measurements are taken. Pressure is applied to the transducer’s polymer
interface which expands or contracts the section of the sensing fiber which is surrounded by
polymer. When actuated, two peaks of light are reflected by the Bragg grating. The first
corresponds to the unstrained portion of the Bragg grating which is not submerged in polymer.
This peak provides a strain-decoupled temperature compensation base wavelength. The second
peak is reflected by the strained portion of the fiber. Assuming the optical fiber is at a uniform
temperature, the applied pressure can be related to the difference between the two spectral peaks
[31].
Although this concept has been experimentally proven, it is not ideal for a nuclear power plant
grade pressure transmitter. At low pressures it is likely that the spectral peaks will be
indistinguishable. Moreover, it would be difficult to ensure that the Bragg gratings that are
surrounded by polymer do not become chirped when pressure is applied.
A similar concept was later adopted by [17] and published in 2009. A schematic of the design is
illustrated in Figure 14.
Figure 13. Temperature independent optical
Bragg grating pressure sensor design [31]

24
This design uses two shells to protect the primary sensing fibers. Two optical Bragg grating
sensors are installed inside a thin inner cylindrical shell. A strain sensor, which is installed
diametrically in the cylinder, characterizes radial expansion of the inner shell which is caused by
applied pressure. A strain-decoupled sensor is installed in the axial direction of the inner shell.
The purpose of the rigid outer shell is to protect the inner shell and prevent it from expanding
longitudinally (thus preventing mechanical strain on the axially mounted optical sensor).
Testing of this design suggested that the two shell concept successfully isolated the axially
mounted temperature compensation sensor from mechanically applied strain between 10 and
60 . A linear strain/pressure relationship was observed for testing pressures between 0 and 4
MPa [17]. Although testing of this design suggests reasonable performance, the design would be
difficult to mass-manufacture.
A hydrostatic pressure transducer concept has been established by [32]. This design uses a fiber
Bragg grating strain gage to quantify hoop strain as a cylindrical vessel is pressurized. Although
testing showed that this design yields a linear strain/pressure relationship between 0 and 70 MPa,
it includes no instrumentation for thermal correction of strain measurements. The strategic
application of a temperature compensation sensor would provide such measurements, but this
design lacks a robust way to mount fiber Bragg grating sensors to the transducer. Loose fiber
sensors (sensors without a mounting base) could be epoxied on the circumference of such a
transducer design, but spot weld mount instrumentation would be preferred to epoxy mounting in
practice.
Figure 14. Schematic of a dual-shell pressure sensor concept
designed by [17]

25
A review of these concepts suggests that research to design a fiber Bragg grating pressure
transducer is still in a very fundamental stage. None of the reviewed fiber Bragg grating
pressure transducer designs have been found to be ideal for use in a nuclear power plant
application. The most common problems with current fiber Bragg grating pressure transducer
designs are inadequate temperature compensation and a lack of mechanical robustness.
Experimental evaluation of the two shell transducer design suggests that such a concept is viable
for pressure measurement in a research setting. Unfortunately high manufacturing tolerances
and hand assembly would likely be required for mass-production of this design to ensure that the
sensor’s axial temperature compensation sensor is not strained at high pressures. The positive
test results of this study, though, suggest that the two sensor method for temperature
compensation would be favorable for a fiber Bragg grating pressure transducer design.

26
Chapter 3 Optical Pressure Transducer Design
3.1 Mechanical Design
The primary motivation for the work presented in this report is to investigate the feasibility of a
fiber Bragg grating pressure transducer which has potential to replace existing capacitance cell
nuclear grade pressure transmitters. Careful review has been given to the strengths and
weaknesses of existing fiber Bragg grating pressure transducer designs but none have been found
to be suitable for this application.
The functionality of a new fiber Bragg grating pressure transducer design was illustrated in
Figure 6 (Section 2.2). A diaphragm-based fiber Bragg grating pressure transducer design would
be mechanically similar to established capacitance cell transmitters. Experimental testing of the
two shell pressure transducer design suggests that temperature independent diaphragm strain
measurements could be calculated with a strain-decoupled temperature compensation sensor
[17].
The design requirements for this work are: (1) operability in the evaluation range of 0-1,500
psig, (2) an ability to be instrumented with both fiber Bragg grating strain, temperature
compensation, and reference instrumentation, (3) a sensing surface with the ability to be easily
removed and modified as needed during evaluation, and (4) a design robustness that can likely be
developed to satisfy IEEE Standard for Qualifying Class IE Equipment for Nuclear Power
Generating Stations, IEEE Std. 323-1974 [33], and IEEE Recommended Practice for Seismic
Qualification of Class 1E Equipment for Nuclear Power Generating Stations, IEEE Std. 344-
1975 [34].
A diaphragm-based fiber Bragg grating pressure transducer was designed with these
requirements in consideration. This pressure transducer design consists of three primary parts:
(1) a thick-walled cylindrical pressure vessel housing, (2) a captivated sensing diaphragm, and
(3) a pressure vessel collar. A CAD rendering of this design is illustrated in Figure 15.

27
An exploded view of the design is illustrated in Figure 16. The design’s three mechanical
components are labeled in this illustration. Fluid flows on the opposite side of the diaphragm
from the sensing fiber. This avoids direct contact between the fiber and fluid, which has been
shown to affect fiber properties and limit life. An increase in fluid pressure strains the
transducer’s sensing diaphragm. Diaphragm strain is measured by a fiber Bragg grating strain
sensor. Temperature change is quantified using a fiber Bragg grating temperature compensation
sensor. Temperature compensation sensor(s) can be installed on the sensing diaphragm (in close
proximity to the strain sensor) and/or on a flat designed in the pressure vessel’s base. Because
the transducer’s sensing diaphragm is located between the collar and pressure vessel base, it can
be easily removed for instrumentation or physical modifications.
Figure 15. CAD rendering of the proposed
pressure transducer design illustrated with
two COTS optical strain sensors on the
sensing element and a COTS temperature
correction sensor on the pressure vessel’s
base

28
The proposed design allows for multiple fiber Bragg grating instrumentation locations. Three
COTS optical sensors can be mounted in parallel on the surface of the testing diaphragm, which
has a usable surface area of 5.47 in2. In addition, a screw mount temperature compensation
sensor can be installed on a flat designed in pressure vessel base. The CAD renderings in Figure
15 and Figure 16 are illustrated with two Micron Optics os3120 strain sensors on the sensing
diaphragm and a Micron Optics os4100 temperature correction sensor on the pressure vessel
base.
Figure 16. Exploded view of proposed pressure
transmitter design illustrated with two COTS
optical strain sensors on the sensing element and a
COTS temperature correction sensor on the
pressure vessel’s base
Diaphragm
Collar
Base

29
The pressure transducer is assembled using six 3/8-16 cap screws and nuts. When torqued to
specification (35 ft-lbs), these bolts secure the sensing diaphragm between the pressure vessel
collar and base. Two rubber o-rings are seated in channels designed into the pressure vessel base
to create a seal between the sensing diaphragm and the pressure vessel base.
The assembled pressure transducer design measures 4.125 inches in height and has an outer
diameter of 5.00 inches. The pressure vessel base has a nominal wall thickness of 1.5 in. These
dimensions are similar to those of a typical capacitance cell pressure transmitter. As an example,
the main sensing module of a Rosemount 1153 Series B Alphaline Nuclear Pressure Transmitter
measures 4.5 inches in diameter and is 4.5 inches in height [6]. The general assembled
dimensions of the proposed pressure transducer design are illustrated in Figure 17.
Figure 17. Top and front view of the
assembled test pressure transmitter
design

30
COTS Fiber Bragg grating strain and compensation sensors manufactured by Micron Optics
were selected for use on the pressure transducer. The motivation for this was documented use of
these sensors in prior structural health monitoring case studies [27, 28]. Further discussion of the
specific fiber Bragg grating sensors used is included in the experimental setup discussion of
Chapter 4 and Chapter 5.
3.2 Design and Modeling of Sensing Diaphragm
3.2.1 Preliminary Diaphragm Design
The primary transduction mechanism of the pressure transducer design is its sensing diaphragm.
After experimental calibration, diaphragm strain measurements will be scaled as pressure
measurements. Careful consideration was taken in the sensing diaphragm design. To maximize
the quality of diaphragm strain measurements, the diaphragm’s strain field, strain excursion
magnitudes, and linear strain response are very important. All of these properties can be
mechanically controlled using deliberate designs in the underside of the sensing diaphragm.
Two diaphragm designs were initially considered for the pressure transducer. The first design
featured a channel in the underside of the sensing surface. The motivation for this channel was
to produce a single sensing location with uniform strain across a fixed region of the diaphragm’s
surface. The magnitude of diaphragm strain excursions during test conditions (0-1,500 psig)
could be controlled using the channel’s depth. A CAD model of this first diaphragm concept is
illustrated in Figure 18 and Figure 19.

31
An initial evaluation of this first design suggested that its strain/pressure correlation may be non-
linear at high pressures. In addition, this diaphragm design would require an azimuthally-
dependent strain sensor installation which may be too detailed for larger scale manufacturing. A
second diaphragm design which yields a bullseye strain distribution would allow for an
azimuthally independent sensor installation. In addition, this design could also be developed to
yield a quasi-uniform strain distribution at the primary sensing location. Thus, a second
diaphragm was designed with a revolved cut in the diaphragm’s underside. CAD illustrations of
the second diaphragm design are illustrated in Figure 20 and Figure 21.
Figure 18. Top view of sensing diaphragm
design 1
Figure 19. Channel on underside of sensing
diaphragm design 1

32
3.2.2 Diaphragm Design Modeling and Development
A linear finite element model was used to develop the second sensing diaphragm design concept
and verify that its strain vs. pressure distribution was linear before fabrication. Autodesk
Simulation Multiphysics 2012 was used to iteratively analyze the strain field of the diaphragm
model at 16 pressures between 0 and 1,500 psig after each design modification [35]. The goals
of the finite element model analysis were to (1) verify linearity of the diaphragm’s strain vs.
pressure distribution, (2) ensure that the diaphragm’s strain excursions in the evaluation range of
0-1,500 psig are within the sensing limits of the selected optical sensors, and (3) to create a
diaphragm design with a central sensing region of quasi-uniform strain.
A model of the diaphragm design was meshed using brick and tetrahedral elements. Before
analysis, the model’s mesh size was iteratively decreased until strain convergence at the
diaphragm’s center was achieved. For the analysis, fully fixed boundary condition
Figure 21. Contour design on underside of sensing diaphragm
design 2
Figure 20. Underside of sensing diaphragm
design 2

33
approximations were made for all surfaces which would be captivated by the pressure
transducer’s base and collar. The boundary conditions that were used for the finite element
analysis are illustrated in Figure 22 and Figure 23.
Figure 22. Top view of boundary conditions used for the finite element model
analysis of the test diaphragm

34
The feature in the diaphragm’s underside was then developed using iterations of design edits and
analyses of finite element models. The developed feature has a diameter of 2 inches and is 0.476
inch deep. A fully dimensioned drawing for fabrication of the final diaphragm design is
illustrated in an appendix at the end of this report. Figure 24 illustrates the final diaphragm
design’s azimuthally independent strain distribution at 1,500 psig.
Figure 23. Bottom view of boundary conditions used for the finite element model
analysis of the test diaphragm

35
The diaphragm’s modeled strain response between 0 and 1,500 psi is illustrated in Figure 25.
From this chart, it is evident that the modeled strain vs. pressure correlation is linear. A
qualitative analysis suggests that the diaphragm’s transduction will have a sensitivity of 1.61
.
At the maximum testing pressure of 1,500 psi, it is expected that the diaphragm will exhibit 945
of maximum principal strain at its central sensing location. Because the sensing range of the
Micron Optics fiber Bragg grating strain sensors that will be used to instrument the diaphragm is
± 2,500 , this design allows for ~1,500 of thermally induced strain, sensor pre-strain from
installation, and safety factor.
Figure 24. Finite element model illustrating the diaphragm’s calculated
strain distribution at 1,500 psig

36
3.2.3 Finite Element Model Validation
Before the pressure transducer design was fabricated, a validation study of the diaphragm finite
element model was performed. Numerous approximations were made in the boundary
conditions and linear study of the diaphragm model that could limit its accuracy. The purpose of
the validation study was to examine the strain accuracy that could be expected from the finite
element model results. There are numerous ways to investigate the accuracy of a finite element
model’s results. The simplest way is to compare a secondary quantity that can be calculated both
analytically and with the finite element model.
The finite element model was validated using a comparison of the diaphragm’s first 5 radial
frequencies. These frequencies were calculated both analytically and using the finite element
model. The radial modal frequencies of a circular thin plate can be calculated by solving the
wave equation given by
Figure 25. Model strain vs. pressure distribution for sensing diaphragm

37
( ) ( ) Eq. 9
where is the material’s volume density, is Poisson’s ratio, Young’s modulus, and is the
radius of gyration [36]. If a fully fixed boundary condition is imposed on the plate’s
circumferential surface area, the plate’s natural modal frequencies can be calculated using:
( )
√ √
( ) Eq. 10
where is the circular plate’s thickness and is the plate’s radius [36].
Analytical calculations of the diaphragm’s exact natural radial frequencies would be
computationally intensive and are outside the scope of this validation study. As a result, the first
five natural frequencies of a circumferentially fixed, 3.25 in. OD, 0.6 in. thick 316 stainless steel
disk were calculated using Eq. 10. These frequencies are tabulated in Table 1 and Table 2. For
comparison, the first 5 natural radial frequencies were calculated using both (1) the diaphragm
design’s finite element model and (2) a finite element model of a solid 3.25 in. OD, 0.6 in. thick
316 stainless steel disk. These frequencies are also tabulated in Table 1 and Table 2.

38
Table 1. The first 5 radial modes of the diaphragm calculated using geometrically simplified
analytical calculations and the exact diaphragm finite element model
Mode Solid Disk Analytical
(Hz)
Diaphragm Model
(Hz) Percent Difference
1 20,571.6 19,251.3 6.86%
2 82,286.2 88,411.7 6.93%
3 185,144. 183,783. 0.74%
4 329,145. 338,096. 2.65%
5 514,289. 511,206. 0.60%
Table 2. The first 5 radial modes of the diaphragm calculated using geometrically simplified
analytical calculations and geometrically simplified finite element model
Mode Solid Disk Analytical
(Hz)
Solid Disk Model
(Hz) Percent Difference
1 20,571.6 21,299.6 3.42%
2 82,286.2 82,926.3 0.77%
3 185,144. 185,801. 0.35%
4 329,145. 329,958. 0.25%
5 514,289. 515,387. 0.21%
The results in Table 1 and Table 2 suggest that the natural frequencies calculated by both finite
element models are reasonably close to the analytically calculated frequencies. It is expected
that the frequencies calculated using the simplified finite element model would match those
calculated analytically more closely, but the results in Table 1 suggest that the errors introduced
by approximating the diaphragm as a solid disk for analytical calculations are not unreasonable.
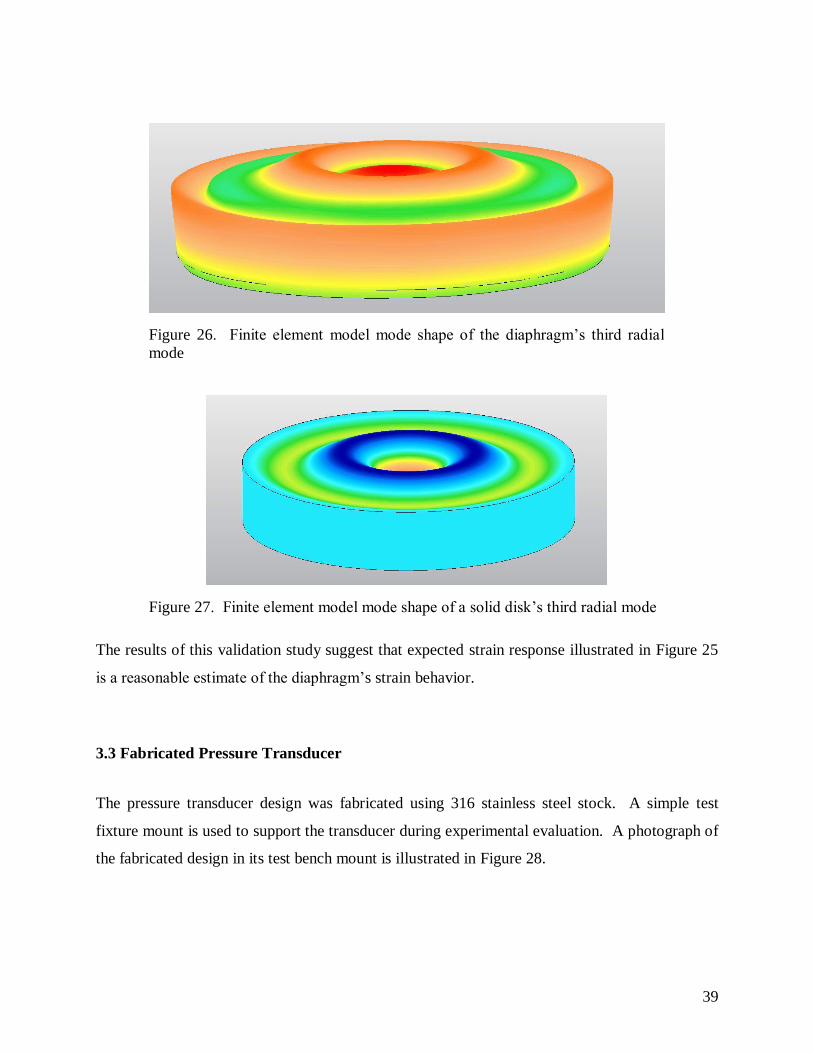
For a visual analysis, the mode shapes of the diaphragm and solid disk models’ third radial mode
are illustrated in Figure 26 and Figure 27, respectively. In these figures the third radial mode of
each model has 4 azimuthally independent nodal diameters which agree with the expected
Chladni pattern.
39
The results of this validation study suggest that expected strain response illustrated in Figure 25
is a reasonable estimate of the diaphragm’s strain behavior.
3.3 Fabricated Pressure Transducer
The pressure transducer design was fabricated using 316 stainless steel stock. A simple test
fixture mount is used to support the transducer during experimental evaluation. A photograph of
the fabricated design in its test bench mount is illustrated in Figure 28.
Figure 26. Finite element model mode shape of the diaphragm’s third radial
mode
Figure 27. Finite element model mode shape of a solid disk’s third radial mode

40
Before the fabricated pressure transmitter’s measurement repeatability and accuracy are
evaluated, a demonstration of thermal correction for diaphragm strain is conducted to evaluate
the accuracy of temperature correction calculations. Chapter 4 presents the testing procedures
and results of an experimental demonstration of thermal strain correction calculations. The
observations from these tests are used to increase the accuracy of the transducer’s coupled
thermal/mechanical response, which is evaluated in Chapter 5.
Figure 28. Top view of the test fixture with diaphragm #1
installed. Visible are two Micron Optics os3120 strain sensors
resting on top of the diaphragm
41
Chapter 4 Experimental Demonstration of Strain Measurement Correction
4.1 Testing Objectives and Experiment
The two sensor method for thermal strain correction uses measurements from two fiber Bragg
grating sensors to calculate a temperature independent strain measurement. In addition to a fiber
Bragg grating strain gage, a thermal correction sensor is used to quantify temperature change-
. Temperature change is then scaled to calculate a correction term, , which accounts for
inaccuracies in raw strain measurements that are caused by fiber and material thermal
expansion/contraction and changes in the Bragg grating’s index of refraction. A temperature
independent strain is calculated by subtracting the thermal correction term from a raw strain
measurement.
The primary purpose of the work presented in Chapter 4 is to experimentally demonstrate
temperature corrected strain measurements that are taken from an unconstrained sensing
diaphragm using the two sensor method. Two diaphragms will be used to provide a qualitative
comparison of spot weld and epoxy mounted fiber Bragg grating sensors. Consideration is given
to two thermal loading scenarios which may be encountered in a nuclear power plant.
Two pressure transducer sensing diaphragms were fabricated using type 316 stainless steel stock.
Each diaphragm was instrumented with COTS fiber Bragg strain and temperature compensation
instrumentation. The first diaphragm was instrumented with a Micron Optics os3120 strain gage
and a Micron Optics os4100 temperature compensation gage. M-Bond-10 adhesive was used to
affix these sensors. The second diaphragm was instrumented with a Micron Optics os3110 strain
sensor and an os4100 temperature compensation sensor. These sensors were attached to using
spot weld mounting.
Strain sensors were mounted across each diaphragm’s diameter. Radially, each strain sensor was
centered about the diaphragm’s transverse axis. Temperature compensation sensors were affixed
parallel to and offset from each strain sensor. Transfer paper was used in the sensor mounting

42
process to maintain similar mounting positions on each sensing diaphragm. A photograph of the
sensing diaphragms during thermal testing is illustrated in Figure 29.
Three thermal experiments were carried out while the sensing diaphragms were placed in an
Envirotronics SH8-R thermal chamber. Figure 29 illustrates the test diaphragms as they were
oriented for testing. Raw strain and temperature change measurements were recorded from each
diaphragm. Raw strain measurements were corrected for temperature perturbations using the
two sensor method.
It is unlikely that pressure transmitters in a nuclear power plant would be subject to rapid internal
or external temperature changes of large magnitude. The purpose of the first thermal loading test
is to evaluate the diaphragms’ corrected strain time histories while they are in an environment
with slow, rolling temperature changes. Testing was carried out with both sensing diaphragms
placed in the environmental chamber as illustrated in Figure 29. Power to the thermal chamber
was disconnected and the chamber’s door was propped open. A thermocouple was used to
record the ambient air temperature between the test diaphragms.
During this test, ambient temperatures fluctuated between 25.3° C and 23.3° C. Raw diaphragm
strain and temperature change were measured using both epoxy and spot weld mounted fiber
Figure 29. Mechanically unconstrained spot weld (right) and epoxy mount
(left) diaphragms in the thermal chamber

43
Bragg grating instrumentation. Absolute temperature measurements were collected using an IMI
601A01integrated thermocouple.
Although internal and external pressure transducer thermal step changes are unlikely, a suitable
pressure transducer for nuclear power plant applications should have a thermally-indiscriminate
steady state response to a temperature step change. The purpose of the second thermal test is to
examine diaphragm temperature correction during a forced temperature step change experiment.
The second thermal test was a 34 hour thermal load test. Testing was carried out with the
diaphragms oriented as illustrated in Figure 29.
Testing began at an ambient temperature of 51° C. Sufficient time was given to allow the
sensing diaphragms to come to a thermal equilibrium before data collection was started. After 2
hours the environmental chamber’s temperature set point was lowered to 29° C. 7 hours later,
the temperature chamber’s temperature was raised to 51° C. The final temperature drop to 29° C
was initiated 16 hours later.
The results of the first two thermal experiments suggested that spot weld sensor mounting would
be superior to epoxy mounting in a thermally perturbative environment. Unfortunately, steady
state temperature corrected strain measurements from both diaphragms were still observed to
fluctuate with temperature. An evaluation of the equations used to calculate the thermal
correction factor, , suggested that improved accuracy may be achieved by experimentally
determining the coefficient of thermal expansion for the stainless steel diaphragms.
A third test was conducted to collect data which could be used to examine the effects of
changing the stainless steel coefficient of thermal expansion in temperature correction
calculations. The third test was a 2.5 hour, single temperature step experiment conducted
between 24° C and 53° C. Because the results of the first two tests suggested that the spot weld
mounted instrumentation would be superior in thermally perturbative environments, the
diaphragm with epoxy mount instrumentation was not used during this experiment.

44
The third thermal test was a single temperature step test. Temperatures between 24° C and 53° C
were considered. After sufficient time was given to achieve thermal equilibrium, testing began
at 24° C. An hour later, the environmental chamber’s temperature set point was increased to 53°
C. Raw strain and temperature correction measurements were taken using only the sensing
diaphragm with spot weld mounted sensors.
4.2 Measurement and Calculations
Fiber Bragg grating sensor measurements were sampled using a four-channel Micron Optics
sm125 optical interrogator. The peak wavelength of light reflected by each sensing Bragg
grating was stored on a PC for post processing. Optical sensor measurements were sampled for
10 seconds at 2 Hz every 5 minutes and stored on a PC.
Ambient temperature was measured using the integrated thermocouple in an IMI 601A01 sensor.
The sensor’s output voltage was sampled using a NI USB-4432 Digital Acquisition unit (DAQ),
immediately scaled to a temperature value using the sensor’s sensitivity, and stored on a PC.
Temperature measurements were sampled for 10 seconds at 1 kHz every 5 minutes. Table 3 lists
the sensors and data acquisition hardware used in experiments to demonstrate thermal correction
of strain measurements.
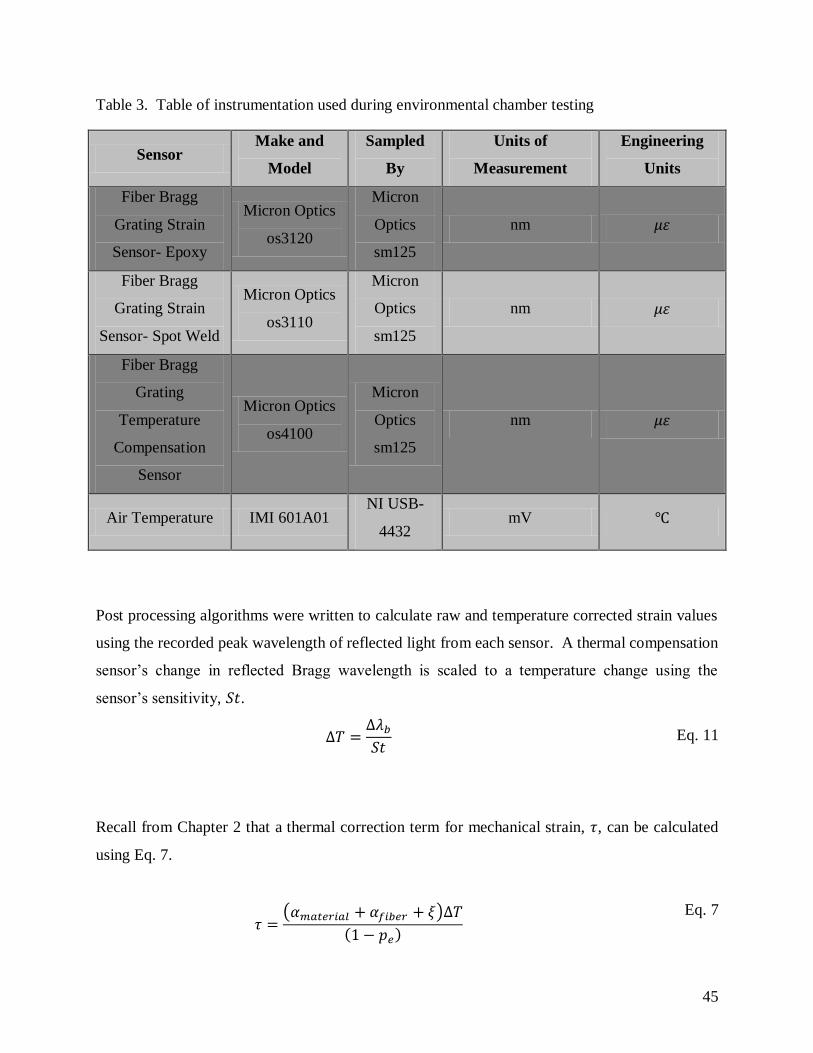
45
Table 3. Table of instrumentation used during environmental chamber testing
Sensor Make and
Model
Sampled
By
Units of
Measurement
Engineering
Units
Fiber Bragg
Grating Strain
Sensor- Epoxy
Micron Optics
os3120
Micron
Optics
sm125
nm
Fiber Bragg
Grating Strain
Sensor- Spot Weld
Micron Optics
os3110
Micron
Optics
sm125
nm
Fiber Bragg
Grating
Temperature
Compensation
Sensor
Micron Optics
os4100
Micron
Optics
sm125
nm
Air Temperature IMI 601A01 NI USB-
4432 mV
Post processing algorithms were written to calculate raw and temperature corrected strain values
using the recorded peak wavelength of reflected light from each sensor. A thermal compensation
sensor’s change in reflected Bragg wavelength is scaled to a temperature change using the
sensor’s sensitivity, .
Eq. 11
Recall from Chapter 2 that a thermal correction term for mechanical strain, , can be calculated
using Eq. 7.
( )
( )
Eq. 7

46
Where and are the coefficients of thermal expansion of the sensing diaphragm
material and the optical fiber, is the thermooptic coefficient of the optical fiber, and is the
effective photoelastic constant.
The thermal correction factor is then subtracted from a raw strain measurement to calculate a
thermally independent strain value using Eq. 8.
( )
( )
Eq. 8
Because COTS sensors were used, , , , and the base Bragg wavelength of each sensor
were provided by Micron Optics in sensor calibration documentation.
Fiber Bragg grating sensor measurements can be zeroed by updating the base Bragg wavelength
that is used in measurement post processing. To provide a qualitative analysis of the magnitude
of sensor pre-strain, sensor calibration sheet base Bragg wavelengths were used to analyze the
results of the thermal testing. Updated base Bragg wavelengths are used to analyze the
transducer’s coupled thermal/mechanical response in Chapter 5.
4.3 Results and Discussion
4.3.1 Unforced Thermal Environment Testing
The first test was a multi-day test which demonstrated the corrected strain on both sensing
diaphragms while they were subjected to changes in ambient room temperature. The recorded
strain time histories for both diaphragms are plotted with recorded temperature in Figure 30 and
Figure 31.

47
Figure 30. Temperature corrected strain measurements from epoxy-mount fiber
Bragg grating instrumentation taken during a multi-day, room temperature test
Figure 31. Temperature corrected strain measurements from spot weld-mount
fiber Bragg grating instrumentation taken during a multi-day, room temperature
test

48
An analysis of these results supports theory and suggests that temperature perturbations are
strongly correlated to changes in the observed raw strain time histories. It is clear in Figure 30
and Figure 31 that the amplitude of raw strain measurements from both diaphragms significantly
decreases when the ambient temperature drops and rises when the ambient temperature rises.
This correlation appears to be linear, and changes in raw strain slightly lag perturbations in
temperature.
An analysis of the corrected strain time histories suggests that strain correction calculations are
successful in reducing the magnitude of raw strain excursions during periods of temperature
change. The results suggest, however, that corrected strain measurements are overcompensated
for temperature perturbations. Theory suggests that temperature corrected strain measurements
should be thermally independent.
The most notable temperature change during this test is a 2° C drop that occurs between 11/12
and 11/13. Each diaphragm’s raw and corrected strain during the peak of this temperature
excursion can be compared to the raw and corrected strain during the quasi-steady state period
which occurs at midnight 11/12. In this way, the effectiveness of strain correction at reducing
strain excursions during a period of temperature change can be qualitatively examined. The
reduction in strain excursion can be calculated by
| | | | Eq. 12
where and are the amplitudes of raw and corrected strain at the peak of the 2° C
temperature excursion and and are the raw and corrected strains during the quasi-
steady state period at midnight 11/12.
A qualitative comparison of the strain excursion percent reduction achieved by the epoxy and
spot weld instrumentation are provided in Table 4.

49
Table 4. Reduction in corrected strain excursion at the peak temperature excursion observed
between 11/12 and 11/13
Sensor
mounting
Steady state
raw strain
Steady state
corrected
strain
Peak raw
strain
Peak
corrected
strain
Reduction in
corrected
strain
excursion
Epoxy 796 788 761.6 795.7 26.70
Spot weld 166 170 123.6 174.0 38.40
These results suggest that measurements taken by spot weld sensors were most effective at
reducing strain excursions caused by thermal perturbations. One possible source of this is
elasticity introduced by epoxy mounting. Although epoxy mounting is acceptable for laboratory
experiments, spot weld mounting would be choice for manufacture of a fiber Bragg grating
nuclear grade pressure transmitter. Reasons for this include a more rigid mounting interface,
ease of manufacture, and the reduced likelihood of viscoelastic creep over time.
Further analysis of the results illustrated in Figure 30 and Figure 31 provides insight into the
relative magnitudes of sensor pre-strain observed from the epoxy and spot weld mount fiber
Bragg grating instrumentation. These results suggest that during the quasi-steady state period at
midnight 11/12 the epoxy mounted strain sensor exhibited 796 of raw strain while the spot
weld mounted strain sensor exhibited 166 . The cause of a systematic strain offset is likely
sensor pre strain that was introduced during the instrumentation process.
A likely explanation for the difference in pre strain magnitudes is a variation in how the two
types of sensors were installed. Epoxy mounted sensors were held in place using a small block
of aluminum while the adhesive cured. It is likely that the aluminum placeholder pre tensioned
the sensors’ mounting. In a similar way, spot weld mounted sensors were held in place with a
piece of tape while they were affixed. It’s likely that this difference in systematic strain could be

50
explained by the varying mounting procedures. If necessary, these systematic offsets could be
removed by updating the base Bragg wavelength, , in post processing calculations.
4.3.2 Thermal Step Change Testing
The purpose of the second thermal test is to demonstrate corrected strain values as sensing
diaphragms were subjected to three 20° C step changes in ambient temperature. This test was a
34 hour test. The strain time histories for the epoxy and spot weld mounted sensors are plotted
with temperature in Figure 32 and Figure 33.
Figure 32. Temperature and corrected strain measurements from epoxy mount
fiber Bragg grating instrumentation taken during a multi-day forced temperature
test

51
A qualitative analysis of these results supports findings from the unforced thermal environment
test. Temperature correction calculations were successful in reducing the magnitude of strain
excursions during temperature steps, but strain does not appear to be temperature-decoupled.
Theory suggests that temperature corrected strain measurements should be thermally
independent.
The experiment’s longest thermal loading occurred through midnight 11/17. The reduction in
corrected strain magnitudes was calculated to compare the magnitude of raw and corrected
strains at midnight 11/17 to their respective magnitudes during the quasi-steady state period
before this temperature loading using Eq. 12 (Page 48). The results of this calculation are
tabulated in Table 5.
Figure 33. Temperature and corrected strain measurements from spot weld
mount fiber Bragg grating instrumentation taken during a multi-day forced
temperature test

52
Table 5. Reduction in corrected strain excursion during the 11/17 temperature excursion
Sensor
mounting
Steady state
raw strain
Steady state
corrected
strain
Peak raw
strain
excursion
Peak
corrected
strain
excursion
Reduction in
corrected
strain
excursion
Epoxy 878 776 1,263 686 475
Spot weld 257 159 730 115 517
The results of this analysis suggest that the spot weld sensor’s raw strain perturbations were
more effectively reduced by thermal correction calculations than the epoxy sensor’s raw strain
perturbations. These results agree with observations from unforced thermal testing and support
the pursuit of spot weld sensor mounting for the pressure transducer design.
Although a large decrease in thermally-induced strain perturbation was achieved by using two
sensor strain correction, the practicality of these results are questionable. During the 11/17
temperature excursion, corrected strain from spot weld instrumentation decreased 44 from the
observed quasi-steady state value. Finite element modeling of the diaphragm design suggested
that it would have a transduction sensitivity of 1.61
. Thus, corrected strain measurements
during the 11/17 temperature excursion would have introduced a 71.8 psi inaccuracy in pressure
measurements.
Recall from Chapter 2 that the thermal correction term, , is calculated with Eq. 7.
( )
( )
Eq. 7
Of the constituent terms used to calculate , will typically be the largest in magnitude.
Unfortunately, is experimentally determined, and the accuracy of it to characterize a

53
given material’s thermal properties would be subject to the tolerances of that material’s
manufacturing processes. As a result, the coefficient of thermal expansion of type 316 stainless
steel which was used in thermal correction measurements may be introducing inaccuracies in the
calculation of .
4.3.3 Experimental Evaluation of the Coefficient of Thermal Expansion
Analysis of the results observed during unforced and forced thermal tests suggested that a
developed coefficient of thermal expansion may increase the accuracy of strain measurement
correction.
was used for strain temperature correction during these
experiments. To experimentally develop a value which may more accurately characterize the
sensing diaphragm’s thermal properties, a 2.5 hour single step thermal experiment was
conducted.
The results of the unforced and forced thermal tests suggested that strain measurements were
overcorrected for temperature variations. Analysis of Eq. 7 (Page 20) suggests that this may be
caused by an over-estimation of . To experimentally confirm this, was calculated
using three values of . The resulting thermal correction terms were then used to correct
raw strain measurements for the thermal step. The effect of these variations on corrected strain
calculations are illustrated in Figure 34.
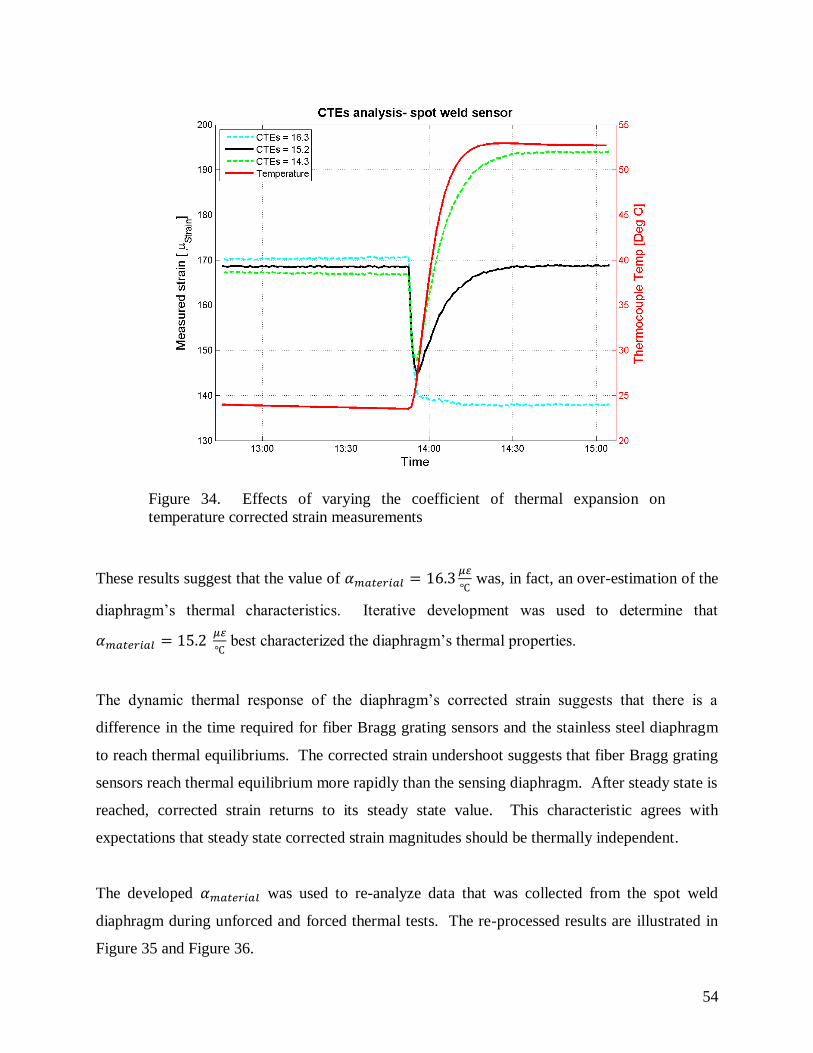
54
These results suggest that the value of
was, in fact, an over-estimation of the
diaphragm’s thermal characteristics. Iterative development was used to determine that
best characterized the diaphragm’s thermal properties.
The dynamic thermal response of the diaphragm’s corrected strain suggests that there is a
difference in the time required for fiber Bragg grating sensors and the stainless steel diaphragm
to reach thermal equilibriums. The corrected strain undershoot suggests that fiber Bragg grating
sensors reach thermal equilibrium more rapidly than the sensing diaphragm. After steady state is
reached, corrected strain returns to its steady state value. This characteristic agrees with
expectations that steady state corrected strain magnitudes should be thermally independent.
The developed was used to re-analyze data that was collected from the spot weld
diaphragm during unforced and forced thermal tests. The re-processed results are illustrated in
Figure 35 and Figure 36.
Figure 34. Effects of varying the coefficient of thermal expansion on
temperature corrected strain measurements

55
Figure 35. Re-calculated corrected strain observed during the unforced thermal
test
Figure 36. Re-calculated corrected strain observed during the unforced thermal
test

56
The corrected strain measurements illustrated in Figure 35 and Figure 36 show that the
developed coefficient of thermal expansion significantly improved the accuracy of strain
measurement correction. The corrected strain time history in Figure 36 shows that the largest
corrected strain inaccuracy occurred when the sensing diaphragm was subjected the 20
temperature step. This event is noted by a red circle in Figure 36. A scaled illustration of the
corrected strain time history at this time is illustrated in Figure 37.
Inspection of Figure 37 shows that the corrected strain approaches steady state 30 minutes after
the temperature step. These observations are similar to the results of the 30 temperature step
experiment conducted to develop an effective . Figure 37 illustrates that the peak strain
overcorrection to the 20 temperature step is 23 . Chapter 3 details that modeling of the
sensing diaphragm suggests that the pressure transducer design has an approximated transduction

57
sensitivity of 1.61
. From this transduction sensitivity it can be determined that the
diaphragm’s transient response to this 20 temperature step would have introduced a maximum
37 psi pressure measurement bias.
Typical nuclear power plant capacitance cell pressure transmitters are designed with sensing
ranges between 0 and 3,000 psig. Inaccuracies introduced by ambient temperature changes are
specified by a percentage of the transmitter’s upper range limit. The Rosemount 1153GB has a
sensing range of 0-1,000 psi and is documented to have ± 7.5 psi temperature effect per 55.6
temperature change in this range [6].
The forced thermal step experiment performed using the fiber Bragg grating sensing diaphragm
presents an evaluation temperature correction in a case when transients would produce the
largest measurement error. A comparison of the fiber Bragg grating diaphragm’s observed
thermal response and the documented thermal error of a 1153GB capacitance cell pressure
transmitter suggests that the fiber Bragg grating sensing diaphragm exhibited a thermal error
29.5 psi larger than what would be expected by a capacitance cell transmitter. Although this
pressure difference is quite large, it is very unlikely that such a temperature change would ever
be observed in a nuclear power plant.
It is likely that fiber Bragg grating corrected strain transients occur when the temperature
correction sensor reaches thermal equilibrium more rapidly than the sensing diaphragm. Recall
from Eq. 7 that accounts for strain bias caused by thermal expansion/contraction of the Bragg
grating and sensing diaphragm. In a thermally transient situation, thermally induced strain from
diaphragm expansion/contraction is being subtended from raw strain measurements before the
diaphragm actually expands/contracts. A thermal barrier which slowed the temperature
compensation sensor’s rate of thermal change has the potential minimize this effect. Future
work could focus on developing such a barrier for use on the assembled pressure transducer.

58
4.4 Summary of Experimental Results
The fiber Bragg grating pressure sensor’s primary source of transduction is its sensing
diaphragm. As such, it is important that strain measurements made on the sensing diaphragm are
reliable in feasible thermal environments. The purpose of the tests described in Chapter 4 was to
experimentally evaluate temperature correction of strain measurements that were taken by fiber
Bragg grating sensors affixed to the pressure transducer’s sensing diaphragm while it was
mechanically unconstrained. In this way, the pressure transducer’s thermal response in the
absence of mechanical stress was evaluated.
Two sensing diaphragms were fabricated and instrumented with spot weld and epoxy fiber Bragg
grating instrumentation. A room temperature and thermal step evaluation of strain measurement
correction was conducted using both sensing diaphragms. The results of these tests showed that
strain was overcompensated for temperature perturbations, but temperature correction was
successful at reducing the magnitude of strain excursions. Spot weld mounting of fiber Bragg
grating sensors was determined to be superior to epoxy mounting and an effective coefficient of
thermal expansion for the spot weld diaphragm was developed using the results of a single step
thermal test. The data collected during the room temperature and temperature step tests was re-
processed using this developed value. The results of this largely suggest that two sensor
temperature compensation is successful in calculating a thermally-independent strain for
unconstrained sensing diaphragm measurements.
The re-processed results of the room temperature test suggest that temperature corrected
diaphragm strain measurements would be quite reliable in an environment with a low thermal
rate of change. Large temperature steps may cause a transient overcompensation in strain
measurement correction. This is likely introduced when the temperature compensation sensor
reaches thermal equilibrium more rapidly than the sensing diaphragm. The results of this study
show that these transients caused the fiber Bragg grating sensing diaphragm to exhibit 4x the
maximum temperature error expected from a capacitance cell pressure transmitter in a similar
environment. Future design improvements could be focused on slowing the temperature

59
compensation sensor’s thermal rate of change. One possible way to do this is to use a thermal
barrier to slow changes in the temperature compensation sensor’s ambient temperature.

60
Chapter 5 Experimental Demonstration of Transducer’s Coupled Response
5.1 Testing Objectives and Experiment
The potential for a fiber Bragg grating pressure transducer to be used in a nuclear power plant
depends on that transducer’s coupled thermal/mechanical response. Chapter 4 of this thesis
demonstrates temperature corrected strain measurements taken from the pressure transducer’s
sensing diaphragm in thermally steady and unsteady environments. Results of this study show
that temperature-decoupled strain measurements are achieved in thermally steady/low rate of
change environments. Finite element modeling of the transducer’s sensing diaphragm was
conducted in Chapter 3. This work suggests that the diaphragm’s corrected strain is linear with
respect to pressure. The primary purpose of the testing presented in Chapter 5 is to evaluate the
fiber Bragg grating pressure transducer’s coupled thermal/mechanical response and to
experimentally determine and experimentally determine the transducer’s calibration model.
The pressure transducer was assembled using the sensing diaphragm with spot weld mounted
fiber Bragg grating sensor and secured in a mounting fixture. A closed loop hydraulic system
was used to pressurize the transducer. A flowchart of this hydraulic system is illustrated in
Figure 38.

61
Using this system, the transducer’s internal pressure can be manually controlled by regulating the
return fluid flow to the system’s reservoir. Flow regulation is achieved using a manually
adjusted needle valve. A Bourdon pressure gage is used to provide course measurements of the
pressure vessel’s internal pressure. The pressure transducer’s reference internal pressure is
measured using an Omega PX309-3KG5V pressure transducer. Figure 39 illustrates the
mounted transducer before a pressure test.
Dyna-Pack M-404 0143
Hydraluic Pump
Forced Convection Heat
Exchanger
RTD
Pressure Transmitter
Flow Regulator
Oil Tank
Figure 38. Hydraulic system flowchart

62
The closed loop hydraulic system has the potential to introduce very large temperature changes
which were previously observed to drift the transducer’s internal pressure. Changes in the
fluid’s temperature are caused by viscous frictions in the pump and needle valve, and cause a
change in the fluid’s density. To help reduce pressure drift in the transducer during testing, a
forced convection heat exchanger was used to maintain the fluid temperature fluctuation within a
range.
Two pressure step tests were completed to evaluate the pressure transducer’s coupled
thermal/mechanical response and experimentally calculate the transducer’s calibration
sensitivity. The first experiment was a 6.5 hour test. During this test, the pressure transducer’s
internal pressure was increased from 0 psig to 1,100 psig in five 50 minute intervals. The
transducer’s internal pressure was then decreased to 250 psig in three 50 minute steps. An
experimental pressure transducer calibration model was calculated using the corrected strain and
pressure time histories that were observed during this test.
Figure 39. Side view of fiber Bragg grating pressure transmitter in
pressure testing environment

63
The second experiment was a similar 5 hour test. During this test, the pressure transducer’s
internal pressure was increased to 1250 psig in four 50 minute intervals. The transducer’s
internal pressure was then decreased to 400 psig in two 50 minute steps. To assess the
transducer’s calibration model repeatability, corrected diaphragm strain measurements were
scaled to pressure using the experimentally generated model from the first test and compared to
reference pressure measurements.
5.2 Measurement and Calculations
The pressure transducer’s sensing diaphragm is instrumented with a spot welded Micron Optics
os3110 strain gage across its diameter and an os4100 temperature compensation sensor mounted
parallel to and offset from the strain sensor. Figure 40 illustrates the sensing diaphragm with the
spot weld sensor installed in the pressure transducer housing.
Figure 40. Spot weld fiber Bragg grating sensing
diaphragm installed in the pressure transmitter housing

64
Fiber Bragg grating sensor measurements were sampled using a four-channel Micron Optics
sm125 optical interrogator. The peak wavelength of light reflected by each sensing Bragg
grating was stored on a PC for post processing. Optical sensor measurements were sampled for
10 seconds at 2 Hz every 60 seconds and stored on a PC. To remove systematic bias in strain
measurements, updated base Bragg wavelengths were used to calculate a temperature corrected
strain.
Section 4.2 of this thesis details how fiber Bragg grating strain and temperature compensation
measurements can be scaled to calculate a thermally independent strain. Thermal evaluation of
the transducer’s sensing diaphragm suggested that strain correction calculations can be improved
using an experimentally determined effective . As such,
was used
to calculate temperature corrected diaphragm strain.
A panel of reference sensors was used to characterize the hydraulic test system and transducer
during pressure experiments. The temperature of the hydraulic flow entering the pressure
transducer was recorded using a Minco S205459PD10P4S resistance temperature detector. The
transducer’s internal reference pressure was recorded using an Omega PX309-3KG5V pressure
transducer. Voltage outputs from these sensors were sampled using an NI USB-4432, scaled to
engineering units and stored on a PC. Datasets from these sensors were sampled for 10 seconds
at 1 kHz every 60 seconds. A list of the instrumentation used throughout pressure test
experiments is provided in Table 6.

65
Table 6. Table of instrumentation used during pressure testing
Sensor Make and Model Sampled
By
Units of
Measurement
Engineering
Units
Fiber Bragg
Grating Strain
Sensor- Spot Weld
Micron Optics
os3110
Micron
Optics
sm125
nm
Fiber Bragg
Grating
Temperature
Compensation
Sensor
Micron Optics
os4100
Micron
Optics
sm125
nm
Reference Pressure
Transducer
Omega PX309-
3KG5V
NI USB-
4432 V PSI
Hydraulic Flow
Temperature
Minco
S205459PD10P4S
NI USB-
4432 V
The pressure transducer’s sensitivity was calculated by performing a linear regression of the
pressure and diaphragm strain measurements that were recorded during the first pressure test.
Using this experimental model sensitivity, the pressure transducer’s diaphragm strain can be
related to pressure by
Eq. 13
where is the temperature corrected sensing diaphragm strain and is the transducer’s
transduction sensitivity in units
.
After the second pressure experiment, a model-calculated pressure record was determined using
Eq. 13. The accuracy of the model-calculated pressure is evaluated using the reference pressure

66
time history. The optical pressure transducer’s absolute measurement error can be calculated
using
| | Eq. 14
Where is the model-calculated pressure time history and is the reference pressure
throughout testing.
5.3 Results and Discussion
5.3.1 Pressure Transducer Calibration Testing
The purpose of the first pressure test was to experimentally develop a transduction calibration
curve for the fiber Bragg grating pressure transducer. During this test, pressure was stepped
between 0 and 1,100 psig in 50 minute increments. Figure 41 illustrates the corrected diaphragm
strain and reference pressure observed during this experiment.

67
A linear transducer calibration model was developed by performing a regression analysis on the
observed strain/pressure correlation. Figure 42 illustrates the experimental strain/pressure scatter
(blue), the experimentally developed calibration model (black), and the finite element-developed
calibration model.
Figure 41. Transduction calibration experiment corrected strain and reference
pressure time histories

68
Finite element modeling of the transducer’s sensing diaphragm design suggested that it would
have a transduction sensitivity of 1.61
. Figure 42 shows that the transducer sensitivity which
was experimentally developed, 1.64
, is in close agreement. This strong agreement provides
validity to the accuracy of the finite element model and suggests that there is little or no
mechanical interaction between the sensing diaphragm and pressure transducer housing. Such
interaction would be undesirable because has the potential to cause a non-linear strain/pressure
correlation.
The experimental strain/pressure distribution in Figure 42 illustrates the effects of over and
under-compensation of raw strain measurements. In this figure, corrected strain and pressure are
clustered at each experimental pressure step. Each cluster appears to be individually smeared
parallel to the calibration curve, which illustrates the test system’s inherent pressure drift after
each pressure step. Two distinct patterns of clusters, however, straddle the calibration models.
Figure 42. Comparison of the experimental and finite element model pressure
calibration curves

69
The first pattern—data collected while the transducer’s internal pressure was being increased—
has a systematic bias which suggests that strain was over-corrected for thermal changes.
Similarly, the second pattern contains data that was collected while the transducer’s internal
pressure was decreased. This strain pattern falls slightly above the models and suggests that
strain was under-corrected for temperature as pressure was decreased.
Thermal testing in Chapter 4 showed that temperature correction transients are introduced when
the transducer’s sensing diaphragm and temperature compensation instrumentation reach thermal
equilibrium at different times. The observations from coupled thermal and mechanical testing
agree with these results, but suggest that temperature correction contains a systematic, not
transient, bias. To further examine this, Figure 43 illustrates the temperature of the hydraulic
flow entering the pressure transducer during this experiment.
Figure 43. Temperature of hydraulic flow observed during the coupled response
test

70
Analysis of the hydraulic system’s flow temperature shows that the fluid never reaches thermal
equilibrium between pressure steps. As such, it is possible that the systematic biases observed in
the corrected strain measurements are caused by the thermally unsteady test conditions. Further
testing analyzed the effects of increasing the time between pressure steps, but the hydraulic
system’s pressure and temperature drifts did not allow for an isothermal mechanical analysis of
the pressure transducer and similar results were observed. Determining the exact cause of the
systematic strain biases would help increase the transducer’s measurement reliability and would
help improve its design. Future isothermal studies which analyze the sensing diaphragm’s pure
mechanical response would offer more insight into strain measurement biases.
5.3.2 Calibration Repeatability Experiment
The work presented in Section 5.3.1 presents the results of a test conducted to experimentally
calibrate the fiber Bragg grating pressure transducer. A similar experiment was conducted to
examine the repeatability of the pressure transducer’s calibration. During this test, the
transducer’s internal pressure was incremented between 0 and 1,200 psig in 50 minute intervals.
The observed strain and pressure scatter are plotted with the finite element and experimental
calibration models in Figure 44.

71
The strain/pressure clustering and systematic strain biases illustrated in Figure 44 are similar to
the results of the experimental calibration model study. An evaluation of the repeatability of
these test results suggests that both models are precise in characterizing the transducer’s response
to changes in internal pressure.
Reference pressure measurements were used to examine the accuracy of the pressure transducer.
Strain measurements recorded during the measurement repeatability test were scaled to pressure
using the experimentally developed calibration model. These model-calculated pressures are
compared to reference measurements in Figure 45.
Figure 44. Corrected strain vs. pressure scatter observed during the repeatability
test

72
Qualitative analysis of Figure 45 shows that the experimental model-calculated pressure record
tracks the reference pressure time history quite well. The model over-estimates the reference
pressure as test pressure increases. The cause of this is likely to be strain over-correction during
testing conditions at this time. As the transducer’s pressure is decreased, the model under-
estimates pressure.
Quantitative comparison of the reference and model-calculated pressure signals shows that the
all-optical pressure transducer concept has significant potential to be developed for nuclear
power plant applications. Measurement error was calculated using Eq. 14. Analysis of the test’s
measurement error shows that the maximum error, 44.3 psi, occurs immediately following the
last pressure increase. This event is noted in Figure 45. The mean measurement error for this
test was 19.0 psi.
Figure 45. Recorded reference pressure (red) and experimental model-
calculated pressure (blue) observed during the calibration model repeatability
test

73
A comparison of the fiber Bragg grating pressure transducer’s combined thermal/mechanical
measurement error to those which may be expected from a capacitance cell pressure transmitter
shows that the fiber Bragg grating pressure transducer should be further developed to reduce
thermally-induced inaccuracies. The Rosemount 1153GB capacitance cell transmitter’s
measurement error is defined by its calibrated pressure span. For a calibrated span of 1,000 psi,
this transmitter would have an overall accuracy of ± 2.5 psi.
Comparison of the accuracies of the fiber Bragg grating and capacitance cell pressure
transmitters suggests that the fiber Bragg grating transducer concept should be further developed.
The largest source of measurement error in the pressure transducer is likely to be strain under
and over-compensation for temperature changes. Although temperature compensation biases
introduce moderate measurement error into the pressure transducer’s pressure time history, this
error could be significantly reduced by further developing strain measurement correction
calculations.
5.4 Summary of Experimental Results
The fiber Bragg grating pressure transducer’s combined thermal/mechanical response was
experimentally evaluated in a series of pressure step tests using a hydraulic pressure test system.
The results of these experiments are highlighted in Chapter 5. The spot weld sensing diaphragm
was used during all testing experiments. Viscous friction in hydraulic system caused thermal
and pressure drift in the test system and provided unsteady test conditions.
The transducer’s experimentally-developed sensitivity was calculated using the results from a 6.5
hour pressure step experiment. This calibration model closely agreed with the finite element
calibration model. The results of a second pressure step experiment showed that the fiber Bragg
grating pressure transducer had significant measurement repeatability. Measurement error was
calculated by comparing pressure measurements from the fiber Bragg Grating and reference
pressure transducers.

74
Comparison of the fiber Bragg grating pressure transducer’s measurement error to measurement
error which could be expected from a capacitance cell transmitter suggests that the fiber Bragg
grating transducer should be further developed. The largest cause of measurement inaccuracy is
likely to be over and under-correction of diaphragm strain measurements for temperature
changes. Future work should focus on further developing temperature correction calculations
and an isothermal mechanical evaluation of the pressure transducer design.

75
Chapter 6 Conclusions
The development of a nuclear grade all-optical pressure transducer would allow the transduction
interface and interrogation electronics to be centralized in a controlled environment. New optical
interrogation lines would be unperturbed by electromagnetic interference. In addition, this
technology would significantly extend sensor life-time and reduce sensor maintenance and
lifecycle costs.
6.1 All-Optical Pressure Transducer Design and Secondary Effects
A fiber Bragg grating pressure sensor that uses diaphragm strain as the primary source of
transduction was designed. Testing showed that this design had many strengths, one of which
includes the ability to easily change sensing diaphragms between tests while maintaining
measurement repeatability. A mechanical analysis suggests that the design could be developed
to yield absolute or differential pressure measurements by altering the sensor’s reference
pressure. The mechanical simplicity and robustness of this pressure sensor design also suggests
that it should be easily developable to satisfy IEEE Std. 323-1974 ( [33]) and IEEE Std. 344-
1975 ( [34]), which would be required for use in a nuclear power reactor.
Intrinsic, wavelength modulated optical strain sensors such as Fiber Bragg grating sensors are
choice for a nuclear power plant application. Unfortunately, fiber Bragg grating strain sensors
are indiscriminate of mechanically and thermally induced strains. The proposed pressure sensor
uses a strain-decoupled temperature compensation sensor to monitor changes in the sensing
diaphragm’s temperature.
The test results discussed in Chapter 4 suggest that thermal perturbations are likely to be the
largest source of error in an all-optical pressure transducer design. Temperature correction
calculations were shown to be time dependent, and thermal correction transients were observed
to occur when the temperature compensation sensor and sensing diaphragm were not at thermal
equilibrium. Accurate temperature-decoupled strain measurements were achieved after the

76
sensing diaphragm and temperature compensation sensor reach thermal equilibrium. Thermal
transients may compromise strain measurement accuracy for up to 30 minutes after a 20
temperature step.
Spot weld mounting of fiber Bragg grating sensors was shown to be favorable to epoxy
mounting in a thermally perturbative environment. Larger temperature correction biases were
calculated using measurements from epoxy-mounted instrumentation. In addition, spot weld
mounting is likely to be more mechanically accepted for a long-term, industrial applications
where viscoelastic creep is undesirable.
6.2 Experimental Pressure Transducer Performance
One of the most desirable qualities for any type of transducer to have is a linear, repeatable
response. Experimental demonstration of the proposed pressure transducer shows that its
calibration model is linear within the testing range. Testing also showed that the fiber Bragg
grating pressure transducer had high measurement repeatability. This suggests that such a
method of all-optical pressure transduction would be desirable for nuclear applications if
competitive performance accuracies could be achieved.
It is unlikely for a pressure transducer in a nuclear power plant to be subjected to large thermal
steps over short time periods. As such, an experimental evaluation of the fiber Bragg grating
pressure transducer’s coupled thermal/mechanical response in a thermally unsteady environment
presented an opportunity to test the pressure transducer in a “worst case” scenario. During this
test, the maximum difference between the fiber Bragg grating pressure transducer’s output and
reference measurements followed a pressure (and by nature of the test system a temperature)
step. This suggests that thermal correction calculations were likely to be a contributing factor to
the observed measurement inaccuracy.

77
6.3 Feasibility of Fiber Bragg Grating Pressure Transducer for Nuclear Power Plant
Applications
The proposed pressure transducer exhibited a maximum measurement error 18x larger than the
expected error from a capacitance cell pressure transmitter in the same environment. This shows
that the fiber Bragg grating transducer design is not immediately ready for use in a nuclear power
plant. Further analysis, however, shows that significant potential exists for this concept to be
developed for such an application in the future. Thermal strain correction has been established to
be the largest contributor of measurement inaccuracies for a fiber Bragg grating pressure
transducer. If these measurement biases were overcome, the proposed fiber Bragg grating
pressure transducer is likely to be feasible for nuclear power plant applications.
The Fukushima Daiichi Nuclear Power Plant disaster shows that a high-temperature pressure
sensor system would be an asset in the event of a nuclear emergency. Literature suggests that
fiber Bragg grating sensors are not degraded by long-term use in nuclear installations where they
would be subject to limited gamma-dosing and large temperature perturbations [22], [23]. In
addition, fiber Bragg grating strain gages have been used in other parts of nuclear power plants
to monitor strain on containment vessel walls. Because a fiber Bragg grating pressure transducer
is not expected to be degraded by gamma-dosing or long-term operation at high temperatures, it
would be feasible for use in a nuclear power plant application.
A low-power sensory system would be an asset in the event of a power plant emergency. The
estimated nominal power consumption of a single Emerson Rosemount 1153 Series B Alphaline
Nuclear Pressure Transmitter is 4.4 Watts [10]. Similarly, Micron Optics’s sm125 optical
interrogator is capable of interrogating 16 optical channels, the equivalent of 8 temperature
compensated pressure sensors, with 20 Watts [25]. This suggests that an all optical pressure
sensing network has significant potential to reduce power consumption.
A high potential exists for this design to meet (or be easily modified to meet) both IEEE Std.
323-1974 ( [33]) and IEEE Std. 344-1975 ( [34]). In addition to the pressure transducer’s linear,
repeatable calibration, these qualities make the proposed pressure transducer a good candidate
for future development.

78
6.4 Areas of Future Work
Future development of the proposed fiber Bragg pressure transducer should focus on increasing
its measurement accuracy, developing the design to meet both IEEE Std. 323-1974 ( [33]) and
IEEE Std. 344-1975 ( [34]) requirements, and adapting the design to allow for absolute and
differential pressure measurements. A deeper understanding of the sources for transient and
systematic thermal strain biases would increase the transducer’s accuracy. In addition, reducing
the thermal resistance between the optical sensors and the sensing diaphragm may also
contribute to reducing the effects of strain under/over correction. This could be achieved by
using thermal gel at the sensor/diaphragm interface.
Future consideration should also be given to a transducer design which is capable of
withstanding an internal overpressure or signaling that an overpressure has occurred. The
proposed fiber Bragg grating pressure transducer was designed for use in an environment where
pressure would be controlled between 0 and 1,500 psig. In practice, however, the transducer
may be subjected to an overpressure in the event of a catastrophe. A large internal pressure
would eventually tear the transducer’s fiber Bragg grating sensors. If this were to happen, the
transmitter’s interrogation unit would be unable to measure diaphragm strain. Although it is
possible to include a modest safety factor in the design of future fiber Bragg grating pressure
transducers to account for such an event, this would reduce the resolution of diaphragm strain
measurements. Future consideration should be given to develop an alarm which signals if no
Bragg wavelength is reflected by any of the transducer’s sensors.
In the nuclear power generation industry, sensor redundancy is favored. To this end, a single
pressure transducer’s sensing diaphragm could be instrumented with a second fiber Bragg strain
gage. Preliminary testing has shown that the response of a second strain gage that is mounted
symmetric to the temperature compensation sensor would also have a linear strain response. In
addition, the calibration sensitivity of the redundant strain gage would be less than the
transducer’s primary strain gage which would also make it a reasonable tool to monitor for an
overpressure event.

79
BIBLIOGRAPHY
[1] World Nuclear Association, "Nuclear Power in the USA," World Nuclear Association,
December 2011. [Online]. Available: http://www.world-nuclear.org/info/inf41.html.
[Accessed 1 January 2012].
[2] H. Hashemian, "Measurement of dynamic temperatures and pressures in nuclear power
plants," Ontario, 2011.
[3] United States Nuclear Regulatory Comission, "Information Notice No. 89-42: Failure of
Rosemount Models 1153 and 1154 Transmitters," 21 April 1989. [Online]. Available:
http://www.nrc.gov/reading-rm/doc-collections/gen-comm/info-notices/1989/in89042.html.
[Accessed 2 January 2012].
[4] CNN Wire Staff, "3 nuclear reactors melted down after quake, Japan confirms," CNN, 7
June 2011. [Online]. Available:
http://edition.cnn.com/2011/WORLD/asiapcf/06/06/japan.nuclear.meltdown/index.html?ire
f=NS1. [Accessed 10 April 2012].
[5] E. Strickland, "Explainer: What went wrong in Japan's nuclear reactors," EIEE, 16 March
2011. [Online]. Available: http://spectrum.ieee.org/tech-talk/energy/nuclear/explainer-
what-went-wrong-in-japans-nuclear-reactors. [Accessed 10 April 2012].
[6] Emerson Process Management, "Rosemount 1153 Series B Alphaline Nuclear Pressure
Transmitter Product Datasheet," January 2008. [Online]. Available:
http://www3.emersonprocess.com/rosemount/nuclear/Document/4302us.PDF. [Accessed 1
December 2011].
[7] Emerson Process Management, "Rosemount 1154 Alphaline Nuclear Pressure Transmitter
Product Datasheet," January 2008. [Online]. Available:
http://www.emersonprocess.com/rosemount/nuclear/Document/4514pds.pdf. [Accessed 10
January 2012].
[8] Vibro-Meter SA, "CP 502 Datasheet," [Online]. Available: http://www.vibro-

80
meter.com/pdf/DS_CP502-e-dec07.pdf. [Accessed 9 January 2012].
[9] M. Fonseca, J. English, M. Von Arx and M. Allen, "Wireless micromachined ceramic
pressure sensor for high-temperature applications," Journal of Microelectromechanical
Systems, vol. 11, no. 4, pp. 337-343, 2002.
[10] Emerson Process Management, "Rosemount 1153 Series B Alphaline Nuclear Pressure
Transmitter Reference Manual," January 2008. [Online]. Available:
http://www3.emersonprocess.com/rosemount/nuclear/Document/00809-0100-4302.pdf.
[Accessed 15 February 2012].
[11] Omega, "Pressure Gages & Switches," Omega Pressure Sensing, [Online]. Available:
http://www.omega.com/literature/transactions/volume3/pressure.html. [Accessed 15
February 2012].
[12] D. Geib, "Multiplexing of Extrinsic Fabry-Perot optical fiber sensors for strain
measurements," Blacksburg, Virginia, 2003.
[13] S. M. Melle, K. Liu and R. Measures, "Practical fiber-optic Bragg grating strain gage
system," Applied Optics, vol. 32, no. 19, pp. 3601-3609, 1993.
[14] M. Xu, L. Dong, L. Reekie, J. Tucknott and J. Cruz, "Temperature-independent strain
sensor using a chirped Bragg grating in a tapered optical fibre," Electronics Letters, vol. 31,
no. 10, pp. 823-825, 1995.
[15] K. O. Hill and G. Meltz, "Fiber Bragg grating technology fundamentals and overview,"
Journal of Lightwave Technology, vol. 15, no. 8, pp. 1263-1276, 1997.
[16] Y. Rao, "Recent progress in applications of in-fibre Bragg grating sensors," Optics and
Lasers in Engineering, vol. 31, pp. 297-324, 1999.
[17] W. Zhang, F. Li and Y. Liu, "FBG Pressure sensor based on the double shell cylinder with
temperature compensation," Journal of the International Measurement Confederation, vol.
42, pp. 408-411, 2009.
[18] Y. Hsu, L. Wang, W.-F. Liu and Y. Chiang, "Temperature compensation of optical fiber
Gragg grating pressure sensor," IEEE Photonics Technology Letters, vol. 18, no. 7, pp. 874-
876, 2006.
[19] R. Schroeder, T. Yamate and E. Udd, "High pressure and temperature sensing for the oil

81
industry using fiber Bragg gratings written onto side hole single mode fiber," Proceedings
of SPIE, the international society for optical engineering, p. 42, 1999.
[20] M. Xu, J. Archambault, L. Reekie and J. Dakin, "Thermally-compensated bending gauge
using surface-mounted fibre gratings," International Journal of Optoelectronics, vol. 9, no.
3, p. 281, 1994.
[21] K.-S. Kim, Y.-C. Song, G.-S. Pang and D.-J. Yoon, "Structural integrity tests of the
containment structures of nuclear power plants with fiber Bragg grating sensors," in
Structural Mechanics in Reactor Technology, Toronto, 2007.
[22] F. Berghamans, A. Fernandez, B. Brichard, F. Vos, M. Decréton, A. Gusarvo, O. Depris, P.
Mégret, M. Blondel, S. Caron and A. Morin, "Radiation hardness of fiber-optic sensors for
monitoring and remote handling applications in nuclear environments," in SPIE
Proceedings 353, Boston, 1998.
[23] A. Gusarov, "Long-term exposure of fiber Bragg gratings in the BR1 low-flux nuclear
reactor," in Radiation and Its Effects on Components and Systems, Bruges, 2009.
[24] W. Morey, G. Meltz and W. Glenn, "Fiber optic Bragg grating sensors," Proc. SPIE, no.
1169, pp. 98-107, 1989.
[25] Micron Optics, "Optical Sensing Interrogator | sm125," [Online]. Available:
http://www.micronoptics.com/uploads/library/documents/Datasheets/Micron%20Optics%2
0sm125.pdf. [Accessed 14 March 2012].
[26] Y.-J. Rao, "In-fibre Bragg grating sensors," Measurement Science and Technology, vol. 8,
no. 4, pp. 355-375, 1997.
[27] Micron Optics, "Case Study- Arsenal Bridge," 2010. [Online]. Available:
http://204.200.161.101/uploads/library/documents/MicronOptics-
Arsenal%20Bridge_2009.pdf. [Accessed 25 November 2011].
[28] Micron Optics, "Case Study- Canton Tower at Guangzhou," 2010. [Online]. Available:
http://www.micronoptics.com/uploads/library/documents/Micron_Optics-
Canton_Tower.pdf. [Accessed 25 November 2011].
[29] Micron Optics, "Optical Strain Gage | os3155 Datasheet," [Online]. Available:
http://www.micronoptics.com/uploads/library/documents/Datasheets/Micron%20Optics%2

82
0os3155.pdf. [Accessed 20 November 2011].
[30] Y. Zhang, Feng, Dejun, Z. Liu, Z. Guo, X. Dong, K. Chiang and B. Chu, "High-sensitivity
pressure sensor using a shielded polymer-coated fiber Bragg grating," IEEE Photonics
Technology Letters, vol. 13, no. 6, pp. 618-619, 2001.
[31] L. Liu, Z. Hao, Q. Zhao, Y. Liu and F. Li, "Temperature-independent FBG pressure sensor
with high sensitivity," Optical Fiber Technology, vol. 13, pp. 78-80, 2007.
[32] M. Xu, L. Reekie, Y. Chow and J. Dakin, "Optical in-Fibre grating high pressure sensor,"
Electronics Letters, vol. 29, no. 4, pp. 398-399, 1993.
[33] United States Nuclear Regulatory Commission, "IEE Standard for Qualifying Class IE
Equipment for Nuclear Power Generating Stations," 1974. [Online]. Available:
http://pbadupws.nrc.gov/docs/ML0322/ML032200206.pdf. [Accessed 03 March 2012].
[34] Institute of Electrical and Electronics Engineers, Inc, "IEEE Recommended Practice for
Seismic Qualification of Class 1E Equipment for Nuclear Power Generating Stations,"
1987. [Online]. Available: http://ieeexplore.ieee.org/stamp/stamp.jsp?arnumber=00026468.
[Accessed 14 March 2012].
[35] Autodesk, "Autodesk Simulation Brochure," [Online]. Available:
http://images.autodesk.com/adsk/files/simulation_detail_brochure_en.pdf. [Accessed 14
March 2012].
[36] L. Kinsler, A. Frey, A. Coppens and J. Sanders, Fundamentals of Acoustics, John Wiley &
Sons, 1999.
[37] K. Kuang, R. Kenny, M. Whelan, W. Cantwell and P. Chalker, "Embedded fibre Bragg
grating sensors in advanced composite materials," Compsites Science and Technology, vol.
61, pp. 1379-1387, 2001.
[38] Micron Optics, "Temperature Compensation Sensor | os4100 Datasheet," [Online].
Available: http://www.sengenia.com/pdfs/os4100.pdf. [Accessed 20 November 2011].
[39] Micron Optics, "Optical Strain Gage | os3110 Datasheet," [Online]. Available:
http://www.sengenia.com/pdfs/os3100.pdf. [Accessed 20 November 2011].
[40] Grahamwild, "Wikipedia," 10 September 2011. [Online]. Available:
http://en.wikipedia.org/wiki/File:Fbg.GIF. [Accessed 21 November 2011].

83
[41] Micron Optics, "Case Study- Team Alinghi," 2010. [Online]. Available:
http://204.200.161.101/uploads/library/documents/Micron_Optics-Alinghi.pdf. [Accessed
25 November 2011].
[42] U.S. Army Corps of Engineers, Engineer Research and Development Center,
Implementation of a novel structural health management system for steel bridges,
Champaign, IL, 2010.
[43] Micron Optics, "Micron Optics Instruments," Micron Optics, 2011. [Online]. Available:
http://micronoptics.com/sensing_instruments.php. [Accessed 9 December 2011].
[44] C.-W. Lai, Y.-L. Lo, J.-P. Yur, W.-F. Liu and C.-H. Chuang, "Application of Fabry-Perot
and fiber Bragg grating pressure sensors to simultaneous measurement of liquid level and
specific gravity," IEEE Sensors Journal, 2011.
[45] "Next Generation Nuclear Power Plant," Idaho National Laboratory, 12 July 2011.
[Online]. Available: http://www.nextgenerationnuclearplant.com/. [Accessed 2 January
2012].

84
APPENDIX- PRESSURE TRANSDUCER DESIGN SPECIFICATIONS

85
DETAILED DRAWINGS OF CONCEPT PRESSURE TRANSDUCER BASE
Figure 46. Detailed drawing for manufacture- pressure transducer base
page 1 of 3

86
Figure 47. Detailed drawing for manufacture- pressure transducer base
page 2 of 3

87
Figure 48. Detailed drawing for manufacture- pressure transducer base
page 3 of 3

88
DETAILED DRAWING OF CONCEPT PRESSURE TRANSDUCER COLLAR
Figure 49. Detailed drawing for manufacture- pressure transducer collar

89
DETAILED DRAWINGS OF CONCEPT PRESSURE TRANSDUCER DIAPHRAGM
Figure 50. Detailed drawing for manufacture- pressure transducer
diaphragm