Embed Size (px)
Citation preview
EFFICIENT, EFFECTIVE, ACCOUNTABLE
AN
AMERICAN BUDGET
BUDGET OF THE U.S. GOVERNMENTOFFICE OF MANAGEMENT AND BUDGET | OMB.GOV
FISC A L Y E A R 2019
Mid-Session Review

EFFICIENT, EFFECTIVE, ACCOUNTABLE
AN
AMERICAN BUDGET
BUDGET OF THE U.S. GOVERNMENTOFFICE OF MANAGEMENT AND BUDGET | OMB.GOV
FISC A L Y E A R 2019
Mid-Session Review

EXECUTIVE OFFICE OF THE PRESIDENT
OFFICE OF MANAGEMENT AND BUDGET
WASHINGTON, D.C. 20503
THE DIRECTORJuly 13, 2018
The Honorable Paul D. Ryan
Speaker of the House of Representatives
Washington, D.C. 20515
Dear Mr. Speaker:
Section 1106 of Title 315 United States Code, requests that the President send to the
Congress a supplemental update of the Budget that was transmitted to the Congress earlier in the
year. This enclosed supplemental update of the Budget, commonly known as the Mid-Session
Review, contains revised estimates of receipts, outlays, budget authority, and the budget deficit
for fiscal years 2018 through 2028.
Sin^eiely,
Mick MulvaneyDirector
Enclosure
Identical Letter Sent to The President of the Senate

v
http://www.budget.gov
TABLE OF CONTENTS
List of Tables ��������������������������������������������������������������������������������������������������������������������������������������������vii
Summary ����������������������������������������������������������������������������������������������������������������������������������������������������1
Economic Assumptions ������������������������������������������������������������������������������������������������������������������������������5
Receipts ����������������������������������������������������������������������������������������������������������������������������������������������������11
Expenditures ��������������������������������������������������������������������������������������������������������������������������������������������15
Summary Tables ��������������������������������������������������������������������������������������������������������������������������������������19
Page

vii
LIST OF TABLES
Table 1� Changes in Deficits from the February Budget �����������������������������������������������������������������4
Table 2� Economic Assumptions ��������������������������������������������������������������������������������������������������������7
Table 3� Comparison of Economic Assumptions ������������������������������������������������������������������������������9
Table 4� Changes in Receipts ����������������������������������������������������������������������������������������������������������13
Table 5� Changes in Outlays �����������������������������������������������������������������������������������������������������������18
Table S–1� Budget Totals ���������������������������������������������������������������������������������������������������������������������21
Table S–2� Effect of Budget Proposals on Projected Deficits �������������������������������������������������������������22
Table S–3� Baseline by Category ��������������������������������������������������������������������������������������������������������23
Table S–4� Proposed Budget by Category �������������������������������������������������������������������������������������������25
Table S–5� Proposed Budget by Category as a Percent of GDP ��������������������������������������������������������27
Table S–6� Mandatory and Receipt Proposals ������������������������������������������������������������������������������������29
Table S–7� Proposed Discretionary Funding Levels in the 2019 Mid-Session Review ��������������������47
Table S–8� 2019 Discretionary Overview by Major Agency ���������������������������������������������������������������49
Table S–9� Estimated Spending from 2019 Balances of Budget Authority: Discretionary Programs �������������������������������������������������������������������������������������������������52
Table S–10� Outlays for Mandatory Programs Under Current Law ��������������������������������������������������53
Table S–11� Federal Government Financing and Debt ������������������������������������������������������������������������54
Page

1
SUMMARYSince President Trump took office in January
of 2017, the Administration has focused on pro-moting policies that foster economic growth, wage increases, and job creation� That is why the Administration prioritized MAGAnomics policies to kick-start economic growth and job creation through reforming the tax code; fix-ing the regulatory structure; reducing bur-densome federal health care mandates and opening up affordable coverage options; ensur-ing free, fair, and reciprocal trade; and imple-menting fiscal discipline through spending re-straint� Americans have already experienced many benefits of MAGAnomics, including: 3�2 million jobs created since the President was sworn in, unemployment falling to 4 percent, job openings hitting a record high, and in-creased consumer and business confidence�
One of the President’s immediate and high-est priorities upon entering office was fixing the outdated tax structure that had not been reformed in more than 30 years� The outdated structure was driving companies overseas, preventing small businesses from expand-ing, and discouraging additional investment in the United States� President Trump and the Administration worked hand-in-hand with Congress to enact the historic Tax Cuts and Jobs Act (TCJA)� Throughout the nego-tiations on the TCJA, the Administration fo-cused on how to help middle-class families and distressed communities, as well as make the U�S� more competitive to attract needed capital investment for small businesses� The TCJA lowered taxes for families, doubled the child tax credit and the standard deduction, and expanded the use of 529 plans to include tuition for kindergarten to 12th grade at pub-lic, private, or religious schools� A study by the Council of Economic Advisers found that American households would see their annual income increase by an average of $4,000 due to corporate tax reform alone, once the adjust-ment to that reform had run its course� The TCJA also created Opportunity Zones to en-courage private investment in distressed com-munities� Opportunity Zones are a way to en-sure that economic growth is experienced even in distressed communities�
Since the passage of the TCJA in December, the American economy has been revitalized� More than six million American workers have benefitted by receiving higher wages, bonuses, or increased retirement contributions from the companies they work for, and companies have also announced additional capital investment of more $217 billion� The Labor Department reported that the U�S� had 6�7 million job open-ings compared with 6�3 million Americans who were unemployed, so that March, April, and May were the first months in which job openings exceeded the number of jobless Americans� Additionally, companies repatri-ated more than $300 billion back to the United States in the first quarter of fiscal year 2018, setting a new record�
The American economy is growing at a rate above predictions, and the unemployment rate fell to the lowest level in nearly 50 years� At the beginning of the Trump Administration, the Blue Chip consensus forecast of real GDP growth (year-over-year) for 2018 was 2�4 percent; it has now grown to 2�9 percent� Additionally, we continue to see upward revi-sions of private forecasts of economic growth� Consensus forecasts through November 2017 were between 2�3 to 2�4 percent in 2018 and 2�1 percent in 2019� Since November, private forecasts have been revised steadily upward� As of last month, the Blue Chip consensus forecast is now for 2018 growth of 2�8 percent, and 2019 growth of 2�3 percent, upward revi-sions of 0�5 and 0�2 percentage points respec-tively since the passage of TCJA�
Official forecasts revisions suggest an even bigger bump� The CBO projected growth of 2�0 and 1�5 percent in 2018 and 2019� That has now been revised substantially—up to 3�3 and 2�4 percent, respectively, following implemen-tation of the TCJA� Meanwhile, last summer, before the tax debate got seriously underway, the FOMC median forecast was for growth of just 2�1 and 1�9 percent in 2018 and 2019� That has since been revised up by 0�6 and 0�5 per-centage points, respectively, with most of the upward revision occurring in December, as the tax bill made it over the legislative finish line�
2 MID-SESSION REVIEW
In April, the IMF released its April 2018 World Economic Outlook (WEO)� Global growth for 2018 was revised up 0�2 percent-age points from its October WEO release to 3�9 percent year-over-year� The IMF attributes roughly half of the global growth revision to changes in U�S� fiscal policy� When honing in on the United States, the IMF’s April 2018 update to its October 2017 World Economic Outlook revised up its growth forecast by 0�6 percent-age points from October to 2�9 percent year-over-year� The IMF’s April upwards revision to its October global growth forecast in the wake of the passage of the TCJA follows the OECD’s own March upwards revision to its November global growth forecast� For the U�S�, its 2018 outlook increased by 0�4 percentage points to 2�9 percent and its 2019 outlook increased by 0�7 percentage points to 2�8 percent�
The Trump Administration has also focused on liberating small businesses from regula-tory red tape created under eight years of the Obama Administration� While small businesses were concerned about taxes and regulations un-der the Obama Administration, their concerns have noticeably diminished after the Trump Administration prioritized regulatory reform�
An important development in this effort oc-curred just days after his inauguration when, on January 30, 2017, President Trump issued Executive Order 13771: “Reducing Regulation and Controlling Regulatory Costs�” Among oth-er things, this executive order requires that, whenever a Federal department or agency is-sues a new regulatory action, it must identify at least two deregulatory actions�
Last year, the Administration greatly exceed-ed this goal as agencies issued 67 deregulatory actions while only imposing 3 new actions, re-sulting in a 22:1 deregulatory ratio� In fact in 2017, 1,579 regulatory actions were withdrawn or removed from active status, which included a 40 percent drop in economically significant regulations, and 35 percent drop in other sig-nificant regulations relative to 2009�
Furthermore, President Trump has imple-mented a renewed focus on cost-benefit anal-ysis and transparency in the United States regulatory agenda�
For 2017, the heads of agencies had to en-sure that the total incremental cost of all new
regulations, including repealed regulations, was no greater than zero, unless otherwise re-quired by law� This new directive proved to be immediately successful�
In 2017, federal agencies achieved $8�1 bil-lion in the present value of net regulatory cost savings, the equivalent of $570 million per year� These savings go beyond the Administration’s goal of imposing zero regulatory costs in 2017� In contrast, the previous administration im-posed between $5�7 billion and $15�2 billion in annualized regulatory costs in just its final eight months in office�
The Trump Administration will continue to place emphasis on reducing unnecessary, duplicative, and burdensome regulations� In calendar year 2018, federal agencies are com-mitted to achieving $9�8 billion in net savings in present value terms, or $690 million per year� In addition, agencies projected they will continue to drive the deregulatory effort by is-suing three deregulatory actions for each new regulatory action�
The Trump Administration is proud of the work we have done as we continue to cut red tape for American businesses, drastically improve our economy, and provide a more free society� Moreover, President Trump has worked to protect Americans by relieving the suffocat-ing restraints of unfair foreign trade practices that have long been ignored by Congress� The United States is a generally open economy, compared with the rest of the world� For ex-ample, China’s tariff on imported flat screen TVs is 30 percent and the European Union’s 14 percent, while the U�S� only charges 3�9 percent on its imports� The U�S� tariff on wild rice is 1�1 percent, compared with China’s and India’s, at 65 percent and 70 percent, respec-tively�
Much like draining the swamp that is Washington, D�C�, the President has been driv-ing to change the behavior of trading partners around the world acting in bad faith by using existing U�S� trade laws to thwart unfair trade practices and improving deals that simply do not work for America� The President’s objec-tive of shifting the world economy to a new equilibrium, one with more reciprocity in trade agreements and reductions in global barriers, would deliver a substantial boost to U�S� and world growth�
3SUMMARy
During his first days in office, President Trump announced that the United States would withdraw from the Trans-Pacific Partnership� Further, the Administration is working to address China’s unfair trade and intellectual property policies through a range of actions� In addition, the Trump Administration secured amendments to the KORUS trade agreement with South Korea, including provisions to increase American au-tomobile exports� The Trump Administration also conducted 82 antidumping and coun-tervailing duty investigations in 2017, a 58 percent increase in investigations over 2016� President Trump will continue work to ensure that there is free, fair, and reciprocal trade�
While focusing on the economic health of the Nation, the Trump Administration contin-ues to work toward getting the Nation’s fiscal house in order� The Administration inherited a tremendous debt and deficit problem, in-cluding an increase in the debt of more than $9 trillion over the eight years of the Obama Administration, which was clearly on an un-sustainable path� The President’s budgets have made difficult choices in order to rein in spending, lower the growth of the national debt, and focus Government on its most impor-tant job: protecting the Nation�
The President supported Congressional ef-forts to replace Obamacare and his most re-cent Budget would save nearly $700 billion by replacing Obamacare with legislation mod-eled closely after the Graham-Cassidy-Heller-Johnson (GCHJ) bill� Additional reforms with-in the 2019 budget would help set Government healthcare spending on a sustainable fiscal path that leads to a bigger bang for the buck� Addressing Obamacare would have also re-duced regulatory burdens for small business-es, some of whom stayed below 50 full-time workers to avoid penalties while shifting full-time workers to part-time status� In the TCJA, Congress repealed the Obamacare individual mandate, eliminating the tax penalty for Americans who decided not to buy coverage� The Administration will continue to work with Congress to provide relief from Obamacare’s mandates and increase more affordable and flexible coverage options�
The Mid-Session Review (MSR) provides updated estimates for changes that have oc-curred since the President’s budget was re-
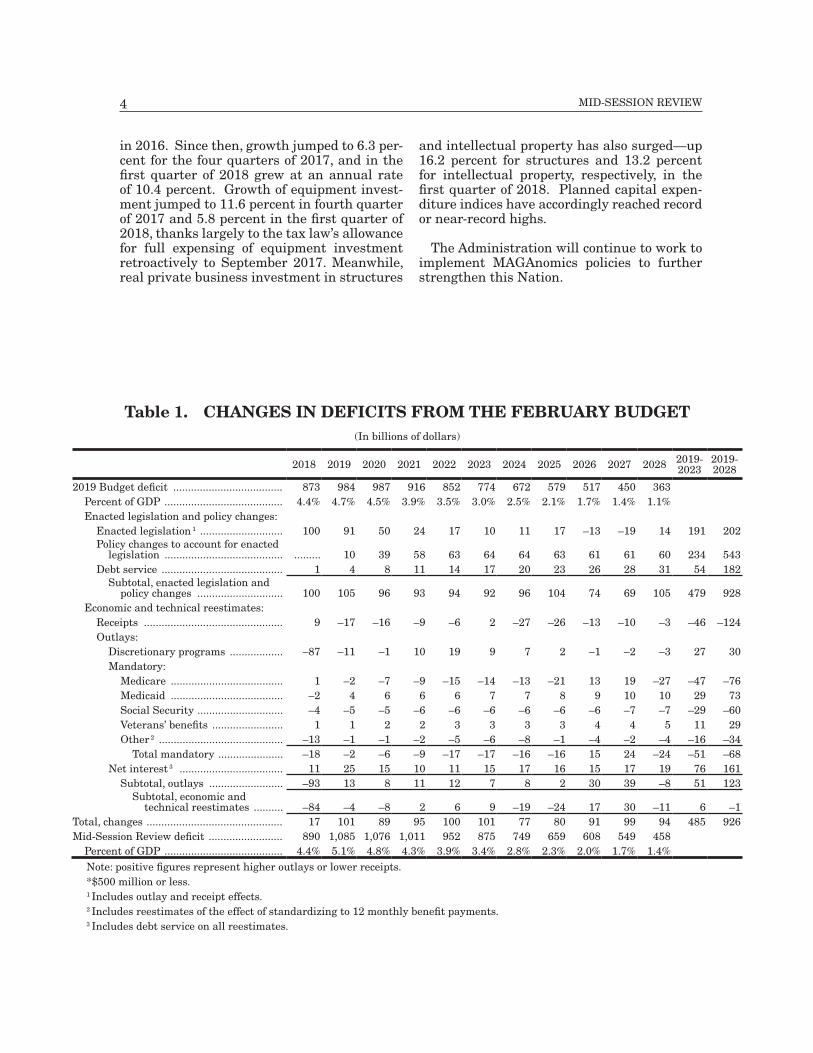
leased in February� The 2019 deficit has been revised to $1�1 trillion� The increases in the deficit compared with the Budget are almost entirely related to increases in spending from the Bipartisan Budget Act of 2018 and the subsequent Consolidated Appropriations Act, 2018 (Omnibus)� The President signed the Omnibus to secure a historic and much-needed funding increase for our military, but he does not support its unnecessary increases to non-defense spending� The MSR incorporates the President’s proposal to constrain non-defense discretionary spending going forward, saving nearly $900 billion compared with current law�
Despite the increases from enacted legis-lation, under the President’s policies to cut spending and grow the economy, the deficit will fall from 4�4 percent of GDP in 2018 to 1�4 percent of GDP in 2028� The Administration will continue to work with Congress to enact fiscal discipline through spending restraint�
President Trump’s policies are fostering a growing economy� Since taking office, this President promised to deliver on job creation and economic growth� While some experts have had a pessimistic view of the American econo-my, we believe that these estimates continue to underestimate hard-working Americans and the true potential of the American spirit� Such pessimism may have been fueled by the historically weak economic recovery under the Obama Administration since the 2008-2009 economic downturn� From 2010 through 2016, fourth quarter-over-fourth quarter (Q4/Q4) growth of real GDP averaged only 2�1 per-cent� In 2016, real GDP growth had sunk to an annual rate of only 1�8 percent, and labor productivity growth in the nonfarm business sector was 0�0 percent� The beginning of the Trump Administration marked a clear break from this pattern of underperformance� In 2017, real GDP (Q4/Q4) grew at a rate of 2�6 percent, far exceeding the projections of many experts, and labor productivity grew at 1�3 percent� Meanwhile, the unemployment rate has dropped from 4�8 percent in January 2017 to only 4�0 percent in June 2018�
The President’s policies have also resulted in a surge in investment� In the 6�5 years be-tween the start of the recovery in the third quarter of 2009 and 2015, growth in real pri-vate nonresidential fixed investment averaged 4�8 percent, and had slowed to just 0�7 percent
4 MID-SESSION REVIEW
Table 1. CHANGES IN DEFICITS FROM THE FEBRUARY BUDGET(In billions of dollars)
2018 2019 2020 2021 2022 2023 2024 2025 2026 2027 2028 2019-2023
2019-2028
2019 Budget deficit ������������������������������������� 873 984 987 916 852 774 672 579 517 450 363Percent of GDP ���������������������������������������� 4�4% 4�7% 4�5% 3�9% 3�5% 3�0% 2�5% 2�1% 1�7% 1�4% 1�1%Enacted legislation and policy changes:
Enacted legislation 1 ���������������������������� 100 91 50 24 17 10 11 17 –13 –19 14 191 202Policy changes to account for enacted
legislation ���������������������������������������� ��������� 10 39 58 63 64 64 63 61 61 60 234 543Debt service ����������������������������������������� 1 4 8 11 14 17 20 23 26 28 31 54 182
Subtotal, enacted legislation and policy changes ����������������������������� 100 105 96 93 94 92 96 104 74 69 105 479 928
Economic and technical reestimates:Receipts ����������������������������������������������� 9 –17 –16 –9 –6 2 –27 –26 –13 –10 –3 –46 –124Outlays:
Discretionary programs ������������������ –87 –11 –1 10 19 9 7 2 –1 –2 –3 27 30Mandatory:
Medicare �������������������������������������� 1 –2 –7 –9 –15 –14 –13 –21 13 19 –27 –47 –76Medicaid �������������������������������������� –2 4 6 6 6 7 7 8 9 10 10 29 73Social Security ����������������������������� –4 –5 –5 –6 –6 –6 –6 –6 –6 –7 –7 –29 –60Veterans’ benefits ������������������������ 1 1 2 2 3 3 3 3 4 4 5 11 29Other 2 ������������������������������������������ –13 –1 –1 –2 –5 –6 –8 –1 –4 –2 –4 –16 –34
Total mandatory ���������������������� –18 –2 –6 –9 –17 –17 –16 –16 15 24 –24 –51 –68Net interest 3 ����������������������������������� 11 25 15 10 11 15 17 16 15 17 19 76 161
Subtotal, outlays ������������������������� –93 13 8 11 12 7 8 2 30 39 –8 51 123Subtotal, economic and
technical reestimates ���������� –84 –4 –8 2 6 9 –19 –24 17 30 –11 6 –1Total, changes ���������������������������������������������� 17 101 89 95 100 101 77 80 91 99 94 485 926Mid-Session Review deficit ������������������������� 890 1,085 1,076 1,011 952 875 749 659 608 549 458
Percent of GDP ���������������������������������������� 4�4% 5�1% 4�8% 4�3% 3�9% 3�4% 2�8% 2�3% 2�0% 1�7% 1�4%Note: positive figures represent higher outlays or lower receipts�*$500 million or less�1 Includes outlay and receipt effects�2 Includes reestimates of the effect of standardizing to 12 monthly benefit payments�3 Includes debt service on all reestimates�
in 2016� Since then, growth jumped to 6�3 per-cent for the four quarters of 2017, and in the first quarter of 2018 grew at an annual rate of 10�4 percent� Growth of equipment invest-ment jumped to 11�6 percent in fourth quarter of 2017 and 5�8 percent in the first quarter of 2018, thanks largely to the tax law’s allowance for full expensing of equipment investment retroactively to September 2017� Meanwhile, real private business investment in structures
and intellectual property has also surged—up 16�2 percent for structures and 13�2 percent for intellectual property, respectively, in the first quarter of 2018� Planned capital expen-diture indices have accordingly reached record or near-record highs�
The Administration will continue to work to implement MAGAnomics policies to further strengthen this Nation�
5
ECONOMIC ASSUMPTIONSThis Mid-Session Review (MSR) updates
the economic forecast from the 2019 Budget, which was finalized in November 2017 and re-leased with the Budget in February 2018� The Budget projected real Gross Domestic Product (GDP) growth averaging 3�0 percent during the 11-year forecast interval� A substantial increase in real GDP was projected for 2018� After that, real GDP growth was projected to increase through 2019, decrease to 3�0 percent for 2021 through 2024, and decline to 2�8 per-cent for 2026 through 2028� The unemploy-ment rate was expected to continue to decline in the near term and then to slowly rise to the Administration’s estimate of its long-run equi-librium� Inflation was expected to rise in 2019 to a rate more consistent with Federal Reserve targets, and interest rates were expected to rise appreciably in the near term and then settle at a rate roughly consistent with rates implied by the term structure of current rates� The MSR forecast, completed in early June, maintains this overall outlook with modifica-tions to account for recent data� Most notably, the anticipated increases in interest rates and inflation have occurred more quickly than ex-pected� Other than revisions to the interest rate and inflation forecasts in the near term, however, the MSR economic trajectory is simi-lar to the 2019 Budget forecast�
The economic recovery following the 2008-2009 downturn was unusually slow relative to other postwar recoveries� Recently, eco-nomic growth has generally been modest, with real GDP growing at only 1�8 percent during the four quarters of 2016� Since this Administration took office, growth has in-creased considerably� In contrast to its lack-luster performance in 2016, real GDP grew at 2�6 percent over the four quarters of 2017, slightly exceeding this Administration’s 2018 Budget forecast of 2�5 percent� Meanwhile,
the labor market in 2018 has been remarkably strong, with payroll employment posting ro-bust and sustained growth and unemployment rates falling to historic lows� By June, the un-employment rate stood at 4�0 percent and the economy had added over 3�2 million nonfarm jobs since the President took office�
The Administration’s efforts to increase eco-nomic growth led to the passage of the Tax Cuts and Jobs Act in December 2017� In addi-tion, many burdensome and unnecessary regu-lations were removed under Executive Orders 13771 and 13777, and the Administration will continue to target and eliminate unnecessary regulations going forward� The Administration is also currently pursuing policies that would establish paid family leave for new parents, spur investments in infrastructure, encour-age domestic energy production, negotiate fair trade agreements, and reduce Federal budget deficits� These policies should bolster econom-ic growth in both the short and long run�
Growth and unemployment are roughly on track with the projections in the Budget� While growth slowed down somewhat in the first quarter of 2018, this follows an observed seasonal pattern of slower growth in the first quarter in recent years� The MSR forecasts a rebound in real GDP growth in subsequent quarters, and maintains the same yearly growth rates as were projected in the Budget� Since the economic forecast for the Budget was finalized in November 2017, interest rates and inflation have been higher than expected� Relative to the Budget forecast, the MSR fore-cast includes a substantial increase in interest rates in the near term, which narrows down to only a slight increase in the long run� Inflation rates are forecasted to be higher in 2018 and 2019, but the same as those projected in the Budget in the medium term and long run�
ECONOMIC PROJECTIONS
The Administration’s forecast is based on information available to forecasters at the be-ginning of June, and it retains the assumption
that the President’s policy proposals in the 2019 Budget will be fully enacted� The projec-tions for key variables can be found in Table 2�
6 MID-SESSION REVIEW
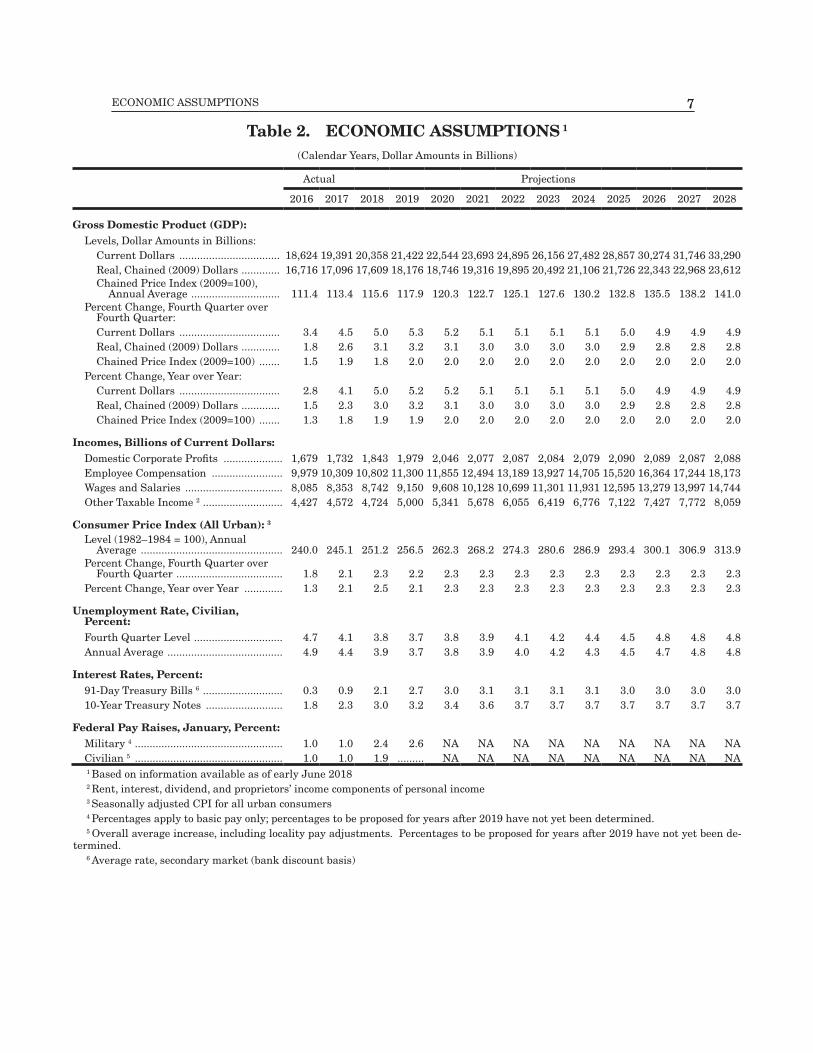
Real Gross Domestic Product: Real GDP growth in 2018 is expected to be 3�1 percent on a fourth quarter-over-fourth quarter (Q4/Q4) basis, with growth increasing slightly to 3�2 percent in 2019 before edging down to 2�8 percent in the long run� Both year-over-year and Q4/Q4 growth rates are identical to those in the Budget for every year in the forecast�
Unemployment Rate: The unemployment rate has remained consistent with the 2019 Budget projections, falling to 4�1 percent in the fourth quarter of 2017 and continuing to decline thus far in 2018� The unemployment rate is expected to average 3�8 percent in 2018 and 3�7 in 2019, and then slowly climb back towards 4�8 percent in 2027, which is the Administration’s estimate of the rate of unem-ployment consistent with stable inflation in the long run�
Inflation: Post-financial crisis, the infla-tion rate has been low compared with the post-World War II average� The medium- and long-run inflation rate projections in the MSR remain consistent with the 2019 Budget assumptions, with year-over-year long-run rates of 2�0 percent for the GDP chained price index and 2�3 percent when measured by the Consumer Price Index for All Urban Consumers (CPI-U)� These rates are consis-tent with Federal Reserve inflation targets� Inflation has climbed higher in the near term, however, than was expected when the Budget assumptions were finalized in November 2017� For 2018, projected year-over-year inflation in
the GDP chained price index has been adjust-ed upwards from 1�6 to 1�9 percent and year-over-year CPI-U inflation has been increased from 2�1 to 2�5 percent based on recent data�
Interest Rates: Interest rate forecasts comprise the most substantial change from the 2019 Budget to the MSR� Treasury rates have increased notably since 2016� While the Budget did forecast increases in interest rates in the near term, these increases have been more pronounced than expected during the first half of 2018� Relative to the 2019 Budget, in the MSR the projected average rate for the 91-day Treasury bill has been increased from 1�5 to 2�1 percent in 2018, and 2�3 to 2�7 percent in 2019� Similarly, the annual average yield on 10-year Treasury notes has been increased from 2�6 percent to 3�0 percent in 2018, and 3�1 to 3�2 percent in 2019� After the near term, the revision to the interest rate projections tapers off� For both 91-day Treasury bills and 10-year Treasury notes, the long-run rates have been adjusted only slightly upwards by 0�1 percent-age point from the 2019 Budget to the MSR�
Incomes and Income Shares: Labor com-pensation and corporate profit trends remain roughly the same as in the 2019 Budget pro-jections� As a share of Gross Domestic Income, labor compensation and wages and salaries are expected to increase, while corporate prof-its are expected to decline, with most of this evolution of income shares taking place during the middle and later years of the forecast�
FORECAST COMPARISONS
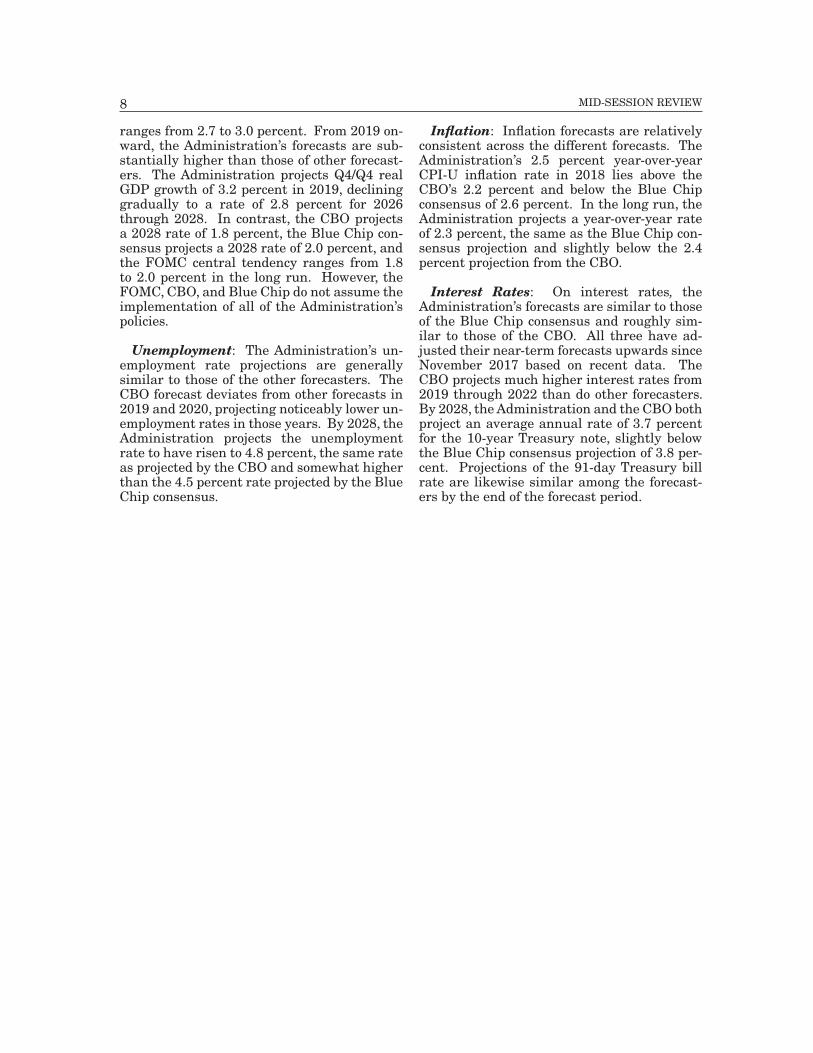
The Administration’s MSR forecast is sim-ilar to those of the Congressional Budget Office (CBO), the Federal Reserve’s Federal Open Market Committee (FOMC), and the Blue Chip panel of private sector forecast-ers for most economic variables, but no-tably higher for real GDP growth� The Administration’s more optimistic forecast for real GDP growth can largely be account-ed for by its expectation of higher productiv-ity growth in the medium to long run, and by the Administration’s assumption that the President’s policy proposals will be enacted� By contrast, the CBO’s forecast assumes roughly current law policies and a more pes-simistic expectation for long-run productivi-ty growth� The Blue Chip consensus reflects
a combination of various unspecified policy assumptions among private sector forecast-ers� A comparison of forecasts for key eco-nomic variables is found in Table 3�
Real Gross Domestic Product: The Administration’s Q4/Q4 forecast for real GDP growth differs from those published by the CBO in April, by the FOMC in June, and by the Blue Chip consensus in March (for the long-run forecast) and July (for the short-run forecast)� The CBO projected the highest 2018 growth rate at 3�3 percent, 0�2 percent-age points higher than the Administration’s projection of 3�1 percent� The Blue Chip con-sensus forecast for the 2018 growth rate is 2�9 percent, and the FOMC central tendency
7ECONOMIC ASSUMPTIONS 7
Table 2. ECONOMIC ASSUMPTIONS 1
(Calendar years, Dollar Amounts in Billions)
Actual Projections
2016 2017 2018 2019 2020 2021 2022 2023 2024 2025 2026 2027 2028
Gross Domestic Product (GDP):Levels, Dollar Amounts in Billions:
Current Dollars ���������������������������������� 18,624 19,391 20,358 21,422 22,544 23,693 24,895 26,156 27,482 28,857 30,274 31,746 33,290Real, Chained (2009) Dollars ������������� 16,716 17,096 17,609 18,176 18,746 19,316 19,895 20,492 21,106 21,726 22,343 22,968 23,612Chained Price Index (2009=100),
Annual Average ������������������������������ 111�4 113�4 115�6 117�9 120�3 122�7 125�1 127�6 130�2 132�8 135�5 138�2 141�0Percent Change, Fourth Quarter over
Fourth Quarter:Current Dollars ���������������������������������� 3�4 4�5 5�0 5�3 5�2 5�1 5�1 5�1 5�1 5�0 4�9 4�9 4�9Real, Chained (2009) Dollars ������������� 1�8 2�6 3�1 3�2 3�1 3�0 3�0 3�0 3�0 2�9 2�8 2�8 2�8Chained Price Index (2009=100) ������� 1�5 1�9 1�8 2�0 2�0 2�0 2�0 2�0 2�0 2�0 2�0 2�0 2�0
Percent Change, year over year:Current Dollars ���������������������������������� 2�8 4�1 5�0 5�2 5�2 5�1 5�1 5�1 5�1 5�0 4�9 4�9 4�9Real, Chained (2009) Dollars ������������� 1�5 2�3 3�0 3�2 3�1 3�0 3�0 3�0 3�0 2�9 2�8 2�8 2�8Chained Price Index (2009=100) ������� 1�3 1�8 1�9 1�9 2�0 2�0 2�0 2�0 2�0 2�0 2�0 2�0 2�0
Incomes, Billions of Current Dollars:Domestic Corporate Profits �������������������� 1,679 1,732 1,843 1,979 2,046 2,077 2,087 2,084 2,079 2,090 2,089 2,087 2,088Employee Compensation ������������������������ 9,979 10,309 10,802 11,300 11,855 12,494 13,189 13,927 14,705 15,520 16,364 17,244 18,173Wages and Salaries ��������������������������������� 8,085 8,353 8,742 9,150 9,608 10,128 10,699 11,301 11,931 12,595 13,279 13,997 14,744Other Taxable Income 2 ��������������������������� 4,427 4,572 4,724 5,000 5,341 5,678 6,055 6,419 6,776 7,122 7,427 7,772 8,059
Consumer Price Index (All Urban): 3
Level (1982–1984 = 100), Annual Average ������������������������������������������������ 240�0 245�1 251�2 256�5 262�3 268�2 274�3 280�6 286�9 293�4 300�1 306�9 313�9
Percent Change, Fourth Quarter over Fourth Quarter ������������������������������������ 1�8 2�1 2�3 2�2 2�3 2�3 2�3 2�3 2�3 2�3 2�3 2�3 2�3
Percent Change, year over year ������������� 1�3 2�1 2�5 2�1 2�3 2�3 2�3 2�3 2�3 2�3 2�3 2�3 2�3
Unemployment Rate, Civilian, Percent:Fourth Quarter Level ������������������������������ 4�7 4�1 3�8 3�7 3�8 3�9 4�1 4�2 4�4 4�5 4�8 4�8 4�8Annual Average ��������������������������������������� 4�9 4�4 3�9 3�7 3�8 3�9 4�0 4�2 4�3 4�5 4�7 4�8 4�8
Interest Rates, Percent:91-Day Treasury Bills 6 ��������������������������� 0�3 0�9 2�1 2�7 3�0 3�1 3�1 3�1 3�1 3�0 3�0 3�0 3�010-year Treasury Notes �������������������������� 1�8 2�3 3�0 3�2 3�4 3�6 3�7 3�7 3�7 3�7 3�7 3�7 3�7
Federal Pay Raises, January, Percent:Military 4 �������������������������������������������������� 1�0 1�0 2�4 2�6 NA NA NA NA NA NA NA NA NACivilian 5 �������������������������������������������������� 1�0 1�0 1�9 ��������� NA NA NA NA NA NA NA NA NA1 Based on information available as of early June 20182 Rent, interest, dividend, and proprietors’ income components of personal income3 Seasonally adjusted CPI for all urban consumers4 Percentages apply to basic pay only; percentages to be proposed for years after 2019 have not yet been determined�5 Overall average increase, including locality pay adjustments� Percentages to be proposed for years after 2019 have not yet been de-
termined�6 Average rate, secondary market (bank discount basis)
8 MID-SESSION REVIEW
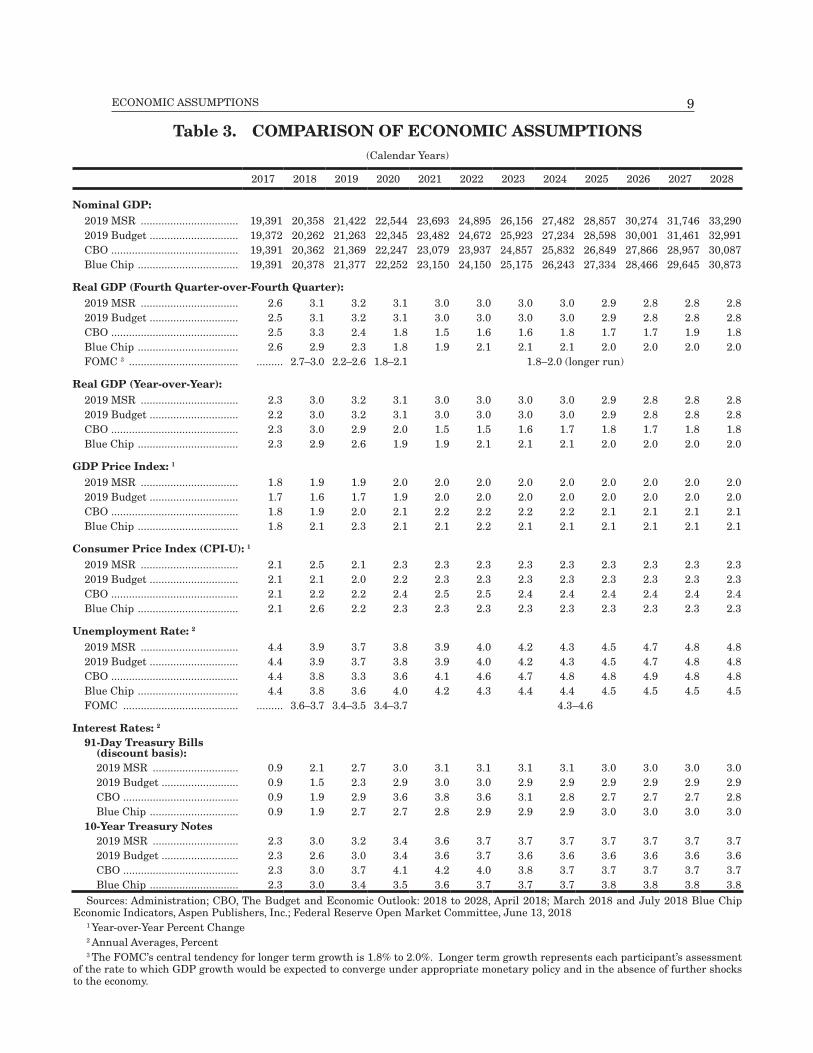
ranges from 2�7 to 3�0 percent� From 2019 on-ward, the Administration’s forecasts are sub-stantially higher than those of other forecast-ers� The Administration projects Q4/Q4 real GDP growth of 3�2 percent in 2019, declining gradually to a rate of 2�8 percent for 2026 through 2028� In contrast, the CBO projects a 2028 rate of 1�8 percent, the Blue Chip con-sensus projects a 2028 rate of 2�0 percent, and the FOMC central tendency ranges from 1�8 to 2�0 percent in the long run� However, the FOMC, CBO, and Blue Chip do not assume the implementation of all of the Administration’s policies�
Unemployment: The Administration’s un-employment rate projections are generally similar to those of the other forecasters� The CBO forecast deviates from other forecasts in 2019 and 2020, projecting noticeably lower un-employment rates in those years� By 2028, the Administration projects the unemployment rate to have risen to 4�8 percent, the same rate as projected by the CBO and somewhat higher than the 4�5 percent rate projected by the Blue Chip consensus�
Inflation: Inflation forecasts are relatively consistent across the different forecasts� The Administration’s 2�5 percent year-over-year CPI-U inflation rate in 2018 lies above the CBO’s 2�2 percent and below the Blue Chip consensus of 2�6 percent� In the long run, the Administration projects a year-over-year rate of 2�3 percent, the same as the Blue Chip con-sensus projection and slightly below the 2�4 percent projection from the CBO�
Interest Rates: On interest rates, the Administration’s forecasts are similar to those of the Blue Chip consensus and roughly sim-ilar to those of the CBO� All three have ad-justed their near-term forecasts upwards since November 2017 based on recent data� The CBO projects much higher interest rates from 2019 through 2022 than do other forecasters� By 2028, the Administration and the CBO both project an average annual rate of 3�7 percent for the 10-year Treasury note, slightly below the Blue Chip consensus projection of 3�8 per-cent� Projections of the 91-day Treasury bill rate are likewise similar among the forecast-ers by the end of the forecast period�
9ECONOMIC ASSUMPTIONS
Table 3. COMPARISON OF ECONOMIC ASSUMPTIONS(Calendar years)
2017 2018 2019 2020 2021 2022 2023 2024 2025 2026 2027 2028
Nominal GDP:2019 MSR ��������������������������������� 19,391 20,358 21,422 22,544 23,693 24,895 26,156 27,482 28,857 30,274 31,746 33,2902019 Budget ������������������������������ 19,372 20,262 21,263 22,345 23,482 24,672 25,923 27,234 28,598 30,001 31,461 32,991CBO ������������������������������������������� 19,391 20,362 21,369 22,247 23,079 23,937 24,857 25,832 26,849 27,866 28,957 30,087Blue Chip ���������������������������������� 19,391 20,378 21,377 22,252 23,150 24,150 25,175 26,243 27,334 28,466 29,645 30,873
Real GDP (Fourth Quarter-over-Fourth Quarter):2019 MSR ��������������������������������� 2�6 3�1 3�2 3�1 3�0 3�0 3�0 3�0 2�9 2�8 2�8 2�82019 Budget ������������������������������ 2�5 3�1 3�2 3�1 3�0 3�0 3�0 3�0 2�9 2�8 2�8 2�8CBO ������������������������������������������� 2�5 3�3 2�4 1�8 1�5 1�6 1�6 1�8 1�7 1�7 1�9 1�8Blue Chip ���������������������������������� 2�6 2�9 2�3 1�8 1�9 2�1 2�1 2�1 2�0 2�0 2�0 2�0FOMC 3 ������������������������������������� ��������� 2�7–3�0 2�2–2�6 1�8–2�1 1�8–2�0 (longer run)
Real GDP (Year-over-Year):2019 MSR ��������������������������������� 2�3 3�0 3�2 3�1 3�0 3�0 3�0 3�0 2�9 2�8 2�8 2�82019 Budget ������������������������������ 2�2 3�0 3�2 3�1 3�0 3�0 3�0 3�0 2�9 2�8 2�8 2�8CBO ������������������������������������������� 2�3 3�0 2�9 2�0 1�5 1�5 1�6 1�7 1�8 1�7 1�8 1�8Blue Chip ���������������������������������� 2�3 2�9 2�6 1�9 1�9 2�1 2�1 2�1 2�0 2�0 2�0 2�0
GDP Price Index: 1
2019 MSR ��������������������������������� 1�8 1�9 1�9 2�0 2�0 2�0 2�0 2�0 2�0 2�0 2�0 2�02019 Budget ������������������������������ 1�7 1�6 1�7 1�9 2�0 2�0 2�0 2�0 2�0 2�0 2�0 2�0CBO ������������������������������������������� 1�8 1�9 2�0 2�1 2�2 2�2 2�2 2�2 2�1 2�1 2�1 2�1Blue Chip ���������������������������������� 1�8 2�1 2�3 2�1 2�1 2�2 2�1 2�1 2�1 2�1 2�1 2�1
Consumer Price Index (CPI-U): 1
2019 MSR ��������������������������������� 2�1 2�5 2�1 2�3 2�3 2�3 2�3 2�3 2�3 2�3 2�3 2�32019 Budget ������������������������������ 2�1 2�1 2�0 2�2 2�3 2�3 2�3 2�3 2�3 2�3 2�3 2�3CBO ������������������������������������������� 2�1 2�2 2�2 2�4 2�5 2�5 2�4 2�4 2�4 2�4 2�4 2�4Blue Chip ���������������������������������� 2�1 2�6 2�2 2�3 2�3 2�3 2�3 2�3 2�3 2�3 2�3 2�3
Unemployment Rate: 2
2019 MSR ��������������������������������� 4�4 3�9 3�7 3�8 3�9 4�0 4�2 4�3 4�5 4�7 4�8 4�82019 Budget ������������������������������ 4�4 3�9 3�7 3�8 3�9 4�0 4�2 4�3 4�5 4�7 4�8 4�8CBO ������������������������������������������� 4�4 3�8 3�3 3�6 4�1 4�6 4�7 4�8 4�8 4�9 4�8 4�8Blue Chip ���������������������������������� 4�4 3�8 3�6 4�0 4�2 4�3 4�4 4�4 4�5 4�5 4�5 4�5FOMC ��������������������������������������� ��������� 3�6–3�7 3�4–3�5 3�4–3�7 4�3–4�6
Interest Rates: 2
91-Day Treasury Bills (discount basis):2019 MSR ����������������������������� 0�9 2�1 2�7 3�0 3�1 3�1 3�1 3�1 3�0 3�0 3�0 3�02019 Budget �������������������������� 0�9 1�5 2�3 2�9 3�0 3�0 2�9 2�9 2�9 2�9 2�9 2�9CBO ��������������������������������������� 0�9 1�9 2�9 3�6 3�8 3�6 3�1 2�8 2�7 2�7 2�7 2�8Blue Chip ������������������������������ 0�9 1�9 2�7 2�7 2�8 2�9 2�9 2�9 3�0 3�0 3�0 3�0
10-Year Treasury Notes2019 MSR ����������������������������� 2�3 3�0 3�2 3�4 3�6 3�7 3�7 3�7 3�7 3�7 3�7 3�72019 Budget �������������������������� 2�3 2�6 3�0 3�4 3�6 3�7 3�6 3�6 3�6 3�6 3�6 3�6CBO ��������������������������������������� 2�3 3�0 3�7 4�1 4�2 4�0 3�8 3�7 3�7 3�7 3�7 3�7Blue Chip ������������������������������ 2�3 3�0 3�4 3�5 3�6 3�7 3�7 3�7 3�8 3�8 3�8 3�8
Sources: Administration; CBO, The Budget and Economic Outlook: 2018 to 2028, April 2018; March 2018 and July 2018 Blue Chip Economic Indicators, Aspen Publishers, Inc�; Federal Reserve Open Market Committee, June 13, 2018
1 year-over-year Percent Change2 Annual Averages, Percent3 The FOMC’s central tendency for longer term growth is 1�8% to 2�0%� Longer term growth represents each participant’s assessment
of the rate to which GDP growth would be expected to converge under appropriate monetary policy and in the absence of further shocks to the economy�

11
RECEIPTSThe Mid-Session Review (MSR) estimates
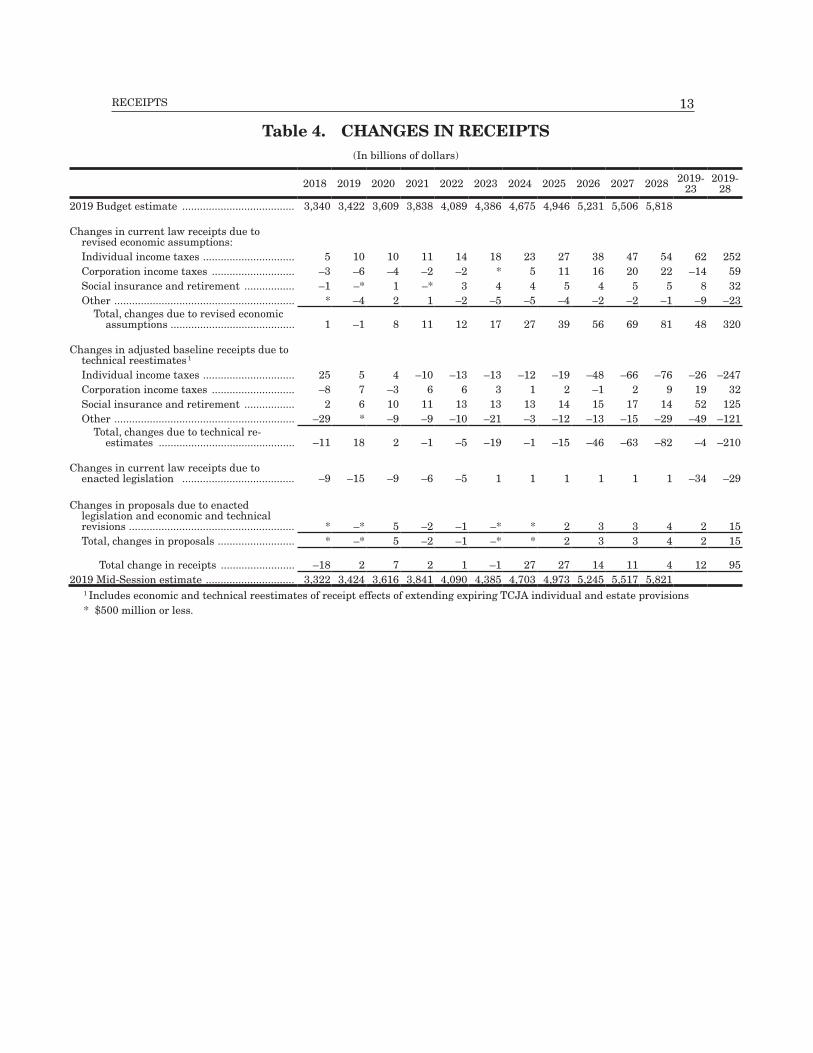
of receipts are below the 2019 Budget esti-mates by $18 billion in 2018 and above those estimates by $2 billion in 2019� The MSR es-timates of receipts are above the Budget es-timates by $7 billion in 2020 and differ from the Budget by $1 billion to $27 billion in each subsequent year, for a net increase in receipts of $95 billion over the 10-year budget window (2019 through 2028)�
A little more than half of the decrease in 2018 receipts is attributable to technical re-visions based on new tax reporting data, col-lections to date, and other information, which decrease receipts by $11 billion� Enacted leg-islation further reduced receipts by $9 billion, while revised economic assumptions increase 2018 receipts by $1 billion�
The estimate of 2019 receipts is above the Budget estimate due to an $18 billion increase in receipts attributable to technical revisions, offset by a $15 billion reduction in receipts due to enacted legislation�
The $95 billion increase in receipts over the 10-year budget horizon is largely the result of a $320 billion gain attributable to revisions in the economic forecast, offset by a reduction in receipts from technical revi-sions in receipts under the Administration’s adjusted baseline that reduce receipts by $210 billion� Enacted legislation further re-duces receipts by $29 billion� Reestimates of the Administration’s proposals increase receipts by $15 billion�
ECONOMIC CHANGES
Revisions in the economic forecast increase receipts by $1 billion in 2018, decrease re-ceipts $1 billion in 2019, and increase receipts by rising amounts in each subsequent year, for a total increase of $320 billion over the 10 years from 2019 through 2028�
In 2018, revisions to the economic forecast have the greatest effect on individual and cor-poration income taxes, increasing individual income taxes by $5 billion and reducing cor-poration income taxes by $3 billion� The in-crease in individual income taxes is primar-ily attributable to increases in the forecast of wages and salaries� Changes in the forecasts of Gross Domestic Product (GDP) and other economic measures that affect the profitabil-ity of corporations are primarily responsible for the reduction in corporation income taxes�
Over the 10-year budget window, revisions in the economic forecast have the greatest ef-fect on individual income taxes, increasing collections by $252 billion� Revisions in the economic forecast increase 10-year collections of corporate income taxes and social insur-ance and retirement receipts by $59 billion and $32 billion, respectively� Increases in the forecasts of taxable corporate income relative to the Budget forecast are primarily due to upward revisions in the forecast of nominal GDP� Increases in the forecast of wages and salaries, which are subject to Social Security and Medicare payroll taxes (the largest com-ponents of social insurance and retirement re-ceipts), account for most of the increase in this source of receipts� Revisions in the forecasts of GDP, interest rates, imports, and other sources of income decrease all remaining sources of re-ceipts by a net $23 billion�
TECHNICAL CHANGES
Technical revisions in the estimates of re-ceipts reduce receipts by $11 billion in 2018 and increase receipts by $18 billion in 2019� Technical revisions reduce or slightly increase receipts in each subsequent year, for a net de-
crease in receipts of $210 billion over the 10 years, 2019 through 2028� The downward technical revisions in 2018 are primarily due to revised estimates of the payment pattern of health insurance provider fees which re-
12 MID-SESSION REVIEW
duced excise taxes by $11 billion� In addition to the excise tax reduction, technical revisions reduced other miscellaneous receipts by $13 billion, offset by an increase of $25 billion for individual income taxes based largely on col-lections experience since the Budget�
Over the 10-year budget window, technical revisions decrease collections of individual income taxes by $247 billion� About three-quarters of this reduction is due to including extension of two provisions affecting pass-through business income in the estimates of
the extension of the Tax Cuts and Jobs Act of 2018 (TCJA) included in the Administration’s adjusted baseline� These provisions were not included in the estimates of the extension of expiring TCJA provision in the 2019 Budget� Technical revisions increase corporation in-come taxes by $32 billion� Technical revisions in all other sources of receipts (social insur-ance and retirement receipts, excise taxes, cus-toms duties, estate and gift taxes, deposits of earnings of the Federal Reserve System, and penalties and fees) result in a net 10-year in-crease in receipts of $4 billion�
ENACTED LEGISLATION AND REVISIONS IN PROPOSALS
The Extension of Continuing Approp-riations Act, 2018, is the largest piece of leg-islation enacted since the Budget that had an effect on receipts, decreasing 10-year col-lections, 2019 through 2028, by $31 billion� These reductions in receipts are largely due to a provision in the Act that delayed the ef-fective date of the excise tax on high cost employer-sponsored health coverage and the suspension of the 2019 annual fee on health in-surance providers� Smaller receipt provisions
in the Bipartisan Budget Act of 2018 and the Consolidated Appropriations Act, 2018, com-bined to increase receipts by $2 billion over the 10-year budget window� Changes in the estimates of receipt proposals increased re-ceipts by $15 billion over the 10-year window� Proposals to repeal and replace Obamacare, provide parental leave benefits, and the reau-thorization the Oil Spill Liability Fund excise tax were the primary drivers of the change in receipt proposals�
13RECEIPTS
Table 4. CHANGES IN RECEIPTS(In billions of dollars)
2018 2019 2020 2021 2022 2023 2024 2025 2026 2027 2028 2019-23
2019-28
2019 Budget estimate �������������������������������������� 3,340 3,422 3,609 3,838 4,089 4,386 4,675 4,946 5,231 5,506 5,818
Changes in current law receipts due to revised economic assumptions:Individual income taxes ������������������������������� 5 10 10 11 14 18 23 27 38 47 54 62 252Corporation income taxes ���������������������������� –3 –6 –4 –2 –2 * 5 11 16 20 22 –14 59Social insurance and retirement ����������������� –1 –* 1 –* 3 4 4 5 4 5 5 8 32Other ������������������������������������������������������������� * –4 2 1 –2 –5 –5 –4 –2 –2 –1 –9 –23
Total, changes due to revised economic assumptions ������������������������������������������ 1 –1 8 11 12 17 27 39 56 69 81 48 320
Changes in adjusted baseline receipts due to technical reestimates 1
Individual income taxes ������������������������������� 25 5 4 –10 –13 –13 –12 –19 –48 –66 –76 –26 –247Corporation income taxes ���������������������������� –8 7 –3 6 6 3 1 2 –1 2 9 19 32Social insurance and retirement ����������������� 2 6 10 11 13 13 13 14 15 17 14 52 125Other ������������������������������������������������������������� –29 * –9 –9 –10 –21 –3 –12 –13 –15 –29 –49 –121
Total, changes due to technical re-estimates ���������������������������������������������� –11 18 2 –1 –5 –19 –1 –15 –46 –63 –82 –4 –210
Changes in current law receipts due to enacted legislation �������������������������������������� –9 –15 –9 –6 –5 1 1 1 1 1 1 –34 –29
Changes in proposals due to enacted legislation and economic and technical revisions �������������������������������������������������������� * –* 5 –2 –1 –* * 2 3 3 4 2 15Total, changes in proposals �������������������������� * –* 5 –2 –1 –* * 2 3 3 4 2 15
Total change in receipts ������������������������� –18 2 7 2 1 –1 27 27 14 11 4 12 952019 Mid-Session estimate ������������������������������ 3,322 3,424 3,616 3,841 4,090 4,385 4,703 4,973 5,245 5,517 5,821
1 Includes economic and technical reestimates of receipt effects of extending expiring TCJA individual and estate provisions* $500 million or less�

15
EXPENDITURESOutlays for 2018 in the Mid-Session Review
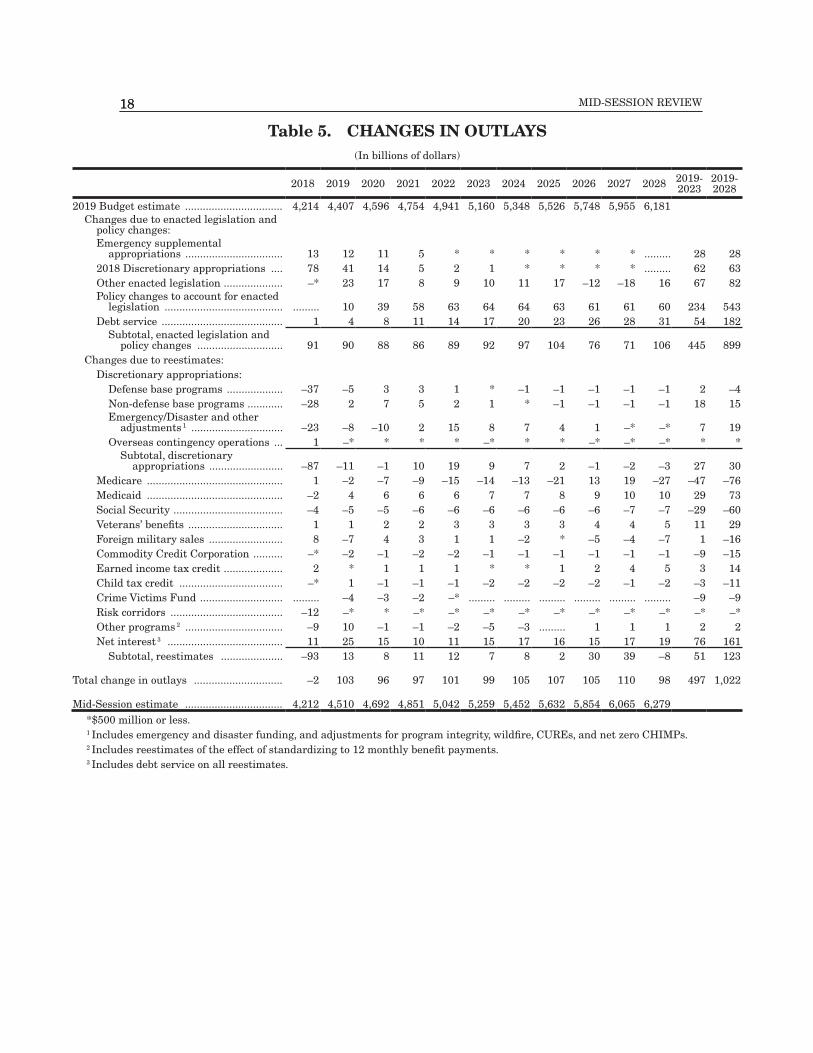
(MSR) are estimated to be $4,212 billion, $2 billion lower than the 2019 Budget estimate� After the current year, outlays increase rela-tive to the 2019 Budget by around $100 billion in 2019 and in each year through 2028 for a to-tal increase of $1,022 billion over the 10-year budget horizon� The increase in spending is primarily due to legislation enacted since the Budget was completed, policy changes to ac-count for enacted legislation, and debt service on those changes� In addition, economic and technical reestimates across a large number of discretionary and mandatory programs, as well as net interest, increased outlays over the next 10 years�
Enacted Legislation Changes
Relative to estimates in the Budget, legisla-tion enacted since the Budget was completed increases outlays by $91 billion in 2018 and by $173 billion over the 10-year budget window� Two laws increased discretionary spending: Public Law 115-123, the Bipartisan Budget Act of 2018 (BBA), and Public Law 115-141, the Consolidated Appropriations Act, 2018 (Omnibus)� These two laws increased discre-tionary outlays by $91 billion in 2018, and by an additional $91 billion from 2019 to 2028�
Four laws enacted since the Budget was completed affected mandatory spending: the BBA; the Omnibus; as well as Division B of Public Law 115-120, Extension of Continuing Appropriations Act, 2018; and Public Law 115-182, VA MISSION Act of 2018� Together these laws increase net mandatory spending rela-tive to Budget estimates by $82 billion over the next 10 years�
• The Children’s Health Insurance Program (CHIP) was extended twice since the Budget was completed� Public Law 115-120, the Extension of Continuing Appropriations Act, 2018, enacted in January, but too late to be included in the Budget, extended CHIP through 2023, and the BBA further extended CHIP through 2027� Compared to the 2019
Budget proposal, these two extensions increased net outlays for CHIP, Medicaid, and refundable premium tax credits and cost sharing reductions and increased outlays by a net $50 billion through 2028�
• The BBA additionally increased net mandatory outlays across a number of programs by $5 billion from the Budget in the current year and by $27 bil-lion over the next 10 years� The BBA increased outlays for the Commodity Credit Corporation because of changes to dairy and cotton support and payment limits for disaster assistance� It also in-creased funding for the Health Resources and Services Administration, as well as other divisions within the Department of Health and Human Services, and en-acted Medicare and Medicaid proposals from the 2019 Budget�
• In addition to providing discretionary funding, the Omnibus decreased manda-tory spending in 2018 by $6 billion pri-marily due to a change to Crime Victims Fund spending, but increased spending over the next 10 years by $1 billion rela-tive to the Budget�
• Public Law 115-182, the VA MISSION Act of 2018, increased spending for the Veterans Choice Program by $4�3 billion�
Policy Changes to Account for Enacted Legislation
Outlays increase by $543 billion from 2019 to 2028 due to changes the Administration made in its 2019 Budget request to account for the increased discretionary caps enacted in the Bipartisan Budget Act of 2018� After the Administration finalized the 2019 Budget, the Congress reached an agreement to raise the defense and non-defense discretionary spend-ing caps in 2018 and 2019� The Administration accounted for these increases in the discretion-ary caps in an addendum to the 2019 Budget and a subsequent budget amendment� These changes fully supported the defense cap enact-
16 MID-SESSION REVIEW
ed in the BBA� For non-defense, these adjust-ments provided a higher level for 2019 appro-priations to account for the higher cap level, for additional support for a limited number of Administration priorities, for the shifting of some funding responsibilities from the manda-tory side, and for curtailing the use of budget gimmicks� The 2019 Budget then continued the “two-penny plan” to reduce non-defense discretionary spending by two percent a year in the outyears� While overall these adjust-ments were $57 billion below the non-defense level allowed by the BBA, they appear as an increase in this presentation since it reflects an increase relative to the original Budget lev-els before the BBA�
Estimating Changes
Estimating changes are due to factors other than enacted legislation or changes in policy� These result from changes in economic as-sumptions, discussed earlier in this MSR, and changes in technical factors� Relative to the Budget estimates, economic and technical changes decrease estimated outlays for 2018 by $93 billion, and increase outlays by $123 billion from 2019 through 2028�
Discretionary Programs. Outlays for dis-cretionary programs decrease by $87 billion in 2018, but increase by $30 billion over the next 10 years relative to the Budget as a result of technical revisions� The changes in 2018 re-flect lower outlays compared to the Budget for both defense, $37 billion, and non-defense, $52 billion, discretionary programs, due to slower-than-expected spending patterns and delayed congressional action on appropriations�
Outlays over the 10-year period decrease by $4 billion for defense programs, but increase by $15 billion for non-defense base programs and by an additional $19 billion for changes to emergency and disaster funding, and adjustments for pro-gram integrity and other adjustments�
Medicare. Economic and technical revi-sions increase outlays for Medicare by $1 billion in 2018, and decrease outlays by $76 billion from 2019 to 2028 relative to Budget es-timates� The decrease is primarily due to tech-nical factors that reduce projected Medicare Part A spending, such as a decline in esti-mated enrollment and updated data on utili-
zation (e�g�, hospital discharges, home health utilization, and skilled nursing facility utiliza-tion)� These decreases are partially offset by increases in Medicare Part B due to changes in assumptions about market baskets, Consumer Price Index (CPI) inflation, and productivity growth� Changes in Part B are also due to up-dated information on actual spending, changes to beneficiary enrollment, and other modeling improvements�
Medicaid. Economic and technical revi-sions reduce projected Federal outlays for Medicaid by $2 billion in 2018 relative to the Budget estimates, but increase outlays by $73 billion from 2019 to 2028 due to higher eco-nomic factors including CPI, as well as techni-cal adjustments for updated Federal matching rates and recent State Medicaid expansions�
Social Security. Estimating changes re-duce outlays for the Social Security trust funds by $4 billion in 2018 and by an addi-tional $60 billion over the following 10 years� The reductions are the net effect of decreas-es in both Old Age and Survivors Insurance (OASI) and Disability Insurance (DI) outlays reflecting continuing trends in actual experi-ence through 2017 and the first half of 2018, partially offset by increases due to the higher forecast for the CPI in the MSR, which results in higher cost-of-living adjustments (COLAs) in the early years� The reductions in OASI are primarily due to revised expectations for the ages at which retired workers start receiving benefits� The MSR estimates reflect the con-tinuing shift to a later starting age for retired worker benefits based on experience through calendar year 2017� Decreases in DI are due to re-estimates of the path of projected disabled worker incidence rates reflecting assumed lower levels of disability applications based on emerging experience through June 2018�
Veterans’ Benefits. Estimating changes increase outlays on net for veterans compen-sation and benefits by $1 billion in 2018 and by an additional $29 billion over the next 10 years� The increases are primarily due to technical revisions to workload projections, contract medical exam reimbursement costs, grant rates for original veterans compensation claims, and burial benefits� In addition, higher COLAs in early years further increased outlay estimates�
17ExPENDITURES
Foreign Military Sales. Estimating changes increase outlays by $8 billion in 2018 and decrease outlays by $16 billion from 2019 to 2028; the revisions reflect the latest mili-tary sales volumes and projections based on year-to-date actuals�
Commodity Credit Corporation. Outlays for the Commodity Credit Corporation de-crease by $15 billion from 2019 to 2028 due to revisions for current spending data and higher-than-expected commodity prices, which reduce payments from the Agriculture Loss Coverage program and the Price Loss Coverage program�
Earned Income Tax Credit (EITC). Economic and technical changes increase out-lays for the earned income tax credit by $2 bil-lion in 2018 and by $14 billion over the next 10 years due to higher assumed wage growth over the period, model improvements, and the incorporation of year-to-date actuals�
Child Tax Credit (CTC). Technical changes decrease outlays for the CTC by $11 billion from 2019 to 2028 due to a revi-sion in the estimates of the Budget proposal to require a Social Security Number valid for work in order to claim the CTC and the EITC, to more accurately reflect the impacts of the proposal after the enactment of Public Law 115-97, the Tax Cuts and Jobs Act� In addi-tion, economic and technical revisions, includ-ing higher assumed wage growth over the period, model improvements, and the incor-poration of year-to-date actuals, offset those decreases slightly�
Crime Victims Fund. Outlays for the Crime Victims Fund decrease by $9 billion from 2019 to 2023 relative to the Budget� The decrease reflects a downward technical adjust-ment to spending based on year-to-date outlays� This trend is expected to continue in the near term, with lower spending on crime victims’ programs relative to the Budget estimate�
Risk Corridors. As described in the February 26, 2018 letter from the Director of the Office of Management and Budget to the Congress, subsequent to submission of the 2019 Budget, the Department of Health and Human Services determined that its ac-counting treatment of the Risk Corridors program required adjustments at the con-clusion of the three-year program� The MSR incorporates the accounting changes, and re-flects Risk Corridors “payments out” capped by the amount of “payments in�” These tech-nical changes decrease outlays for the Risk Corridors program by $12 billion in 2018�
Net Interest. Excluding the debt service associated with enacted legislation and policy changes, outlays for net interest are project-ed to increase by $11 billion in 2018 and by $161 billion over the next 10 years� The ma-jority of the increase is the result of revised economic assumptions, including higher pro-jections for Treasury interest rates and higher growth in the CPI� Technical revisions are primarily due to updating for year-to-date ac-tuals�
18 MID-SESSION REVIEW18
Table 5. CHANGES IN OUTLAYS(In billions of dollars)
2018 2019 2020 2021 2022 2023 2024 2025 2026 2027 2028 2019-2023
2019-2028
2019 Budget estimate ��������������������������������� 4,214 4,407 4,596 4,754 4,941 5,160 5,348 5,526 5,748 5,955 6,181Changes due to enacted legislation and
policy changes:Emergency supplemental
appropriations ��������������������������������� 13 12 11 5 * * * * * * ��������� 28 282018 Discretionary appropriations ���� 78 41 14 5 2 1 * * * * ��������� 62 63Other enacted legislation �������������������� –* 23 17 8 9 10 11 17 –12 –18 16 67 82Policy changes to account for enacted
legislation ���������������������������������������� ��������� 10 39 58 63 64 64 63 61 61 60 234 543Debt service ����������������������������������������� 1 4 8 11 14 17 20 23 26 28 31 54 182
Subtotal, enacted legislation and policy changes ����������������������������� 91 90 88 86 89 92 97 104 76 71 106 445 899
Changes due to reestimates:Discretionary appropriations:
Defense base programs ������������������� –37 –5 3 3 1 * –1 –1 –1 –1 –1 2 –4Non-defense base programs ������������ –28 2 7 5 2 1 * –1 –1 –1 –1 18 15Emergency/Disaster and other
adjustments 1 ������������������������������� –23 –8 –10 2 15 8 7 4 1 –* –* 7 19Overseas contingency operations ��� 1 –* * * * –* * * –* –* –* * *
Subtotal, discretionary appropriations ������������������������� –87 –11 –1 10 19 9 7 2 –1 –2 –3 27 30
Medicare ���������������������������������������������� 1 –2 –7 –9 –15 –14 –13 –21 13 19 –27 –47 –76Medicaid ���������������������������������������������� –2 4 6 6 6 7 7 8 9 10 10 29 73Social Security ������������������������������������� –4 –5 –5 –6 –6 –6 –6 –6 –6 –7 –7 –29 –60Veterans’ benefits �������������������������������� 1 1 2 2 3 3 3 3 4 4 5 11 29Foreign military sales ������������������������� 8 –7 4 3 1 1 –2 * –5 –4 –7 1 –16Commodity Credit Corporation ���������� –* –2 –1 –2 –2 –1 –1 –1 –1 –1 –1 –9 –15Earned income tax credit �������������������� 2 * 1 1 1 * * 1 2 4 5 3 14Child tax credit ����������������������������������� –* 1 –1 –1 –1 –2 –2 –2 –2 –1 –2 –3 –11Crime Victims Fund ���������������������������� ��������� –4 –3 –2 –* ��������� ��������� ��������� ��������� ��������� ��������� –9 –9Risk corridors �������������������������������������� –12 –* * –* –* –* –* –* –* –* –* –* –*Other programs 2 ��������������������������������� –9 10 –1 –1 –2 –5 –3 ��������� 1 1 1 2 2Net interest 3 ��������������������������������������� 11 25 15 10 11 15 17 16 15 17 19 76 161
Subtotal, reestimates ��������������������� –93 13 8 11 12 7 8 2 30 39 –8 51 123
Total change in outlays ������������������������������ –2 103 96 97 101 99 105 107 105 110 98 497 1,022
Mid-Session estimate ��������������������������������� 4,212 4,510 4,692 4,851 5,042 5,259 5,452 5,632 5,854 6,065 6,279*$500 million or less�1 Includes emergency and disaster funding, and adjustments for program integrity, wildfire, CUREs, and net zero CHIMPs�2 Includes reestimates of the effect of standardizing to 12 monthly benefit payments�3 Includes debt service on all reestimates�
19
SUMMARY TABLES

21S
UM
MA
Ry
TA
BL
ES
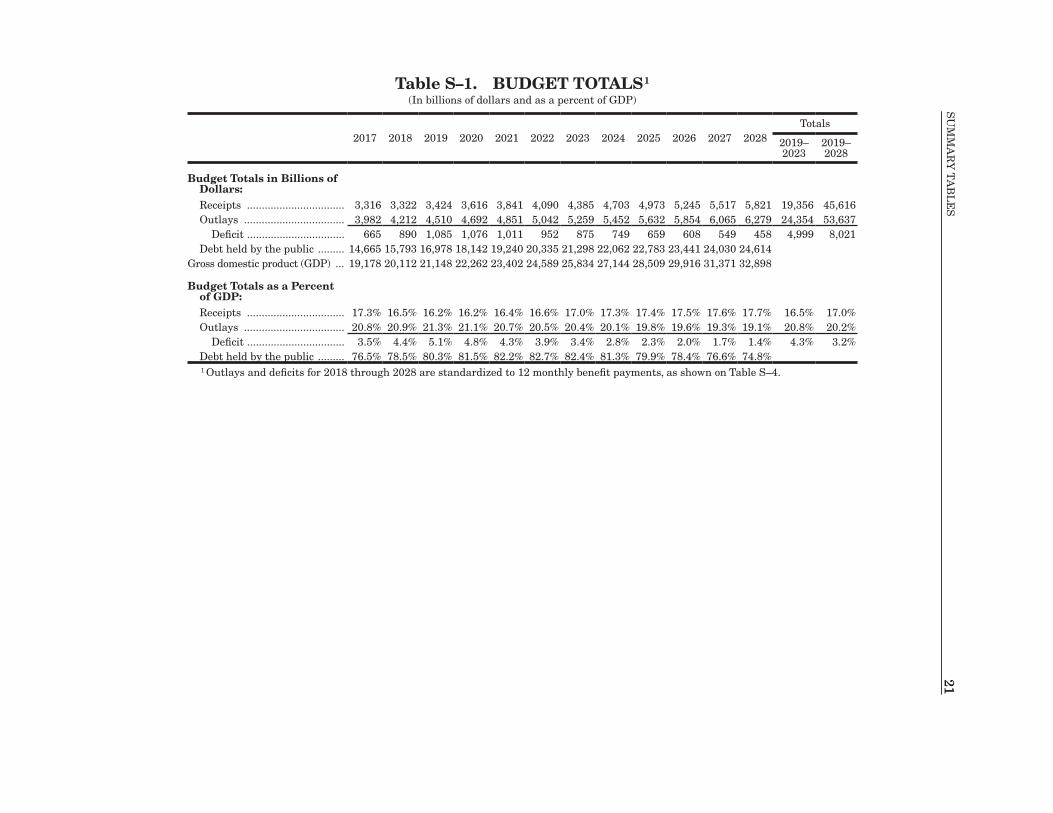
21Table S–1. BUDGET TOTALS 1
(In billions of dollars and as a percent of GDP)
2017 2018 2019 2020 2021 2022 2023 2024 2025 2026 2027 2028Totals
2019–2023
2019–2028
Budget Totals in Billions of Dollars:Receipts ��������������������������������� 3,316 3,322 3,424 3,616 3,841 4,090 4,385 4,703 4,973 5,245 5,517 5,821 19,356 45,616Outlays ���������������������������������� 3,982 4,212 4,510 4,692 4,851 5,042 5,259 5,452 5,632 5,854 6,065 6,279 24,354 53,637
Deficit ��������������������������������� 665 890 1,085 1,076 1,011 952 875 749 659 608 549 458 4,999 8,021Debt held by the public ��������� 14,665 15,793 16,978 18,142 19,240 20,335 21,298 22,062 22,783 23,441 24,030 24,614
Gross domestic product (GDP) ��� 19,178 20,112 21,148 22,262 23,402 24,589 25,834 27,144 28,509 29,916 31,371 32,898
Budget Totals as a Percent of GDP:Receipts ��������������������������������� 17�3% 16�5% 16�2% 16�2% 16�4% 16�6% 17�0% 17�3% 17�4% 17�5% 17�6% 17�7% 16�5% 17�0%Outlays ���������������������������������� 20�8% 20�9% 21�3% 21�1% 20�7% 20�5% 20�4% 20�1% 19�8% 19�6% 19�3% 19�1% 20�8% 20�2%
Deficit ��������������������������������� 3�5% 4�4% 5�1% 4�8% 4�3% 3�9% 3�4% 2�8% 2�3% 2�0% 1�7% 1�4% 4�3% 3�2%Debt held by the public ��������� 76�5% 78�5% 80�3% 81�5% 82�2% 82�7% 82�4% 81�3% 79�9% 78�4% 76�6% 74�8%1 Outlays and deficits for 2018 through 2028 are standardized to 12 monthly benefit payments, as shown on Table S–4�
22M
ID-S
ES
SIO
N R
EV
IEW
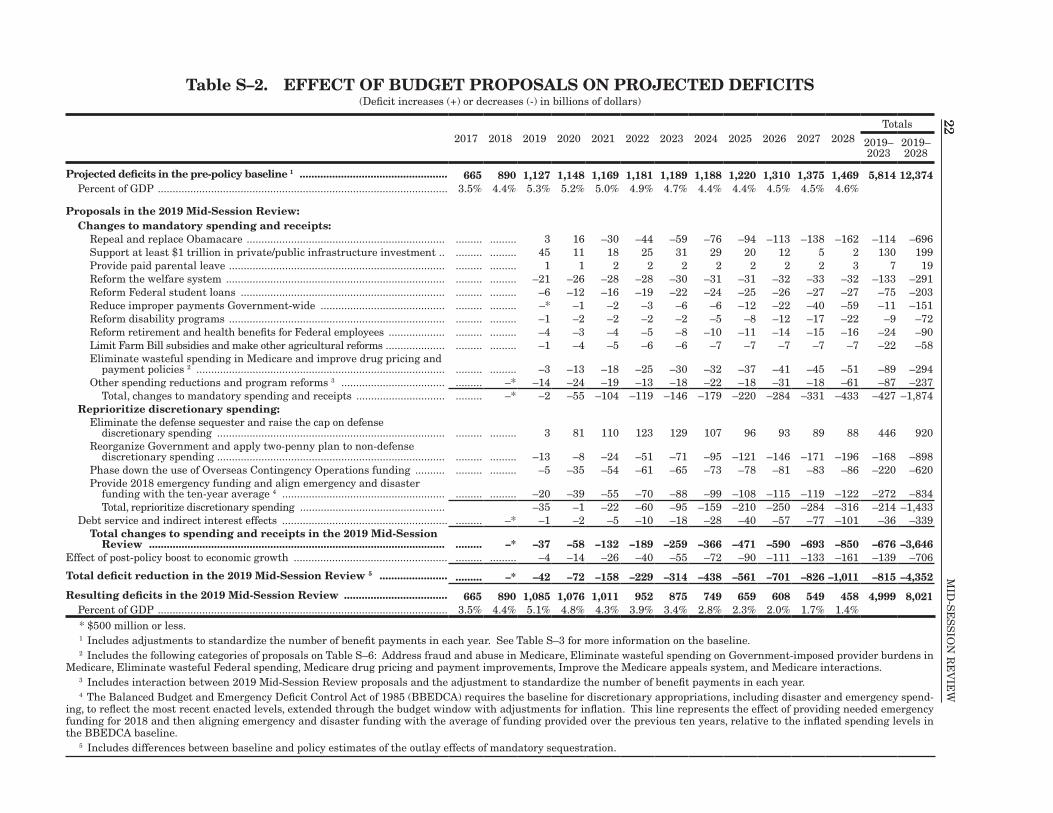
22Table S–2. EFFECT OF BUDGET PROPOSALS ON PROJECTED DEFICITS
(Deficit increases (+) or decreases (-) in billions of dollars)
2017 2018 2019 2020 2021 2022 2023 2024 2025 2026 2027 2028Totals
2019–2023
2019–2028
Projected deficits in the pre-policy baseline 1 .................................................. 665 890 1,127 1,148 1,169 1,181 1,189 1,188 1,220 1,310 1,375 1,469 5,814 12,374Percent of GDP �������������������������������������������������������������������������������������������������� 3�5% 4�4% 5�3% 5�2% 5�0% 4�9% 4�7% 4�4% 4�4% 4�5% 4�5% 4�6%
Proposals in the 2019 Mid-Session Review:Changes to mandatory spending and receipts:
Repeal and replace Obamacare ������������������������������������������������������������������� ��������� ��������� 3 16 –30 –44 –59 –76 –94 –113 –138 –162 –114 –696Support at least $1 trillion in private/public infrastructure investment �� ��������� ��������� 45 11 18 25 31 29 20 12 5 2 130 199Provide paid parental leave ������������������������������������������������������������������������� ��������� ��������� 1 1 2 2 2 2 2 2 2 3 7 19Reform the welfare system �������������������������������������������������������������������������� ��������� ��������� –21 –26 –28 –28 –30 –31 –31 –32 –33 –32 –133 –291Reform Federal student loans ��������������������������������������������������������������������� ��������� ��������� –6 –12 –16 –19 –22 –24 –25 –26 –27 –27 –75 –203Reduce improper payments Government-wide ������������������������������������������ ��������� ��������� –* –1 –2 –3 –6 –6 –12 –22 –40 –59 –11 –151Reform disability programs ������������������������������������������������������������������������� ��������� ��������� –1 –2 –2 –2 –2 –5 –8 –12 –17 –22 –9 –72Reform retirement and health benefits for Federal employees ������������������� ��������� ��������� –4 –3 –4 –5 –8 –10 –11 –14 –15 –16 –24 –90Limit Farm Bill subsidies and make other agricultural reforms �������������������� ��������� ��������� –1 –4 –5 –6 –6 –7 –7 –7 –7 –7 –22 –58Eliminate wasteful spending in Medicare and improve drug pricing and
payment policies 2 ������������������������������������������������������������������������������������ ��������� ��������� –3 –13 –18 –25 –30 –32 –37 –41 –45 –51 –89 –294Other spending reductions and program reforms 3 ����������������������������������� ��������� –* –14 –24 –19 –13 –18 –22 –18 –31 –18 –61 –87 –237
Total, changes to mandatory spending and receipts ������������������������������ ��������� –* –2 –55 –104 –119 –146 –179 –220 –284 –331 –433 –427 –1,874Reprioritize discretionary spending:
Eliminate the defense sequester and raise the cap on defense discretionary spending ����������������������������������������������������������������������������� ��������� ��������� 3 81 110 123 129 107 96 93 89 88 446 920
Reorganize Government and apply two-penny plan to non-defense discretionary spending ����������������������������������������������������������������������������� ��������� ��������� –13 –8 –24 –51 –71 –95 –121 –146 –171 –196 –168 –898
Phase down the use of Overseas Contingency Operations funding ���������� ��������� ��������� –5 –35 –54 –61 –65 –73 –78 –81 –83 –86 –220 –620Provide 2018 emergency funding and align emergency and disaster
funding with the ten-year average 4 ������������������������������������������������������� ��������� ��������� –20 –39 –55 –70 –88 –99 –108 –115 –119 –122 –272 –834Total, reprioritize discretionary spending ������������������������������������������������� –35 –1 –22 –60 –95 –159 –210 –250 –284 –316 –214 –1,433
Debt service and indirect interest effects �������������������������������������������������������� ��������� –* –1 –2 –5 –10 –18 –28 –40 –57 –77 –101 –36 –339Total changes to spending and receipts in the 2019 Mid-Session
Review .................................................................................................... ......... –* –37 –58 –132 –189 –259 –366 –471 –590 –693 –850 –676 –3,646Effect of post-policy boost to economic growth ���������������������������������������������������� ��������� ��������� –4 –14 –26 –40 –55 –72 –90 –111 –133 –161 –139 –706
Total deficit reduction in the 2019 Mid-Session Review 5 ....................... ......... –* –42 –72 –158 –229 –314 –438 –561 –701 –826 –1,011 –815 –4,352
Resulting deficits in the 2019 Mid-Session Review ................................... 665 890 1,085 1,076 1,011 952 875 749 659 608 549 458 4,999 8,021Percent of GDP �������������������������������������������������������������������������������������������������� 3�5% 4�4% 5�1% 4�8% 4�3% 3�9% 3�4% 2�8% 2�3% 2�0% 1�7% 1�4%* $500 million or less�1 Includes adjustments to standardize the number of benefit payments in each year� See Table S–3 for more information on the baseline�2 Includes the following categories of proposals on Table S–6: Address fraud and abuse in Medicare, Eliminate wasteful spending on Government-imposed provider burdens in
Medicare, Eliminate wasteful Federal spending, Medicare drug pricing and payment improvements, Improve the Medicare appeals system, and Medicare interactions�3 Includes interaction between 2019 Mid-Session Review proposals and the adjustment to standardize the number of benefit payments in each year�4 The Balanced Budget and Emergency Deficit Control Act of 1985 (BBEDCA) requires the baseline for discretionary appropriations, including disaster and emergency spend-
ing, to reflect the most recent enacted levels, extended through the budget window with adjustments for inflation� This line represents the effect of providing needed emergency funding for 2018 and then aligning emergency and disaster funding with the average of funding provided over the previous ten years, relative to the inflated spending levels in the BBEDCA baseline�
5 Includes differences between baseline and policy estimates of the outlay effects of mandatory sequestration�
23S
UM
MA
Ry
TA
BL
ES
23
Table S–2. EFFECT OF BUDGET PROPOSALS ON PROJECTED DEFICITS(Deficit increases (+) or decreases (-) in billions of dollars)
2017 2018 2019 2020 2021 2022 2023 2024 2025 2026 2027 2028Totals
2019–2023
2019–2028
Projected deficits in the pre-policy baseline 1 .................................................. 665 890 1,127 1,148 1,169 1,181 1,189 1,188 1,220 1,310 1,375 1,469 5,814 12,374Percent of GDP �������������������������������������������������������������������������������������������������� 3�5% 4�4% 5�3% 5�2% 5�0% 4�9% 4�7% 4�4% 4�4% 4�5% 4�5% 4�6%
Proposals in the 2019 Mid-Session Review:Changes to mandatory spending and receipts:
Repeal and replace Obamacare ������������������������������������������������������������������� ��������� ��������� 3 16 –30 –44 –59 –76 –94 –113 –138 –162 –114 –696Support at least $1 trillion in private/public infrastructure investment �� ��������� ��������� 45 11 18 25 31 29 20 12 5 2 130 199Provide paid parental leave ������������������������������������������������������������������������� ��������� ��������� 1 1 2 2 2 2 2 2 2 3 7 19Reform the welfare system �������������������������������������������������������������������������� ��������� ��������� –21 –26 –28 –28 –30 –31 –31 –32 –33 –32 –133 –291Reform Federal student loans ��������������������������������������������������������������������� ��������� ��������� –6 –12 –16 –19 –22 –24 –25 –26 –27 –27 –75 –203Reduce improper payments Government-wide ������������������������������������������ ��������� ��������� –* –1 –2 –3 –6 –6 –12 –22 –40 –59 –11 –151Reform disability programs ������������������������������������������������������������������������� ��������� ��������� –1 –2 –2 –2 –2 –5 –8 –12 –17 –22 –9 –72Reform retirement and health benefits for Federal employees ������������������� ��������� ��������� –4 –3 –4 –5 –8 –10 –11 –14 –15 –16 –24 –90Limit Farm Bill subsidies and make other agricultural reforms �������������������� ��������� ��������� –1 –4 –5 –6 –6 –7 –7 –7 –7 –7 –22 –58Eliminate wasteful spending in Medicare and improve drug pricing and
payment policies 2 ������������������������������������������������������������������������������������ ��������� ��������� –3 –13 –18 –25 –30 –32 –37 –41 –45 –51 –89 –294Other spending reductions and program reforms 3 ����������������������������������� ��������� –* –14 –24 –19 –13 –18 –22 –18 –31 –18 –61 –87 –237
Total, changes to mandatory spending and receipts ������������������������������ ��������� –* –2 –55 –104 –119 –146 –179 –220 –284 –331 –433 –427 –1,874Reprioritize discretionary spending:
Eliminate the defense sequester and raise the cap on defense discretionary spending ����������������������������������������������������������������������������� ��������� ��������� 3 81 110 123 129 107 96 93 89 88 446 920
Reorganize Government and apply two-penny plan to non-defense discretionary spending ����������������������������������������������������������������������������� ��������� ��������� –13 –8 –24 –51 –71 –95 –121 –146 –171 –196 –168 –898
Phase down the use of Overseas Contingency Operations funding ���������� ��������� ��������� –5 –35 –54 –61 –65 –73 –78 –81 –83 –86 –220 –620Provide 2018 emergency funding and align emergency and disaster
funding with the ten-year average 4 ������������������������������������������������������� ��������� ��������� –20 –39 –55 –70 –88 –99 –108 –115 –119 –122 –272 –834Total, reprioritize discretionary spending ������������������������������������������������� –35 –1 –22 –60 –95 –159 –210 –250 –284 –316 –214 –1,433
Debt service and indirect interest effects �������������������������������������������������������� ��������� –* –1 –2 –5 –10 –18 –28 –40 –57 –77 –101 –36 –339Total changes to spending and receipts in the 2019 Mid-Session
Review .................................................................................................... ......... –* –37 –58 –132 –189 –259 –366 –471 –590 –693 –850 –676 –3,646Effect of post-policy boost to economic growth ���������������������������������������������������� ��������� ��������� –4 –14 –26 –40 –55 –72 –90 –111 –133 –161 –139 –706
Total deficit reduction in the 2019 Mid-Session Review 5 ....................... ......... –* –42 –72 –158 –229 –314 –438 –561 –701 –826 –1,011 –815 –4,352
Resulting deficits in the 2019 Mid-Session Review ................................... 665 890 1,085 1,076 1,011 952 875 749 659 608 549 458 4,999 8,021Percent of GDP �������������������������������������������������������������������������������������������������� 3�5% 4�4% 5�1% 4�8% 4�3% 3�9% 3�4% 2�8% 2�3% 2�0% 1�7% 1�4%* $500 million or less�1 Includes adjustments to standardize the number of benefit payments in each year� See Table S–3 for more information on the baseline�2 Includes the following categories of proposals on Table S–6: Address fraud and abuse in Medicare, Eliminate wasteful spending on Government-imposed provider burdens in
Medicare, Eliminate wasteful Federal spending, Medicare drug pricing and payment improvements, Improve the Medicare appeals system, and Medicare interactions�3 Includes interaction between 2019 Mid-Session Review proposals and the adjustment to standardize the number of benefit payments in each year�4 The Balanced Budget and Emergency Deficit Control Act of 1985 (BBEDCA) requires the baseline for discretionary appropriations, including disaster and emergency spend-
ing, to reflect the most recent enacted levels, extended through the budget window with adjustments for inflation� This line represents the effect of providing needed emergency funding for 2018 and then aligning emergency and disaster funding with the average of funding provided over the previous ten years, relative to the inflated spending levels in the BBEDCA baseline�
5 Includes differences between baseline and policy estimates of the outlay effects of mandatory sequestration�
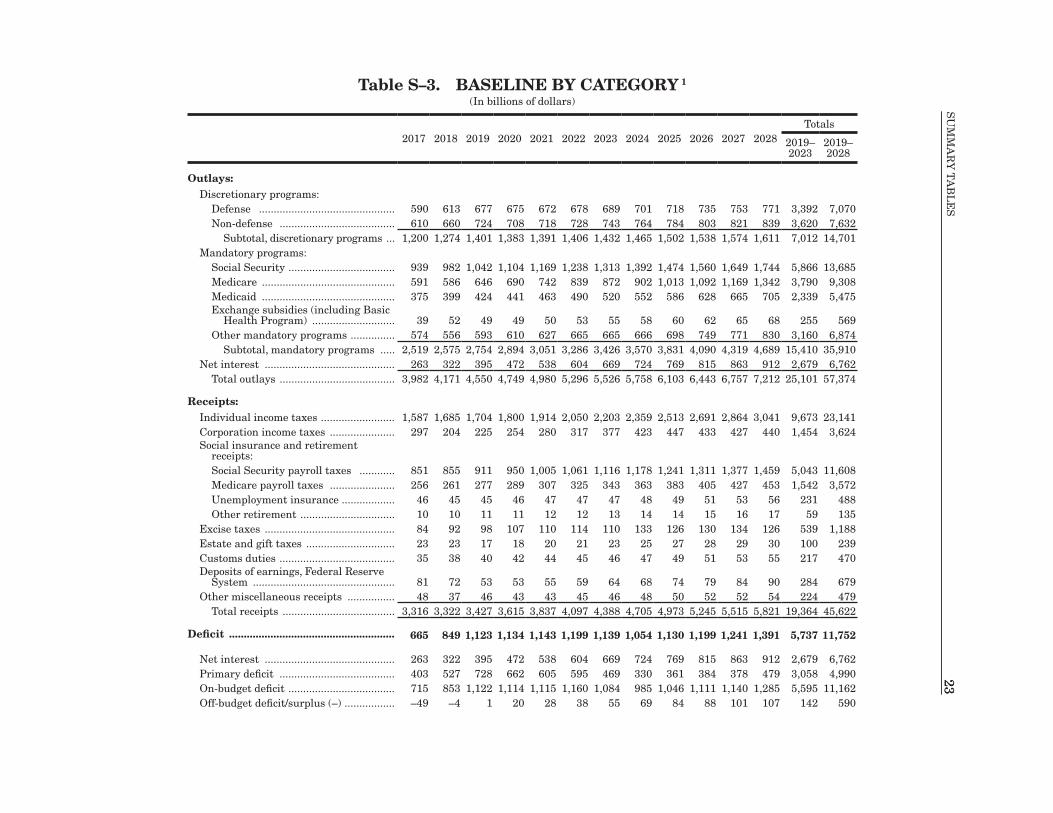
Table S–3. BASELINE BY CATEGORY 1
(In billions of dollars)
2017 2018 2019 2020 2021 2022 2023 2024 2025 2026 2027 2028Totals
2019–2023
2019–2028
Outlays:Discretionary programs:
Defense ���������������������������������������������� 590 613 677 675 672 678 689 701 718 735 753 771 3,392 7,070Non-defense ��������������������������������������� 610 660 724 708 718 728 743 764 784 803 821 839 3,620 7,632
Subtotal, discretionary programs ��� 1,200 1,274 1,401 1,383 1,391 1,406 1,432 1,465 1,502 1,538 1,574 1,611 7,012 14,701Mandatory programs:
Social Security ������������������������������������ 939 982 1,042 1,104 1,169 1,238 1,313 1,392 1,474 1,560 1,649 1,744 5,866 13,685Medicare ��������������������������������������������� 591 586 646 690 742 839 872 902 1,013 1,092 1,169 1,342 3,790 9,308Medicaid ��������������������������������������������� 375 399 424 441 463 490 520 552 586 628 665 705 2,339 5,475Exchange subsidies (including Basic
Health Program) ���������������������������� 39 52 49 49 50 53 55 58 60 62 65 68 255 569Other mandatory programs ��������������� 574 556 593 610 627 665 665 666 698 749 771 830 3,160 6,874
Subtotal, mandatory programs ����� 2,519 2,575 2,754 2,894 3,051 3,286 3,426 3,570 3,831 4,090 4,319 4,689 15,410 35,910Net interest �������������������������������������������� 263 322 395 472 538 604 669 724 769 815 863 912 2,679 6,762
Total outlays ��������������������������������������� 3,982 4,171 4,550 4,749 4,980 5,296 5,526 5,758 6,103 6,443 6,757 7,212 25,101 57,374
Receipts:Individual income taxes ������������������������� 1,587 1,685 1,704 1,800 1,914 2,050 2,203 2,359 2,513 2,691 2,864 3,041 9,673 23,141Corporation income taxes ���������������������� 297 204 225 254 280 317 377 423 447 433 427 440 1,454 3,624Social insurance and retirement
receipts:Social Security payroll taxes ������������ 851 855 911 950 1,005 1,061 1,116 1,178 1,241 1,311 1,377 1,459 5,043 11,608Medicare payroll taxes ���������������������� 256 261 277 289 307 325 343 363 383 405 427 453 1,542 3,572Unemployment insurance ������������������ 46 45 45 46 47 47 47 48 49 51 53 56 231 488Other retirement �������������������������������� 10 10 11 11 12 12 13 14 14 15 16 17 59 135
Excise taxes �������������������������������������������� 84 92 98 107 110 114 110 133 126 130 134 126 539 1,188Estate and gift taxes ������������������������������ 23 23 17 18 20 21 23 25 27 28 29 30 100 239Customs duties ��������������������������������������� 35 38 40 42 44 45 46 47 49 51 53 55 217 470Deposits of earnings, Federal Reserve
System ������������������������������������������������ 81 72 53 53 55 59 64 68 74 79 84 90 284 679Other miscellaneous receipts ���������������� 48 37 46 43 43 45 46 48 50 52 52 54 224 479
Total receipts �������������������������������������� 3,316 3,322 3,427 3,615 3,837 4,097 4,388 4,705 4,973 5,245 5,515 5,821 19,364 45,622
Deficit ........................................................ 665 849 1,123 1,134 1,143 1,199 1,139 1,054 1,130 1,199 1,241 1,391 5,737 11,752
Net interest �������������������������������������������� 263 322 395 472 538 604 669 724 769 815 863 912 2,679 6,762Primary deficit ��������������������������������������� 403 527 728 662 605 595 469 330 361 384 378 479 3,058 4,990On-budget deficit ������������������������������������ 715 853 1,122 1,114 1,115 1,160 1,084 985 1,046 1,111 1,140 1,285 5,595 11,162Off-budget deficit/surplus (–) ����������������� –49 –4 1 20 28 38 55 69 84 88 101 107 142 590
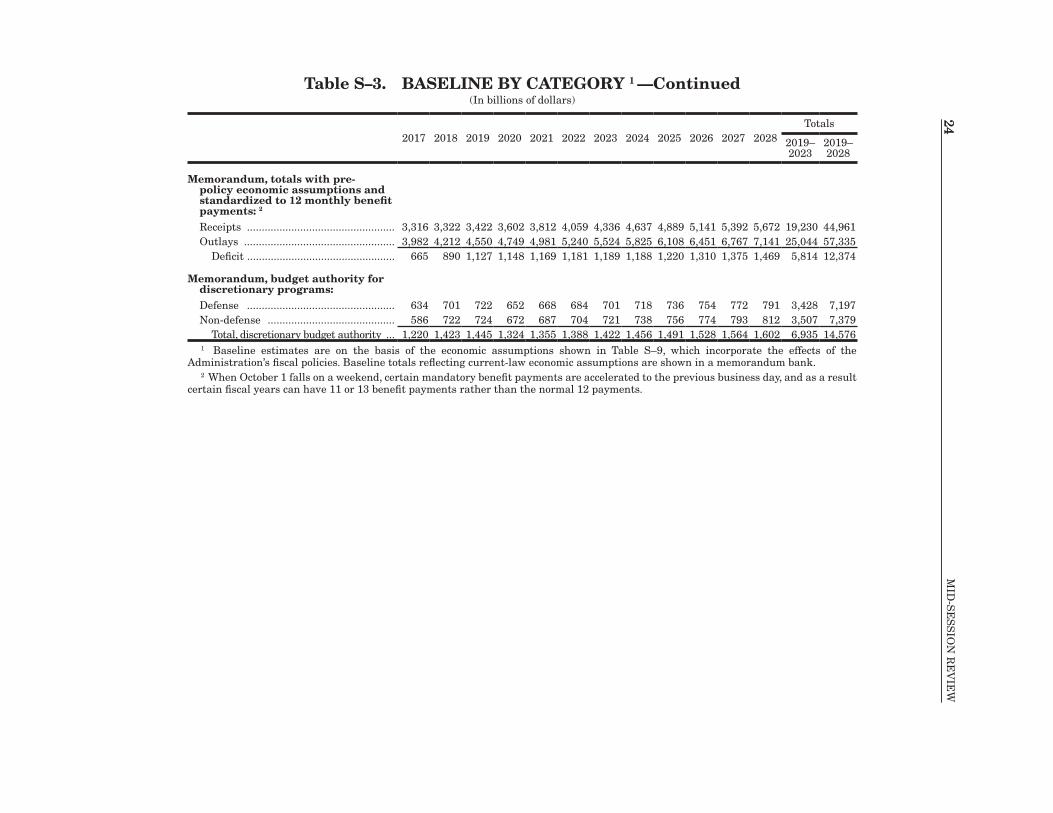
24M
ID-S
ES
SIO
N R
EV
IEW
24Table S–3. BASELINE BY CATEGORY 1 —Continued
(In billions of dollars)
2017 2018 2019 2020 2021 2022 2023 2024 2025 2026 2027 2028Totals
2019–2023
2019–2028
Memorandum, totals with pre-policy economic assumptions and standardized to 12 monthly benefit payments: 2
Receipts �������������������������������������������������� 3,316 3,322 3,422 3,602 3,812 4,059 4,336 4,637 4,889 5,141 5,392 5,672 19,230 44,961Outlays ��������������������������������������������������� 3,982 4,212 4,550 4,749 4,981 5,240 5,524 5,825 6,108 6,451 6,767 7,141 25,044 57,335
Deficit �������������������������������������������������� 665 890 1,127 1,148 1,169 1,181 1,189 1,188 1,220 1,310 1,375 1,469 5,814 12,374
Memorandum, budget authority for discretionary programs:Defense �������������������������������������������������� 634 701 722 652 668 684 701 718 736 754 772 791 3,428 7,197Non-defense ������������������������������������������� 586 722 724 672 687 704 721 738 756 774 793 812 3,507 7,379
Total, discretionary budget authority ��� 1,220 1,423 1,445 1,324 1,355 1,388 1,422 1,456 1,491 1,528 1,564 1,602 6,935 14,5761 Baseline estimates are on the basis of the economic assumptions shown in Table S–9, which incorporate the effects of the
Administration’s fiscal policies� Baseline totals reflecting current-law economic assumptions are shown in a memorandum bank�2 When October 1 falls on a weekend, certain mandatory benefit payments are accelerated to the previous business day, and as a result
certain fiscal years can have 11 or 13 benefit payments rather than the normal 12 payments�
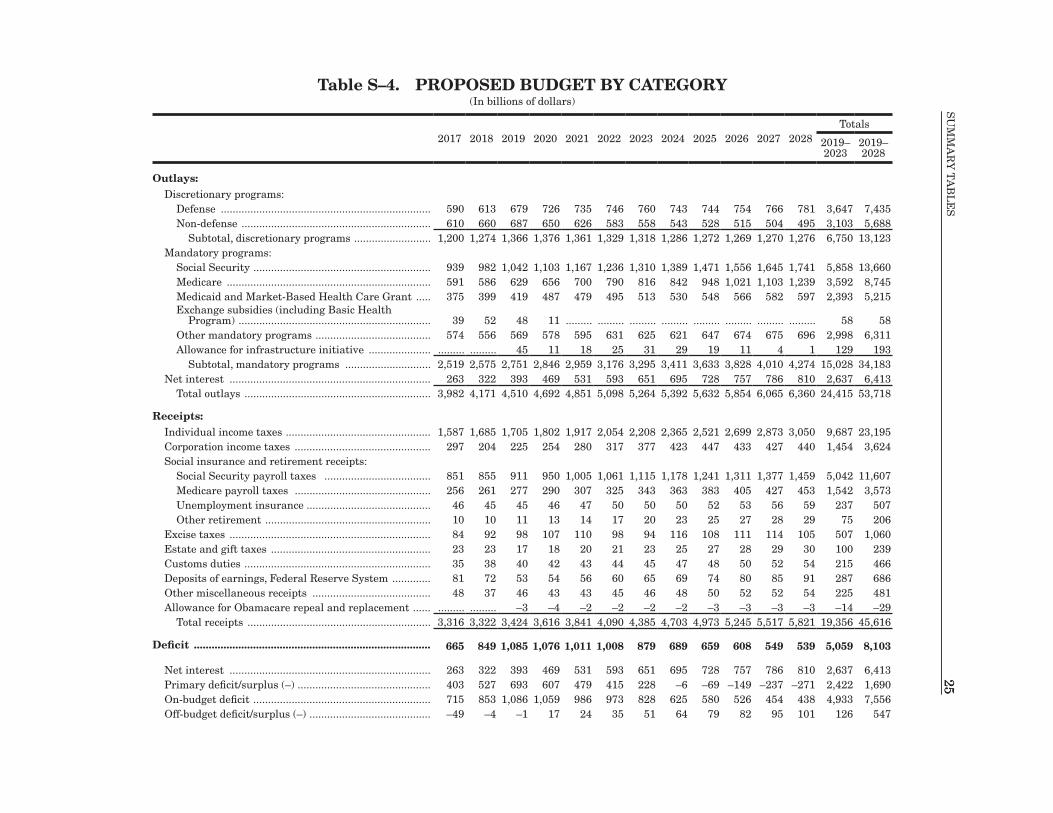
25S
UM
MA
Ry
TA
BL
ES
25Table S–4. PROPOSED BUDGET BY CATEGORY
(In billions of dollars)
2017 2018 2019 2020 2021 2022 2023 2024 2025 2026 2027 2028Totals
2019–2023
2019–2028
Outlays:Discretionary programs:
Defense ����������������������������������������������������������������������� 590 613 679 726 735 746 760 743 744 754 766 781 3,647 7,435Non-defense ���������������������������������������������������������������� 610 660 687 650 626 583 558 543 528 515 504 495 3,103 5,688
Subtotal, discretionary programs �������������������������� 1,200 1,274 1,366 1,376 1,361 1,329 1,318 1,286 1,272 1,269 1,270 1,276 6,750 13,123Mandatory programs:
Social Security ������������������������������������������������������������ 939 982 1,042 1,103 1,167 1,236 1,310 1,389 1,471 1,556 1,645 1,741 5,858 13,660Medicare ��������������������������������������������������������������������� 591 586 629 656 700 790 816 842 948 1,021 1,103 1,239 3,592 8,745Medicaid and Market-Based Health Care Grant ����� 375 399 419 487 479 495 513 530 548 566 582 597 2,393 5,215Exchange subsidies (including Basic Health
Program) ����������������������������������������������������������������� 39 52 48 11 ��������� ��������� ��������� ��������� ��������� ��������� ��������� ��������� 58 58Other mandatory programs ��������������������������������������� 574 556 569 578 595 631 625 621 647 674 675 696 2,998 6,311Allowance for infrastructure initiative ��������������������� ��������� ��������� 45 11 18 25 31 29 19 11 4 1 129 193
Subtotal, mandatory programs ����������������������������� 2,519 2,575 2,751 2,846 2,959 3,176 3,295 3,411 3,633 3,828 4,010 4,274 15,028 34,183Net interest �������������������������������������������������������������������� 263 322 393 469 531 593 651 695 728 757 786 810 2,637 6,413
Total outlays ��������������������������������������������������������������� 3,982 4,171 4,510 4,692 4,851 5,098 5,264 5,392 5,632 5,854 6,065 6,360 24,415 53,718
Receipts:Individual income taxes ������������������������������������������������� 1,587 1,685 1,705 1,802 1,917 2,054 2,208 2,365 2,521 2,699 2,873 3,050 9,687 23,195Corporation income taxes ���������������������������������������������� 297 204 225 254 280 317 377 423 447 433 427 440 1,454 3,624Social insurance and retirement receipts:
Social Security payroll taxes ������������������������������������ 851 855 911 950 1,005 1,061 1,115 1,178 1,241 1,311 1,377 1,459 5,042 11,607Medicare payroll taxes ���������������������������������������������� 256 261 277 290 307 325 343 363 383 405 427 453 1,542 3,573Unemployment insurance ������������������������������������������ 46 45 45 46 47 50 50 50 52 53 56 59 237 507Other retirement �������������������������������������������������������� 10 10 11 13 14 17 20 23 25 27 28 29 75 206
Excise taxes �������������������������������������������������������������������� 84 92 98 107 110 98 94 116 108 111 114 105 507 1,060Estate and gift taxes ������������������������������������������������������ 23 23 17 18 20 21 23 25 27 28 29 30 100 239Customs duties ��������������������������������������������������������������� 35 38 40 42 43 44 45 47 48 50 52 54 215 466Deposits of earnings, Federal Reserve System ������������� 81 72 53 54 56 60 65 69 74 80 85 91 287 686Other miscellaneous receipts ���������������������������������������� 48 37 46 43 43 45 46 48 50 52 52 54 225 481Allowance for Obamacare repeal and replacement ������ ��������� ��������� –3 –4 –2 –2 –2 –2 –3 –3 –3 –3 –14 –29
Total receipts �������������������������������������������������������������� 3,316 3,322 3,424 3,616 3,841 4,090 4,385 4,703 4,973 5,245 5,517 5,821 19,356 45,616
Deficit ................................................................................ 665 849 1,085 1,076 1,011 1,008 879 689 659 608 549 539 5,059 8,103
Net interest �������������������������������������������������������������������� 263 322 393 469 531 593 651 695 728 757 786 810 2,637 6,413Primary deficit/surplus (–) ��������������������������������������������� 403 527 693 607 479 415 228 –6 –69 –149 –237 –271 2,422 1,690On-budget deficit ������������������������������������������������������������ 715 853 1,086 1,059 986 973 828 625 580 526 454 438 4,933 7,556Off-budget deficit/surplus (–) ����������������������������������������� –49 –4 –1 17 24 35 51 64 79 82 95 101 126 547
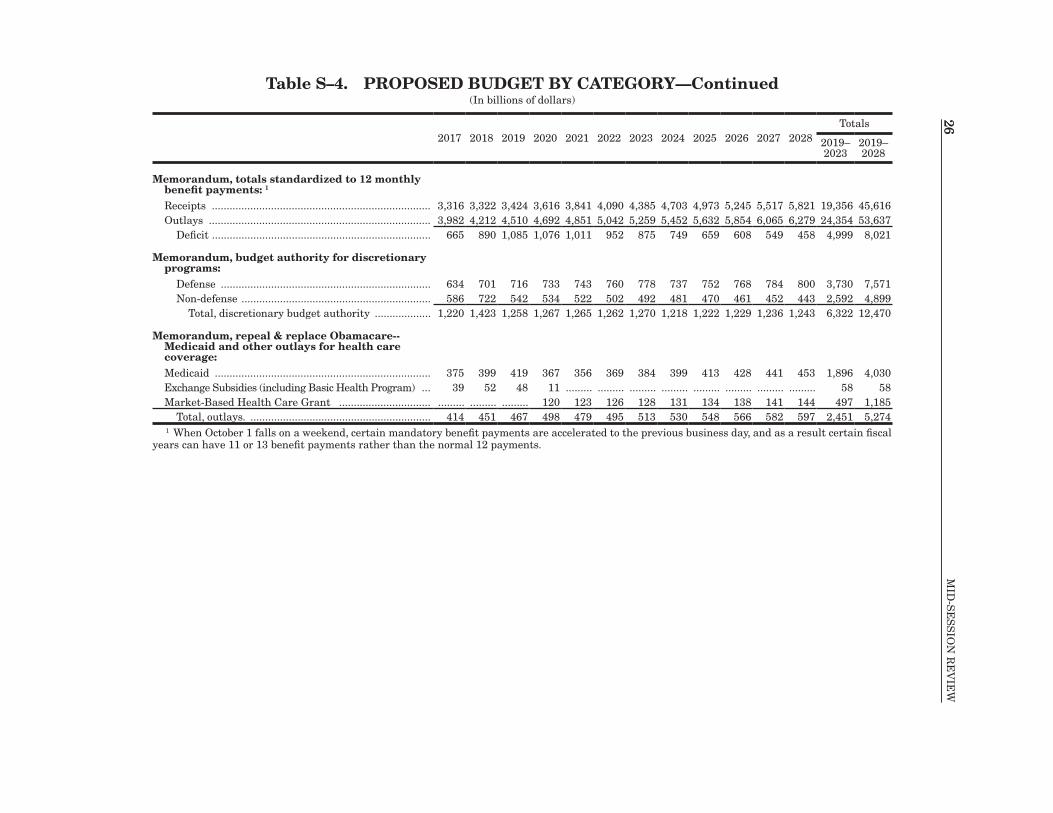
26M
ID-S
ES
SIO
N R
EV
IEW
26Table S–4. PROPOSED BUDGET BY CATEGORY—Continued
(In billions of dollars)
2017 2018 2019 2020 2021 2022 2023 2024 2025 2026 2027 2028Totals
2019–2023
2019–2028
Memorandum, totals standardized to 12 monthly benefit payments: 1
Receipts �������������������������������������������������������������������������� 3,316 3,322 3,424 3,616 3,841 4,090 4,385 4,703 4,973 5,245 5,517 5,821 19,356 45,616Outlays ��������������������������������������������������������������������������� 3,982 4,212 4,510 4,692 4,851 5,042 5,259 5,452 5,632 5,854 6,065 6,279 24,354 53,637
Deficit �������������������������������������������������������������������������� 665 890 1,085 1,076 1,011 952 875 749 659 608 549 458 4,999 8,021
Memorandum, budget authority for discretionary programs:
Defense ����������������������������������������������������������������������� 634 701 716 733 743 760 778 737 752 768 784 800 3,730 7,571Non-defense ���������������������������������������������������������������� 586 722 542 534 522 502 492 481 470 461 452 443 2,592 4,899
Total, discretionary budget authority ������������������� 1,220 1,423 1,258 1,267 1,265 1,262 1,270 1,218 1,222 1,229 1,236 1,243 6,322 12,470
Memorandum, repeal & replace Obamacare--Medicaid and other outlays for health care coverage:Medicaid ������������������������������������������������������������������������� 375 399 419 367 356 369 384 399 413 428 441 453 1,896 4,030Exchange Subsidies (including Basic Health Program) ��� 39 52 48 11 ��������� ��������� ��������� ��������� ��������� ��������� ��������� ��������� 58 58Market-Based Health Care Grant ������������������������������� ��������� ��������� ��������� 120 123 126 128 131 134 138 141 144 497 1,185
Total, outlays� ������������������������������������������������������������� 414 451 467 498 479 495 513 530 548 566 582 597 2,451 5,2741 When October 1 falls on a weekend, certain mandatory benefit payments are accelerated to the previous business day, and as a result certain fiscal
years can have 11 or 13 benefit payments rather than the normal 12 payments�
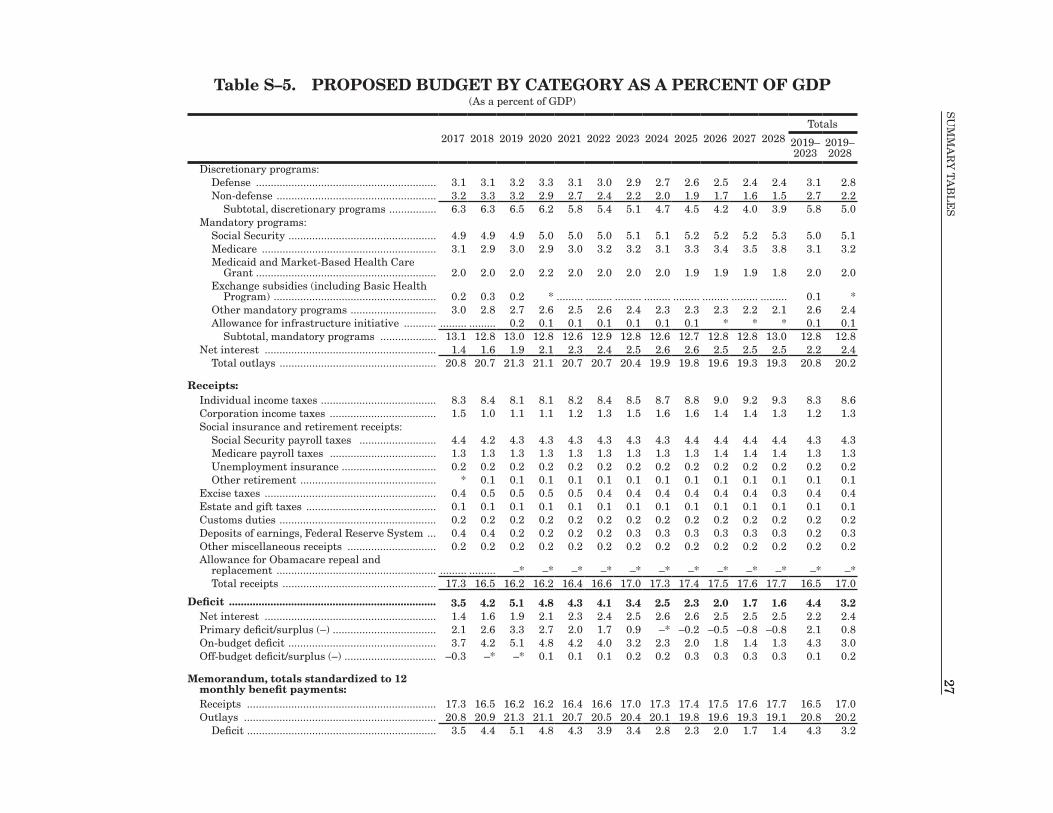
27S
UM
MA
Ry
TA
BL
ES
27Table S–5. PROPOSED BUDGET BY CATEGORY AS A PERCENT OF GDP
(As a percent of GDP)
2017 2018 2019 2020 2021 2022 2023 2024 2025 2026 2027 2028Totals
2019–2023
2019–2028
Discretionary programs:Defense ������������������������������������������������������������� 3�1 3�1 3�2 3�3 3�1 3�0 2�9 2�7 2�6 2�5 2�4 2�4 3�1 2�8Non-defense ������������������������������������������������������ 3�2 3�3 3�2 2�9 2�7 2�4 2�2 2�0 1�9 1�7 1�6 1�5 2�7 2�2
Subtotal, discretionary programs ���������������� 6�3 6�3 6�5 6�2 5�8 5�4 5�1 4�7 4�5 4�2 4�0 3�9 5�8 5�0Mandatory programs:
Social Security �������������������������������������������������� 4�9 4�9 4�9 5�0 5�0 5�0 5�1 5�1 5�2 5�2 5�2 5�3 5�0 5�1Medicare ����������������������������������������������������������� 3�1 2�9 3�0 2�9 3�0 3�2 3�2 3�1 3�3 3�4 3�5 3�8 3�1 3�2Medicaid and Market-Based Health Care
Grant ������������������������������������������������������������� 2�0 2�0 2�0 2�2 2�0 2�0 2�0 2�0 1�9 1�9 1�9 1�8 2�0 2�0Exchange subsidies (including Basic Health
Program) ������������������������������������������������������� 0�2 0�3 0�2 * ��������� ��������� ��������� ��������� ��������� ��������� ��������� ��������� 0�1 *Other mandatory programs ����������������������������� 3�0 2�8 2�7 2�6 2�5 2�6 2�4 2�3 2�3 2�3 2�2 2�1 2�6 2�4Allowance for infrastructure initiative ����������� ��������� ��������� 0�2 0�1 0�1 0�1 0�1 0�1 0�1 * * * 0�1 0�1
Subtotal, mandatory programs ������������������� 13�1 12�8 13�0 12�8 12�6 12�9 12�8 12�6 12�7 12�8 12�8 13�0 12�8 12�8Net interest ���������������������������������������������������������� 1�4 1�6 1�9 2�1 2�3 2�4 2�5 2�6 2�6 2�5 2�5 2�5 2�2 2�4
Total outlays ����������������������������������������������������� 20�8 20�7 21�3 21�1 20�7 20�7 20�4 19�9 19�8 19�6 19�3 19�3 20�8 20�2
Receipts:Individual income taxes ��������������������������������������� 8�3 8�4 8�1 8�1 8�2 8�4 8�5 8�7 8�8 9�0 9�2 9�3 8�3 8�6Corporation income taxes ������������������������������������ 1�5 1�0 1�1 1�1 1�2 1�3 1�5 1�6 1�6 1�4 1�4 1�3 1�2 1�3Social insurance and retirement receipts:
Social Security payroll taxes �������������������������� 4�4 4�2 4�3 4�3 4�3 4�3 4�3 4�3 4�4 4�4 4�4 4�4 4�3 4�3Medicare payroll taxes ������������������������������������ 1�3 1�3 1�3 1�3 1�3 1�3 1�3 1�3 1�3 1�4 1�4 1�4 1�3 1�3Unemployment insurance �������������������������������� 0�2 0�2 0�2 0�2 0�2 0�2 0�2 0�2 0�2 0�2 0�2 0�2 0�2 0�2Other retirement ���������������������������������������������� * 0�1 0�1 0�1 0�1 0�1 0�1 0�1 0�1 0�1 0�1 0�1 0�1 0�1
Excise taxes ���������������������������������������������������������� 0�4 0�5 0�5 0�5 0�5 0�4 0�4 0�4 0�4 0�4 0�4 0�3 0�4 0�4Estate and gift taxes �������������������������������������������� 0�1 0�1 0�1 0�1 0�1 0�1 0�1 0�1 0�1 0�1 0�1 0�1 0�1 0�1Customs duties ����������������������������������������������������� 0�2 0�2 0�2 0�2 0�2 0�2 0�2 0�2 0�2 0�2 0�2 0�2 0�2 0�2Deposits of earnings, Federal Reserve System ��� 0�4 0�4 0�2 0�2 0�2 0�2 0�3 0�3 0�3 0�3 0�3 0�3 0�2 0�3Other miscellaneous receipts ������������������������������ 0�2 0�2 0�2 0�2 0�2 0�2 0�2 0�2 0�2 0�2 0�2 0�2 0�2 0�2Allowance for Obamacare repeal and
replacement ������������������������������������������������������ ��������� ��������� –* –* –* –* –* –* –* –* –* –* –* –*Total receipts ���������������������������������������������������� 17�3 16�5 16�2 16�2 16�4 16�6 17�0 17�3 17�4 17�5 17�6 17�7 16�5 17�0
Deficit ...................................................................... 3.5 4.2 5.1 4.8 4.3 4.1 3.4 2.5 2.3 2.0 1.7 1.6 4.4 3.2Net interest ���������������������������������������������������������� 1�4 1�6 1�9 2�1 2�3 2�4 2�5 2�6 2�6 2�5 2�5 2�5 2�2 2�4Primary deficit/surplus (–) ����������������������������������� 2�1 2�6 3�3 2�7 2�0 1�7 0�9 –* –0�2 –0�5 –0�8 –0�8 2�1 0�8On-budget deficit �������������������������������������������������� 3�7 4�2 5�1 4�8 4�2 4�0 3�2 2�3 2�0 1�8 1�4 1�3 4�3 3�0Off-budget deficit/surplus (–) ������������������������������� –0�3 –* –* 0�1 0�1 0�1 0�2 0�2 0�3 0�3 0�3 0�3 0�1 0�2
Memorandum, totals standardized to 12 monthly benefit payments:Receipts ���������������������������������������������������������������� 17�3 16�5 16�2 16�2 16�4 16�6 17�0 17�3 17�4 17�5 17�6 17�7 16�5 17�0Outlays ����������������������������������������������������������������� 20�8 20�9 21�3 21�1 20�7 20�5 20�4 20�1 19�8 19�6 19�3 19�1 20�8 20�2
Deficit ���������������������������������������������������������������� 3�5 4�4 5�1 4�8 4�3 3�9 3�4 2�8 2�3 2�0 1�7 1�4 4�3 3�2
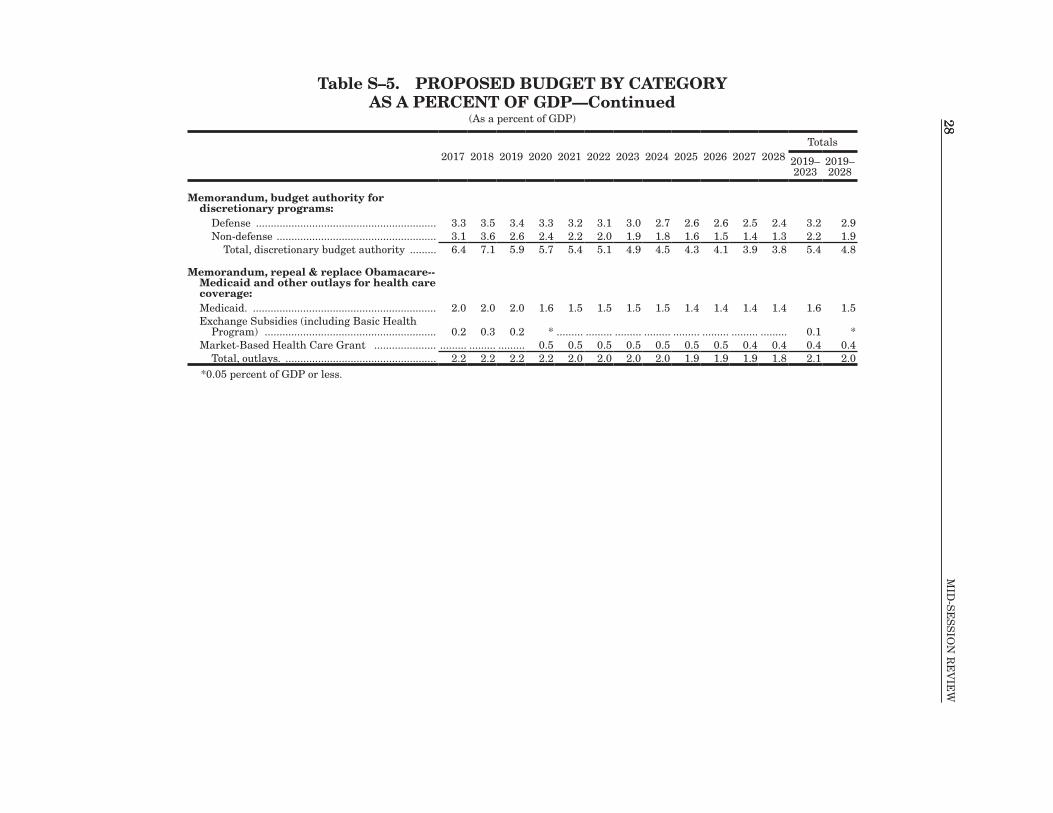
28M
ID-S
ES
SIO
N R
EV
IEW
28Table S–5. PROPOSED BUDGET BY CATEGORY
AS A PERCENT OF GDP—Continued(As a percent of GDP)
2017 2018 2019 2020 2021 2022 2023 2024 2025 2026 2027 2028Totals
2019–2023
2019–2028
Memorandum, budget authority for discretionary programs:
Defense ������������������������������������������������������������� 3�3 3�5 3�4 3�3 3�2 3�1 3�0 2�7 2�6 2�6 2�5 2�4 3�2 2�9Non-defense ������������������������������������������������������ 3�1 3�6 2�6 2�4 2�2 2�0 1�9 1�8 1�6 1�5 1�4 1�3 2�2 1�9
Total, discretionary budget authority ��������� 6�4 7�1 5�9 5�7 5�4 5�1 4�9 4�5 4�3 4�1 3�9 3�8 5�4 4�8
Memorandum, repeal & replace Obamacare--Medicaid and other outlays for health care coverage:Medicaid� �������������������������������������������������������������� 2�0 2�0 2�0 1�6 1�5 1�5 1�5 1�5 1�4 1�4 1�4 1�4 1�6 1�5Exchange Subsidies (including Basic Health
Program) ���������������������������������������������������������� 0�2 0�3 0�2 * ��������� ��������� ��������� ��������� ��������� ��������� ��������� ��������� 0�1 *Market-Based Health Care Grant ��������������������� ��������� ��������� ��������� 0�5 0�5 0�5 0�5 0�5 0�5 0�5 0�4 0�4 0�4 0�4
Total, outlays� ��������������������������������������������������� 2�2 2�2 2�2 2�2 2�0 2�0 2�0 2�0 1�9 1�9 1�9 1�8 2�1 2�0*0�05 percent of GDP or less�
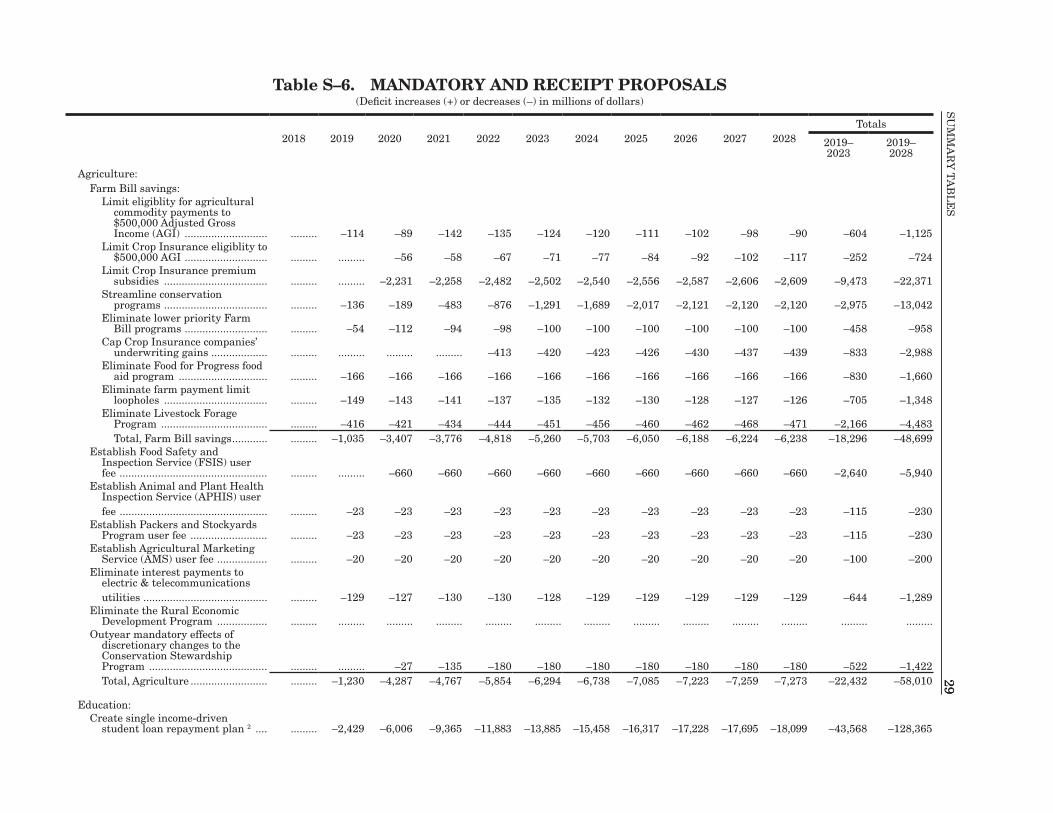
29S
UM
MA
Ry
TA
BL
ES
29Table S–6. MANDATORY AND RECEIPT PROPOSALS
(Deficit increases (+) or decreases (–) in millions of dollars)
2018 2019 2020 2021 2022 2023 2024 2025 2026 2027 2028Totals
2019– 2023
2019– 2028
Agriculture:Farm Bill savings:
Limit eligiblity for agricultural commodity payments to $500,000 Adjusted Gross Income (AGI) ���������������������������� ��������� –114 –89 –142 –135 –124 –120 –111 –102 –98 –90 –604 –1,125
Limit Crop Insurance eligiblity to $500,000 AGI ���������������������������� ��������� ��������� –56 –58 –67 –71 –77 –84 –92 –102 –117 –252 –724
Limit Crop Insurance premium subsidies ����������������������������������� ��������� ��������� –2,231 –2,258 –2,482 –2,502 –2,540 –2,556 –2,587 –2,606 –2,609 –9,473 –22,371
Streamline conservation programs ����������������������������������� ��������� –136 –189 –483 –876 –1,291 –1,689 –2,017 –2,121 –2,120 –2,120 –2,975 –13,042
Eliminate lower priority Farm Bill programs ���������������������������� ��������� –54 –112 –94 –98 –100 –100 –100 –100 –100 –100 –458 –958
Cap Crop Insurance companies’ underwriting gains ������������������� ��������� ��������� ��������� ��������� –413 –420 –423 –426 –430 –437 –439 –833 –2,988
Eliminate Food for Progress food aid program ������������������������������ ��������� –166 –166 –166 –166 –166 –166 –166 –166 –166 –166 –830 –1,660
Eliminate farm payment limit loopholes ����������������������������������� ��������� –149 –143 –141 –137 –135 –132 –130 –128 –127 –126 –705 –1,348
Eliminate Livestock Forage Program ������������������������������������ ��������� –416 –421 –434 –444 –451 –456 –460 –462 –468 –471 –2,166 –4,483Total, Farm Bill savings ������������ ��������� –1,035 –3,407 –3,776 –4,818 –5,260 –5,703 –6,050 –6,188 –6,224 –6,238 –18,296 –48,699
Establish Food Safety and Inspection Service (FSIS) user fee �������������������������������������������������� ��������� ��������� –660 –660 –660 –660 –660 –660 –660 –660 –660 –2,640 –5,940
Establish Animal and Plant Health Inspection Service (APHIS) user fee �������������������������������������������������� ��������� –23 –23 –23 –23 –23 –23 –23 –23 –23 –23 –115 –230
Establish Packers and Stockyards Program user fee �������������������������� ��������� –23 –23 –23 –23 –23 –23 –23 –23 –23 –23 –115 –230
Establish Agricultural Marketing Service (AMS) user fee ����������������� ��������� –20 –20 –20 –20 –20 –20 –20 –20 –20 –20 –100 –200
Eliminate interest payments to electric & telecommunications utilities ������������������������������������������ ��������� –129 –127 –130 –130 –128 –129 –129 –129 –129 –129 –644 –1,289
Eliminate the Rural Economic Development Program ����������������� ��������� ��������� ��������� ��������� ��������� ��������� ��������� ��������� ��������� ��������� ��������� ��������� ���������
Outyear mandatory effects of discretionary changes to the Conservation Stewardship Program ���������������������������������������� ��������� ��������� –27 –135 –180 –180 –180 –180 –180 –180 –180 –522 –1,422Total, Agriculture �������������������������� ��������� –1,230 –4,287 –4,767 –5,854 –6,294 –6,738 –7,085 –7,223 –7,259 –7,273 –22,432 –58,010
Education:Create single income-driven
student loan repayment plan 2 ���� ��������� –2,429 –6,006 –9,365 –11,883 –13,885 –15,458 –16,317 –17,228 –17,695 –18,099 –43,568 –128,365
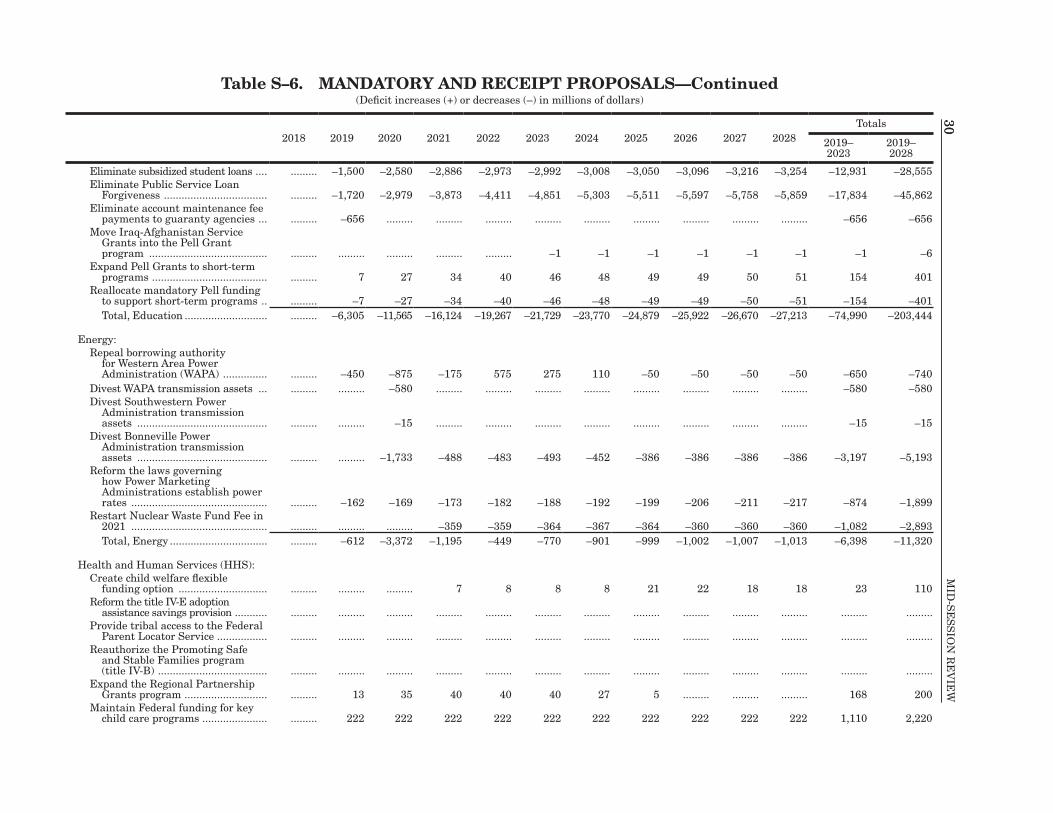
30M
ID-S
ES
SIO
N R
EV
IEW
30Table S–6. MANDATORY AND RECEIPT PROPOSALS—Continued
(Deficit increases (+) or decreases (–) in millions of dollars)
2018 2019 2020 2021 2022 2023 2024 2025 2026 2027 2028Totals
2019– 2023
2019– 2028
Eliminate subsidized student loans ���� ��������� –1,500 –2,580 –2,886 –2,973 –2,992 –3,008 –3,050 –3,096 –3,216 –3,254 –12,931 –28,555Eliminate Public Service Loan
Forgiveness ����������������������������������� ��������� –1,720 –2,979 –3,873 –4,411 –4,851 –5,303 –5,511 –5,597 –5,758 –5,859 –17,834 –45,862Eliminate account maintenance fee
payments to guaranty agencies ��� ��������� –656 ��������� ��������� ��������� ��������� ��������� ��������� ��������� ��������� ��������� –656 –656Move Iraq-Afghanistan Service
Grants into the Pell Grant program ���������������������������������������� ��������� ��������� ��������� ��������� ��������� –1 –1 –1 –1 –1 –1 –1 –6
Expand Pell Grants to short-term programs ��������������������������������������� ��������� 7 27 34 40 46 48 49 49 50 51 154 401
Reallocate mandatory Pell funding to support short-term programs �� ��������� –7 –27 –34 –40 –46 –48 –49 –49 –50 –51 –154 –401Total, Education ���������������������������� ��������� –6,305 –11,565 –16,124 –19,267 –21,729 –23,770 –24,879 –25,922 –26,670 –27,213 –74,990 –203,444
Energy:Repeal borrowing authority
for Western Area Power Administration (WAPA) ��������������� ��������� –450 –875 –175 575 275 110 –50 –50 –50 –50 –650 –740
Divest WAPA transmission assets ��� ��������� ��������� –580 ��������� ��������� ��������� ��������� ��������� ��������� ��������� ��������� –580 –580Divest Southwestern Power
Administration transmission assets �������������������������������������������� ��������� ��������� –15 ��������� ��������� ��������� ��������� ��������� ��������� ��������� ��������� –15 –15
Divest Bonneville Power Administration transmission assets �������������������������������������������� ��������� ��������� –1,733 –488 –483 –493 –452 –386 –386 –386 –386 –3,197 –5,193
Reform the laws governing how Power Marketing Administrations establish power rates ���������������������������������������������� ��������� –162 –169 –173 –182 –188 –192 –199 –206 –211 –217 –874 –1,899
Restart Nuclear Waste Fund Fee in 2021 ���������������������������������������������� ��������� ��������� ��������� –359 –359 –364 –367 –364 –360 –360 –360 –1,082 –2,893Total, Energy ��������������������������������� ��������� –612 –3,372 –1,195 –449 –770 –901 –999 –1,002 –1,007 –1,013 –6,398 –11,320
Health and Human Services (HHS):Create child welfare flexible
funding option ������������������������������ ��������� ��������� ��������� 7 8 8 8 21 22 18 18 23 110Reform the title IV-E adoption
assistance savings provision ����������� ��������� ��������� ��������� ��������� ��������� ��������� ��������� ��������� ��������� ��������� ��������� ��������� ���������Provide tribal access to the Federal
Parent Locator Service ����������������� ��������� ��������� ��������� ��������� ��������� ��������� ��������� ��������� ��������� ��������� ��������� ��������� ���������Reauthorize the Promoting Safe
and Stable Families program (title IV-B) ������������������������������������� ��������� ��������� ��������� ��������� ��������� ��������� ��������� ��������� ��������� ��������� ��������� ��������� ���������
Expand the Regional Partnership Grants program ���������������������������� ��������� 13 35 40 40 40 27 5 ��������� ��������� ��������� 168 200
Maintain Federal funding for key child care programs ���������������������� ��������� 222 222 222 222 222 222 222 222 222 222 1,110 2,220
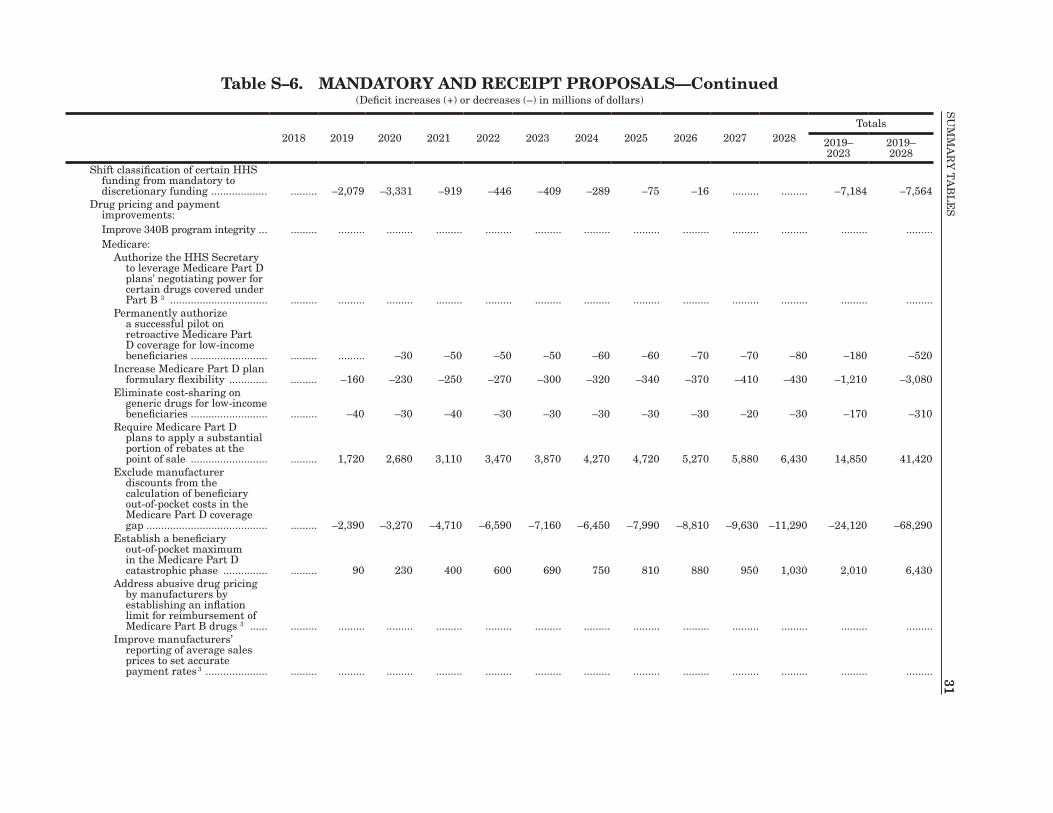
31S
UM
MA
Ry
TA
BL
ES
31Table S–6. MANDATORY AND RECEIPT PROPOSALS—Continued
(Deficit increases (+) or decreases (–) in millions of dollars)
2018 2019 2020 2021 2022 2023 2024 2025 2026 2027 2028Totals
2019– 2023
2019– 2028
Shift classification of certain HHS funding from mandatory to discretionary funding ������������������� ��������� –2,079 –3,331 –919 –446 –409 –289 –75 –16 ��������� ��������� –7,184 –7,564
Drug pricing and payment improvements:Improve 340B program integrity ��� ��������� ��������� ��������� ��������� ��������� ��������� ��������� ��������� ��������� ��������� ��������� ��������� ���������Medicare:
Authorize the HHS Secretary to leverage Medicare Part D plans’ negotiating power for certain drugs covered under Part B 3 ��������������������������������� ��������� ��������� ��������� ��������� ��������� ��������� ��������� ��������� ��������� ��������� ��������� ��������� ���������
Permanently authorize a successful pilot on retroactive Medicare Part D coverage for low-income beneficiaries �������������������������� ��������� ��������� –30 –50 –50 –50 –60 –60 –70 –70 –80 –180 –520
Increase Medicare Part D plan formulary flexibility ������������� ��������� –160 –230 –250 –270 –300 –320 –340 –370 –410 –430 –1,210 –3,080
Eliminate cost-sharing on generic drugs for low-income beneficiaries �������������������������� ��������� –40 –30 –40 –30 –30 –30 –30 –30 –20 –30 –170 –310
Require Medicare Part D plans to apply a substantial portion of rebates at the point of sale �������������������������� ��������� 1,720 2,680 3,110 3,470 3,870 4,270 4,720 5,270 5,880 6,430 14,850 41,420
Exclude manufacturer discounts from the calculation of beneficiary out-of-pocket costs in the Medicare Part D coverage gap ����������������������������������������� ��������� –2,390 –3,270 –4,710 –6,590 –7,160 –6,450 –7,990 –8,810 –9,630 –11,290 –24,120 –68,290
Establish a beneficiary out-of-pocket maximum in the Medicare Part D catastrophic phase ��������������� ��������� 90 230 400 600 690 750 810 880 950 1,030 2,010 6,430
Address abusive drug pricing by manufacturers by establishing an inflation limit for reimbursement of Medicare Part B drugs 3 ������ ��������� ��������� ��������� ��������� ��������� ��������� ��������� ��������� ��������� ��������� ��������� ��������� ���������
Improve manufacturers’ reporting of average sales prices to set accurate payment rates 3 ��������������������� ��������� ��������� ��������� ��������� ��������� ��������� ��������� ��������� ��������� ��������� ��������� ��������� ���������
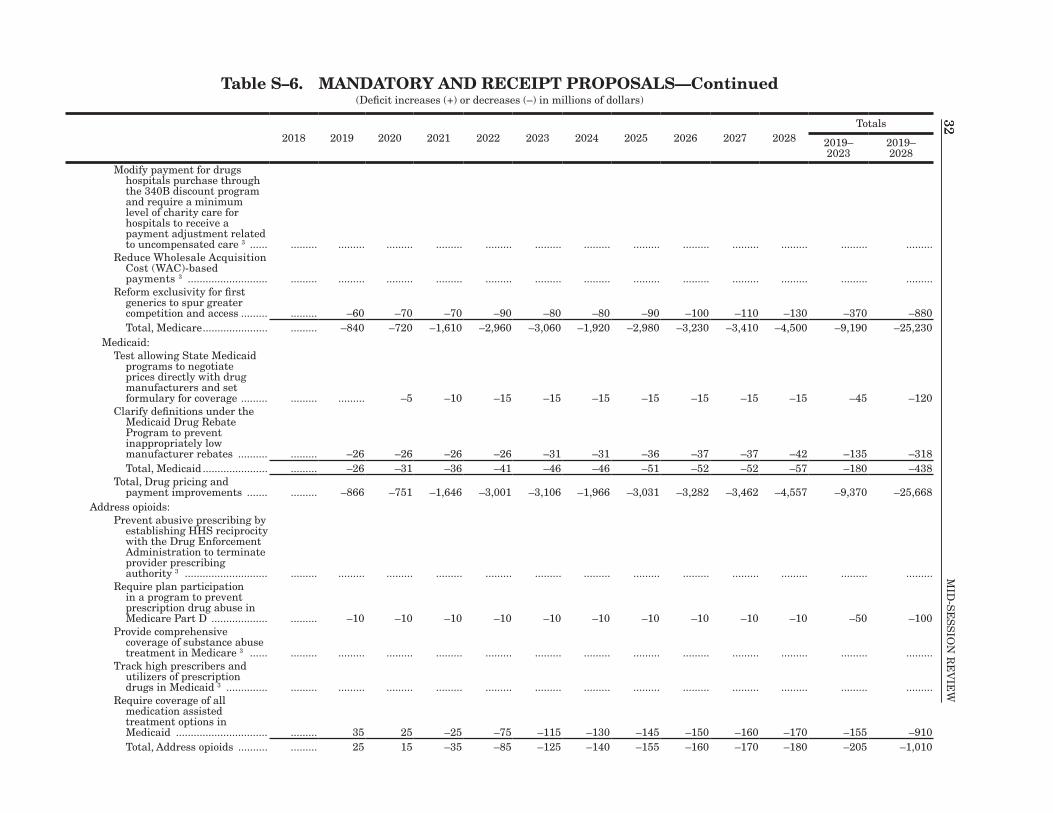
32M
ID-S
ES
SIO
N R
EV
IEW
32Table S–6. MANDATORY AND RECEIPT PROPOSALS—Continued
(Deficit increases (+) or decreases (–) in millions of dollars)
2018 2019 2020 2021 2022 2023 2024 2025 2026 2027 2028Totals
2019– 2023
2019– 2028
Modify payment for drugs hospitals purchase through the 340B discount program and require a minimum level of charity care for hospitals to receive a payment adjustment related to uncompensated care 3 ������ ��������� ��������� ��������� ��������� ��������� ��������� ��������� ��������� ��������� ��������� ��������� ��������� ���������
Reduce Wholesale Acquisition Cost (WAC)-based payments 3 ��������������������������� ��������� ��������� ��������� ��������� ��������� ��������� ��������� ��������� ��������� ��������� ��������� ��������� ���������
Reform exclusivity for first generics to spur greater competition and access ��������� ��������� –60 –70 –70 –90 –80 –80 –90 –100 –110 –130 –370 –880Total, Medicare ���������������������� ��������� –840 –720 –1,610 –2,960 –3,060 –1,920 –2,980 –3,230 –3,410 –4,500 –9,190 –25,230
Medicaid:Test allowing State Medicaid
programs to negotiate prices directly with drug manufacturers and set formulary for coverage ��������� ��������� ��������� –5 –10 –15 –15 –15 –15 –15 –15 –15 –45 –120
Clarify definitions under the Medicaid Drug Rebate Program to prevent inappropriately low manufacturer rebates ���������� ��������� –26 –26 –26 –26 –31 –31 –36 –37 –37 –42 –135 –318Total, Medicaid ���������������������� ��������� –26 –31 –36 –41 –46 –46 –51 –52 –52 –57 –180 –438
Total, Drug pricing and payment improvements ������� ��������� –866 –751 –1,646 –3,001 –3,106 –1,966 –3,031 –3,282 –3,462 –4,557 –9,370 –25,668
Address opioids:Prevent abusive prescribing by
establishing HHS reciprocity with the Drug Enforcement Administration to terminate provider prescribing authority 3 ���������������������������� ��������� ��������� ��������� ��������� ��������� ��������� ��������� ��������� ��������� ��������� ��������� ��������� ���������
Require plan participation in a program to prevent prescription drug abuse in Medicare Part D ������������������� ��������� –10 –10 –10 –10 –10 –10 –10 –10 –10 –10 –50 –100
Provide comprehensive coverage of substance abuse treatment in Medicare 3 ������ ��������� ��������� ��������� ��������� ��������� ��������� ��������� ��������� ��������� ��������� ��������� ��������� ���������
Track high prescribers and utilizers of prescription drugs in Medicaid 3 �������������� ��������� ��������� ��������� ��������� ��������� ��������� ��������� ��������� ��������� ��������� ��������� ��������� ���������
Require coverage of all medication assisted treatment options in Medicaid ������������������������������� ��������� 35 25 –25 –75 –115 –130 –145 –150 –160 –170 –155 –910Total, Address opioids ���������� ��������� 25 15 –35 –85 –125 –140 –155 –160 –170 –180 –205 –1,010
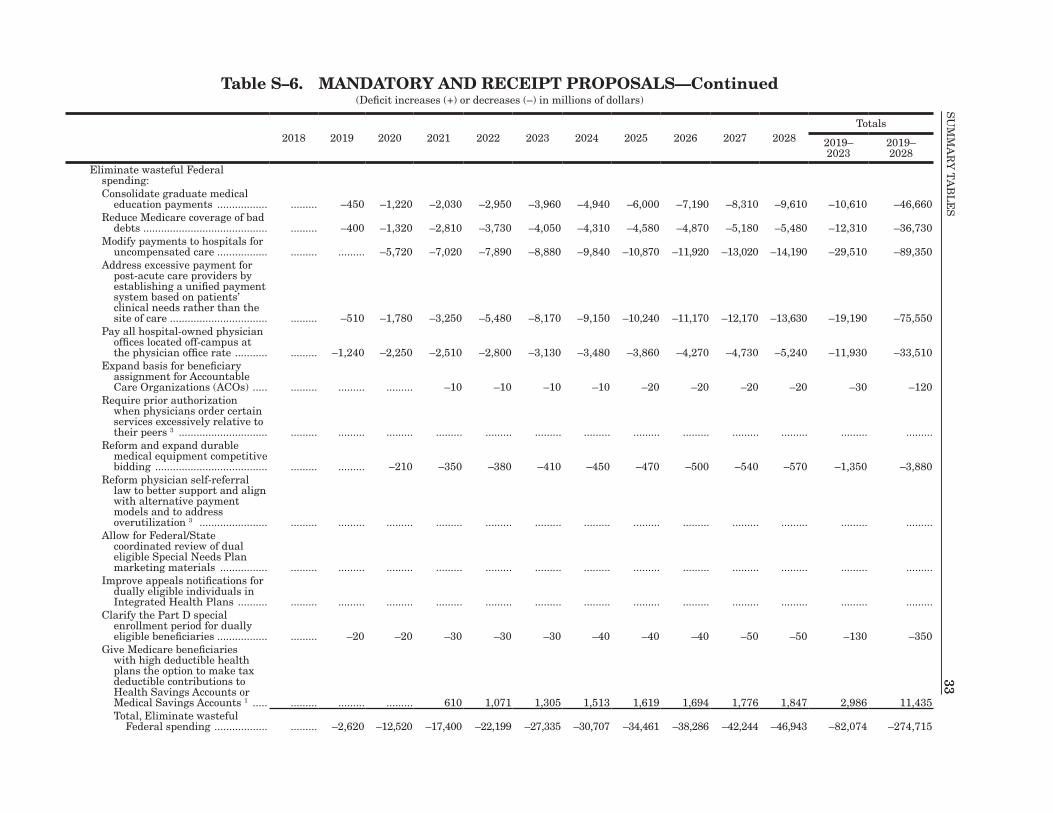
33S
UM
MA
Ry
TA
BL
ES
33Table S–6. MANDATORY AND RECEIPT PROPOSALS—Continued
(Deficit increases (+) or decreases (–) in millions of dollars)
2018 2019 2020 2021 2022 2023 2024 2025 2026 2027 2028Totals
2019– 2023
2019– 2028
Eliminate wasteful Federal spending:Consolidate graduate medical
education payments ����������������� ��������� –450 –1,220 –2,030 –2,950 –3,960 –4,940 –6,000 –7,190 –8,310 –9,610 –10,610 –46,660Reduce Medicare coverage of bad
debts ������������������������������������������ ��������� –400 –1,320 –2,810 –3,730 –4,050 –4,310 –4,580 –4,870 –5,180 –5,480 –12,310 –36,730Modify payments to hospitals for
uncompensated care ����������������� ��������� ��������� –5,720 –7,020 –7,890 –8,880 –9,840 –10,870 –11,920 –13,020 –14,190 –29,510 –89,350Address excessive payment for
post-acute care providers by establishing a unified payment system based on patients’ clinical needs rather than the site of care ��������������������������������� ��������� –510 –1,780 –3,250 –5,480 –8,170 –9,150 –10,240 –11,170 –12,170 –13,630 –19,190 –75,550
Pay all hospital-owned physician offices located off-campus at the physician office rate ����������� ��������� –1,240 –2,250 –2,510 –2,800 –3,130 –3,480 –3,860 –4,270 –4,730 –5,240 –11,930 –33,510
Expand basis for beneficiary assignment for Accountable Care Organizations (ACOs) ����� ��������� ��������� ��������� –10 –10 –10 –10 –20 –20 –20 –20 –30 –120
Require prior authorization when physicians order certain services excessively relative to their peers 3 ������������������������������ ��������� ��������� ��������� ��������� ��������� ��������� ��������� ��������� ��������� ��������� ��������� ��������� ���������
Reform and expand durable medical equipment competitive bidding �������������������������������������� ��������� ��������� –210 –350 –380 –410 –450 –470 –500 –540 –570 –1,350 –3,880
Reform physician self-referral law to better support and align with alternative payment models and to address overutilization 3 ����������������������� ��������� ��������� ��������� ��������� ��������� ��������� ��������� ��������� ��������� ��������� ��������� ��������� ���������
Allow for Federal/State coordinated review of dual eligible Special Needs Plan marketing materials ���������������� ��������� ��������� ��������� ��������� ��������� ��������� ��������� ��������� ��������� ��������� ��������� ��������� ���������
Improve appeals notifications for dually eligible individuals in Integrated Health Plans ���������� ��������� ��������� ��������� ��������� ��������� ��������� ��������� ��������� ��������� ��������� ��������� ��������� ���������
Clarify the Part D special enrollment period for dually eligible beneficiaries ����������������� ��������� –20 –20 –30 –30 –30 –40 –40 –40 –50 –50 –130 –350
Give Medicare beneficiaries with high deductible health plans the option to make tax deductible contributions to Health Savings Accounts or Medical Savings Accounts 1 ����� ��������� ��������� ��������� 610 1,071 1,305 1,513 1,619 1,694 1,776 1,847 2,986 11,435Total, Eliminate wasteful
Federal spending ������������������ ��������� –2,620 –12,520 –17,400 –22,199 –27,335 –30,707 –34,461 –38,286 –42,244 –46,943 –82,074 –274,715
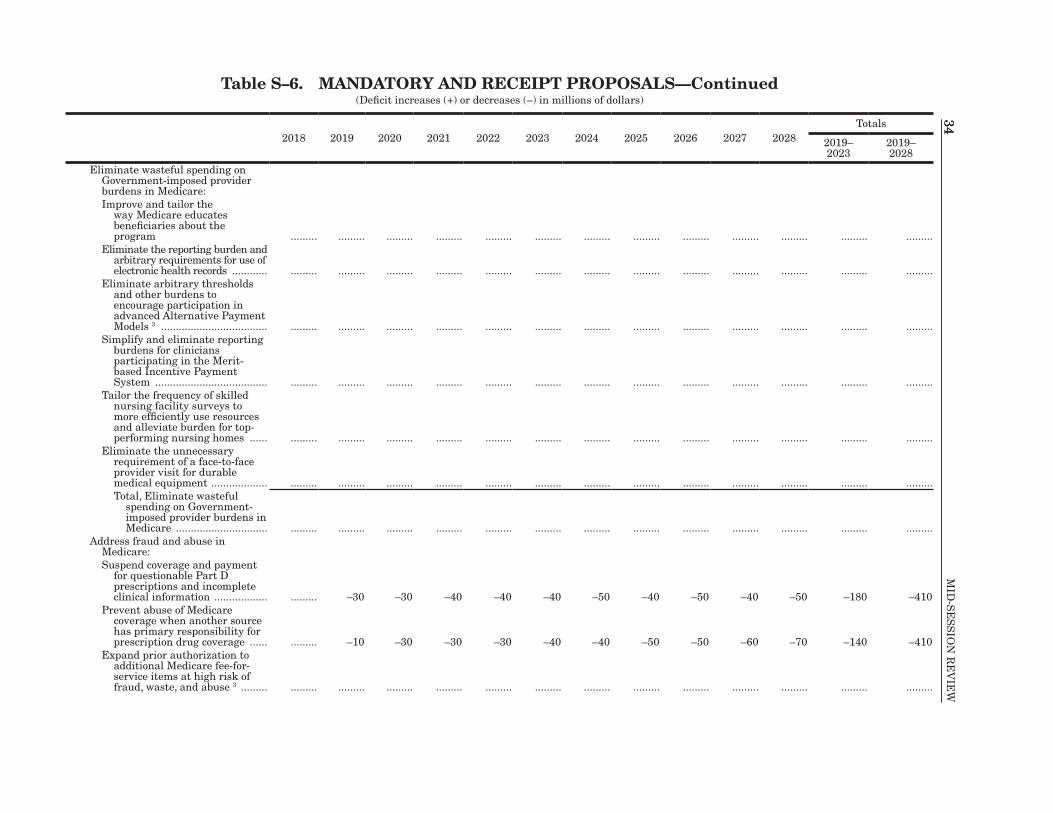
34M
ID-S
ES
SIO
N R
EV
IEW
34Table S–6. MANDATORY AND RECEIPT PROPOSALS—Continued
(Deficit increases (+) or decreases (–) in millions of dollars)
2018 2019 2020 2021 2022 2023 2024 2025 2026 2027 2028Totals
2019– 2023
2019– 2028
Eliminate wasteful spending on Government-imposed provider burdens in Medicare:Improve and tailor the
way Medicare educates beneficiaries about the program ��������� ��������� ��������� ��������� ��������� ��������� ��������� ��������� ��������� ��������� ��������� ��������� ���������
Eliminate the reporting burden and arbitrary requirements for use of electronic health records ������������ ��������� ��������� ��������� ��������� ��������� ��������� ��������� ��������� ��������� ��������� ��������� ��������� ���������
Eliminate arbitrary thresholds and other burdens to encourage participation in advanced Alternative Payment Models 3 ������������������������������������ ��������� ��������� ��������� ��������� ��������� ��������� ��������� ��������� ��������� ��������� ��������� ��������� ���������
Simplify and eliminate reporting burdens for clinicians participating in the Merit-based Incentive Payment System �������������������������������������� ��������� ��������� ��������� ��������� ��������� ��������� ��������� ��������� ��������� ��������� ��������� ��������� ���������
Tailor the frequency of skilled nursing facility surveys to more efficiently use resources and alleviate burden for top-performing nursing homes ������ ��������� ��������� ��������� ��������� ��������� ��������� ��������� ��������� ��������� ��������� ��������� ��������� ���������
Eliminate the unnecessary requirement of a face-to-face provider visit for durable medical equipment ������������������� ��������� ��������� ��������� ��������� ��������� ��������� ��������� ��������� ��������� ��������� ��������� ��������� ���������Total, Eliminate wasteful
spending on Government-imposed provider burdens in Medicare ������������������������������� ��������� ��������� ��������� ��������� ��������� ��������� ��������� ��������� ��������� ��������� ��������� ��������� ���������
Address fraud and abuse in Medicare:Suspend coverage and payment
for questionable Part D prescriptions and incomplete clinical information ������������������ ��������� –30 –30 –40 –40 –40 –50 –40 –50 –40 –50 –180 –410
Prevent abuse of Medicare coverage when another source has primary responsibility for prescription drug coverage ������ ��������� –10 –30 –30 –30 –40 –40 –50 –50 –60 –70 –140 –410
Expand prior authorization to additional Medicare fee-for-service items at high risk of fraud, waste, and abuse 3 ��������� ��������� ��������� ��������� ��������� ��������� ��������� ��������� ��������� ��������� ��������� ��������� ��������� ���������
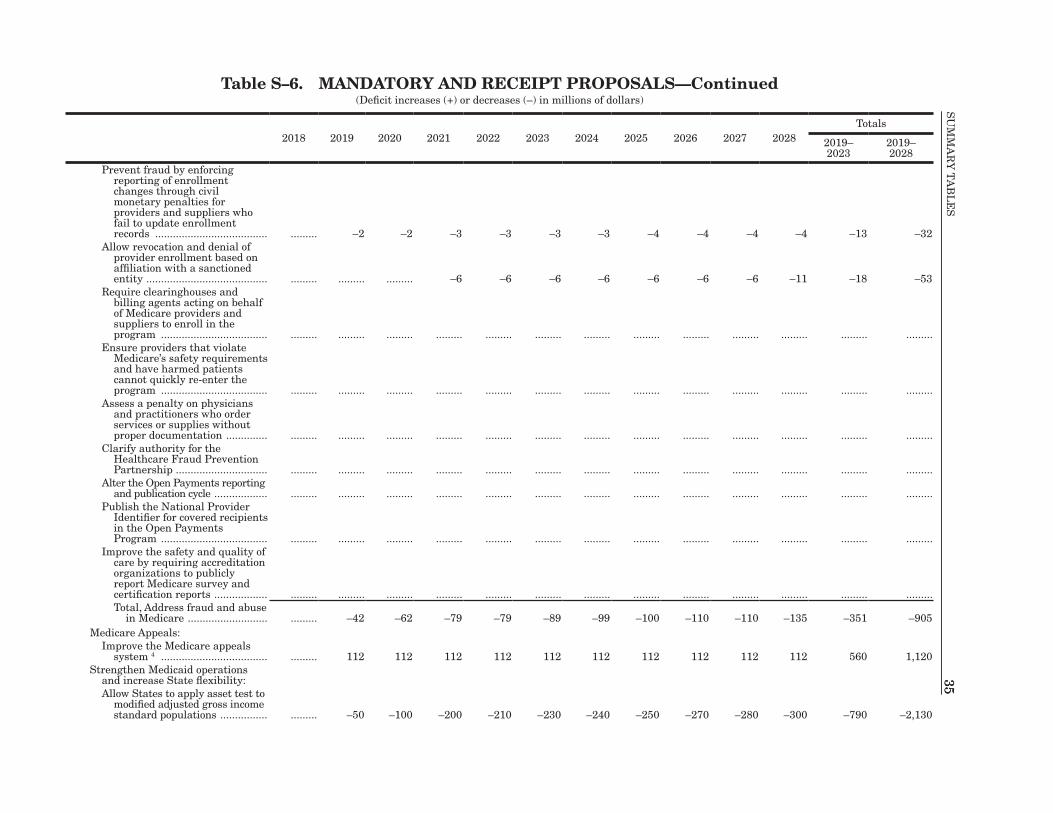
35S
UM
MA
Ry
TA
BL
ES
35Table S–6. MANDATORY AND RECEIPT PROPOSALS—Continued
(Deficit increases (+) or decreases (–) in millions of dollars)
2018 2019 2020 2021 2022 2023 2024 2025 2026 2027 2028Totals
2019– 2023
2019– 2028
Prevent fraud by enforcing reporting of enrollment changes through civil monetary penalties for providers and suppliers who fail to update enrollment records �������������������������������������� ��������� –2 –2 –3 –3 –3 –3 –4 –4 –4 –4 –13 –32
Allow revocation and denial of provider enrollment based on affiliation with a sanctioned entity ����������������������������������������� ��������� ��������� ��������� –6 –6 –6 –6 –6 –6 –6 –11 –18 –53
Require clearinghouses and billing agents acting on behalf of Medicare providers and suppliers to enroll in the program ������������������������������������ ��������� ��������� ��������� ��������� ��������� ��������� ��������� ��������� ��������� ��������� ��������� ��������� ���������
Ensure providers that violate Medicare’s safety requirements and have harmed patients cannot quickly re-enter the program ������������������������������������ ��������� ��������� ��������� ��������� ��������� ��������� ��������� ��������� ��������� ��������� ��������� ��������� ���������
Assess a penalty on physicians and practitioners who order services or supplies without proper documentation �������������� ��������� ��������� ��������� ��������� ��������� ��������� ��������� ��������� ��������� ��������� ��������� ��������� ���������
Clarify authority for the Healthcare Fraud Prevention Partnership ������������������������������� ��������� ��������� ��������� ��������� ��������� ��������� ��������� ��������� ��������� ��������� ��������� ��������� ���������
Alter the Open Payments reporting and publication cycle ������������������ ��������� ��������� ��������� ��������� ��������� ��������� ��������� ��������� ��������� ��������� ��������� ��������� ���������
Publish the National Provider Identifier for covered recipients in the Open Payments Program ������������������������������������ ��������� ��������� ��������� ��������� ��������� ��������� ��������� ��������� ��������� ��������� ��������� ��������� ���������
Improve the safety and quality of care by requiring accreditation organizations to publicly report Medicare survey and certification reports ������������������ ��������� ��������� ��������� ��������� ��������� ��������� ��������� ��������� ��������� ��������� ��������� ��������� ���������Total, Address fraud and abuse
in Medicare ��������������������������� ��������� –42 –62 –79 –79 –89 –99 –100 –110 –110 –135 –351 –905Medicare Appeals:
Improve the Medicare appeals system 4 ������������������������������������ ��������� 112 112 112 112 112 112 112 112 112 112 560 1,120
Strengthen Medicaid operations and increase State flexibility:Allow States to apply asset test to
modified adjusted gross income standard populations ���������������� ��������� –50 –100 –200 –210 –230 –240 –250 –270 –280 –300 –790 –2,130
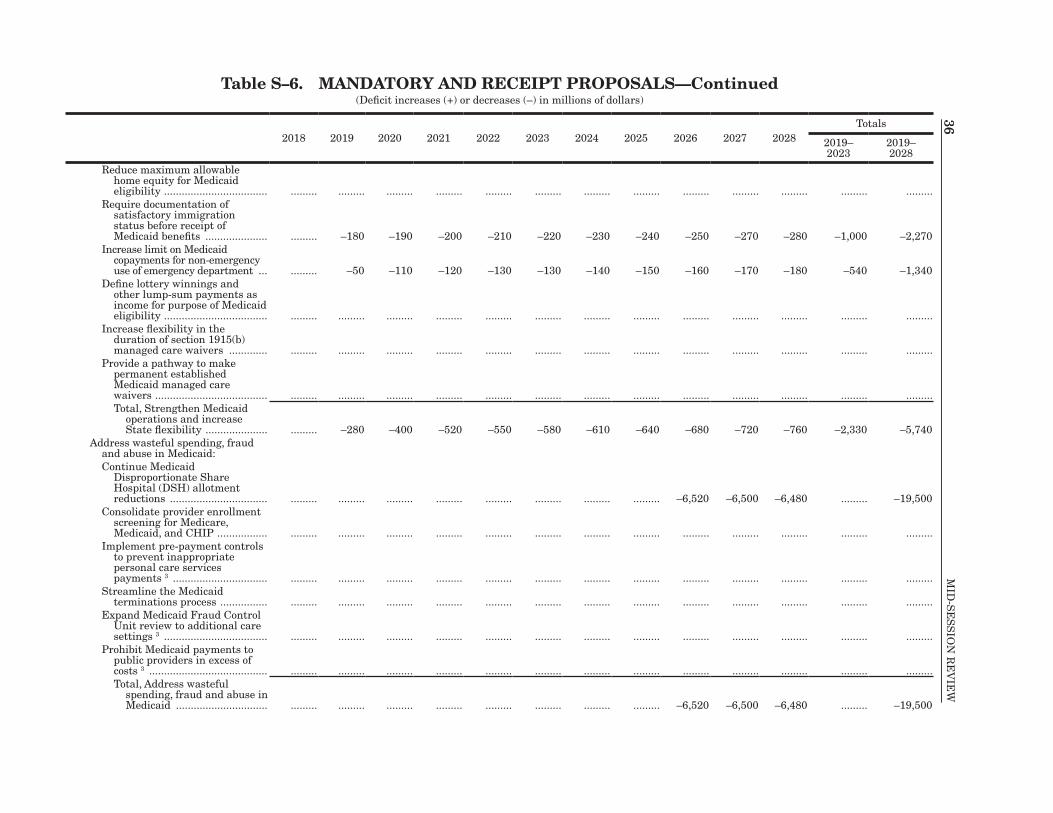
36M
ID-S
ES
SIO
N R
EV
IEW
36Table S–6. MANDATORY AND RECEIPT PROPOSALS—Continued
(Deficit increases (+) or decreases (–) in millions of dollars)
2018 2019 2020 2021 2022 2023 2024 2025 2026 2027 2028Totals
2019– 2023
2019– 2028
Reduce maximum allowable home equity for Medicaid eligibility ����������������������������������� ��������� ��������� ��������� ��������� ��������� ��������� ��������� ��������� ��������� ��������� ��������� ��������� ���������
Require documentation of satisfactory immigration status before receipt of Medicaid benefits ��������������������� ��������� –180 –190 –200 –210 –220 –230 –240 –250 –270 –280 –1,000 –2,270
Increase limit on Medicaid copayments for non-emergency use of emergency department ��� ��������� –50 –110 –120 –130 –130 –140 –150 –160 –170 –180 –540 –1,340
Define lottery winnings and other lump-sum payments as income for purpose of Medicaid eligibility ����������������������������������� ��������� ��������� ��������� ��������� ��������� ��������� ��������� ��������� ��������� ��������� ��������� ��������� ���������
Increase flexibility in the duration of section 1915(b) managed care waivers ������������� ��������� ��������� ��������� ��������� ��������� ��������� ��������� ��������� ��������� ��������� ��������� ��������� ���������
Provide a pathway to make permanent established Medicaid managed care waivers �������������������������������������� ��������� ��������� ��������� ��������� ��������� ��������� ��������� ��������� ��������� ��������� ��������� ��������� ���������Total, Strengthen Medicaid
operations and increase State flexibility ��������������������� ��������� –280 –400 –520 –550 –580 –610 –640 –680 –720 –760 –2,330 –5,740
Address wasteful spending, fraud and abuse in Medicaid:Continue Medicaid
Disproportionate Share Hospital (DSH) allotment reductions ��������������������������������� ��������� ��������� ��������� ��������� ��������� ��������� ��������� ��������� –6,520 –6,500 –6,480 ��������� –19,500
Consolidate provider enrollment screening for Medicare, Medicaid, and CHIP ����������������� ��������� ��������� ��������� ��������� ��������� ��������� ��������� ��������� ��������� ��������� ��������� ��������� ���������
Implement pre-payment controls to prevent inappropriate personal care services payments 3 �������������������������������� ��������� ��������� ��������� ��������� ��������� ��������� ��������� ��������� ��������� ��������� ��������� ��������� ���������
Streamline the Medicaid terminations process ���������������� ��������� ��������� ��������� ��������� ��������� ��������� ��������� ��������� ��������� ��������� ��������� ��������� ���������
Expand Medicaid Fraud Control Unit review to additional care settings 3 ����������������������������������� ��������� ��������� ��������� ��������� ��������� ��������� ��������� ��������� ��������� ��������� ��������� ��������� ���������
Prohibit Medicaid payments to public providers in excess of costs 3 ���������������������������������������� ��������� ��������� ��������� ��������� ��������� ��������� ��������� ��������� ��������� ��������� ��������� ��������� ���������Total, Address wasteful
spending, fraud and abuse in Medicaid ������������������������������� ��������� ��������� ��������� ��������� ��������� ��������� ��������� ��������� –6,520 –6,500 –6,480 ��������� –19,500
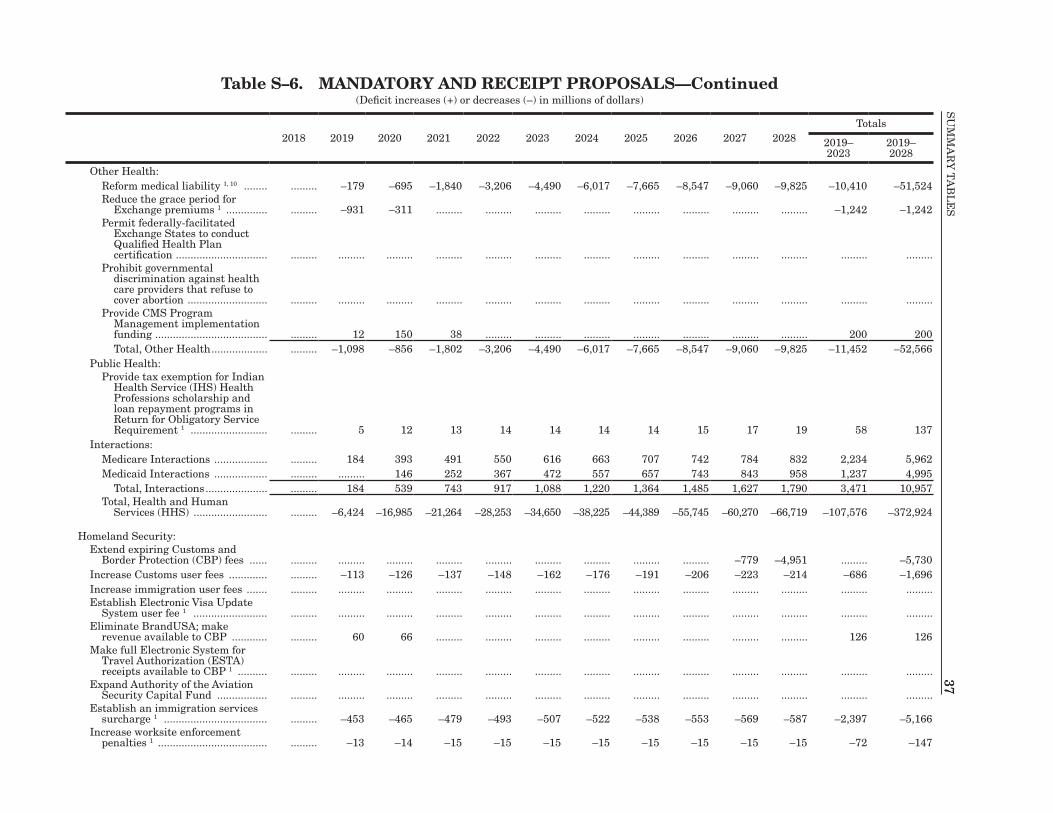
37S
UM
MA
Ry
TA
BL
ES
37Table S–6. MANDATORY AND RECEIPT PROPOSALS—Continued
(Deficit increases (+) or decreases (–) in millions of dollars)
2018 2019 2020 2021 2022 2023 2024 2025 2026 2027 2028Totals
2019– 2023
2019– 2028
Other Health:Reform medical liability 1, 10 �������� ��������� –179 –695 –1,840 –3,206 –4,490 –6,017 –7,665 –8,547 –9,060 –9,825 –10,410 –51,524Reduce the grace period for
Exchange premiums 1 �������������� ��������� –931 –311 ��������� ��������� ��������� ��������� ��������� ��������� ��������� ��������� –1,242 –1,242Permit federally-facilitated
Exchange States to conduct Qualified Health Plan certification ������������������������������� ��������� ��������� ��������� ��������� ��������� ��������� ��������� ��������� ��������� ��������� ��������� ��������� ���������
Prohibit governmental discrimination against health care providers that refuse to cover abortion ��������������������������� ��������� ��������� ��������� ��������� ��������� ��������� ��������� ��������� ��������� ��������� ��������� ��������� ���������
Provide CMS Program Management implementation funding �������������������������������������� ��������� 12 150 38 ��������� ��������� ��������� ��������� ��������� ��������� ��������� 200 200Total, Other Health ������������������� ��������� –1,098 –856 –1,802 –3,206 –4,490 –6,017 –7,665 –8,547 –9,060 –9,825 –11,452 –52,566
Public Health:Provide tax exemption for Indian
Health Service (IHS) Health Professions scholarship and loan repayment programs in Return for Obligatory Service Requirement 1 �������������������������� ��������� 5 12 13 14 14 14 14 15 17 19 58 137
Interactions:Medicare Interactions ������������������ ��������� 184 393 491 550 616 663 707 742 784 832 2,234 5,962Medicaid Interactions ������������������ ��������� ��������� 146 252 367 472 557 657 743 843 958 1,237 4,995
Total, Interactions ��������������������� ��������� 184 539 743 917 1,088 1,220 1,364 1,485 1,627 1,790 3,471 10,957Total, Health and Human
Services (HHS) ������������������������� ��������� –6,424 –16,985 –21,264 –28,253 –34,650 –38,225 –44,389 –55,745 –60,270 –66,719 –107,576 –372,924
Homeland Security:Extend expiring Customs and
Border Protection (CBP) fees ������ ��������� ��������� ��������� ��������� ��������� ��������� ��������� ��������� ��������� –779 –4,951 ��������� –5,730Increase Customs user fees ������������� ��������� –113 –126 –137 –148 –162 –176 –191 –206 –223 –214 –686 –1,696Increase immigration user fees ������� ��������� ��������� ��������� ��������� ��������� ��������� ��������� ��������� ��������� ��������� ��������� ��������� ���������Establish Electronic Visa Update
System user fee 1 ������������������������� ��������� ��������� ��������� ��������� ��������� ��������� ��������� ��������� ��������� ��������� ��������� ��������� ���������Eliminate BrandUSA; make
revenue available to CBP ������������ ��������� 60 66 ��������� ��������� ��������� ��������� ��������� ��������� ��������� ��������� 126 126Make full Electronic System for
Travel Authorization (ESTA) receipts available to CBP 1 ���������� ��������� ��������� ��������� ��������� ��������� ��������� ��������� ��������� ��������� ��������� ��������� ��������� ���������
Expand Authority of the Aviation Security Capital Fund ����������������� ��������� ��������� ��������� ��������� ��������� ��������� ��������� ��������� ��������� ��������� ��������� ��������� ���������
Establish an immigration services surcharge 1 ����������������������������������� ��������� –453 –465 –479 –493 –507 –522 –538 –553 –569 –587 –2,397 –5,166
Increase worksite enforcement penalties 1 ������������������������������������� ��������� –13 –14 –15 –15 –15 –15 –15 –15 –15 –15 –72 –147
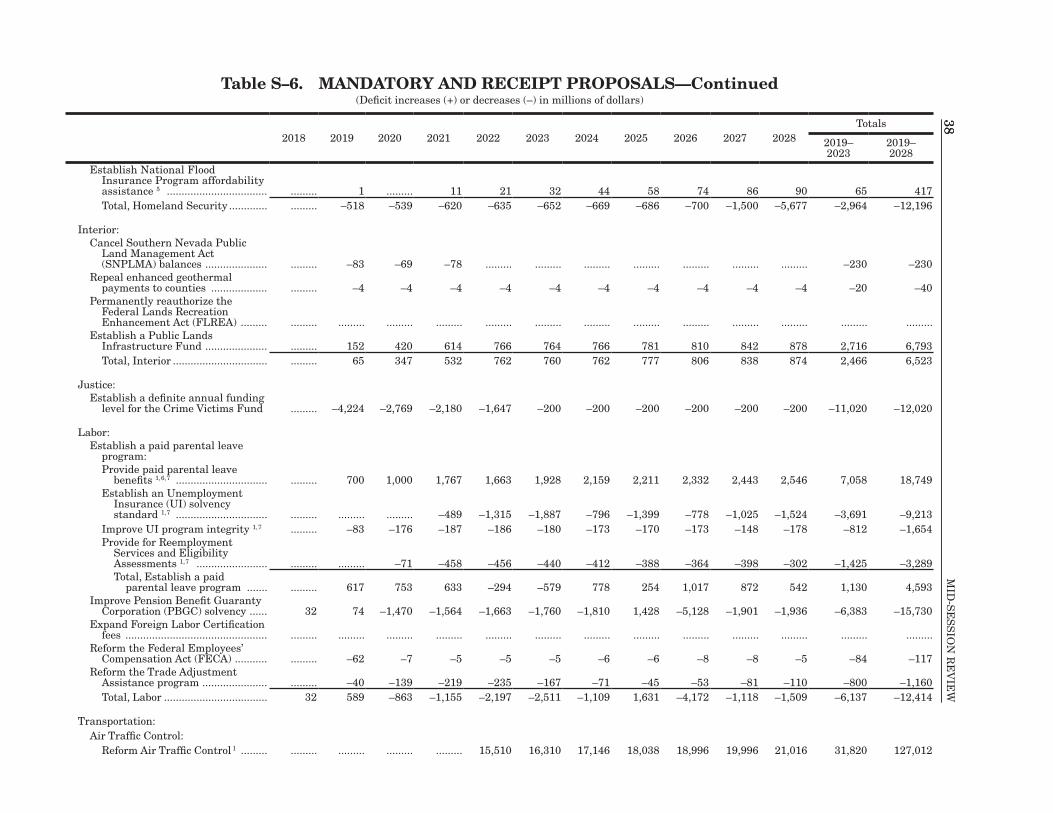
38M
ID-S
ES
SIO
N R
EV
IEW
38Table S–6. MANDATORY AND RECEIPT PROPOSALS—Continued
(Deficit increases (+) or decreases (–) in millions of dollars)
2018 2019 2020 2021 2022 2023 2024 2025 2026 2027 2028Totals
2019– 2023
2019– 2028
Establish National Flood Insurance Program affordability assistance 5 ���������������������������������� ��������� 1 ��������� 11 21 32 44 58 74 86 90 65 417Total, Homeland Security ������������� ��������� –518 –539 –620 –635 –652 –669 –686 –700 –1,500 –5,677 –2,964 –12,196
Interior:Cancel Southern Nevada Public
Land Management Act (SNPLMA) balances ��������������������� ��������� –83 –69 –78 ��������� ��������� ��������� ��������� ��������� ��������� ��������� –230 –230
Repeal enhanced geothermal payments to counties ������������������� ��������� –4 –4 –4 –4 –4 –4 –4 –4 –4 –4 –20 –40
Permanently reauthorize the Federal Lands Recreation Enhancement Act (FLREA) ��������� ��������� ��������� ��������� ��������� ��������� ��������� ��������� ��������� ��������� ��������� ��������� ��������� ���������
Establish a Public Lands Infrastructure Fund ��������������������� ��������� 152 420 614 766 764 766 781 810 842 878 2,716 6,793Total, Interior �������������������������������� ��������� 65 347 532 762 760 762 777 806 838 874 2,466 6,523
Justice:Establish a definite annual funding
level for the Crime Victims Fund ��������� –4,224 –2,769 –2,180 –1,647 –200 –200 –200 –200 –200 –200 –11,020 –12,020
Labor:Establish a paid parental leave
program:Provide paid parental leave
benefits 1, 6, 7 ������������������������������� ��������� 700 1,000 1,767 1,663 1,928 2,159 2,211 2,332 2,443 2,546 7,058 18,749Establish an Unemployment
Insurance (UI) solvency standard 1, 7 ������������������������������� ��������� ��������� ��������� –489 –1,315 –1,887 –796 –1,399 –778 –1,025 –1,524 –3,691 –9,213
Improve UI program integrity 1, 7 ��������� –83 –176 –187 –186 –180 –173 –170 –173 –148 –178 –812 –1,654Provide for Reemployment
Services and Eligibility Assessments 1, 7 ������������������������ ��������� ��������� –71 –458 –456 –440 –412 –388 –364 –398 –302 –1,425 –3,289Total, Establish a paid
parental leave program ������� ��������� 617 753 633 –294 –579 778 254 1,017 872 542 1,130 4,593Improve Pension Benefit Guaranty
Corporation (PBGC) solvency ������ 32 74 –1,470 –1,564 –1,663 –1,760 –1,810 1,428 –5,128 –1,901 –1,936 –6,383 –15,730Expand Foreign Labor Certification
fees ������������������������������������������������ ��������� ��������� ��������� ��������� ��������� ��������� ��������� ��������� ��������� ��������� ��������� ��������� ���������Reform the Federal Employees’
Compensation Act (FECA) ����������� ��������� –62 –7 –5 –5 –5 –6 –6 –8 –8 –5 –84 –117Reform the Trade Adjustment
Assistance program ���������������������� ��������� –40 –139 –219 –235 –167 –71 –45 –53 –81 –110 –800 –1,160Total, Labor ����������������������������������� 32 589 –863 –1,155 –2,197 –2,511 –1,109 1,631 –4,172 –1,118 –1,509 –6,137 –12,414
Transportation:Air Traffic Control:
Reform Air Traffic Control 1 ��������� ��������� ��������� ��������� ��������� 15,510 16,310 17,146 18,038 18,996 19,996 21,016 31,820 127,012
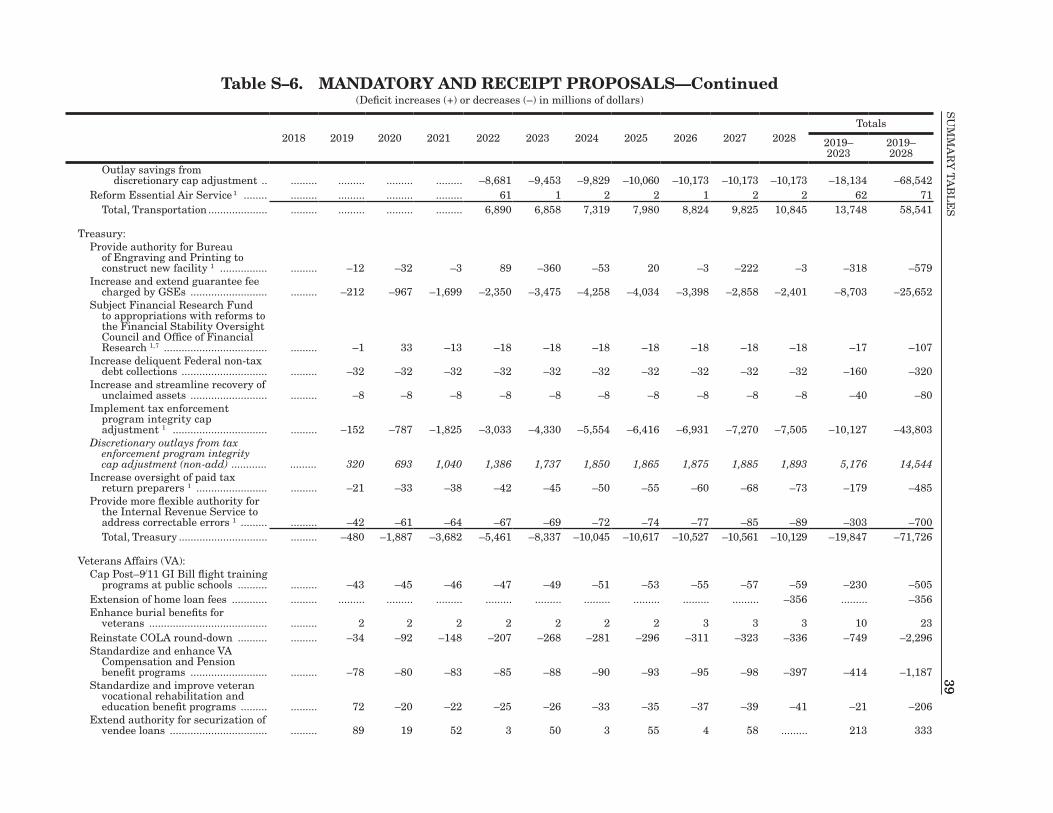
39S
UM
MA
Ry
TA
BL
ES
39Table S–6. MANDATORY AND RECEIPT PROPOSALS—Continued
(Deficit increases (+) or decreases (–) in millions of dollars)
2018 2019 2020 2021 2022 2023 2024 2025 2026 2027 2028Totals
2019– 2023
2019– 2028
Outlay savings from discretionary cap adjustment �� ��������� ��������� ��������� ��������� –8,681 –9,453 –9,829 –10,060 –10,173 –10,173 –10,173 –18,134 –68,542
Reform Essential Air Service 1 �������� ��������� ��������� ��������� ��������� 61 1 2 2 1 2 2 62 71Total, Transportation �������������������� ��������� ��������� ��������� ��������� 6,890 6,858 7,319 7,980 8,824 9,825 10,845 13,748 58,541
Treasury:Provide authority for Bureau
of Engraving and Printing to construct new facility 1 ���������������� ��������� –12 –32 –3 89 –360 –53 20 –3 –222 –3 –318 –579
Increase and extend guarantee fee charged by GSEs �������������������������� ��������� –212 –967 –1,699 –2,350 –3,475 –4,258 –4,034 –3,398 –2,858 –2,401 –8,703 –25,652
Subject Financial Research Fund to appropriations with reforms to the Financial Stability Oversight Council and Office of Financial Research 1, 7 ����������������������������������� ��������� –1 33 –13 –18 –18 –18 –18 –18 –18 –18 –17 –107
Increase deliquent Federal non-tax debt collections ����������������������������� ��������� –32 –32 –32 –32 –32 –32 –32 –32 –32 –32 –160 –320
Increase and streamline recovery of unclaimed assets �������������������������� ��������� –8 –8 –8 –8 –8 –8 –8 –8 –8 –8 –40 –80
Implement tax enforcement program integrity cap adjustment 1 �������������������������������� ��������� –152 –787 –1,825 –3,033 –4,330 –5,554 –6,416 –6,931 –7,270 –7,505 –10,127 –43,803
Discretionary outlays from tax enforcement program integrity cap adjustment (non-add) ������������ ��������� 320 693 1,040 1,386 1,737 1,850 1,865 1,875 1,885 1,893 5,176 14,544
Increase oversight of paid tax return preparers 1 ������������������������ ��������� –21 –33 –38 –42 –45 –50 –55 –60 –68 –73 –179 –485
Provide more flexible authority for the Internal Revenue Service to address correctable errors 1 ��������� ��������� –42 –61 –64 –67 –69 –72 –74 –77 –85 –89 –303 –700Total, Treasury ������������������������������ ��������� –480 –1,887 –3,682 –5,461 –8,337 –10,045 –10,617 –10,527 –10,561 –10,129 –19,847 –71,726
Veterans Affairs (VA):Cap Post–9/11 GI Bill flight training
programs at public schools ���������� ��������� –43 –45 –46 –47 –49 –51 –53 –55 –57 –59 –230 –505Extension of home loan fees ������������ ��������� ��������� ��������� ��������� ��������� ��������� ��������� ��������� ��������� ��������� –356 ��������� –356Enhance burial benefits for
veterans ���������������������������������������� ��������� 2 2 2 2 2 2 2 3 3 3 10 23Reinstate COLA round-down ���������� ��������� –34 –92 –148 –207 –268 –281 –296 –311 –323 –336 –749 –2,296Standardize and enhance VA
Compensation and Pension benefit programs �������������������������� ��������� –78 –80 –83 –85 –88 –90 –93 –95 –98 –397 –414 –1,187
Standardize and improve veteran vocational rehabilitation and education benefit programs ��������� ��������� 72 –20 –22 –25 –26 –33 –35 –37 –39 –41 –21 –206
Extend authority for securization of vendee loans ��������������������������������� ��������� 89 19 52 3 50 3 55 4 58 ��������� 213 333
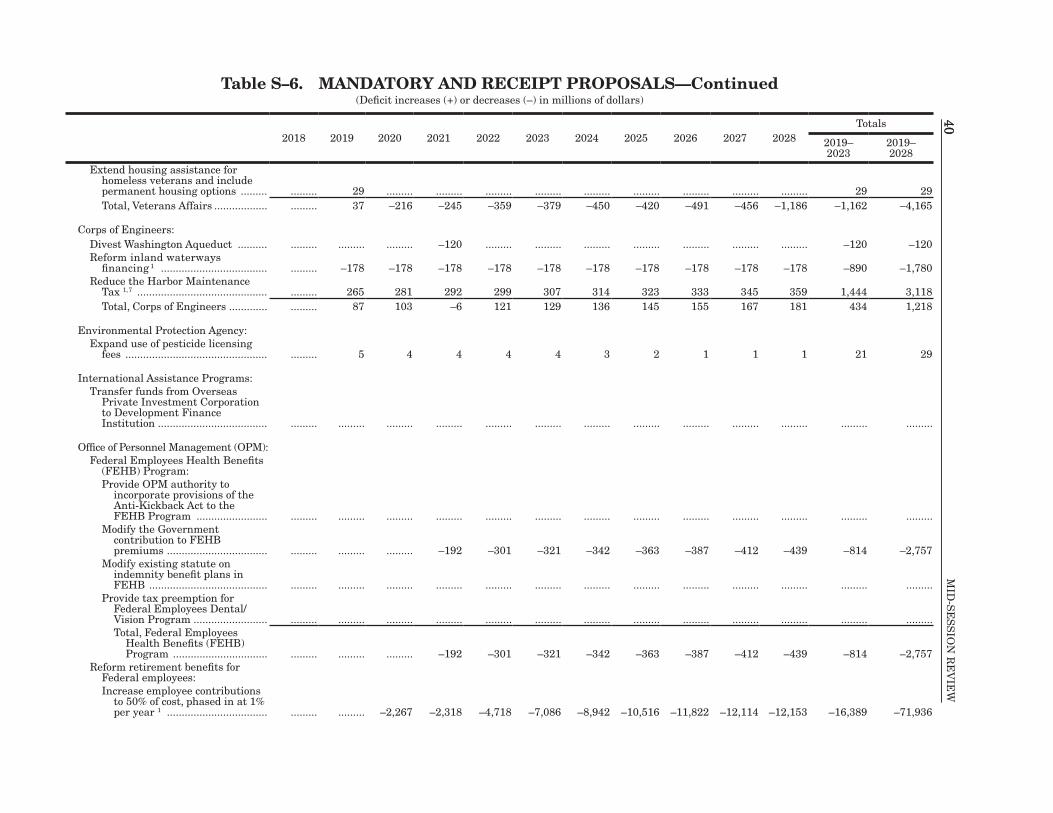
40M
ID-S
ES
SIO
N R
EV
IEW
40Table S–6. MANDATORY AND RECEIPT PROPOSALS—Continued
(Deficit increases (+) or decreases (–) in millions of dollars)
2018 2019 2020 2021 2022 2023 2024 2025 2026 2027 2028Totals
2019– 2023
2019– 2028
Extend housing assistance for homeless veterans and include permanent housing options ��������� ��������� 29 ��������� ��������� ��������� ��������� ��������� ��������� ��������� ��������� ��������� 29 29Total, Veterans Affairs ������������������ ��������� 37 –216 –245 –359 –379 –450 –420 –491 –456 –1,186 –1,162 –4,165
Corps of Engineers:Divest Washington Aqueduct ���������� ��������� ��������� ��������� –120 ��������� ��������� ��������� ��������� ��������� ��������� ��������� –120 –120Reform inland waterways
financing 1 ������������������������������������ ��������� –178 –178 –178 –178 –178 –178 –178 –178 –178 –178 –890 –1,780Reduce the Harbor Maintenance
Tax 1, 7 �������������������������������������������� ��������� 265 281 292 299 307 314 323 333 345 359 1,444 3,118Total, Corps of Engineers ������������� ��������� 87 103 –6 121 129 136 145 155 167 181 434 1,218
Environmental Protection Agency:Expand use of pesticide licensing
fees ������������������������������������������������ ��������� 5 4 4 4 4 3 2 1 1 1 21 29
International Assistance Programs:Transfer funds from Overseas
Private Investment Corporation to Development Finance Institution ������������������������������������� ��������� ��������� ��������� ��������� ��������� ��������� ��������� ��������� ��������� ��������� ��������� ��������� ���������
Office of Personnel Management (OPM):Federal Employees Health Benefits
(FEHB) Program:Provide OPM authority to
incorporate provisions of the Anti-Kickback Act to the FEHB Program ������������������������ ��������� ��������� ��������� ��������� ��������� ��������� ��������� ��������� ��������� ��������� ��������� ��������� ���������
Modify the Government contribution to FEHB premiums ���������������������������������� ��������� ��������� ��������� –192 –301 –321 –342 –363 –387 –412 –439 –814 –2,757
Modify existing statute on indemnity benefit plans in FEHB ���������������������������������������� ��������� ��������� ��������� ��������� ��������� ��������� ��������� ��������� ��������� ��������� ��������� ��������� ���������
Provide tax preemption for Federal Employees Dental/Vision Program ������������������������� ��������� ��������� ��������� ��������� ��������� ��������� ��������� ��������� ��������� ��������� ��������� ��������� ���������Total, Federal Employees
Health Benefits (FEHB) Program �������������������������������� ��������� ��������� ��������� –192 –301 –321 –342 –363 –387 –412 –439 –814 –2,757
Reform retirement benefits for Federal employees:Increase employee contributions
to 50% of cost, phased in at 1% per year 1 ���������������������������������� ��������� ��������� –2,267 –2,318 –4,718 –7,086 –8,942 –10,516 –11,822 –12,114 –12,153 –16,389 –71,936
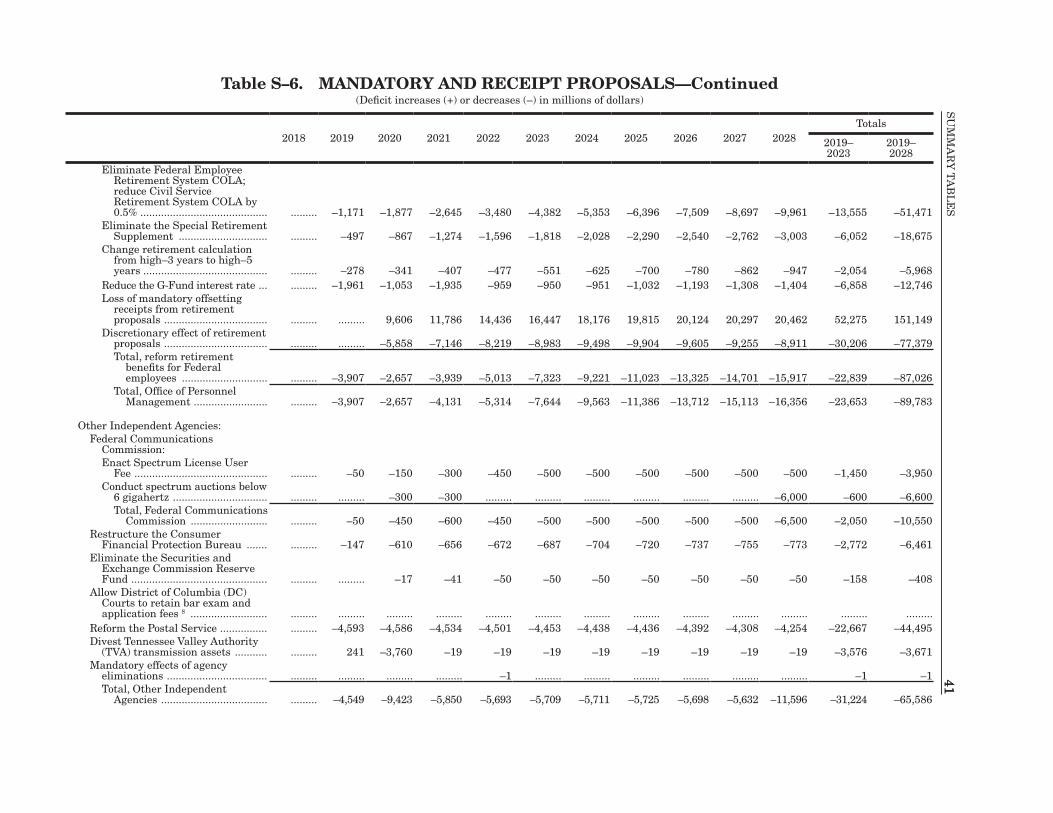
41S
UM
MA
Ry
TA
BL
ES
41Table S–6. MANDATORY AND RECEIPT PROPOSALS—Continued
(Deficit increases (+) or decreases (–) in millions of dollars)
2018 2019 2020 2021 2022 2023 2024 2025 2026 2027 2028Totals
2019– 2023
2019– 2028
Eliminate Federal Employee Retirement System COLA; reduce Civil Service Retirement System COLA by 0�5% ������������������������������������������� ��������� –1,171 –1,877 –2,645 –3,480 –4,382 –5,353 –6,396 –7,509 –8,697 –9,961 –13,555 –51,471
Eliminate the Special Retirement Supplement ������������������������������ ��������� –497 –867 –1,274 –1,596 –1,818 –2,028 –2,290 –2,540 –2,762 –3,003 –6,052 –18,675
Change retirement calculation from high–3 years to high–5 years ������������������������������������������ ��������� –278 –341 –407 –477 –551 –625 –700 –780 –862 –947 –2,054 –5,968
Reduce the G-Fund interest rate ��� ��������� –1,961 –1,053 –1,935 –959 –950 –951 –1,032 –1,193 –1,308 –1,404 –6,858 –12,746Loss of mandatory offsetting
receipts from retirement proposals ����������������������������������� ��������� ��������� 9,606 11,786 14,436 16,447 18,176 19,815 20,124 20,297 20,462 52,275 151,149
Discretionary effect of retirement proposals ����������������������������������� ��������� ��������� –5,858 –7,146 –8,219 –8,983 –9,498 –9,904 –9,605 –9,255 –8,911 –30,206 –77,379Total, reform retirement
benefits for Federal employees ����������������������������� ��������� –3,907 –2,657 –3,939 –5,013 –7,323 –9,221 –11,023 –13,325 –14,701 –15,917 –22,839 –87,026
Total, Office of Personnel Management ������������������������� ��������� –3,907 –2,657 –4,131 –5,314 –7,644 –9,563 –11,386 –13,712 –15,113 –16,356 –23,653 –89,783
Other Independent Agencies:Federal Communications
Commission:Enact Spectrum License User
Fee ��������������������������������������������� ��������� –50 –150 –300 –450 –500 –500 –500 –500 –500 –500 –1,450 –3,950Conduct spectrum auctions below
6 gigahertz �������������������������������� ��������� ��������� –300 –300 ��������� ��������� ��������� ��������� ��������� ��������� –6,000 –600 –6,600Total, Federal Communications
Commission �������������������������� ��������� –50 –450 –600 –450 –500 –500 –500 –500 –500 –6,500 –2,050 –10,550Restructure the Consumer
Financial Protection Bureau ������� ��������� –147 –610 –656 –672 –687 –704 –720 –737 –755 –773 –2,772 –6,461Eliminate the Securities and
Exchange Commission Reserve Fund ���������������������������������������������� ��������� ��������� –17 –41 –50 –50 –50 –50 –50 –50 –50 –158 –408
Allow District of Columbia (DC) Courts to retain bar exam and application fees 8 �������������������������� ��������� ��������� ��������� ��������� ��������� ��������� ��������� ��������� ��������� ��������� ��������� ��������� ���������
Reform the Postal Service ���������������� ��������� –4,593 –4,586 –4,534 –4,501 –4,453 –4,438 –4,436 –4,392 –4,308 –4,254 –22,667 –44,495Divest Tennessee Valley Authority
(TVA) transmission assets ����������� ��������� 241 –3,760 –19 –19 –19 –19 –19 –19 –19 –19 –3,576 –3,671Mandatory effects of agency
eliminations ���������������������������������� ��������� ��������� ��������� ��������� –1 ��������� ��������� ��������� ��������� ��������� ��������� –1 –1Total, Other Independent
Agencies ������������������������������������ ��������� –4,549 –9,423 –5,850 –5,693 –5,709 –5,711 –5,725 –5,698 –5,632 –11,596 –31,224 –65,586
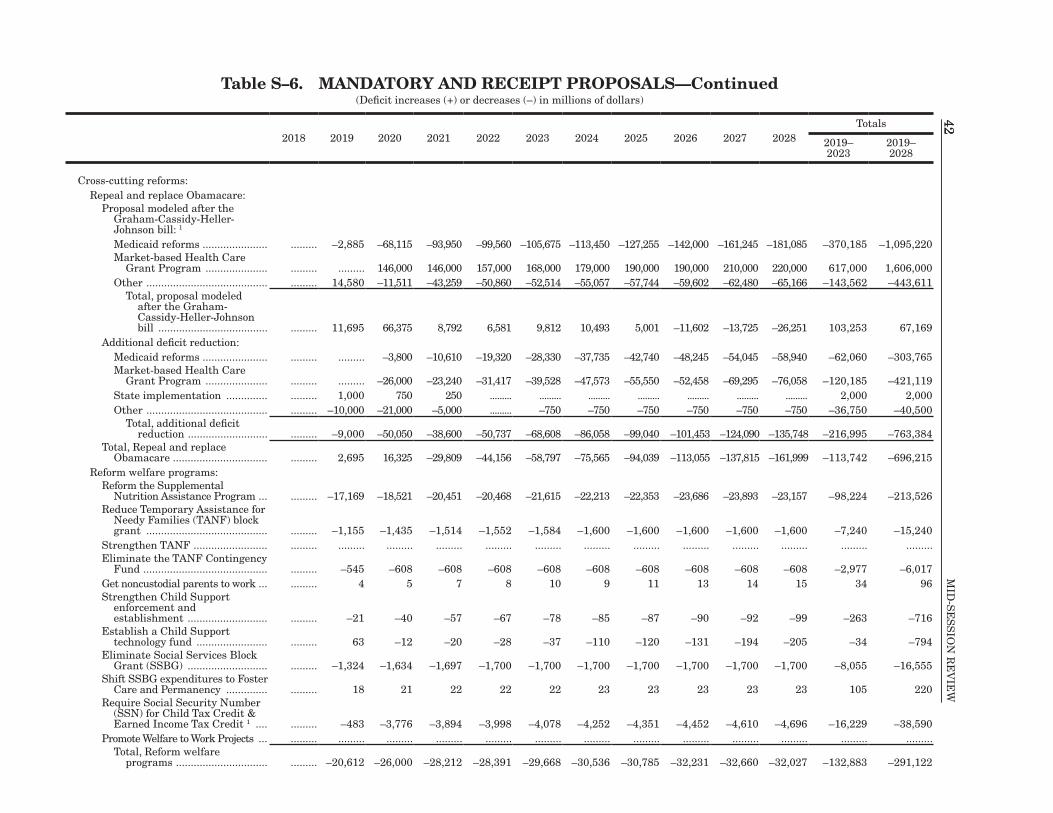
42M
ID-S
ES
SIO
N R
EV
IEW
42Table S–6. MANDATORY AND RECEIPT PROPOSALS—Continued
(Deficit increases (+) or decreases (–) in millions of dollars)
2018 2019 2020 2021 2022 2023 2024 2025 2026 2027 2028Totals
2019– 2023
2019– 2028
Cross-cutting reforms:Repeal and replace Obamacare:
Proposal modeled after the Graham-Cassidy-Heller-Johnson bill: 1 Medicaid reforms ���������������������� ��������� –2,885 –68,115 –93,950 –99,560 –105,675 –113,450 –127,255 –142,000 –161,245 –181,085 –370,185 –1,095,220Market-based Health Care
Grant Program ��������������������� ��������� ��������� 146,000 146,000 157,000 168,000 179,000 190,000 190,000 210,000 220,000 617,000 1,606,000Other ����������������������������������������� ��������� 14,580 –11,511 –43,259 –50,860 –52,514 –55,057 –57,744 –59,602 –62,480 –65,166 –143,562 –443,611
Total, proposal modeled after the Graham-Cassidy-Heller-Johnson bill ������������������������������������� ��������� 11,695 66,375 8,792 6,581 9,812 10,493 5,001 –11,602 –13,725 –26,251 103,253 67,169
Additional deficit reduction:Medicaid reforms ���������������������� ��������� ��������� –3,800 –10,610 –19,320 –28,330 –37,735 –42,740 –48,245 –54,045 –58,940 –62,060 –303,765Market-based Health Care
Grant Program ��������������������� ��������� ��������� –26,000 –23,240 –31,417 –39,528 –47,573 –55,550 –52,458 –69,295 –76,058 –120,185 –421,119State implementation �������������� ��������� 1,000 750 250 ��������� ��������� ��������� ��������� ��������� ��������� ��������� 2,000 2,000Other ����������������������������������������� ��������� –10,000 –21,000 –5,000 ��������� –750 –750 –750 –750 –750 –750 –36,750 –40,500
Total, additional deficit reduction ��������������������������� ��������� –9,000 –50,050 –38,600 –50,737 –68,608 –86,058 –99,040 –101,453 –124,090 –135,748 –216,995 –763,384
Total, Repeal and replace Obamacare �������������������������������� ��������� 2,695 16,325 –29,809 –44,156 –58,797 –75,565 –94,039 –113,055 –137,815 –161,999 –113,742 –696,215
Reform welfare programs:Reform the Supplemental
Nutrition Assistance Program ��� ��������� –17,169 –18,521 –20,451 –20,468 –21,615 –22,213 –22,353 –23,686 –23,893 –23,157 –98,224 –213,526Reduce Temporary Assistance for
Needy Families (TANF) block grant ����������������������������������������� ��������� –1,155 –1,435 –1,514 –1,552 –1,584 –1,600 –1,600 –1,600 –1,600 –1,600 –7,240 –15,240
Strengthen TANF ������������������������� ��������� ��������� ��������� ��������� ��������� ��������� ��������� ��������� ��������� ��������� ��������� ��������� ���������Eliminate the TANF Contingency
Fund ������������������������������������������ ��������� –545 –608 –608 –608 –608 –608 –608 –608 –608 –608 –2,977 –6,017Get noncustodial parents to work ��� ��������� 4 5 7 8 10 9 11 13 14 15 34 96Strengthen Child Support
enforcement and establishment ��������������������������� ��������� –21 –40 –57 –67 –78 –85 –87 –90 –92 –99 –263 –716
Establish a Child Support technology fund ������������������������ ��������� 63 –12 –20 –28 –37 –110 –120 –131 –194 –205 –34 –794
Eliminate Social Services Block Grant (SSBG) ��������������������������� ��������� –1,324 –1,634 –1,697 –1,700 –1,700 –1,700 –1,700 –1,700 –1,700 –1,700 –8,055 –16,555
Shift SSBG expenditures to Foster Care and Permanency �������������� ��������� 18 21 22 22 22 23 23 23 23 23 105 220
Require Social Security Number (SSN) for Child Tax Credit & Earned Income Tax Credit 1 ���� ��������� –483 –3,776 –3,894 –3,998 –4,078 –4,252 –4,351 –4,452 –4,610 –4,696 –16,229 –38,590
Promote Welfare to Work Projects ��� ��������� ��������� ��������� ��������� ��������� ��������� ��������� ��������� ��������� ��������� ��������� ��������� ���������Total, Reform welfare
programs ������������������������������� ��������� –20,612 –26,000 –28,212 –28,391 –29,668 –30,536 –30,785 –32,231 –32,660 –32,027 –132,883 –291,122
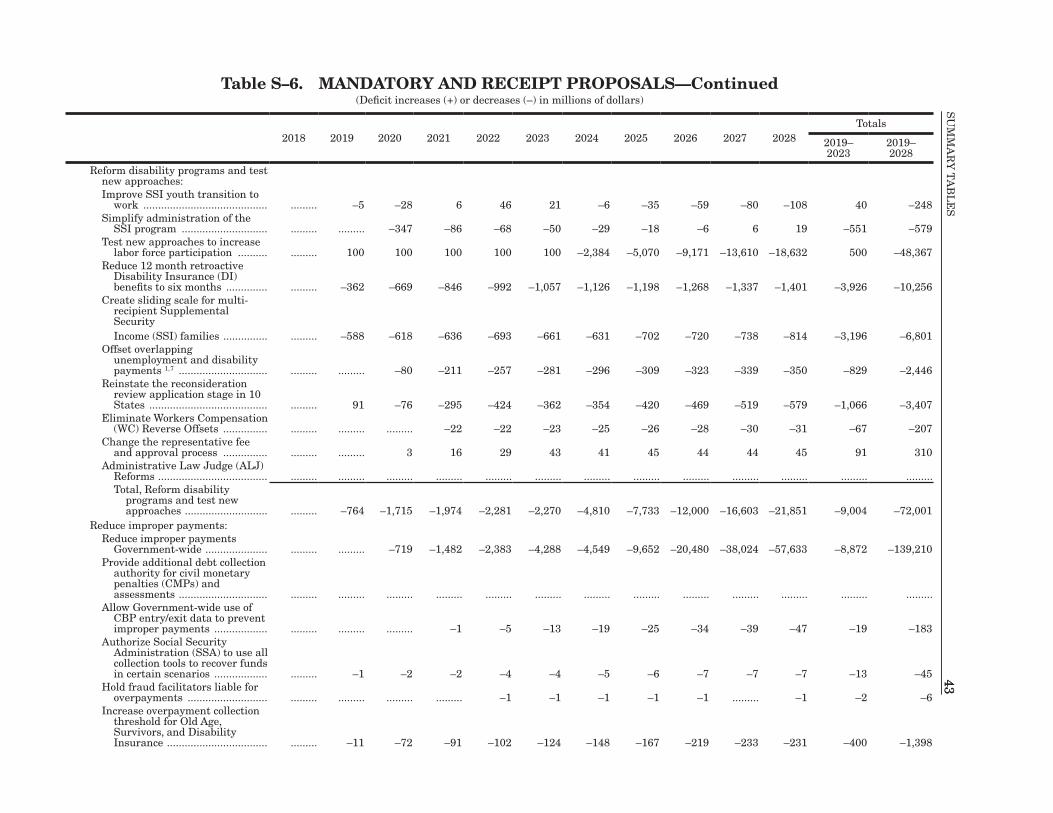
43S
UM
MA
Ry
TA
BL
ES
43Table S–6. MANDATORY AND RECEIPT PROPOSALS—Continued
(Deficit increases (+) or decreases (–) in millions of dollars)
2018 2019 2020 2021 2022 2023 2024 2025 2026 2027 2028Totals
2019– 2023
2019– 2028
Reform disability programs and test new approaches:Improve SSI youth transition to
work ������������������������������������������ ��������� –5 –28 6 46 21 –6 –35 –59 –80 –108 40 –248Simplify administration of the
SSI program ����������������������������� ��������� ��������� –347 –86 –68 –50 –29 –18 –6 6 19 –551 –579Test new approaches to increase
labor force participation ���������� ��������� 100 100 100 100 100 –2,384 –5,070 –9,171 –13,610 –18,632 500 –48,367Reduce 12 month retroactive
Disability Insurance (DI) benefits to six months �������������� ��������� –362 –669 –846 –992 –1,057 –1,126 –1,198 –1,268 –1,337 –1,401 –3,926 –10,256
Create sliding scale for multi-recipient Supplemental Security Income (SSI) families ��������������� ��������� –588 –618 –636 –693 –661 –631 –702 –720 –738 –814 –3,196 –6,801
Offset overlapping unemployment and disability payments 1, 7 ������������������������������ ��������� ��������� –80 –211 –257 –281 –296 –309 –323 –339 –350 –829 –2,446
Reinstate the reconsideration review application stage in 10 States ���������������������������������������� ��������� 91 –76 –295 –424 –362 –354 –420 –469 –519 –579 –1,066 –3,407
Eliminate Workers Compensation (WC) Reverse Offsets ��������������� ��������� ��������� ��������� –22 –22 –23 –25 –26 –28 –30 –31 –67 –207
Change the representative fee and approval process ��������������� ��������� ��������� 3 16 29 43 41 45 44 44 45 91 310
Administrative Law Judge (ALJ) Reforms ������������������������������������� ��������� ��������� ��������� ��������� ��������� ��������� ��������� ��������� ��������� ��������� ��������� ��������� ���������Total, Reform disability
programs and test new approaches ���������������������������� ��������� –764 –1,715 –1,974 –2,281 –2,270 –4,810 –7,733 –12,000 –16,603 –21,851 –9,004 –72,001
Reduce improper payments:Reduce improper payments
Government-wide ��������������������� ��������� ��������� –719 –1,482 –2,383 –4,288 –4,549 –9,652 –20,480 –38,024 –57,633 –8,872 –139,210Provide additional debt collection
authority for civil monetary penalties (CMPs) and assessments ������������������������������ ��������� ��������� ��������� ��������� ��������� ��������� ��������� ��������� ��������� ��������� ��������� ��������� ���������
Allow Government-wide use of CBP entry/exit data to prevent improper payments ������������������ ��������� ��������� ��������� –1 –5 –13 –19 –25 –34 –39 –47 –19 –183
Authorize Social Security Administration (SSA) to use all collection tools to recover funds in certain scenarios ������������������ ��������� –1 –2 –2 –4 –4 –5 –6 –7 –7 –7 –13 –45
Hold fraud facilitators liable for overpayments ��������������������������� ��������� ��������� ��������� ��������� –1 –1 –1 –1 –1 ��������� –1 –2 –6
Increase overpayment collection threshold for Old Age, Survivors, and Disability Insurance ���������������������������������� ��������� –11 –72 –91 –102 –124 –148 –167 –219 –233 –231 –400 –1,398
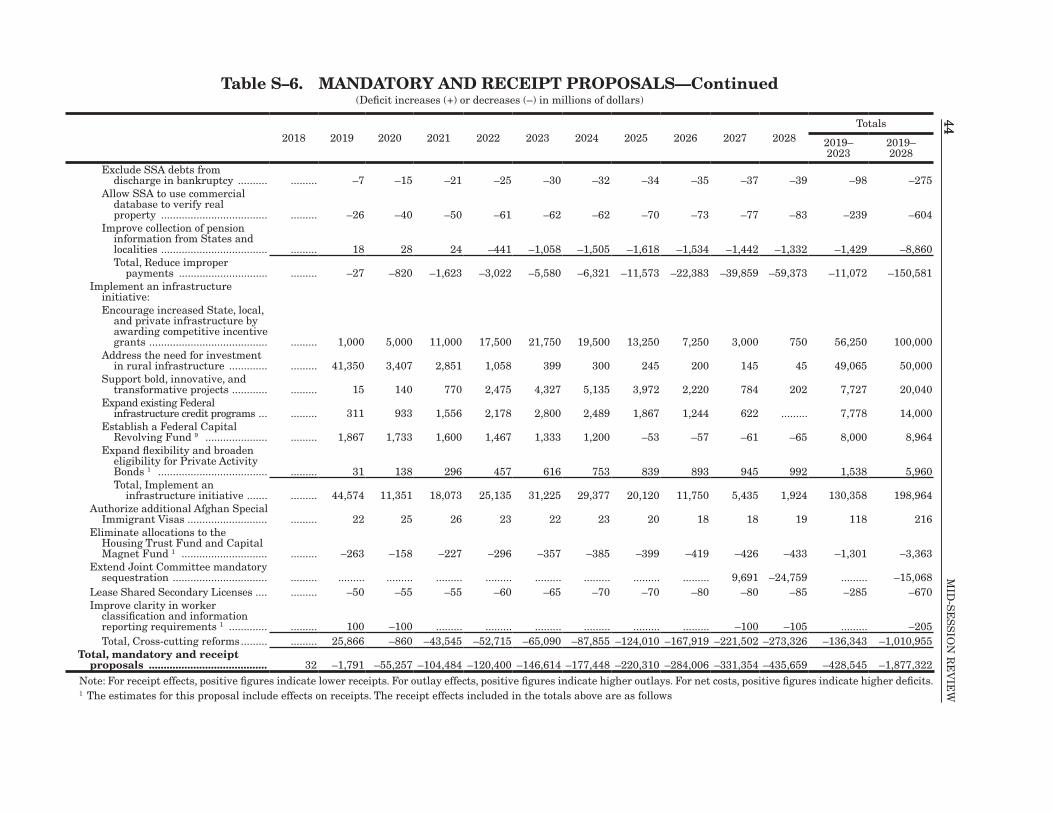
44M
ID-S
ES
SIO
N R
EV
IEW
44Table S–6. MANDATORY AND RECEIPT PROPOSALS—Continued
(Deficit increases (+) or decreases (–) in millions of dollars)
2018 2019 2020 2021 2022 2023 2024 2025 2026 2027 2028Totals
2019– 2023
2019– 2028
Exclude SSA debts from discharge in bankruptcy ���������� ��������� –7 –15 –21 –25 –30 –32 –34 –35 –37 –39 –98 –275
Allow SSA to use commercial database to verify real property ������������������������������������ ��������� –26 –40 –50 –61 –62 –62 –70 –73 –77 –83 –239 –604
Improve collection of pension information from States and localities ������������������������������������ ��������� 18 28 24 –441 –1,058 –1,505 –1,618 –1,534 –1,442 –1,332 –1,429 –8,860Total, Reduce improper
payments ������������������������������ ��������� –27 –820 –1,623 –3,022 –5,580 –6,321 –11,573 –22,383 –39,859 –59,373 –11,072 –150,581Implement an infrastructure
initiative:Encourage increased State, local,
and private infrastructure by awarding competitive incentive grants ���������������������������������������� ��������� 1,000 5,000 11,000 17,500 21,750 19,500 13,250 7,250 3,000 750 56,250 100,000
Address the need for investment in rural infrastructure ������������� ��������� 41,350 3,407 2,851 1,058 399 300 245 200 145 45 49,065 50,000
Support bold, innovative, and transformative projects ������������ ��������� 15 140 770 2,475 4,327 5,135 3,972 2,220 784 202 7,727 20,040
Expand existing Federal infrastructure credit programs ��� ��������� 311 933 1,556 2,178 2,800 2,489 1,867 1,244 622 ��������� 7,778 14,000
Establish a Federal Capital Revolving Fund 9 ��������������������� ��������� 1,867 1,733 1,600 1,467 1,333 1,200 –53 –57 –61 –65 8,000 8,964
Expand flexibility and broaden eligibility for Private Activity Bonds 1 ������������������������������������� ��������� 31 138 296 457 616 753 839 893 945 992 1,538 5,960Total, Implement an
infrastructure initiative ������� ��������� 44,574 11,351 18,073 25,135 31,225 29,377 20,120 11,750 5,435 1,924 130,358 198,964Authorize additional Afghan Special
Immigrant Visas ��������������������������� ��������� 22 25 26 23 22 23 20 18 18 19 118 216Eliminate allocations to the
Housing Trust Fund and Capital Magnet Fund 1 ����������������������������� ��������� –263 –158 –227 –296 –357 –385 –399 –419 –426 –433 –1,301 –3,363
Extend Joint Committee mandatory sequestration �������������������������������� ��������� ��������� ��������� ��������� ��������� ��������� ��������� ��������� ��������� 9,691 –24,759 ��������� –15,068
Lease Shared Secondary Licenses ���� ��������� –50 –55 –55 –60 –65 –70 –70 –80 –80 –85 –285 –670Improve clarity in worker
classification and information reporting requirements 1 ������������� ��������� 100 –100 ��������� ��������� ��������� ��������� ��������� ��������� –100 –105 ��������� –205Total, Cross-cutting reforms ��������� ��������� 25,866 –860 –43,545 –52,715 –65,090 –87,855 –124,010 –167,919 –221,502 –273,326 –136,343 –1,010,955
Total, mandatory and receipt proposals ........................................ 32 –1,791 –55,257 –104,484 –120,400 –146,614 –177,448 –220,310 –284,006 –331,354 –435,659 –428,545 –1,877,322
Note: For receipt effects, positive figures indicate lower receipts� For outlay effects, positive figures indicate higher outlays� For net costs, positive figures indicate higher deficits�1 The estimates for this proposal include effects on receipts� The receipt effects included in the totals above are as follows
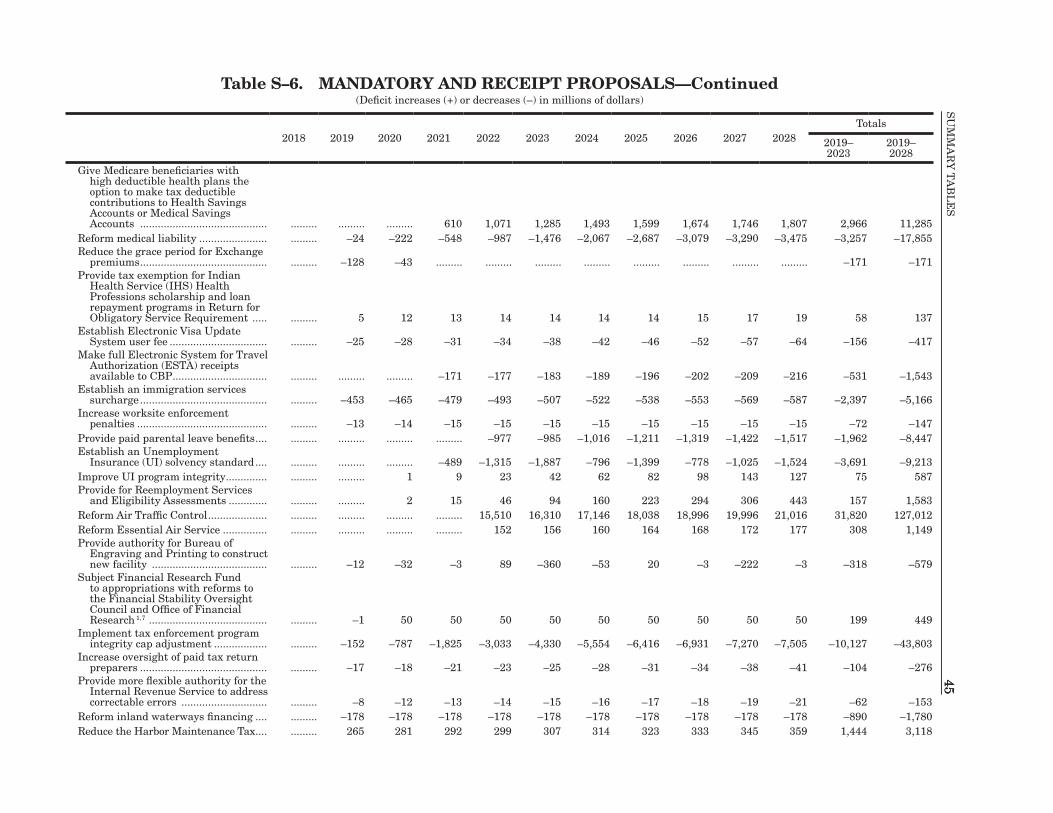
45S
UM
MA
Ry
TA
BL
ES
45Table S–6. MANDATORY AND RECEIPT PROPOSALS—Continued
(Deficit increases (+) or decreases (–) in millions of dollars)
2018 2019 2020 2021 2022 2023 2024 2025 2026 2027 2028Totals
2019– 2023
2019– 2028
Give Medicare beneficiaries with high deductible health plans the option to make tax deductible contributions to Health Savings Accounts or Medical Savings Accounts ������������������������������������������� ��������� ��������� ��������� 610 1,071 1,285 1,493 1,599 1,674 1,746 1,807 2,966 11,285
Reform medical liability ����������������������� ��������� –24 –222 –548 –987 –1,476 –2,067 –2,687 –3,079 –3,290 –3,475 –3,257 –17,855Reduce the grace period for Exchange
premiums ������������������������������������������� ��������� –128 –43 ��������� ��������� ��������� ��������� ��������� ��������� ��������� ��������� –171 –171Provide tax exemption for Indian
Health Service (IHS) Health Professions scholarship and loan repayment programs in Return for Obligatory Service Requirement ����� ��������� 5 12 13 14 14 14 14 15 17 19 58 137
Establish Electronic Visa Update System user fee ��������������������������������� ��������� –25 –28 –31 –34 –38 –42 –46 –52 –57 –64 –156 –417
Make full Electronic System for Travel Authorization (ESTA) receipts available to CBP �������������������������������� ��������� ��������� ��������� –171 –177 –183 –189 –196 –202 –209 –216 –531 –1,543
Establish an immigration services surcharge ������������������������������������������� ��������� –453 –465 –479 –493 –507 –522 –538 –553 –569 –587 –2,397 –5,166
Increase worksite enforcement penalties �������������������������������������������� ��������� –13 –14 –15 –15 –15 –15 –15 –15 –15 –15 –72 –147
Provide paid parental leave benefits ���� ��������� ��������� ��������� ��������� –977 –985 –1,016 –1,211 –1,319 –1,422 –1,517 –1,962 –8,447Establish an Unemployment
Insurance (UI) solvency standard ���� ��������� ��������� ��������� –489 –1,315 –1,887 –796 –1,399 –778 –1,025 –1,524 –3,691 –9,213Improve UI program integrity �������������� ��������� ��������� 1 9 23 42 62 82 98 143 127 75 587Provide for Reemployment Services
and Eligibility Assessments ������������� ��������� ��������� 2 15 46 94 160 223 294 306 443 157 1,583Reform Air Traffic Control �������������������� ��������� ��������� ��������� ��������� 15,510 16,310 17,146 18,038 18,996 19,996 21,016 31,820 127,012Reform Essential Air Service ��������������� ��������� ��������� ��������� ��������� 152 156 160 164 168 172 177 308 1,149Provide authority for Bureau of
Engraving and Printing to construct new facility ��������������������������������������� ��������� –12 –32 –3 89 –360 –53 20 –3 –222 –3 –318 –579
Subject Financial Research Fund to appropriations with reforms to the Financial Stability Oversight Council and Office of Financial Research 1, 7 ���������������������������������������� ��������� –1 50 50 50 50 50 50 50 50 50 199 449
Implement tax enforcement program integrity cap adjustment ������������������ ��������� –152 –787 –1,825 –3,033 –4,330 –5,554 –6,416 –6,931 –7,270 –7,505 –10,127 –43,803
Increase oversight of paid tax return preparers ������������������������������������������� ��������� –17 –18 –21 –23 –25 –28 –31 –34 –38 –41 –104 –276
Provide more flexible authority for the Internal Revenue Service to address correctable errors ����������������������������� ��������� –8 –12 –13 –14 –15 –16 –17 –18 –19 –21 –62 –153
Reform inland waterways financing ���� ��������� –178 –178 –178 –178 –178 –178 –178 –178 –178 –178 –890 –1,780Reduce the Harbor Maintenance Tax ���� ��������� 265 281 292 299 307 314 323 333 345 359 1,444 3,118
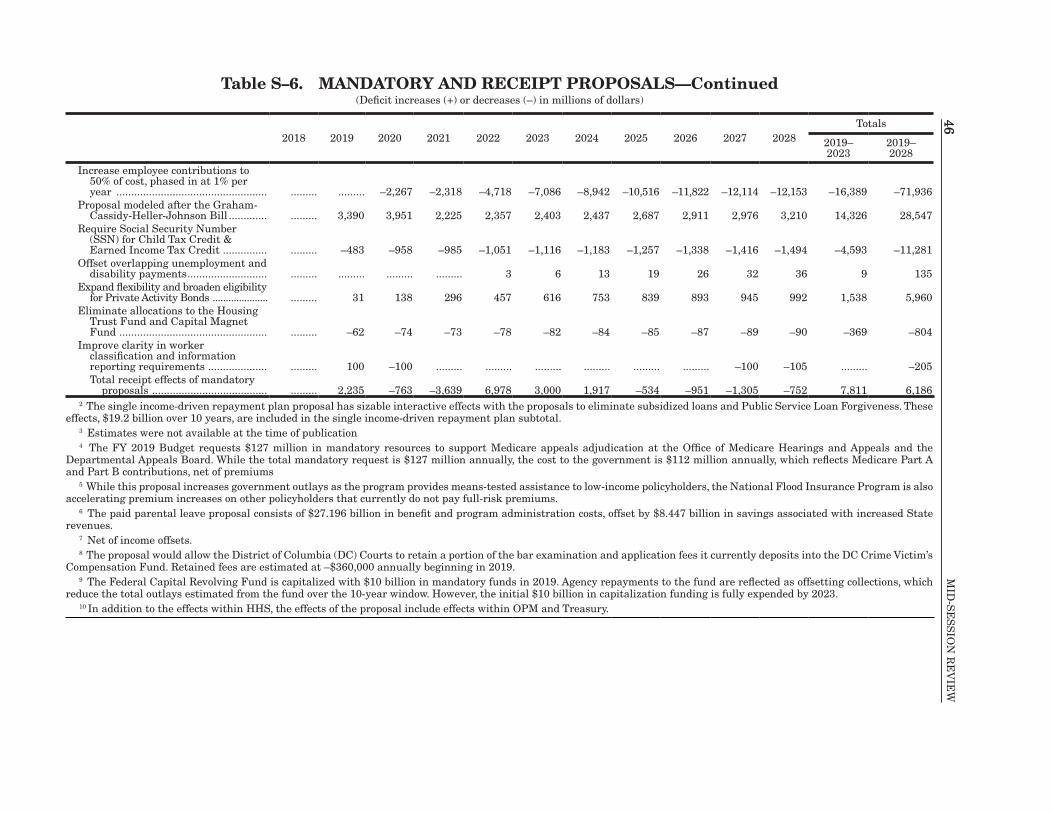
46M
ID-S
ES
SIO
N R
EV
IEW
46Table S–6. MANDATORY AND RECEIPT PROPOSALS—Continued
(Deficit increases (+) or decreases (–) in millions of dollars)
2018 2019 2020 2021 2022 2023 2024 2025 2026 2027 2028Totals
2019– 2023
2019– 2028
Increase employee contributions to 50% of cost, phased in at 1% per year ��������������������������������������������������� ��������� ��������� –2,267 –2,318 –4,718 –7,086 –8,942 –10,516 –11,822 –12,114 –12,153 –16,389 –71,936
Proposal modeled after the Graham-Cassidy-Heller-Johnson Bill ������������� ��������� 3,390 3,951 2,225 2,357 2,403 2,437 2,687 2,911 2,976 3,210 14,326 28,547
Require Social Security Number (SSN) for Child Tax Credit & Earned Income Tax Credit ��������������� ��������� –483 –958 –985 –1,051 –1,116 –1,183 –1,257 –1,338 –1,416 –1,494 –4,593 –11,281
Offset overlapping unemployment and disability payments ��������������������������� ��������� ��������� ��������� ��������� 3 6 13 19 26 32 36 9 135
Expand flexibility and broaden eligibility for Private Activity Bonds ��������������������� ��������� 31 138 296 457 616 753 839 893 945 992 1,538 5,960
Eliminate allocations to the Housing Trust Fund and Capital Magnet Fund �������������������������������������������������� ��������� –62 –74 –73 –78 –82 –84 –85 –87 –89 –90 –369 –804
Improve clarity in worker classification and information reporting requirements �������������������� ��������� 100 –100 ��������� ��������� ��������� ��������� ��������� ��������� –100 –105 ��������� –205Total receipt effects of mandatory
proposals ��������������������������������������� ��������� 2,235 –763 –3,639 6,978 3,000 1,917 –534 –951 –1,305 –752 7,811 6,1862 The single income-driven repayment plan proposal has sizable interactive effects with the proposals to eliminate subsidized loans and Public Service Loan Forgiveness� These
effects, $19�2 billion over 10 years, are included in the single income-driven repayment plan subtotal�3 Estimates were not available at the time of publication4 The Fy 2019 Budget requests $127 million in mandatory resources to support Medicare appeals adjudication at the Office of Medicare Hearings and Appeals and the
Departmental Appeals Board� While the total mandatory request is $127 million annually, the cost to the government is $112 million annually, which reflects Medicare Part A and Part B contributions, net of premiums
5 While this proposal increases government outlays as the program provides means-tested assistance to low-income policyholders, the National Flood Insurance Program is also accelerating premium increases on other policyholders that currently do not pay full-risk premiums�
6 The paid parental leave proposal consists of $27�196 billion in benefit and program administration costs, offset by $8�447 billion in savings associated with increased State revenues�
7 Net of income offsets�8 The proposal would allow the District of Columbia (DC) Courts to retain a portion of the bar examination and application fees it currently deposits into the DC Crime Victim’s
Compensation Fund� Retained fees are estimated at –$360,000 annually beginning in 2019�9 The Federal Capital Revolving Fund is capitalized with $10 billion in mandatory funds in 2019� Agency repayments to the fund are reflected as offsetting collections, which
reduce the total outlays estimated from the fund over the 10-year window� However, the initial $10 billion in capitalization funding is fully expended by 2023�10 In addition to the effects within HHS, the effects of the proposal include effects within OPM and Treasury�
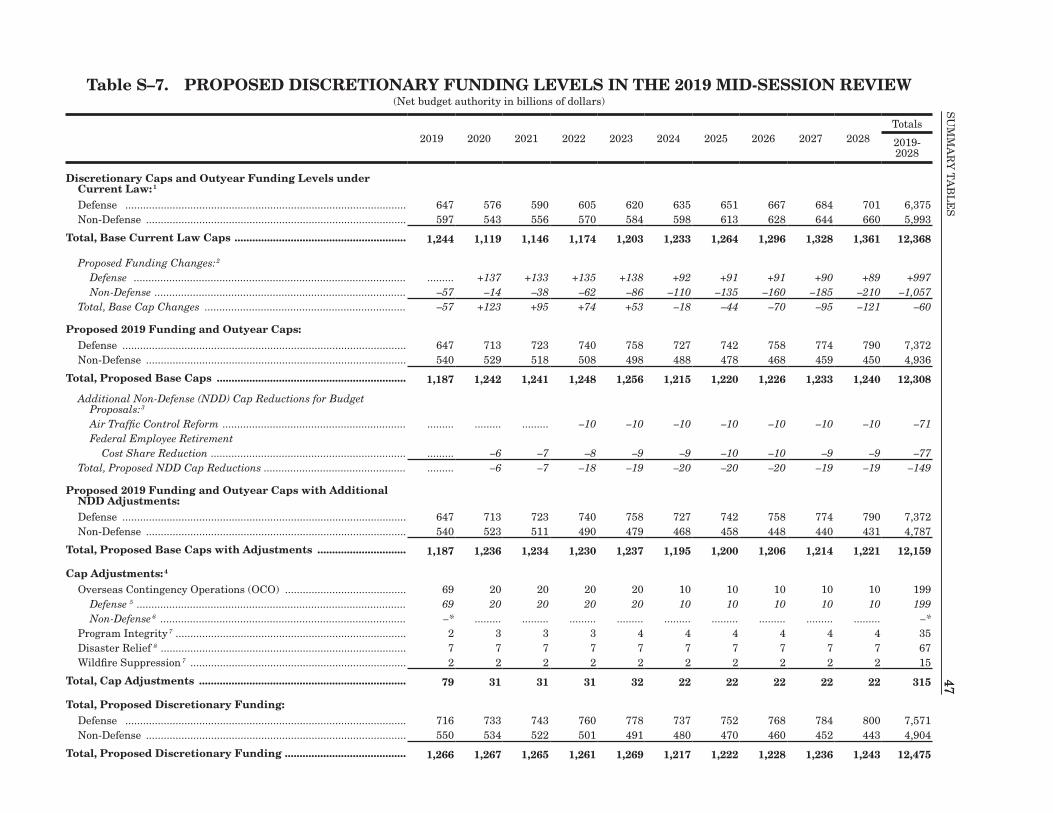
47S
UM
MA
Ry
TA
BL
ES
47Table S–7. PROPOSED DISCRETIONARY FUNDING LEVELS IN THE 2019 MID-SESSION REVIEW
(Net budget authority in billions of dollars)
2019 2020 2021 2022 2023 2024 2025 2026 2027 2028Totals
2019- 2028
Discretionary Caps and Outyear Funding Levels under Current Law: 1
Defense ����������������������������������������������������������������������������������������������� 647 576 590 605 620 635 651 667 684 701 6,375Non-Defense ���������������������������������������������������������������������������������������� 597 543 556 570 584 598 613 628 644 660 5,993
Total, Base Current Law Caps .......................................................... 1,244 1,119 1,146 1,174 1,203 1,233 1,264 1,296 1,328 1,361 12,368
Proposed Funding Changes: 2
Defense �������������������������������������������������������������������������������������������� ��������� +137 +133 +135 +138 +92 +91 +91 +90 +89 +997Non-Defense ������������������������������������������������������������������������������������� –57 –14 –38 –62 –86 –110 –135 –160 –185 –210 –1,057
Total, Base Cap Changes �������������������������������������������������������������������� –57 +123 +95 +74 +53 –18 –44 –70 –95 –121 –60
Proposed 2019 Funding and Outyear Caps: Defense ������������������������������������������������������������������������������������������������ 647 713 723 740 758 727 742 758 774 790 7,372Non-Defense ���������������������������������������������������������������������������������������� 540 529 518 508 498 488 478 468 459 450 4,936
Total, Proposed Base Caps ................................................................ 1,187 1,242 1,241 1,248 1,256 1,215 1,220 1,226 1,233 1,240 12,308
Additional Non-Defense (NDD) Cap Reductions for Budget Proposals: 3
Air Traffic Control Reform �������������������������������������������������������������� ��������� ��������� ��������� –10 –10 –10 –10 –10 –10 –10 –71Federal Employee Retirement
Cost Share Reduction ������������������������������������������������������������������ ��������� –6 –7 –8 –9 –9 –10 –10 –9 –9 –77Total, Proposed NDD Cap Reductions ������������������������������������������������ ��������� –6 –7 –18 –19 –20 –20 –20 –19 –19 –149
Proposed 2019 Funding and Outyear Caps with Additional NDD Adjustments:Defense ������������������������������������������������������������������������������������������������ 647 713 723 740 758 727 742 758 774 790 7,372Non-Defense ���������������������������������������������������������������������������������������� 540 523 511 490 479 468 458 448 440 431 4,787
Total, Proposed Base Caps with Adjustments .............................. 1,187 1,236 1,234 1,230 1,237 1,195 1,200 1,206 1,214 1,221 12,159
Cap Adjustments: 4
Overseas Contingency Operations (OCO) ����������������������������������������� 69 20 20 20 20 10 10 10 10 10 199Defense 5 ������������������������������������������������������������������������������������������� 69 20 20 20 20 10 10 10 10 10 199Non-Defense 6 ����������������������������������������������������������������������������������� –* ��������� ��������� ��������� ��������� ��������� ��������� ��������� ��������� ��������� –*
Program Integrity 7 ������������������������������������������������������������������������������ 2 3 3 3 4 4 4 4 4 4 35Disaster Relief 8 ����������������������������������������������������������������������������������� 7 7 7 7 7 7 7 7 7 7 67Wildfire Suppression 7 ������������������������������������������������������������������������� 2 2 2 2 2 2 2 2 2 2 15
Total, Cap Adjustments ...................................................................... 79 31 31 31 32 22 22 22 22 22 315
Total, Proposed Discretionary Funding: Defense ����������������������������������������������������������������������������������������������� 716 733 743 760 778 737 752 768 784 800 7,571Non-Defense ���������������������������������������������������������������������������������������� 550 534 522 501 491 480 470 460 452 443 4,904
Total, Proposed Discretionary Funding ......................................... 1,266 1,267 1,265 1,261 1,269 1,217 1,222 1,228 1,236 1,243 12,475
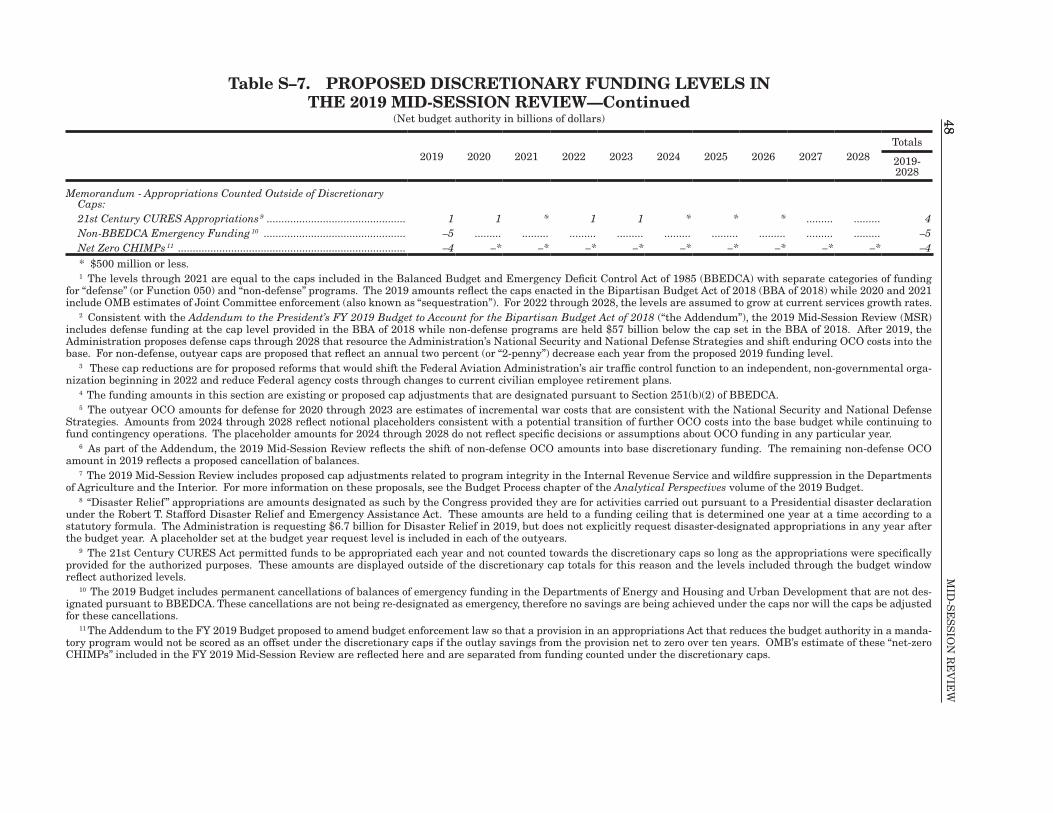
48M
ID-S
ES
SIO
N R
EV
IEW
48Table S–7. PROPOSED DISCRETIONARY FUNDING LEVELS IN
THE 2019 MID-SESSION REVIEW—Continued(Net budget authority in billions of dollars)
2019 2020 2021 2022 2023 2024 2025 2026 2027 2028Totals
2019- 2028
Memorandum - Appropriations Counted Outside of Discretionary Caps:21st Century CURES Appropriations 9 ����������������������������������������������� 1 1 * 1 1 * * * ��������� ��������� 4Non-BBEDCA Emergency Funding 10 ������������������������������������������������ –5 ��������� ��������� ��������� ��������� ��������� ��������� ��������� ��������� ��������� –5Net Zero CHIMPs 11 ����������������������������������������������������������������������������� –4 –* –* –* –* –* –* –* –* –* –4* $500 million or less�1 The levels through 2021 are equal to the caps included in the Balanced Budget and Emergency Deficit Control Act of 1985 (BBEDCA) with separate categories of funding
for “defense” (or Function 050) and “non-defense” programs� The 2019 amounts reflect the caps enacted in the Bipartisan Budget Act of 2018 (BBA of 2018) while 2020 and 2021 include OMB estimates of Joint Committee enforcement (also known as “sequestration”)� For 2022 through 2028, the levels are assumed to grow at current services growth rates�
2 Consistent with the Addendum to the President’s FY 2019 Budget to Account for the Bipartisan Budget Act of 2018 (“the Addendum”), the 2019 Mid-Session Review (MSR) includes defense funding at the cap level provided in the BBA of 2018 while non-defense programs are held $57 billion below the cap set in the BBA of 2018� After 2019, the Administration proposes defense caps through 2028 that resource the Administration’s National Security and National Defense Strategies and shift enduring OCO costs into the base� For non-defense, outyear caps are proposed that reflect an annual two percent (or “2-penny”) decrease each year from the proposed 2019 funding level�
3 These cap reductions are for proposed reforms that would shift the Federal Aviation Administration’s air traffic control function to an independent, non-governmental orga-nization beginning in 2022 and reduce Federal agency costs through changes to current civilian employee retirement plans�
4 The funding amounts in this section are existing or proposed cap adjustments that are designated pursuant to Section 251(b)(2) of BBEDCA�5 The outyear OCO amounts for defense for 2020 through 2023 are estimates of incremental war costs that are consistent with the National Security and National Defense
Strategies� Amounts from 2024 through 2028 reflect notional placeholders consistent with a potential transition of further OCO costs into the base budget while continuing to fund contingency operations� The placeholder amounts for 2024 through 2028 do not reflect specific decisions or assumptions about OCO funding in any particular year�
6 As part of the Addendum, the 2019 Mid-Session Review reflects the shift of non-defense OCO amounts into base discretionary funding� The remaining non-defense OCO amount in 2019 reflects a proposed cancellation of balances�
7 The 2019 Mid-Session Review includes proposed cap adjustments related to program integrity in the Internal Revenue Service and wildfire suppression in the Departments of Agriculture and the Interior� For more information on these proposals, see the Budget Process chapter of the Analytical Perspectives volume of the 2019 Budget�
8 “Disaster Relief” appropriations are amounts designated as such by the Congress provided they are for activities carried out pursuant to a Presidential disaster declaration under the Robert T� Stafford Disaster Relief and Emergency Assistance Act� These amounts are held to a funding ceiling that is determined one year at a time according to a statutory formula� The Administration is requesting $6�7 billion for Disaster Relief in 2019, but does not explicitly request disaster-designated appropriations in any year after the budget year� A placeholder set at the budget year request level is included in each of the outyears�
9 The 21st Century CURES Act permitted funds to be appropriated each year and not counted towards the discretionary caps so long as the appropriations were specifically provided for the authorized purposes� These amounts are displayed outside of the discretionary cap totals for this reason and the levels included through the budget window reflect authorized levels�
10 The 2019 Budget includes permanent cancellations of balances of emergency funding in the Departments of Energy and Housing and Urban Development that are not des-ignated pursuant to BBEDCA� These cancellations are not being re-designated as emergency, therefore no savings are being achieved under the caps nor will the caps be adjusted for these cancellations�
11 The Addendum to the Fy 2019 Budget proposed to amend budget enforcement law so that a provision in an appropriations Act that reduces the budget authority in a manda-tory program would not be scored as an offset under the discretionary caps if the outlay savings from the provision net to zero over ten years� OMB’s estimate of these “net-zero CHIMPs” included in the Fy 2019 Mid-Session Review are reflected here and are separated from funding counted under the discretionary caps�
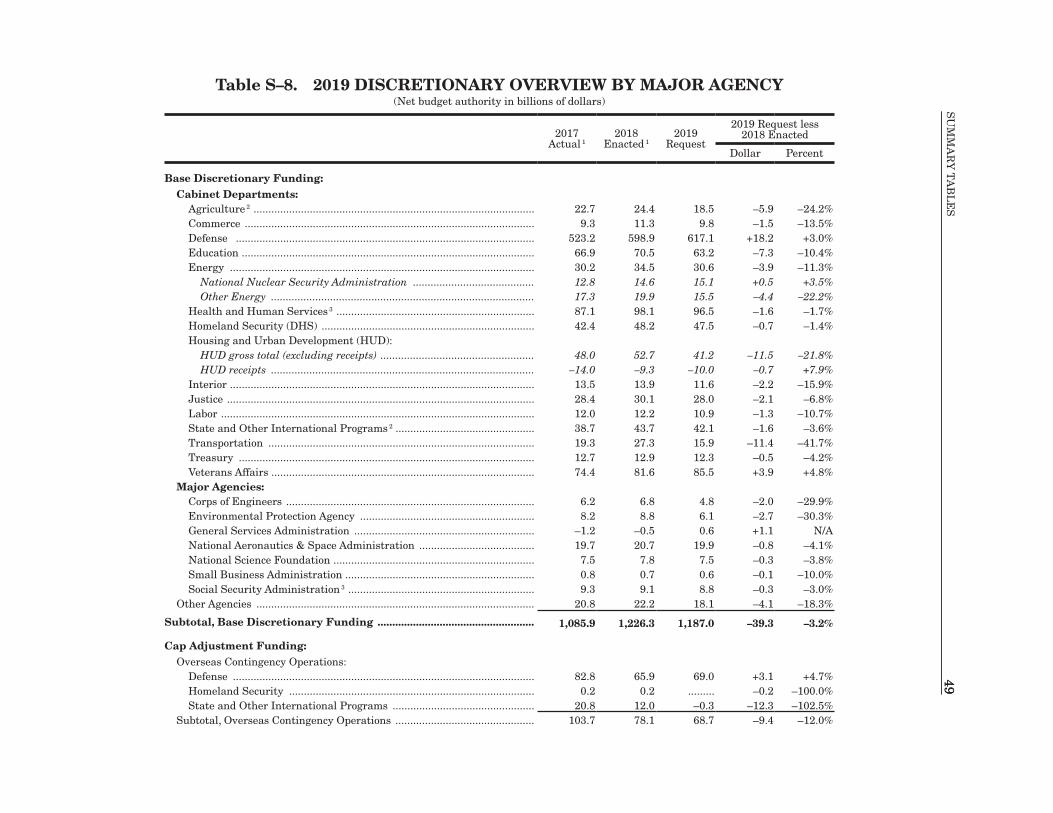
49S
UM
MA
Ry
TA
BL
ES
49Table S–8. 2019 DISCRETIONARY OVERVIEW BY MAJOR AGENCY
(Net budget authority in billions of dollars)
2017 Actual 1
2018 Enacted 1
2019 Request
2019 Request less 2018 Enacted
Dollar Percent
Base Discretionary Funding:Cabinet Departments:
Agriculture 2 ����������������������������������������������������������������������������������������������� 22�7 24�4 18�5 –5�9 –24�2%Commerce �������������������������������������������������������������������������������������������������� 9�3 11�3 9�8 –1�5 –13�5%Defense ����������������������������������������������������������������������������������������������������� 523�2 598�9 617�1 +18�2 +3�0%Education ��������������������������������������������������������������������������������������������������� 66�9 70�5 63�2 –7�3 –10�4%Energy ������������������������������������������������������������������������������������������������������� 30�2 34�5 30�6 –3�9 –11�3%
National Nuclear Security Administration ����������������������������������������� 12�8 14�6 15�1 +0�5 +3�5%Other Energy ����������������������������������������������������������������������������������������� 17�3 19�9 15�5 –4�4 –22�2%
Health and Human Services 3 ������������������������������������������������������������������� 87�1 98�1 96�5 –1�6 –1�7%Homeland Security (DHS) ������������������������������������������������������������������������ 42�4 48�2 47�5 –0�7 –1�4%Housing and Urban Development (HUD):
HUD gross total (excluding receipts) ���������������������������������������������������� 48�0 52�7 41�2 –11�5 –21�8%HUD receipts ����������������������������������������������������������������������������������������� –14�0 –9�3 –10�0 –0�7 +7�9%
Interior ������������������������������������������������������������������������������������������������������� 13�5 13�9 11�6 –2�2 –15�9%Justice �������������������������������������������������������������������������������������������������������� 28�4 30�1 28�0 –2�1 –6�8%Labor ���������������������������������������������������������������������������������������������������������� 12�0 12�2 10�9 –1�3 –10�7%State and Other International Programs 2 ����������������������������������������������� 38�7 43�7 42�1 –1�6 –3�6%Transportation ������������������������������������������������������������������������������������������ 19�3 27�3 15�9 –11�4 –41�7%Treasury ���������������������������������������������������������������������������������������������������� 12�7 12�9 12�3 –0�5 –4�2%Veterans Affairs ����������������������������������������������������������������������������������������� 74�4 81�6 85�5 +3�9 +4�8%
Major Agencies:Corps of Engineers ������������������������������������������������������������������������������������ 6�2 6�8 4�8 –2�0 –29�9%Environmental Protection Agency ����������������������������������������������������������� 8�2 8�8 6�1 –2�7 –30�3%General Services Administration ������������������������������������������������������������� –1�2 –0�5 0�6 +1�1 N/ANational Aeronautics & Space Administration ��������������������������������������� 19�7 20�7 19�9 –0�8 –4�1%National Science Foundation �������������������������������������������������������������������� 7�5 7�8 7�5 –0�3 –3�8%Small Business Administration ���������������������������������������������������������������� 0�8 0�7 0�6 –0�1 –10�0%Social Security Administration 3 ��������������������������������������������������������������� 9�3 9�1 8�8 –0�3 –3�0%
Other Agencies ���������������������������������������������������������������������������������������������� 20�8 22�2 18�1 –4�1 –18�3%
Subtotal, Base Discretionary Funding ..................................................... 1,085.9 1,226.3 1,187.0 –39.3 –3.2%
Cap Adjustment Funding:Overseas Contingency Operations:
Defense ������������������������������������������������������������������������������������������������������ 82�8 65�9 69�0 +3�1 +4�7%Homeland Security ����������������������������������������������������������������������������������� 0�2 0�2 ��������� –0�2 –100�0%State and Other International Programs ������������������������������������������������ 20�8 12�0 –0�3 –12�3 –102�5%
Subtotal, Overseas Contingency Operations ����������������������������������������������� 103�7 78�1 68�7 –9�4 –12�0%
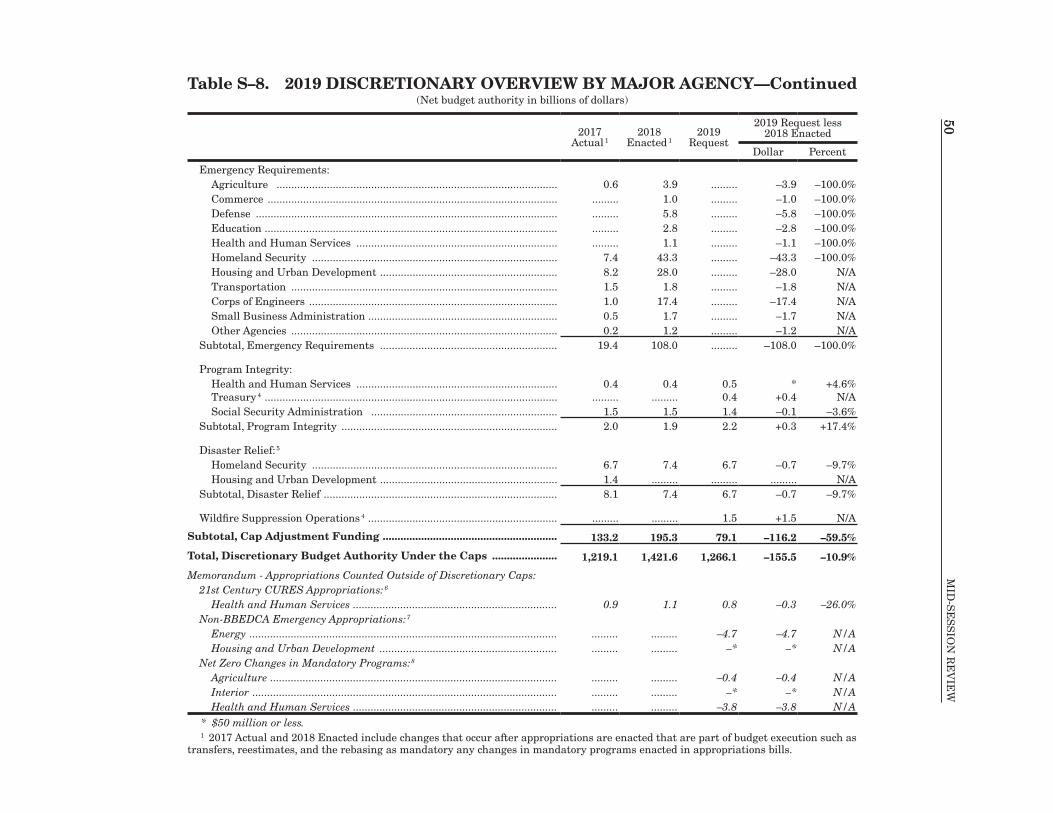
50M
ID-S
ES
SIO
N R
EV
IEW
50Table S–8. 2019 DISCRETIONARY OVERVIEW BY MAJOR AGENCY—Continued
(Net budget authority in billions of dollars)
2017 Actual 1
2018 Enacted 1
2019 Request
2019 Request less 2018 Enacted
Dollar Percent
Emergency Requirements:Agriculture ����������������������������������������������������������������������������������������������� 0�6 3�9 ��������� –3�9 –100�0%Commerce �������������������������������������������������������������������������������������������������� ��������� 1�0 ��������� –1�0 –100�0%Defense ������������������������������������������������������������������������������������������������������ ��������� 5�8 ��������� –5�8 –100�0%Education ��������������������������������������������������������������������������������������������������� ��������� 2�8 ��������� –2�8 –100�0%Health and Human Services �������������������������������������������������������������������� ��������� 1�1 ��������� –1�1 –100�0%Homeland Security ����������������������������������������������������������������������������������� 7�4 43�3 ��������� –43�3 –100�0%Housing and Urban Development ������������������������������������������������������������ 8�2 28�0 ��������� –28�0 N/ATransportation ������������������������������������������������������������������������������������������ 1�5 1�8 ��������� –1�8 N/ACorps of Engineers ������������������������������������������������������������������������������������ 1�0 17�4 ��������� –17�4 N/ASmall Business Administration ���������������������������������������������������������������� 0�5 1�7 ��������� –1�7 N/AOther Agencies ������������������������������������������������������������������������������������������ 0�2 1�2 ��������� –1�2 N/A
Subtotal, Emergency Requirements ������������������������������������������������������������ 19�4 108�0 ��������� –108�0 –100�0%
Program Integrity:Health and Human Services �������������������������������������������������������������������� 0�4 0�4 0�5 * +4�6%Treasury 4 ��������������������������������������������������������������������������������������������������� ��������� ��������� 0�4 +0�4 N/ASocial Security Administration ��������������������������������������������������������������� 1�5 1�5 1�4 –0�1 –3�6%
Subtotal, Program Integrity ������������������������������������������������������������������������� 2�0 1�9 2�2 +0�3 +17�4%
Disaster Relief: 5
Homeland Security ����������������������������������������������������������������������������������� 6�7 7�4 6�7 –0�7 –9�7%Housing and Urban Development ������������������������������������������������������������ 1�4 ��������� ��������� ��������� N/A
Subtotal, Disaster Relief ������������������������������������������������������������������������������� 8�1 7�4 6�7 –0�7 –9�7%
Wildfire Suppression Operations 4 ���������������������������������������������������������������� ��������� ��������� 1�5 +1�5 N/A
Subtotal, Cap Adjustment Funding ........................................................... 133.2 195.3 79.1 –116.2 –59.5%
Total, Discretionary Budget Authority Under the Caps ...................... 1,219.1 1,421.6 1,266.1 –155.5 –10.9%
Memorandum - Appropriations Counted Outside of Discretionary Caps:21st Century CURES Appropriations: 6
Health and Human Services ��������������������������������������������������������������������� 0�9 1�1 0�8 –0�3 –26�0%Non-BBEDCA Emergency Appropriations: 7
Energy �������������������������������������������������������������������������������������������������������� ��������� ��������� –4�7 –4�7 N/AHousing and Urban Development ������������������������������������������������������������ ��������� ��������� –* –* N/A
Net Zero Changes in Mandatory Programs: 8
Agriculture ������������������������������������������������������������������������������������������������� ��������� ��������� –0�4 –0�4 N/AInterior ������������������������������������������������������������������������������������������������������� ��������� ��������� –* –* N/AHealth and Human Services ��������������������������������������������������������������������� ��������� ��������� –3�8 –3�8 N/A
* $50 million or less�1 2017 Actual and 2018 Enacted include changes that occur after appropriations are enacted that are part of budget execution such as
transfers, reestimates, and the rebasing as mandatory any changes in mandatory programs enacted in appropriations bills�
51S
UM
MA
Ry
TA
BL
ES
51
Table S–8. 2019 DISCRETIONARY OVERVIEW BY MAJOR AGENCY—Continued(Net budget authority in billions of dollars)
2017 Actual 1
2018 Enacted 1
2019 Request
2019 Request less 2018 Enacted
Dollar Percent
Emergency Requirements:Agriculture ����������������������������������������������������������������������������������������������� 0�6 3�9 ��������� –3�9 –100�0%Commerce �������������������������������������������������������������������������������������������������� ��������� 1�0 ��������� –1�0 –100�0%Defense ������������������������������������������������������������������������������������������������������ ��������� 5�8 ��������� –5�8 –100�0%Education ��������������������������������������������������������������������������������������������������� ��������� 2�8 ��������� –2�8 –100�0%Health and Human Services �������������������������������������������������������������������� ��������� 1�1 ��������� –1�1 –100�0%Homeland Security ����������������������������������������������������������������������������������� 7�4 43�3 ��������� –43�3 –100�0%Housing and Urban Development ������������������������������������������������������������ 8�2 28�0 ��������� –28�0 N/ATransportation ������������������������������������������������������������������������������������������ 1�5 1�8 ��������� –1�8 N/ACorps of Engineers ������������������������������������������������������������������������������������ 1�0 17�4 ��������� –17�4 N/ASmall Business Administration ���������������������������������������������������������������� 0�5 1�7 ��������� –1�7 N/AOther Agencies ������������������������������������������������������������������������������������������ 0�2 1�2 ��������� –1�2 N/A
Subtotal, Emergency Requirements ������������������������������������������������������������ 19�4 108�0 ��������� –108�0 –100�0%
Program Integrity:Health and Human Services �������������������������������������������������������������������� 0�4 0�4 0�5 * +4�6%Treasury 4 ��������������������������������������������������������������������������������������������������� ��������� ��������� 0�4 +0�4 N/ASocial Security Administration ��������������������������������������������������������������� 1�5 1�5 1�4 –0�1 –3�6%
Subtotal, Program Integrity ������������������������������������������������������������������������� 2�0 1�9 2�2 +0�3 +17�4%
Disaster Relief: 5
Homeland Security ����������������������������������������������������������������������������������� 6�7 7�4 6�7 –0�7 –9�7%Housing and Urban Development ������������������������������������������������������������ 1�4 ��������� ��������� ��������� N/A
Subtotal, Disaster Relief ������������������������������������������������������������������������������� 8�1 7�4 6�7 –0�7 –9�7%
Wildfire Suppression Operations 4 ���������������������������������������������������������������� ��������� ��������� 1�5 +1�5 N/A
Subtotal, Cap Adjustment Funding ........................................................... 133.2 195.3 79.1 –116.2 –59.5%
Total, Discretionary Budget Authority Under the Caps ...................... 1,219.1 1,421.6 1,266.1 –155.5 –10.9%
Memorandum - Appropriations Counted Outside of Discretionary Caps:21st Century CURES Appropriations: 6
Health and Human Services ��������������������������������������������������������������������� 0�9 1�1 0�8 –0�3 –26�0%Non-BBEDCA Emergency Appropriations: 7
Energy �������������������������������������������������������������������������������������������������������� ��������� ��������� –4�7 –4�7 N/AHousing and Urban Development ������������������������������������������������������������ ��������� ��������� –* –* N/A
Net Zero Changes in Mandatory Programs: 8
Agriculture ������������������������������������������������������������������������������������������������� ��������� ��������� –0�4 –0�4 N/AInterior ������������������������������������������������������������������������������������������������������� ��������� ��������� –* –* N/AHealth and Human Services ��������������������������������������������������������������������� ��������� ��������� –3�8 –3�8 N/A
* $50 million or less�1 2017 Actual and 2018 Enacted include changes that occur after appropriations are enacted that are part of budget execution such as
transfers, reestimates, and the rebasing as mandatory any changes in mandatory programs enacted in appropriations bills�
Table S–8. 2019 DISCRETIONARY OVERVIEW BY MAJOR AGENCY—Continued
2 Funding for Food for Peace Title II Grants is included in the State and Other International Programs total� Although the funds are appropriated to the Department of Agriculture, the funds are administered by the U�S� Agency for International Development�
3 Funding from the Hospital Insurance and Supplementary Medical Insurance trust funds for administrative expenses incurred by the Social Security Administration that support the Medicare program are included in the Health and Human Services total and not in the Social Security Administration total�
4 The 2019 Mid-Session Review includes proposed cap adjustments related to program integrity in the Internal Revenue Service and wildfire suppression in the Departments of Agriculture and the Interior� For more information on these proposals, see the Budget Process chapter of the Analytical Perspectives volume of the 2019 Budget�
5 “Disaster Relief” appropriations are amounts designated as such by the Congress provided they are for activities carried out pursu-ant to a Presidential disaster declaration under the Robert T� Stafford Disaster Relief and Emergency Assistance Act� These amounts are held to a funding ceiling that is determined one year at a time according to a statutory formula� The Administration is requesting $6�7 billion for Disaster Relief in 2019�
6 The 21st Century CURES Act permitted funds to be appropriated each year for certain activities and not counted toward the discre-tionary caps so long as the appropriations were specifically provided for the authorized purposes� These amounts are displayed outside of the discretionary caps totals for this reason�
7 The 2019 Budget includes permanent cancellations of balances of emergency funding in the Departments of Energy and Housing and Urban Development that are not designated pursuant to BBEDCA� These cancellations are not being re-designated as emergency, therefore no savings are being achieved under the caps nor will the caps be adjusted for these cancellations�
8 The Addendum to the 2019 Budget proposed to amend budget enforcement law so that a provision in an appropriations Act that reduces the budget authority in a mandatory program would not be scored as an offset under the discretionary caps if the outlay savings from the provision net to zero over ten years� OMB’s estimate of these “net-zero CHIMPs” included in the Fy 2019 Mid-Session Review are reflected here and are separated from funding counted under the discretionary caps�
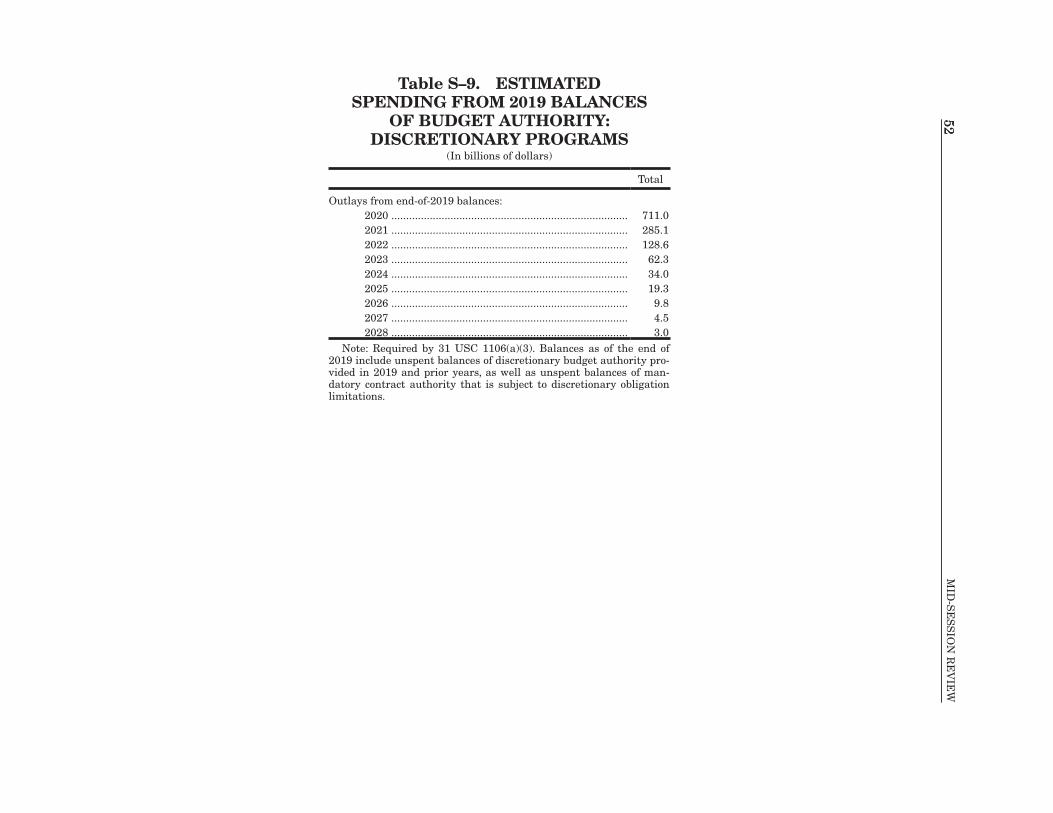
52M
ID-S
ES
SIO
N R
EV
IEW
52Table S–9. ESTIMATED
SPENDING FROM 2019 BALANCES OF BUDGET AUTHORITY:
DISCRETIONARY PROGRAMS(In billions of dollars)
Total
Outlays from end-of-2019 balances:2020 �������������������������������������������������������������������������������� 711�02021 �������������������������������������������������������������������������������� 285�12022 �������������������������������������������������������������������������������� 128�62023 �������������������������������������������������������������������������������� 62�32024 �������������������������������������������������������������������������������� 34�02025 �������������������������������������������������������������������������������� 19�32026 �������������������������������������������������������������������������������� 9�82027 �������������������������������������������������������������������������������� 4�52028 �������������������������������������������������������������������������������� 3�0
Note: Required by 31 USC 1106(a)(3)� Balances as of the end of 2019 include unspent balances of discretionary budget authority pro-vided in 2019 and prior years, as well as unspent balances of man-datory contract authority that is subject to discretionary obligation limitations�
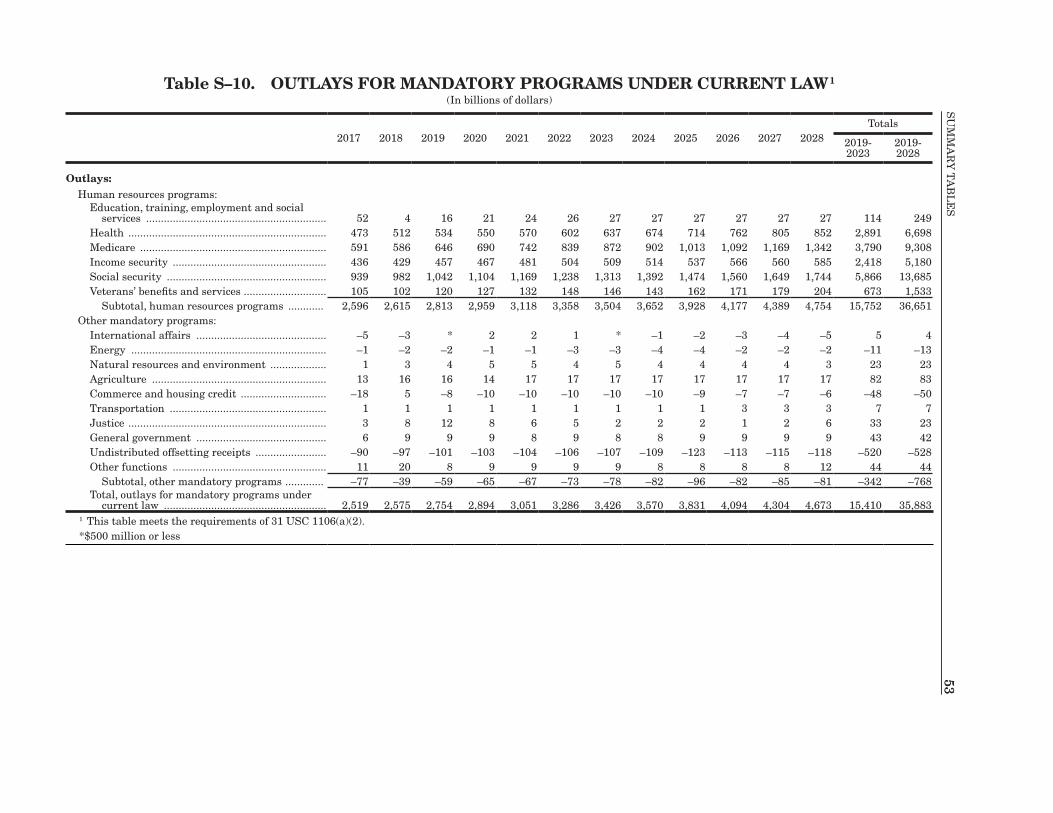
53S
UM
MA
Ry
TA
BL
ES
53Table S–10. OUTLAYS FOR MANDATORY PROGRAMS UNDER CURRENT LAW 1
(In billions of dollars)
2017 2018 2019 2020 2021 2022 2023 2024 2025 2026 2027 2028Totals
2019-2023
2019-2028
Outlays:Human resources programs:
Education, training, employment and social services ������������������������������������������������������������� 52 4 16 21 24 26 27 27 27 27 27 27 114 249
Health ������������������������������������������������������������������� 473 512 534 550 570 602 637 674 714 762 805 852 2,891 6,698Medicare ��������������������������������������������������������������� 591 586 646 690 742 839 872 902 1,013 1,092 1,169 1,342 3,790 9,308Income security ���������������������������������������������������� 436 429 457 467 481 504 509 514 537 566 560 585 2,418 5,180Social security ������������������������������������������������������ 939 982 1,042 1,104 1,169 1,238 1,313 1,392 1,474 1,560 1,649 1,744 5,866 13,685Veterans’ benefits and services ���������������������������� 105 102 120 127 132 148 146 143 162 171 179 204 673 1,533
Subtotal, human resources programs ������������ 2,596 2,615 2,813 2,959 3,118 3,358 3,504 3,652 3,928 4,177 4,389 4,754 15,752 36,651Other mandatory programs:
International affairs �������������������������������������������� –5 –3 * 2 2 1 * –1 –2 –3 –4 –5 5 4Energy ������������������������������������������������������������������ –1 –2 –2 –1 –1 –3 –3 –4 –4 –2 –2 –2 –11 –13Natural resources and environment ������������������� 1 3 4 5 5 4 5 4 4 4 4 3 23 23Agriculture ����������������������������������������������������������� 13 16 16 14 17 17 17 17 17 17 17 17 82 83Commerce and housing credit ����������������������������� –18 5 –8 –10 –10 –10 –10 –10 –9 –7 –7 –6 –48 –50Transportation ����������������������������������������������������� 1 1 1 1 1 1 1 1 1 3 3 3 7 7Justice ������������������������������������������������������������������� 3 8 12 8 6 5 2 2 2 1 2 6 33 23General government �������������������������������������������� 6 9 9 9 8 9 8 8 9 9 9 9 43 42Undistributed offsetting receipts ������������������������ –90 –97 –101 –103 –104 –106 –107 –109 –123 –113 –115 –118 –520 –528Other functions ���������������������������������������������������� 11 20 8 9 9 9 9 8 8 8 8 12 44 44
Subtotal, other mandatory programs ������������� –77 –39 –59 –65 –67 –73 –78 –82 –96 –82 –85 –81 –342 –768Total, outlays for mandatory programs under
current law ������������������������������������������������������� 2,519 2,575 2,754 2,894 3,051 3,286 3,426 3,570 3,831 4,094 4,304 4,673 15,410 35,8831 This table meets the requirements of 31 USC 1106(a)(2)�*$500 million or less
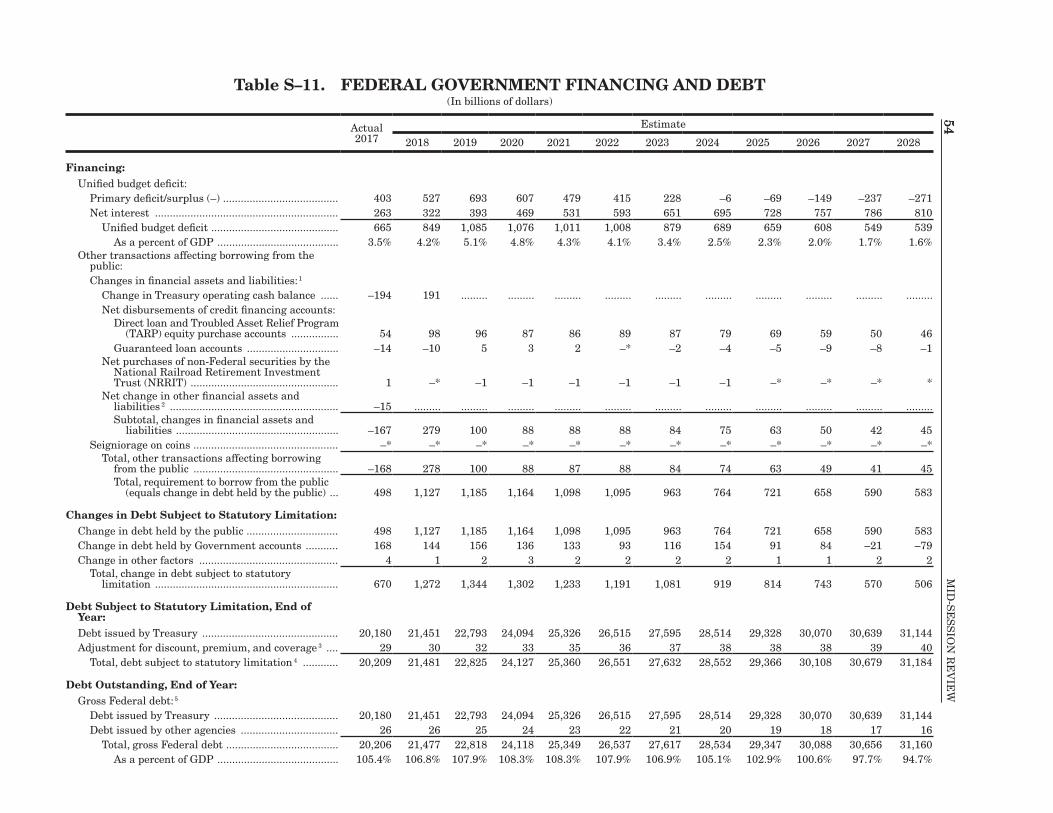
54M
ID-S
ES
SIO
N R
EV
IEW
54Table S–11. FEDERAL GOVERNMENT FINANCING AND DEBT
(In billions of dollars)
Actual 2017
Estimate
2018 2019 2020 2021 2022 2023 2024 2025 2026 2027 2028
Financing:Unified budget deficit:
Primary deficit/surplus (–) ��������������������������������������� 403 527 693 607 479 415 228 –6 –69 –149 –237 –271Net interest �������������������������������������������������������������� 263 322 393 469 531 593 651 695 728 757 786 810
Unified budget deficit ������������������������������������������� 665 849 1,085 1,076 1,011 1,008 879 689 659 608 549 539As a percent of GDP ����������������������������������������� 3�5% 4�2% 5�1% 4�8% 4�3% 4�1% 3�4% 2�5% 2�3% 2�0% 1�7% 1�6%
Other transactions affecting borrowing from the public:Changes in financial assets and liabilities: 1
Change in Treasury operating cash balance ������ –194 191 ��������� ��������� ��������� ��������� ��������� ��������� ��������� ��������� ��������� ���������Net disbursements of credit financing accounts:
Direct loan and Troubled Asset Relief Program (TARP) equity purchase accounts ���������������� 54 98 96 87 86 89 87 79 69 59 50 46
Guaranteed loan accounts ������������������������������� –14 –10 5 3 2 –* –2 –4 –5 –9 –8 –1Net purchases of non-Federal securities by the
National Railroad Retirement Investment Trust (NRRIT) �������������������������������������������������� 1 –* –1 –1 –1 –1 –1 –1 –* –* –* *
Net change in other financial assets and liabilities 2 ��������������������������������������������������������� –15 ��������� ��������� ��������� ��������� ��������� ��������� ��������� ��������� ��������� ��������� ���������Subtotal, changes in financial assets and
liabilities ������������������������������������������������������� –167 279 100 88 88 88 84 75 63 50 42 45Seigniorage on coins ������������������������������������������������� –* –* –* –* –* –* –* –* –* –* –* –*
Total, other transactions affecting borrowing from the public ������������������������������������������������� –168 278 100 88 87 88 84 74 63 49 41 45Total, requirement to borrow from the public
(equals change in debt held by the public) ��� 498 1,127 1,185 1,164 1,098 1,095 963 764 721 658 590 583
Changes in Debt Subject to Statutory Limitation:Change in debt held by the public ������������������������������� 498 1,127 1,185 1,164 1,098 1,095 963 764 721 658 590 583Change in debt held by Government accounts ����������� 168 144 156 136 133 93 116 154 91 84 –21 –79Change in other factors ����������������������������������������������� 4 1 2 3 2 2 2 2 1 1 2 2
Total, change in debt subject to statutory limitation �������������������������������������������������������������� 670 1,272 1,344 1,302 1,233 1,191 1,081 919 814 743 570 506
Debt Subject to Statutory Limitation, End of Year:Debt issued by Treasury ���������������������������������������������� 20,180 21,451 22,793 24,094 25,326 26,515 27,595 28,514 29,328 30,070 30,639 31,144Adjustment for discount, premium, and coverage 3 ���� 29 30 32 33 35 36 37 38 38 38 39 40
Total, debt subject to statutory limitation 4 ������������ 20,209 21,481 22,825 24,127 25,360 26,551 27,632 28,552 29,366 30,108 30,679 31,184
Debt Outstanding, End of Year:Gross Federal debt: 5
Debt issued by Treasury ������������������������������������������ 20,180 21,451 22,793 24,094 25,326 26,515 27,595 28,514 29,328 30,070 30,639 31,144Debt issued by other agencies ��������������������������������� 26 26 25 24 23 22 21 20 19 18 17 16
Total, gross Federal debt �������������������������������������� 20,206 21,477 22,818 24,118 25,349 26,537 27,617 28,534 29,347 30,088 30,656 31,160As a percent of GDP ����������������������������������������� 105�4% 106�8% 107�9% 108�3% 108�3% 107�9% 106�9% 105�1% 102�9% 100�6% 97�7% 94�7%
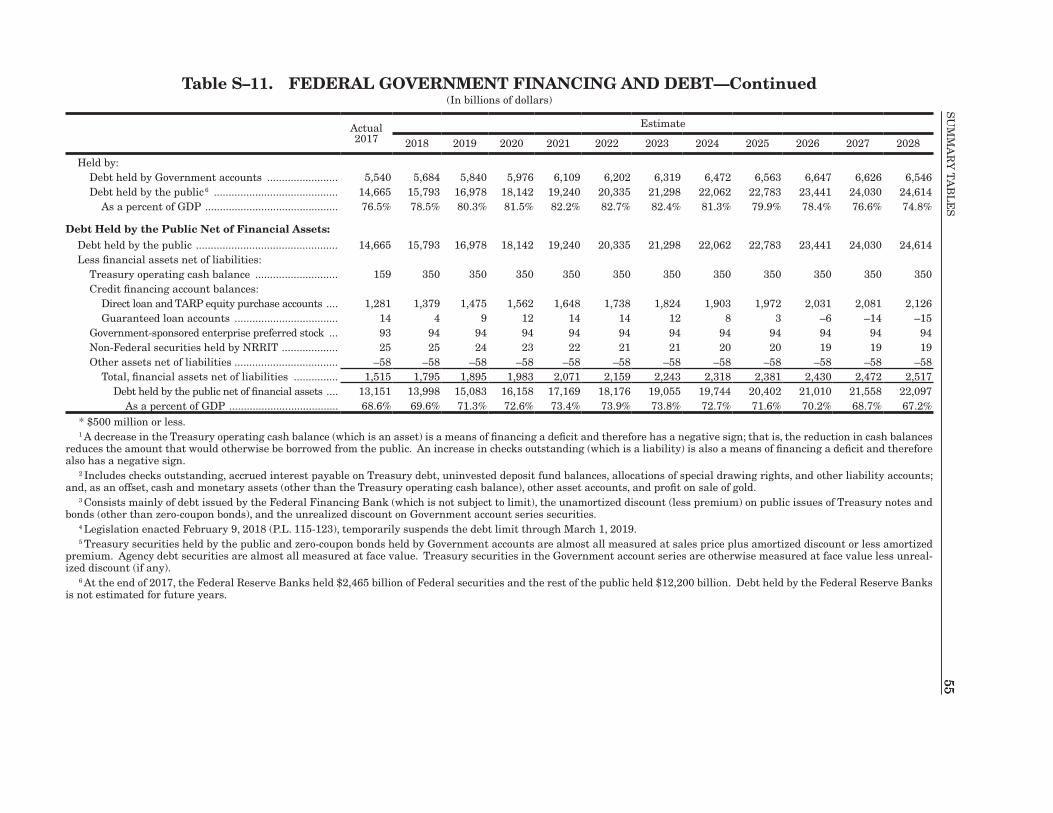
55S
UM
MA
Ry
TA
BL
ES
55Table S–11. FEDERAL GOVERNMENT FINANCING AND DEBT—Continued
(In billions of dollars)
Actual 2017
Estimate
2018 2019 2020 2021 2022 2023 2024 2025 2026 2027 2028
Held by:Debt held by Government accounts ������������������������ 5,540 5,684 5,840 5,976 6,109 6,202 6,319 6,472 6,563 6,647 6,626 6,546Debt held by the public 6 ������������������������������������������ 14,665 15,793 16,978 18,142 19,240 20,335 21,298 22,062 22,783 23,441 24,030 24,614
As a percent of GDP ��������������������������������������������� 76�5% 78�5% 80�3% 81�5% 82�2% 82�7% 82�4% 81�3% 79�9% 78�4% 76�6% 74�8%
Debt Held by the Public Net of Financial Assets:Debt held by the public ������������������������������������������������ 14,665 15,793 16,978 18,142 19,240 20,335 21,298 22,062 22,783 23,441 24,030 24,614Less financial assets net of liabilities:
Treasury operating cash balance ���������������������������� 159 350 350 350 350 350 350 350 350 350 350 350Credit financing account balances:
Direct loan and TARP equity purchase accounts ���� 1,281 1,379 1,475 1,562 1,648 1,738 1,824 1,903 1,972 2,031 2,081 2,126Guaranteed loan accounts ����������������������������������� 14 4 9 12 14 14 12 8 3 –6 –14 –15
Government-sponsored enterprise preferred stock ��� 93 94 94 94 94 94 94 94 94 94 94 94Non-Federal securities held by NRRIT ������������������� 25 25 24 23 22 21 21 20 20 19 19 19Other assets net of liabilities ����������������������������������� –58 –58 –58 –58 –58 –58 –58 –58 –58 –58 –58 –58
Total, financial assets net of liabilities ��������������� 1,515 1,795 1,895 1,983 2,071 2,159 2,243 2,318 2,381 2,430 2,472 2,517Debt held by the public net of financial assets ���� 13,151 13,998 15,083 16,158 17,169 18,176 19,055 19,744 20,402 21,010 21,558 22,097
As a percent of GDP ������������������������������������� 68�6% 69�6% 71�3% 72�6% 73�4% 73�9% 73�8% 72�7% 71�6% 70�2% 68�7% 67�2%* $500 million or less�1 A decrease in the Treasury operating cash balance (which is an asset) is a means of financing a deficit and therefore has a negative sign; that is, the reduction in cash balances
reduces the amount that would otherwise be borrowed from the public� An increase in checks outstanding (which is a liability) is also a means of financing a deficit and therefore also has a negative sign�
2 Includes checks outstanding, accrued interest payable on Treasury debt, uninvested deposit fund balances, allocations of special drawing rights, and other liability accounts; and, as an offset, cash and monetary assets (other than the Treasury operating cash balance), other asset accounts, and profit on sale of gold�
3 Consists mainly of debt issued by the Federal Financing Bank (which is not subject to limit), the unamortized discount (less premium) on public issues of Treasury notes and bonds (other than zero-coupon bonds), and the unrealized discount on Government account series securities�
4 Legislation enacted February 9, 2018 (P�L� 115-123), temporarily suspends the debt limit through March 1, 2019�5 Treasury securities held by the public and zero-coupon bonds held by Government accounts are almost all measured at sales price plus amortized discount or less amortized
premium� Agency debt securities are almost all measured at face value� Treasury securities in the Government account series are otherwise measured at face value less unreal-ized discount (if any)�
6 At the end of 2017, the Federal Reserve Banks held $2,465 billion of Federal securities and the rest of the public held $12,200 billion� Debt held by the Federal Reserve Banks is not estimated for future years�


EXECUTIVE OFFICE OF THE PRESIDENTOF FICE OF MANAGEMENT A N D B U DG E T
WASHINGTON, D.C.