Embed Size (px)
Citation preview

Retrospective Theses and Dissertations Iowa State University Capstones, Theses andDissertations
1994
An anaerobic/aerobic process for solid wastecompostingYaw-Tzuu Michael ChyiIowa State University
Follow this and additional works at: https://lib.dr.iastate.edu/rtd
Part of the Civil Engineering Commons
This Dissertation is brought to you for free and open access by the Iowa State University Capstones, Theses and Dissertations at Iowa State UniversityDigital Repository. It has been accepted for inclusion in Retrospective Theses and Dissertations by an authorized administrator of Iowa State UniversityDigital Repository. For more information, please contact [email protected].
Recommended CitationChyi, Yaw-Tzuu Michael, "An anaerobic/aerobic process for solid waste composting " (1994). Retrospective Theses and Dissertations.10548.https://lib.dr.iastate.edu/rtd/10548
INFORMATION TO USERS
This manuscript has been reproduced from the microfilm master. UMI films the text directly from the original or copy submitted. Thus, some thesis and dissertation copies are in typewriter face, while others may be from aity type of computer printer.
The quality of this reproduction is dependent upon the quality of the copy submitted. Broken or indistinct print, colored or poor quality illustrations and photographs, print bleedthrough, substandard margins, and improper alignment can adversely affect reproduction.
In the unlikely event that the author did not send UMI a complete manuscript and there are missing pages, these will be noted. Also, if unauthorized copyright material had to be removed, a note will indicate the deletion.
Oversize materials (e.g., maps, drawings, charts) are reproduced by sectioning the original, beginning at the upper left-hand comer and continuing from left to right in equal sections with small overlaps. Each original is also photographed in one exposure and is included in reduced form at the back of the book.
Photographs included in the original manuscript have been reproduced xerographically in this copy. Higher quality 6" x 9" black and white photographic prints are available for any photographs or illustrations appearing in this copy for an additional charge. Contact UMI directly to order.
A Bell & Hcjwell Information Company 300 North Zeeb Road, Ann Arbor. Ml 48106-1346 USA
313.'761-4700 800/521-0600

Order Number 9518368
An anaerobic/aerobic process for solid waste composting
Chyi, Yaw-Tzuu Michael, Ph.D.
Iowa State University, 1994
U M I 300N.ZeebRd. Ann Arbor, MI 48106

An anaerobic/aerobic process for solid waste composting
by
Yaw-Tzuu Michael Chyi
A Dissertation Submitted to the
Graduate Faculty in Partial Fulfillment of the
Requirements for the Degree of
DOCTOR OF PHILOSOPHY
Department: Civil and Construction Engineering Major: Civil Engineering (Enviroimiental Engineering)
In Charag'of Major ^rk
Members of the Committee
For the Major Department
or the Graduate College
Iowa State University Ames, Iowa
1994
Signature was redacted for privacy.
Signature was redacted for privacy.
Signature was redacted for privacy.
Signature was redacted for privacy.
Signature was redacted for privacy.
Signature was redacted for privacy.
Signature was redacted for privacy.
11
TABLE OF CONTENTS
PAGE
LIST OF TABLES vii LIST OF FIGURES x LIST OF ABBREVIATIONS xv
I. INTRODUCTION 1 Characteristics of the Two-Phase Anaerobic/Aerobic Composting System .... 2 Objectives and Purposes 3
II. LITERATURE REVIEW 5 Characteristics of MSW 6
Biodegradability of Paper Products 9 Thermochemistry of Biological System 11
Gibbs Free Energy 11 Fundamentals of Fermentative Hydrolysis 14
Carbohydrates 15 Proteins 16 Lipids 20 Overall Considerations of Anaerobic Digestion 24
Aerobic Respiration 28 Overall Reactions in the Biological Treatment of OFMSW 28
Aerobic Reactions 30 Anaerobic Reactions 33
Previous Work in Treating OFMSW 34 The Slow and Incomplete Process of Digesting MSW 34 Dry Anaerobic Fermentation 37 Sequential Batch Anaerobic Composting 37 KOMPOGAS Anaerobic Composting Process 40 DRANCO Process 41 BIOCEL Process 42 Multi-Stage Digestion Process 44 Two-Stage Anaerobic/Aerobic Process 46 Two-Phase Anaerobic Process 48 Enzymatic Enhancement of Bioconversion of OFMSW 49 Sununary of the Treatment Processes 51
A Potential Process for the Treatment of OFMSW 54 Two-Phase Anaerobic Digestion 56
Phase Separation 56

iii
Advantages of Phase Separation 58 Biochemical Thermochemistry in the First Phase 59 Application of Two-Phase Anaerobic Digestion for High-Solid Waste Treatment 61
III. EXPERIMENTAL STUDY 62 Equipment Set-up and System Operation 62
Reactor Set-up and pH Control System 62 System Operation 71 Special Design 73 System Set-up for Studying the Effects of Hydrolysis and Acidogenesis on OFMSW 75
Preparation of Substrate and Nutrients 78 Contents and Characteristics of Synthetic Substrate 78 Preparation of Preweighed Substrate 79 Addition of Nutrients and Trace Metals 80
Two-Phase Composting System Operating Procedure 81 Start-up and the Following Conditions at the end of half a SWRT 81 Daily Sampling Procedure 83 Routine Maintenance and Daily Monitoring 83
Study of Ultimate Methane Gas Production on Feeding Solid Waste 85 Preparation of Substrate, Seed, and Nutrient 85
Loading Schedule 86 Analytical Methods 89
Sampling Procedure for Soluble Components 89 Chemical Oxygen Demand 89 Individual Volatile Acids 91 Solids 92
Total solids and total volatile solids 92 Total suspended solids and total volatile suspended solids 94
Total Organic Carbon 95 Total Kjeldahl Nitrogen 95 Metals (Zn, Ni, Mg, Ca, Fe, Mn, Co, Mo, Na, K) 96 Gas Production and Analysis 97 pH 97
Conversion Factors and Sample Calculations 99 Methane Gas 99 Calculation of Gas Production 99

iv
IV. RESULTS AND DISCUSSIONS 101 Ultimate Methane Production for the Prepared MSW 102 Results for the SBAR System at an Operating Period of 25 days 104 Results for the SBAR System with a 10-day SWRT 109 Results for the DBAR System at TS content of 10% and a 14-day SWRT . . 118
Cumulative Methane Production 118 Aerobic Study 124 pH Profile 126 COD Profile 126 Gas Composition Profile 127 Biomass Seeding Ratio and TS and TVS Destruction 127 Individual Volatile Fatty Acids 129
Results of the DBAR system at TS content of 10% and a 10-day SWRT . . 132 Cumulative Methane Production 132 Toxicity Study 136 Monitoring of Possible Toxins 140 System Performance without External Seeding Biomass and Dilution 140 pH Profile 142 COD Profile 143 Gas Composition Profile 143 Biomass Seeding Ratio and Destruction of TS and TVS 143 Individual Volatile Fatty Acids 146
Results of the DBAR system at TS content of 15% and a 10-day SWRT . . 146 Cumulative Methane Production 150 Aerobic Study 155 pH Profile 156 COD Profile 158 Gas Composition Profile 158
Results of Hydrolysis and Acidogenesis on Treatment of OFMSW 161 Cumulative Methane Production 161 Gas Composition Profile 163 Cumulative COD 163 Individual Volatile Fatty Acids 166
Summary of Overall Performance 171
V. ENGINEERING APPLICATION 175
VI. CONCLUSIONS 178
VII. SUGGESTIONS FOR FUTURE WORK 181

V
BIBLIOGRAPHY 182
ACKNOWLEDGEMENTS 189 APPENDIX A ULTIMATE METHANE GAS PRODUCTION DATA
PROFILE 190
APPENDIX B DATA PROFILE OF THE SBAR SYSTEM AT A 25-DAY OPERATING PERIOD 195
APPENDIX C. DATA PROFILE OF THE SBAR SYSTEM AT A 10-DAY SWRT 199
APPENDIX D. DATA PROFILE OF THE DBAR SYSTEM AT A CONTENT OF 10% AND A 14-DAY SWRT 208
APPENIDX E. DATA PROFILE OF THE DBAR SYSTEM AT TS CONTENT OF 10% AND A 10-DAY SWRT 217
APPENIDX F. DATA PROFILE OF THE DBAR SYSTEM AT TS CONTENT OF 15% AND A 10-DAY SWRT 226
APPENDIX G. DATA PROFILE OF THE HYDROLYSIS AND ACIDOGENESIS ONOFMSW 237
vi
LIST OF TABLES
PAGE
Table L Estimated quantities of solid wastes for methane production 6
Table 2. Comparison of MSW before and after sorted at AMES RRP 8
Table 3. Projected average generated reftise composition, 1970-2000 8
Table 4. Standard free energy of formation of compounds important in anaerobic digestion 13
Table 5. Overall glucose fermentation including free energy changes 18
Table 6. Some fermentation reactions of individual amino acids 21
Table 7. Standard free energy changes for p-oxidation of palmitate assuming various electron sinks 23
Table 8. Free energy changes for various anaerobic reactions 27
Table 9. Free energy changes for various aerobic reactions 29
Table 10. Two different compositions of OFMSW (Sumter and Levy counties, Florida) used in SEBAC study 39
Table 11. Summary of performance of all SEBAC runs 39
Table 12. Performance of the KOMPOGAS pilot plant at a 40-day SWRT 40
Table 13. Composition of feedstock and performance of DRANCO process 42
Table 14. Composition of the OFMSW obtained by mechanical separation as used in the study of BIOCEL reactor 43
Table 15. Performance of multi-stage digestion 46
Table 16. Characteristics of the organic materials used as the feedstock for the high-solids anaerobic/aerobic composting process 47

Vll
Table 17. Performance data for the high-solids anaerobic digestion/aerobic composting process 47
Table 18. Performance of two-phase anaerobic high solid digestion 49
Table 19. Composition of MSW used in the enzymatic enhancement of bioconversion ofMSW 50
Table 20. Operating conditions and performance obtained by various treatment ... 52 processes
Table 21. Standard Gibb's free energies for acetogenic conversions of higher fatty acids, ethanol, and lactate 61
Table 22. Characteristics of feeding substrate 79
Table 23. Wet weight of each component of substrate for TS contents of 10, 15, and 20% 79
Table 24. Concentration of bulk solution of trace metals and nutrient (g/L) 81
Table 25. Daily inspection of the whole system 84
Table 26. Nutrients and trace metals stock-solution for the study of ultimate gas production 86
Table 27. Summary of analytical methods used in this study 88
Table 28. Loading schedule for this study 90
Table 29. GC operating conditions for volatile acids analysis 93
Table 30. GC operating conditions for biogas analysis 98
Table 31. Summary of ultimate methane production 105
Table 32. Operating conditions and performance for the SBAR system operated at TS contents of 10, 15, and 20% and a 25-day running period 105
Table 33. Operating conditions and performance for the SBAR system operated at TS contents of 10 and 15% and a 10-day SWRT 117
Table 34. Summary of operating conditions and performance for the DEAR system operated at TS content of 10% and a 14-day SWRT 125
Table 35. IVFA concentrations and percentage of IVFA COD in total VFA COD in the system between days 29 and 35 for a TS contents of 10% and a 14-day SWRT 133
Table 36. Summary of operating conditions and performance for the DEAR system operated at TS content of 10% and a 10-day SWRT 137
Table 37. Concentrations of monitoring species for the toxicity study of the DEAR system operated at TS content of 10% and a 10-day SWRT 141
Table 38. Concentration of inorganics reported to be inhibitory to anaerobic digestion 142
Table 39. IVFA concentrations and percentage of IVFA COD in total VFA COD in the system between days 26 and 30 for a TS content of 10% and a 10-day SWRT 149
Table 40. Summary of operating conditions and performance for the DEAR system operated at TS content of 15% and a 10-day SWRT 153
Table 41. IVFA concentrations and percentage of IVFA COD in total VFA COD in the system between days 26 and 30 for a TS content of 10% and a 10-day SWRT 170
Table 42. Summary of overall performance for SEAR system and DEAR system . . 173
Table 43. Summary of overall performance for the DEAROL system of hydrolysis and acidogenesis study 174
ix
LIST OF FIGURES
PAGE
Figure 1. Wood scheme of pyruvate fermentation 17
Figure 2. Exchange of components with and transformation within the liquid phase during anaerobic digestion 25
Figure 3. A general set-up for a dry anaerobic digestion 37
Figure 4. Schematic of the sequential batch anaerobic composting process ... 38
Figure 5. A schematic of KOMPOGAS system 40
Figure 6. A schematic of DRANCO process 41
Figure 7. Flow chart of the BIOCEL reactor 43
Figure 8. Conceptual multi-stage digestion of solid waste 45
Figure 9. Basic flow diagram for the high-solids anaerobic/aerobic composting process 47
Figure 10. A schematic of two-phase anaerobic high solid digestion 48
Figure 11. Laboratory-scale flow-diagram for enzymatic enhancement of bioconversion of OFMSW 50
Figure 12. Time profiles of accumulative gas production in leach-bed digestion system and TVFA in solid bed 55
Figure 13. Microbial reactions in two-phase anaerobic digestion 60
Figure 14. Schematic of the two-phase anaerobic/aerobic composting system . . 64
Figure 15. Detailed drawing of the acidogenic reactor 65
Figure 16. (a) A-A profile of the acidogenic reactor; (b) B-B profile of the acidogenic reactor 66
X
Figure 17. Detailed drawing of the holding and recycling tank 68
Figure 18. Detailed drawing of the methanogenic filter 70
Figure 19. Schematic of the aerobic study set-up 72
Figure 20. Schematic of a special design for avoiding clogging problem 74
Figure 21. Schematic of system set-up for the study of hydrolysis and acidogenesis on OFMSW 76
Figure 22. pH control system to maintain a preset pH level within the holding and recycling tank 77
Figure 23. System set-up for the study of ultimate methane production on feeding substrate 87
Figure 24. Cumulative methane production for the ultimate methane study . . 103
Figure 25. Cumulative methane production over the operating duration for the SBAR system operated at TS contents of 10, 15, and 20% and a 25-day period 107
Figure 26. pH profile for the SBAR system over the operating duration operated at TS contents of 10, 15, and 20% and a 25-day period . . 108
Figure 27. Cumulative methane production over SWRT for the SBAR system operated at TS contents of 10%(a) and 15%(b) and a 10-day SWRT Ill
Figure 28. Cumulative methane production over time for the SBAR system operated at TS contents of 10 and 15% and a 10-day SWRT .... 112
Figure 29. COD profile for the SBAR system operated at TS contents of 10%(a) and 15%(b) and a 10-day SWRT 114
Figure 30. pH profile for the SBAR system operated at TS contents of 10%(a) and 15%(b) and a 10-day SWRT 115
Figure 31. Gas composition profile for the SBAR system operated at TS contents of 10%(a) and 15%(b) and a 10-day SWRT 116
xi
Figure 32. Cumulative total methane production over time for the DEAR system operated at a TS content of 10% and a 14-day SWRT 120
Figure 33. Cumulative methane production over half SWRT for the DEAR system operated at TS content of 10% and a 10-day SWRT 121
Figure 34. pH profile of the holding/recycling tank and effluent from the solid bed for the DEAR system operated at TS content of 10% and a 14-day SWRT 123
Figure 35. COD profile of the holding/recycling tank and effluent from the solid bed for the DEAR system operated at TS content of 10% and a 14-day SWRT 123
Figure 36. Gas composition profile of the biofilter for the DEAR system operated at TS content of 10% TS and a 14-day SWRT 128
Figure 37. Gas composition profile of the solid bed for the DEAR system at TS content of 10% and a 14-day SWRT 128
Figure 38. Individual volatile acids of the holding/recycling tank for the DEAR system operated at a TS content of 10% and a 14-day SWRT 130
Figure 39. Individual volatile acids measured from the effluent of solid bed for the DEAR system operated at a TS content of 10%and a 14-day SWRT 131
Figure 40. Cumulative methane production over half SWRT for the DEAR system operated at TS content of 10% and 10-day SWRT 134
Figure 41. Cumulative total methane production over time for the DEAR system operated at a TS content of 10% and a 10-day SWRT .... 135
Figure 42. pH profile of the holding/recycling tank and effluent from the solid bed for the DEAR system operated at a TS content of 10% and a 10-day SWRT 139

xii
Figure 43. COD profile of the holding/recycling tank and effluent from the solid bed for the DBAR system operated at TS content of 10% and a 10-day SWRT 139
Figure 44. Gas composition profile of the biofilter for the DBAR system operated at TS content of 10% and a 10-day SWRT 145
Figure 45. Gas composition profile of the solid bed for the DBAR system operated at TS content of 10% and a 10-day SWRT 145
Figure 46. Individual volatile acids of the holding/recycling tank for the DBAR system operated at TS content of 10% and a 10-day SWRT 147
Figure 47. Individual volatile acids of the solid bed for the DBAR system operated at TS content of 10% and a 10-day SWRT 148
Figure 48. Cumulative methane production over half SWRT for the DBAR system operated at TS content of 15% and a 10-day SWRT 151
Figure 49. Cumulative methane production over time for the DBAR system operated at a TS content of 15% and a 10-day SWRT 152
Figure 50. pH profile of the holding/recycling tank and effluent from the solid bed for the DBAR system operated at a TS content of 15% and a 10-day SWRT 157
Figure 51. COD profile of the holding/recycling tank and effluent from the solid bed for the DBAR system operated at TS content of 15% and a 10-day SWRT 159
Figure 52. Gas composition profile of the biofilter for the DBAR system operated at TS content of 15% and a 10-day SWRT 160
Figure 53. Gas composition profile of the solid bed for the DBAR system operated at TS content of 15% and a 10-day SWRT 160
Xlll
Figure 54. Cumulative methane production over half SWRT for the hydrolysis and acidogenesis study at pH controls of 6.4, 6.0, and 5.6 in the holding/recycling tank 161
Figure 55. Gas composition profile for the hydrolysis and acidogenesis study on OFMSW at pH controls of 6.4, 6.0, and 5.6 and TS content of 10% 163
Figure 56. Cumulative COD profile for the hydrolysis and acidogenesis study from methane COD and soluble COD in the volatile acids storage tank 164
Figure 57. Individual volatile acids for the hydrolysis and acidogenesis study at pH control of 6.4 166
Figure 58. Individual volatile acids for the hydrolysis and acidogenesis study at pH control of 6.0 167
Figure 59. Individual volatile acids for the hydrolysis and acidogenesis study at pH control of 5.6 168

xiv
LIST OF ABBREVIATIONS
BSR Biomass seeding ratio
COD Chemical oxygen demand
Cumu. CH4 Cumulative methane production
DBAR Double batch acidogenic reactors
HRT Hydraulic retention time
IVFA Individual volatile fatty acid
AG° Gibbs free energy
AG° Standard free energy in which all reactants and products are at unit activity except hydrogen ion (H"*") which has an activity of 10'^
AGf° Standard energy of formation
LC Lignin content
MGPUW Methane gas production per unit wt. of TS (m^ CH4/kg TS)
MLSS Mixed liquor suspended solids
MLVSS Mixed liquor volatile suspended solids
MSW Municipal solid waste
OFMSW Organic fraction of municipal solid waste
OLR Organic loading rate (kg TVS/m^/day)
RDF Refuse derived fuel
RRP Resource recovery plant
SBAR Single batch acidogenic reactor

XV
SPMGP Specific methane gas production (m^ CH4/m^ active reactor volume/day)
SWRT Solid waste retention time
TOC Total organic carbon
TS Total solids
TVFA Total volatile fatty acid
TVS Total volatile solids
UMPG Ultimate methane gas production measured from the synthetic solid waste
I. INTRODUCTION
The tremendous increase in municipal solid waste generation in the United States has
provoked an intensive search for alternatives to recover the energy and minimize the
amount of waste requiring ultimate disposal. Two-phase anaerobic composting, which has
been studied for over 15 years, is one promising method for stabilizing the organic fraction
of municipal solid waste (OFMSW) and to produce energy in the form of methane gas.
This process provides a better environment for two different biomass groups (acidogens
and methanogens) and leads to a higher gas production rate than one-phase anaerobic
composting. An innovative two-phase process consisting of two up-flow acidogenic
reactors operated in series, one up-flow methanogenic filter, and one recycle/holding tank
were investigated in this research. The holding/recycling tank receives hydrolysis end
products and organic acids from the acidogenic reactors, which are pumped into the
methanogenic filter and converted into methane. To minimize water that must later be
disposed, liquid is recycled on a continuous basis. The system is operated at 35°C in a
constant-temperature room.
Upon removal of the digested wastes from the acidogenic phase, free liquid is drained
into the holding/recycling tank. Air at a temperamre of 25°C is pumped into the drained
acidogenic reactor at a controlled rate to initiate aerobic composting, and, simultaneously,
to dry the digested solid wastes. The aerobic phase of treatment is operated at a three-day
solid waste retention time (SWRT).
2
The overall performance of the anaerobic phase of treatment depends on a number of
operaring parameters, including; 1) the solid waste volumetric loading rate, 2) TS content,
3) the solid waste retention time, and 4) the hydraulic retention time of the acidogenic
reactors. The quantity of biomass inoculum added to the acidogenic phase of
treatment is also an important factor.
Characteristics of the Two-phase Anaerobic/Aerobic Composting System
After operating this system for approximately 2 years, the merits of the system are as
follows;
1. The volatile fatty acids (VFA) concentration in the recycle and holding tank can be
maintained at a low level by efficient conversion of acids through a methanogenic filter
and by recycling the effluent to the holding/recycling tank.
2. The acidogenic reactors and methanogenic filter can be operated independently due to
the installation of the holding/recycling tank. Therefore, the hydraulic retention
time (HRT) of the methanogenic filter can be adjusted to 72 hours for start-up and
gradually decreased to 24 hours when the population of methangens are ready to take
a higher loading rate.
3. The HRT for the acidogenic reactor can be as low as 4 hours. This low HRT will
guarantee that the concentration of acids in the acidogenic reactor will not exceed the
inhibitory level for hydrolysis and acidogenesis.
4. The compost end products can be dried to less than 10% moisture and serve as an
odorless soil conditioner or for burning fuel after completion of the aerobic process.
5. The volume of the methanogenic reactor could be intensively reduced according to the
results that the top acidogenic reactor became more like a methanogenic reactor
rather than an acidogenic reactor. This leads to a decrease in the concentration of
volatile acids from the acidogenic reactors, and, therefore, decreases the loading

3
applied to the methanogenic reactor.
The only disadvantage of this system was that a portion of the biomass was lost due
to the sludge retained on the surface of solid wastes during the draining process. This
necessitates reseeding of a certain amount of biomass for each batch. However, at large
scale, a significant portion of a wastewater treatment plant anaerobic digester sludge
could be disposed by this process.
Objectives and Purposes
Parameters affecting the performance of two-phase anaerobic composting followed by
an aerobic polishing process include temperature, pH in the holding/recycling tank, HRT
for acidogenic and methanogenic reactors, total volatile solids (TVS) load, characteristics
of OFMSW, solid waste retention time, and biomass seeding ratio (total dry weight of
seed solids/total dry weight of solid waste in the acidogenic reactor). A simulated
domestic solid waste was prepared for these experiments. HRTs for the acidogenic
reactors were tested from 4 to 16 hours and the HRTs for the methanogenic filter were
adjusted according to the maturity of the filter. To assess the effects of total solids content
on system performance, three different total solids contents of 10%, 15%, and 20% at
SWRTs of 10 and 14 days were smdied. These parameters mentioned above were
determined by preliminary runs and based on the methane production and destruction of
total solids (TS) and total volatile solids (TVS).
4
Specific objectives of this study were:
1. To establish a reliable and high performance process for OFMSW treatment and
characterize this new process.
2. To solve physical problems which were encountered during the experimental smdy.
3. To compare the performance of different TS concentrations (10% and 15%) under two
different SWRTs (10 and 14 days) without pH control.
4. To obtain an optimum biomass seeding ratio defined as the highest methane gas
production and maximum destruction of TS and TVS with a minimum of seeding
biomass from the wastewater treatment plant.
5. To estimate the volume ratio required for the acidogenic reactors and the
methanogenic filter.
6. To study the pH effects on hydrolysis and acidogenesis of OFMSW by controlling
the pH in the holding/recycling tank at 6.4, 6.0, and 5.6 while operating at a TS
content of 10% and a 10-day SWRT.

5
II. LITERATURE REVIEW
Bioconversion of waste organic matter is one of the more promising waste disposal
technologies available today. In this area, anaerobic digestion has the greatest potential, as
it addresses two of the world's most pressing problems: solid waste disposal and energy
production. In anaerobic digestion, not only is the volume of solid waste reduced; useful
methane is also produced, which can lessen society's dependence on non-renewable fossil
fuels.
The potential energy available for recovery from waste products is considerable.
Table 1 shows the amount of waste materials and the quantity of methane that could be
produced from these wastes (Compare and Griffith, 1975). This table also shows that
domestic urban refiise contains roughly 130 million tons of dry organic solids. If all urban
refuse in the U.S. were used to provide methane, it could provide about 2.3 x 10^^ BTU
per year or about 3% of the total U.S. energy consumption. If all organic wastes were
routinely collected, they could provide as much as 14 x lO'^ BTU per year, or about
20%of the total U.S. energy consumption, if converted to methane. However, the organic
fraction of municipal solid waste (OFMSW) has to be sorted before it can be fed into an
anaerobic digestion system. The energy content within the OFMSW depends on the
methods used to separate the inorganic and non-biodegradable or refractory fraction from
the solid waste stream. The time required to stabilize the OFMSW and the net energy
gained from the system are functions of the biochemical pathways and the environmental
conditions provided by the operator. Separation procedures and reaction mechanisms thus

6
Table 1. Estimated quantities of solid wastes for methane production
Source Estimated Quantities (10^ tons/year)
Organic Dry Wt. As Received weight weight
Calculated Methane Prod.* (ft3)
Urban refuse 130 260 2.3 X 10^^ Crop and food residues 390 550 6.6 X 10^^ Manures 200 1,500 - 2,000 3.6 X 10'^ Industrial wastes 44 110 0.8 X 10^^
Logging and wood manufacture 55 **
80 0.2 X 10^^
Sewage solids 12 - 0.9 X 10^-Miscellaneous wastes 50 - -
Total 881 2,500 - 3,000 1.44 X 10'^ = 1.44 X 10^^ BTU
*
Calculated based on organic solids as C2H7O5N (53% carbon by weight): 80% recovery of carbon as gas;
and a gas composition of 70% methane and 30% CO2 (46% methane by weight). Thus, (2,000)(1/113)
(5)(0.7) (0.8) = 17,800 fl^ CH4 per ton of organic solids. (One cubic foot of methane = 10^ BTU).
Varies widely. Calculated as 25% moisture.
become important factros in evaluating the performance and feasibility of the process. The
methods for separating OFMSW and the characteristics of OFMSW, thermochemistry of
biochemical reactions, and the performance of different biochemical processes and
operations will be discussed in this chapter.
Characteristics of MSW
Energy recovery from municipal solid wastes has risen in attention since a high
percentage of volatile solids comprises most of the municipal solid wastes stream. A
survey conducted by Salas et al (1980) reported that the average volatile solids content of
MSW in the U.S. was about 52% of the total dry weight, as received. This is why

7
different routes to maximize energy recovery and to minimize the solid waste quantities
have been intensively studied and practiced. The most common way to reduce the
quantities of solid wastes include separation of the organic fraction of MSW from the
wastes, as received by the resource recovery plant (RRP). This organic fraction can be
used as refuse derived fuel (RDF) to generate electric power or through biological
processes, to produce another energy source - methane. For instance, the RRP at Ames,
Iowa, reduced 80% of MSW, as received, in 1991. In other words, only 20% of MSW
after sorting was landfilled. RDF obtained through the sorting procedure comprised about
93% of the solids reduction. This renewable fuel reduces about 20% of the coal fuel
consumption of the power plant by mixing the coal with the OFMSW. The content of
MSW before and after sorting by the RRP at Ames is shown in Table 2. In this specific
case, paper compromises about 55% of OFMSW.
Projected average generated refuse composition of the U.S. between 1970-2000, as
shown in Table 3, from Niessen and Alsobrook (1972), indicates that paper, cardboard,
and other wood-fiber products will comprise an increasingly dominant fraction of refuse.
This change will decrease bulk density, adversely affecting almost all collection, storages
and handling operations associated with disposal facilities. The increase in the portion of
refiise accounted for by paper may have a favorable impact on the economics of waste-
paper recovery which should become of increasing importance in light of the diminishing
availability of new pulp resources forecast. A survey by EPA indicated that paper and
paperboard comprised about 40% of the dry weight of discarded MSW in 1988 (EPA/530-
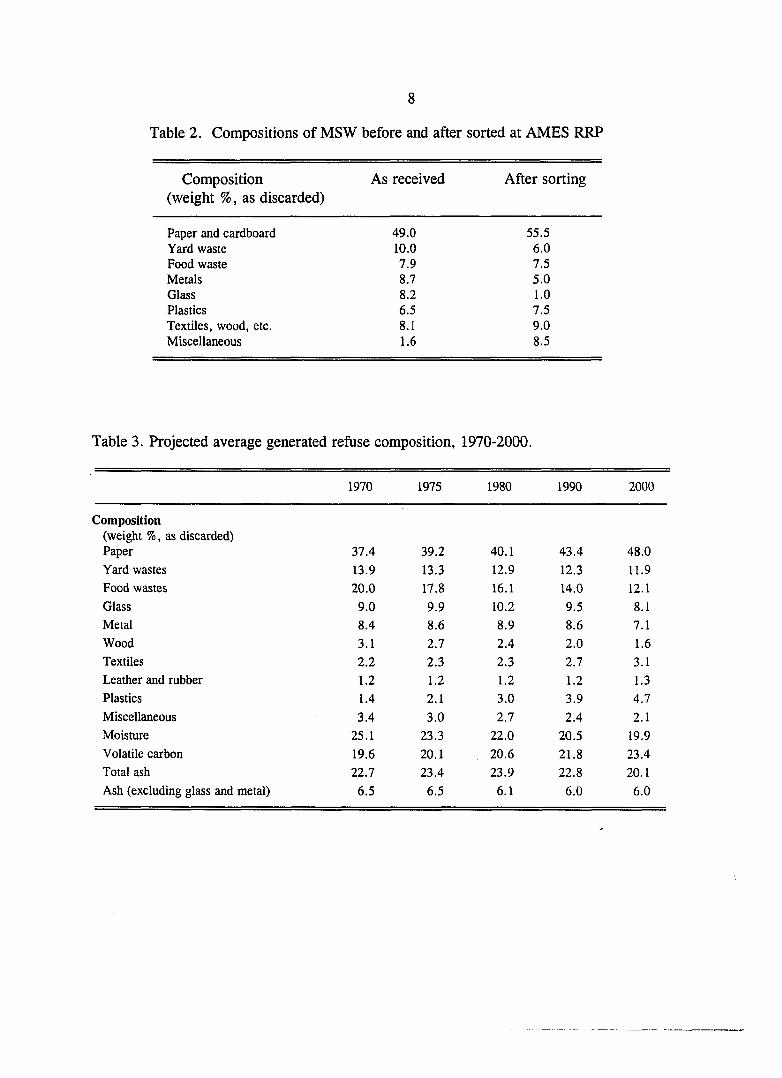
8
Table 2. Compositions of MSW before and after sorted at AMES RRP
Composition (weight %, as discarded)
As received After sorting
Paper and cardboard 49.0 55.5 Yard waste 10.0 6.0 Food waste 7.9 7.5 Metals 8.7 5.0 Glass 8.2 1.0 Plastics 6.5 7.5 Textiles, wood, etc. 8.1 9.0 Miscellaneous 1.6 8.5
Table 3. Projected average generated refuse composition, 1970-2000.
1970 1975 1980 1990 2000
Composition (weight %, as discarded) Paper 37.4 39.2 40.1 43.4 48.0
Yard wastes 13.9 13.3 12.9 12.3 11.9
Food wastes 20.0 17.8 16.1 14.0 12.1
Glass 9.0 9.9 10.2 9.5 8.1
Metal 8.4 8.6 8.9 8.6 7.1
Wood 3.1 2.7 2.4 2.0 1.6
Textiles 2.2 2.3 2.3 2.7 3.1
Leather and rubber 1.2 1.2 1.2 1.2 1.3
Plastics 1.4 2.1 3.0 3.9 4.7
Miscellaneous 3.4 3.0 2.7 2.4 2.1
Moisture 25.1 23.3 22.0 20.5 19.9
Volatile carbon 19.6 20.1 20.6 21.8 23.4
Total ash 22.7 23.4 23.9 22.8 20.1
Ash (excluding glass and metal) 6.5 6.5 6.1 6.0 6.0

9
SW-90-042A).
Different means of separating the organic fraction from MSW will result in different
compositions of end products. Source separation and centralized separation (handpicking
and handsorting) are used to separate corrugated and high-quality paper, metals, and wood
at commercial and industrial sites and newspapers at residences. This is economically
feasible if market prices are adequate (Tchobanoglous et al., 1977). A specific OFMSW
from Levy County, Florida, sorted by hand indicated that paper products and cardboard
compromised about 95.6% of OFMSW (David et al., 1990). Mechanical separation make
use of equipment to separate combustible materials (air separation), glass (flotation), and
ferrous and nonferrous metals (magnetic separation and heavy media separation)
(Tchobanoglous et al., 1977). Basically, source sorted OFMSW results in a higher energy
and biodegradability product than mechanically sorted OFMSW (Cecchi, 1984).
However, most of the literature covers the mechanically sorted OFMSW rather
than source sorted OFMSW.
Biodegradability of Paper Products
Since paper products comprise 40% of MSW, as received (Bonomo and Higginson,
1988), it is necessary to explore the biodegradability of this major portion of the MSW.
Basically, pure cellulose is entirely degradable. However, the raw material consists of
cellulose fibers, always combined with hemicellulose and lignin, which has been subjected
to mechanical or chemical treatment. All types of mixtures are possible with varying
proportions of cellulose, hemicellulose, and lignin. For example (Graindorge et al.,
10
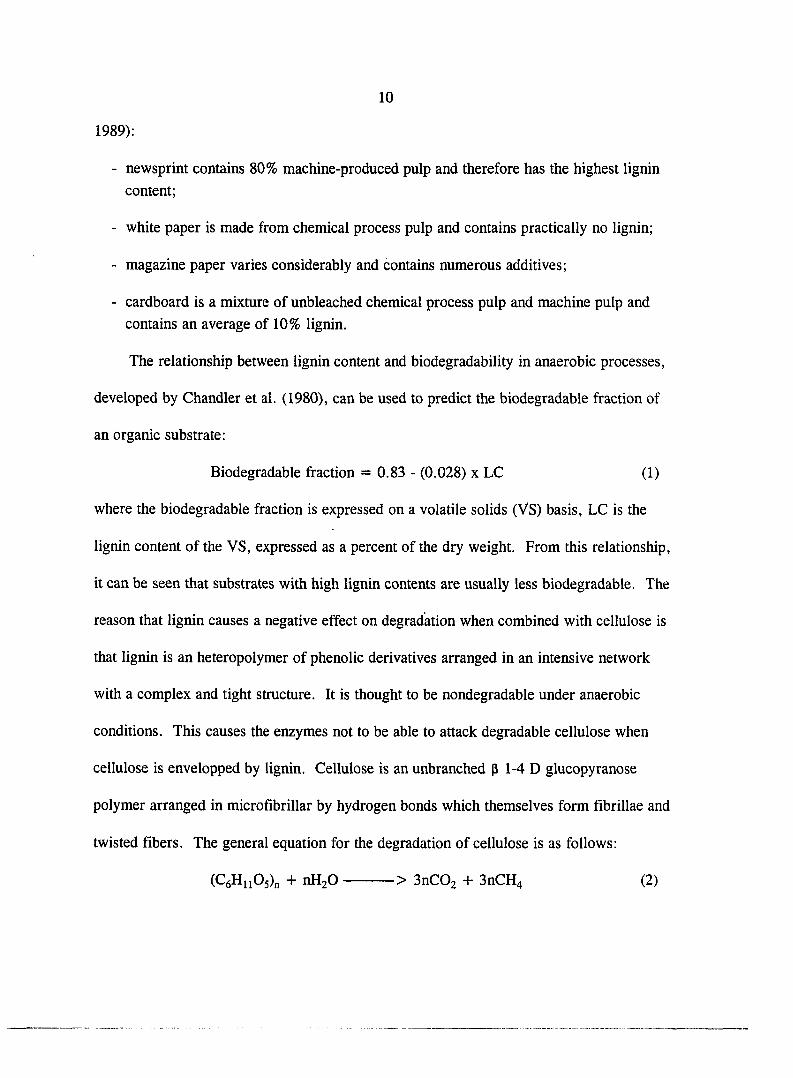
1989):
- newsprint contains 80% machine-produced pulp and therefore has the highest lignin
content;
- white paper is made from chemical process pulp and contains practically no lignin;
- magazine paper varies considerably and contains numerous additives;
- cardboard is a mixmre of unbleached chemical process pulp and machine pulp and
contains an average of 10% lignin.
The relationship between lignin content and biodegradability in anaerobic processes,
developed by Chandler et al. (1980), can be used to predict the biodegradable fraction of
an organic substrate:
Biodegradable fraction = 0.83 - (0.028) x LC (1)
where the biodegradable fraction is expressed on a volatile solids (VS) basis, LC is the
lignin content of the VS, expressed as a percent of the dry weight. From this relationship,
it can be seen that substrates with high lignin contents are usually less biodegradable. The
reason that lignin causes a negative effect on degradation when combined with cellulose is
that lignin is an heteropolymer of phenolic derivatives arranged in an intensive network
widi a complex and tight structure. It is thought to be nondegradable under anaerobic
conditions. This causes the enzymes not to be able to attack degradable cellulose when
cellulose is envelopped by lignin. Cellulose is an unbranched p 1-4 D glucopyranose
polymer arranged in microfibrillar by hydrogen bonds which themselves form fibrillae and
twisted fibers. The general equation for the degradation of cellulose is as follows:
(C6Hii05)n -I- nH20 > 3nC02 + 3nCH4 (2)
11
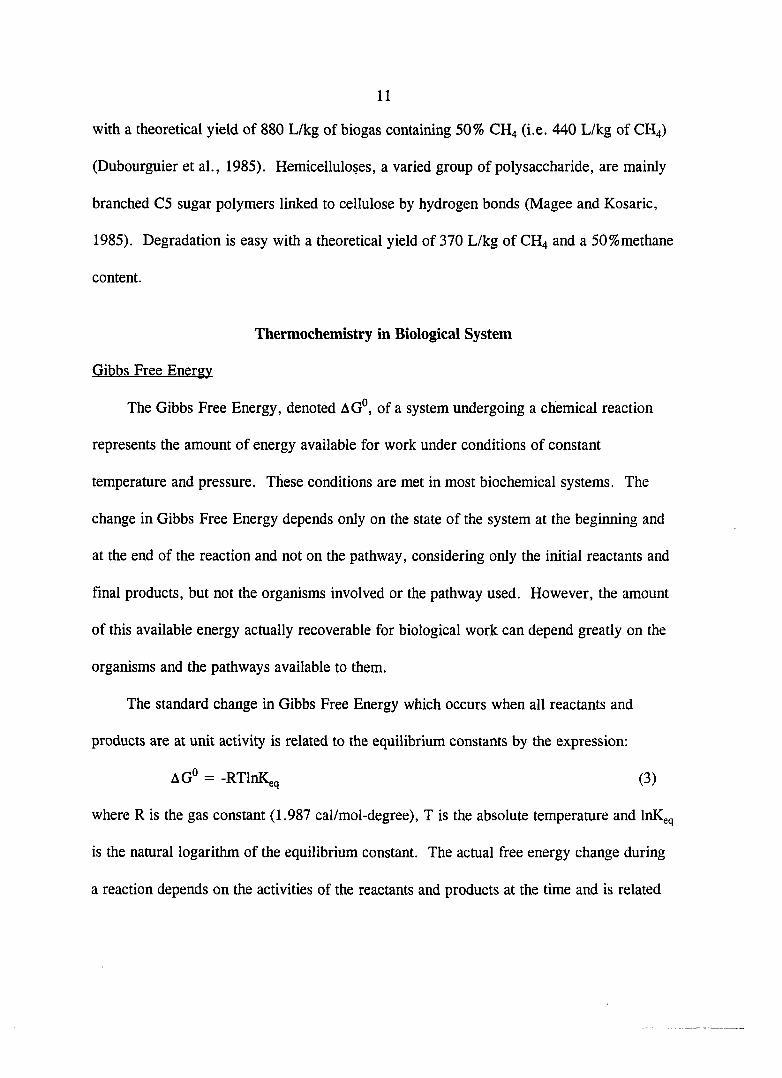
with a theoretical yield of 880 L/kg of biogas containing 50% CH4 (i.e. 440 L/kg of CH4)
(Dubourguier et al., 1985). Hemicelluloses, a varied group of polysaccharide, are mainly
branched C5 sugar polymers linked to cellulose by hydrogen bonds (Magee and Kosaric,
1985). Degradation is easy with a theoretical yield of 370 L/kg of CH4 and a 50%methane
content.
Thermochemistry in Biological System
Gibbs Free Energy
The Gibbs Free Energy, denoted AG°, of a system undergoing a chemical reaction
represents the amount of energy available for work under conditions of constant
temperature and pressure. These conditions are met in most biochemical systems. The
change in Gibbs Free Energy depends only on the state of the system at the beginning and
at the end of the reaction and not on the pathway, considering only the initial reactants and
final products, but not the organisms involved or the pathway used. However, the amount
of this available energy actually recoverable for biological work can depend greatly on the
organisms and the pathways available to them.
The standard change in Gibbs Free Energy which occurs when all reactants and
products are at unit activity is related to the equilibrium constants by the expression;
AG° = -RTlnKeq (3)
where R is the gas constant (1.987 cal/mol-degree), T is the absolute temperature and InK^q
is the namral logarithm of the equilibrium constant. The actual free energy change during
a reaction depends on the activities of the reactants and products at the time and is related
12
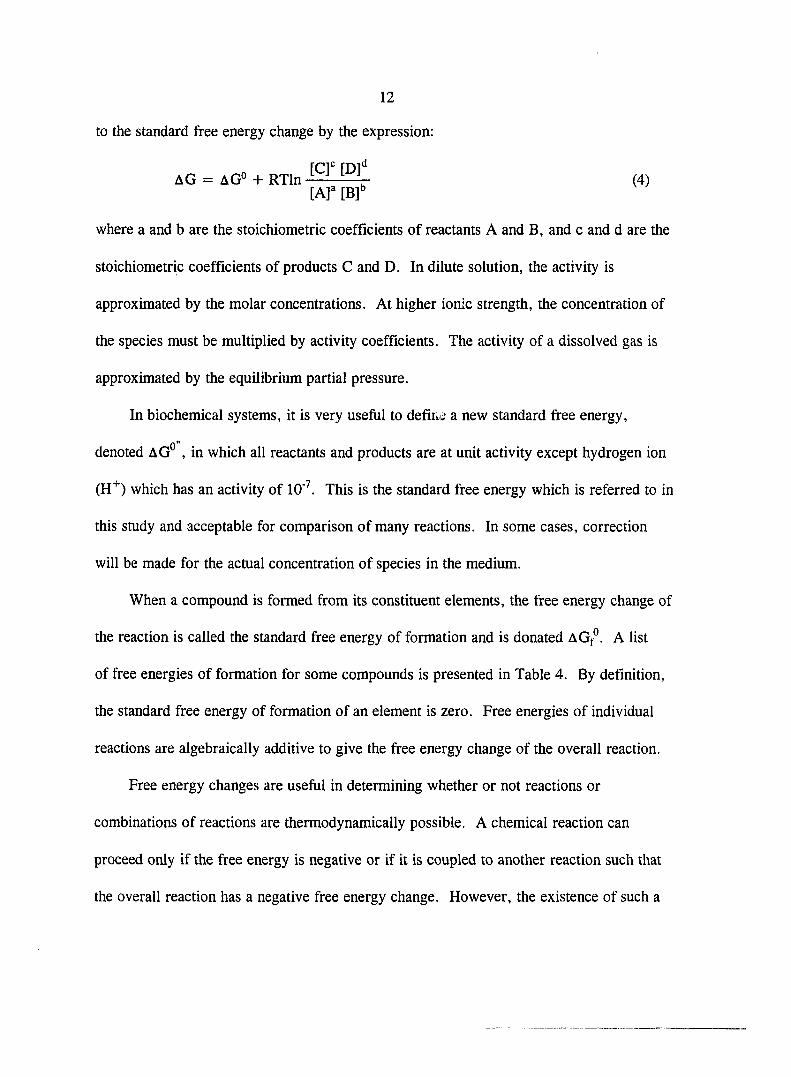
to the standard free energy change by the expression:
rCT^ FDl'' AG = AG" + RTln \ (4)
[A]^ [B]"
where a and b are the stoichiometric coefficients of reactants A and B, and c and d are the
stoichiometric coefficients of products C and D. In dilute solution, the activity is
approximated by the molar concentrations. At higher ionic strength, the concentration of
the species must be multiplied by activity coefficients. The activity of a dissolved gas is
approximated by the equilibrium partial pressure.
In biochemical systems, it is very useful to define a new standard free energy,
denoted AG° , in which all reactants and products are at unit activity except hydrogen ion
(H"*") which has an activity of 10"'. This is the standard free energy which is referred to in
this smdy and acceptable for comparison of many reactions. In some cases, correction
will be made for the actual concentration of species in the medium.
When a compound is formed from its constituent elements, the free energy change of
die reaction is called the standard free energy of formation and is donated AGf°. A list
of free energies of formation for some compounds is presented in Table 4. By definition,
the standard free energy of formation of an element is zero. Free energies of individual
reactions are algebraically additive to give the free energy change of the overall reaction.
Free energy changes are usefiil in determining whether or not reactions or
combinations of reactions are thermodynamically possible. A chemical reaction can
proceed only if the free energy is negative or if it is coupled to another reaction such that
the overall reaction has a negative free energy change. However, the existence of such a
13
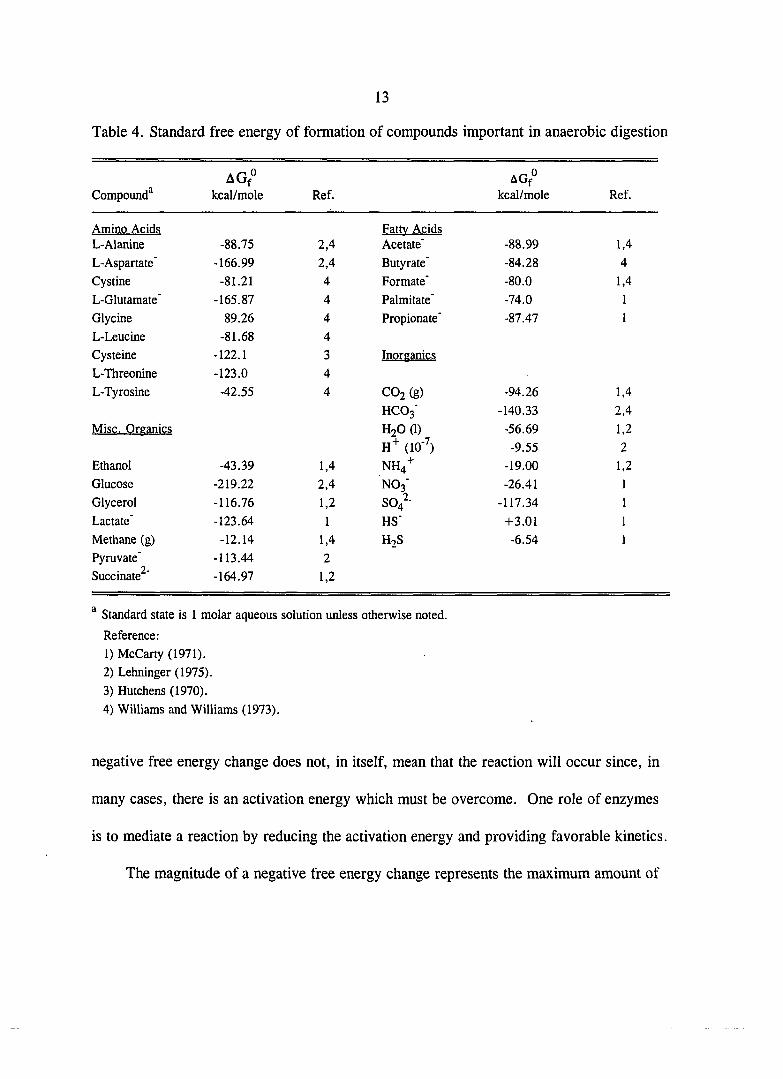
Table 4. Standard free energy of formation of compounds important in anaerobic digestion
Compound^
AGf°
kcal/mole Ref.
AG°
kcal/mole Ref.
Amino Acids Fattv Acids L-Alanine -88.75 2,4 Acetate" -88.99 1,4
L-Aspartate' -166.99 2,4 Butyrate' -84.28 4
Cystine -81.21 4 Formate' -80.0 1,4
L-Glutamate' -165.87 4 Palmitate" -74.0 1
Glycine 89.26 4 Propionate' -87.47 1
L-Leucine -81.68 4
Cysteine -122.1 3 Inorganics
L-Threonine -123.0 4
L-Tyrosine -42.55 4 CO2 (g) -94.26 1,4
HCO3- -140.33 2,4
Misc. Orpanics H2O (1) -56.69 1,2
H"^ (10'"') -9.55 2
Ethanol -43.39 1.4 NH4"^ -19.00 1,2
Glucose -219.22 2,4 NO3' -26.41 1
Glycerol -116.76 1,2 S04^- -117.34 1
Lactate" -123.64 1 HS' +3.01 1
Methane (g) -12.14 1,4 H2S -6.54 1
Pyruvate" -113.44 2
Succinate^" -164.97 1,2
® Standard state is 1 molar aqueous solution unless otherwise noted.
Reference:
1) McCarty (1971).
2) Lehninger (1975).
3) Hutchens (1970).
4) Williams and Williams (1973).
negative free energy change does not, in itself, mean that the reaction will occur since, in
many cases, there is an activation energy which must be overcome. One role of enzymes
is to mediate a reaction by reducing the activation energy and providing favorable kinetics.
The magnitude of a negative free energy change represents the maximum amount of

14
chemical work which can be done if the energy yielding reaction is coupled with another
reaction requiring energy. In any energy yielding reaction, only a portion of the energy
can be captured and used by organisms. The major means of recovering energy is in
enzymatically coupled reactions to adenosine triphosphate (ATP). The ATP is then used
for work, including synthesis, through other coupled reactions. The standard free energy
o" change (AG ) for the hydrolysis of ATP to ADP plus inorganic phosphate is -7.0
kcal/mole. Under physiological conditions the actual free energy of hydrolysis has been
estimated to be about -12.0 kcal/mole (Lehninger, 1975). A reaction in which ATP is
produced must provide at least this amount of energy. Thauer (1977) pointed out a cause
of inefficiency in metabolism, namely the "quantification" of energy pockets such as ATP.
Thus, if 70 kilojoules are available in a reaction, only 52 kilojoules can be stored as ATP
rather than all of it in 1.4 ATP, since free energy change for the formation of ATP from
ADP is 52 kilojoules per mole of ATP.
Fundamentals of Fermentative Hydrolysis
Most of the constituents within solid waste are insoluble and hence are not directly
available for assimilation by bacteria. Hydrolysis and liquefaction of complex and/or
insoluble organics are necessary to convert these materials (particulate carbohydrates,
lipids, and proteins) to a size and form that can pass through bacterial cell walls for use as
energy or nutrient sources under aerobic or anaerobic conditions. Specific enzymes are
produced and excreted by a group of hydrolytic organisms through adaptation and
recognition of the substrate for this specific purpose. (Kotze et al., 1969). Some basic
15
fermentative pathways for particulate carbohydrates, lipids, and proteins will be discussed
in this section.
Carbohydrates
Complete hydrolysis of carbohydrate yields monosaccharides, both hexoses and
pentoses, of which glucose is by far the most important quantitatively. It is the sole
constituent of both cellulose and starch, the two predominant carbohydrates in nature.
Small amounts of sugars also arise from the hydrolysis of noncarbohydrates which contain
monosaccharide units. The fermentation of glucose generally begins with the Embden-
Meyerhoff pathway (glycolysis), although other pathways, particularly the hexose
monophosphate shunt, may be important under some conditions or for some organisms.
Thus, as a first overall step, the fermentation of carbohydrate can be represented as the
oxidation of glucose to pyruvate (a key intermediate product for acidogenesis):
CgHizOg = 2CH3COCOO- + 2H+ + 4H (5)
where H represents a reduced electron "carrier" such as reduced nicotinamide adenine
dinucleotide (NADH).
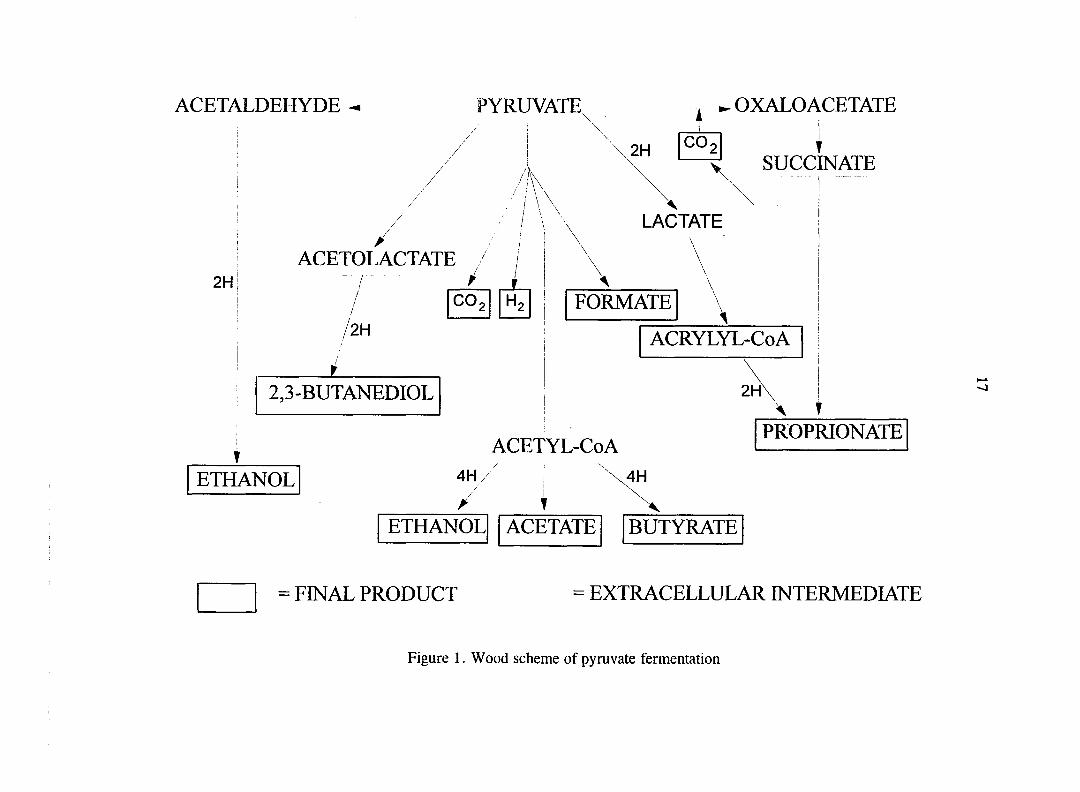
Pyruvate, however, can not be a significant final end product for an organism
because the electron "carriers" can not accumulate and the overall oxidation-reduction
balance must be maintained. The general pattern of pyruvate fermentation has been
presented by Wood (1961). Figure 1 shows the Wood scheme for pyruvate fermentation,
which was modified by Bryant (1979). Under the Wood scheme, pyruvate can undergo
three pathways via: (1) acetyl-CoA, (2) lactate and oxaloacetate, and (3) acetaldehyde and
16
acetolactate.
The various reactions for the formation of end products from pyruvate can be
combined with the oxidation of glucose to pyruvate to provide the requirement of
oxidation-reduction balance. These are listed in Table 5 along with the associated standard
free energy change (AG° ). This indicates that all the listed reactions which produce
volatile acids, whether or not hydrogen is also produced, are about equally favorable for
bacterial growth. What is probably more important in determining the acmal pathways is
coupling with ATP formation and the complexity of the biochemical machinery. The
similarity in the free energy changes indicates that the maximum number of ATP's formed
per glucose is probably the same for each reaction producing volatile acids. The probable
number of ATP's formed per glucose fermented is four for the acid phase of anaerobic
digestion (Sykes, 1975).
Proteins
Most nitrogenous organic material in solid waste is comprised of proteins which yield
amino acids upon complete hydrolysis. Other fermentable nitrogen containing components
of lesser quantitative importance are purines and pyrimidines, the building blocks of
nucleic acids. Understanding of the biochemical pathways for the fermentation of
nitrogenous material is less advanced than for carbohydrate fermentation, in part due to the
OXALOACETATE ACETALDEHYDE PYRUVATE
2H SUCCINATE
LACTATE
ACETOLACTATE 2H
2H
ACETYL-CoA
4H
= EXTRACELLULAR INTERMEDLVTE = FINAL PRODUCT
CO
CO
ETHANOL ACETATE
ETHANOL
FORMATE
BUTYRATE
PROPRIONATE
ACRYLYL-CoA
2,3-BUTANEDIOL
Figure 1. Wood scheme of pyruvate fermentation
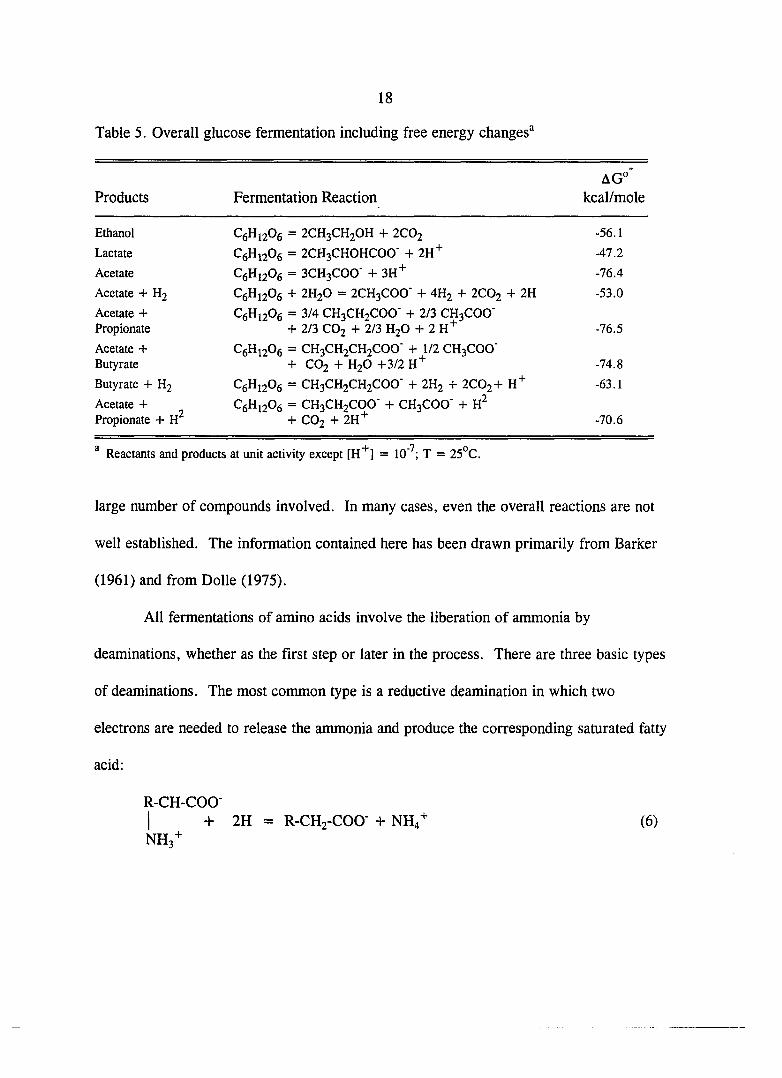
18
Table 5. Overall glucose fermentation including free energy changes®
AG°"
Products Fermentation Reaction kcal/mole
Ethanol C6H12O6 = 2CH3CH2OH + 2CO2 -56.1
Lactate CeHnOfi = 2CH3CHOHCOO" + 2H'^ -47.2
Acetate CeHiaOe = 3CH3COO" + -76.4
Acetate + H2 ^6^1206 + 2H2O = 2CH3COO" + 4H2 + 2CO2 + 2H -53.0
Acetate + Propionate
^6^1206 = 3/4 CH3CH2COO' + 2/3 CH3COO" + 2/3 CO2 + 2/3 H2O + 2 -76.5
Acetate + Butyrate
CeHnOe = CH3CH2CH2COO" + 1/2 CH3COO" + CO2 + H2O +3/2 -74.8
Butyrate + H2 CeHijOg = CH3CH2CH2COO" + 2H2 + 2CO2+ H"^ -63.1
Acetate + 2 Propionate + H
CfiHnOfi = CH3CH2COO" + CH3COO" + + CO2 + 2H"^ -70.6
® Reactants and products at unit activity except [H"*"] = 10"^; T = 25°C.
large number of compounds involved. In many cases, even the overall reactions are not
well established. The information contained here has been drawn primarily from Barker
(1961) and from Dolle (1975).
All fermentations of amino acids involve the liberation of ammonia by
deaminations, whether as the first step or later in the process. There are three basic types
of deaminations. The most common type is a reductive deamination in which two
electrons are needed to release the ammonia and produce the corresponding saturated fatty
acid:
R-CH-COO" I + 2H = R-CHa-COO" + NH4+ (6) NH3+

19
The second type is an oxidative deamination in which two electrons are removed,
producing a keto acid and ammonia:
O R-CH-COO" 11
I + H2O = R-CH-COO" + NH4+ + 2H (7) NH3+
The keto acid can be oxidatively decarboxylated to form a fatty acid with one less carbon
than the original amino acid:
0
1 R-CH-COO- + H2O = R-COO" + CO2 + 2H (8)
Finally, in a desamration deamination, the end product is an unsaturated fatty acid:
R-CH2-CH-C00-I = R-CH=CH-COO- + NH4+ (9) NHg-^
The fermentation of amino acids can be accomplished through two basic patterns. In
the first, a single amino acid is fermented to a combination of end products which maintain
the oxidation-reduction balance. In the second pattern (Stickland Reaction), pairs of amino
acids are fermented; one is oxidized while the other is reduced.
The overall reaction in the fermentation of single amino acids can be understood by
first considering the types of deamination(s) and then the products necessary to achieve an
overall oxidation-reduction balance. Since pyruvate is often an intermediate in amino acid
fermentation, the reaction producing volatile acids from pyruvate, as discussed under
20
carbohydrate fermentations, are also important. The overall reactions of some amino acid
fermentations are listed in Table 6.
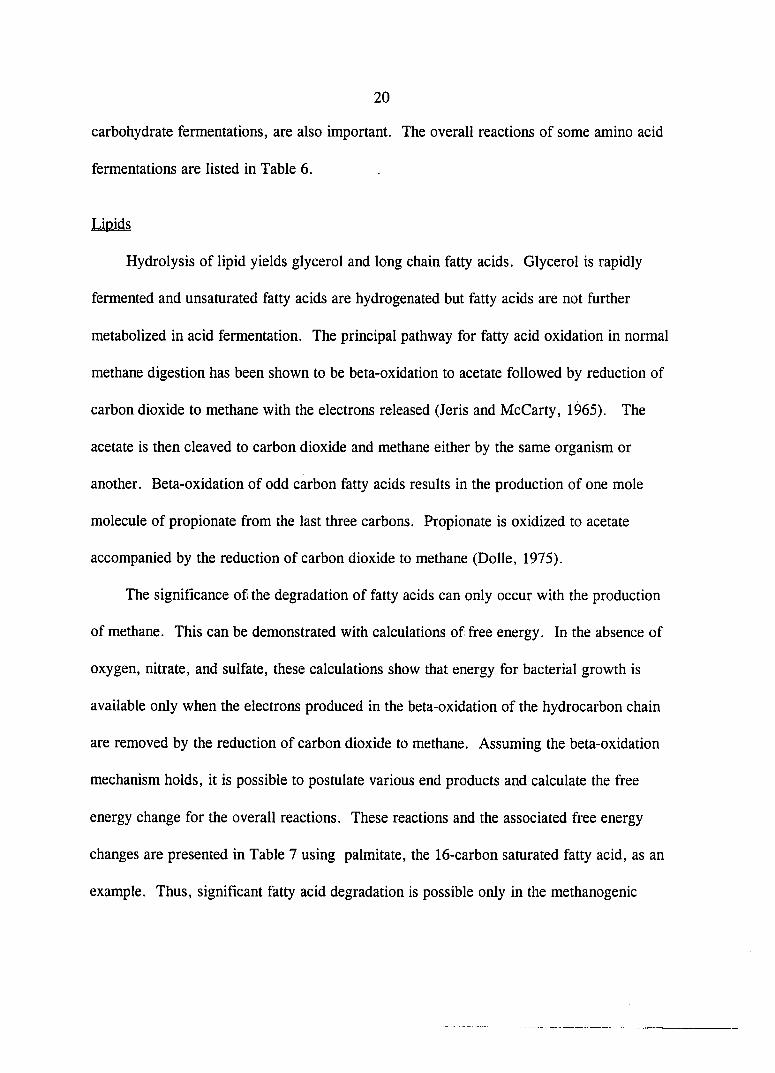
Lipids
Hydrolysis of lipid yields glycerol and long chain fatty acids. Glycerol is rapidly
fermented and unsaturated fatty acids are hydrogenated but fatty acids are not further
metabolized in acid fermentation. The principal pathway for fatty acid oxidation in normal
methane digestion has been shown to be beta-oxidation to acetate followed by reduction of
carbon dioxide to methane with the electrons released (Jeris and McCarty, 1965). The
acetate is then cleaved to carbon dioxide and methane either by the same organism or
another. Beta-oxidation of odd carbon fatty acids results in the production of one mole
molecule of propionate from the last three carbons. Propionate is oxidized to acetate
accompanied by the reduction of carbon dioxide to methane (Dolle, 1975).
The significance of the degradation of fatty acids can only occur with the production
of methane. This can be demonstrated with calculations of free energy. In the absence of
oxygen, nitrate, and sulfate, these calculations show that energy for bacterial growth is
available only when the electrons produced in the beta-oxidation of the hydrocarbon chain
are removed by the reduction of carbon dioxide to methane. Assuming the beta-oxidation
mechanism holds, it is possible to postulate various end products and calculate the free
energy change for the overall reactions. These reactions and the associated free energy
changes are presented in Table 7 using palmitate, the 16-carbon saturated fatty acid, as an
example. Thus, significant fatty acid degradation is possible only in the methanogenic
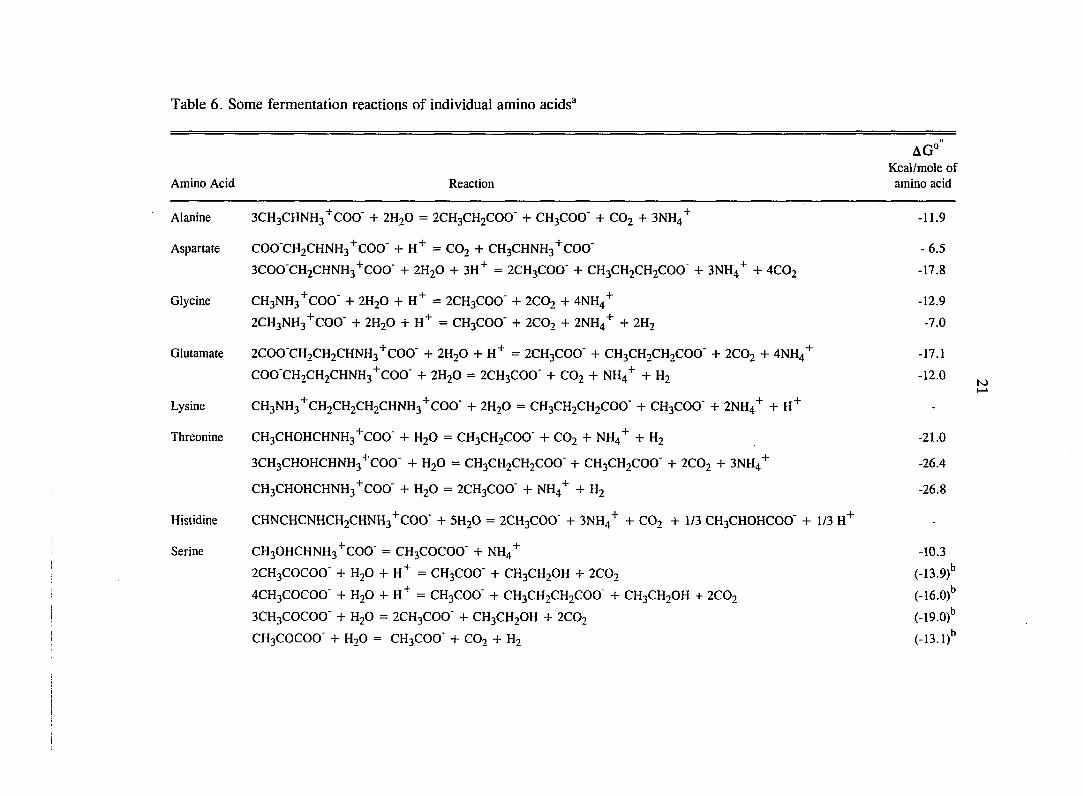
Table 6. Some fermentation reactions of individual amino acids®
AG°" Kcal/mole of
Amino Acid Reaction amino acid
Alanine 3CH3CHNH3"^COO'+ 2H2O = 2CH3CH2COO'+ CH3COO" + CO2 + 3NH4"^ -11.9
Aspanate COO'CH2CHNH3"^COO" + H"^ = CO2 + CH3CHNH3"*^COO" - 6.5
3C00'CH2CHNH3"^C00" + ZHjO + 3H"^ = 2CH3COO" + CH3CH2CH2COO" + 3NH4^ + 4CO2 -17.8
Glycine CH3NH3"^C00" + 2H2O + H"^ = 2CH3COO' -I- 2CO2 + 4NH4+ -12.9
2CH3NH3"*'COO" -t- 2H2O -i- H"^ = CHjCOO' + 2CO2 + 2NH4'^ -I- 2H2 -7.0
Glutamate 2COO"CH2CH2CHNH3"^COO' -I- 2H2O + H"^ = 2CH3COO" + CH3CH2CH2COO" + 2CO2 + 4NH4'^ -17.1
COO'CHjCHjCHNHa'^COO' + 2H2O = 2CH3COO" -I- COj + NH4"^ -h Hj -12.0
Lysine CH3NH3'^CH2CH2CH2CHNH3"^COO" + 2H2O = CH3CH2CH2COO" -I- CH3COO" + 2NH4"^ + H"^
Threonine CH3CHOHCHNH3'^COO" + H2O = CH3CH2COO' + CO2 + NH4"^ -f- H2 -21.0
3CH3CH0HCHNH3^C00" -I- H2O = CH3CH2CH2COO' -t- CH3CH2COO' + 2CO2 + 3NH4"^ -26.4
CH3CH0HCHNH3"^C00" + H2O = 2CH3COO" + NH4"^ + H2 -26.8
Histidine CHNCHCNHCH2CHNH3"^COO' + 5H2O = 2CH3COO" -1- 3NH4'^ -h CO2 -t- 1/3 CH3CHOHCOO" -I- 1/3 H"^
Serine CH30HCHNH3"^C00" = CH3COCOO" 4- NH4"^ -10.3
2CH3COCOO" -f- H2O -t- H"^ = CH3COO" -I- CH3CH2OH + 2CO2 (-13.9)''
4CH3COCOO' -t- H2O + H"^ = CH3COO" -I- CH3CH2CH2COO" + CH3CH2OH + 2CO2 (-16.0)''
3CH3COCOO" -h H2O = 2CH3COO" + CH3CH2OH + 2CO2 (-19.0)''
CH3COCOO' -t- H2O = CH3COO" + CO2 -t- H2 (-13.1)''

Table 6. (Continued)
AG°
Kcal/mole of
Amino Acid Reaction amino acid
Serine 4CH3COCOO' + 2H2O = SCHjCOO" + COj + H"^ (-19.0)''
Cysteine HSCH2CHNH3"^COO" + H2O = H^S + NH4'^ + CH3COCOO" -1.1
• + -7 o Reactants and products at unit activity except [H ] = 10 ; T = 25 C.
These values of AG° are only for fermentation of pyruvate; AG° for overall amino acid fermentation
is obtained by adding the AG° for the deamination reaction which produces pyruvate.
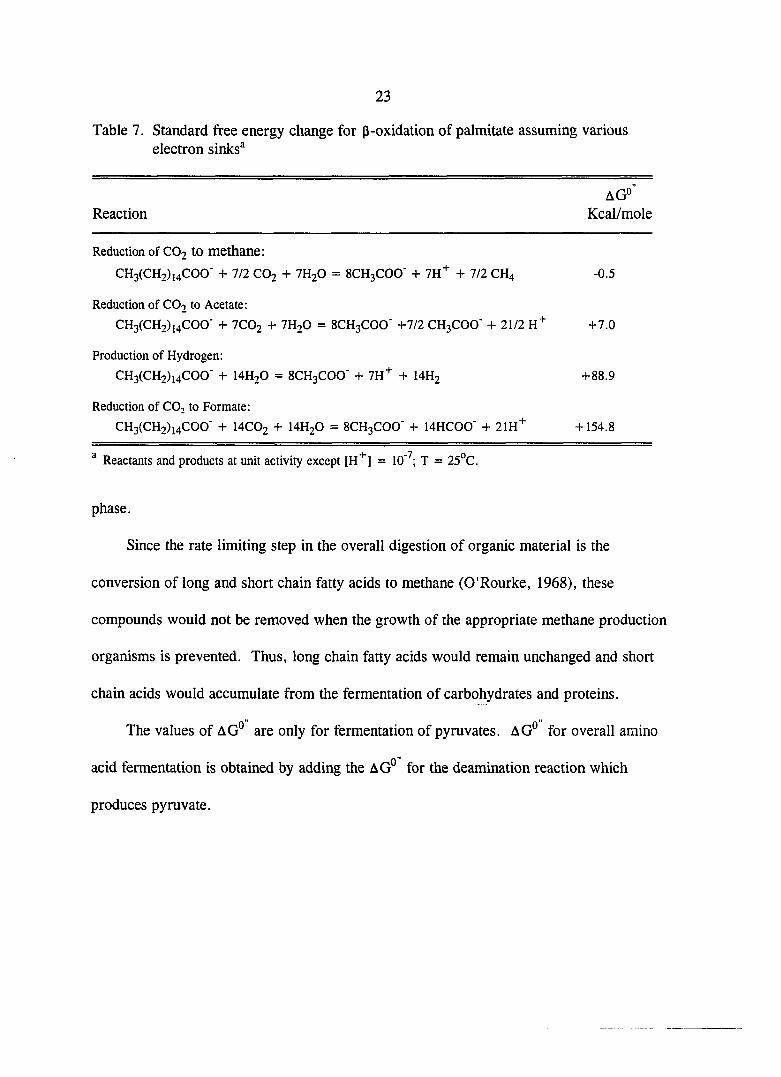
23
Table 7. Standard free energy change for p-oxidation of palmitate assuming various electron sinks''
aG°" Reaction Kcal/mole
Reduction of CO2 to methane:
CH3(CH2)i4COO' + 7/2 CO2 + 7H2O = 8CH3COO" + 7H"*" + 7/2 CH4 -0.5
Reduction of COo to Acetate;
CH3(CH2)i4COO' H- 7CO2 -I- 7H2O = 8CH3COO' +112 CHsCOO" -t- 21/2 H"*" -t-7.0
Production of Hydrogen:
CH3(CH2)i4COO' -I- I4H2O = 8CH3COO' + 7H"*" -I- I4H2 +88.9
Reduction of CO, to Formate:
CH3(CH2)i4COO" + I4CO2 + I4H2O = 8CH3COO" + 14HC00' -h 21H"^ +154.8
^ Reactants and products at unit activity except [H"*"] = 10"^; T = 25°C.
phase.
Since the rate limiting step in the overall digestion of organic material is the
conversion of long and short chain fatty acids to methane (O'Rourke, 1968), these
compounds would not be removed when the growth of the appropriate methane production
organisms is prevented. Thus, long chain fatty acids would remain unchanged and short
chain acids would accumulate from the fermentation of carbohydrates and proteins.
The values of AG° are only for fermentation of pyruvates. AG° for overall amino
acid fermentation is obtained by adding the AG° for the deamination reaction which
produces pyruvate.

24
Overall Considerations for Anaerobic Digestion
In environmental engineering, it has become common practice to measure organic
compounds in terms of the weight of oxygen required to oxidize completely the compound
to CO2, H2O, NO3", and S04^'. This is the theoretical oxygen demand and can be readily
calculated from the stoichiometry of a reaction. The oxygen demand can also be measured
experunentally using potassium dichromate in an acid medium (Standard Methods, 1985),
in which case it is referred to as the chemical oxygen demand (COD). The COD is not
precisely equivalent to the theoretical oxygen demand in that ammonia, organic nitrogen,
and some organic compounds are not oxidized.
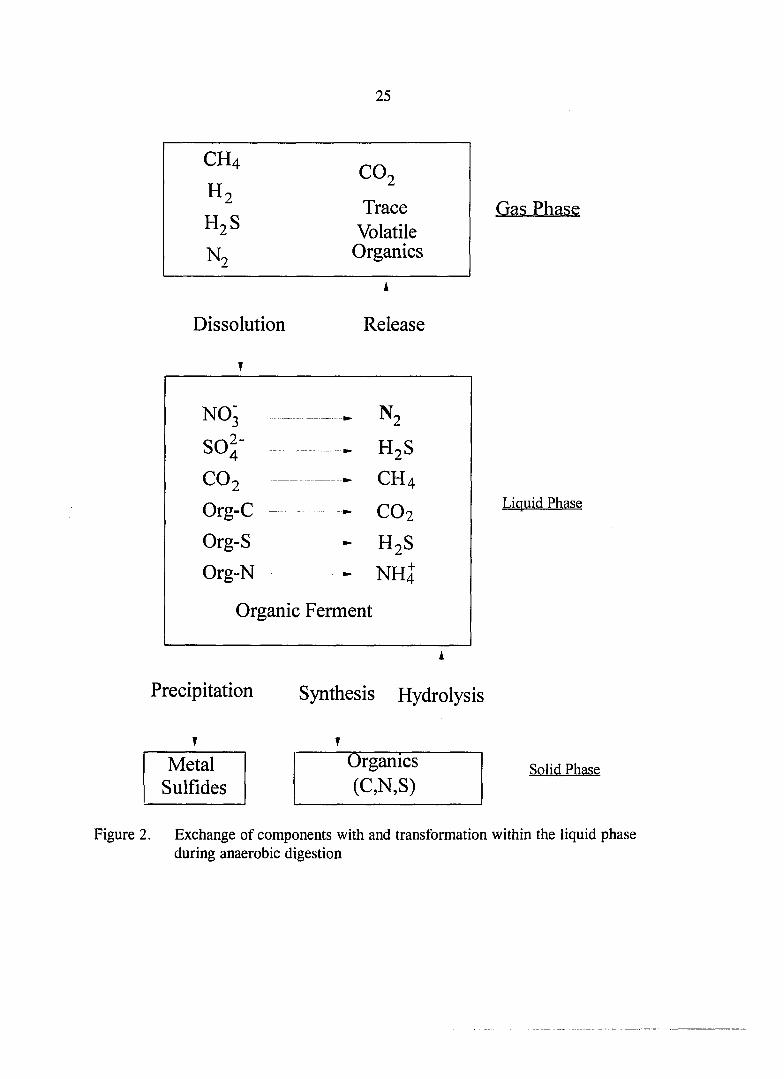
Figure 2 is a schematic of the important transformations and exchanges between
phases which occur in anaerobic digestion. The only process which increases the COD of
the solution is the hydrolysis of particulate organics to soluble materials. COD may be
removed from solution by synthesis of cells, by precipitation of metal sulfides, and by the
production of gases. Most importantly, fermentations and carbon dioxide reduction do not
change the solution COD except to the extent that cells and reduced gases (CH4, Ht, HoS,
and NH3) are produced and leave the system.
The organics, solubilized through hydrolysis, are oxidized or fermented, resulting in
a variety of inorganic and organic end products such as ammonia, hydrogen sulfide, carbon
dioxide, methane, hydrogen, and cells. The gases hydrogen and methane represent
important losses of COD, but carbon dioxide release does not affect the COD. The release
of ammonia and hydrogen sulfide from organics and incorporation into cellular material
25
CH4
H i CO2
Trace H2S Volatile Nj Organics
Gas Phase
Dissolution Release
NOj - - - Nj
SO4" HjS
CO2 CH4
Org-C CO2
Org-S - - HjS
Org-N NH4
Organic Ferment
Liquid Phase
Precipitation Synthesis Hydrolysis
Metal Sulfides
Organics C,N,S
Solid Phase
Figure 2. Exchange of components with and transformation within the liquid phase during anaerobic digestion
26
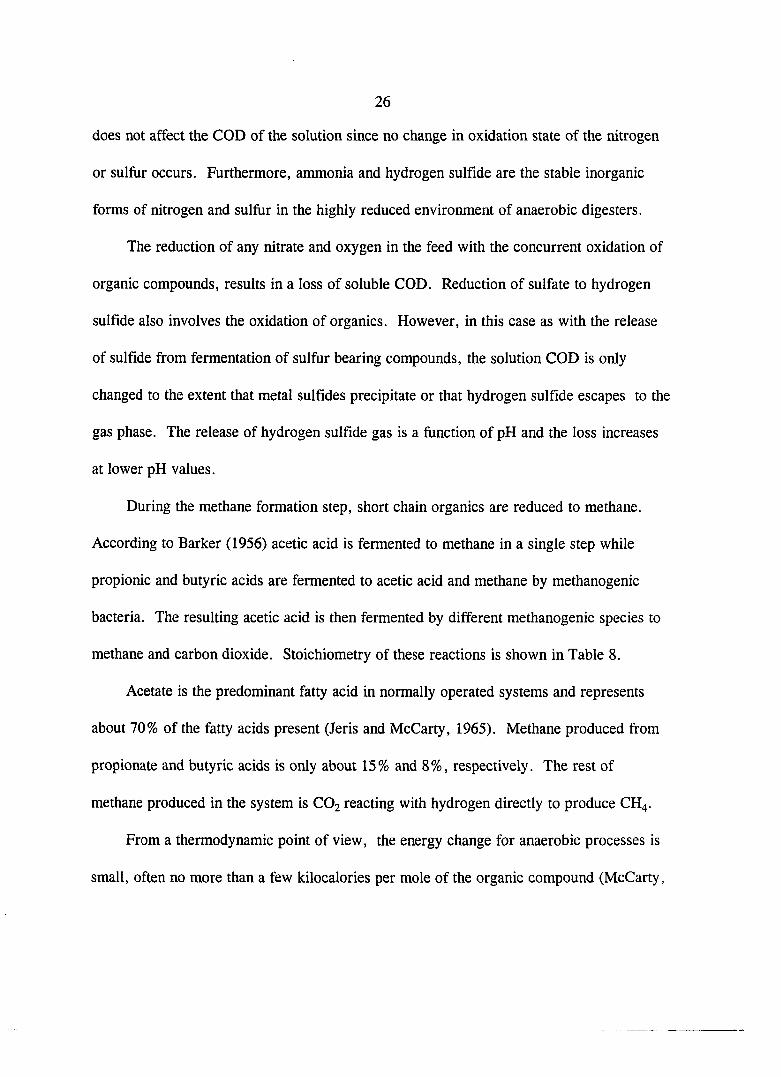
does not affect the COD of the solution since no change in oxidation state of the nitrogen
or sulfur occurs. Furthermore, ammonia and hydrogen sulfide are the stable inorganic
forms of nitrogen and sulfur in the highly reduced environment of anaerobic digesters.
The reduction of any nitrate and oxygen in the feed with the concurrent oxidation of
organic compounds, results in a loss of soluble COD. Reduction of sulfate to hydrogen
sulfide also involves the oxidation of organics. However, in this case as with the release
of sulfide from fermentation of sulfur bearing compounds, the solution COD is only
changed to the extent that metal sulfides precipitate or that hydrogen sulfide escapes to the
gas phase. The release of hydrogen sulfide gas is a function of pH and the loss increases
at lower pH values.
During the methane formation step, short chain organics are reduced to methane.
According to Barker (1956) acetic acid is fermented to methane in a single step while
propionic and butyric acids are fermented to acetic acid and methane by methanogenic
bacteria. The resulting acetic acid is then fermented by different methanogenic species to
methane and carbon dioxide. Stoichiometry of these reactions is shown in Table 8.
Acetate is the predominant fatty acid in normally operated systems and represents
about 70% of the fatty acids present (Jeris and McCarty, 1965). Methane produced from
propionate and butyric acids is only about 15% and 8%, respectively. The rest of
methane produced in the system is CO2 reacting with hydrogen directly to produce CH4.
From a thermodynamic point of view, the energy change for anaerobic processes is
small, often no more than a few kilocalories per mole of the organic compound (McCarty,

27
1977). Many organic compounds are fermented to CH4 by different groups of
microorganisms operating in series. Thus, the relatively little energy yield from the
overall conversion of complex organics to CH4 gas must be distributed among the different
bacteria involved.
Table 8. Free energy changes for various anaerobic reactions^
AG" (KJ) AG" (KJ) Reaction per reaction per electron pair
CgHijOg + 2 CH3COO" = 2 CH3CH2CH2COO' + 2 HCO3" + 2 H"^ -302.9 -154.4
CgHiaOg + H2O =CH3CH2C00" + CH3COO" + HCO3" + 3 H+ + H2 -282.4 -
141.2 CgHijOg + H2O = 2 CH3COO" + CH4 + HCO3' + 3 H"^ -342.3 -85.6
CH3CH2OH + H2O = CH3COO" + H"*" + 2 H2 -1-9.6 H-4.8
CH3CH2CH2COO' + H2O = 2 CH3COO" + H"^ + 2 H2 -f48.1 -(-24.0
2 CH3CHOHCOO" + H2O = 2 CH3COO" + CH4 + HCO3" + 3 H"^ -143.6 -35.9
2 CH3CH2OH + HCO3" = 2 CH3COO" + CH4 + HCO3" + H"*" -116.4 -29.1
4 CH3CH2COO' + 3 H2O = 4 CH3COO" + 3 CH4 + 2H'^ -102.4 -8.5
C6H12O6 + 3 H2O = 3 CH4 + 3 HCO3" + 3 H"*" -404.3 -101.1
2 CH3CHOHCOO" + 3 H2O = 3 CH4 + 3 HCO3" + -205.9 -51.5
^ Reactants and products at unit activity except [H"*"] = 10"^ ; T = 25°C.
Based on the reaction stoichiometry, 0.25 pounds of COD reduction results in 1
pound of CH4 production, which is equivalent to 6000 Btu/lb COD as methane. Typically,
80 to 90% of the biochemical energy is retained in the CH4 and only 5 to 10% is retained
in the bacterial cells. Table 8 shows the free energy changes and efficiencies of some
anaerobic reactions.
28
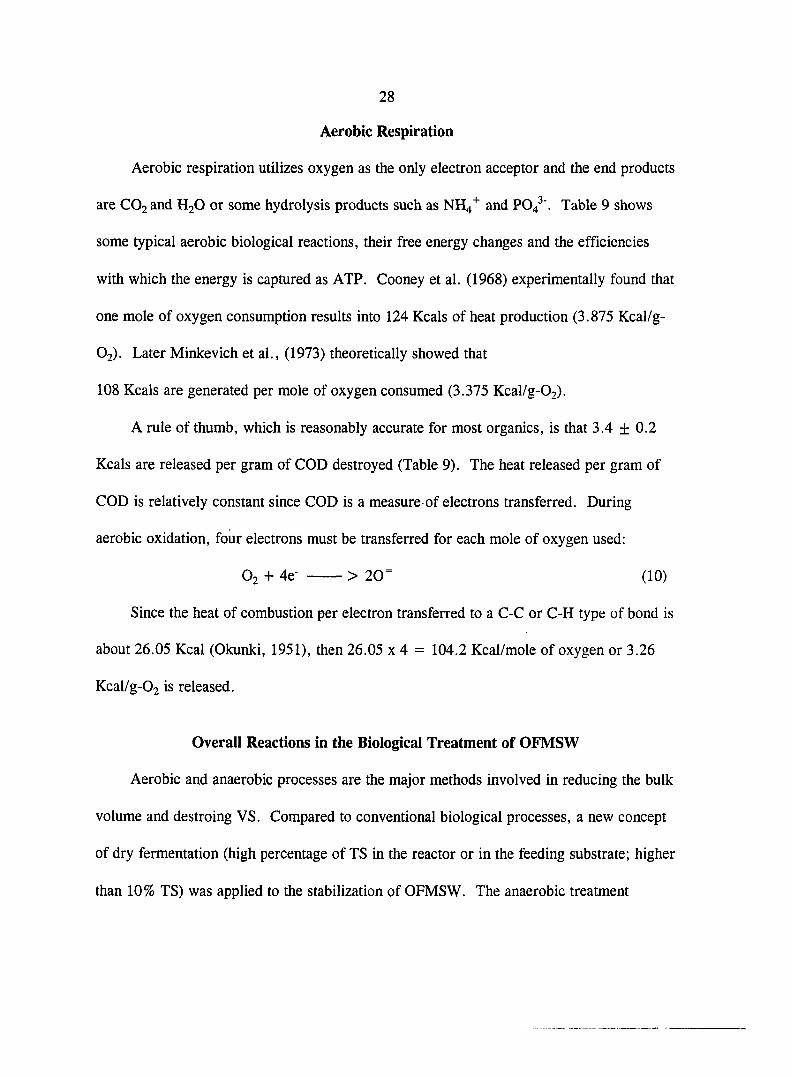
Aerobic Respiration
Aerobic respiration utilizes oxygen as the only electron acceptor and the end products
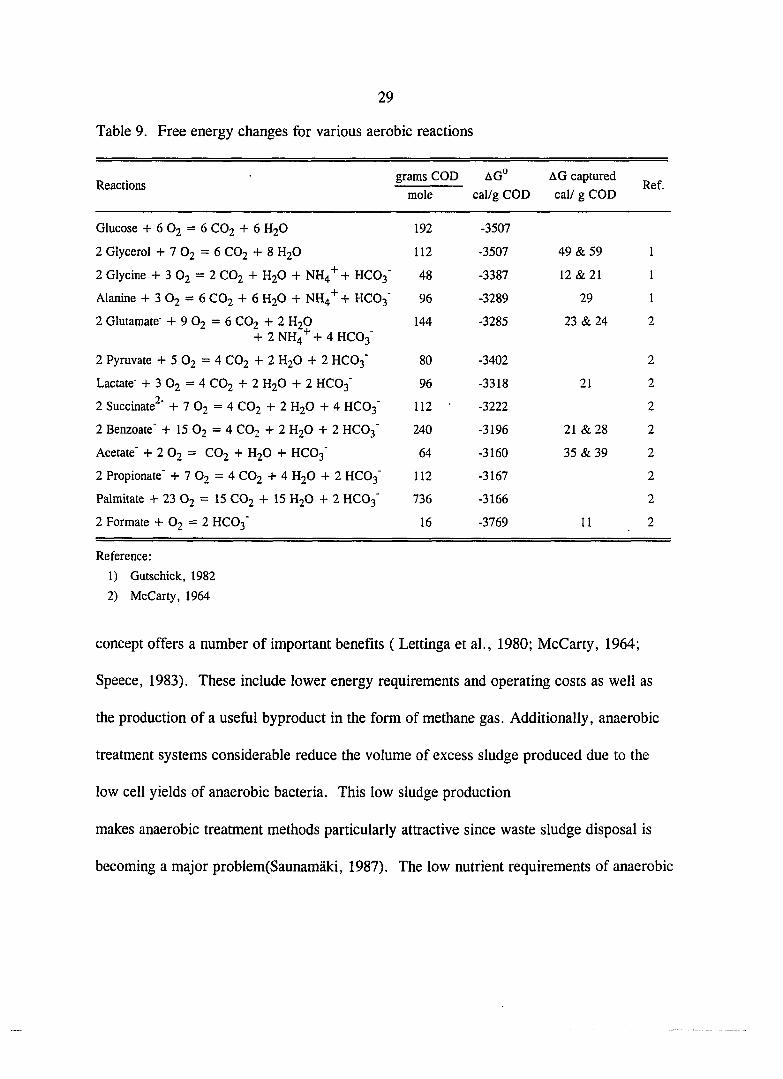
are CO2 and H2O or some hydrolysis products such as NH4"^ and P04^'. Table 9 shows
some typical aerobic biological reactions, their free energy changes and the efficiencies
with which the energy is captured as ATP. Cooney et al. (1968) experimentally found that
one mole of oxygen consumption results into 124 Kcals of heat production (3.875 Kcal/g-
O2). Later Minkevich et al., (1973) theoretically showed that
108 Kcals are generated per mole of oxygen consumed (3.375 Kcal/g-02).
A rule of thumb, which is reasonably accurate for most organics, is that 3.4 ± 0.2
Kcals are released per gram of COD destroyed (Table 9). The heat released per gram of
COD is relatively constant since COD is a measure of electrons transferred. During
aerobic oxidation, four electrons must be transferred for each mole of oxygen used:
O2 + 4e- > 20= (10)
Since the heat of combustion per electron transferred to a C-C or C-H type of bond is
about 26.05 Kcal (Okunki, 1951), then 26.05 x 4 = 104.2 Kcal/mole of oxygen or 3.26
Kcal/g-02 is released.
Overall Reactions in the Biological Treatment of OFMSW
Aerobic and anaerobic processes are the major methods involved in reducing the bulk
volume and destroing VS. Compared to conventional biological processes, a new concept
of dry fermentation (high percentage of TS in the reactor or in the feeding substrate; higher
than 10% TS) was applied to the stabilization of OFMSW. The anaerobic treatment
29
Table 9. Free energy changes for various aerobic reactions
Reactions grams COD
0 0
< AG captured
Ref. Reactions mole cal/g COD cal/ g COD
Ref.
Glucose + 6 O2 = 6 CO2 + 6 H2O 192 -3507
2 Glycerol + 7 O2 = 6 CO2 + 8 HjO 112 -3507 4 9 & 5 9 1
2 Glycine + 3 O2 = 2 CO2 + H2O + NH4'^+ HCO3" 48 -3387 1 2 & 2 1 1
Alanine + 3 O2 = 6 CO2 + 6 H2O + NH4"^ + HCO3' 96 -3289 29 1
2 Glutamate" + 9 O2 = 6 CO2 + 2 H2O 144 -3285 2 3 & 2 4 2 + 2 NH4'^+ 4 HCO3"
2 Pyruvate + 5 O2 = 4 CO2 + 2 H2O + 2 HCO3' 80 -3402 2
Lactate' + 3 O2 — 4 CO2 2 H2O + 2 HCO3 96 -3318 21 2
2 Succinate^' + 7 O2 = 4 CO2 + 2 H2O + 4 HCO3" 1 1 2 • -3222 2
2 Benzoate' + 15 O2 = 4 CO2 + 2 H2O + 2 HCO3" 240 -3196 2 1 & 2 8 2
Acetate + 2 O2 = CO2 + H2O + HCO3 64 -3160 35 & 39 2
2 Propionate' + 7 O2 = 4 CO2 + 4 H2O + 2 HCO3" 1 1 2 -3167 2
Palmitate + 23 Oj = 15 CO2 + 15 H2O + 2 HC03' 736 -3166 2
2 Formate + O2 = 2 HCO3' 16 -3769 11 2
Reference:
1) Gutschick, 1982
2) McCarty, 1964
concept offers a number of important benefits ( Lettinga et al., 1980; McCarty, 1964;
Speece, 1983). These include lower energy requirements and operating costs as well as
the production of a useful byproduct in the form of methane gas. Additionally, anaerobic
treatment systems considerable reduce the volume of excess sludge produced due to the
low cell yields of anaerobic bacteria. This low sludge production
makes anaerobic treatment methods particularly attractive since waste sludge disposal is
becoming a major probIem(Saunamaki, 1987). The low nutrient requirements of anaerobic
30
bacteria is also an advantage in the treatment of nutrient deficient wastewaters such as
those from pulp and paper mills (Maatta, 1985). Furthermore, the improved biomass
retention in high rate anaerobic treatment systems allows the application of high organic
loading rates, reducing the required volume.
The most significant drawbacks which have hampered the widespread application of
anaerobic systems for wastewater treatment in the past are related to the low growth rates
and yield of anaerobic bacteria. Thus, maintenance of high biomass concentrations within
the reactor is required in order to achieve high reaction rates in spite of the slow growth
rates of methanogenic bacteria. Consequently, relatively long start-up periods are needed
for anaerobic reactors in order to obtain high concentrations for active biomass. Likewise,
recovery of the methanogenic population after a toxic shock may be time consuming.
Aerobic Reactions
The major reactions involved in the aerobic composting process include;
i. solubilization of solids
ii. organic matter oxidation
iii. autooxidation of cells
The organic solids which serve as substrate for the microorganisms consist of many
organic compounds. Cellulose, lipids, proteins, sugars, alcohols, aromatic compounds,
purines, and carboxylic acids are among the organic substrates which can be used by the
mesophiles or thermophiles.

31
Organics can be utilized by microorganisms, only if they can diffuse through the cell
wall. Therefore, hydrolysis of the particulate organics is the first step in the use of
biodegradable matter by bacteria. The principles of hydrolysis have been illustrated
previously in this chapter. The rate of hydrolysis is a function of many factors such as pH,
temperature, microbial biomass, type of particulate substrate, and the remaining
concentration of degradable particulates. At constant temperature and pH, the hydrolysis
rate of particulates is approximately first order with respect to the remaining concentration
of degradable particulate matter (Eastman and Ferguson, 1981).
Oxidation of organic matter is a combustion reaction which can be represented as :
CxHyO^ + (x + 0.25y - 0.5z) O2 > XCO2 + 0.5y H2O (11)
If the organic matter contains nitrogen and sulfur, nitrate and sulfate form as oxidation
products.
Synthesis of cell material from organic substrates can be formulated as :
C^HyO^ + NH3 + (x + 0.25y -0.5z -5) O2 >
C5H7NO2 + (x-5) CO2 + 0.5 (y-4) H.O (12)
when the empirical composition of cells is C5H7NO2.
Organism decay decreases cell mass. Allen (1953) has indicated that cell material is
rapidly destroyed during the growth of thermophiles. Due to both higher organism decay
rates and higher maintenance energy, the observed yield (net growth) and oxidation of cells
is called "endogenous respiration" and can be represented by the following reaction :
C5H7NO2 + 5 O2 > 5 CO2 + 2 H2O + NH3 (13)
At long detention times and at mesophilic temperatures, NH3 forms but is further oxidized

32
to nitrate (NO3 ).
McCarty (1975) showed that overall biological reaction stoichiometry can be devised
by summing the separate reactions for energy and synthesis. The balanced chemical
reactions can be obtained from:
R = f, R, + f3 R, - Rd (14)
where,
Rj; half reaction for oxidation of one electron equivalent of electron donor
Rg! half reaction for oxidation of one electron equivalent of electron acceptor
R(.: half reaction for oxidation of one electron equivalent for bacterial cells
R: overall stoichiometric equation occurring in the reactor
f^: the portion of the electron donor which is coupled with the electron acceptor (the portion used for energy)
fj: the portion of the electron donor which is coupled with cell formation (the portion used for synthesis)
Since the equation has to balance :
fs + fe = 1 (15)
McCarty (1975) also showed that fj can be estimated from:
where,
fj: biodegradable fraction of active microorganisms
b: organism decay rate, (1/time)
t^: sludge retention time, (time)
ae = 1/(1+A), growth yield coefficient, equivalents of substrate synthesis per equivalent utilized by microorganisms
33
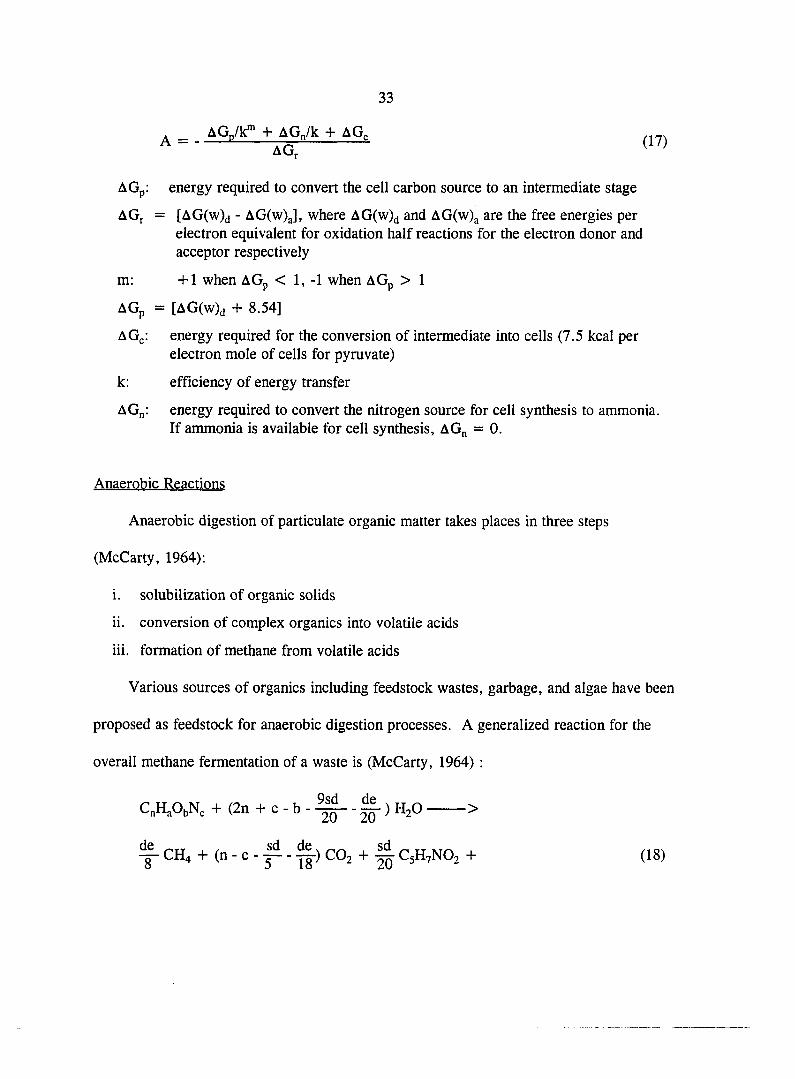
A = - AGp/k*" + AGn/k + AG, AG.
(17)
AGp; energy required to convert the cell carbon source to an intermediate stage
AGr = [AG(w)(i - AG(w)a], where AG(w)(j and AG(w)a are the free energies per electron equivalent for oxidation half reactions for the electron donor and acceptor respectively
AGp = [AG(w)d + 8.54]
AGj,: energy required for the conversion of intermediate into cells (7.5 kcal per electron mole of cells for pyruvate)
AG^: energy required to convert the nitrogen source for cell synthesis to ammonia. If ammonia is available for cell synthesis, AGp = 0.
Anaerobic Reactions
Anaerobic digestion of particulate organic matter takes places in three steps
(McCarty, 1964);
i. solubilization of organic solids
ii. conversion of complex organics into volatile acids
iii. formation of methane from volatile acids
Various sources of organics including feedstock wastes, garbage, and algae have been
proposed as feedstock for anaerobic digestion processes. A generalized reaction for the
overall methane fermentation of a waste is (McCarty, 1964) :
m: + 1 when AGp <1,-1 when AGp > 1
k; efficiency of energy transfer
C^H^ObN, + (2n + c - b - -^ - ) H2O >
I-CH4 + (n -c -^ -^ )C02 + C5H7N02 + (18)

34
(c -^ )NH/ + (c -^ )HC03-
where,
d : (4n + a - 2b -3c)
s : fraction of waste converted to cells
e : fraction of waste converted to methane
s + e = 1
Previous Work in Treating OFMSW
Biological treatment of OFMSW contains aerobic, anaerobic, and a combination of
anaerobic and aerobic processes. Windrow and Drainco are main aerobic composting
processes. However, the problems encountered during aerobic composting are possibly
odors, inadequacy of oxygen supply, too low moisture content, and nutrient limitations
(Bertoldi et al., 1983). Besides, the energy crisis has led to the prospect of applying
anaerobic processes to stabilize OFMSW as well as to produce a valuable fiiel in
the form of methane.
The Slow and Incomplete Process of Digesting MSW
MSW has a characteristically high solids content. Conventional digesters can handle
solids concentrations of about 5 to 8%, which means that solid wastes must be slurried
(Golueke, 1977). This results in additional problems in wastewater production and large
reactor volumes. Thus, reactor designs for the digestion of high solids substrates are
constantly developed and tested. Theoretically, a high solids reactor would be more
economically feasible, as it would have a lower reactor volume compared to a conventional
35
digester. Also, available kinetic data indicate that gas production rates should increase
with solid concentration in the reactor (Rivard et al., 1989). Therefore, a decreased
reactor volume would be possible with higher feed solids concentrations while maintaining
the same solids loading rate and retention tune.
It has been found that high TS concentrations (35 to 40%) inhibit anaerobic digestion
because of the build-up of high levels of volatile acids (Molaru* and Bartha, 1988). The
same effect results from a high C/N ratio; nitrogen becomes limiting, which causes the
acid-forming bacteria to multiply at the expense of the methanogenic bacteria, thus leading
to imbalance. This happens at C/N ratios above 30:1 for conventional digesters, unless the
carbonaceous material is of a form resistant to bacterial attack (Golueke, 1977).
Generally, when the C/N ratio is too high (as in the case with MSW), the addition of
sewage sludge or animal manure produces positive effects (Golueke, 1977; Rivard et al,
1989; Diaz et al., 1987).
Another factor which should be considered is that a very high solids content may
result in too thick a slurry, which may pose mixing and handling problems. Thus, it seems
that there are limits to the amounts of TS that can be fed to the reactors, unless special
high solids reactor designs are used.
Nevertheless, the slow degradation process of lignocellulosic MSW in anaerobic
processes requires a long substrate retention time from 20 to 100 days (Clausen and
Gaddy, 1987). Also, the conversion is incomplete, leaving as much as 50% of the organic
materials unconverted, in many cases (Tsao, 1988). This problem led to alternative routes
36
for processing MSW, such as pretreatment to more digestible substances which become
feed for the anaerobic digester. The pretreatment of lignocellulosics can be carried out
physically and chemically, e.g. size reduction, alkali cooking, steam explosion, freeze
explosion, mild acid hydrolysis, solvent dissolution, pyrolysis, and irradiation (Tsao,
1988).
Needless to say, the problems associated with anaerobic digestion has led to the
search for new and effective processes. Some of these processes are:
1) Dry Anaerobic Fermentation
2) SEBAC (Sequencing Batch Anaerobic Composting) developed by Chynoweth et
al., at the University of Florida in 1991
3) KOMPOGAS Process (Anaerobic Composting) developed by Wellinger et al., in
Switzerlalnd in 1991
4) DRANCO Process (Dry Anaerobic Composting) developed by Six and De Baere
in Belgium in 1991
5) BIOCEL Process developed by Ten Brummeler and Koster in the Netherlands in 1986
6) Multi-stage anaerobic digestion process developed by Wise, et al in U.S.A. in 1977
7) Two-stage Process (Anaerobic/Aerobic) developed by Kayhanian, et al., at University
of California at Davis, 1991
8) Two-phase anaerobic digestion process developed by Ghosh in U.S.A. in 1985.
9) Enzymatic enhancement of bioconversion of OFMSW studied by Higgins et al.,
1979
37
Dry Anaerobic Fermentation
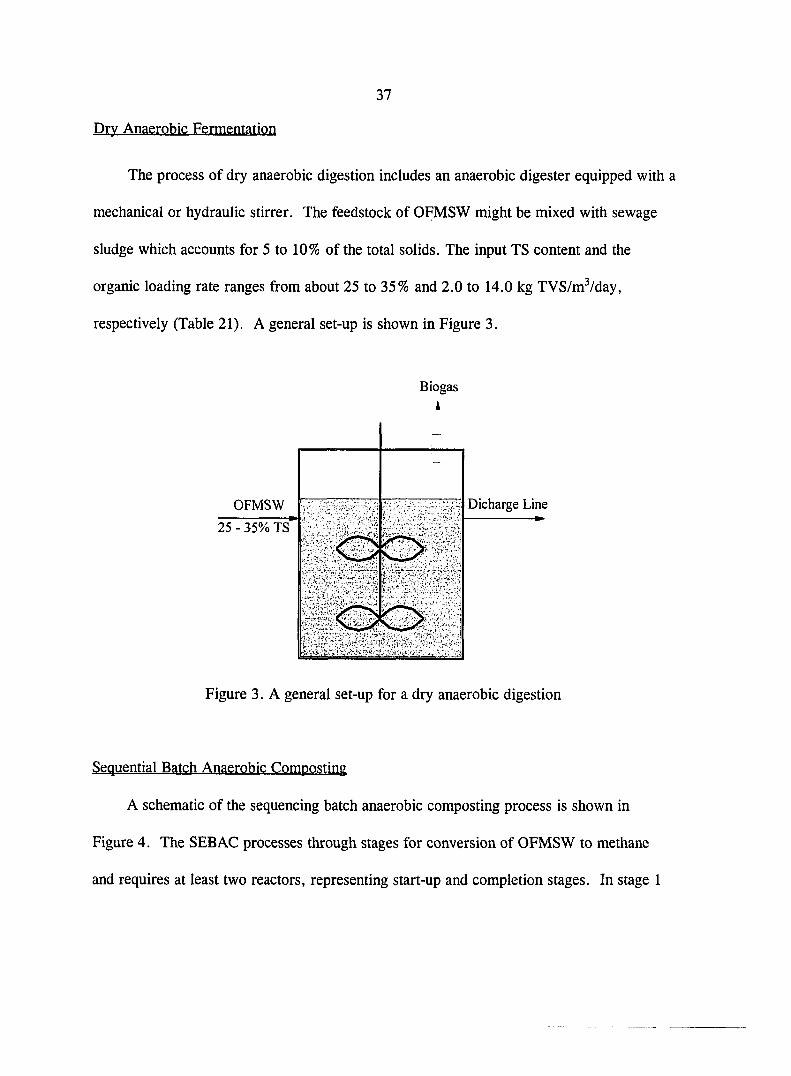
The process of dry anaerobic digestion includes an anaerobic digester equipped with a
mechanical or hydraulic stirrer. The feedstock of OFMSW might be mixed with sewage
sludge which accounts for 5 to 10% of the total solids. The input TS content and the
organic loading rate ranges from about 25 to 35% and 2.0 to 14.0 kg TVS/m^/day,
respectively (Table 21). A general set-up is shown in Figure 3.
Biogas
A
Dicharge Line OFMSW
25 - 35% TS
Figure 3. A general set-up for a dry anaerobic digestion
Sequential Batch Anaerobic Composting
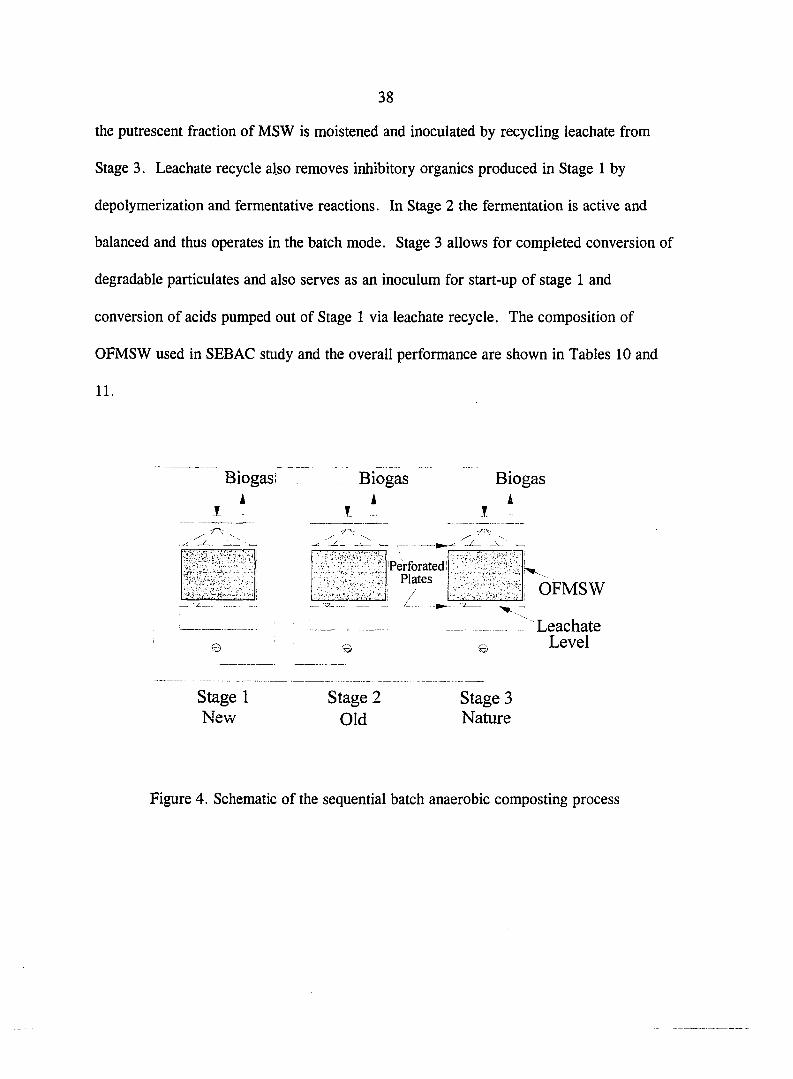
A schematic of the sequencing batch anaerobic composting process is shown in
Figure 4. The SEBAC processes through stages for conversion of OFMSW to methane
and requires at least two reactors, representing start-up and completion stages. In stage 1
38
the putrescent fraction of MSW is moistened and inoculated by recycling leachate from
Stage 3. Leachate recycle also removes inhibitory organics produced in Stage 1 by
depolymerization and fermentative reactions. In Stage 2 the fermentation is active and
balanced and thus operates in the batch mode. Stage 3 allows for completed conversion of
degradable particulates and also serves as an inoculum for start-up of stage 1 and
conversion of acids pumped out of Stage 1 via leachate recycle. The composition of
OFMSW used in SEBAC smdy and the overall performance are shown in Tables 10 and
n.
1
Biogasi A
Biogas A
T
Biogas A
-V »
Perforated i : Plates : /
'
.. 3 ...1 . ,
Perforated i : Plates : /
-
e — —
©
Stage 1 New
Stage 2 Old
Stage 3 Nature
OFMSW
Leachate Level
Figure 4. Schematic of the sequential batch anaerobic composting process
39
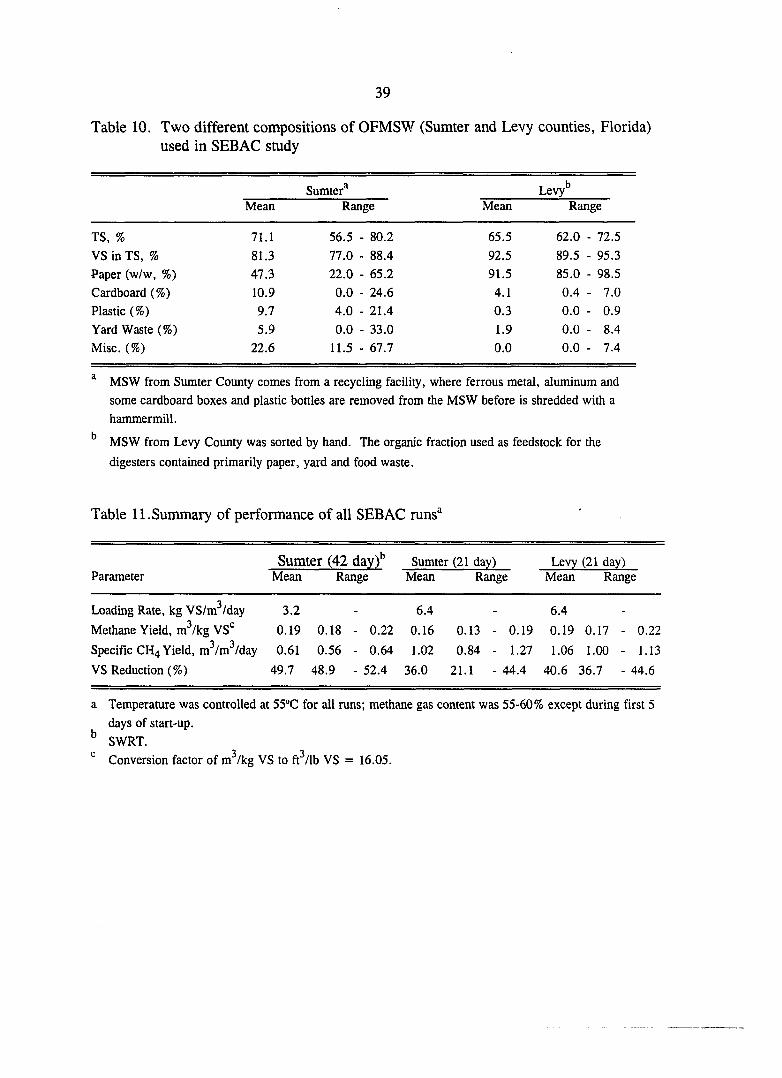
Table 10. Two different compositions of OFMSW (Sumter and Levy counties, Florida) used in SEBAC study
Sumter® I b Levy Mean Range Mean Range
TS, % 71.1 56.5 - 80.2 65.5 62.0 - 72.5
VS in TS, % 81.3 77.0 - 88.4 92.5 89.5 - 95.3
Paper (w/w, %) 47.3 22.0 - 65.2 91.5 85.0 - 98.5
Cardboard (%) 10.9 0.0 - 24.6 4.1 0.4 - 7.0
Plastic (%) 9.7 4.0 - 21.4 0.3 0.0 - 0.9
Yard Waste (%) 5.9 0.0 - 33.0 1.9 0.0 - 8.4
Misc. (%) 22.6 11.5 - 67.7 0.0 0.0 - 7.4
^ MSW from Sumter Coimty comes from a recycling facility, where ferrous metal, aluminum and
some cardboard boxes and plastic bottles are removed from the MSW before is shredded with a
hammermill.
'' MSW from Levy County was sorted by hand. The organic fraction used as feedstock for the
digesters contained primarily paper, yard and food waste.
Table 11. Summary of performance of all SEBAC runs®
Sumter (42 day)*^ Sumter (21 day) Levy (21 day) Parameter Mean Range Mean Range Mean Range
3 Loading Rate, kg VS/m /day 3.2 - 6.4 - 6.4 -
Methane Yield, m^/kg VS"^ 0.19 0.18 - 0.22 0.16 0.13 - 0.19 0.19 0.17 - 0.22
Specific CH4 Yield, m^/m^/day 0.61 0.56 - 0.64 1.02 0.84 - 1.27 1.06 1.00 - 1.13
VS Reduction (%) 49.7 48.9 - 52.4 36.0 21.1 - 44.4 40.6 36.7 - 44.6
a Temperature was controlled at 55°C for all runs; methane gas content was 55-60% except during first 5
days of start-up.
^ SWRT.
Conversion factor of m^/kg VS to ft^/lb VS = 16.05.
40
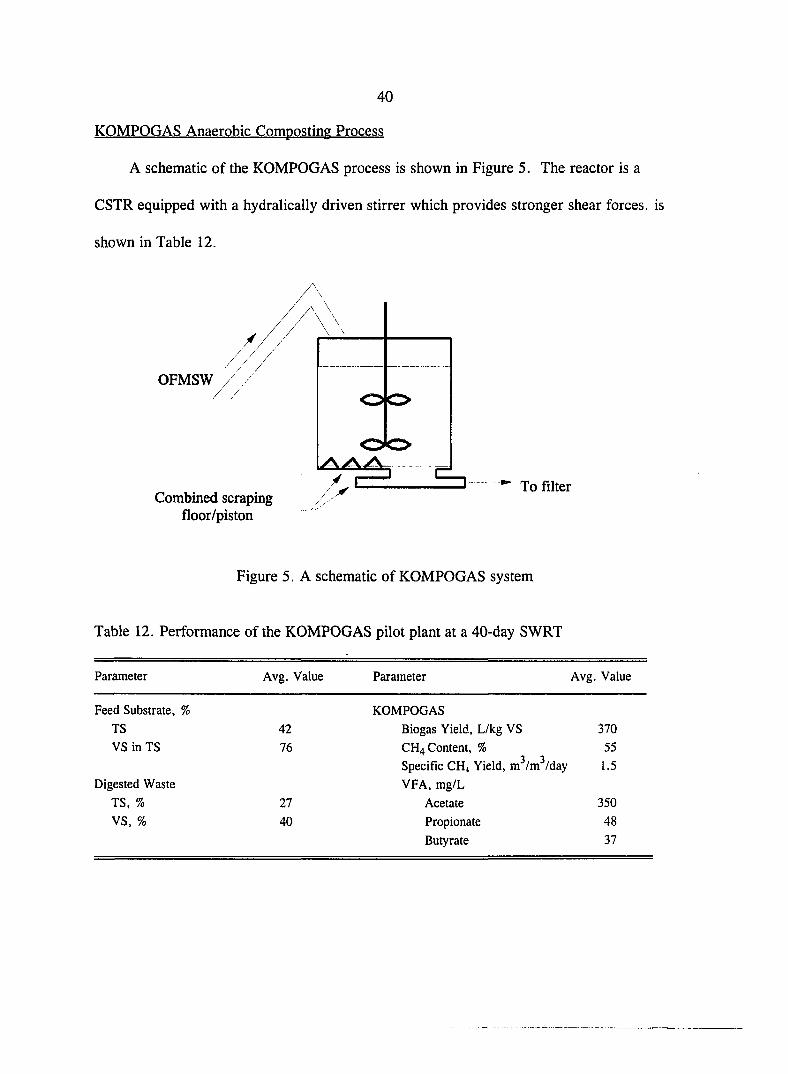
KOMPOGAS Anaerobic Composting Process
A schematic of the KOMPOGAS process is shown in Figure 5. The reactor is a
CSTR equipped with a hydralically driven stirrer which provides stronger shear forces, is
shown in Table 12.
OFMSW
Combined scraping floor/piston
To filter
Figure 5. A schematic of KOMPOGAS system
Table 12. Performance of the KOMPOGAS pilot plant at a 40-day SWRT
Parameter Avg. Value Parameter Avg. Value
Feed Substrate, %
TS
VS in TS
Digested Waste
TS, %
VS, %
42
76
27
40
KOMPOGAS
Biogas Yield, L/kg VS 370
CH4 Content, % 55
Specific CH4 Yield, m^/m^/day 1.5
VFA, mg/L
Acetate 350
Propionate 48
Butyrate 37
41
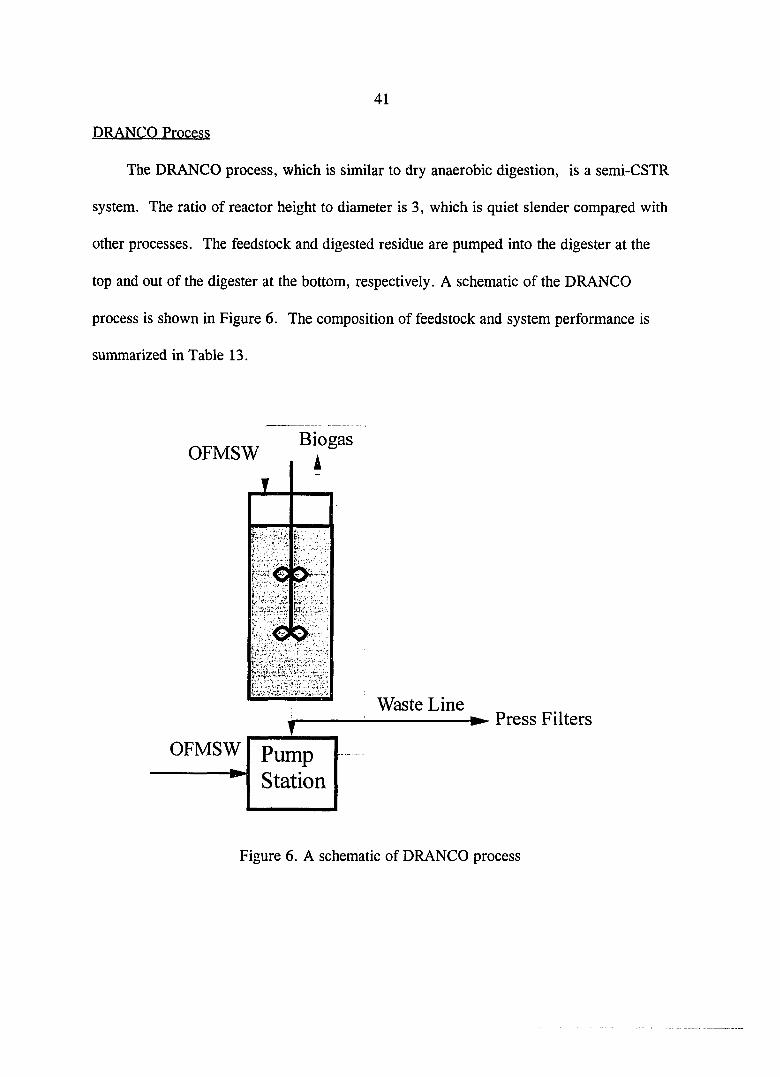
DRANCO Process
The DRANCO process, which is similar to dry anaerobic digestion, is a semi-CSTR
system. The ratio of reactor height to diameter is 3, which is quiet slender compared with
other processes. The feedstock and digested residue are pumped into the digester at the
top and out of the digester at the bottom, respectively. A schematic of the DRANCO
process is shown in Figure 6. The composition of feedstock and system performance is
summarized in Table 13.
Biogas OFMSW
Waste Line Press Filters
OFMSW Pump Station
CO
Figure 6. A schematic of DRANCO process
42
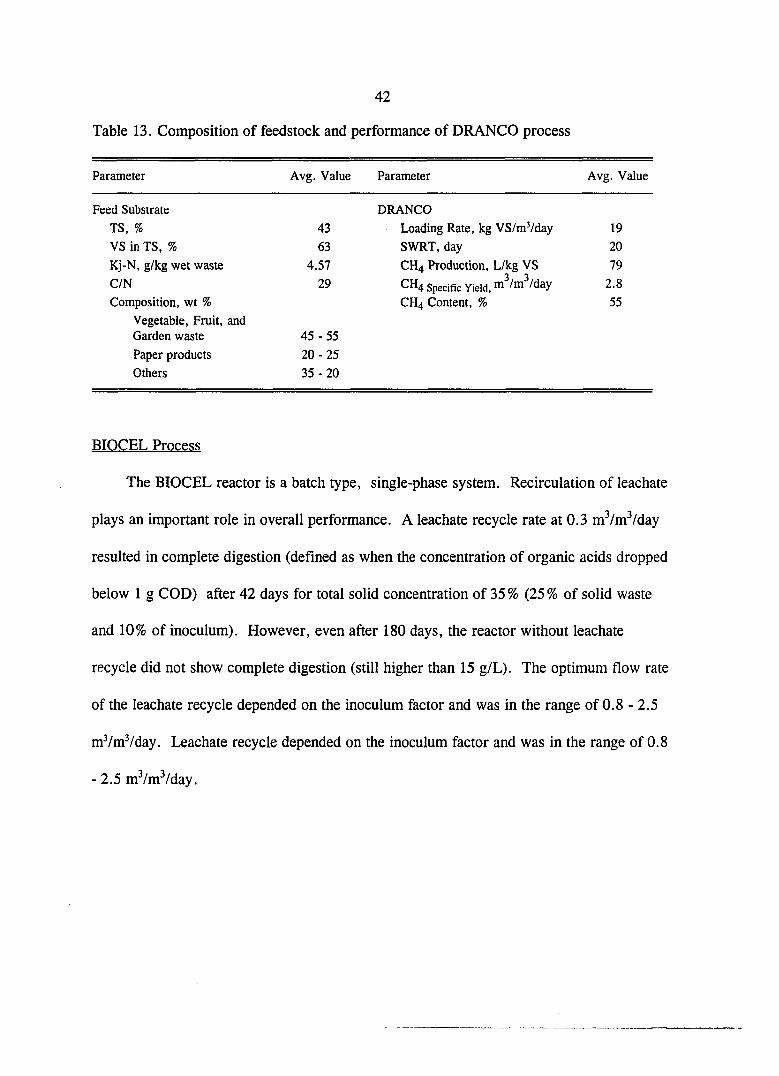
Table 13. Composition of feedstock and performance of DRANCO process
Parameter Avg. Value Parameter Avg. Value
Feed Substrate DRANCO
TS, % 43 Loading Rate, kg VS/mVday 19
VS in TS, % 63 SWRT, day 20
Kj-N, g/kg wet waste 4.57 CH4 Production, L/kg VS 79
C/N 29 CH4 Specific Yield, 2.8
Composition, wt % CH4 Content, % 55
Vegetable, Fruit, and Garden waste 4 5 - 5 5
Paper products 2 0 - 2 5
Others 3 5 - 2 0
BIOCEL Process
The BIOCEL reactor is a batch type, single-phase system. Recirculation of leachate
plays an important role in overall performance. A leachate recycle rate at 0.3 m^/m^/day
resulted in complete digestion (defined as when the concentration of organic acids dropped
below 1 g COD) after 42 days for total solid concentration of 35 % (25 % of solid waste
and 10% of inoculum). However, even after 180 days, the reactor without leachate
recycle did not show complete digestion (still higher than 15 g/L). The optimum flow rate
of the leachate recycle depended on the inoculum factor and was in the range of 0.8 - 2.5
mVmVday. Leachate recycle depended on the inoculum factor and was in the range of 0.8
-2.5 mVm^/day.
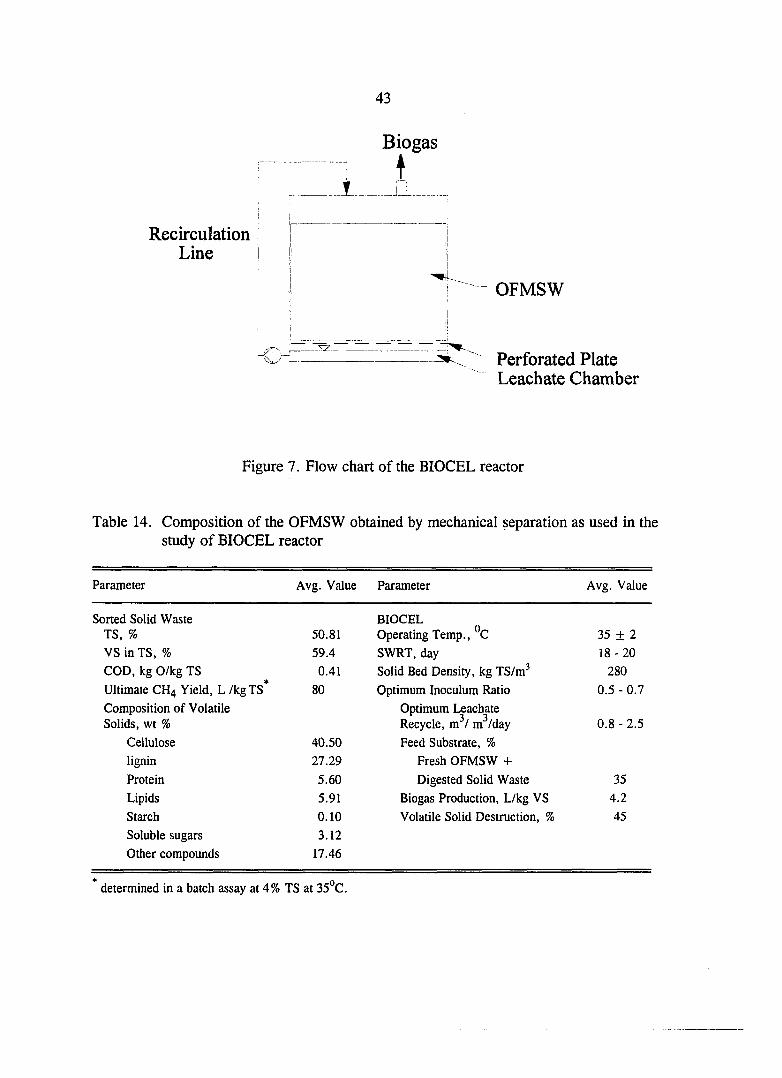
43
Recirculation Line
Biogas
OFMSW
-0± Perforated Plate Leachate Chamber
Figure 7. Flow chart of the BIOCEL reactor
Table 14. Composition of the OFMSW obtained by mechanical separation as used in the study of BIOCEL reactor
Parameter Avg. Value Parameter Avg. Value
Sorted Solid Waste BIOCEL TS, % 50.81 Operating Temp., 35 ± 2
VS in TS, % 59.4 SWRT, day 1 8 - 2 0
COD, kg 0/kg TS 0.41 Solid Bed Density, kg TS/m^ 280
Ultimate CH4 Yield, L /kgTS* 80 Optimum Inoculum Ratio 0 . 5 - 0 . 7
Composition of Volatile Optimum Leachate Solids, wt % Recycle, m^/ m^/day 0 . 8 - 2 . 5
Cellulose 40.50 Feed Substrate, %
lignin 27.29 Fresh OFMSW +
Protein 5.60 Digested Solid Waste 35
Lipids 5.91 Biogas Production, L/kg VS 4.2
Starch 0.10 Volatile Solid Destruction, % 45
Soluble sugars 3 . 1 2
Other compounds 17.46
* O determined in a batch assay at 4% TS at 35 C.

44
The inoculum of biomass is also an important factor in stabilizing solid wastes.
Experiments showed that the dry digestion of the organic fraction is unbalanced at a
seed/substrate solids ratio of 0.03-0.08, resulting in very low methane production rate.
The pH under these conditions was 5-5.5 with organic acid concentrations of 50 g
COD/L. Addition of a buffer (NaHCOs) appeared to be successful at a minimum
buffer/substrate solids ratio of 0.06. The optimum inoculum factor (I; The ratio of digested
solids and total initial solids), was in the range of 0.5 - 0.6. Table 14 shows the
composition of OFMSW used in the study and the overall performance.
Multi-Stage Digestion Process
A conceptual multi-stage digestion system for solid wastes is shown in Figure 8. The
whole process is similar to two-phase anaerobic digestion. The plug flow reactor serves as
the first phase (hydrolysis and acidogenesis). The CSTR unit (second phase) converts
volatile acids into methane gas. To simulate plug flow, ten 3.8 L jars were applied for the
acid-forming step. This system was coupled with a 45 1 anaerobic digester, operating as a
CSTR, for the methane-forming step. A small laboratory press was used to separate
material after processing through the plug flow system. Sewage sludge with 5 % total
solids was added so that sludge solids comprised about 10% by weight of total solids
in each jar.
Each day an additional jar was prepared in a similar fashion and was put into
operation. Each jar was stirred by hand briefly to mix the material once a day. On the
tenth day, the first jar so prepared was removed from storage and the liquid separated from
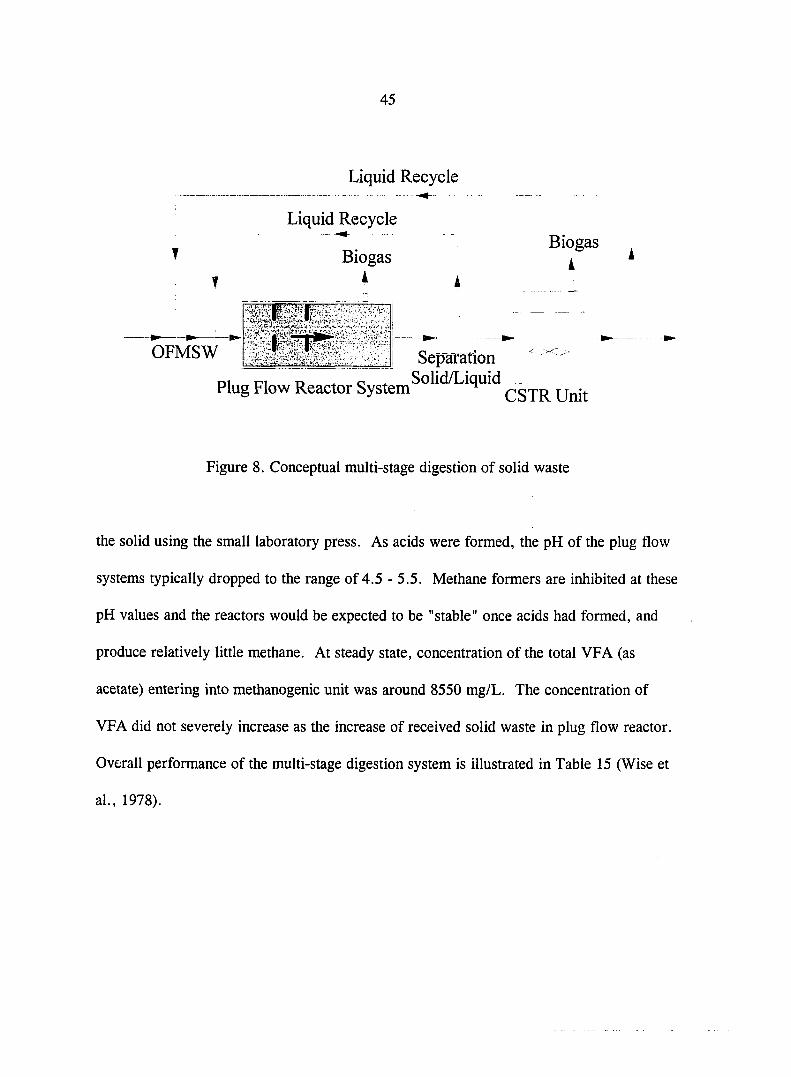
45
Liquid Recycle
OFMSW
Liquid Recycle
Biogas A
J < h' a. !
Separation
Plug Flow Reactor
Biogas I
CSTR Unit
Figure 8. Conceptual multi-stage digestion of solid waste
the solid using the small laboratory press. As acids were formed, the pH of the plug flow
systems typically dropped to the range of 4.5 - 5.5. Methane formers are inhibited at these
pH values and the reactors would be expected to be "stable" once acids had formed, and
produce relatively little methane. At steady state, concentration of the total VFA (as
acetate) entering into methanogenic unit was around 8550 mg/L. The concentration of
VFA did not severely increase as the increase of received solid waste in plug flow reactor.
Overall performance of the multi-stage digestion system is illustrated in Table 15 (Wise et
al., 1978).

46
Table 15. Performance of multi-stage digestion
Parameter Avg. Value Parameter Avg. Value
Feed Substrate, % Digestion
TS 10 Operating Temp., °C 37
Solid Waste 5 SWRT, day 10
Sewage Sludge 5 Total wt. of Solid Waste, g 254
Volatile acids in the effluent of Final Stage Solid Removal, g 133
plug flow reactor, meq/L Gas Production, g 84
Acetate 48.0 Digester Effluent loss, g 37
Propionate 115.87 Volatile Solid Destruction, % 48
Butyric 6.6 Gas Content, %
Valeric 5.0 Plug Flow Reactor
CO2 80 - 90 CH4 10 - 20
CSTR Unit CO2 35-40 CH4 60-65
Two-Stage Anaerobic/Aerobic Process
Figure 9 shows the basic flow diagram for the high-solids anaerobic/aerobic
composting process. The high-solid anaerobic digestion/aerobic composting process is a
two-stage process. The first stage of the process involves high solids (25 to 30%)
anaerobic digestion. The second stage involves the aerobic composting of the
anaerobically digested solids to increase the solids content from 25 to 65% or more,
depending on the final use of the compost. In this study, a synthetic solid waste was
prepared, as shown in Table 16. The output from the second stage is a fine humus-like
material with a total solids content of 65%, a density of 35 Ib/ft^, and a thermal content of
6,360 BTU/lb. Because of the relatively high energy content of the final
humus, it appears that this material could also be fired directly into a boiler when mixed

47
OFMSW
Biogas 1 Heat
oo
oo
•-;!' oo I 0 0 i
CSTR Unit for Aerobic Composter
; "• Humus
Fuel for Power Plants
CSTR Unit for Anaerobic Digestion
Figure 9. Basic flow diagram for the high-solids anaerobic/aerobic composting process
Table 16. Characteristics of the organic materials used as the feedstock for the high-solids anaerobic/aerobic composting process
Parameter Newsprint Office paper Yard waste Food waste
TS, % 94.00 96.40 50-90 7-15
V S i n T S , % 8 8 . 0 0 8 2 . 6 0 7 2 . 7 2 7 9 . 7 1
Ash content 0.88 6.94 11.20 3.16
Fixed carbon 11.15 10.46 16.06 17.13
Table 17. Performance data for the high-solids anaerobic digestion/aerobic composting process
Parameter Avg. Values Parameter Avg. Value
Feed Substrate (Synthetic) Anaerobic Digester
TS, % 61 Operating Temp., °C 55
VS in TS, % 82 SWRT, day 30
Biodegradability VS (BVS), % 68 Effluent TS, % CH4 Content, %
2 3 - 3 0 48 - 52
Aerobic Composting Unit Operating Temperature, *^0
CH4 Specific Yield, m^/m^/day 2.5 - 2.9 Aerobic Composting Unit Operating Temperature, *^0 55 BVS Removal Efficiency, % 9 0 - 9 9 SRT, day 3 Effluent TS, % of humus 65
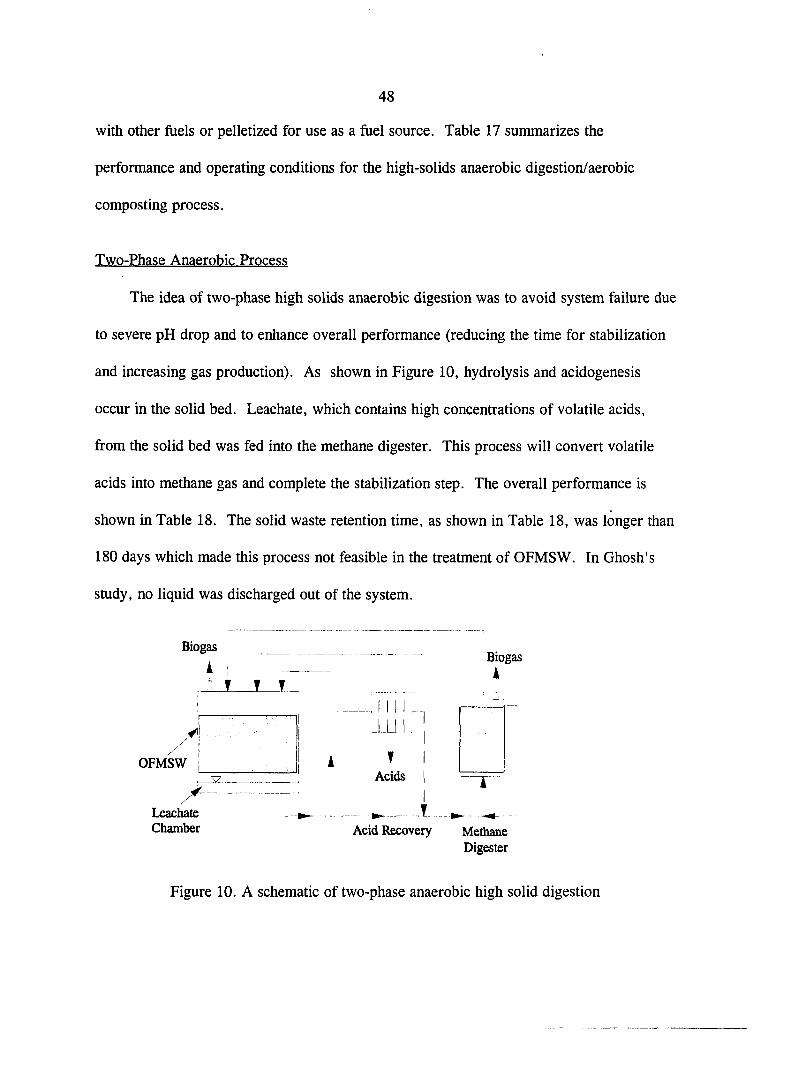
48
with other fuels or pelletized for use as a fuel source. Table 17 summarizes the
performance and operating conditions for the high-solids anaerobic digestion/aerobic
composting process.
Two-Phase Anaerobic Process
The idea of two-phase high solids anaerobic digestion was to avoid system failure due
to severe pH drop and to enhance overall performance (reducing the time for stabilization
and increasing gas production). As shown in Figure 10, hydrolysis and acidogenesis
occur in the solid bed. Leachate, which contains high concentrations of volatile acids,
from the solid bed was fed into the methane digester. This process will convert volatile
acids into methane gas and complete the stabilization step. The overall performance is
shown in Table 18. The solid waste retention time, as shown in Table 18, was longer than
180 days which made this process not feasible in the treatment of OFMSW. In Ghosh's
study, no liquid was discharged out of the system.
Biogas
i Biogas
A y y y
y! LL_L / /
A • OFMSW Acids
X
Leachate Chamber Acid Recovery Methane
Digester
Figure 10. A schematic of two-phase anaerobic high solid digestion
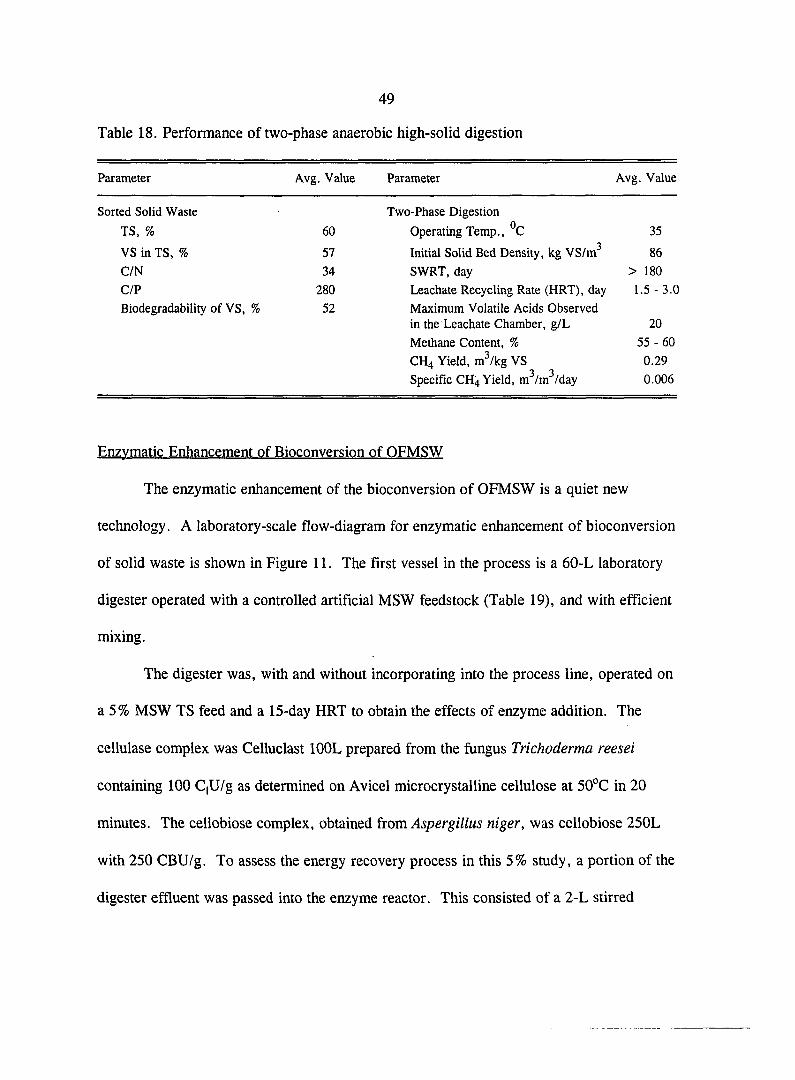
49
Table 18. Performance of two-phase anaerobic high-solid digestion
Parameter Avg. Value Parameter Avg. Value
Sorted Solid Waste Two-Phase Digestion
TS, % 60 Operating Temp., °C 35
VS in TS, % 57 Initial Solid Bed Density, kg VSIxa 86
C/N 34 SWRT, day > 180
C/P 280 Leachate Recycling Rate (HRT), day 1 . 5 - 3 . 0
Biodegradability of VS, % 52 Maximum Volatile Acids Observed in the Leachate Chamber, g/L 20
Methane Content, % 5 5 - 6 0
CH4 Yield, m^/kg VS 0.29
Specific CH4 Yield, m^/m^/day 0.006
Enzymatic Enhancement of Bioconversion of OFMSW
The enzymatic enhancement of the bioconversion of OFMSW is a quiet new
technology. A laboratory-scale flow-diagram for enzymatic enhancement of bioconversion
of solid waste is shown in Figure 11. The first vessel in the process is a 60-L laboratory
digester operated with a controlled artificial MSW feedstock (Table 19), and with efficient
mixing.
The digester was, with and without incorporating into the process line, operated on
a 5% MSW TS feed and a 15-day HRT to obtain the effects of enzyme addition. The
cellulase complex was Celluclast lOOL prepared from the fungus Trichoderma reesei
containing 100 CjU/g as determined on Avicel microcrystalline cellulose at 50°C in 20
minutes. The cellobiose complex, obtained from Aspergillus niger, was cellobiose 250L
with 250 CBU/g. To assess the energy recovery process in this 5% study, a portion of the
digester effluent was passed into the enzyme reactor. This consisted of a 2-L stirred
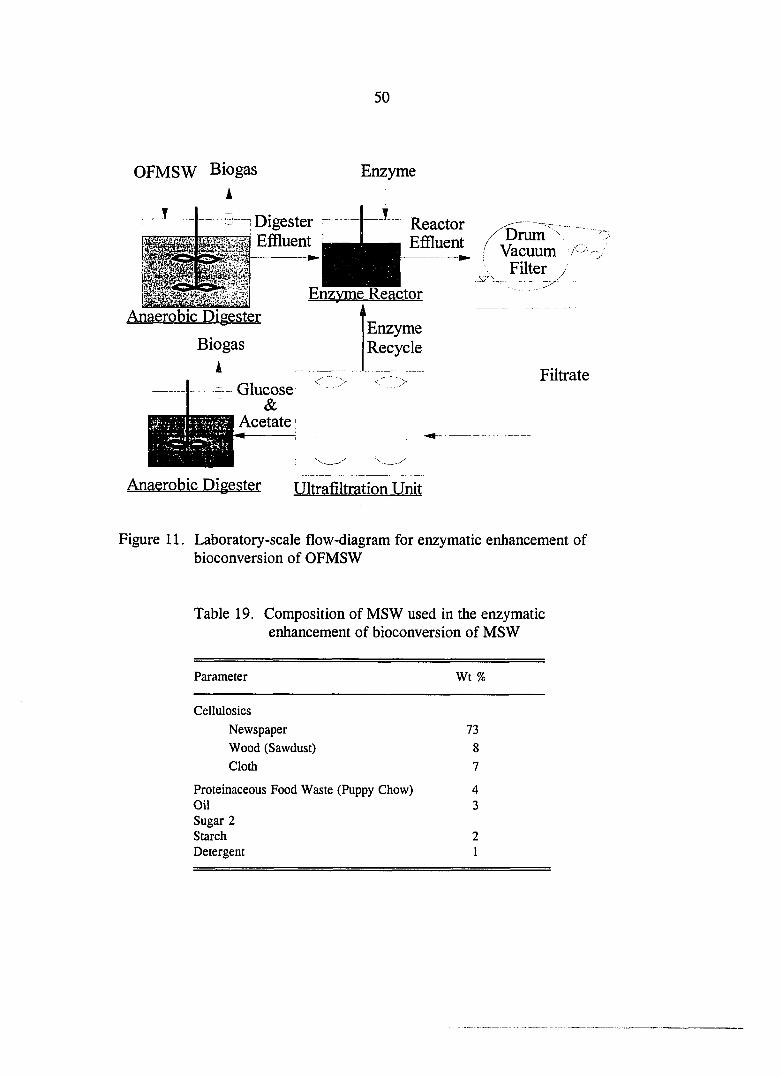
50
OFMSW Biogas A
1
Enzyme
• '5?
WI¥I r/vv.'s^
1 Digester Effluent i
Anaerobic Digester
Biogas A
V-
Reactor Effluent
Enzyme Reactor
Enzyme Recycle
Glucose &
Acetate
Anaerobic Digester ultrafiltration Unit
Drum Vacuum
Filter /
Filtrate
Figure 11. Laboratory-scale flow-diagram for enzymatic enhancement of bioconversion of OFMSW
Table 19. Composition of MSW used in the enzymatic enhancement of bioconversion of MSW
Parameter Wt %
Cellulosics
Newspaper 73
Wood (Sawdust) 8
Cloth 7
Proteinaceous Food Waste (Puppy Chow) 4 Oil 3 Sugar 2 Starch 2 Detergent 1
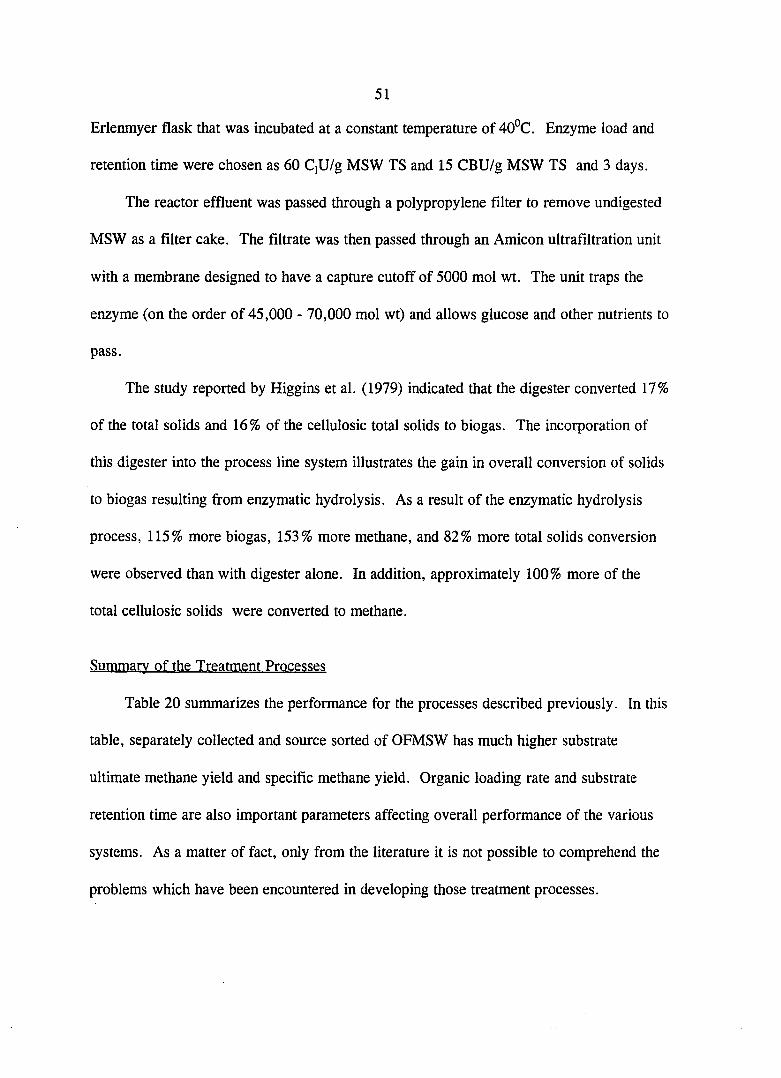
51
Erlenmyer flask that was incubated at a constant temperature of 40°C. Enzyme load and
retention time were chosen as 60 CjU/g MSW TS and 15 CBU/g MSW TS and 3 days.
The reactor effluent was passed through a polypropylene filter to remove undigested
MSW as a filter cake. The filtrate was then passed through an Amicon ultrafiltration unit
with a membrane designed to have a capture cutoff of 5000 mol wt. The unit traps the
enzyme (on the order of 45,000 - 70,000 mol wt) and allows glucose and other nutrients to
pass.
The study reported by Higgins et al. (1979) indicated that the digester converted 17%
of the total solids and 16% of the cellulosic total solids to biogas. The incorporation of
this digester into the process line system illustrates the gain in overall conversion of solids
to biogas resulting from enzymatic hydrolysis. As a result of the enzymatic hydrolysis
process, 115% more biogas, 153% more methane, and 82% more total solids conversion
were observed than with digester alone. In addition, approximately 100% more of the
total cellulosic solids were converted to methane.
Summary of the Treatment Processes
Table 20 summarizes the performance for the processes described previously. In this
table, separately collected and source sorted of OFMSW has much higher substrate
ultimate methane yield and specific methane yield. Organic loading rate and substrate
retention time are also important parameters affecting overall performance of the various
systems. As a matter of fact, only from the literature it is not possible to comprehend the
problems which have been encountered in developing those treatment processes.
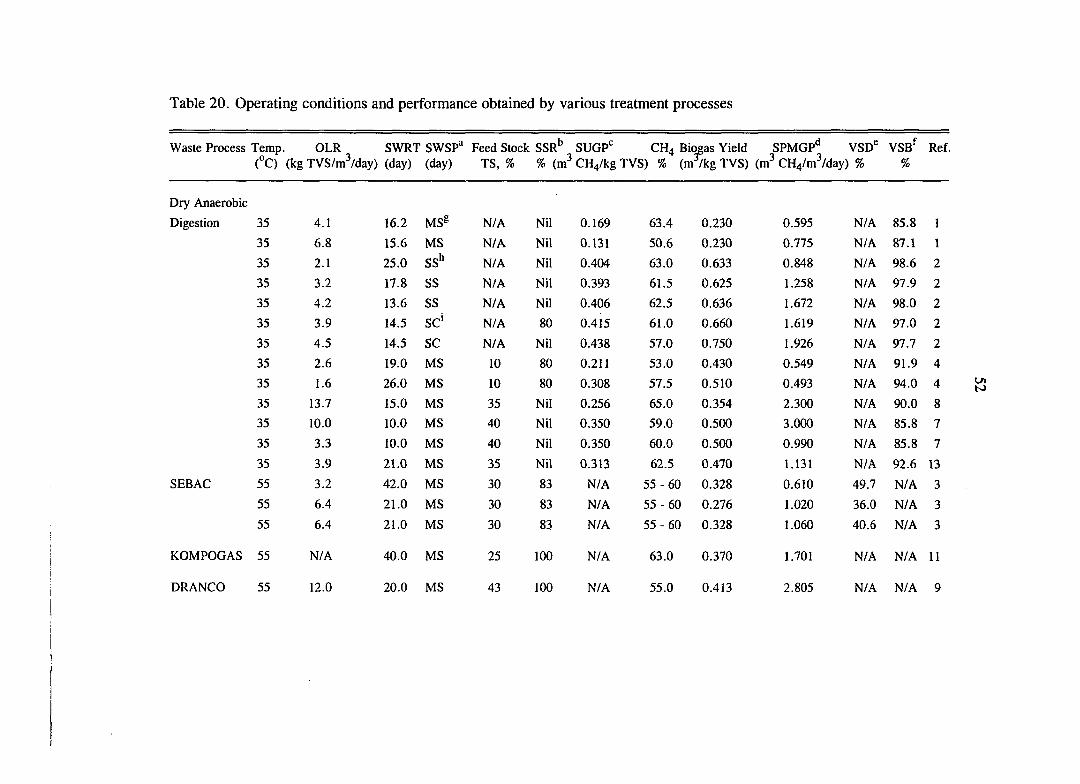
1
1
2
2
2
2
2
4
4
8
7
7
13
3
3
3
11
Table 20. Operating conditions and performance obtained by various treatment processes
Waste Process Temp. OLR SWRT SWSP^ Feed Stock SSR*' SUGP'^ CH4 Bi(^as Yield SPMGP'' VSD® VSB^ (°C) (kg TVS/m^/day) (day) (day) TS, % % (m^ CH4/kg TVS) % (mVkg TVS) (m^ CH4/m^/day) % %
Dry Anaerobic
Digestion
SEBAC
KOMPOGAS 55
DRANCO
35 4 . 1 16.2 MS® N/A Nil 0.169 63.4 0.230 0.595 N/A 85.8
35 6.8 15.6 MS N/A Nil 0 . 1 3 1 50.6 0.230 0.775 N/A 87.1
35 2 . 1 25.0 SS** N/A Nil 0.404 63.0 0.633 0.848 N/A 98.6
35 3.2 17.8 SS N/A Nil 0.393 61.5 0.625 1.258 N/A 97.9
35 4.2 13.6 SS N/A Nil 0.406 62.5 0.636 1.672 N/A 98.0
35 3.9 14.5 sc' N/A 80 0.415 6 1 . 0 0.660 1.619 N/A 97.0
35 4.5 14.5 SC N/A Nil 0.438 57.0 0.750 1.926 N/A 97.7
35 2.6 19.0 MS 10 80 0.211 53.0 0.430 0.549 N/A 9 1 . 9
35 1 . 6 26.0 MS 10 80 0.308 57.5 0.510 0.493 N/A 94.0
35 13.7 15.0 MS 35 Nil 0.256 65.0 0.354 2.300 N/A 90.0
35 10.0 10.0 MS 40 Nil 0.350 59.0 0.500 3.000 N/A 85.8
35 3.3 10.0 MS 40 Nil 0.350 60.0 0.500 0.990 N/A 85.8
35 3.9 21.0 MS 35 Nil 0.313 62.5 0.470 1 . 1 3 1 N/A 92.6
55 3.2 42.0 MS 30 83 N/A 5 5 - 6 0 0.328 0.610 49.7 N/A
55 6.4 21.0 MS 30 83 N/A 5 5 - 6 0 0.276 1.020 36.0 N/A
55 6.4 2 1 . 0 MS 30 83 N/A 5 5 - 6 0 0.328 1.060 40.6 N/A
55 N/A 40.0 MS 25 100 N/A 63.0 0.370 1.701 N/A N/A
55 12.0 20.0 MS 43 100 N/A 55.0 0.413 2.805 N/A N/A

Table 20. (Continued)
Waste Process Temp. OLR SWRT SWSP® Feed Stock SSR*' SUGP"^ CH4 Bioeas Yield SPMGP^ VSD® VSB^ Ref. (°C) (kg TVS/iti^/day) (day) (day) TS, % % (m^ CH4/kg TVS) % (ret/kg TVS) (m^ CYi^lxi?/A&y) % %
BIOCEL 35 N/A 1 8 - 2 0 MS 35 71 0.157 N/A 0.238 N/A 45.0 N/A 10
Multi-Stage 37 2 . 5 10.0 MS 10 80 N/A 58 - 62 0.352 1.240 48.0 N/A 12
Two-stage 55/55^ 7 . 2 33.0 SM'' 25 -30 Nil N/A 4 8 - 5 2 N/A 2.400 - 3.016 N/A 90-99 6
Two-phase 22/55' 0.32 190.0 SM 20 100 N/A 5 5 - 6 0 0.501 0.006 N/A N/A 5
^ Solid waste sorting procedure.
SS (sewage sludge) ratio added in the feed stock; total dry wt. of feed solid waste/total dry wt. of SS.
Substrate ultimate gas production.
Specific methane gas production.
^ Volatile solid destruction.
Volatile solid destruction of biodegradable portion.
® Mechanically sorted OFMSW.
Source sorted OFMSW.
' Separately collected OFMSW.
Controlled temperatures for anaerobic and aerobic reactors were both at 55''C.
Synthetic substrate.
' Controlled temperature for solid bed and anaerobic biofilter were at 22 and 35°C, repectively.
Reference:
1) Cecchietal. (1986). 2)
5) Ghosh (1985). 6)
9) Six and Baere (1992). 10)
13) Wujcik and Jewell (1979).
Cecchi et al. (1988). 3)
Kayhanian et al. (1991). 7)
Ten Brummeler and Koster (1990). 11)
Chynoweth et al. (1992).
Molnar and Bartha (1988).
Wellinger et al. (1992).
4) De Baere (1985).
8) Peres et al. (1992).
12) Wise et al. (1978).
54
not mention the disadvantages of their own processes. In addition, the minimum substrate
retention time is about 10 days, as shown in this table.
A Potential Process for the Treatment of OFMSW
For the two-phase anaerobic process (Table 20), the SWRT was longer than 180
days. This high SWRT made the reactor volume required for a two-phase process to
obtain the same treatment performance much larger than other processes and makes this
process not feasible for application in the treatment of OFMSW. The two-phase anaerobic
digestion process for treating some complex substrates has shown better results (shorter
solids retention time and higher methane production) than single-phase anaerobic
digestion (Ghosh, 1987; Hanaki et al., 1987; Zhang and Noike, 1991).
The reasons for this low treatment performance could be the accumulation of high
concentrations of volatile acids in the leachate (10-20 g/L, as acetate), as shown in
Figure 12, and a low pH (5 -6). Concentration of volatile acids above 6000 mg/L leads to
cation toxicity to the methanogens due to the addition of alkanility for maintaining a
netural pH (Andrew, 1969 ; Kroeker, 1979; McCarty and Mckinney, 1961). Also, a pH
lower than 6.0 in the reactor for over 3 days will lead to anaerobic digestion failure (Clark
and Speece, 1970). Under these adverse conditions, the methanogenic filter would not be
able to convert the volatile acids to methane gas effectively within a short period of time
and the effluent from the filter would still contain high concentrations of volatile acids and
have a low pH. In the long run, hydrolysis and acidogenesis in the solid bed may be

55
a 0
4>
1 1 3
3000
Solid Bed TVFA
CH 4 Production in Solid Bed
CH 4Production in Methane Digester
J 'So
40 cT o 'A
- 30 2 "S Oj
20 U c o U
10 < > H
0 10 20 30 40 so 60 70 80 90 100 110 120 130 140 ISO 160 170 180 190
Day since started
Figure 12. Time profiles of accumulative gas production in leach-bed digestion system and TVFA in solid bed
inhibited at high concentrations of volatile acids. Therefore, poor performance occurs with
the high concentrations of volatile acids in the acidognesis step and when the stabilization
step (methanogenesis) is almost terminated in the methanogenesis step. Another study,
leachate recycle as landfill management option, reported by Pholand (1979) was also ended
up with a long-term running period of 360 days. In this study, only a single-stage and
batch-fed reactor with a acive volume of 47 m^ was used. The system set-up and operation
is the same as the BIOCEL reactor shown in Figure 7. As demonstrated in the paper, the
methane gas did not show up in time profile until day 300 since started. The high
concentrations of VFA (15 - 25 g/L) appeared in the leachate chamber between days 10
and 200 which may explain the poor performance of this study. To modify the two-phase
anaerobic digestion for treating OFMSW, some important fundamentals related to two-
phase anaerobic process will be discussed in the following section.

56
Two-Phase Anaerobic Digestion
The basic idea of two-phase anaerobic digestion is to provide optimal environmental
conditions for two different groups of syntrophic bacteria (acidogens and methanogens).
This process can be accomplished by maintaining acidogens and methanogens in the first
and second reactor, respectively. The principal function of the first reactor is the
hydrolysis of big particulates into small particulates and soluble products, and the
utilization of the end products for acidogenic fermentation. The end products of
acidogenic fermentation (acetate, methanol, and carbon dioxide) are converted into
methane gas in the second reactor.
Phase Separation
Two-phase anaerobic digestion can avoid system failure due to a severe pH drop
since acidogens can function well at low pH (less than 6.0) and keep the same activity at
concentration of TVFA lower than 7000 mg/L (Chyi and Dague, 1994). Phase separation
can be accomplished by the following methods (Pohland and Ghosh, 1971);
a) addition of various inhibitors in the acid digester to prevent methanogenesis, e.g.
carbon tetrachloride or chloroform;
b) lunited oxygenation;
c) adjustment of redox potential;
d) dialysis separation of the methane-forming cultures by filtering the acids, etc. and;
e) pH control.
The original proponents of two-phase digestion, Pohland and Ghosh (1971), suggest
that operational difficulties with dialysis membranes and the uncertainties in determination

57
that operational difficulties with dialysis membranes and the uncertainties in determination
of inhibitor concentrations make kinetic control more attractive. Kinetic control can be
achieved in each phase by adjustment of the dilution rates and recycle ratios. The
objectives of this adjustment are to "exceed the maximum specific growth rate of the
methane formers by the allowable growth rate of the first reactor and to insure almost
complete conversion of substrates in the first phase to volatile acids and other intermediates
acceptable to methane formers" (Pohland and Ghosh, 1971).
The form of kinetic control (dilution and recycle rates adjustment) is perhaps the
most popular, as it is favored by more researchers in laboratory studies. On the other
hand, some workers favor pH control, which is deemed simpler (Shin, et al., 1992).
The principle of phase separation can be summarized by:
a) Shortening the SRT to the best time for phase separation, a larger quantity of
fermentative bacteria may be obtained, which cannot be obtained in the conventional
digester, so that the potential ability of fermentative bacteria can come into full play.
b) Shortening the SRT to the best time for phase separation, large quantities of
H2-utilizing acetogens and hydrogenotrophs can be obtained, which not only
intensifies inter-species hydrogen transfer, but also promotes the fermentation of
substrate directly to acetic acid instead of propionic acid and other VFA so that
reasonable and constant production of acetic, propionic and butyric acid can be
maintained in acidogenesis;
c) When the constant production of major intermediaries enter into the second phase,
it is easy for the bacteria in the second phase to establish a harmonious ecosystem
therefore the efficiency of the second phase is enhanced (Zhang and Noike, 1991)
58
Advantages of Phase Separation
The potential benefits of phase separation compared with the conventional one-phase
process can be summarized as follows (Cohen et al., 1979).
a) Optimization: The possibility of maintaining optimal environmental conditions for
each group of organisms and concomitantly increasing the rate of substrate turnover
which may allow a reduction in total reactor volume.
b) Increased stability: By means of appropriate control of the loading rate on the
methane reactor, mutual adaptation between acid and methane formers can be
regulated, and the cessation of methane production by lowered pH or the
accumulation of VFA's can be prevented.
c) Sludge disposal: Disposal of relatively fast growing acid forming sludge can occur
without the loss of methane producing bacteria.
With regard to the first advantage, Ghosh (1987) reports that acidogenic and ,
methanogenic cultures would express enhanced metabolic and kinetic capabilities when
they are enriched in separate environments providing the optimum pH, redox potential,
dilution rate, alkalinity, and temperamre. Thus, a separated methanogenic culture is
expected to exhibit a higher specific growth rate and a lower half-velocity constant than the
methanogens of a single-stage digester. Not only are the environmental requirements
different, the growth kinetics of the acidogenic, acetogenic, and methanogenic bacteria are
also different. Pholand and Ghosh (1971), for example, have shown that the maximum
specific growth rate of the acidogenic organisms could be one order of magnitude higher
than that of the methanogens. This suggests that by phase separation, it is possible to
maximize volatile solids conversion (hydrolysis) and volatile acids (VA) production

59
(acidification), in a first-stage acid digester. The acetate gasification rate is maximized in
the second-stage methane digester. These characteristics lead to increased process stability
and insurance against imbalance between acidogenic and methanogenic fermentation
(Ghosh, 1987).
Biochemical Thermochemistry in the First Phase
Accumulation of acids in the first phase seems to be expected and practical.
However, acetogenic conversion of lactate, ethanol, and higher volatile acids to acetate
will not be thermodynamically feasible at substrate concentration of 10'® M when the
hydrogen partial pressure is higher than 10"^ atm for propionate, 10'® atm for butyrate, 10"^
atm for ethanol, and 10"^ atm for lactate (Mclnemey, 1980). This can be easily understood
from Table 21 which shows that propionate oxidation is least favored with the most
positive AG°. The step most sensitive to the accumulation of H2 is the oxidation of
reduced nicotinamide adenine dinucleotide (NADH) to NAD"*" and H2. In fact, the first
phase is still a co-culturing of acidogens and syntrophic methanogens or sulphate reducers,
as shown in Figure 13. Sulfate reduction is thermodynamically favored over CO2
reduction by methane formers (Wood, 1961), provided that sulfate is present in the process
feed. Sulfate reducing organisms degrade acetate to CO2 and water.
In a mixed culture system, hydrogen removal is accomplished by interspecies
hydrogen transfer and by syntrophic methanogenic bacteria. It has been reported that the
acidogenic conversion may be inhibited by high concentrations of propionate and
butyrate due to product inhibition (Zoetemeyer, 1982).
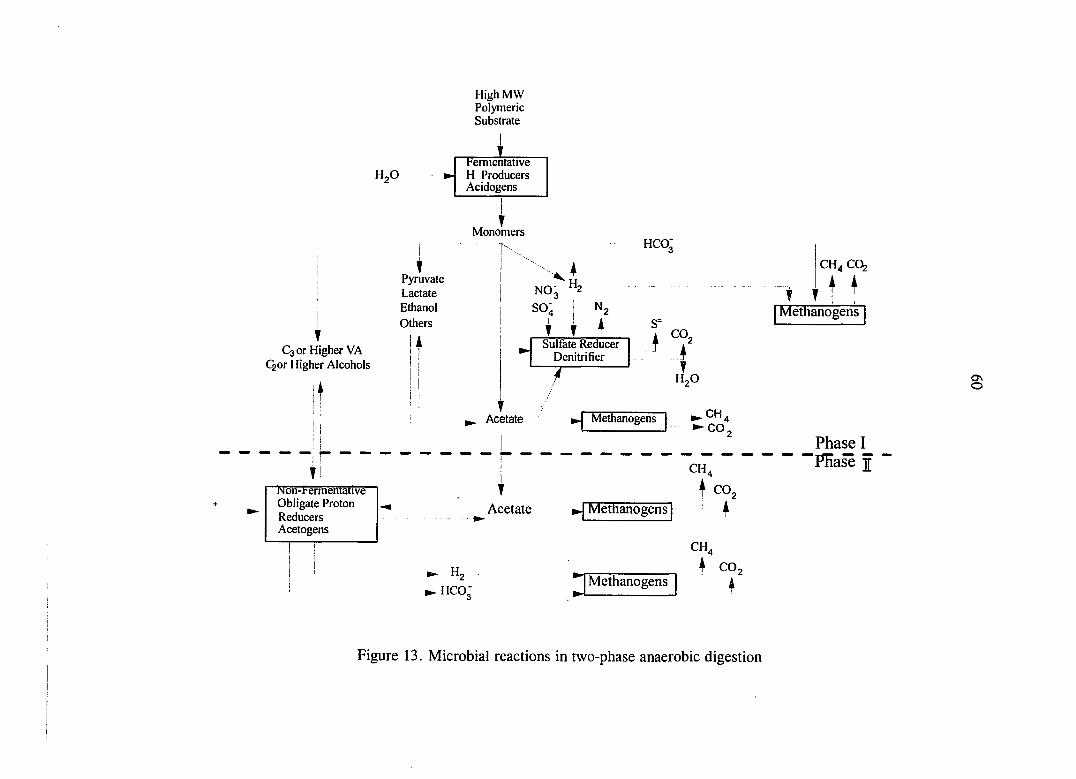
High MW Polymeric Substrate
HjO hermentative H Producers Acidogens
Mono^iers
T Pyruvate Lactate Ethanol Others
HCO;
NO; H,
SO
Csor Higher VA Qor Higher Alcohols
4 I
T T Sulfate Reducer
Denitrifier
~1
S=
.f CO,
A y
HgO
Acetate Methanogens . C H 4 - C O ,
f
CH4C0^
t t Methanogens
j 1
! 1 Phase I 1 ^ T! CH4 l^ase J
iNon-rermentative Obligate Proton Reducers Acetogens
T
Acetate ^ Methanogens CO2
4
^ H 2 HCO:
CH4
f CO2 Methanogens ^
Figure 13. Microbial reactions in two-phase anaerobic digestion

61
Table 21. Standard Gibb's free energies for acetogenic conversions of higher fatty acids, ethanol, and lactate®
Acetogenic Conversion Reaction AG" KJ/moIe
CH3CH2COO" + 3 H2O = CH3COO" + HCO3" + + 3 H2 +76.1
CH3CH2CH2COO- + 2 H2O = 2 CH3COO'+ H"*" + 2 H2 +48.1
CH3CH2OH + H2O = CH3C00- + H+ + 2 H2 +9.6
CH3CHOHCOO" + 4 H2O = 2 CH3COO" + 2 HCO3" + 2H"^+4H2 +9.2
" Reactants and products at unit activity except [H"^] = 10'^; T = 25°C.
Application of Two-Phase Anaerobic Digestion for High-Solid Waste Treatment
The most important point egarding the two-phase anaerobic digestion concept for
treating OFMSW successfully is to maintain a high hydrolytic and acidogenic rate in the
first phase and effective conversion of VFA to methane gas in the second phase. In
addition, a VFA concentration that is too high or a pH that is too low should not occur in
the process.
From an operational point of view, the hydraulic detention time in the acidogenic
reactor was too long in the solid bed (2-3 days) and the concentration of VFA entering the
methanogenic reactor was too high. The long HRT in the solid bed will cause the
accumulation of volatile acids. Therefore, the key to enhancing the efficiency of the two-
phase process is to make the chain reactions (hydrolysis ~ > acidogenesis ~ >
methanogenesis) proceed smoothly and effectively. A modified two-phase process was
studied in this research and will be presented and discussed in Chapter III.
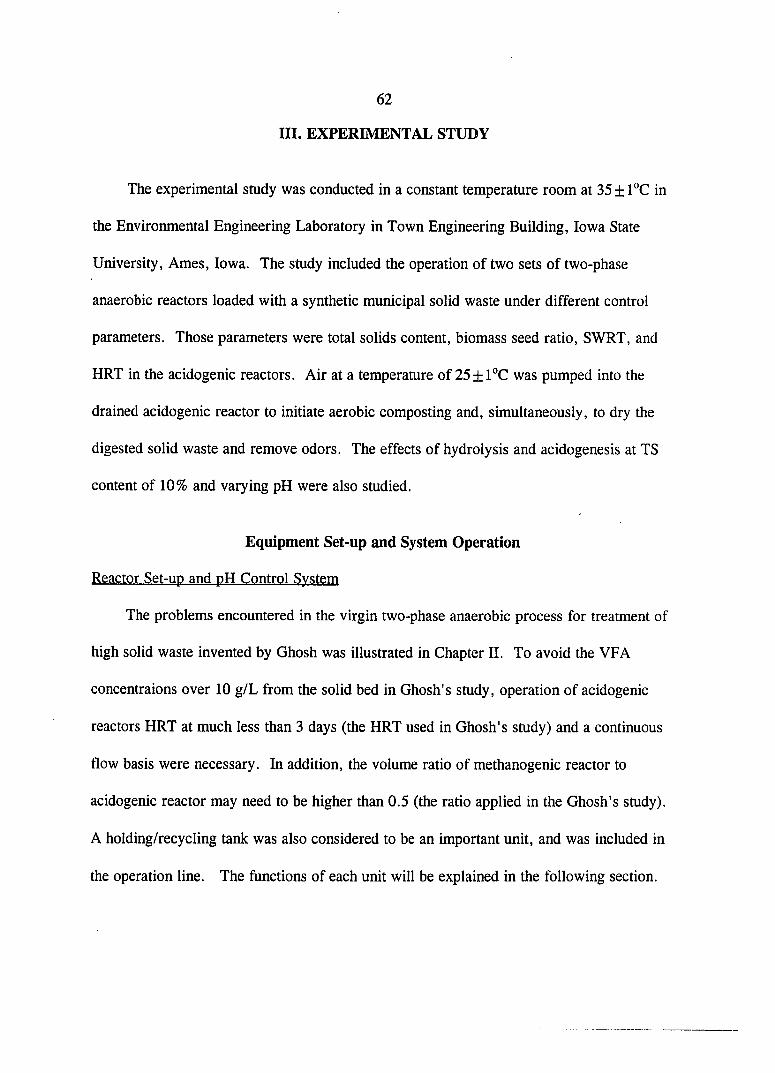
62
III. EXPERIMENTAL STUDY
The experimental study was conducted in a constant temperature room at 35 ± TC in
the Environmental Engineering Laboratory in Town Engineering Building, Iowa State
University, Ames, Iowa. The study included the operation of two sets of two-phase
anaerobic reactors loaded with a synthetic municipal solid waste under different control
parameters. Those parameters were total solids content, biomass seed ratio, SWRT, and
HRT in the acidogenic reactors. Air at a temperature of 25 + l°C was pumped into the
drained acidogenic reactor to initiate aerobic composting and, simultaneously, to dry the
digested solid waste and remove odors. The effects of hydrolysis and acidogenesis at TS
content of 10% and varying pH were also studied.
Equipment Set-up and System Operation
Reactor Set-up and pH Control Svstem
The problems encountered in the virgin two-phase anaerobic process for treatment of
high solid waste invented by Ghosh was illustrated in Chapter II. To avoid the VFA
concentraions over 10 g/L from the solid bed in Ghosh's study, operation of acidogenic
reactors HRT at much less than 3 days (the HRT used in Ghosh's study) and a continuous
flow basis were necessary. In addition, the volume ratio of methanogenic reactor to
acidogenic reactor may need to be higher than 0.5 (the ratio applied in the Ghosh's stady).
A holding/recycling tank was also considered to be an important unit, and was included in
the operation line. The functions of each unit will be explained in the following section.
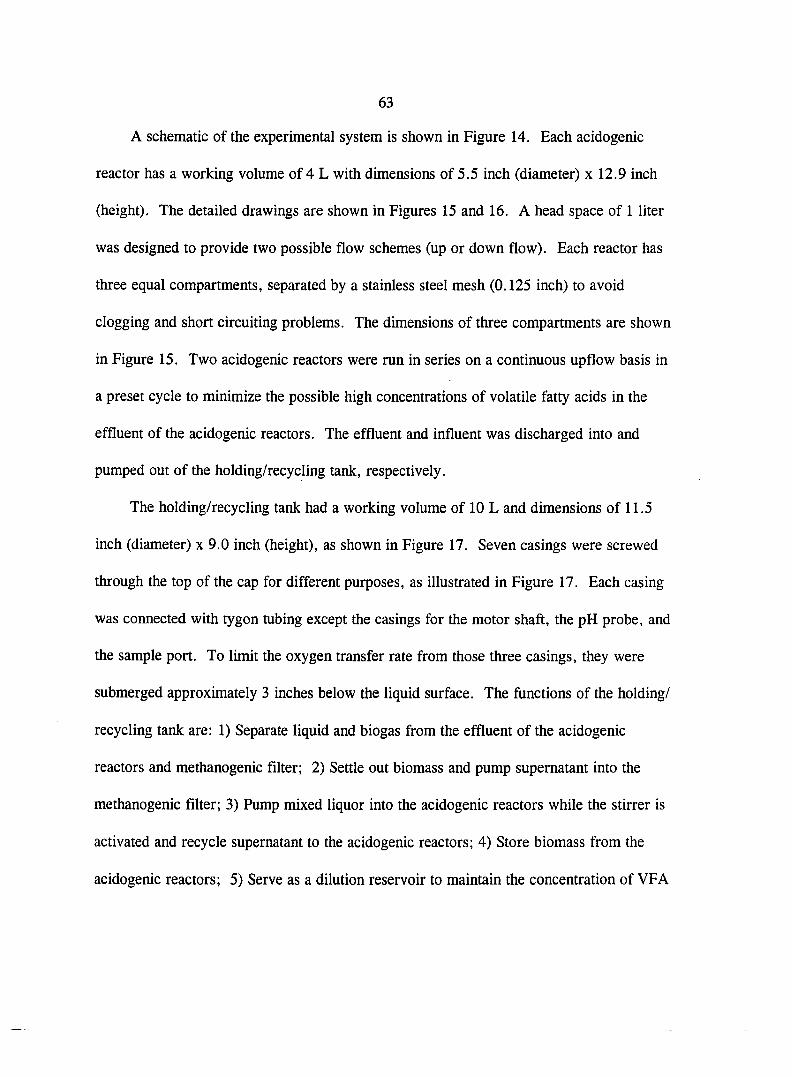
A schematic of the experimental system is shown in Figure 14. Each acidogenic
reactor has a working volume of 4 L with dimensions of 5.5 inch (diameter) x 12.9 inch
(height). The detailed drawings are shown in Figures 15 and 16. A head space of 1 liter
was designed to provide two possible flow schemes (up or down flow). Each reactor has
three equal compartments, separated by a stainless steel mesh (0.125 inch) to avoid
clogging and short circuiting problems. The dimensions of three compartments are shown
in Figure 15. Two acidogenic reactors were run in series on a continuous upflow basis in
a preset cycle to minimize the possible high concentrations of volatile fatty acids in the
effluent of the acidogenic reactors. The effluent and influent was discharged into and
pumped out of the holding/recycling tank, respectively.
The holding/recycling tank had a working volume of 10 L and dimensions of 11.5
inch (diameter) x 9.0 inch (height), as shown in Figure 17. Seven casings were screwed
through the top of the cap for different purposes, as illustrated in Figure 17. Each casing
was connected with tygon tubing except the casings for the motor shaft, the pH probe, and
the sample port. To limit the oxygen transfer rate from those three casings, they were
submerged approximately 3 inches below the liquid surface. The functions of the holding/
recycling tank are: 1) Separate liquid and biogas from the effluent of the acidogenic
reactors and methanogenic filter; 2) Settle out biomass and pump supernatant into the
methanogenic filter; 3) Pump mixed liquor into the acidogenic reactors while the stirrer is
activated and recycle supernatant to the acidogenic reactors; 4) Store biomass from the
acidogenic reactors; 5) Serve as a dilution reservoir to maintain the concentration of VFA
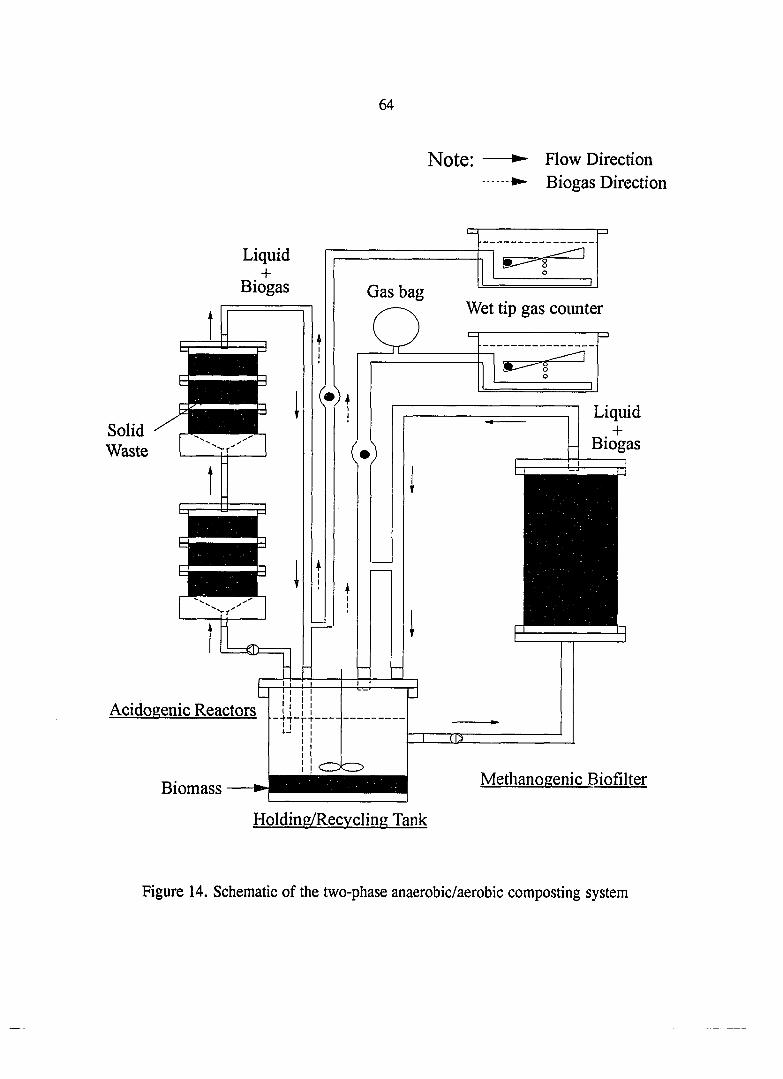
64
Note: • Flow Direction • Biogas Direction
Solid Waste
Acidogenic Reactors
Liquid +
Biogas
Gas bag Wet tip gas counter
Biomass Methanogenic Biofilter
Holding/Recycling Tank
Figure 14. Schematic of the two-phase anaerobic/aerobic composting system

65
T
A
i 1/2"
T
O Ring 5/8 jo Rii
5/8" -•
T 1.5"
7/16"
Swage Lock
T
A
Wing Nut
2 9/16"
B i
5.5" I.D.
-T 1/4"
B
3 7/16"
i I -^1/4" 3 7/16"
r'._/7
£ Stainless Mesh
•EE C
1 1/4 "
3 7/16"
\ 3.0"
3/4"
Swage Lock 1.5"
5/8"
Figure 15. Detailed drawing of the acidogenic reactor
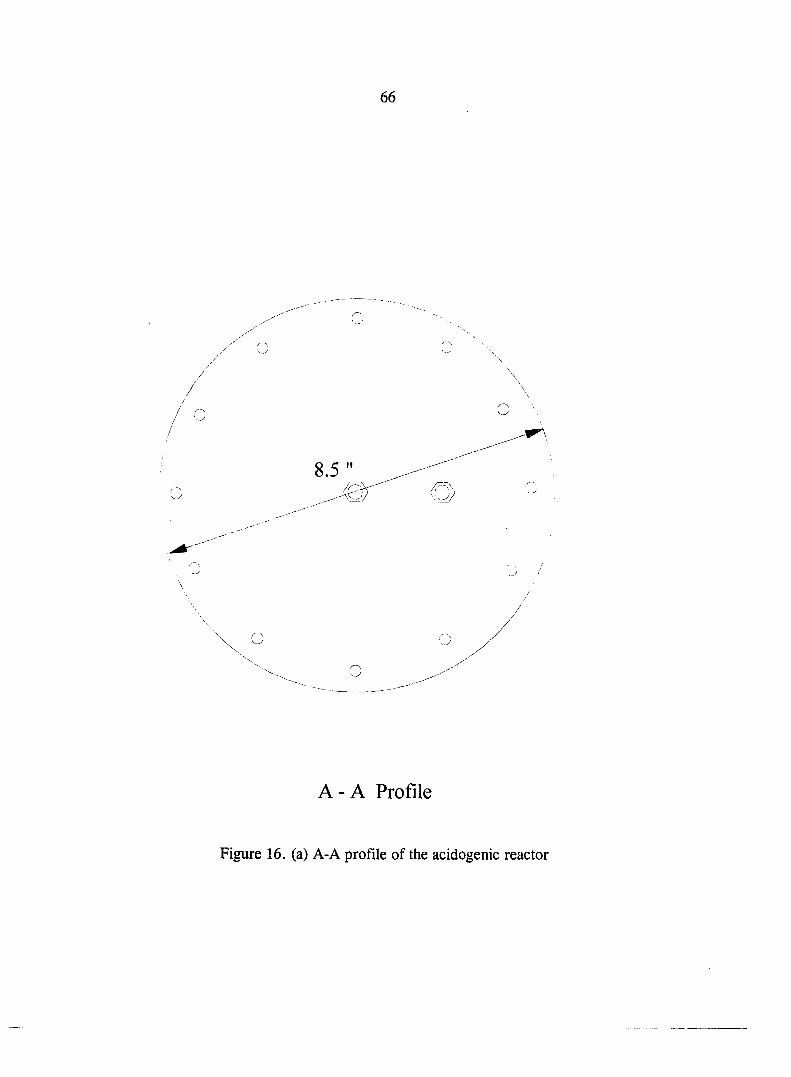
66
A - A P r o f i l e
Figure 16. (a) A-A profile of the acidogenic reactor

67
B-B Profile
Figure 16(continued); (b) B-B profile of the acidogenic reactor

68
3/8 "
T A
3/16" Y " 3/4" I r*-
5/8"
2 1/2"! 1 1/2"
* A
1/4 " r
' i 2 .0 "
- 1
H 3/4"
1/2 '
'5/8 "
9.0" J>7 .
1 /2"- ' - -
3 3/4" *
Swage Lock "2" 2 3/4"
._L
1/2"
I
11.5" I.D.
O Ring
1 / 2 "
/•-' 4,0" 4.0"
L = 3.0"
O.D. = 1/2 '
- YQ.R 'R^Q..
T W • L = 4.5" 2.0" ^ -r O.D. = 1/2
o i-r<0> <0>
/ O I / ; '/ / '/
2.0"
\ r^\\ \ \
1.0"
T
N / " i '/ o /
(0) ^ -v
A-A Profile
Figure 17. Detailed drawing of the holding/recycling tank
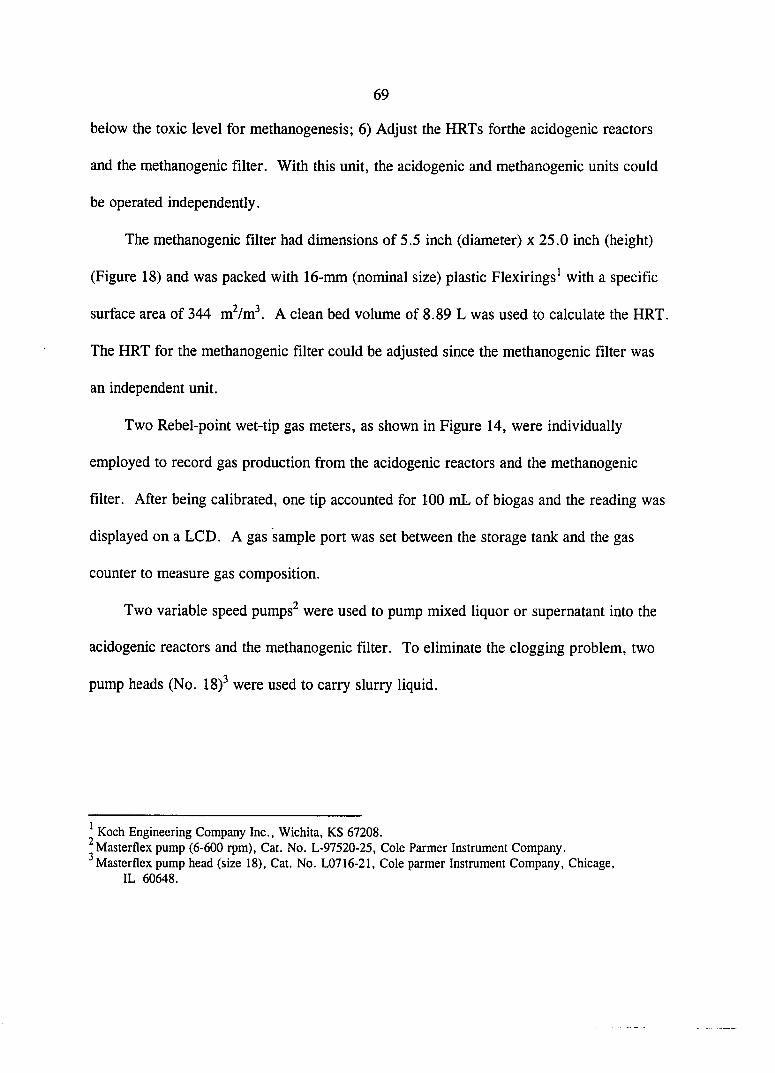
69
below the toxic level for methanogenesis; 6) Adjust the HRTs forthe acidogenic reactors
and the methanogenic filter. With this unit, the acidogenic and methanogenic units could
be operated independently.
The methanogenic filter had dimensions of 5.5 inch (diameter) x 25.0 inch (height)
(Figure 18) and was packed with 16-mm (nominal size) plastic Flexirings^ with a specific
surface area of 344 m^/m^. A clean bed volume of 8.89 L was used to calculate the HRT,
The HRT for the methanogenic filter could be adjusted since the methanogenic filter was
an independent unit.
Two Rebel-point wet-tip gas meters, as shown in Figure 14, were individually
employed to record gas production from the acidogenic reactors and the methanogenic
filter. After being calibrated, one tip accounted for 100 mL of biogas and the reading was
displayed on a LCD. A gas sample port was set between the storage tank and the gas
counter to measure gas composition.
Two variable speed pumps^ were used to pump mixed liquor or supernatant into the
acidogenic reactors and the methanogenic filter. To eliminate the clogging problem, two
pump heads (No. 18)^ were used to carry slurry liquid.
' Koch Engineering Company Inc., Wichita, KS 67208. Masterflex pump (6-600 rpm), Cat. No. L-97520-25, Cole Parmer Instrument Company. Masterflex pump head (size 18), Cat. No. L0716-21, Cole parmer Instrument Company, Chicage,
IL 60648.
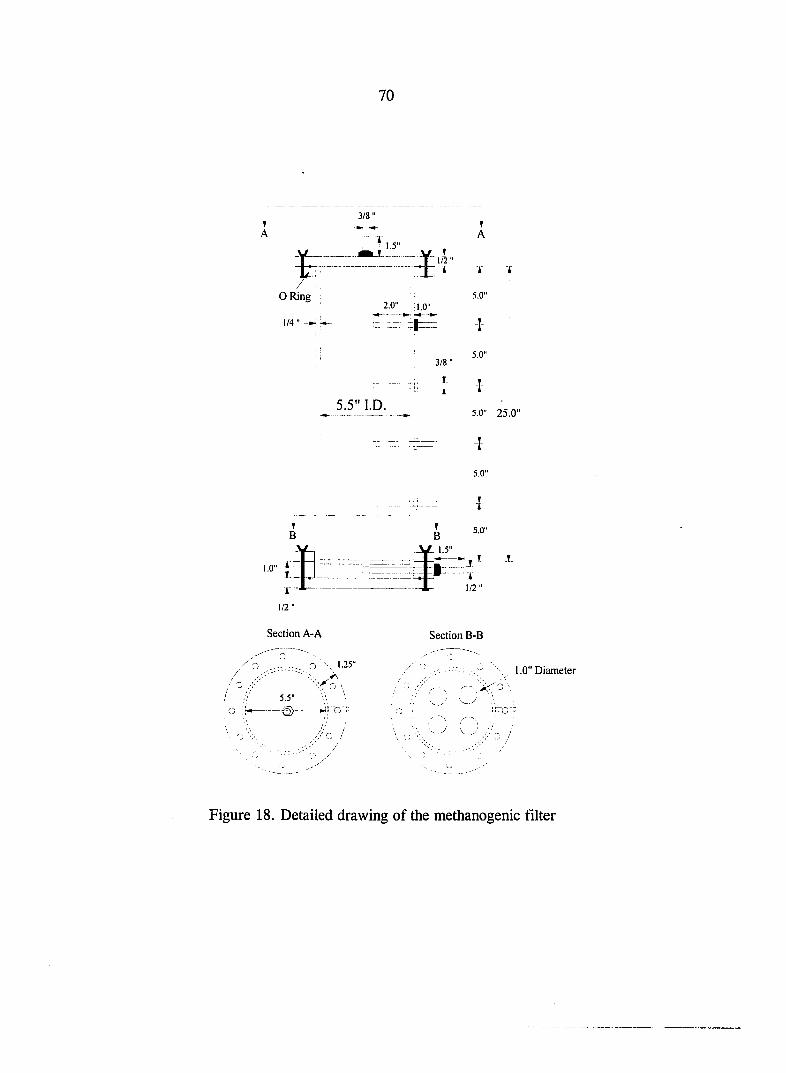
70
? A
3/8"
/ /
O Ring
1/4 " i»-
1,5"
2.0" 1.0"
3/8 "
1. t
5.5" I.D.
T A
"i" t
5.0"
-I-
5,0"
I 5.0" 25.0"
-I-
5.0"
-I
Section A-A Section B-B
O \l.25-
5.5"
1.0" Diameter
c /
Figure 18. Detailed drawing of the methanogenic filter
71
System Operation
Two acidogenic reactors were operated in series in an continuous upflow scheme. At
the end of half a SWRT, the top reactor was removed from the operational line and the
bottom one is moved to the follow position. Fresh synthetic OFMSW preloaded into an
empty acidogenic reactor was put into the system at the bottom lead position. The
acidogenic reactor removed from operation was drained of slurry liquid and the liquid was
then pumped back into the holding/recycling tank. The drained sludge served as seeding
biomass for a new start-up. However, a certain amount of biomass obtained from the
Wastewater Treatment Plant at Ames was needed to seed the acidogenic reactor since a
high portion of biomass was retained on the solid bed. After the draining process has been
completed, air at a constant temperature of 25 ± 1 °C was pumped into the digested solid
waste at a controlled rate to initiate the aerobic process and to dry the solid wastes. The
set-up for the aerobic study is shown in Figure 19.
Operation of the holding/recycling tank was based on a 1-hr cycle. The stirrer'^ was
activated for 7 minutes at the beginning of one cycle. This allowed the acidogenic pump to
pump mixed liquor into the acidogenic reactor to allow biomass to work on the solid
waste. At 12 minutes the solids settled to the bottom of the holding
and recycling tank and the methanogenic pump was then activated throughout the cycle.
This guaranteed that only the supernatant was being pumped into the methanogenic filter.
'^Cat. No. G-04330-00, Cole-Parmer Instrument Company, Niles, IL 60714.
72
rT Drained Solid Waste
Valve
-:=:nO:zjGl:: ai
Pressure Gauge
Figure 19. Schematic of the aerobic study set-up

73
Two programmable table timers^ were used to activate and deactivate the pumps and
mixing motor.
Special Design
Before the system started up, little information about system operation and physical
problems were known. Therefore, only one acidogenic reactor was tried operating in a
batch mode at 10, 15, and 20% TS contents. System failure occurred several times in this
batch study. This might be caused by two reasons: 1) Some big particles were clumped
together in tubings ; 2) Biogas trapped in the solid waste resulted in uplifting of the solid
bed. These two phenomena would block biogas from exiting the reactor. It was possible
to increase gas pressure within the acidogenic reactor and finally blow out the joints
between two tubings.
To solve the physical problems, the following means were tried: 1) Enlarge the size
of the tubings from diameter of 0.375 inch to 0.5 inch; 2) Insert five plastic tubes (0.08
inch I.D) which were evenly perforated with 3 holes (0.05 inch diameter) along the tube,
as shown in Figure 18; 3) Glue plastic media, used as biomass attachment for the biofilter
in this study, onto the bottom of three meshes for redistribution of the flow pattern and
avoidance of short circuiting problems. This set up is shown in Figure 20. The plastic
tubes were evenly distributed on the surface of the stainless mesh as possible as it could be
and the density of the plastic media was set at about 0.88 piece per square inches. System
^ Chron Trol Timer, Cat. No. L-08614-00, Cole-Parmer Instrument Company.

74
Plastic media 3Si
I ;irzri .Trnr
icrrp ' " 'I'' I
. ifc! =±=
V^i.
4 .0"
V y
I ; •
y-.J
Top View 0.08" Plastic tube
/
hole
Silicone §yg View
Fgure 20. Schematic of a special design for avoiding clogging problem
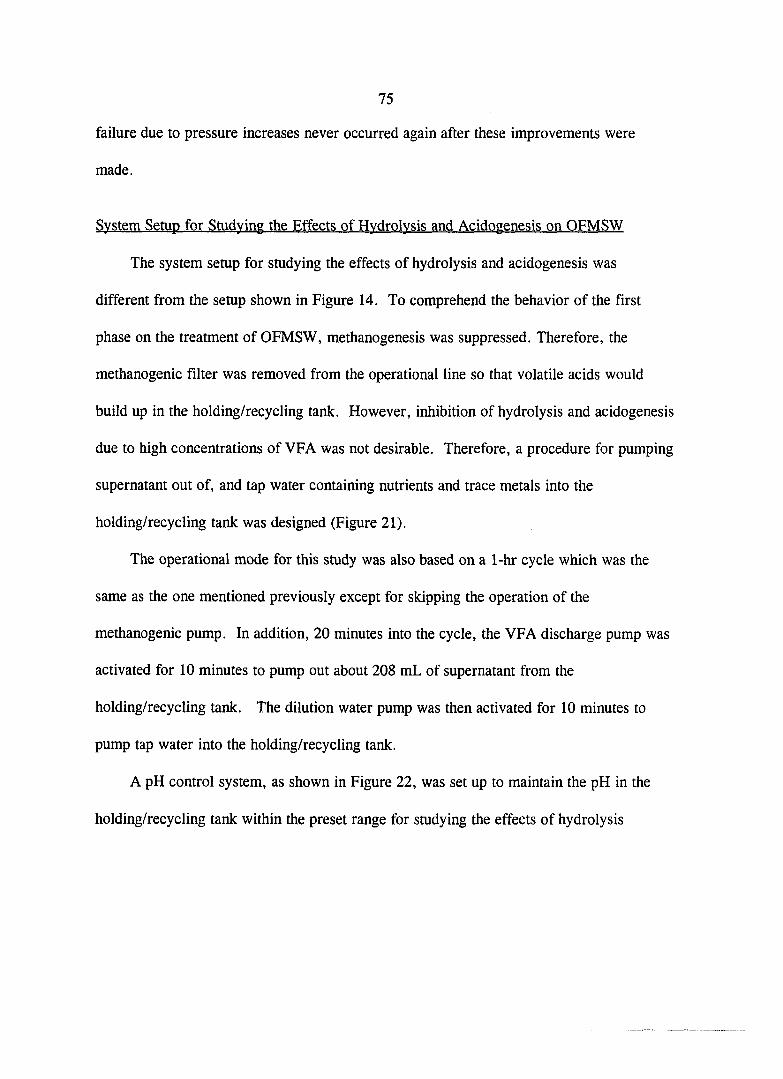
75
failure due to pressure increases never occurred again after these improvements were
made.
Svstem Setup for Studying the Effects of Hydrolysis and Acidogenesis on OFMSW
The system setup for studying the effects of hydrolysis and acidogenesis was
different from the setup shown in Figure 14. To comprehend the behavior of the first
phase on the treatment of OFMSW, methanogenesis was suppressed. Therefore, the
methanogenic filter was removed from the operational line so that volatile acids would
build up in the holding/recycling tank. However, inhibition of hydrolysis and acidogenesis
due to high concentrations of VFA was not desirable. Therefore, a procedure for pumping
supernatant out of, and tap water containing nutrients and trace metals into the
holding/recycling tank was designed (Figure 21).
The operational mode for this study was also based on a 1-hr cycle which was the
same as the one mentioned previously except for skipping the operation of the
methanogenic pump. In addition, 20 minutes into the cycle, the VFA discharge pump was
activated for 10 minutes to pump out about 208 mL of supernatant from the
holding/recycling tank. The dilution water pump was then activated for 10 minutes to
pump tap water into the holding/recycling tank.
A pH control system, as shown in Figure 22, was set up to maintain the pH in the
holding/recycling tank within the preset range for studying the effects of hydrolysis

76
Note: —• Gas bag
Flow Direction Biogas Direction
Liquid .4*
Biogas
Solid Waste
Wet tip gas counter
Dilution Water Tank
Acidoeenic Reactors
Holding/Recycling Tank
VFA Discharge Tank
Figure 21. Schematic of system setup for the study of hydrolysis and acidogenesis on OFMSW

77
Microflow pump On or Off ^ N
mV Concentrated basic solution
A 1
pH control unit pH Probe
• i ; . \ ~ /
u- - ' V V
I c
Figure 22. pH control system to maintain a preset pH level within the holding/ recycling tank
78
and acidogenesis. This system consisted of a pH controller^ and a microflow pump^. The
pH can be maintained at a preset value ± 0.05 pH unit. The pH probe was immersed
into the holding/recycling tank and the response was fed into the pH controller. The
switching of the pump was initiated when the pH in the reactor fell below a preset value.
Concentrated basic solution containing IM sodium bicarbonate, IM potassium bicarbonate,
IM sodium hydroxide, and IM potassium hydroxide, was prepared for maintaining
constant pH.
Preparation of Substrate and Nutrient
Contents and Characteristics of Svnthetic Substrate
From the literature mentioned in Chapter II, synthetic substrate was used to simulate
OFMSW. The content and characteristics of the substrate are shown in Table 23. The
average percentage of dry weight determined from the bulk sample was about 86.9%. The
average percentage of TVS in TS was about 92.9%. White paper (20 lb basis weight) used
as copy paper was obtained from Wal Mart. Newspaper was collected from Iowa State
University. Cardboard paper was collected from Save U More. Plastics bought from Wal
Mart has a thickness of 0.8 mm. Wood chips and mulch were obtained from a garden
center. Limited by the reactor size, white paper, newspaper, cardboard paper, and plastics
were cut roughly into dimensions of 0.5 inch by 0.5 inch. The experimental procedure to
obtain the numbers in Table 22 is discussed in this chapter.
^ Cat. No. G-05997-75, Cole-Parmer Instrument Company, Niles, IL 60774. 7
No speed control (6 rpm), Cat. No. G-07543-06, Cole-Parmer Instrument Company.
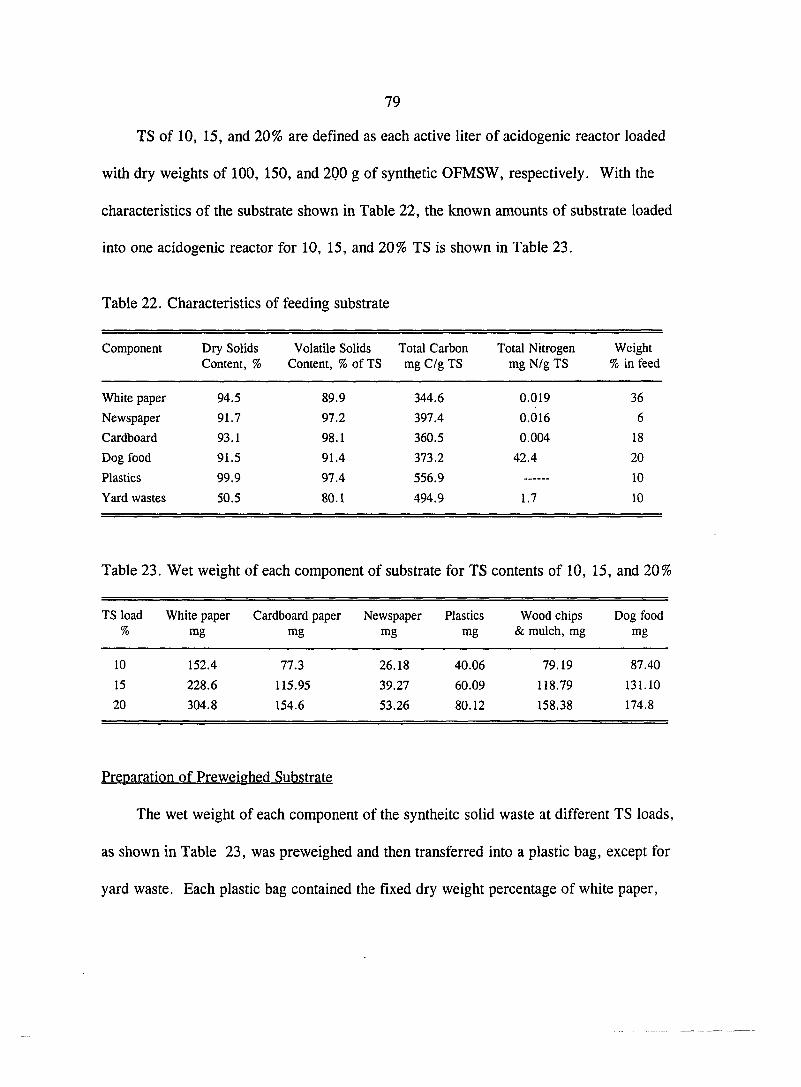
79
TS of 10, 15, and 20% are defined as each active liter of acidogenic reactor loaded
with dry weights of 100, 150, and 200 g of synthetic OFMSW, respectively. With the
characteristics of the substrate shown in Table 22, the known amounts of substrate loaded
into one acidogenic reactor for 10, 15, and 20% TS is shown in Table 23.
Table 22. Characteristics of feeding substrate
Component Dry Solids Content, %
Volatile Solids Content, % of TS
Total Carbon mg C/g TS
Total Nitrogen mg N/g TS
Weight % in feed
White paper 94.5 89.9 344.6 0.019 36
Newspaper 91.7 97.2 397.4 0.016 6
Cardboard 93.1 98.1 360.5 0.004 18
Dog food 91.5 91.4 373.2 42.4 20
Plastics 99.9 97.4 556.9 10
Yard wastes 50.5 80.1 494.9 1.7 10
Table 23. Wet weight of each component of substrate for TS contents of 10, 15, and 20%
TS load White paper Cardboard paper Newspaper Plastics Wood chips Dog food % mg mg mg mg & mulch, mg mg
10 152.4 77.3 26.18 40.06 79.19 87.40
15 228.6 115.95 39.27 60.09 118.79 131.10
20 304.8 154.6 53.26 80.12 158.38 174.8
Preparation of Preweighed Substrate
The wet weight of each component of the syntheitc solid waste at different TS loads,
as shown in Table 23, was preweighed and then transferred into a plastic bag, except for
yard waste. Each plastic bag contained the fixed dry weight percentage of white paper,
cardboard paper, newspaper, plactics, and dog food. These bags were preserved at 4 °C in
a refrigerator until they were used. This preparation keeps the dry weight of each
component the same over time. Accordingly, 40 samples of each TS load were prepared
and kept at 4 °C in a refrigerator for the whole experimental study. The contents of a
plastic bag were mixed and then completely transferred into an empty acidogenic reactor
one night before the lead acidogenic reactor was removed from the operational line.
During the loading process, preweighed yard waste was also transferred and mixed into the
acidogenic reactor. The time for exchanging fresh solid waste and digested solid waste
was set around 12 o'clock PM at the end of every half SWRT.
Addition of Nutrients and Trace Metals
Nutrients and trace metals were prepared for studying the effects of hydrolysis and
acidogenesis. In this study, 5 L of supernatant in the holding/recycling tank was replaced
by 5 L of tap water with nutrients and trace metals on a daily basis. The reason to add
nutrients and trace metals in the dilution water is that release of nutrients and trace metals
from solid waste into liquid would be pumped out of the system. This would result in a
deficiency of nutrients and trace metals. Therefore, 100 mL of bulk solution containing
nutrient and trace metals, as shown in Table 24, was added to the 5-liter dilution water.
Three 2-liter bottles were used to store trace metals and nutrients. Trace metals were
mixed and stored in one bottle. Sulfide was stored in one bottle to prevent the
precipitation of trace metals. Ammonium and phosphate were stored in one bottle.
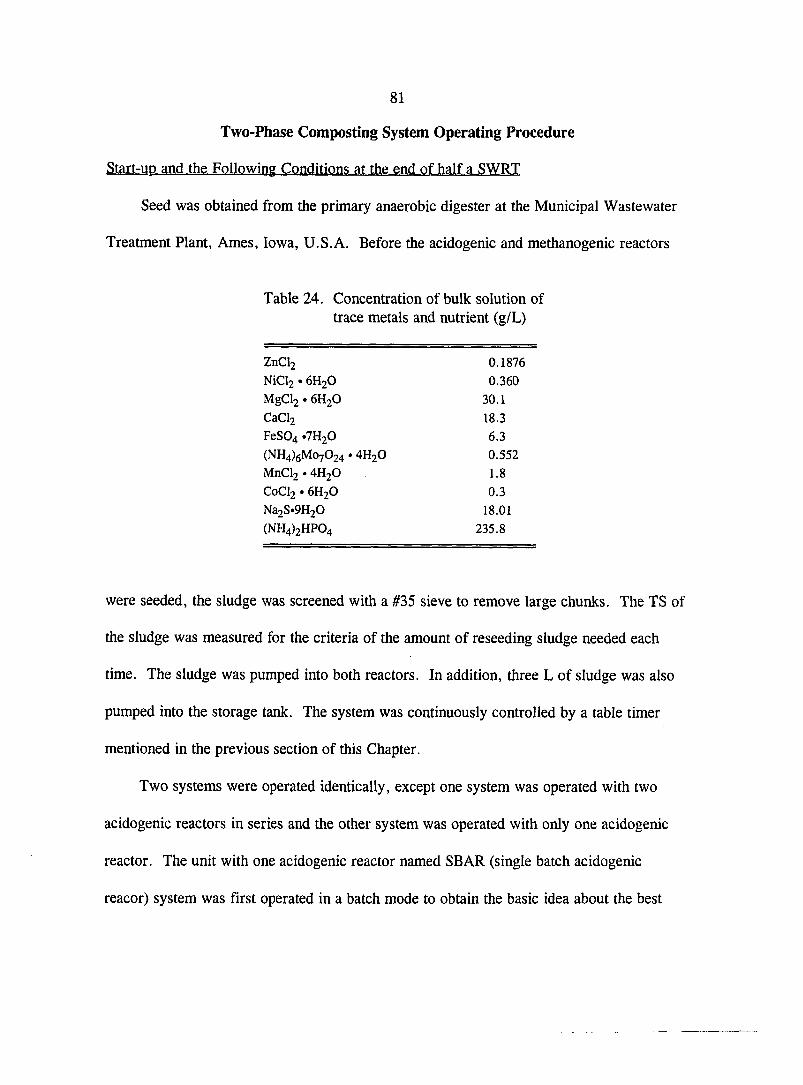
81
Two-Phase Composting System Operating Procedure
Start-up and the Following Conditions at the end of half a SWRT
Seed was obtained from the primary anaerobic digester at the Municipal Wastewater
Treatment Plant, Ames, Iowa, U.S.A. Before the acidogenic and methanogenic reactors
Table 24. Concentration of bulk solution of trace metals and nutrient (g/L)
ZnCl2 0.1876
NiCl2 • 6H2O 0.360
MgCl2'6H20 30.1
CaCl2 18.3
FeS04.7H2O 6.3
(NH4)6Mo7024 • 4H2O 0.552
MnCl2'4H20 1.8
C0CI2 • 6H2O 0.3
Na2S«9H20 18.01
(NH4)2HP04 235.8
were seeded, the sludge was screened with a #35 sieve to remove large chunks. The TS of
the sludge was measured for the criteria of the amount of reseeding sludge needed each
time. The sludge was pumped into both reactors. In addition, three L of sludge was also
pumped into the storage tank. The system was continuously controlled by a table timer
mentioned in the previous section of this Chapter.
Two systems were operated identically, except one system was operated with two
acidogenic reactors in series and the other system was operated with only one acidogenic
reactor. The unit with one acidogenic reactor named SBAR (single batch acidogenic
reacor) system was first operated in a batch mode to obtain the basic idea about the best
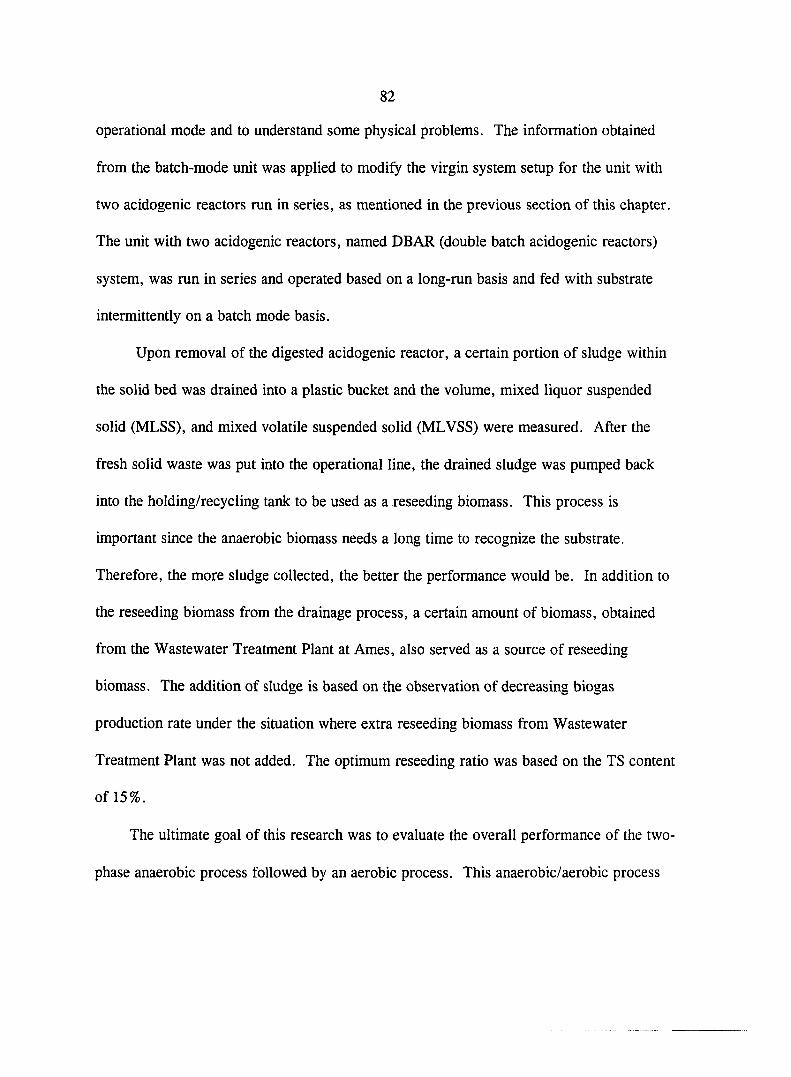
82
operational mode and to understand some physical problems. The information obtained
from the batch-mode unit was applied to modify the virgin system setup for the unit with
two acidogenic reactors run in series, as mentioned in the previous section of this chapter.
The unit with two acidogenic reactors, named DEAR (double batch acidogenic reactors)
system, was run in series and operated based on a long-run basis and fed with substrate
intermittently on a batch mode basis.
Upon removal of the digested acidogenic reactor, a certain portion of sludge within
the solid bed was drained into a plastic bucket and the volume, mixed liquor suspended
solid (MLSS), and mixed volatile suspended solid (MLVSS) were measured. After the
fresh solid waste was put into the operational line, the drained sludge was pumped back
into the holding/recycling tank to be used as a reseeding biomass. This process is
important since the anaerobic biomass needs a long time to recognize the substrate.
Therefore, the more sludge collected, the better the performance would be. In addition to
the reseeding biomass from the drainage process, a certain amount of biomass, obtained
from the Wastewater Treatment Plant at Ames, also served as a source of reseeding
biomass. The addition of sludge is based on the observation of decreasing biogas
production rate under the situation where extra reseeding biomass from Wastewater
Treatment Plant was not added. The optimum reseeding ratio was based on the TS content
of 15%.
The ultimate goal of this research was to evaluate the overall performance of the two-
phase anaerobic process followed by an aerobic process. This anaerobic/aerobic process

83
was only applied to the DBAR system. Operation of anaerobic/aerobic processes has been
discussed previously. The air flux was controlled in the range of 0.131 to 0.522 m^ air/m^
surface area of acidogenic reactor/minute, at different study periods from 3 to 5 days.
This process would not start until the total gas production rate was at a constant level.
Daily Sampling Procedure
Since the time to replace a digested solid waste was set at 12 o'clock noon, the time
to take liquid and gas samples was also fixed at 12 o'clock. Mixed liquor in the amount of
35 mL was drawn from the sample port of the holding/recycling tank and another 35 mL
of acidogenic effluent was collected from a manual on-off valve. Tap water of 50 mL was
used to replenish the reactor. Measurement of pH and MLVSS for both samples was
executed immediately. Each sample was then diluted for the measurement of COD and
individual VFA, and preserved in a 100 mL glass at a temperature of 4°C. Gas was
sampled for immediate gas analysis, using a Gas Chromatograph.
Routine Maintenance and Daily Monitoring
Little information on the physical problems of two-phase anaerobic composting has
been documented. Successful operation of each run of the whole system relied on
consistent, careful, and thorough routine maintenance. Any small disruption would have
disturbed the entire system and required restarting. A daily inspection checklist was
established (Table 25). The checklist kept expanding to include the problems not in the
current list throughout the study.
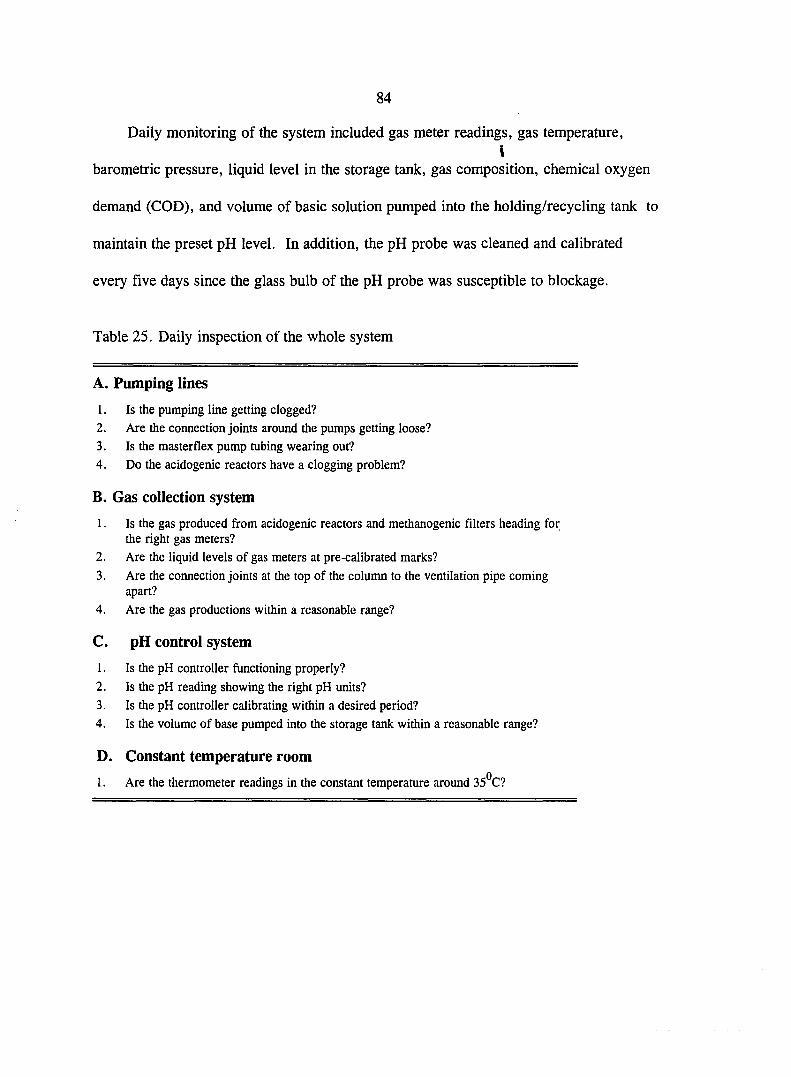
84
Daily monitoring of the system included gas meter readings, gas temperature, \
barometric pressure, liquid level in the storage tank, gas composition, chemical oxygen
demand (COD), and volume of basic solution pumped into the holding/recycling tank to
maintain the preset pH level. In addition, the pH probe was cleaned and calibrated
every five days since the glass bulb of the pH probe was susceptible to blockage.
Table 25. Daily inspection of the whole system
A. Pumping lines
1. Is the pumping line getting clogged?
2. Are the connection joints around the pumps getting loose?
3. Is the masterflex pump tubing wearing out?
4. Do the acidogenic reactors have a clogging problem?
B. Gas collection system
1. Is the gas produced from acidogenic reactors and methanogenic filters heading for the right gas meters?
2. Are the liquid levels of gas meters at pre-calibrated marks?
3. Are the connection joints at the top of the column to the ventilation pipe coming apart?
4. Are the gas productions within a reasonable range?
C. pH control system
1. Is the pH controller functioning properly?
2. Is the pH reading showing the right pH units?
3. Is the pH controller calibrating within a desired period?
4. Is the volume of base pumped into the storage tank within a reasonable range?
D.
1.
Constant temperature room
Are the thermometer readings in the constant temperature around 35°C?

85
Study of Ultimate Gas Production on Feeding Solid Waste
Measurement of ultimate methane production per unit weight of dry solid waste is
necessary and important. This information could be a base line used to calculate the VS
destruction of the biodegradable portion for different operating conditions. Therefore,
the percentage of ultimate gas production for a specific run could be obtained.
Preparation of Substrate. Seed, and Nutrient
Ten vacuum filter bottles with total volume of 500 mL were used to smdy the
ultimate gas production. The procedure for this study is shown as follows:
1. Five preweighed 3-g TS, according to the content of Table 23, were individually
transferred into five vacuum filter bottles serving as testing samples. The others,
without adding substrate, served as blank controls.
2. Screened seed, obtained from the Wastewater Treatment Plant at Ames in the amount
of 100 mL, was transferred into each bottle.
3. To avoid rate limitations by nutrients, trace metals, and pH drop, each bottle was
filled with a 200 mL solution from a 4-L bulk solution. This 4-L bulk solution,
which contains nutrients, trace metals, and buffer, was made from three concentrated
stock solution, as shown in Table 26. 16 mL of stock solution 1 and 3, and 80 mL of
stock solution 2 were transferred into an empty 4-L graduation beaker and then
diluted to 4 L.
4. Each bottle was then diluted to 400 mL. The final concentration of nutrients,
trace metals, and sodium bicarbonate in media is shown in the column 5, Table 26.
5. Each bottle was purged with pure N2 gas for 15 minutes to expel excess air. Then the
tygon tubings were clamped and the study was started. A magnetic plate was used to
continuously mix the liquid. The system set-up is shown in Figure 23.
6. The biogas accumulated in the bottles was released by a lubricated glass syringe. The
86
Table 26. Nutrients and trace metals stock solution for the study of ultimate gas production
Stock Compound Concentration Amount added Concentration solution g/L per 4 L, mL in media, mmol
S-1 KH2PO4 69.0 16 2.0
K2HPO4 88.0 16 2.0
(NH4)2HP04 10.0 16 0.3
NH4CI 100.0 16 7.4
S-2 MgCl2 • 6H2O 60.0 80 6.0
FeCb • 4H2O 20.0 80 2.0 KCl 10.0 80 2.6 CaCb 10.0 80 1.8 KI 1.0 80 0.12
MnCl2 .4H2O 0.4 80 0.04 C0CI2 .EHJO 0.4 80 0.034
NiClj • 6H2O 0.05 80 0.0042
CUCI2 0.05 80 0.0074
ZnCl2 0.05 80 0.0074
H3BO3 0.05 80 0.0162
Na2Mo04 . 2H2O 0.05 80 0.0036
NaV03 • nHaO 0.05 80 0.0082
Na2Sc03 0.01 80 0.00108
S-3 NajS . 9H2O 50.0 16 0.80 NaHC03 50.0 16 0.80
gas composition was simultaneously measured using a GC. Sampling frequency
was based on the biogas production rate.
Loading Schedule
The loading schedules for the two-phase anaerobic composting smdies were
performed on the basis of TS content fed in the acidogenic reactor and SWRT. Table 27
shows the loading schedule for the two systems. As mentioned previously, the SBAR
system was being operated with only one acidogenic reactor at a batch feed or semi-batch

87
• 9 m
Rubber stopper
Gas sample port
Vacuum filter bottle /
Seed +
(Substrate ) +
Nutrients
Vol. = 400 ml
_ __ _Stk Bar 2
Magnetic Plate
Clamp
Figure 23. System set-up for the study of ultimate methane gas production on feeding substrate
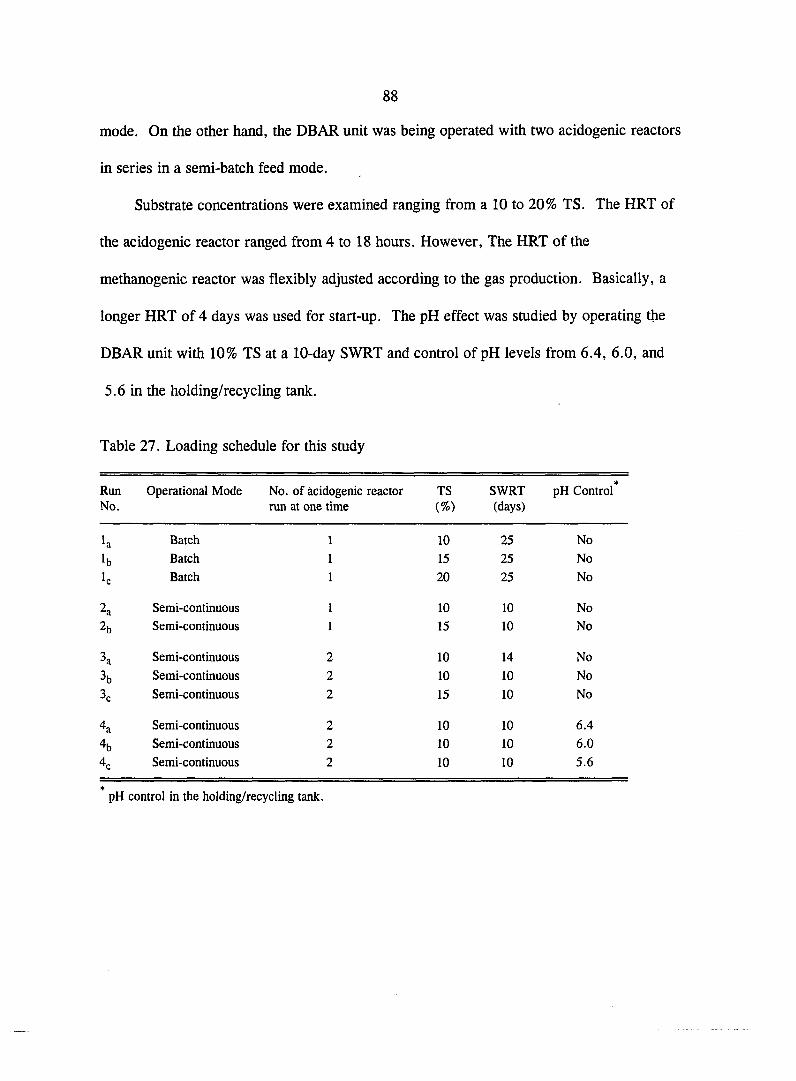
88
mode. On the other hand, the DBAR unit was being operated with two acidogenic reactors
in series in a semi-batch feed mode.
Substrate concentrations were examined ranging from a 10 to 20% TS. The HRT of
the acidogenic reactor ranged from 4 to 18 hours. However, The HRT of the
methanogenic reactor was flexibly adjusted according to the gas production. Basically, a
longer HRT of 4 days was used for start-up. The pH effect was studied by operating the
DBAR unit with 10% TS at a 10-day SWRT and control of pH levels from 6.4, 6.0, and
5.6 in the holding/recycling tank.
Table 27. Loading schedule for this study
Riin Operational Mode No. of acidogenic reactor TS SWRT *
pH Control No. run at one time (%) (days)
la Batch 1 10 25 No
lb Batch I 15 25 No
Ic Batch 1 20 25 No
2a Semi-continuous 1 10 10 No
2b Semi-continuous 1 15 10 No
3a Semi-continuous 2 10 14 No
3b Semi-continuous 2 10 10 No
3c Semi-continuous 2 15 10 No
4a Semi-continuous 2 10 10 6.4
4b Semi-continuous 2 10 10 6.0
4c Semi-continuous 2 10 10 5.6
*
pH control in the holding/recycling tank.
89
Analytical Methods
Operation of the two-phase anaerobic composting system involved intensive analytical
work on a routine basis. Table 28 summarizes the analyzed items and the methods used in
this study.
Sampling Procedure for Soluble Components
To effectively remove the suspended solids for the determination of soluble
components, the preserved or fresh samples were passed through a 9 cm glass filter® with a
1.2 ^m pore size using a vacuum pump connected to a filter flask and buchner fiinnel.
Chemical Oxygen Demand
The chemical oxygen demand (COD) test is used as a measure of the oxygen
equivalent of the organic matter in a sample that is susceptible to oxidation by a strong
chemical oxidant. Only soluble COD (SCOD) was determined throughout the smdy since
SCOD represents the hydrolysis end products and volatile acids. The test procedure
followed the outline in part 508b of Standard Methods (Standard Methods, 1985).
The 20 X 150 mm culture tubes® were used for the digestion, requiring the following
quantities:
Sample 5 mL
Potassium Dichromate 3 mL
Sulfuric acid with catalyst 7 mL
® Cat. No. 09-804-90A, Fisher Sicence Company.
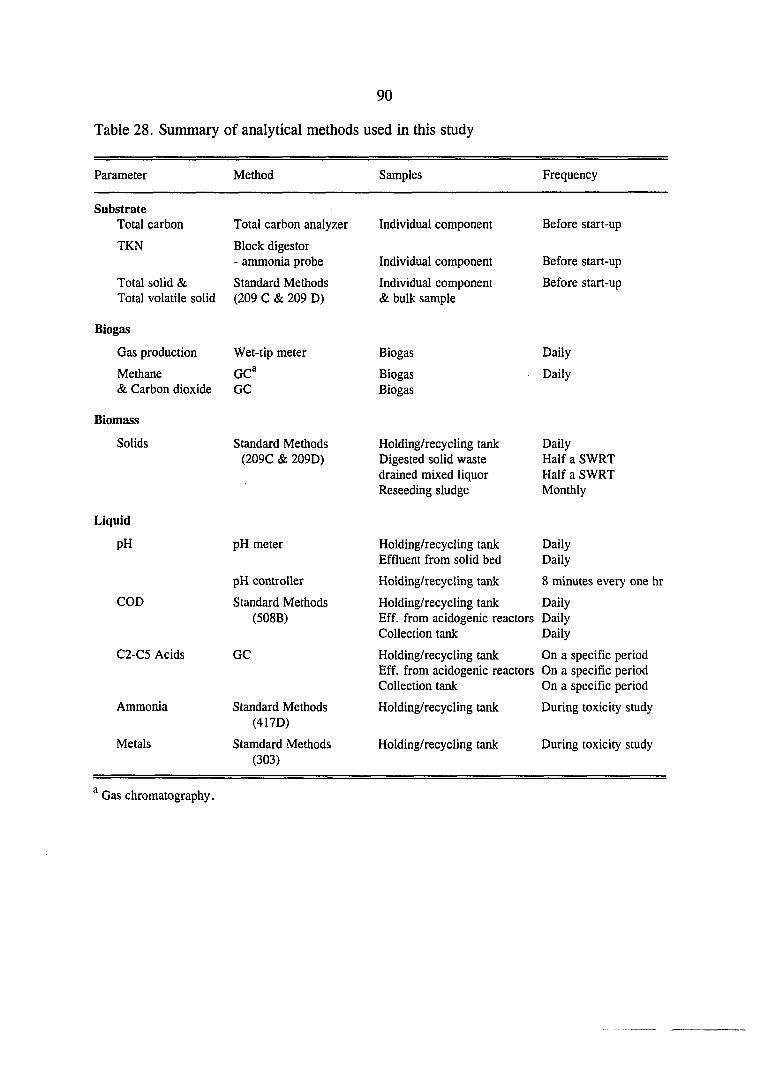
90
Table 28. Summary of analytical methods used in this study
Parameter Method Samples Frequency
Substrate Total carbon
TKN
Total solid & Total volatile solid
Biogas
Gas production
Methane & Carbon dioxide
Biomass
Solids
Liquid
PH
COD
C2-C5 Acids
Ammonia
Metals
Total carbon analyzer Individual component
Block digestor - ammonia probe
Standard Methods (209 C & 209 D)
Wet-tip meter
GC®
GC
Standard Methods (209C & 209D)
pH meter
pH controller
Standard Methods (508B)
GC
Standard Methods (417D)
Stamdard Methods (303)
Individual component
Individual component & bulk sample
Biogas
Biogas Biogas
Holding/recycling tank Digested solid waste drained mixed liquor Reseeding sludge
Holding/recycling tank Effluent from solid bed
Holding/recycling tank
Holding/recycling tank Eff. from acidogenic reactors Collection tank
Holding/recycling tank Eff. from acidogenic reactors Collection tank
Holding/recycling tank
Holding/recycling tank
Before start-up
Before start-up
Before start-up
Daily
Daily
Daily Half a SWRT Half a SWRT Monthly
Daily Daily
8 minutes every one hr
Daily Daily Daily
On a specific period On a specific period On a specific period
During toxicity study
During toxicity study
^ Gas chromatography.
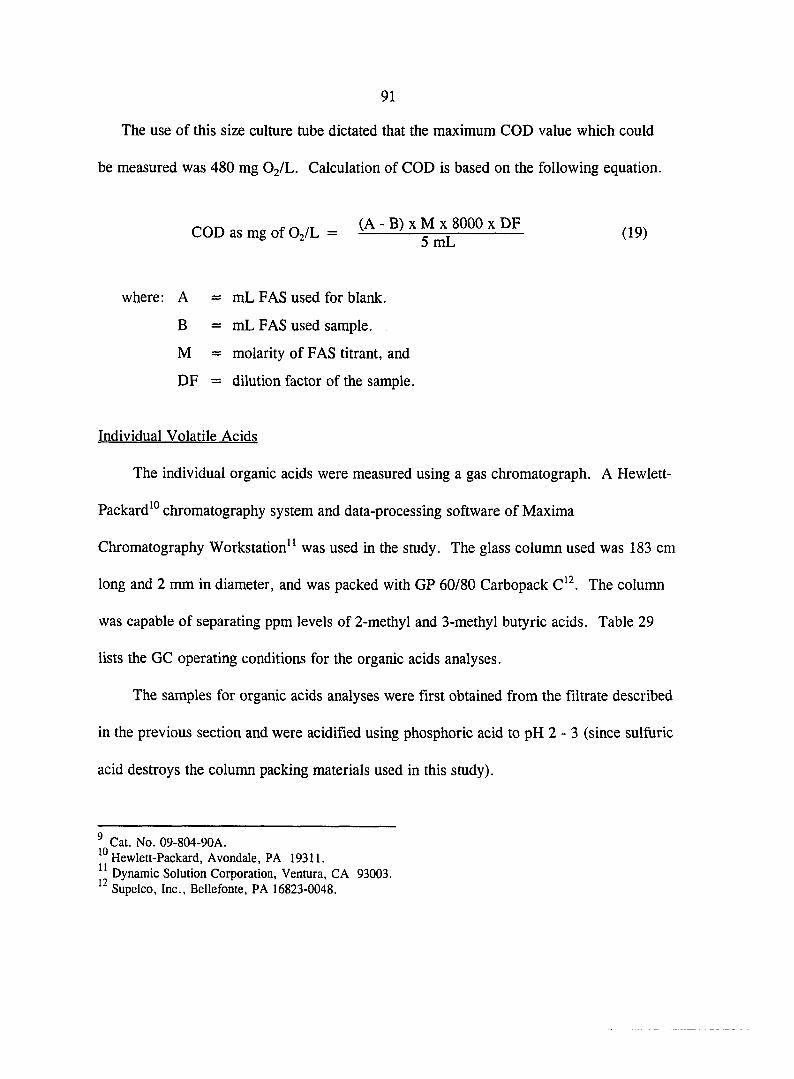
91
The use of this size culture tube dictated that the maximum COD value which could
be measured was 480 mg O2/L. Calculation of COD is based on the following equation.
f m n ( A - B ) X M X 8000 X DF COD as mg of O2/L = (19)
where: A = mL FAS used for blank.
B = mL FAS used sample.
M = molarity of FAS titrant, and
DF = dilution factor of the sample.
Individual Volatile Acids
The individual organic acids were measured using a gas chromatograph. A Hewlett-
Packard^® chromatography system and data-processing software of Maxima
Chromatography Workstation^' was used in the study. The glass column used was 183 cm
long and 2 mm in diameter, and was packed with GP 60/80 Carbopack C'^. The column
was capable of separating ppm levels of 2-methyl and 3-methyl butyric acids. Table 29
lists the GC operating conditions for the organic acids analyses.
The samples for organic acids analyses were first obtained from the filtrate described
in the previous section and were acidified using phosphoric acid to pH 2 - 3 (since sulfuric
acid destroys the column packing materials used in this study).
^ Cat. No. 09-804-90A. Hewlett-Packard, Avondale, PA 19311.
11 Dynamic Solution Coqjoration, Ventura, CA 93003. Supelco, Inc., Bellefonte, PA 16823-0048.
92
The acidified filtrates were then preserved in 2-mL vials'^, which were covered with
Teflon-coated lids and clamped with aluminum caps. The samples were preserved at 4°C in
a refrigerater until they were analyzed. A microsyringe^'^was used to withdraw 1 lA^ of
sample from a vial for direct injection into the column.
Solids
Total suspended solids and total volatile solids
Total solids (TS) can be determined by evaporating the sample in a weighed dish and
dried to constant weight in an oven at 103 to 105°C. The increase in weight over that of
the empty dish represents the total solids. The volatile and fixed components in the total
residue of predried dish can be determined by igniting the sample at 550 ± 50°C. The
tests for total solids and volatile solids were performed according to the procedures given
in part 509F of the Standard Methods with the following exceptions:
1. The digested solid waste was completely transferred from the acidogenic reactor into porcelain dishes. Eight to 14 dishes were used in the measurement of total solid and
total volatile solid depending on the total solid content within the acidogenic reactor.
2. Each sample size was dependent on the volume capacity of the dish.
3. The samples were placed in the 103°C oven for at least one day.
4. Only one cycle of drying, cooling, desiccating and weighing was done.
Cat. No. 3-3121, Supelco, Inc., Bellefonte, PA 16823-0048. Microliter series 700, Model #701-L, Stock #80300, Hamilton Company, Reno, NE 89520.
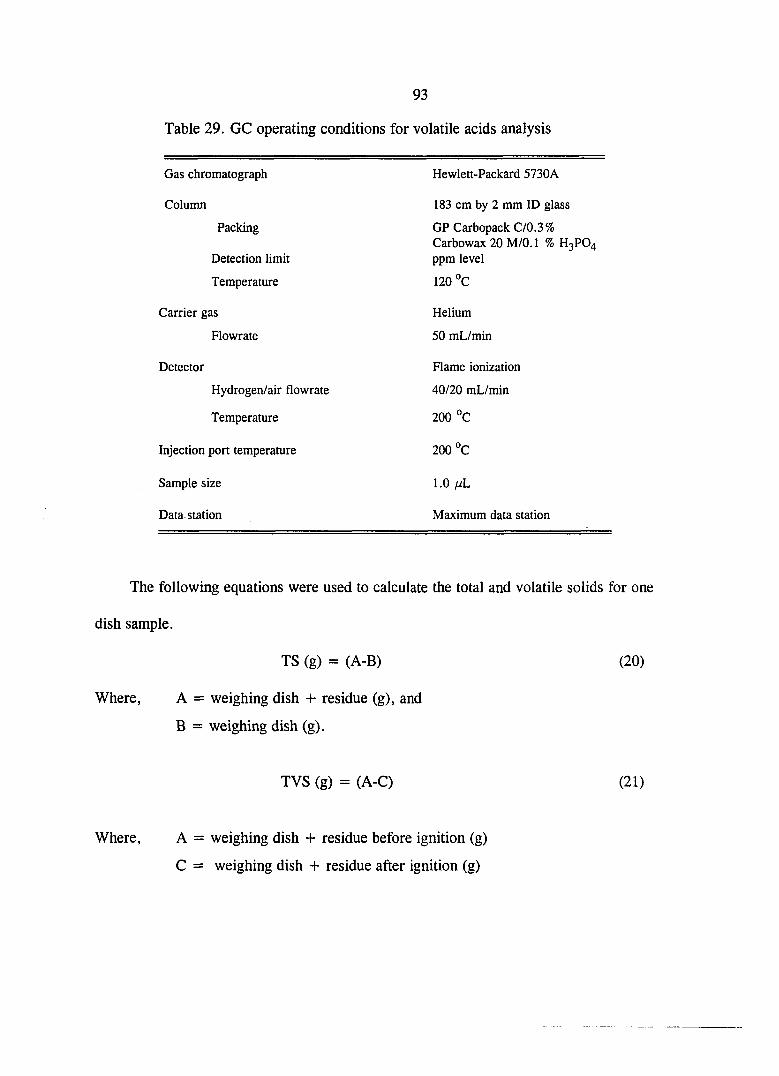
93
Table 29. GC operating conditions for volatile acids analysis
Gas chromatograph
Column
Packing
Detection limit
Temperature
Carrier gas
Flowrate
Detector
Hydrogen/air flowrate
Temperature
Injection port temperature
Sample size
Data, station
Hewlett-Packard 5730A
183 cm by 2 mm ID glass
GP Carbopack C/0.3% Carbowax 20 M/0.1 % H3PO4 ppm level
120 °C
Helium
50 mL/min
Flame ionization
40/20 mL/min
200 °C
200 °C
1.0 fjL
Maximum data station
The following equations were used to calculate the total and volatile solids for
dish sample.
TS (g) = (A-B) C
Where, A = weighing dish + residue (g), and
B = weighing dish (g).
TVS (g) = (A-C) 0
Where, A = weighing dish + residue before ignition (g)
C = weighing dish + residue after ignition (g)
A summation of each sample's result, TS and TVS of digested solid waste was then
obtained. This information would be used to calculate destruction of TS and TVS for each
run. The other measurement of TS and TVS for the digester sludge used as reseeding
biomass and synthetic substrate followed the procedure given in part 209F of Standard
Methods.
Total suspended solids and total volatile suspended solids The determination of
total suspended solids (TSS) and total volatile suspended solids (TVSS) in the
holding/recycling tank, effluent from solid bed, and drained sludge from digested solid
waste were performed according to the procedure given in the part 209C of Standard
Methods with the following exceptions:
1. The filter papers were not washed prior to use.
2. The sample size was 10 mL.
3. Only one cycle of drying, cooling, desiccating, and weighing was done.
The filtration apparatus used was equal to that used for COD samples. After
filtering, the 9 cm GFA glass filter papers were placed in disposable aluminum weighing
dishes for drying and weighing. Each sample was run in duplicate and the value averaged.
The following equation was used to calculate the total and volatile suspended solids.
TSS (mg/L) = (A-B)(100mg/gm)aOMmL/L) Sample volume (mL)

Where,
95
A = weight of filter paper + weighing dish + residue (gm), and
B = weight of filter paper + weighing dish (gm).
TVSS (mg/L) = (A -Q (100 mg/gm) (1000 mL/L) Sample volume (mL)
Where, A = weight of filter + weighing dish + residue before ignition (gm), and
B = weight of filter + weighing dish + residue after ignition (gm).
Total Organic Carbon
Total organic carbon (TOC) can be measured by oxidizing (burning) the organic
carbon within a solid or liquid sample to carbon dioxide, which is measured by means of a
nondispersive type of infrared analyzer. The total carbon content for each component of
synthetic solid waste was obtained using Dohrmaim DC 180 TOC Analyzer. Potassium
Hydrogen Phthalate (KHP) was used as a standard stock solution. The total carbon
analyzer equipped with a 183 Boat Sampling Module which is used for the fast and
accurate measurement of TOC in a wide range of sample matrices including water,
wastewater, slurries, and solids. The procedure for measuring TOC is outlined in part
505A of the Standard Methods. The result was directly shown from the pannel reading
expressed as the unit of ppm.
Total Kjeldahl Nitrogen
Determination of total Kjeldahl nitrogen (TKN) includes inorganic nitrogen and
organic nitrogen. Since the moisture content of the synthetic solid waste is generally lower
96
than 10%, organic nirtogen comprises most of the TKN. Before the final ammonia could
be measured, organic nitrogen needed to be released into liquid through a digestion
procedure in the inorganic form. The TKN test was executed before the start-up of the
system, following the procedure outlined in the part 420A & 417D of Standard Methods.
The following equation was used to calculate the TKN of a smple.
A x B X C NH3-N, mg/dry wt. of smple = -pr :-r—^— (24)
^ ^ Dry weight of sample
where, A = dilution factor,
B = concentration of NH3-N/L, mg/L, from calibration curve,
C = volume of sample (mL), and
D = volume of added 10 N NaOH in excess of 1 mL (mL).
Metals (Zn. Ni. Mg. Ca. Fe. Mn. Co. Mo. Na. K')
All metals were measured using a Perkin-Elmer Atomic Absorption
Spectrophotometry System^^ with a flame emission (AE) method (303, Standard Methods).
All metals were determined by the Analytical Services Laboratory at Iowa State
University.
Model 305B, Perkin-Elmer Corporation, Norwalk, CT 06856.

97
Gas Production and Analysis
Gas production in each reactor was measured using wet-tip gas meter. Gas was
analyzed for methane and carbon dioxide content using a gas chromatograph with a
thermalconductivity detector. Gas samples were taken from a sampling port located
between the reactor and gas meter using a 1 mL gas-lock syringe^®. The gas sample in the
syringe was analyzed immediately. Table 30 shows the operating conditions of the gas
chromatograph for gas analysis.
The standard gas used for calibration contained 70% methane, 25% CO2, and 5% N2.
The standard gases are accurate to within 0.5%. Peak area was used for calculating the
response factor. Peak identification and integration were done with a Maxima Console
Data Station.
pH
Measurement of pH depended on a pH controller and a pH meter^^ with a standard
glass membrane-type probe The pH meter was used to measure the samples from the
holding/recycling tank and effluent form the solid bed, whenever it might be necessary.
The pH controller, as mentioned previously, was continuously monitoring the pH value in
the holding/recycling tank for the first phase of the study. The pH probe connected with
the pH controller were washed with distilled water and calibrated with buffers of 7.00 and
22 gauge side-bore needle, Alltech, Inc., Deerfield, IL.
Altex pH meter. Model 4500, Digital. Cat. No. H788, Markson Corporation.
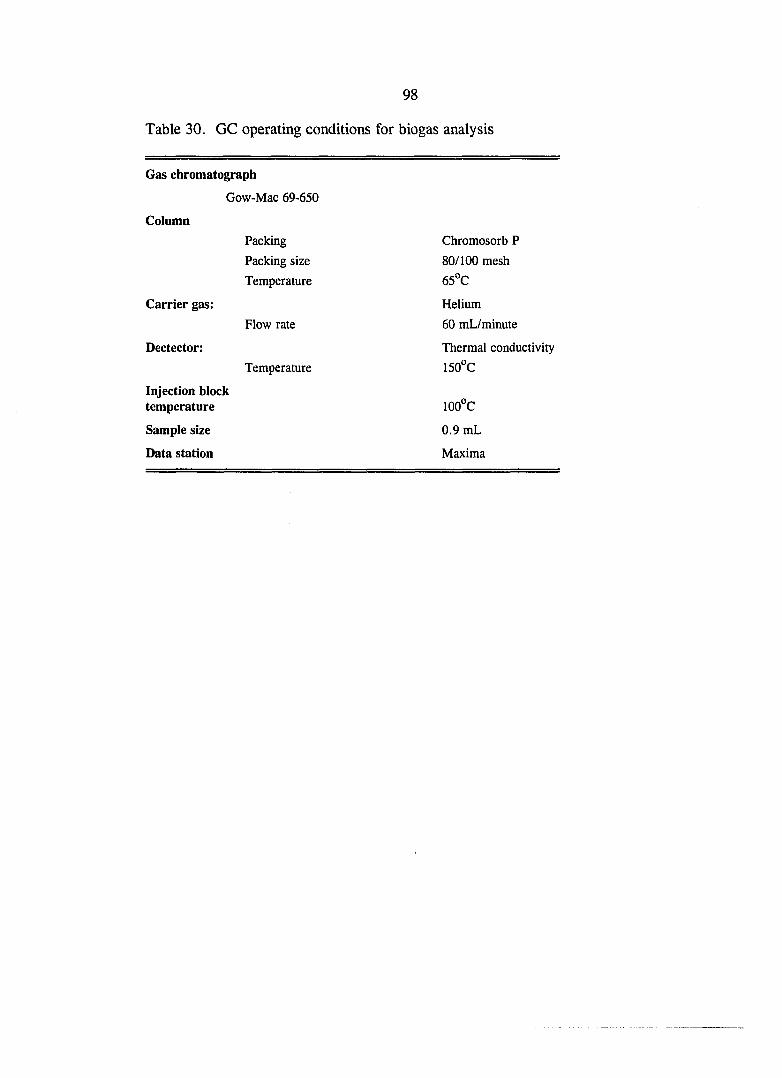
98
Table 30. GC operating conditions for biogas analysis
Gas chromatograph
Gow-Mac 69-650
Column
Packing
Packing size
Temperature
Carrier gas:
Flow rate
Dectector:
Temperature
Injection block temperature
Sample size
Data station
Chromosorb P
80/100 mesh
65°C
Helium
60 mL/minute
Thermal conductivity
150°C
100°C
0.9 mL
Maxima
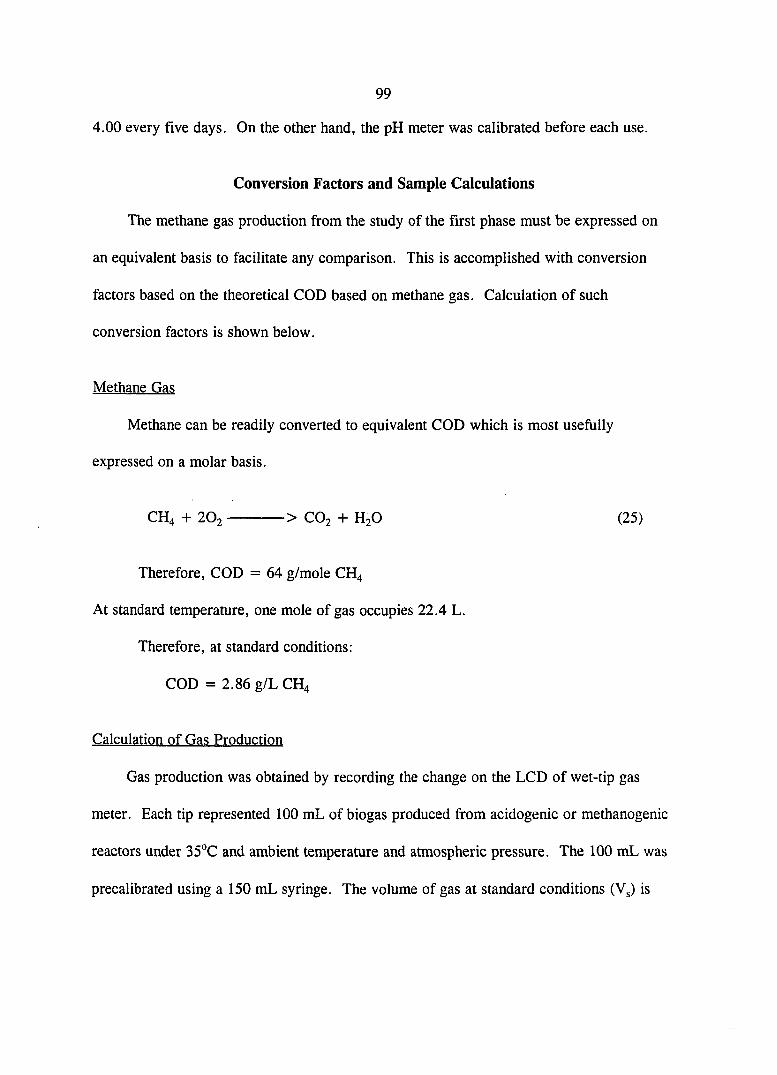
99
4.00 every five days. On the other hand, the pH meter was calibrated before each use.
Conversion Factors and Sample Calculations
The methane gas production from the study of the first phase must be expressed on
an equivalent basis to facilitate any comparison. This is accomplished with conversion
factors based on the theoretical COD based on methane gas. Calculation of such
conversion factors is shown below.
Methane Gas
Methane can be readily converted to equivalent COD which is most usefully
expressed on a molar basis.
CH4 + 20, > CO2 + H2O (25)
Therefore, COD = 64 g/mole CH4
At standard temperature, one mole of gas occupies 22.4 L.
Therefore, at standard conditions:
COD = 2.86 g/L CH4
Calculation of Gas Production
Gas production was obtained by recording the change on the LCD of wet-tip gas
meter. Each tip represented 100 mL of biogas produced from acidogenic or methanogenic
reactors under 35°C and ambient temperature and atmospheric pressure. The 100 mL was
precalibrated using a 150 mL syringe. The volume of gas at standard conditions (V^) is
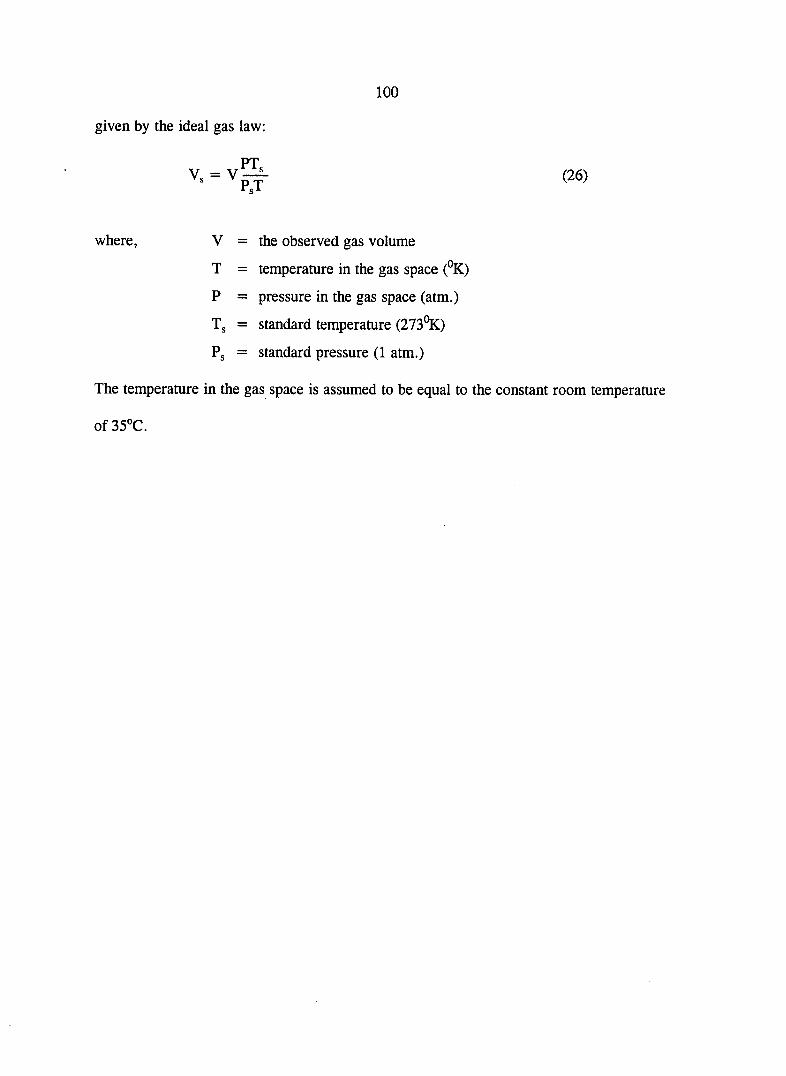
100
given by the ideal gas law:
PT Vs = (26)
PsT
where, V = the observed gas volume
T = temperature in the gas space (°K)
P = pressure in the gas space (atm.)
Tj = standard temperature (273°K)
Ps = standard pressure (1 atm.)
The temperature in the gas space is assumed to be equal to the constant room temperature
of35°C.

101
IV. RESULTS AND DISCUSSION
The complete experimental set-up includes a combination of the acidogenic batch
reactor system and the methanogenic filter. The substrate was introduced to the combined
system by routinely alternating batches fed to the acidogenic reactor. The effluent of the
acidogenic reactor was fed into the methanogenic reactor through the holding/recycling
tank. The experunental study was conducted by altering key operating conditions such as
TS load, number of batch reactors in series, biomass seed ratio (BSR), effluent recycle
rate, and solid waste retention time (SWRT) of the acidogenic reactor. The same operating
conditions were maintained on the methanogenic filter throughout the study. The optimum
operating conditions, in terms of the highest TS and TVS destruction and the greatest
methane production, were determined.
The experiments were performed in two phases. The first phase focused primarily on
methane production under different TS loading and SWRT. For the first phase study, the
data describe methane production, destruction of TS and TVS, COD profile, pH profile,
and individual VFA under the operating controls of TS load, HRT of acidogenic reactors,
SWRT, and the amount of dilution water. Four studies with different operating conditions
were: 1) A single batch acidogenic reactor (SBAR) with a SWRT of 25 days at three TS
contents of 10, 15 and 20% . The running time for the SBAR system was 25 days for each
TS load, 2) A study on the SBAR system with a SWRT of 10 days at two TS contents of
10 and 15 %. The running time of the SBAR system was 40 days for each TS load. The
batch feed was alternated every 10 days, 3) A study on a continuously operated double
102
batch acidogenic reactors (DEAR) system with TS content of 10% at two SWRTs of 10
and 14 days, 4) A study on a continuously operated DBAR system with a TS content of
15% at a SWRT of 10 days.
The goal of the second phase was to determine the effect of pH on hydrolysis and
acidogenesis of solid wastes. For the second phase study, TS content of 10% and a 10-day
SWRT was used for studying the effect of pH on hydrolysis and acidogenesis. Two
acidogenic reactors were run in series at three different pHs (6.4, 6.0, and 5.6) were
controlled in the holding/recycling tank. The results focus mainly on methane production,
soluble COD, and individual VFA in the VFA storage tank. In this study, methane was
converted into theoretical COD so that the performance at the different pH levels and
phases are easily compared. To understand the biodegradability of solid waste, the
ultimate methane production is illustrated in the following section.
Ultimate Methane Production for the Prepared MSW
The experimental set-up and procedure to study the ultimate methane production were
described in Chapter II. The average ultimate gas production per unit dry weight (UMGP)
of solid waste provides a baseline for understanding the system performance under
different operating conditions. Figure 24 illustrates the maximum cumulative methane
production at STP conditions for four samples. This figure represents the methane
production from the solid waste used in these experiments.

103
450
400
ra 350
C/5 300
^ 250 _
u (U 200 >
3 s 3
O
150
100
50
-yr— V • V •
--- Bottle No. 1 --- Bottle No. 1 M -i— Bottle No. 2 M -i— -®- Bottle No. 3
/i / p
Bottle No. 4 /i / p
rr '7 ^7/
-
f 1
jJl
/
5 10 15 20 25 30 35 40 45 50 55 59
Days since started
Figure 24. Cumulative methane production for the ultimate methane study

104
The methane production between days 4 and 12 are straight lines. In addition, the methane
production approaches zero after the 38th day. The pH measured at the end of the study
was approximately 7.3 for all four samples, indicating that the overall process was not
inhibited by pH.
To accurately calculate the UMGP, the methane gas which stayed in the head space
and gas produced from the blank controls needs to be considered. The ultimate methane
production per unit weight of dry solid waste can be obtained by the following formula:
average methane production from solid waste + average volume of methane in the head
space - average methane production from blank controls. Table 31 summarizes the total
methane production for the four bottles. Calculation of the average ultimate gas production
per unit weight of TS, yields an average of 0.251 m^ CH4/kg TS or 4.02 ft^/lb TS.
Results for the SBAR System at an Operating Period of 25 days
This study was conducted using one acidogenic reactor loaded with three TS
concentrations (10, 15, and 20%). The operating period was 25 days for each different TS
concentration. The study with 10% TS was first carried out and followed by 15 and 20%
TS. The purposes of this study were to get information on the length of time required to
stabilize the solid waste and to determine operating problems. Also, the results will be
used to compare with more mature systems. For a TS content of 20%, the fresh solid
waste was hard pressed to get completely transferred into the acidogenic reactor. Several
times the system failed at the beginning of the study due to the clogging problems, which
were discussed in Chapter II. The problems were solved by installing a special design.
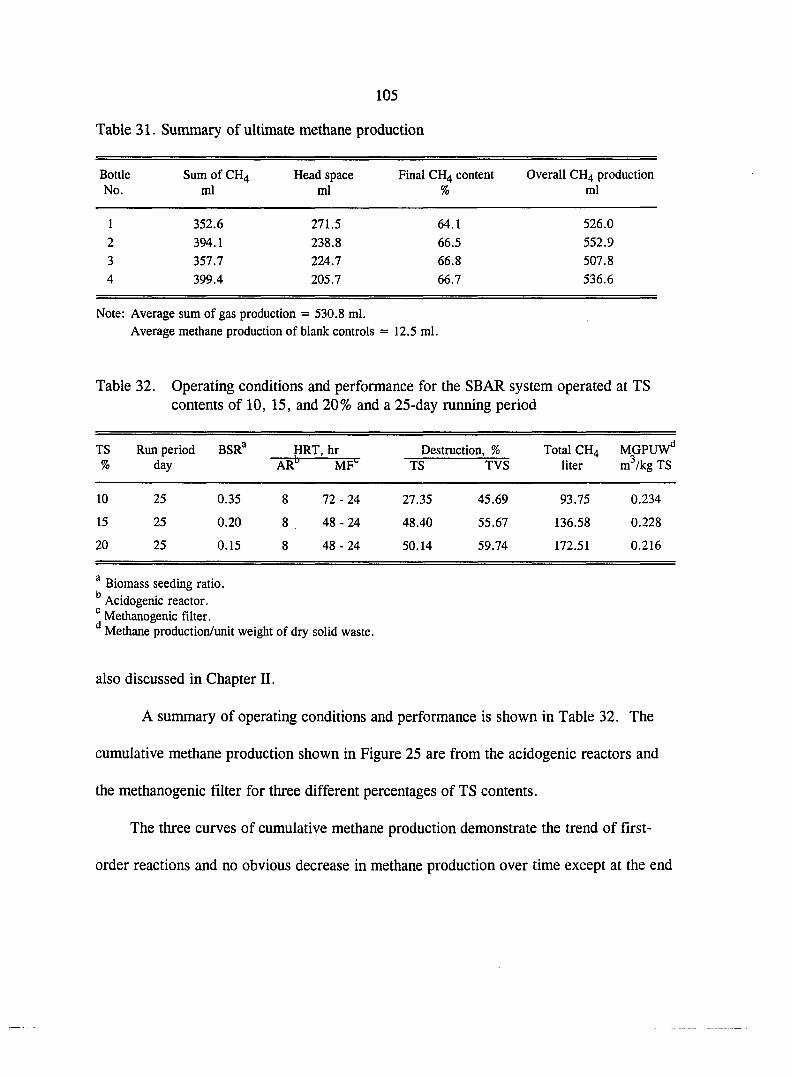
105
Table 31. Summary of ultimate methane production
Bottle Sum of CH4 Head space Final CH4 content Overall CH4 production No. ml ml % ml
1 352.6 271.5 64.1 526.0
2 394.1 238.8 66.5 552.9
3 357.7 224.7 66.8 507.8
4 399.4 205.7 66.7 536.6
Note: Average sum of gas production = 530.8 ml.
Average methane production of blank controls = 12.5 ml.
Table 32. Operating conditions and performance for the SBAR system operated at TS contents of 10, 15, and 20% and a 25-day running period
TS Run period BSR® HRT, hr Destruction, % Total CH4 MGPUW'' % day AR^ MF" TS TVS liter m^/kg TS
10 25 0.35 8 72 - 24 27.35 45.69 93.75 0.234
15 25 0.20 8 , 48-24 48.40 55.67 136.58 0.228
20 25 0.15 00
00
50.14 59.74 172.51 0.216
® Biomass seeding ratio.
'' Acidogenic reactor. Methanogenic filter. Methane production/unit weight of dry solid waste.
also discussed in Chapter II.
A summary of operating conditions and performance is shown in Table 32. The
cumulative methane production shown in Figure 25 are from the acidogenic reactors and
the methanogenic filter for three different percentages of TS contents.
The three curves of cumulative methane production demonstrate the trend of first-
order reactions and no obvious decrease in methane production over time except at the end
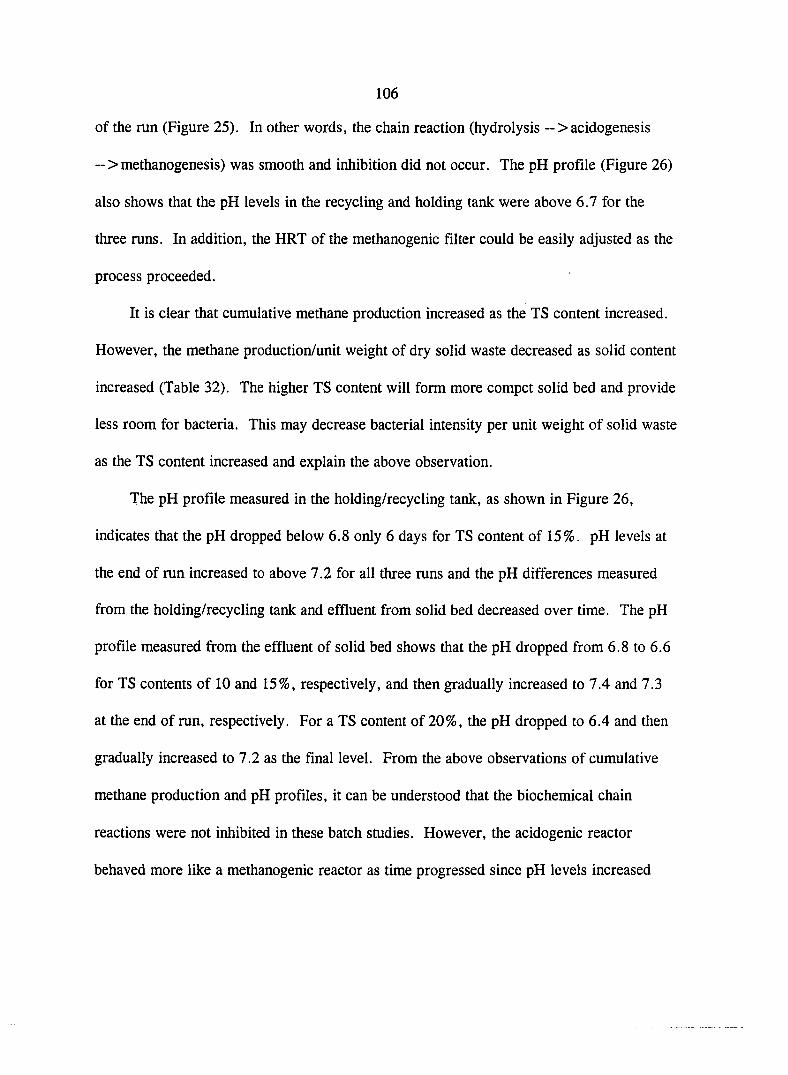
106
of the run (Figure 25). In other words, the chain reaction (hydrolysis ~ > acidogenesis
~ > methanogenesis) was smooth and inhibition did not occur. The pH profile (Figure 26)
also shows that the pH levels in the recycling and holding tank were above 6.7 for the
three runs. In addition, the HRT of the methanogenic filter could be easily adjusted as the
process proceeded.
It is clear that cumulative methane production increased as the TS content increased.
However, the methane production/unit weight of dry solid waste decreased as solid content
increased (Table 32). The higher TS content will form more compct solid bed and provide
less room for bacteria. This may decrease bacterial intensity per unit weight of solid waste
as the TS content increased and explain the above observation.
The pH profile measured in the holding/recycling tank, as shown in Figure 26,
indicates that the pH dropped below 6.8 only 6 days for TS content of 15%. pH levels at
the end of run increased to above 7.2 for all three runs and the pH differences measured
from the holding/recycling tank and effluent from solid bed decreased over time. The pH
profile measured from the effluent of solid bed shows that the pH dropped from 6.8 to 6.6
for TS contents of 10 and 15%, respectively, and then gradually increased to 7.4 and 7.3
at the end of run, respectively. For a TS content of 20%, the pH dropped to 6.4 and then
gradually increased to 7.2 as the final level. From the above observations of cumulative
methane production and pH profiles, it can be understood that the biochemical chain
reactions were not inhibited in these batch studies. However, the acidogenic reactor
behaved more like a methanogenic reactor as time progressed since pH levels increased
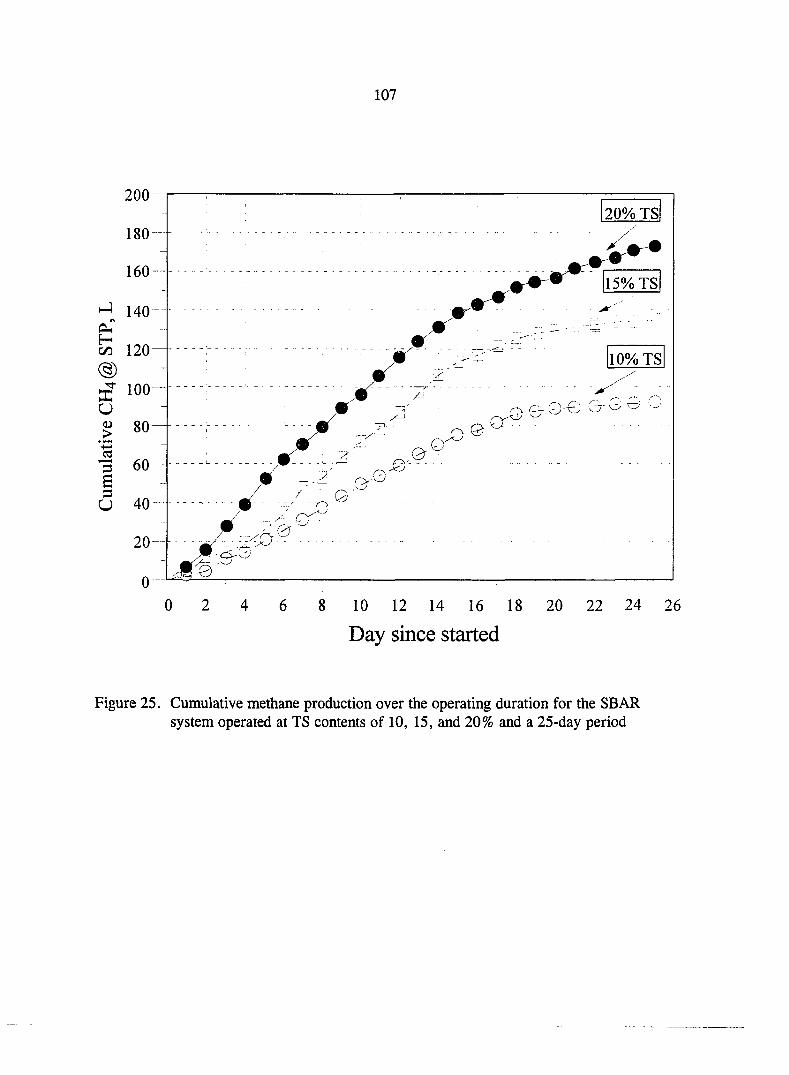
107
200-
180
160
^ 140 T\ (2H
120
X u
>
03 3 60-S U 40-
20-
0
20% TS
15% TS
®r ,lL
10% TS
0-
- / J*;
/• -O-
^0
-o-o
0 2 4 6 8 10 12 14 16 18
Day since started
20 22 24 26
Figure 25. Cumulative methane production over the operating duration for the SBAR system operated at TS contents of 10, 15, and 20% and a 25-day period
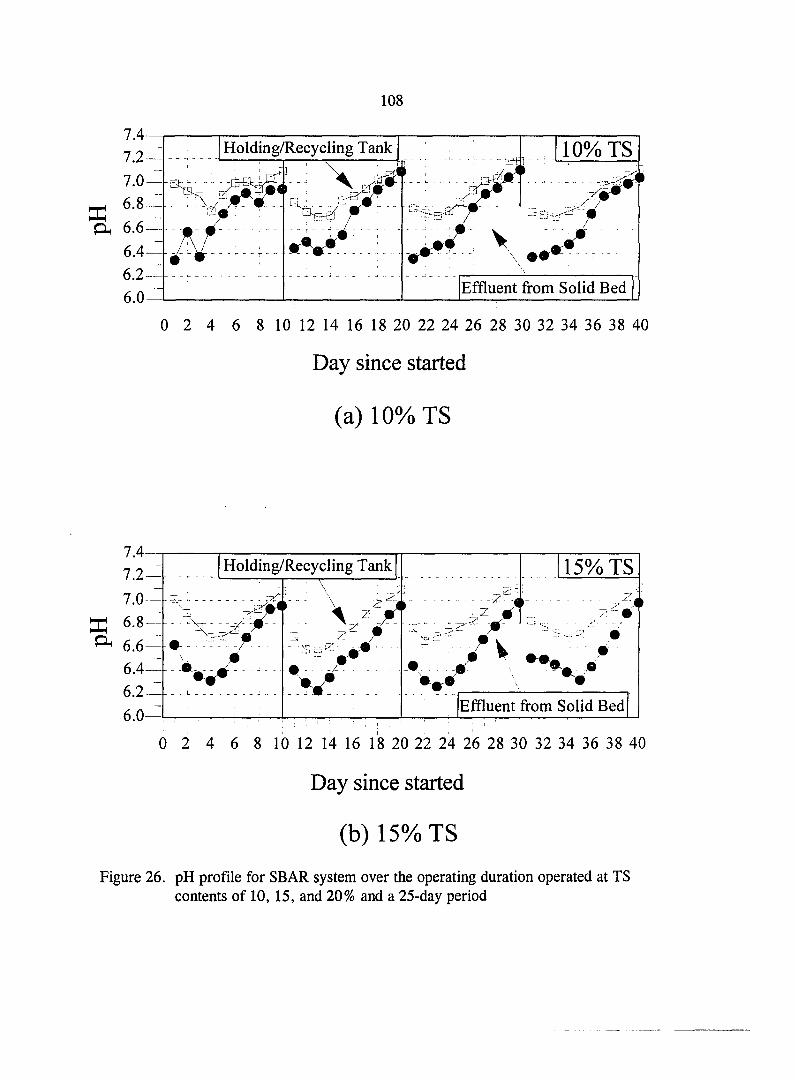
108
7.4-
1 2 -
7.0-
Oh 6.6-
6.4—
6 .2 -
6.0-
Holding/Recycling Tank
-3^n
r a,;
<
Swf .ar-'
• ••:— &f 1
>•
10% TS
\ - -
Effluent from Solid Bed
0 2 4 6 8 10 12 14 16 18 20 22 24 26 28 30 32 34 36 38 40
Day since started
(a) 10% TS
7_4__^ I——1 -72^ Holding/Recycling Tank 115% TS
- \ ,2^
^ 6.6 - ^ V - ; .- - -
6.4-- W t '/ \ X -V.» 6 . 2 - - - - . V * r i ? , , „ - Effluent from Solid Bed 6.0—L 1 i '—• . : ' : , : ^
0 2 4 6 8 10 12 14 16 18 20 22 24 26 28 30 32 34 36 38 40
Day since started
(b) 15% TS
Holding/Recycling Tank
\
: V/ -7 ' Z
/v
15% TS
v.®
Effluent from Solid Bed
Figure 26. pH profile for SBAR system over the operating duration operated at IS contents of 10, 15, and 20% and a 25-day period
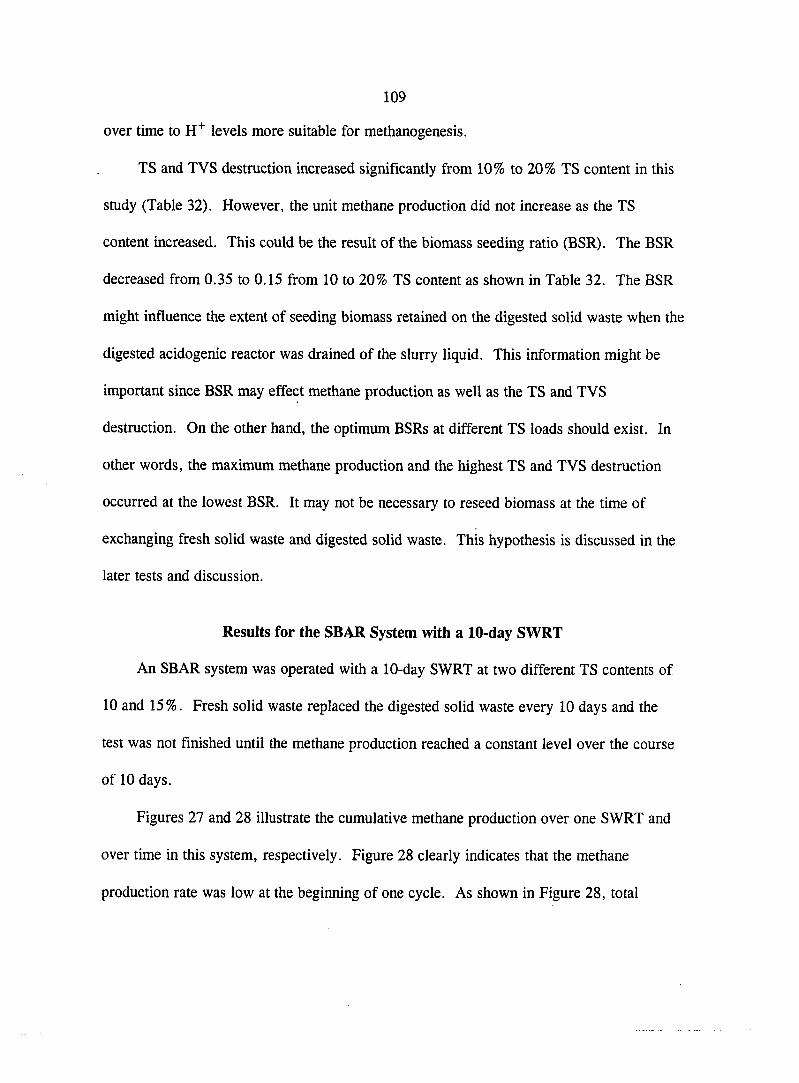
109
over time to H"*" levels more suitable for methanogenesis.
TS and TVS destruction increased significantly from 10% to 20% TS content in this
study (Table 32). However, the unit methane production did not increase as the TS
content increased. This could be the result of the biomass seeding ratio (BSR). The BSR
decreased from 0.35 to 0.15 from 10 to 20% TS content as shown in Table 32. The BSR
might influence the extent of seeding biomass retained on the digested solid waste when the
digested acidogenic reactor was drained of the slurry liquid. This information might be
important since BSR may effect methane production as well as the TS and TVS
destruction. On the other hand, the optimum BSRs at different TS loads should exist. In
other words, the maximum methane production and the highest TS and TVS destruction
occurred at the lowest BSR. It may not be necessary to reseed biomass at the time of
exchanging fresh solid waste and digested solid waste. This hypothesis is discussed in the
later tests and discussion.
Results for the SBAR System with a 10-day SWRT
An SBAR system was operated with a 10-day SWRT at two different TS contents of
10 and 15%. Fresh solid waste replaced the digested solid waste every 10 days and the
test was not finished until the methane production reached a constant level over the course
of 10 days.
Figures 27 and 28 illustrate the cumulative methane production over one SWRT and
over time in this system, respectively. Figure 28 clearly indicates that the methane
production rate was low at the beginning of one cycle. As shown in Figure 28, total
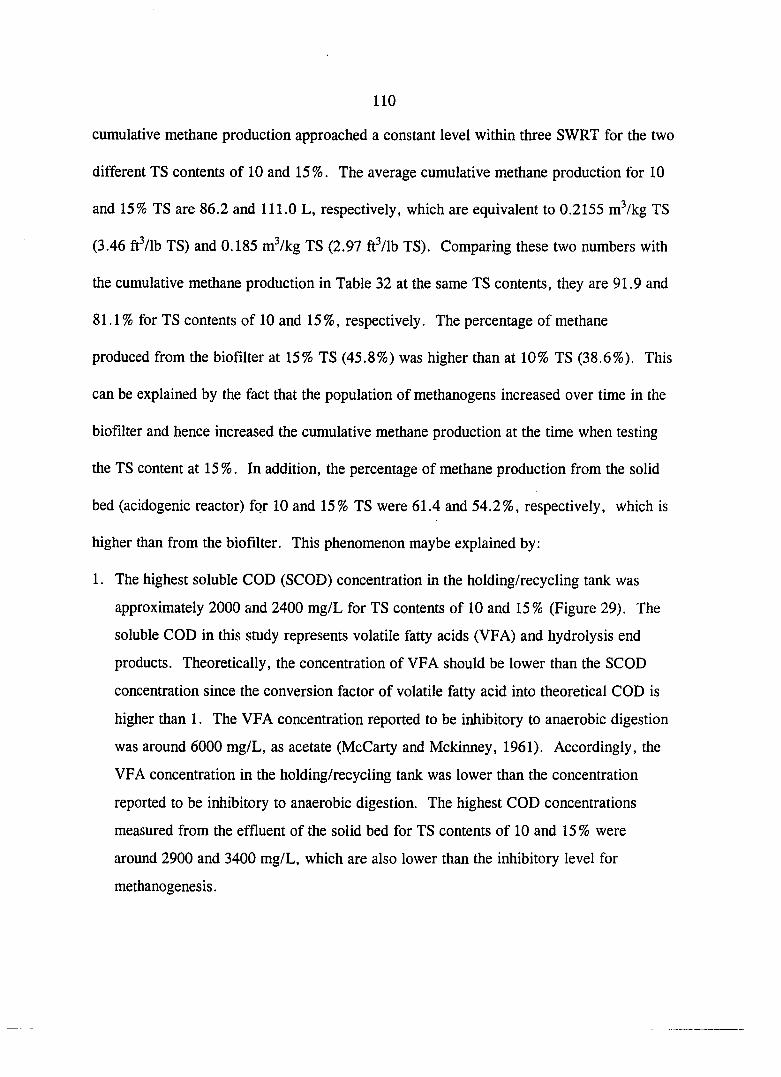
110
cumulative methane production approached a constant level within three SWRT for the two
different TS contents of 10 and 15%. The average cumulative methane production for 10
and 15% TS are 86.2 and 111.0 L, respectively, which are equivalent to 0.2155 m^/kg TS
(3.46 ft^/lb TS) and 0.185 m^/kg TS (2.97 ft^/lb TS). Comparing these two numbers with
die cumulative methane production in Table 32 at the same TS contents, they are 91.9 and
81.1% for TS contents of 10 and 15%, respectively. The percentage of methane
produced from the biofilter at 15% TS (45.8%) was higher than at 10% TS (38.6%). This
can be explained by the fact that the population of methanogens increased over time in the
biofilter and hence increased the cumulative methane production at the time when testing
the TS content at 15%. In addition, the percentage of methane production from the solid
bed (acidogenic reactor) for 10 and 15% TS were 61.4 and 54.2%, respectively, which is
higher than from the biofilter. This phenomenon maybe explained by;
1. The highest soluble COD (SCOD) concentration in the holding/recycling tank was
approximately 2000 and 2400 mg/L for TS contents of 10 and 15% (Figure 29). The
soluble COD in this study represents volatile fatty acids (VFA) and hydrolysis end
products. Theoretically, the concentration of VFA should be lower than the SCOD
concentration since the conversion factor of volatile fatty acid into theoretical COD is
higher than 1. The VFA concentration reported to be inhibitory to anaerobic digestion
was around 6000 mg/L, as acetate (McCarty and Mckinney, 1961). Accordingly, the
VFA concentration in the holding/recycling tank was lower than the concentration
reported to be inhibitory to anaerobic digestion. The highest COD concentrations
measured from the effluent of the solid bed for TS contents of 10 and 15% were
around 2900 and 3400 mg/L, which are also lower than the inhibitory level for
methanogenesis.

I l l
100 10 % TS Solid Bed + Biofilter
80 —
Solid Bed
U 60 —
CJ 40 — u > 3 0 —
20 — Biofilter
5 10-
0 2 4 6 8 10 12 14 16 18 20 22 24 26 28 30 32 34 36 38 40
Day since started
(a) 10% TS
15 % TS Solid Bed + Biofilter
t/3 i->
O
U u _>
3 S 3 o
Solid Bed
/
K c/i'
/:
.9 / •
Biofilter
/ • X f • / - '•
I -M- ' ;
r/
f -• d
"xS' / :
/ :A
. / • /
130
120
110
"i 100 •H
5^ 90
80
70 -
60
50
40-
30
2 0 -
10
0
0 2 4 6 8 10 12 14 16 18 20 22 24 26 28 30 32 34 36 38 40
Day since started
(b) 15% TS
Figure 27. Cumulative methane production over SWRT for the SBAR system operated at TS contents of 10%(a) and 15%(b) and a 10-day SWRT
' '/ • • 23
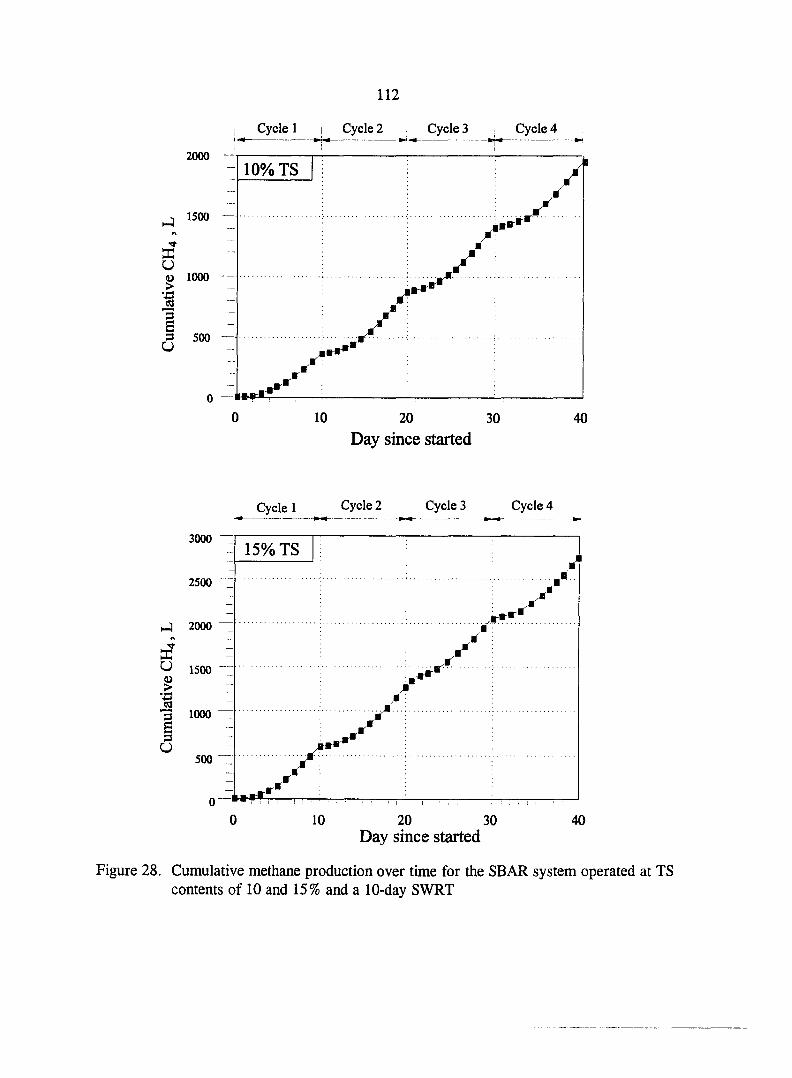
112
Cycle 1 Cycle 2 i Cycle 3 Cycle 4
2000
1500
10% TS
u 4) 1000
B 3 500
/
0 —
0 10 20 30
Day since started
40
Cycle 1 Cycle 2 Cycle 3 Cycle 4
3000
2500
15% TS
hJ 2000
^ 1500
cQ 3 1000
500
/
:/• »r"
10 20 30 Day since started
40
Figure 28. Cumulative methane production over time for the SBAR system operated at TS contents of 10 and 15% and a 10-day SWRT

113
2. pH profiles for TS contents of 10 and 15% (Figure 30) show that the lowest pH level
measured from the effluent of the solid bed for 10 and 15% TS were 6.36 and
6.25, respectively. These pH levels are not optimum for methanogenesis. However,
pH levels increased to above 6.5 at day 6 during one-cycle run for both control
conditions.
Based on these observations, the environmental conditions for methanogenesis were
not too adverse in the solid bed. Here, the holding/recycling tank may also play an
important role for diluting the soluble COD concentrations coming out of the solid bed and
hence provide a necessary time period for methanogenic biofilter to build up methanogens.
Figure 31, gas composition profile, shows that the methane composition in the
holding/recycling tank was in excess of 60% for the two different TS contents. The
methane composition from the solid bed, however, were much different over time. The
methane content increased smoothly from about 30% for both TS contents at the beginning
of one cycle to about 60% (10% TS) and 55% (15% TS) at the end of the cycle. This
observation suggests that the acidogenic reactors act more like a methanogenic digester as
run time progressed within a SWRT period. The pH profile (Figure 28) also supports this
comment. The pH increased above 7.0 in the effluent of the solid bed at the end of one
cycle for both operating conditions. When this condition occurred, the acidogenic reactor
can be regarded as a single anaerobic digester.
Table 33, summary of the operating conditions and performance, indicates that
methane production did not decrease as the biomass seeding ratios decreased from 0.25 to
0.15 for both TS contents of 10 and 15%. In other words, the biochemical reation rates
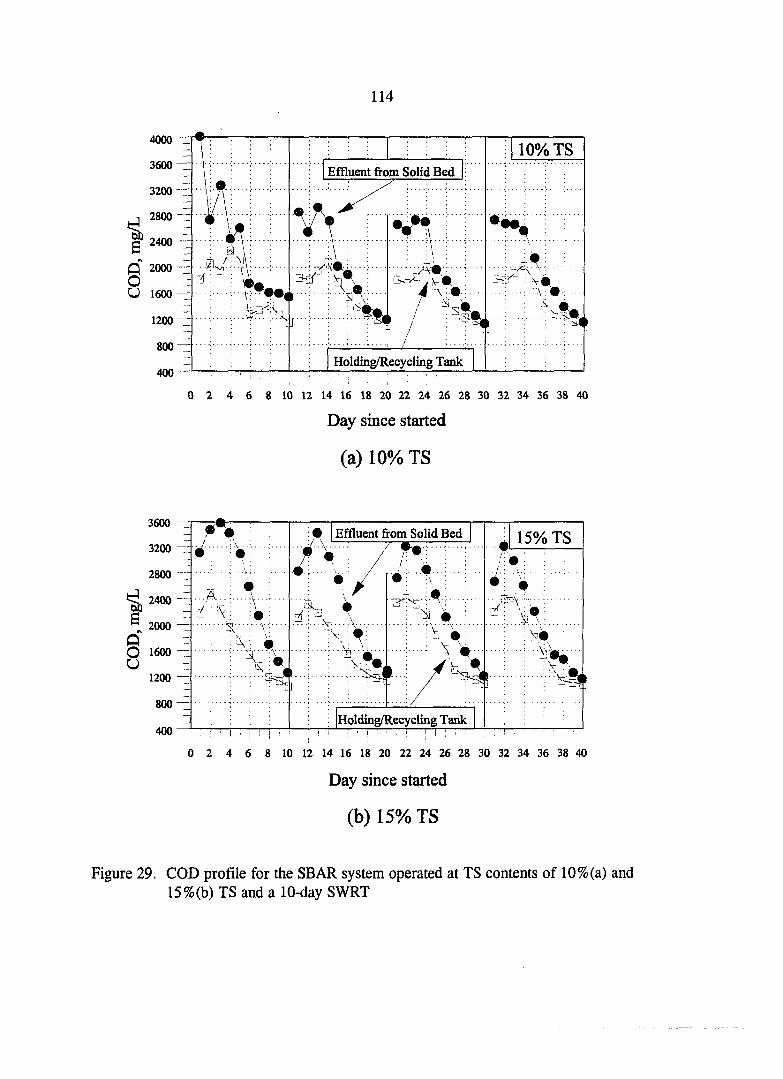
114
4000
3600
3200
2800
2400 •i!
Q 2000 -o U 1600
1200
800
400
..ia. is'
Effluent from Solid Bed
•-7-V< ,
/
Holding/Recycling Tank
10% TS
V« \ : - <
0 2 4 6 8 10 12 14 16 18 20 22 24 26 28 30 32 34 36 38 40
Day since started
(a) 10% TS
3600 —I ^^^ [—1 T - " • :• Effluent from Solid Bed 1 TS
3200 : / f g.-:-''' V''':' :
2800 -r - i • ; • / i .
2 4 0 0 - - . . . . A . . v . . : ^ \
^ v-»: 2000 — A;-: , V •. ,... .:y ,
o 1 6 0 0 " • • • ; - ^ u r ; ; ; : ;v:V : ; ; ;v\
800-^ • ••: :•••:••••; . l - - / r
I ; ; ; ; : : Holding/Recycling Tank 400 : : ; I : I I j ' 1 ; ' i - I i ! , I i I I : I ! -T- . • . • '
0 2 4 6 8 10 12 14 16 18 20 22 24 26 28 30 32 34 36 38 40
Day since started
( b ) 1 5 % T S
Figure 29. COD profile for the SBAR system operated at TS contents of 10% (a) and 15%(b) TS and a 10-day SWRT
. . . n . .
Effluent from Solid Bed /-\. ...: / 15% TS
• '2: - v . , . . A - .
V ;
:vV.
"5. • : V
V h^J V'
Holding/Recycling Tank
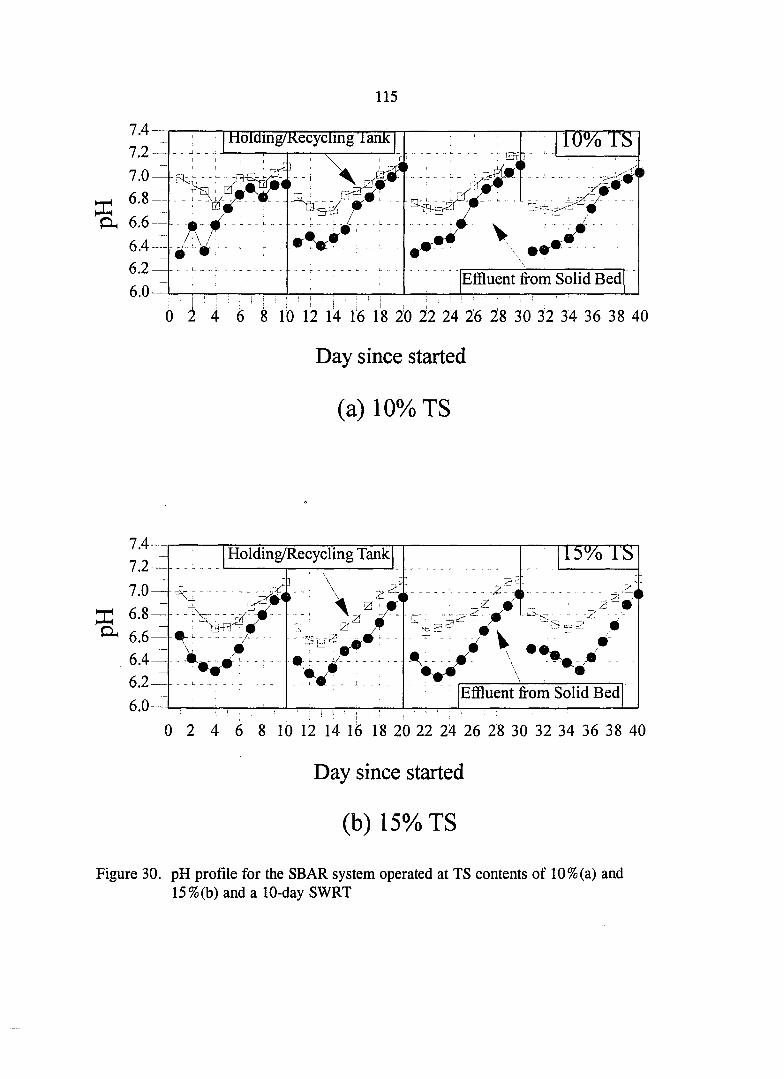
115
7.4
7.2
7.0 —
6.8 X Oh 6.6
6.4-
6.2 6.0-
: Jtloidmg/Kecyclmg lank ^ ....
• - - - - -
10% TS
-0-9 •
^ ....
• - - - - -
Effluent from Solid Bed
0 2 4 6 8 lb 12 14 1'6 18 20 22 24 26 IS 30 32 34 36 38 40
Day since started
(a) 10% TS
7.4—
7 .2^
7.0—
^ 6.6—
6.4-^
6.2—
6.0—
0 2 4 6 8 10 12 14 16 18 20 22 24 26 28 30 32 34 36 38 40
Day since started
(b) 15% TS
Figure 30. pH profile for the SBAR system operated at TS contents of 10%(a) and 15%(b) and a 10-day SWRT
Holding/Recycling Tank li5%'l'S
...
J -
. Z J
... - o z.'P*r - "'= . ' ' J t -
- 4 V »-•
Effluent from Solid Bed
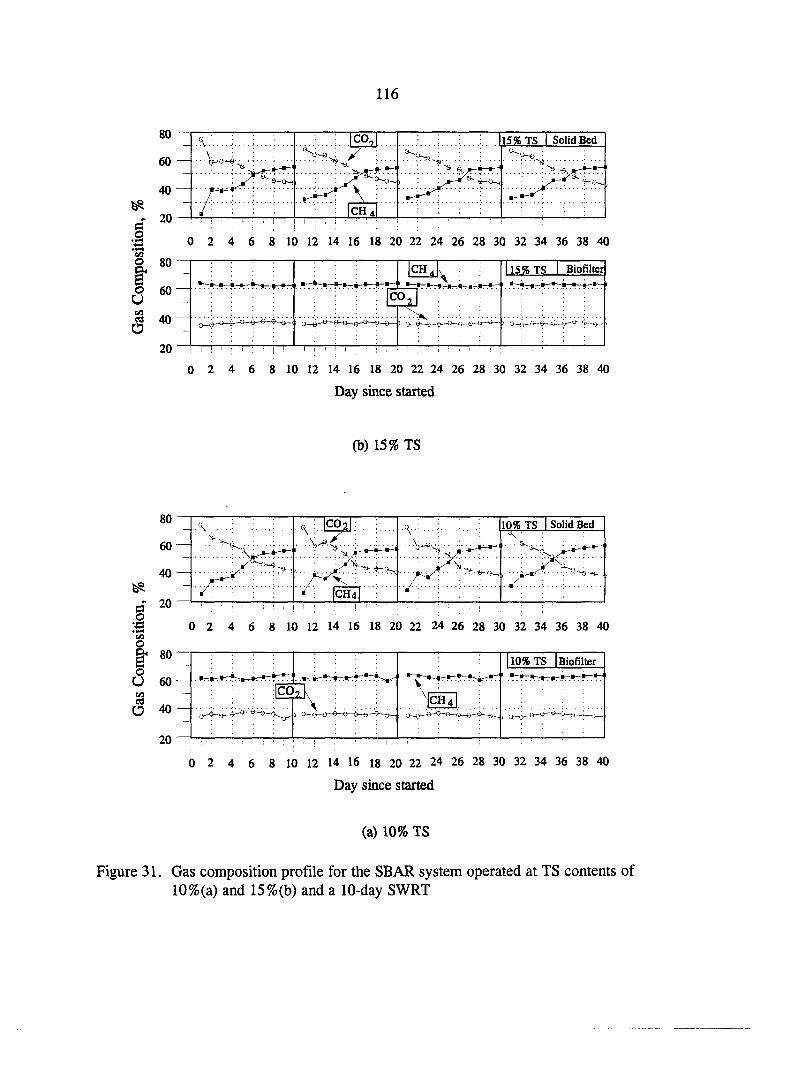
116
i
B o U
a
15% TS Solid Bed
0 2 4 6 8 10 12 14 16 18 20 22 24 26 28 30 32 34 36 38 40
O 80
60
c/i rt 40
20
• — B -
CH, \
CO,
• "V
15% TS I Biofilter
0 2 4 6 8 10 12 14 16 18 20 22 24 26 28 30 32 34 36 38 40
Day since started
(b) 15% TS
80
60
40
fl 20 o S
CA
a o U cfl cd O
A. : |C02|: 10% TS I Solid Bed
0 2 4 6 8 10 12 14 16 18 20 22 24 26 28 30 32 34 36 38 40
0 2 4 6 8 10 12 14 16 18 20 22 24 26 28 30 32 34 36 38 40
Day since started
(a) 10% TS
Figure 31. Gas composition profile for the SBAR system operated at TS contents of 10%(a) and 15%(b) and a 10-day SWRT

117
did not decrease as with the decrease in seeding biomass. The TS and TVS destruction, on
the contrary, increased from about 40 and 50 to 49 and 58%, respectively. This finding
brought up an important manifestation that the biomass seeding ratio really affects the
overall performance (methane production and destruction of TS and TVS). Therefore,
control of the BSR in later studies became necessary and important.
Table 33. Operating conditions and performance for the SBAR system operated at TS contents of 10 and 15% and a 10-day SWRT
TS No. of SWRT BSR HRT, hr Destruction, % Total CH4^ MGPUW % AR MF TS TVS liter m^/kg TS
10
0 0.25 8 24 — — —
1 0.20 8 24 40.41 50.74 65.95
2 0.18 8 24 46.48 54.92 84.34
3 0.15 8 24 48.35 56.74 85.59
4 50.67 58.15 86.73
Avg. '' 86.16 0.2154
15
0 0.25 8 24 — — —
1 0.20 8 24 40.71 53.47 105.62
2
3
4
0.18
0.15 00
00
24
24
45.31
47.52
48.83
54.19
58.72
59.10
109.54 **
111.57 •*
111.76
Avg."" 111.67 0.1861
^ Cumulative methane production over SWRT.
'' Average of two numbers marked with *.
Average of two numbers marked with **.

118
Results for the DBAR System at TS content of 10% and a 14-day SWRT
As mentioned in Chapter II, the DBAR system is a double batch acidogenic reactor.
Hence, every half SWRT the digested solid waste was replaced by fresh solid waste. The
DBAR system was started at a content of 10% and operated at a solid waste retention time
of 14 days. Since two acidogenic reactors were run in series, one-half of the digested solid
waste was replaced with fresh solid waste every half SWRT (7 days). With these
characteristics, the data shown in the figures are based on half SWRT. The experimental
data presented in this section include the cumulative methane production over 7 days and
the operating conditions and performance.
Cumulative Methane Production
Figures 32 and 33 show the cumulative methane production for different study
periods from the solid bed and the biofilter over time and for half SWRT, respectively.
The highest cumulative methane production over 7 days emerged on days 28 and 35. This
value is approximately 107 L (Figure 33). In this time period, the daily methane
production and methane production per unit weight of TS, which can be obtained from
Figure 32, were approximately 15.2 L and 0.267 m^/kg TS (4.29 ft^/lb TS), respectively.
In other words, the system had become mature under the load of 10% TS after one and
half SWRTs (21 days). However, the methane production dramatically dropped after day
36. To explain this observation, a hypothesis of inhibition on biochemical reactions under
the control conditions was made. The decreasing methane production may be the response
to three possible causes: 1) the acidogenesis rate decreased which caused the

119
methanogenesis rate to decrease; 2) the acidogenesis rate maintained the same but the
methanogenesis rate decreased. Under this assumption, the soluble COD measured from
the holding/recycling tank and effluent from the solid bed should increase; 3) Both the
acidogenesis and methanogenesis rates decreased.
Basically, most of the conditions causing biochemical rate decreases are due to the
inhibition of methanogenesis. However, the cumulative methane production from the solid
bed did not decrease significantly. This indicates that in some regions of the solid bed
normal methanogenic activity might still maintain.
To prove this assumption, 8 L of supernatant in the holding/recycling tank were
gradually replaced by 8 L of tap water between day 43 and 44. The cumulative methane
production was observed to gradually increase. The increase was almost solely attributed
to the increase in cumulative methane production from the biofilter (Figure 33). This
observation supported the assumption that methanogenesis rate was inhibited between day
35 and 42. However, the cumulative methane production from the solid bed did not
increase immediately. This may demonstrate that the solid bed responds and releases
toxicity much slower than the biofilter. This observation was not firmly proven but seems
reasonable.
The dilution process was continued starting one day before the end of every half
SWRT. For instance, on day 69, 10 L of supernatant were slowly replaced by 10 L
of tap water. The cumulative methane production did gradually increase to a constant
level of about 97 L (between day 56 and 70) but never reached 107 L. This
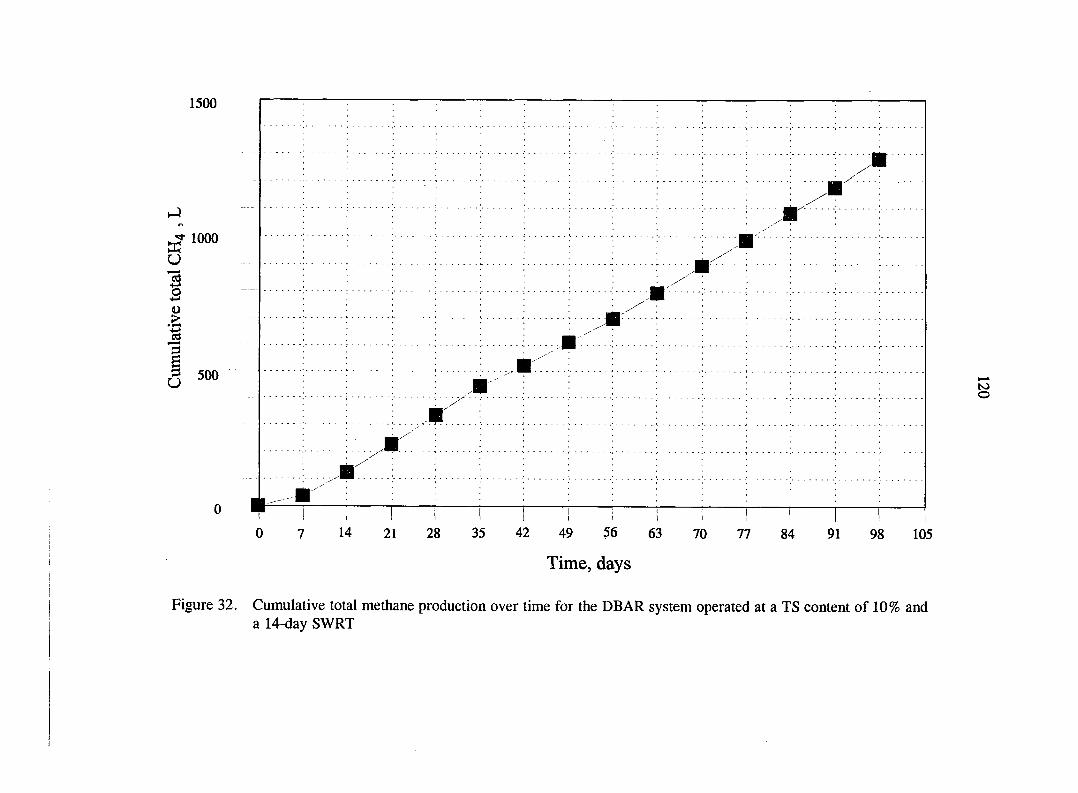
1500
! • I I I I ' ( i I I I I 1
0 7 14 21 28 35 42 49 56 63 70 77 84 91 98 105
Time, days
Figure 32. Cumulative total methane production over time for the DEAR system operated at a TS content of 10% and a 14-day SWRT
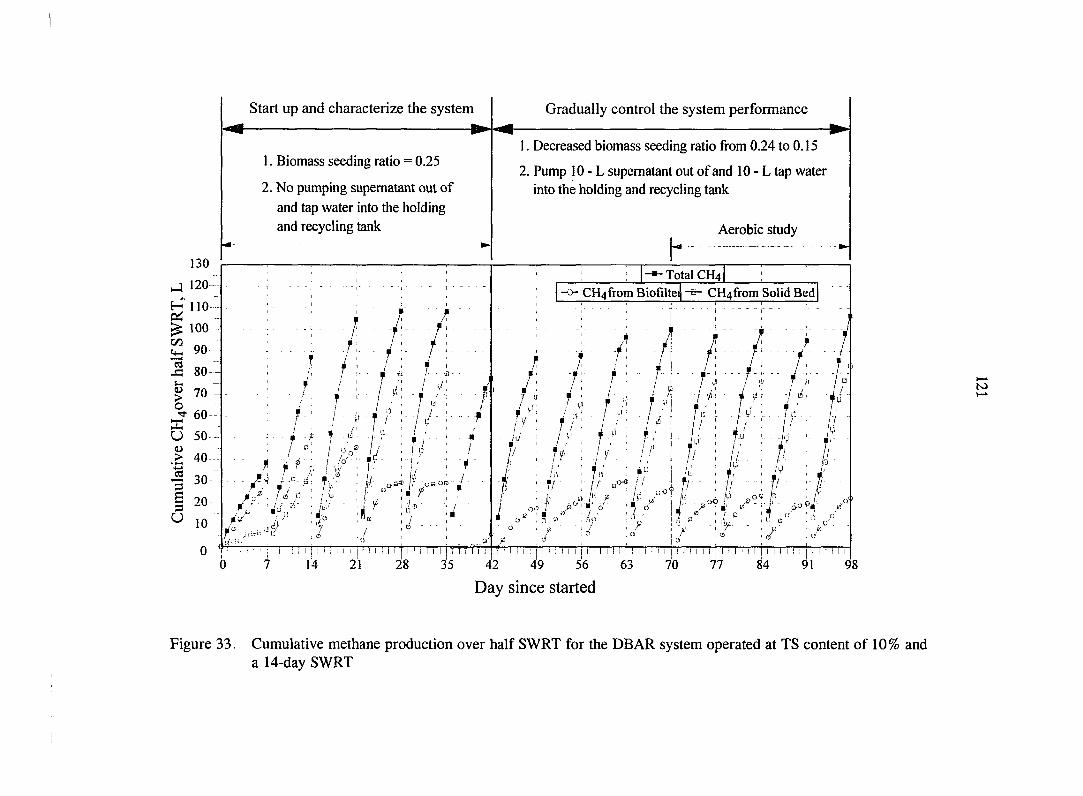
Start up and characterize the system
1. Biomass seeding ratio = 0.25
2. No pumping supernatant out of
and tap water into the holding
and recycling tank
Gradually control the system performance
1. Decreased biomass seeding ratio from 0.24 to 0.15
2. Pump 10 - L supernatant out of and 10 - L tap water
into the holding and recycling tank
h
Aerobic study
/
7/'
• Total CH4
CH4from Biofiltei CH4from Solid Bed
f " t - f
/i', T/
i ••jj' . n
• V'
/; p /!'• ?
L'tO
•/
I I 1 I I j I I I I M I I : i I I I n n 1' I I f I I ! I 1 I ! i ; I M I I I I M I I M I I M ! I I I I I | I I I I I I { I I I M I | I ! t I I I
7 14 21 28 35 42 49 56 63 70 77 84 91 98
•/ r
f I i I '
. f ; . I f
/ / 1.1
h /u '/- •
T" / ; / i ' •
5.
,o<? P
T-
r •>: / , /
> »! - I
j: : /
f ' i ' / J' - eo Pi- B' • e" / / ; /
Day since started
Figure 33. Cumulative methane production over half SWRT for the DBAR system operated at TS content of 10% and a 14-day SWRT
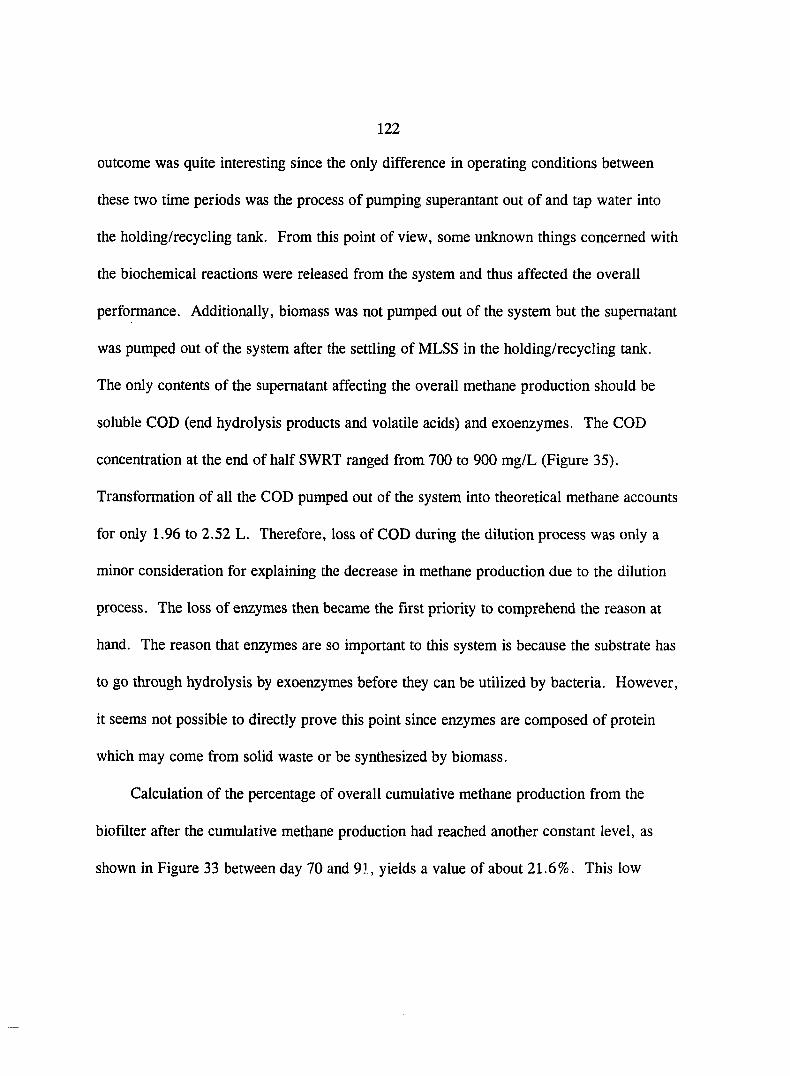
122
outcome was quite interesting since the only difference in operating conditions between
these two time periods was the process of pumping superantant out of and tap water into
the holding/recycling tank. From this point of view, some unknown things concerned with
the biochemical reactions were released from the system and thus affected the overall
performance. Additionally, biomass was not pumped out of the system but the supernatant
was pumped out of the system after the settling of MLSS in the holding/recycling tank.
The only contents of the supernatant affecting the overall methane production should be
soluble COD (end hydrolysis products and volatile acids) and exoenzymes. The COD
concentration at the end of half SWRT ranged from 700 to 900 mg/L (Figure 35).
Transformation of all the COD pumped out of the system into theoretical methane accounts
for only 1.96 to 2.52 L. Therefore, loss of COD during the dilution process was only a
minor consideration for explaining the decrease in methane production due to the dilution
process. The loss of enzymes then became the first priority to comprehend the reason at
hand. The reason that enzymes are so important to this system is because the substrate has
to go through hydrolysis by exoenzymes before they can be utilized by bacteria. However,
it seems not possible to directly prove this point since enzymes are composed of protein
which may come from solid waste or be synthesized by biomass.
Calculation of the percentage of overall cumulative methane production from the
biofilter after the cumulative methane production had reached another constant level, as
shown in Figure 33 between day 70 and 91, yields a value of about 21.6%. This low

123
7.6-
1A~
1 2 -
1 . 0 -
6.8-
6.6-
6.4-0 7 14 21 28 35 42 49 56 63 70 77 84 91 98
Day since started
Figure 34. pH profile of the holding/recycling tank and effluent from the solid bed for the DEAR system operated at TS content of 10% and a 14-day SWRT
4000
J 3000 I Effluent from Solid Bed
® 2000-- •
1 - \ • a *54- ' '• •-
8 1000^ - C L.=-
- " • i ' 'f i
0 7 14 21 28 35 42 49 56 63 70 77 84 91 98
Day since started
Figure 35. COD profile of the holding/recycling tank and effluent from the solid bed for the DEAR system operated at TS content of 10% and a 14-day SWRT
Holding/Recycling Tank
V.
: / • r•
c:. .•
• V / - •'4 Effluent from Solid bed
^ •
f •,*» k'
• ,
Holding and Recycling Tank .rr, Effluent from Solid Bed
o/ 'v r . V / ; , . - . ^ ^ i'«V
• o ^
" ;»Q
• •
* -or'
•6 c -ji ri, ^ r) - V 0 • '.v -
3 a '
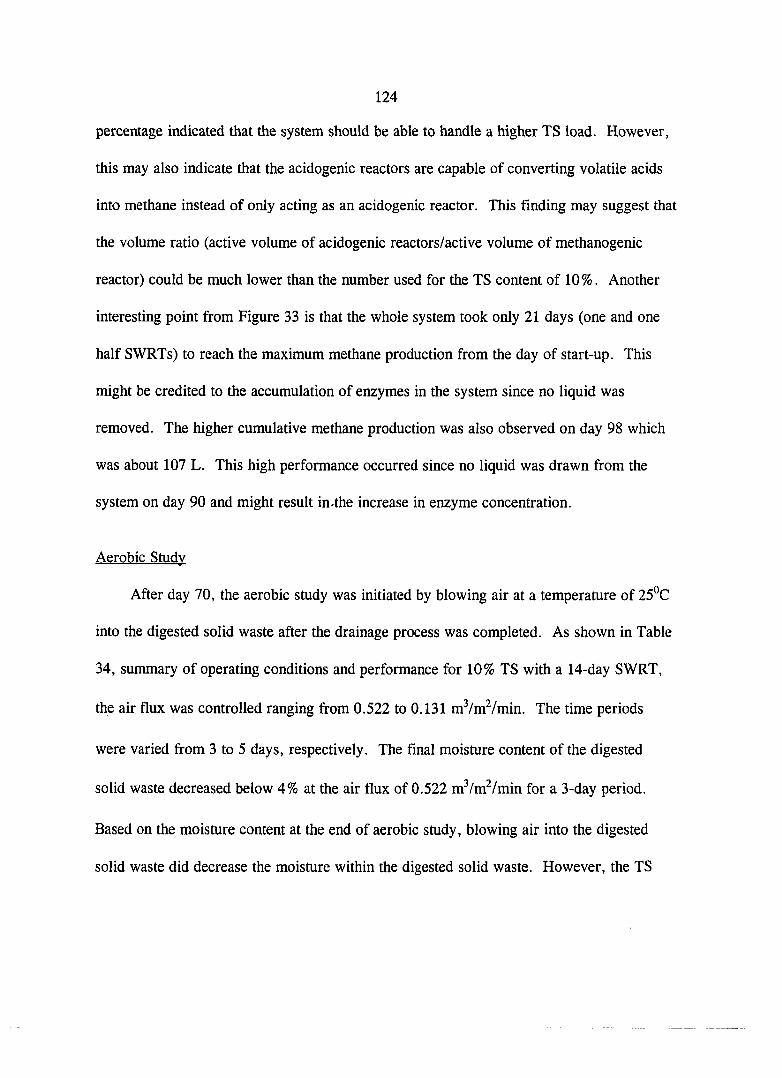
124
percentage indicated that the system should be able to handle a higher TS load. However,
this may also indicate that the acidogenic reactors are capable of converting volatile acids
into methane instead of only acting as an acidogenic reactor. This finding may suggest that
the volume ratio (active volume of acidogenic reactors/active volume of methanogenic
reactor) could be much lower than the number used for the TS content of 10%. Another
interesting point from Figure 33 is that the whole system took only 21 days (one and one
half SWRTs) to reach the maximum methane production from the day of start-up. This
might be credited to the accumulation of enzymes in the system since no liquid was
removed. The higher cumulative methane production was also observed on day 98 which
was about 107 L. This high performance occurred since no liquid was drawn from the
system on day 90 and might result in^he increase in enzyme concentration.
Aerobic Stody
After day 70, the aerobic study was initiated by blowing air at a temperature of 25°C
into the digested solid waste after the drainage process was completed. As shown in Table
34, summary of operating conditions and performance for 10% TS with a 14-day SWRT,
the air flux was controlled ranging from 0.522 to 0.131 m^/m^/min. The time periods
were varied from 3 to 5 days, respectively. The final moisture content of the digested
solid waste decreased below 4% at the air flux of 0.522 m^/m^/min for a 3-day period.
Based on the moisture content at the end of aerobic study, blowing air into the digested
solid waste did decrease the moisture within the digested solid waste. However, the TS
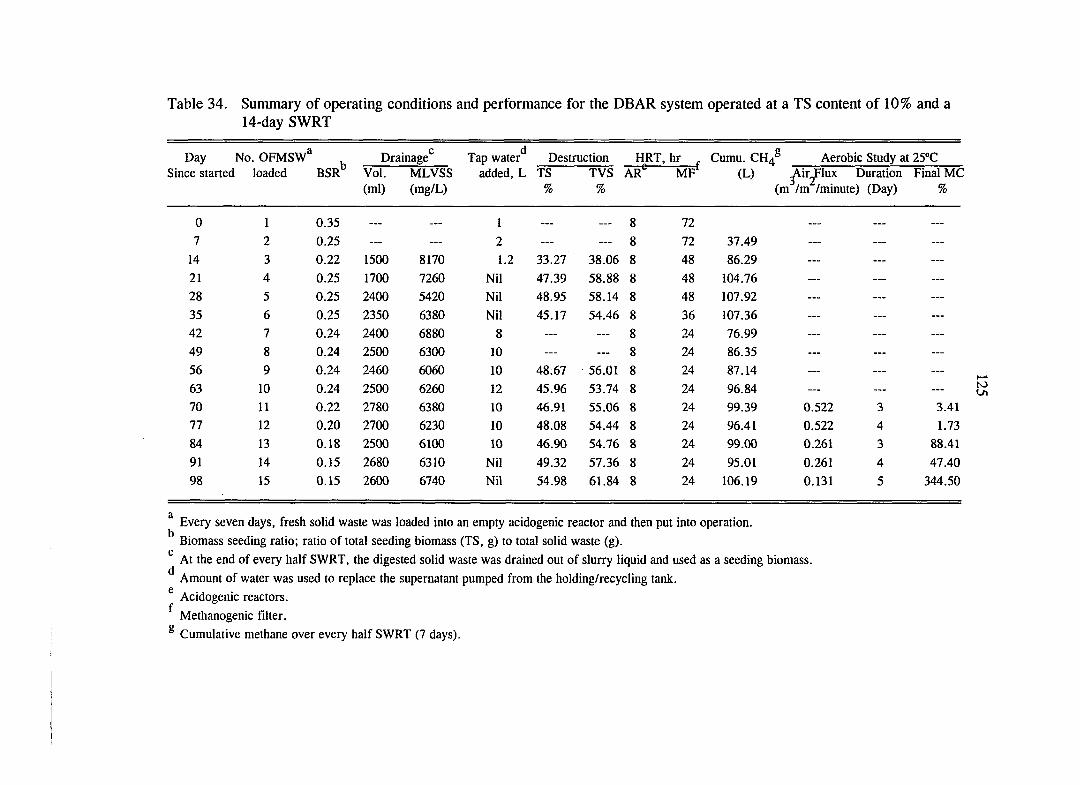
Table 34. Summary of operating conditions and performance for the DEAR system operated at a TS content of 10% and a 14-day SWRT
Day No. OFMSW^ Drainage'^ Tap water'^ Destruction HRT, hr Cumu. CH4® Aerobic Study at 25°C Since started loaded BSR Vol. MLVSS added, L TS TVS AR® MF (L) Airjlux Duration Final MC
(ml) (mg/L) % % (m /m /minute) (Day) %
0 1 0.35 — — 1 — — 8 72 — — —
7 2 0.25 — — 2 — — 8 72 37.49 — — —
14 3 0.22 1500 8170 1.2 33.27 38.06 8 48 86.29 — — —
21 4 0.25 1700 7260 Nil 47.39 58.88 8 48 104.76 — — —
28 5 0.25 2400 5420 Nil 48.95 58.14 8 48 107.92 — — —
35 6 0.25 2350 6380 Nil 45.17 54.46 8 36 107.36 — — —
42 7 0.24 2400 6880 8 — — 8 24 76.99 — — —
49 8 0.24 2500 6300 10 — — 8 24 86.35 — — —
56 9 0.24 2460 6060 10 48;67 56.01 8 24 87.14 — — —
63 10 0.24 2500 6260 12 45.96 53.74 8 24 96.84 — — —
70 11 0.22 2780 6380 10 46.91 55.06 8 24 99.39 0.522 3 3.41
77 12 0.20 2700 6230 10 48.08 54.44 8 24 96.41 0.522 4 1.73
84 13 0.18 2500 6100 10 46.90 54.76 8 24 99.00 0.261 3 88.41
91 14 0.15 2680 6310 Nil 49.32 57.36 8 24 95.01 0.261 4 47.40
98 15 0.15 2600 6740 Nil 54.98 61.84 8 24 106.19 0.131 5 344.50
^ Every seven days, fresh solid waste was loaded into an empty acidogenic reactor and then put into operation.
Biomass seeding ratio; ratio of total seeding biomass (TS, g) to total solid waste (g).
At the end of every half SWRT, the digested solid waste was drained out of slurry liquid and used as a seeding biomass.
Amount of water was used to replace the supernatant pumped from the holding/recycling tank. g
Acidogenic reactors. f
Methanogenic filter.
® Cumulative methane over every half SWRT (7 days).
126
pH Profile
In Figure 34, the pH dropped to 6.6 and 6.8 at the beginning of start-up for the solid
bed and the holding/recycling tank, respectively. The pH then gradually increased to the
highest levels of 7.2 (solid bed) and 7,3 (holding/recycling tank) on day 27, during which
the highest cumulative methane production occurred. This may indicate that the system
was becoming mature and had no problem in handling the current solid load although the
high performance was due to the accumulation of exoenzymes. In other words, the system
was capable of converting volatile fatty acids at the current concentration into methane.
After day 42, the pH decreased to a range from 6.7 to 7.0. The pH decrease may be the
response of performance reduction according to the dilution process. However, this pH
range was still close to the optimum for anaerobic digestion.
COD Profile
The COD concentration in the solid bed and holding/recycling tank were
approximately 4000 and 2800 mg/L, respectively, at the time of start-up. The profile was
then smoothly decreased to the range of 2000 to 1000 mg/L between days 28 and 35.
These observations indicate that the system was getting mature over time. In other words,
the system was capable of converting more volatile acids into methane and led to the drop
in COD concentration from the holding/recycling tank and solid bed. Between day 35 and
42, methane production dramatically decreased (Figure 33). In this time period, the COD
concentrations were higher than previous cycles. One spike in COD concentration around
3000 mg/L appeared on day 37. This phenomenon was not surprising because the

127
inhibition of methanogenesis caused the accumulation of reaction byproducts (volatile
acids) in the liquid phase. With the dilution process, the COD profile gradually dropped to
a level between 1500 and 700 mg/L.
Gas Composition Profile
Figures 36 and 37 show the gas composition profiles for the biofilter and the solids
bed. The content of methane and carbon dioxide measured from the biofilter and the solids
bed approached a constant value after day 56. For the biofilter, the concentration of
methane and carbon dioxide was 61 and 37%, respectively. The content of methane and
carbon dioxide in the solids bed was 45 and 53%, respectively. A methane content
between 60 to 65% in anaerobic digestion is quite normal. Methane content below 50% in
the first-phase digestion are also normal, since carbon dioxide is the byproduct in the
process of converting substrate into volatile acids. The methane and carbon dioxide
contents were not significantly different when the cumulative methane
production dramatically decreased between day 35 and 42.
Biomass Seeding Ratio and TS and TVS Destruction
The biomass seeding ratio is thought to be important in methane production and TS
and TVS destruction. In this section, the BSR was not strictly controlled. The system was
seeded with a BSR of 0.35 at start-up and then controlled at 0.24 or 0.25 until day 64.
The destruction of TS and TVS increased from 35 and 38%, to an average of 47 and 55%,
respectively. After that the BSR was decreased from 0.24 to 0.15 between days 70

128
70
§ 60
S 50" o,
I 40-U
30 03
O
CH. -e-co^
& - • - -^ - •—•h - - -
0 7 14 21 28 35 42 49 56 63 70 77 84 91 98
Day since started
Figure 36. Gas composition profile of the biofilter for the DEAR system operated at a TS content of 10% and a 14-day SWRT
70
c 60
1 40 u
S 30 a 20
0 7 14 21 28 35 42 49 56 63 70 77 84 91 98
Day since started
> CO9
Figure 37. Gas composition profile of the solid bed for the DEAR system operated at a TS
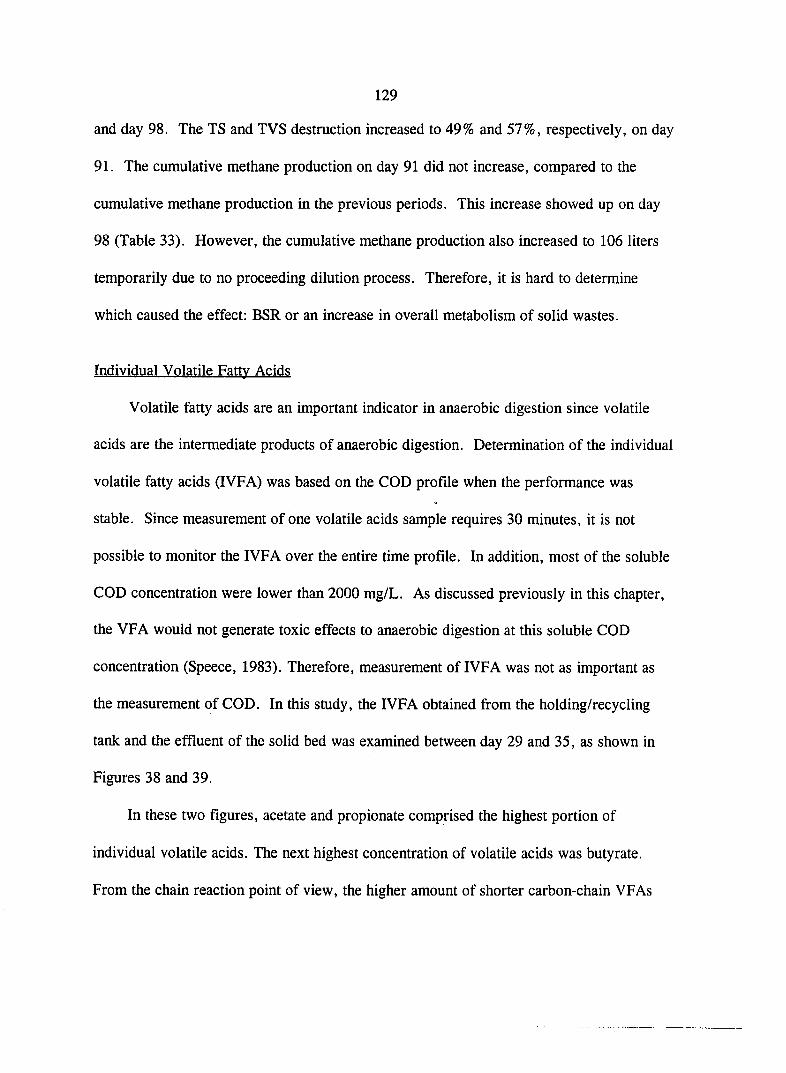
129
and day 98. The TS and TVS destruction increased to 49% and 57%, respectively, on day
91. The cumulative methane production on day 91 did not increase, compared to the
cumulative methane production in the previous periods. This increase showed up on day
98 (Table 33). However, the cumulative methane production also increased to 106 liters
temporarily due to no proceeding dilution process. Therefore, it is hard to determine
which caused the effect: BSR or an increase in overall metabolism of solid wastes.
Individual Volatile Fatty Acids
Volatile fatty acids are an important indicator in anaerobic digestion since volatile
acids are the intermediate products of anaerobic digestion. Determination of the individual
volatile fatty acids (IVFA) was based on the COD profile when the performance was
stable. Since measurement of one volatile acids sample requires 30 minutes, it is not
possible to monitor the IVFA over the entire time profile. In addition, most of the soluble
COD concentration were lower than 2000 mg/L. As discussed previously in this chapter,
the VFA would not generate toxic effects to anaerobic digestion at this soluble COD
concentration (Speece, 1983). Therefore, measurement of IVFA was not as important as
the measurement of COD. In this study, the IVFA obtained from the holding/recycling
tank and the effluent of the solid bed was examined between day 29 and 35, as shown in
Figures 38 and 39.
In these two figures, acetate and propionate comprised the highest portion of
individual volatile acids. The next highest concentration of volatile acids was butyrate.
From the chain reaction point of view, the higher amount of shorter carbon-chain VFAs

130
500 Acetate
-B- Propionate 450— Butyrate
-A- Iso-Butyrate 400—
©- 2-Meth-Butyrate 350—
3-Meth-Butyrate
Valerate 300—
31 32 33
Time, days
Figure 38. lidividual volatile acids in the holding/recycling tank for the SBAR system operated at a TS content of 10% and a 14-day SWRT

131
550 Acetate
-g- Propionate 500 Butyrate
-7^ Iso-Butyrate
.2 300
-0- 2-Meth-Butyrate
3-Meth-Butyrate
Valerate
100
Time, days
Figure 39. Individual volatile acids measured from the effluent of solid bed for the DEAR system operated at a TS content of 10% and a 14-day SWRT
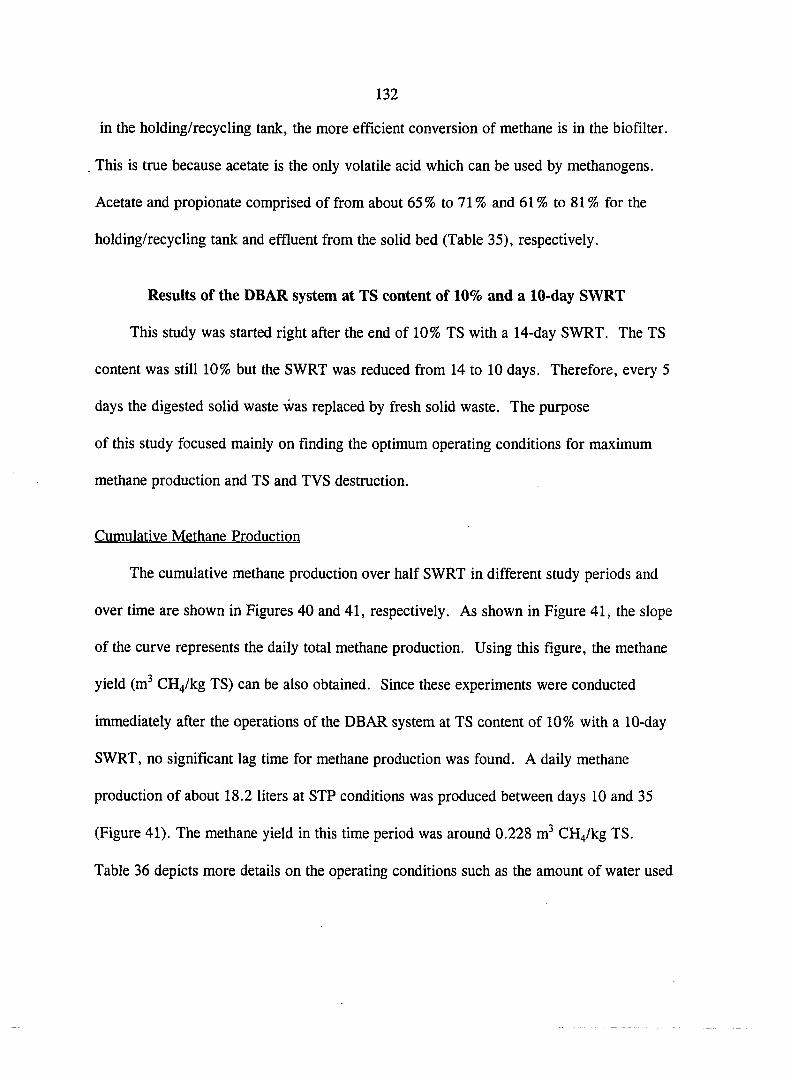
132
in the holding/recycling tank, the more efficient conversion of methane is in the biofilter.
This is true because acetate is the only volatile acid which can be used by methanogens.
Acetate and propionate comprised of from about 65% to 71 % and 61 % to 81 % for the
holding/recycling tank and effluent from the solid bed (Table 35), respectively.
Results of the DBAR system at TS content of 10% and a 10-day SWRT
This smdy was started right after the end of 10% TS with a 14-day SWRT. The TS
content was still 10% but the SWRT was reduced from 14 to 10 days. Therefore, every 5
days the digested solid waste was replaced by fresh solid waste. The purpose
of this study focused mainly on finding the optimum operating conditions for maximum
methane production and TS and TVS destruction.
Cumulative Methane Production
The cumulative methane production over half SWRT in different study periods and
over time are shown in Figures 40 and 41, respectively. As shown in Figure 41, the slope
of the curve represents the daily total methane production. Using this figure, the methane
yield (m^ CH4/kg TS) can be also obtained. Since these experiments were conducted
immediately after the operations of the DBAR system at TS content of 10% with a 10-day
SWRT, no significant lag time for methane production was found. A daily methane
production of about 18.2 liters at STP conditions was produced between days 10 and 35
(Figure 41). The methane yield in this time period was around 0.228 m^ CH4/kg TS.
Table 36 depicts more details on the operating conditions such as the amount of water used
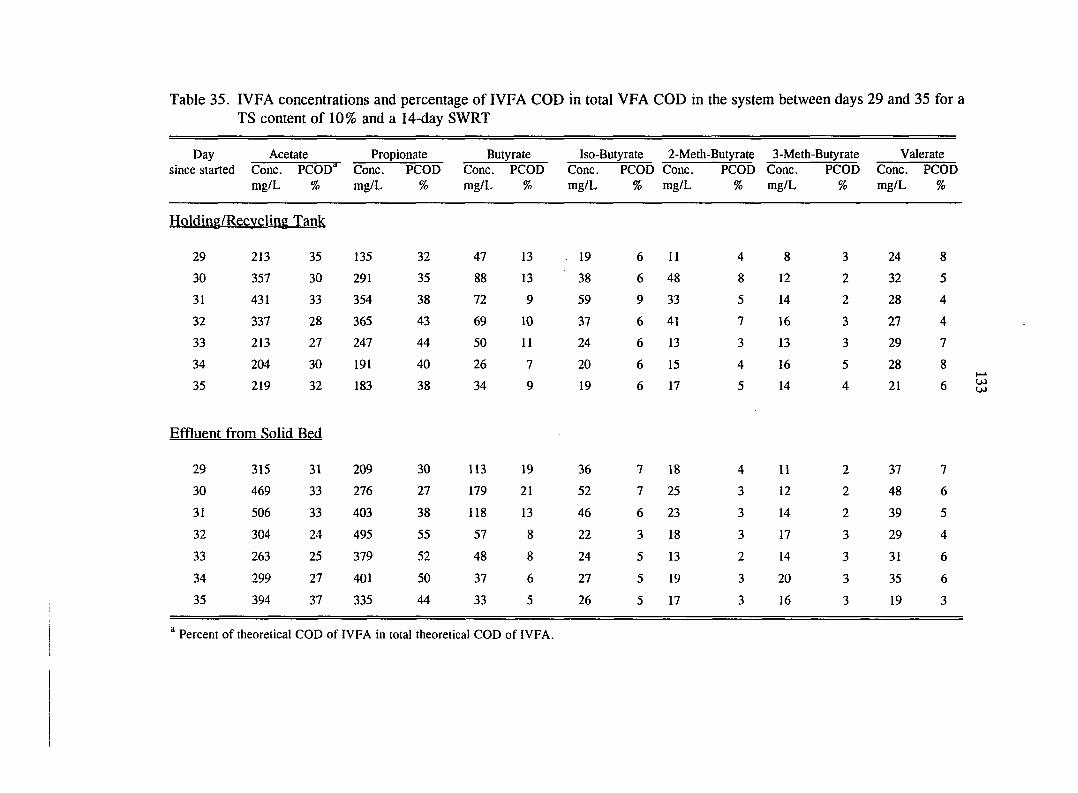
Table 35. IVFA concentrations and percentage of IVFA COD in total VFA COD in the system between days 29 and 35 for a TS content of 10% and a 14-day SWRT
Day Acetate Propionate Butyrate Iso-Butyrate 2-Meth-Butyrate 3-Meth-Butyrate Valerate since started Cone. PCOD" Cone. PCOD Cone. PCOD Cone. PCOD Cone. PCOD Cone. PCOD Cone. PCOD
mg/L % mg/L % mg/L % mg/L % mg/L % mg/L % mg/L %
Holding/Recycling Tank
29 213 35 135 32 47 13 . 19 6 11 4 8 3 24 8
30 357 30 291 35 88 13 38 6 48 8 12 2 32 5
31 431 33 354 38 72 9 59 9 33 5 14 2 28 4
32 337 28 365 43 69 10 37 6 41 7 16 3 27 4
33 213 27 247 44 50 11 24 6 13 3 13 3 29 7
34 204 30 191 40 26 7 20 6 15 4 16 5 28 8
35 219 32 183 38 34 9 19 6 17 5 14 4 21 6
Effluent from Solid Bed
29 315 31 209 30 113 19 36 7 18 4 11 2 37 7
30 469 33 276 27 179 21 52 7 25 3 12 2 48 6
31 506 33 403 38 118 13 46 6 23 3 14 2 39 5
32 304 24 495 55 57 8 22 3 18 3 17 3 29 4
33 263 25 379 52 48 8 24 5 13 2 14 3 31 6
34 299 27 401 50 37 6 27 5 19 3 20 3 35 6
35 394 37 335 44 33 5 26 5 17 3 16 3 19 3
^ Percent of theoretical COD of IVFA in total theoretical COD of IVFA.

Normal Operation
1. Biomass seeding ratio = 0.2
2. Pump 8-L supernatant out of and 8-L tap water into the holding and recycling tank
3. HRTacidogenic ~ 8 hr reactors
Toxicity study
1. No pumping supernatant out of and tap water into the holding and recycling tank
2. HRTacidogenic ~ 8 hr reactors
Biomass seeding ratio R = 0.2 R = 0.15 R = 0.1
No reseeding biomass
r: /
r f -If ' A ' j*
Ik-'- r T; ' ' If
i' ' r ^ ; ^ M : I.
1 1
n fr h i
-ii: if': P
l! \l
" ' <^'^1 * 5,®^ £ ' a •• •• 7.
C3 -a
Total CH}
-(§)-CH4 from Biofiltei|[ - A- CH4froni Solid Bed
u
f'
f ?
(
h. T,: M; f.
/ . r 'A ' /' I 'i
I /I
If
i :!
3 :
• I l
/A
TfTTT
- - / A -
- JC' r , /' -• I : /
H ; ! '
: t: H ; ! ' f ; !• ' II 1 •- '•
•!!
1 1 ! 1 1 1 ! 1 1 1 M 1 ! 1 M 1 1 I ! I I i I j I I I i I I 1 I • i T l ! I I - I TTm i I ! I I I I I I I 1 1 ! ! I I I I I I I I I 1 I 1 I
0 5 10 15 20 25 30 35 40 45 50 55 60 65 70 75 80 85 90 95 100 105
Day since started
Figure 40. Cumulative methane production over half SWRT for the DEAR system operated at TS content of 10% and a 10-day SWRT
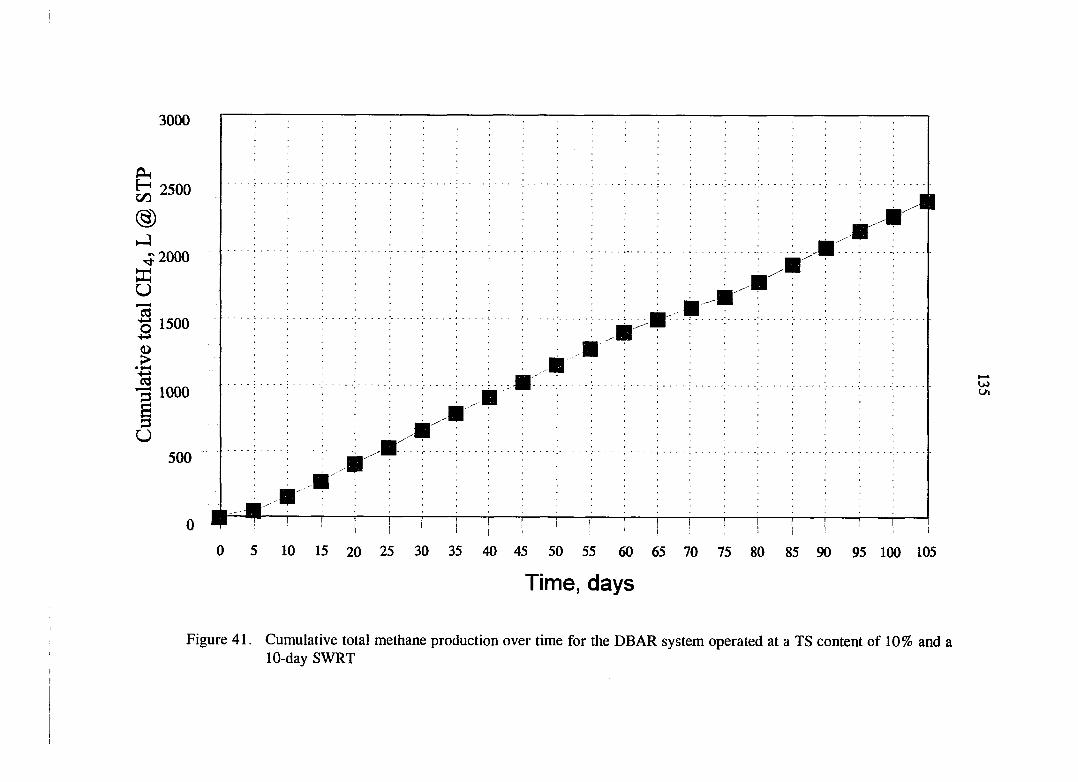
3000
2500
^2000 ffi u
1500 -t-' <u
c3 3 1000
o
500
0
w
0 5 10 15 20 25 30 35 40 45 50 55 60 65 70 75 80 85 90 95 100 105
Time, days
Figure 41. Cumulative total methane production over time for the DEAR system operated at a TS content of 10% and a 10-day SWRT
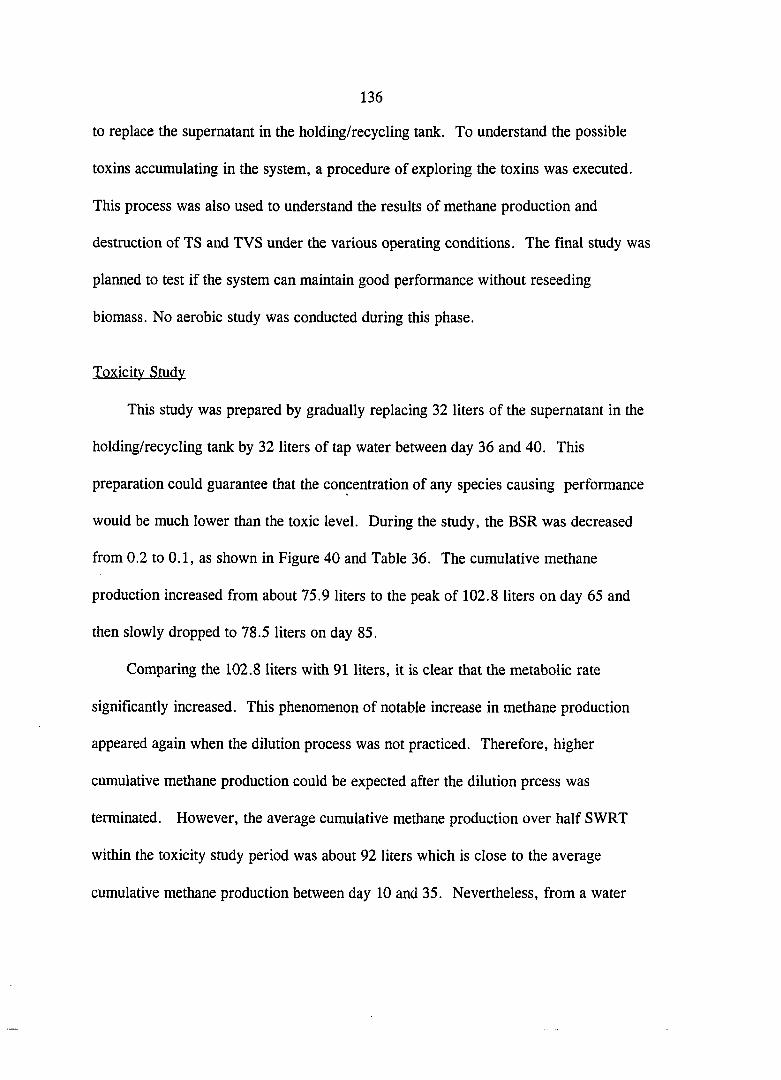
136
to replace the supernatant in the holding/recycling tank. To understand the possible
toxins accumulating in the system, a procedure of exploring the toxins was executed.
This process was also used to understand the results of methane production and
destruction of TS and TVS under the various operating conditions. The final study was
planned to test if the system can maintain good performance without reseeding
biomass. No aerobic study was conducted during this phase.
Toxicity Study
This study was prepared by gradually replacing 32 liters of the supernatant in the
holding/recycling tank by 32 liters of tap water between day 36 and 40. This
preparation could guarantee that the concentration of any species causing performance
would be much lower than the toxic level. During the study, the BSR was decreased
from 0.2 to 0.1, as shown in Figure 40 and Table 36. The cumulative methane
production increased from about 75.9 liters to the peak of 102.8 liters on day 65 and
then slowly dropped to 78.5 liters on day 85.
Comparing the 102.8 liters with 91 liters, it is clear that the metabolic rate
significantly increased. This phenomenon of notable increase in methane production
appeared again when the dilution process was not practiced. Therefore, higher
cumulative methane production could be expected after the dilution prcess was
terminated. However, the average cumulative methane production over half SWRT
within the toxicity study period was about 92 liters which is close to the average
cumulative methane production between day 10 and 35. Nevertheless, from a water
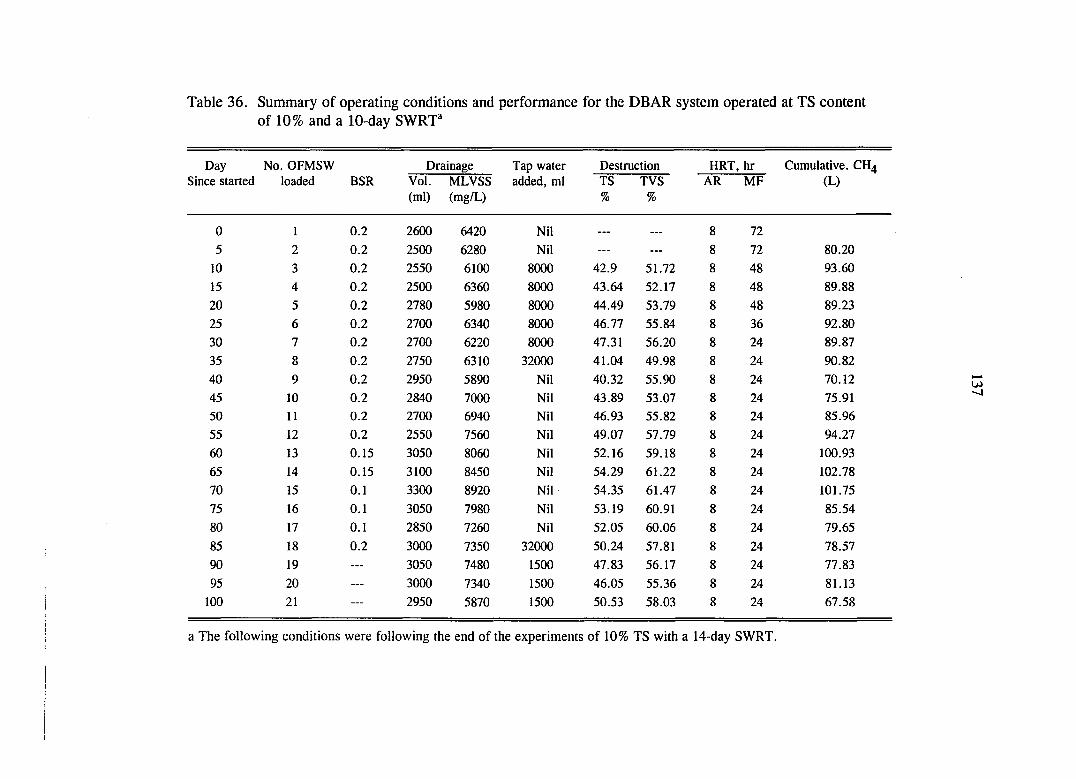
Table 36. Summary of operating conditions and performance for the DEAR system operated at TS content of 10% and a 10-day SWRT'
Day No. OFMSW Drainage Tap water Destruction HRT, hr Cumulative. CH4 Since started loaded BSR Vol.
(ml) MLVSS (mg/L)
added, ml TS
% TVS
% AR MF (L)
0 1 0.2 2600 6420 Nil — — 8 72
5 2 0.2 2500 6280 Nil — — 8 72 80.20
10 3 0.2 2550 6100 8000 42.9 51.72 8 48 93.60
15 4 0.2 2500 6360 8000 43.64 52.17 8 48 89.88
20 5 0.2 2780 5980 8000 44.49 53.79 8 48 89.23
25 6 0.2 2700 6340 8000 46.77 55.84 8 36 92.80
30 7 0.2 2700 6220 8000 47.31 56.20 8 24 89.87
35 8 0.2 2750 6310 32000 41.04 49.98 8 24 90.82
40 9 0.2 2950 5890 Nil 40.32 55.90 8 24 70.12
45 10 0.2 2840 7000 Nil 43.89 53.07 8 24 75.91
50 11 0.2 2700 6940 Nil 46.93 55.82 8 24 85.96
55 12 0.2 2550 7560 Nil 49.07 57.79 8 24 94.27
60 13 0.15 3050 8060 Nil 52.16 59.18 8 24 100.93
65 14 0.15 3100 8450 Nil 54.29 61.22 8 24 102.78
70 15 0.1 3300 8920 Nil 54.35 61.47 8 24 101.75
75 16 0.1 3050 7980 Nil 53.19 60.91 8 24 85.54
80 17 0.1 2850 7260 Nil 52.05 60.06 8 24 79.65
85 18 0.2 3000 7350 32000 50.24 57.81 8 24 78.57
90 19 — 3050 7480 1500 47.83 56.17 8 24 77.83
95 20 — 3000 7340 1500 46.05 55.36 8 24 81.13
100 21 — 2950 5870 1500 50.53 58.03 8 24 67.58
a The following conditions were following the end of the experiments of 10% TS with a 14-day SWRT.
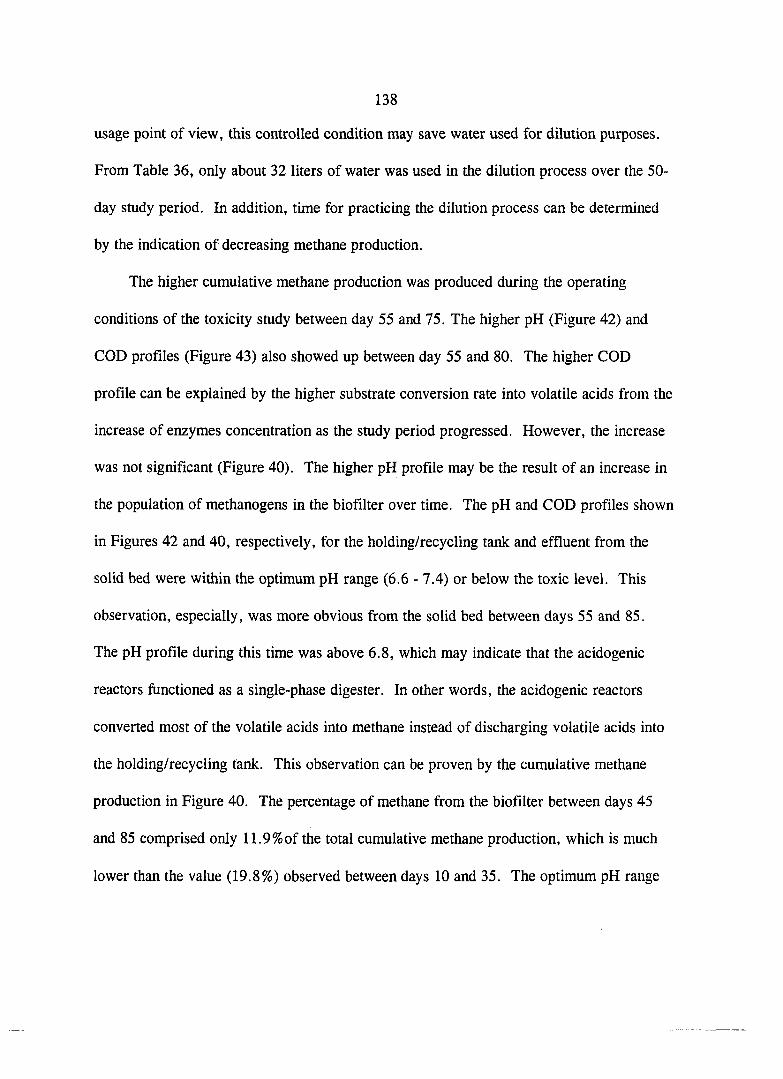
138
usage point of view, this controlled condition may save water used for dilution purposes.
From Table 36, only about 32 liters of water was used in the dilution process over the 50-
day study period. In addition, time for practicing the dilution process can be determined
by the indication of decreasing methane production.
The higher cumulative methane production was produced during the operating
conditions of the toxicity study between day 55 and 75. The higher pH (Figure 42) and
COD profiles (Figure 43) also showed up between day 55 and 80. The higher COD
profile can be explained by the higher substrate conversion rate into volatile acids from the
increase of enzymes concentration as the study period progressed. However, the increase
was not significant (Figure 40). The higher pH profile may be the result of an increase in
the population of methanogens in the biofilter over time. The pH and COD profiles shown
in Figures 42 and 40, respectively, for the holding/recycling tank and effluent from the
solid bed were within the optimum pH range (6.6 - 7.4) or below the toxic level. This
observation, especially, was more obvious from the solid bed between days 55 and 85.
The pH profile during this time was above 6.8, which may indicate that the acidogenic
reactors functioned as a single-phase digester. In other words, the acidogenic reactors
converted most of the volatile acids into methane instead of discharging volatile acids into
the holding/recycling tank. This observation can be proven by the cumulative methane
production in Figure 40. The percentage of methane from the biofilter between days 45
and 85 comprised only 11.9% of the total cumulative methane production, which is much
lower than the value (19.8%) observed between days 10 and 35. The optimum pH range
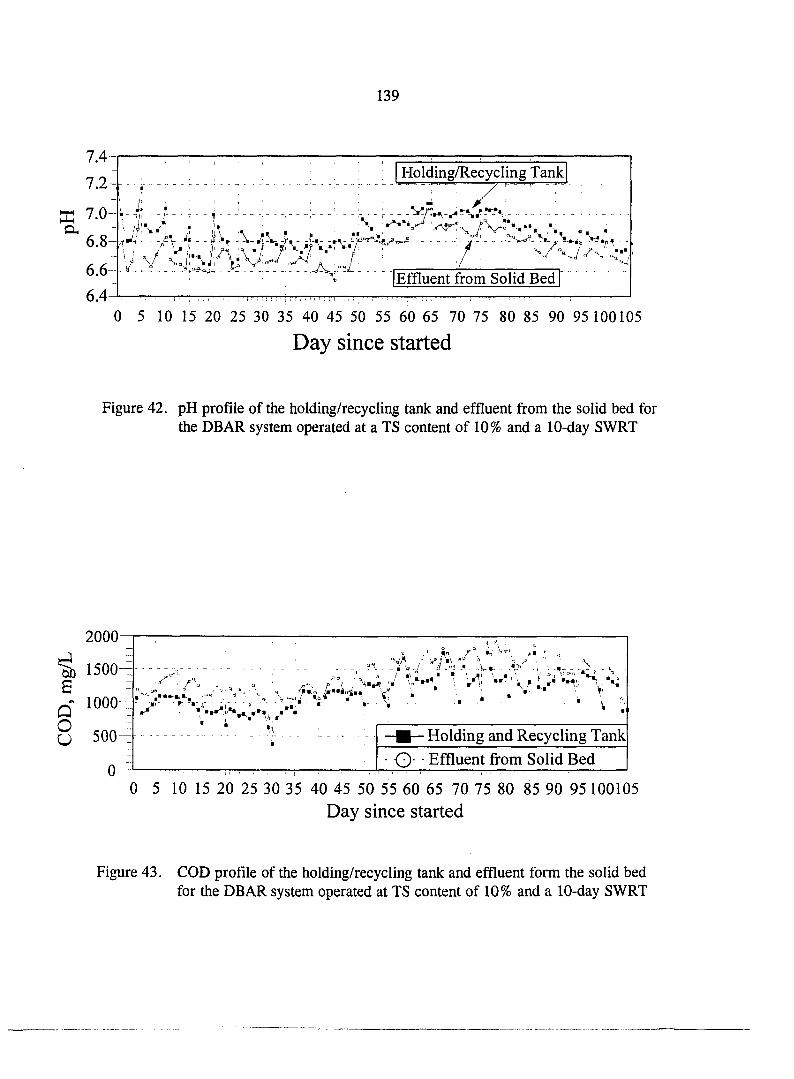
139
7.4
7.2-
7.0-Oh
6.8-
6.6
6.4-
Holding/Recycling Tank "Z"
. J- .. -L - . _ , . _ ,
-v •- - -/V -4 - - Pt - ;K" ^ - ' J -
.A.,.
Z"^' >*o** »• • / " • V « , • , a
Effluent from Solid Bed
0 5 10 15 20 25 30 35 40 45 50 55 60 65 70 75 80 85 90 95 100105
Day since started
Figure 42. pH profile of the holding/recycling tank and effluent from the solid bed for the DBAR system operated at a TS content of 10% and a 10-day SWRT
2000
^ 1500 B
Q- 1000
8 500
0 -I . • : . . , . . — . . . I . I : . — ^
0 5 10 15 20 25 30 35 40 45 50 55 60 65 70 75 80 85 90 95 100105
Day since started
I • • ' ' '
V ' V' i,.'*'v; V
•j •Holding and Recycling Tank
O" • Effluent from Solid Bed
Figure 43. COD profile of the holding/recycling tank and effluent form the solid bed for the DBAR system operated at TS content of 10% and a 10-day SWRT
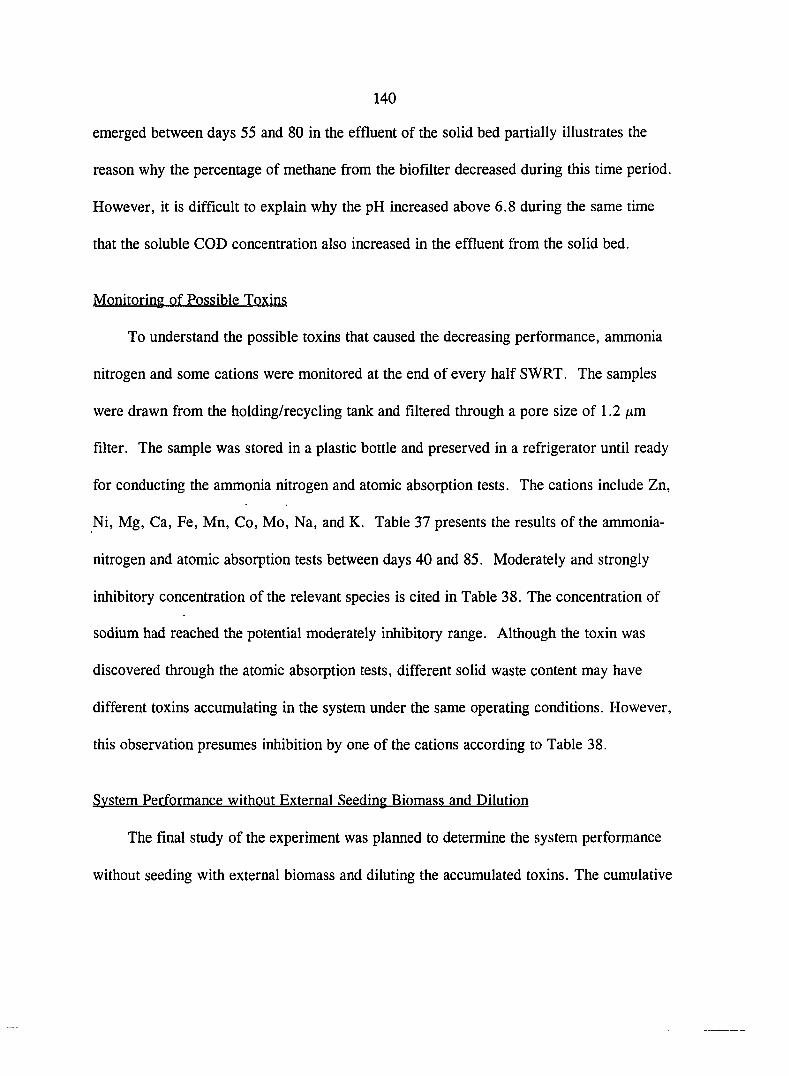
140
emerged between days 55 and 80 in the effluent of the solid bed partially illustrates the
reason why the percentage of methane from the biofilter decreased during this time period.
However, it is difficult to explain why the pH increased above 6.8 during the same tune
that the soluble COD concentration also increased in the effluent from the solid bed.
Monitoring of Possible Toxins
To understand the possible toxins that caused the decreasing performance, ammonia
nitrogen and some cations were monitored at the end of every half SWRT. The samples
were drawn from the holding/recycling tank and filtered through a pore size of 1.2 fim
filter. The sample was stored in a plastic bottle and preserved in a refrigerator until ready
for conducting the ammonia nitrogen and atomic absorption tests. The cations include Zn,
Ni, Mg, Ca, Fe, Mn, Co, Mo, Na, and K. Table 37 presents the results of the ammonia-
nitrogen and atomic absorption tests between days 40 and 85. Moderately and strongly
inhibitory concentration of the relevant species is cited in Table 38. The concentration of
sodium had reached the potential moderately inhibitory range. Although the toxin was
discovered through the atomic absorption tests, different solid waste content may have
different toxins accumulating in the system under the same operating conditions. However,
this observation presumes inhibition by one of the cations according to Table 38.
System Performance without External Seeding Biomass and Dilution
The final study of the experiment was planned to determine the system performance
without seeding with external biomass and diluting the accumulated toxins. The cumulative
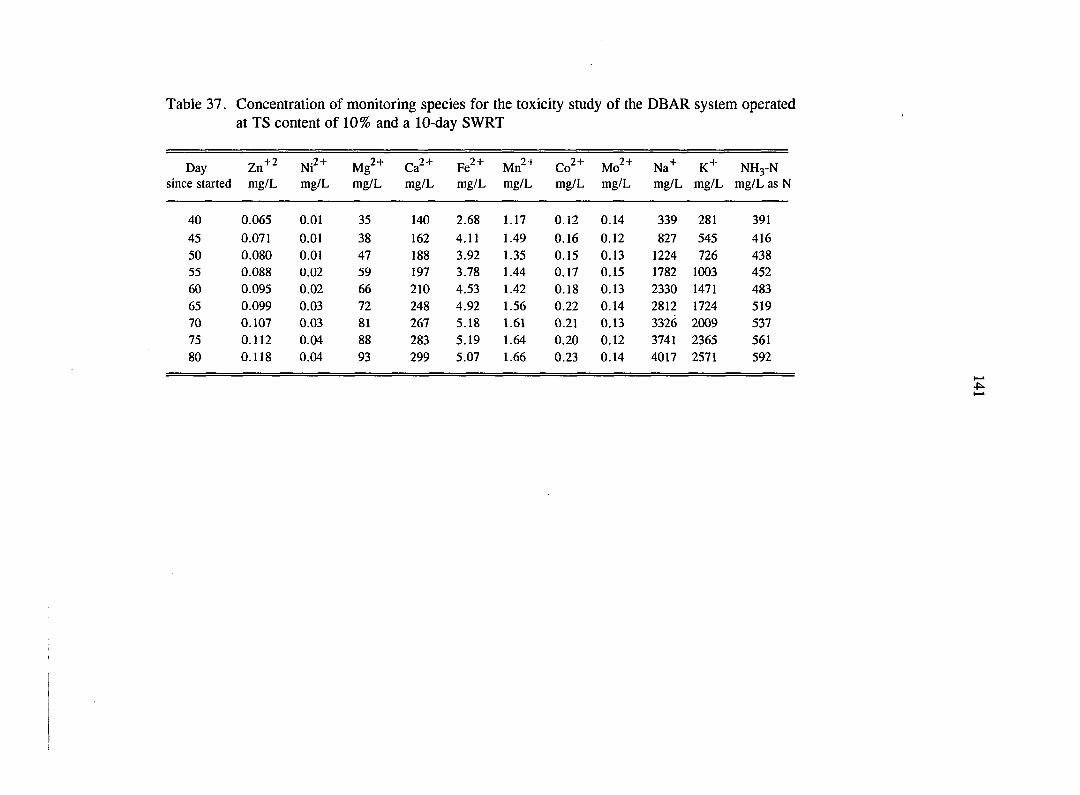
Table 37. Concentration of monitoring species for the toxicity study of the DEAR system operated at TS content of 10% and a 10-day SWRT
Day Zn"^^ VI.2+ Ni Mg^"^ c 2 + Fe Mn^"^ Co^"^ Mo^"^ Na"^ K+ NHj-N since started mg/L mg/L mg/L mg/L mg/L mg/L mg/L mg/L mg/L mg/L mg/L as N
40 0.065 0.01 35 140 2.68 1.17 0.12 0.14 339 281 391
45 0.071 0.01 38 162 4.11 1.49 0.16 0.12 827 545 416
50 0.080 0.01 47 188 3.92 1.35 0.15 0.13 1224 726 438
55 0.088 0.02 59 197 3.78 1.44 0.17 0.15 1782 1003 452
60 0.095 0.02 66 210 4.53 1.42 0.18 0.13 2330 1471 483
65 0.099 0.03 72 248 4.92 1.56 0.22 0.14 2812 1724 519
70 0.107 0.03 81 267 5.18 1.61 0.21 0.13 3326 2009 537
75 0.112 0.04 88 283 5.19 1.64 0.20 0.12 3741 2365 561
80 0.118 0.04 93 299 5.07 1.66 0.23 0.14 4017 2571 592
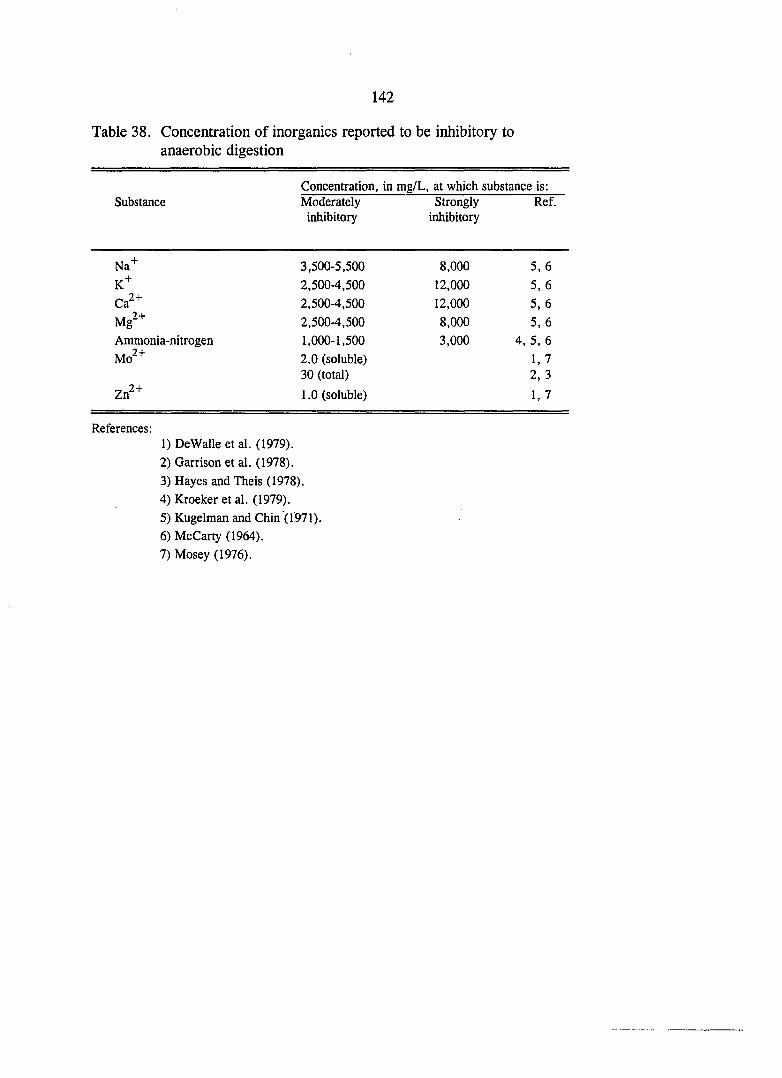
142
Table 38. Concentration of inorganics reported to be inhibitory to anaerobic digestion
Concentration, in mg/L, at which substance is: Substance Moderately Strongly Ref.
inhibitory inhibitory
Na"^ 3,500-5,500 8,000 5, 6
K"*" 2,500-4,500 12,000 5, 6
Ca^"^ 2,500-4,500 12,000 5, 6
Mg^"^ 2,500-4,500 8,000 5, 6
Ammonia-nitrogen 1,000-1,500 3,000 4, 5, 6
Mo^^ 2.0 (soluble) 1,7 30 (total) 2, 3
Zn^"*" 1.0 (soluble) 1,7
References: 1) DeWalle et al. (1979).
2) Garrison et al. (1978).
3) Hayes and Theis (1978).
4) Kroeker et al. (1979).
5) Kugelman and Chin (1971).
6) McCarty (1964).
7) Mosey (1976).
143
methane production under these controls is shown in Figure 38 between days 90 and 105.
During this study, 32 liters of supernatant was slowly replaced by tap water between day
85 and 88 to decrease the toxin concentration accumulated by the toxicity study. Also,
biomass seeding occurred only once (day 85) at a ratio of 0.2. The cumulative methane
production increased marginally on day 90 and then dramatically decreased as time
progressed. Therefore, it appears that the system performance depends on reseeding
biomass obtained from the wastewater treatment plant.
Another interesting observation is that the drainage volume of slurry liquid from the
digested solid bed obviously increased after day 60 (Table 36). Biomass drained from the
solid bed was acclimated to the substrate. Accordingly, the more biomass that was drained
from the solid bed, the more the hydrolysis and acidogenesis rate will be increased. The
reason to increase the drainage volume may be due to the increase of liquid storage space
by the increase of TS and TVS destruction. The decrease of the solid bed may help the
slurry liquid drain out. From this point, the more drainage volume from the solid bed, the
better the system performance.
pH Profile
The pH profile has been discussed previously. In Figure 42, the pH levels above
6.75 and 6.7 comprised most of profile in the holding/recycling and the effluent from the
solid bed. Therefore, the system provided a good pH level at the current TS load.

144
COD Profile
Figure 43 shows that the COD differences between the effluent of the solid bed and
the holding/recycling tank were below 400 mg/L under most conditions. A higher COD
profile appeared between days 55 and 80, but the highest one was still lower than about
1900 mg/L. System performance was not inhibited by high COD levels.
Gas Composition Profile
Figures 44 and 45 show the gas composition profiles for the biofilter and the solid
bed. The content of methane and carbon dioxide measured from the biofilter and the solid
bed approached a constant level a few days after the system was started. For the biofilter,
methane and carbon dioxide content were around 60 and 37%, respectively, under most
the operating conditions, although during some cycles 31 to 39% of carbon dioxide was
found. The content of methane and carbon dioxide from the solid bed comprised 46 and
52%, respectively. From the gas composition profiles, it is hard to comment on the
performance of the system.
Biomass Seeding Ratio and Destruction of TS and TVS
Table 36 addresses the information of TS and TVS destruction under the control
conditions. The TS and TVS destructions reached 47 and 56% on day 30. The BSR and
dilution water were controlled at 0.2 and 10 liters, respectively. The purpose of this
period was to obtain information on methane gas production under normal operating
conditions. As mentioned previously, the highest cumulative methane production occurred
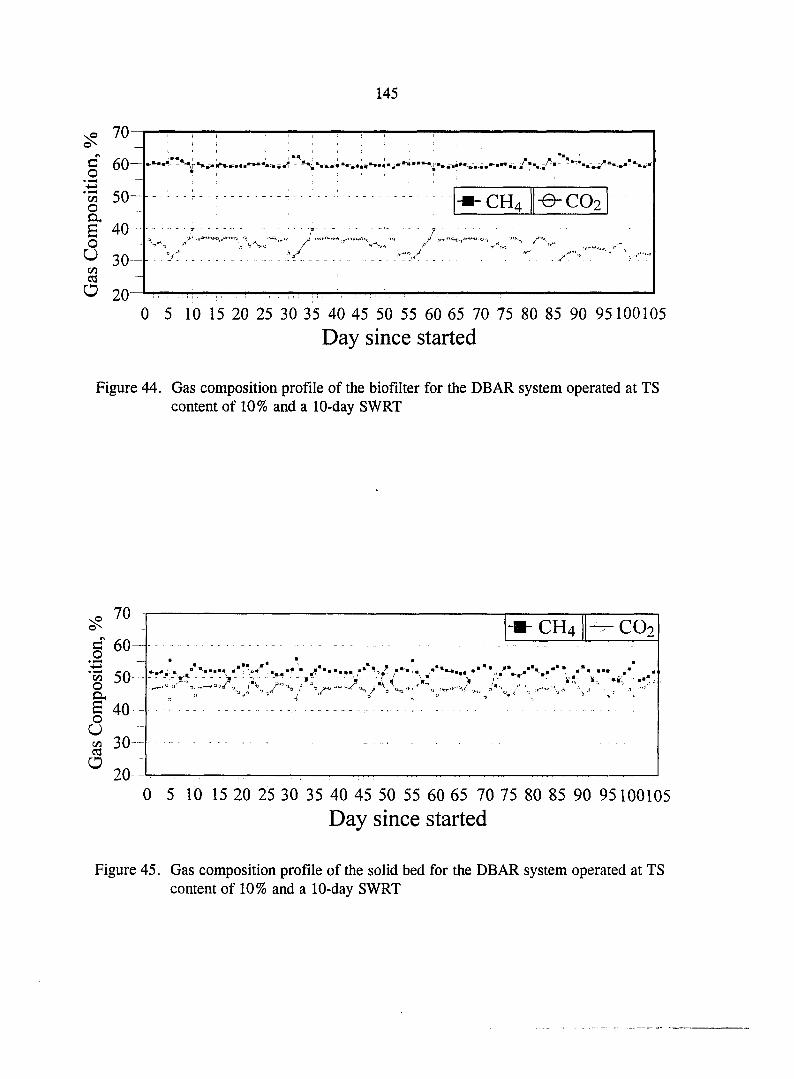
145
S 60-
CH
0 5 10 15 20 25 30 35 40 45 50 55 60 65 70 75 80 85 90 95100105
Day since started
Figure 44. Gas composition profile of the biofilter for the DEAR system operated at TS content of 10% and a 10-day SWRT
70
g 60-
1 50-
I 40 -o U « 30-
o 20
-•-CH4 -^C02
• ^ * •
r, " V ,
• • ••• ,• •
0 5 10 15 20 25 30 35 40 45 50 55 60 65 70 75 80 85 90 95100105
Day since started
Figure 45. Gas composition profile of the solid bed for the DEAR system operated at TS content of 10% and a 10-day SWRT

146
between days 60 and 70. During this time, the TS and TVS destructions were 54% and
61%, respectively. The BSR was decreased from 0.2 to 0.15 in the time period (between
days 60 and 70). Control of BSRs from 0.2 on day 36 to 0.1 on day 85 were shown in
Figure 40. Although the cumulative methane production decreased to 79.7 liters on day
85, the TS and TVS destruction were still maintained at 50% and 58%, respectively.
These two numbers are still higher than the highest numbers of TS (47%) and TVS (56%)
destructions obtained on day 30. The theory that the TS and TVS destruction is a function
of BSR is again supported by these result.
Individual Volatile Fatty Acids
IVFAs, measured from the holding/recycling tank and effluent of the solid bed for
the DBAR operated at TS content of 10% and a 10-day SWRT are shown in Figures 46
and 47. Comparing the IVFA at the two different sampling locations, the effluent from the
solid bed had higher concentrations of propionate and lower concentrations of acetate than
the IVFA in the holding/recycling tank. However, the percentage of theoretical COD of
acetate plus propionate was about 70% of the total COD(Table 38).
Results of the DBAR system at a TS content of 15% and a 10-day SWRT
In this run, the DBAR system was operated at a TS content of 15% and a solid waste
retention time of 10 days. The purposes of this smdy included exploration of the optimum
biomass seeding ratio, effect of aeration, effects of the acidogenic reactor HRT, and
toxicity study. In the results presentation, methane gas is still the most important
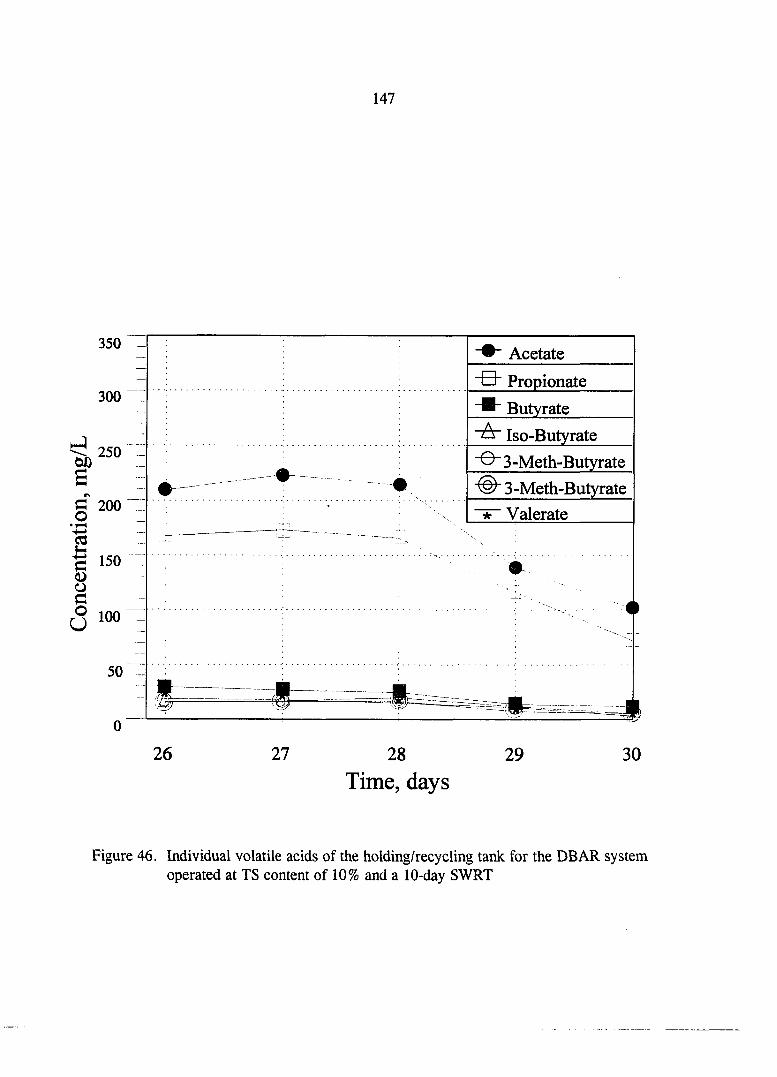
147
Acetate
"B" Propionate
Butyrate Iso-Butyrate
~Q" 3-Meth-Butyrate 3-Meth-Butyrate
*V alerate
0
26 27 28
Time, days 29 30
Figure 46. Individual volatile acids of the holding/recycling tank for the DEAR system operated at TS content of 10% and a 10-day SWRT
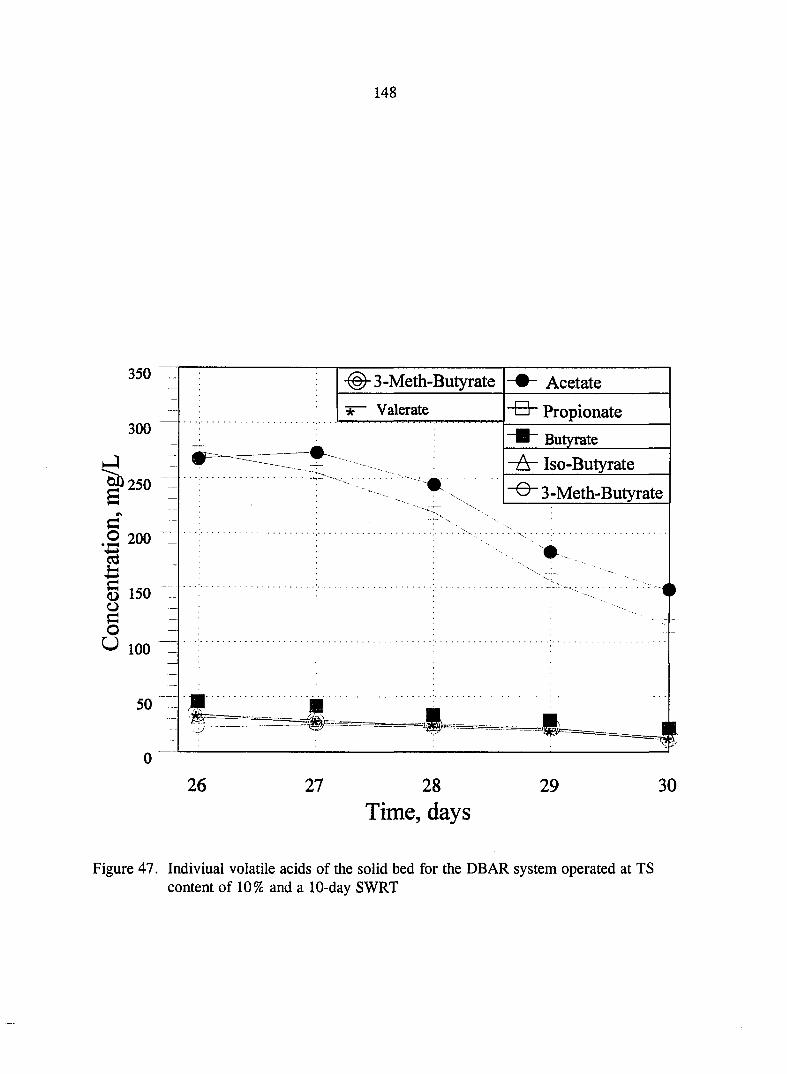
148
350
300
^250
C .2 200
§ 150 O c o 100
50
0
3-Meth-Butyrate Acetate ir~ Valerate "S~ Propionate
Butyrate
-ti- Iso-Butyrate
3-Meth-Butyrate
-
\
- 1 1 J • ^
1 26 27 28
Time, days 29 30
Figure 47. Indiviual volatile acids of the solid bed for the DEAR system operated at TS content of 10% and a 10-day SWRT
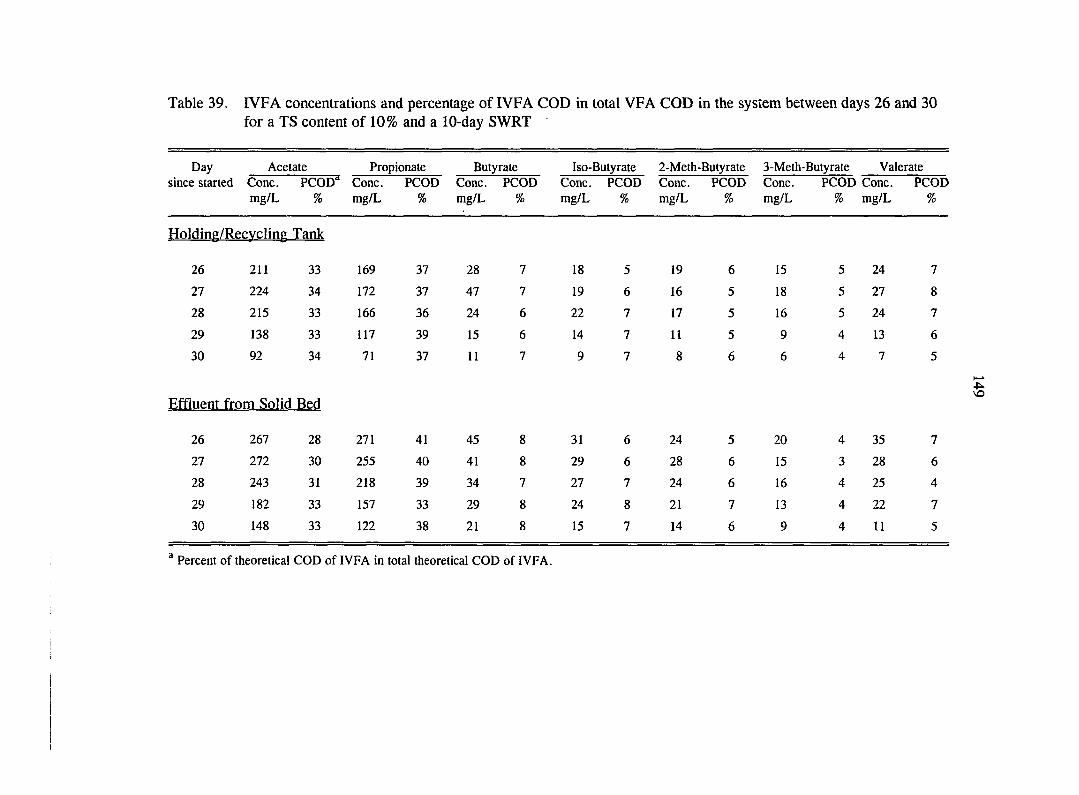
Table 39. IVFA concentrations and percentage of IVFA COD in total VFA COD in the system between days 26 and 30 for a TS content of 10% and a 10-day SWRT
Day Acetate Propionate Butyrate Iso-Butyrate 2-Meth-Butyrate 3-Meth-Butyrate Valerate since started Cone. PCOD" Cone. PCOD Cone. PCOD Cone. PCOD Cone. PCOD Cone. PCOD Cone. PCOD
mg/L % mg/L % mg/L % mg/L % mg/L % mg/L % mg/L %
Holding/Recycling Tank
26 211 33 169 37 28 7 18 5 19 6 15 5 24 7
27 224 34 172 37 47 7 19 6 16 5 18 5 27 8
28 215 33 166 36 24 6 22 7 17 5 16 5 24 7
29 138 33 117 39 15 6 14 7 11 5 9 4 13 6
30 92 34 71 37 11 7 9 7 8 6 6 4 7 5
Effluent from Solid Bed
26 267 28 271 41 45 8 31 6 24 5 20 4 35 7
27 272 30 255 40 41 8 29 6 28 6 15 3 28 6
28 243 31 218 39 34 7 27 7 24 6 16 4 25 4
29 182 33 157 33 29 8 24 8 21 7 13 4 22 7
30 148 33 122 38 21 8 15 7 14 6 9 4 11 5
® Percent of theoretical COD of IVFA in total theoretical COD of IVFA.
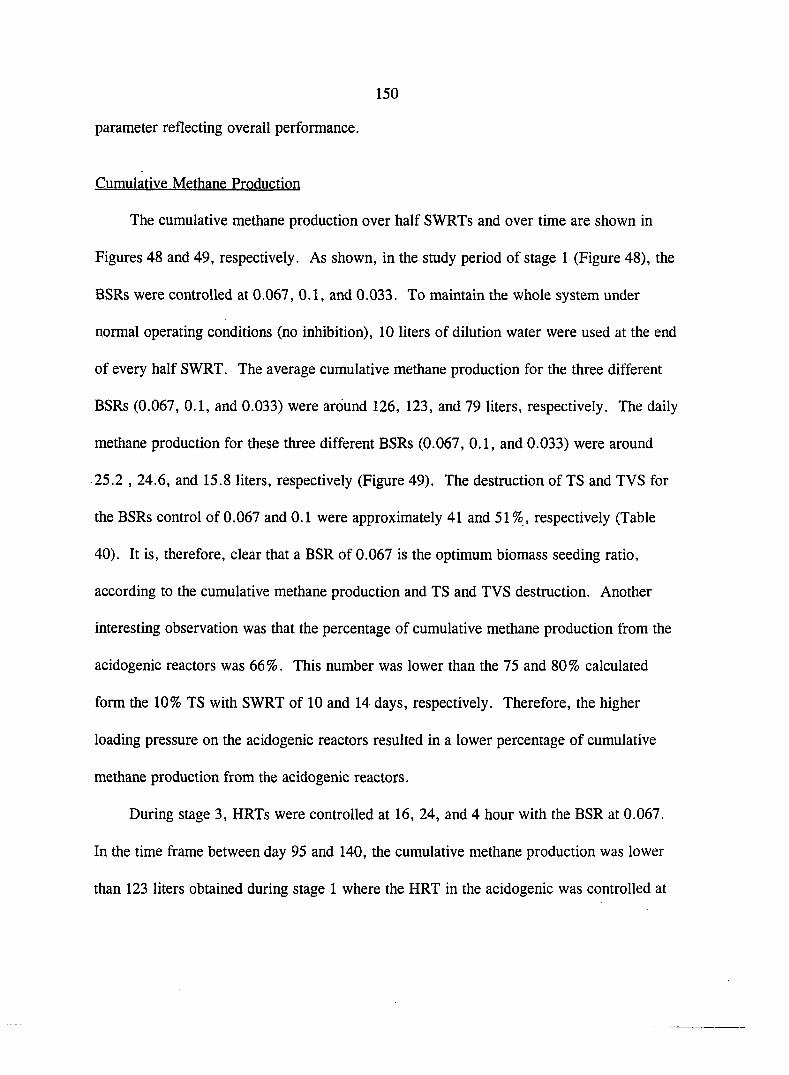
150
parameter reflecting overall performance.
Cumulative Methane Production
The cumulative methane production over half SWRTs and over tune are shown in
Figures 48 and 49, respectively. As shown, in the study period of stage 1 (Figure 48), the
BSRs were controlled at 0.067, 0.1, and 0.033. To maintain the whole system under
normal operating conditions (no inhibition), 10 liters of dilution water were used at the end
of every half SWRT. The average cumulative methane production for the three different
BSRs (0.067, 0.1, and 0.033) were around 126, 123, and 79 liters, respectively. The daily
methane production for these three different BSRs (0.067, 0.1, and 0.033) were around
25.2 , 24.6, and 15.8 liters, respectively (Figure 49). The destruction of TS and TVS for
the BSRs control of 0.067 and 0.1 were approximately 41 and 51% , respectively (Table
40). It is, therefore, clear that a BSR of 0.067 is the optimum biomass seeding ratio,
according to the cumulative methane production and TS and TVS destruction. Another
interesting observation was that the percentage of cumulative methane production from the
acidogenic reactors was 66%. This number was lower than the 75 and 80% calculated
form the 10% TS with SWRT of 10 and 14 days, respectively. Therefore, the higher
loading pressure on the acidogenic reactors resulted in a lower percentage of cumulative
methane production from the acidogenic reactors.
During stage 3, HRTs were controlled at 16, 24, and 4 hour with the BSR at 0.067.
In the time frame between day 95 and 140, the cumulative methane production was lower
than 123 liters obtained during stage 1 where the HRT in the acidogenic was controlled at
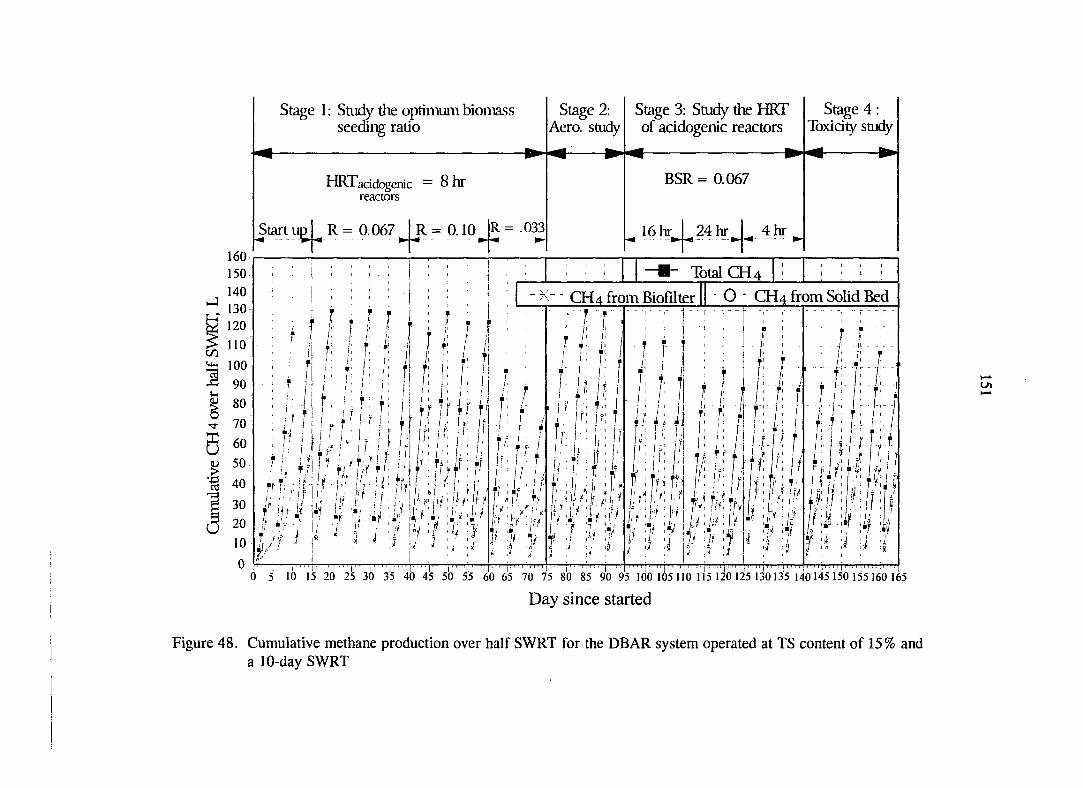
160
150
140
130
120
110
100
90
80
70
60
50
40
30
20
10
0
8. I
Stage 1; Study tlie optimum bioniass seeding ratio
HRTacidogenic — 8 hi reactors
Stage 2: Aero, study
Stage 3: Stucfy the HRT of acidogenic reactors
Stage 4:
Toxicity stucfy^
Startup! R= 0.067
BSR= 0.067
R = 0.10 R = -033
Total CH4
CH4 from Biofilter H Q CH4 from Solid Bed
I: •I • P 'ly- U f f
5 16 15 26 25 30 35 40 45 sb 55 60 65 70 75 80 85 90 95 100 lis 110 115 120 125 do 135 140 145 150 155 I6O 1(
Day since started
umulative methane production over half SWRT for the DBAR system operated at TS content of 15 % 10-day SWRT

4000
.M'
II-! I
5 10 15 20 25 30 35 40 45 50 55 ® 65 70 75
i ! I I ! I ! ! I I 1 I ! 85 90 95 100 105 110 115 120 125 130 135 140 145 150 155 160 165 170
Time, days
Figure 49. Cumulative methane production over time for the DEAR system operated at a TS content of 15% and a 10-day SWRT
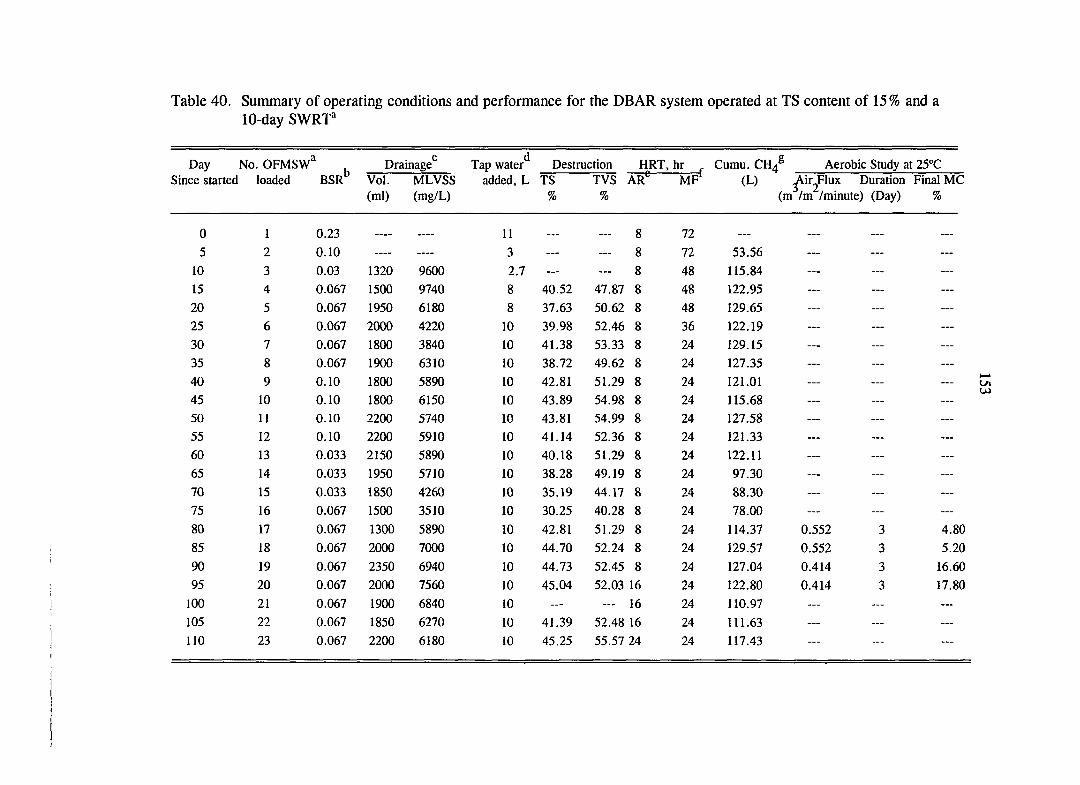
Table 40. Summary of operating conditions and performance for the DEAR system operated at TS content of 15% and a 10-day SWRT'
Day No. OFMSW^ Drainage*^ Tap water*^ Destruction HRT, hr Cumu. CH4® Aerobic Study at 25°C Since started loaded BSR VoL MLVSS added, L TS TVS AR® MF (L) ^irjlux Duration Final MC
(ml) (mg/L) % % (m /m /minute) (Day) %
0 1 0.23 — — 11 — 8 72 — ... ... ...
5 2 0.10 — 3 — 8 72 53.56 — ... ...
10 3 0.03 1320 9600 2.7 — 8 48 115.84 — — —
15 4 0.067 1500 9740 8 40.52 47.87 8 48 122.95 — — —
20 5 0.067 1950 6180 8 37.63 50.62 8 48 129.65 — — —
25 6 0.067 2000 4220 10 39.98 52.46 8 36 122.19 — — —
30 7 0.067 1800 3840 10 41.38 53.33 8 24 129.15 — — —
35 8 0.067 1900 6310 10 38.72 49.62 8 24 127.35 — — —
40 9 0.10 1800 5890 10 42.81 51.29 8 24 121.01 — — —
45 10 0.10 1800 6150 10 43.89 54.98 8 24 115.68 — — —
50 11 0.10 2200 5740 10 43.81 54.99 8 24 127.58 — — —
55 12 0.10 2200 5910 10 41.14 52.36 8 24 121.33 — — —
60 13 0.033 2150 5890 10 40.18 51.29 8 24 122.11 — — —
65 14 0.033 1950 5710 10 38.28 49.19 8 24 97.30 — — —
70 15 0.033 1850 4260 10 35.19 44.17 8 24 88.30 — — —
75 16 0.067 1500 3510 10 30.25 40.28 8 24 78.00 — — —
80 17 0.067 1300 5890 10 42.81 51.29 8 24 114.37 0.552 3 4.80
85 18 0.067 2000 7000 10 44.70 52.24 8 24 129.57 0.552 3 5.20
90 19 0.067 2350 6940 10 44.73 52.45 8 24 127.04 0.414 3 16.60
95 20 0.067 2000 7560 10 45.04 52.03 16 24 122.80 0.414 3 17.80
100 21 0.067 1900 6840 10 — — 16 24 110.97 — — —
105 22 0.067 1850 6270 10 41.39 52.48 16 24 111.63 — — —
no 23 0.067 2200 6180 10 45.25 55.57 24 24 117.43 — — —
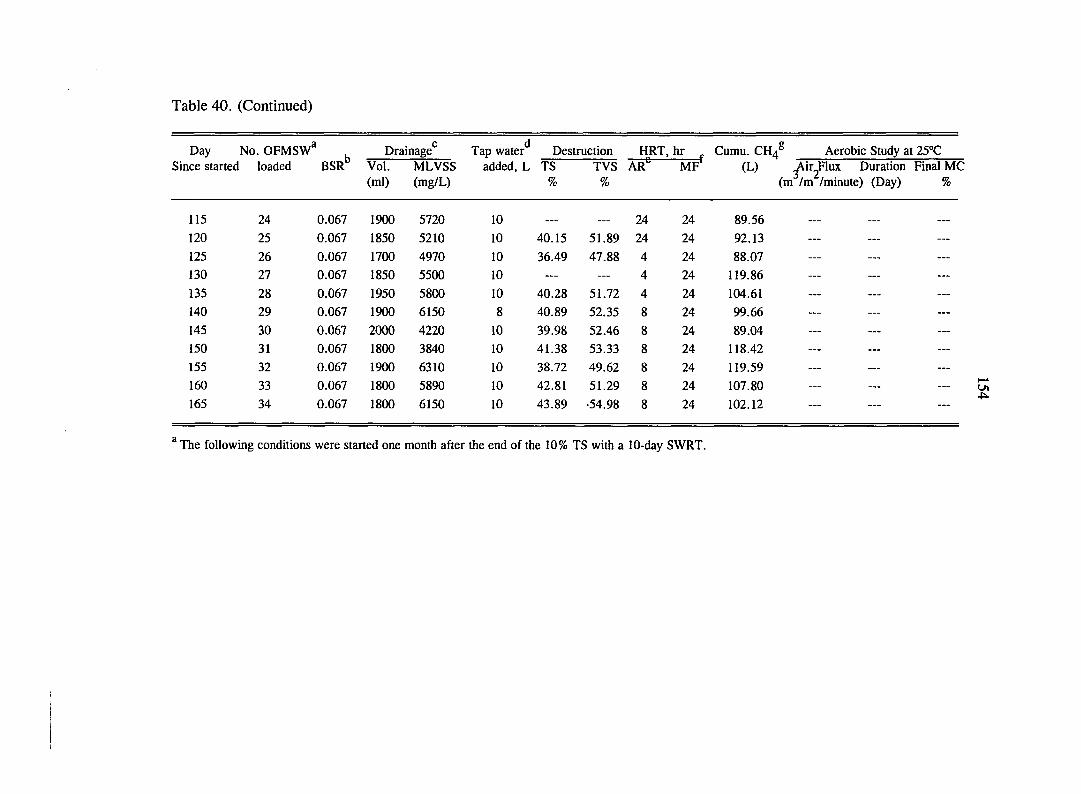
Table 40. (Continued)
Day No. OFMSW^ Drainage^ Tap water Destruction HRT, hr Cumu. CH4® Aerobic Study at 25°C Since started loaded BSR Vol. MLVSS added, L TS TVS AR MF (L) Airjlux Duration Final MC
(ml) (mg/L) % % (m /m /minute) (Day) %
115 24 0.067 1900 5720 10 — — 24 24 89.56
120 25 0.067 1850 5210 10 40.15 51.89 24 24 92.13
125 26 0.067 1700 4970 10 36.49 47.88 4 24 88.07
130 27 0.067 1850 5500 10 — — 4 24 119.86
135 28 0.067 1950 5800 10 40.28 51.72 4 24 104.61
140 29 0.067 1900 6150 8 40.89 52.35 8 24 99.66
145 30 0.067 2000 4220 10 39.98 52.46 8 24 89.04
150 31 0.067 1800 3840 10 41.38 53.33 8 24 118.42
155 32 0.067 1900 6310 10 38.72 49.62 8 24 119.59
160 33 0.067 1800 5890 10 42.81 51.29 8 24 107.80
165 34 0.067 1800 6150 10 43.89 •54.98 8 24 102.12
^ The following conditions were started one month after the end of the 10% TS with a 10-day SWRT.
155
8 hours. It appears that the optimum HRT for the acidogenic reactors, under the operating
conditions of a TS content of 15% and a 10-day SWRT, is 8 hour. In the toxicity study of
stage 4, 32 liters of tap water were used to dilute the toxins concentration between days
140 and 142. The HRT and BSR were controlled at 8 hr and 0.067, respectively. The
cumulative methane production increased from about 89 liters to the highest value of 120
liters on day 155 and then decreased to 102 liters. The average cumulative methane
production over half SWRT was about 107 liters, which is much less than the average (123
liters) obtained during stage 1. Based on methane production, the metabolism rate
decreased after day 155, which was the begirming of the 4th half SWRT cycle. In
addition, the highest cumulative methane production of 120 liters within the smdy periods
was still lower than 123 liters. Hence, it appeared that 32 liters of dilution water was not
enough to make the cumulative methane production higher than the maximum cumulative
methane production (130 liters) of stage 1.
Aerobic Smdy
The aerobic smdy was conducted between days 80 and 95. Two different air flux
rates were used (0.414 and 0.552 m^/m^/min.) over a 3-day period. The average
destruction of TS (44%) and TVS (52%) measured at the end of the aerobic process were
not higher than the destruction of TS (44%) and TVS (53%) during the stage 1 (Table 40).
Therefore, it is obvious that the destruction of TS and TVS did not increase from the
aerobic process. However, calculation of the remaining biodegradable organic fraction
before applying the aerobic process was about 18%. Accordingly, the digested solid waste
156
was not completely stabilized prior to aerobic treatment. Hence, the reason that the
aerobic reactions were not initiated was not due to a lack of degradable organic material or
the remaining organics in the digested solid wastes were difficult to be further stabilized.
Another possible reason that TS and TVS destruction were not enhanced could be that the
time period was not long enough to initiate the aerobic reactions or the air flux was too
high so that the moisture content of the solid waste dropped below the minimum
requirement (35 % moisture content) within too short a time. This hypothesis needs to be
further studied. The other reason could be that the remaining organics were not suitable
for aerobic treatment. The moisture content was decreased to lower than 18% over the
control conditions. Therefore, this aerobic process is suitable to dry out digested solid
waste to a moisture content lower than 10%.
pH Profile
Shown in Figure 50 is the pH profile for the holding/recycling tank and the effluent
from the solid bed. The pH ranged from 6.3 to 6.6 for the holding/recycling tank between
day 15 and 65 during which the performance were quiet stable. On the other hand, the pH
ranged from 6.0 to 6.4 measured from the effluent of the solid bed during the same time
frame. The pH proflle since then fluctuated because the performance was not stable. It is,
therefore, hard to comment on the reasons why the pH profile after day 80 was lower than
that between day 15 and day 80. In addition, the pH profile during the toxicity study after
day 155 was lower than the pH profile between days 85 and 150. This could be the result
of the accumulation of soluble COD in the liquid phase caused by the increasing toxin
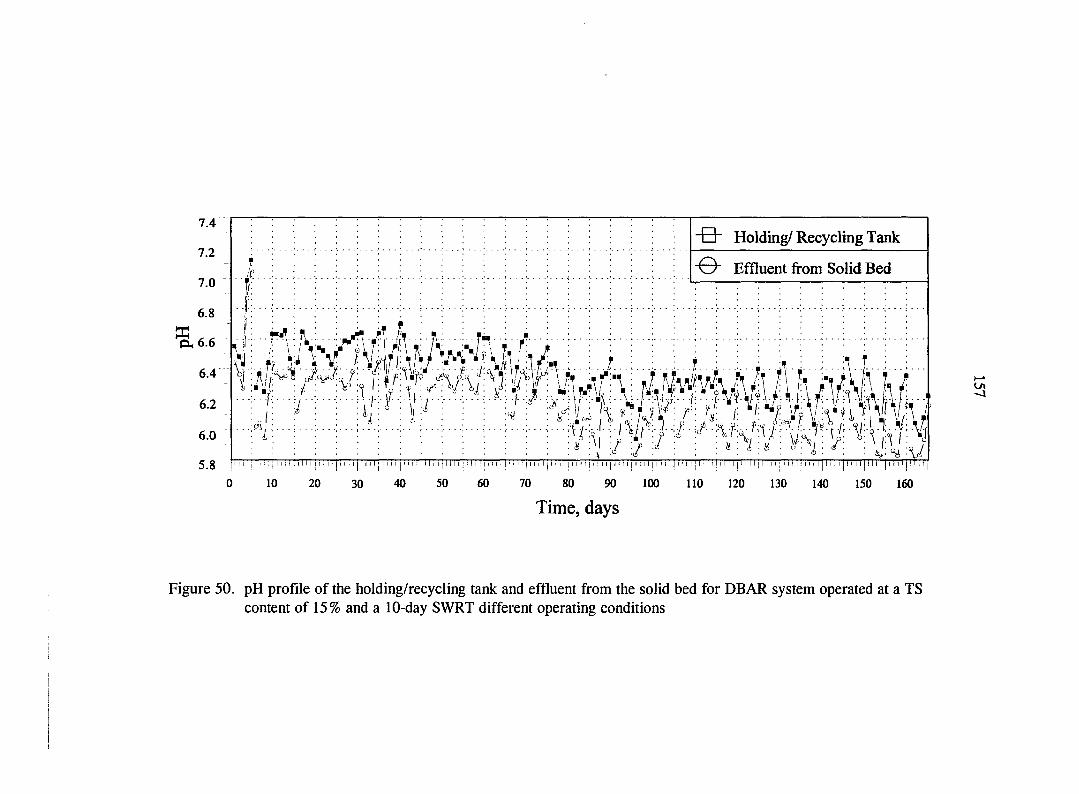
"B" Holding/ Recycling Tank
"O" Effluent from Solid Bed
0 10 20 30 40 50 60 70 80 90 100 110 120 130 140 150 160
Time, days
Figure 50. pH profile of the holding/recycling tank and effluent from the solid bed for DEAR system operated at a TS content of 15% and a 10-day SWRT different operating conditions
158
concentrations, which inhibited methanogenesis. This can be identified by the COD profile
shown in Figure 51. Comparing the pH profile measured from the effluent of the solid bed
among the three operating conditions (10% TS with a 14-day SWRT, 10% TS with a 10-
day SWRT, and 15% TS with a 10-day SWRT), 15% TS with a 10-day SWRT showed the
lowest profile in the holding/recycling tank and the effluent from the solid bed. This
finding indicates that the pH in the system decreased as a higher TS content was applied to
the system.
COD Profile
The COD profile for the holding/recycling tank and the effluent from the solid bed,
as shown in Figure 51, does not show much difference between each half SWRT cycle
after day 35. The COD measured from the effluent of the solid bed ranged from 1600
mg/L to 900 mg/L. For the holding/recycling tank, the COD ranged from 1200 mg/L to
700 mg/L. However, the COD profile abnormally increased after day 155 to its highest
point of 2700 mg/L and 2100 mg/L for the effluent of the solid bed and the
holding/recycling tank, respectively. This was explained previously during the pH profile
discussion.
Gas Composition Profile
The gas composition profile for the holding/recycling tank and the solid bed are
illustrated in Figures 52 and 53. In most of the half SWRT cycles, the methane content of
the biofilter was above 61% and carbon dioxide content ranged from 35 to 40%. For the
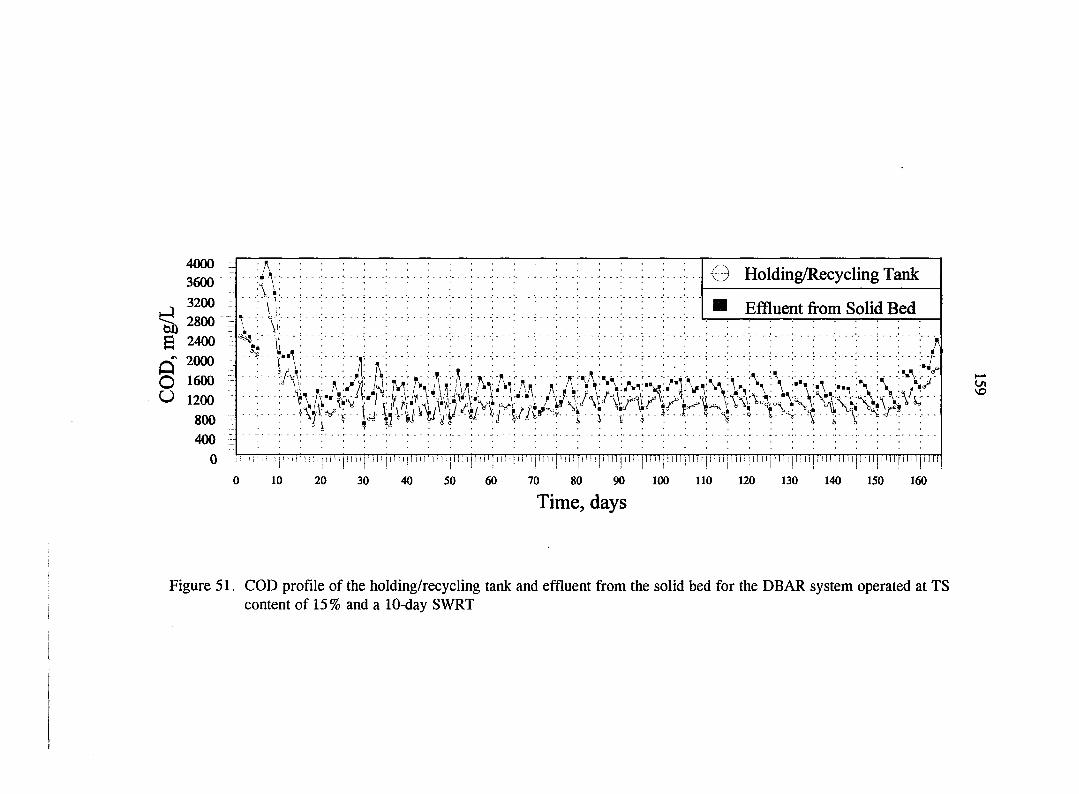
00
4000
3600
3200
2800
g 2400
p" 2000
O 1600 1200
800
400
A :
\ i :
V'
•v"V
if
I h
! n 11 n n 11111 imn n n I n
. I I i
11!! 1111111 n I
Holding/Recycling Tank
Effluent from Solid Bed
• %
\ -i
f j
A- • •
0 10 20 30 40 50 60 70 80
I I I I I i I I I I I I I ! I I I I I I I I I I M I j M I I I I I I I I I I I I
90 100 110 120 130 140 150 160
Time, days
VO
Figure 51. COD profile of the holding/recycling tank and effluent from the solid bed for the DEAR system operated at TS i content of 15% and a 10-day SWRT i
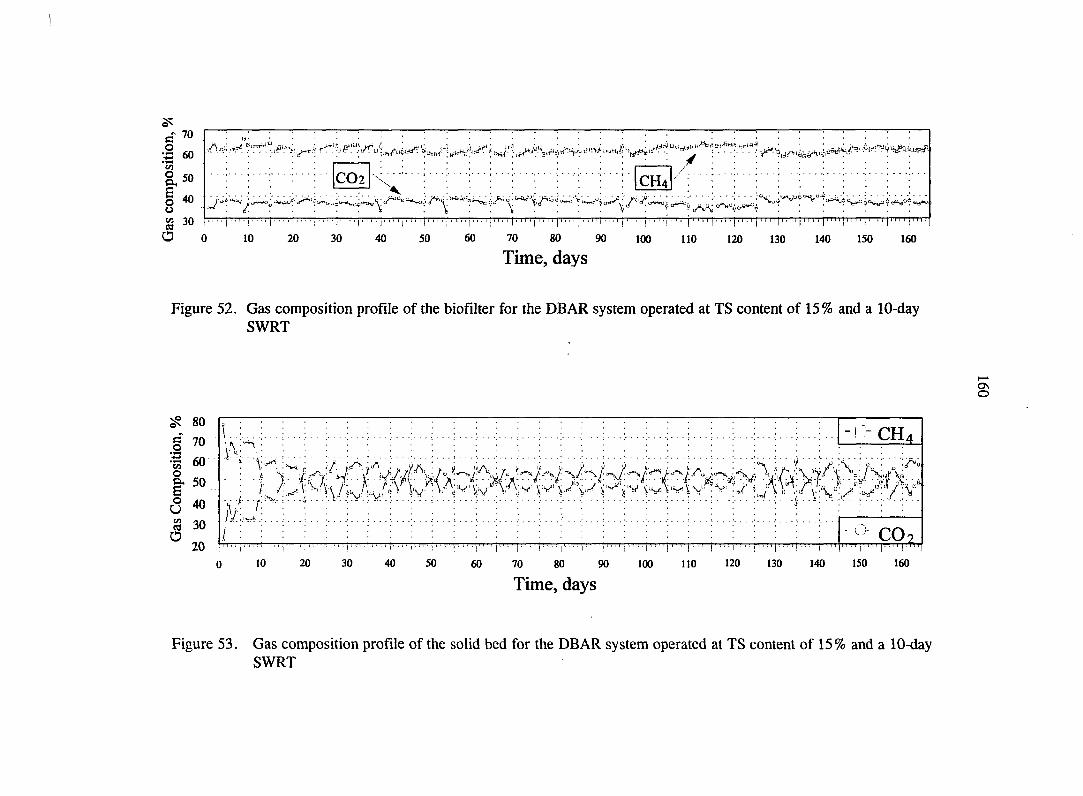
60
110 140 150 160 100 120 130
Time, days
Figure 52. Gas composition profile of the biofilter for the DBAR system operated at TS content of 15% and a 10-day SWRT
^ 80
§ 70
1 60 0 1 50
c3 40 rt 30 O
20 0 10 20 30 40 SO 60 70 80 90 100 110 120 130 140 ISO 160
Time, days
1 - ! 1- CH4 - ! 1- CH4
1- ^ . x i "V 5"V" v'v
A. • > 'v^'. 'V'\ i >?
/'x^ • / V y\'
1 Liwi';
J - CO9
Figure 53. Gas composition profile of the solid bed for the DBAR system operated at TS content of 15% and a 10-day SWRT
161
solid bed, the methane content increased from 45 to 55% over the course of each half
cycle. Lower methane content and higher carbon dioxide content were shown during
thetoxicity study. The difference, however, was not significant..
Results of Hydrolysis and Acidogenesis on Treatment of OFMSW
This stody was set up to explore the optimum pH for hydrolysis and acidogenesis of
OFMSW and to compare the potential methane production with the study of 10% TS
operated at a 10-day SWRT. The system set-up has been discussed in Chapter III. In this
smdy, a TS of 10%, a 10-day SWRT, and an 8-hour HRT of the acidogenic reactors were
used to operate the system. In addition, the biofilter was removed from the operational
line, one tap water tank with nutrients and trace metals and one volatile acids discharge
tank were put into operation. The data presented in this section includes cumulative
methane production at different pH levels (6.4, 6.0, and 5.6) controlled in the
holding/recycling tank, cumulative soluble COD in the volatile acids storage tank, and
cumulative COD from the methane and soluble COD in the volatile acids storage tank.
To compare the results at different operating conditions, the cumulative methane
production was converted into COD on an equivalent basis.
Cumulative Methane Production
Figure 54 shows the highest cumulative methane production was observed at a pH of
6.0. The average methane production for the three different operating conditions were
23.5 liters (pH 5.6), 43.3 liters (pH 6.0), and 34.7 liters (pH 6.4). Theoretically, pH
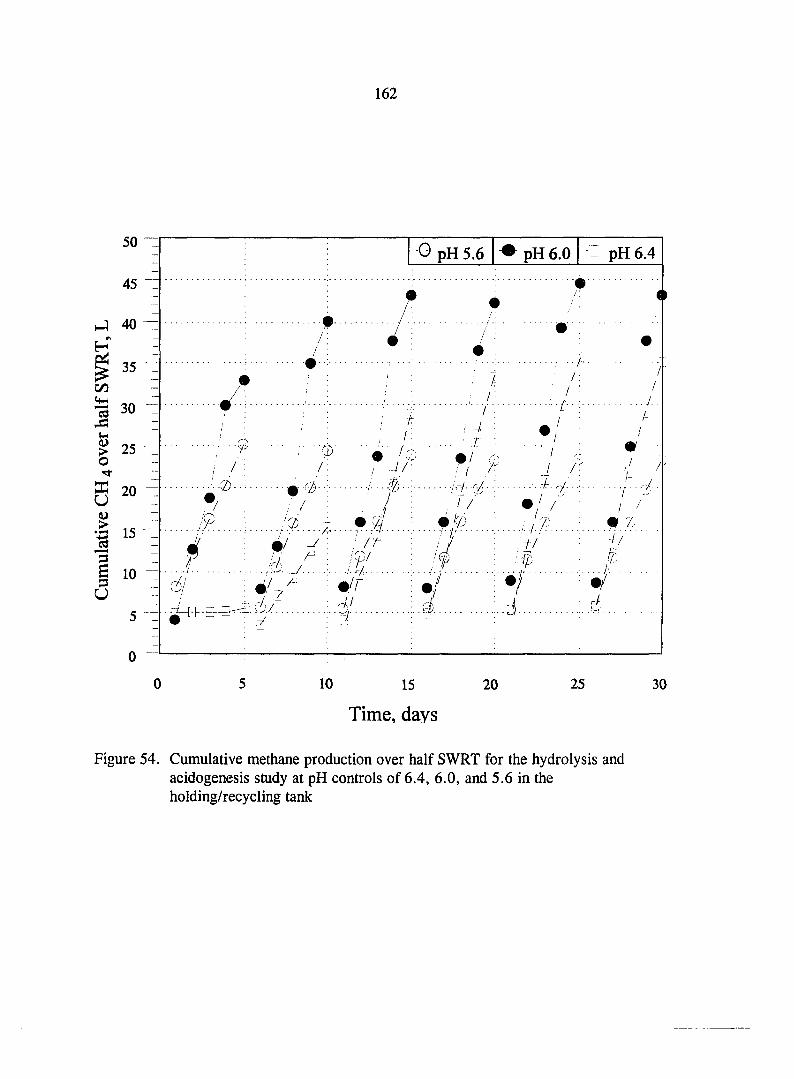
162
50
45
hJ 40
H g 35
CO 13 30 xt Ui (L» > 25
(U 15
3 I 10
CJ 5
0
•0 pH 5.6 • pH 6.0 - pH6.4
1
4 / • <
i <
7 /
j
' / • / •
" •
w 1 / 7
/ ; /
/ /
/ / •
: c / ' '• '
; / ; /
/ / -/ ' ..r -
L"
•; !-
1
•
: c / ' '• '
^ • A ' / . J /
Wr
^ / ' -/
• f?
: / 19^...
. j , /V /•
A " / /
« Z
f
>
: / f
iv' .
'4
;-/•/ rip
-//
(6i • 0 '
rU •/ ;i
4
10 15
Time, days
20 25 30
Figure 54. Cumulative methane production over half SWRT for the hydrolysis and acidogenesis study at pH controls of 6.4, 6.0, and 5.6 in the holding/recycling tank

163
controlled at 6.4 should have the highest cumulative methane production since the
methanogenic activity is inhibited at pH levels lower than 6.5 (Speece 1983). However,
the results from this study were country to this concept. This phenomenon may be
explained by the fact that the highest conversion of solid waste into soluble COD
(hydrolysis end products and volatile fatty acids) was at a pH of 6.0, and the methanogens
gradually acclimated to the environmental condition at a pH of 6.0,
Gas Composition Profile
The methane contents decreased from 52 to 55% at pH 6.4 to 43 to 51% at pH 5.6
(Figure 55). It is clear that the methane contents decreased as the pH levels were lowered.
Cumulative COD
The cumulative COD from methane production and liquid COD is demonstrated in
Figure 56. As shown in this figure, pH control at 6.0 showed on average cumulative COD
of 242 g which is higher than 214 g (pH 6.4) and 146 g (pH 5.6). By considering the
chain reaction of anaerobic degradation, methane was the end product of the anaerobic
reactions and soluble COD was the end hydrolysis and acidogenic products. Therefore,
the highest cumulative COD, obtained from the transformed cumulative methane
production and the cumulative soluble COD in the storage tank, represents the highest
hydrolysis and acidogenesis rate. Therefore, control of pH at 6.0 in the holding/recycling
tank had the highest hydrolysis and acidogenesis rate on OFMSW.
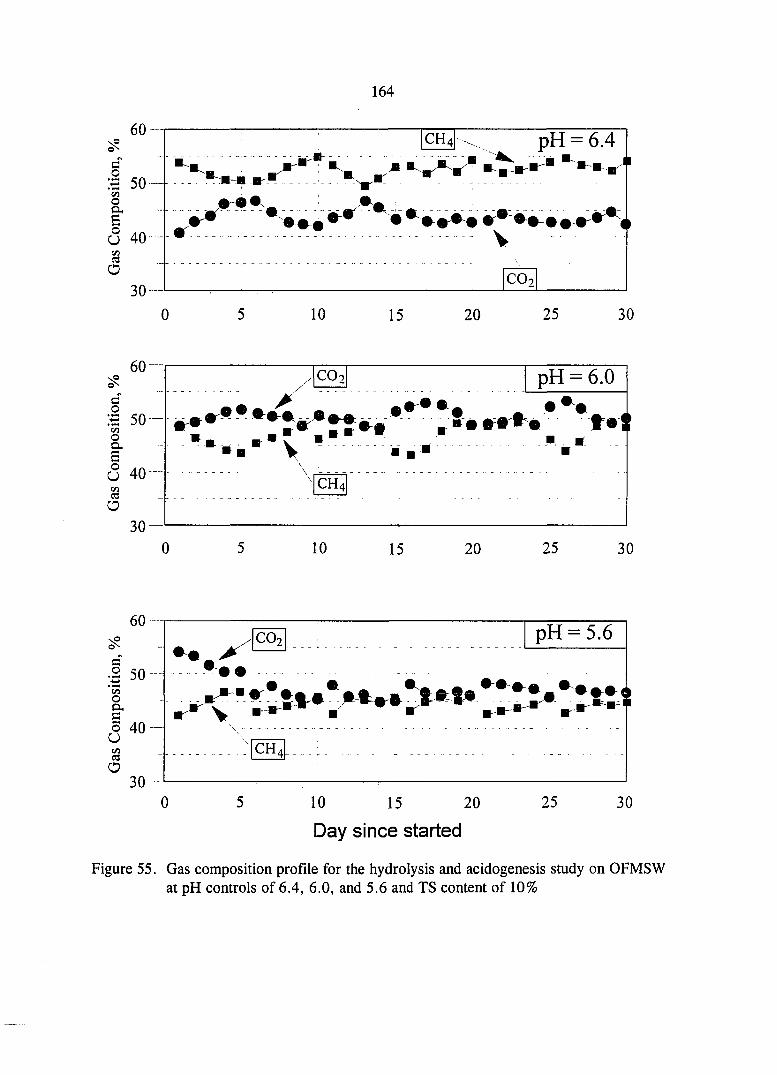
164
S 50
10 15 20 25 30
60
c o S 50
(/5 O a, E U 40-
C/3 cd o
/ C02 pH = 6.0
• •
30
ICH4
10 15 20 25 30
60
c .2 50 -'33 o D, P
ca 21" ~ - - — . ^ - . . - . - -a 30-J — — ^
0 5 10 15 20 25 30
Day since started
Figure 55. Gas composition profile for the hydrolysis and acidogenesis study on OFMSW at pH controls of 6.4, 6.0, and 5.6 and TS content of 10%
pH = 5.6
n • " m • n • " B
CH,
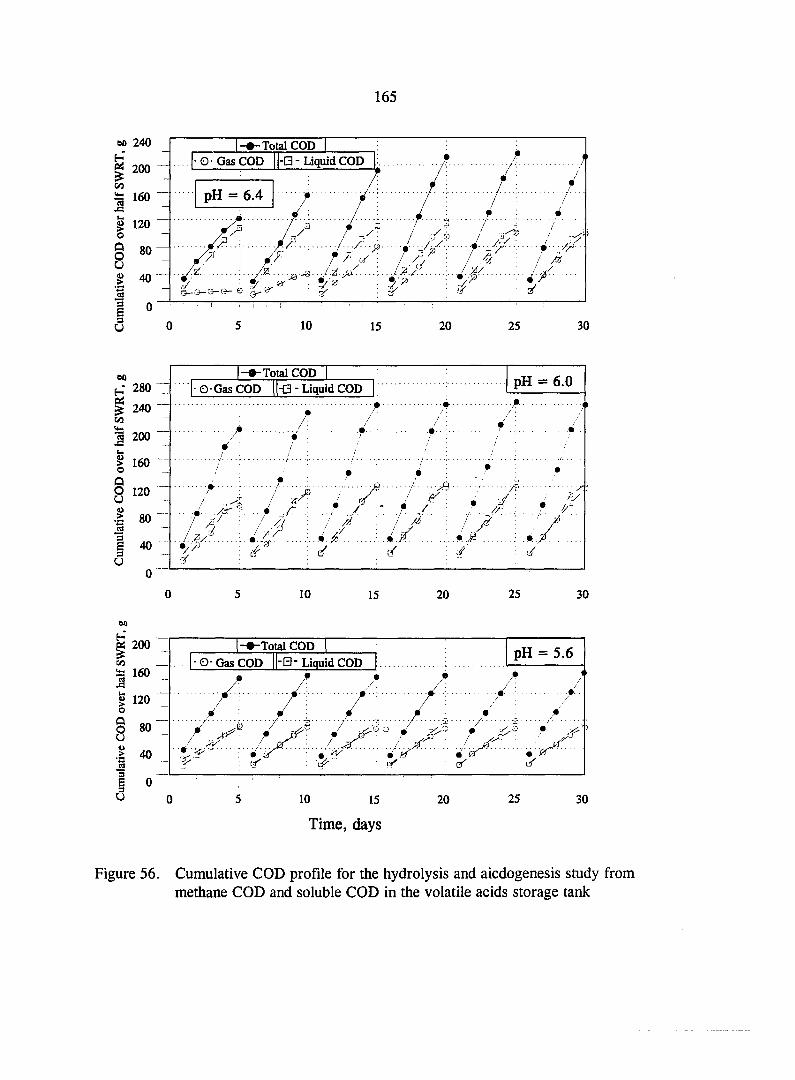
165
Total COD -B - Liquid COD • O- Gas COD
200
pH = 6.4 160 ""
S 120 ~
40
to H 280
240 Ui % 200 i.. Q O 120 u
80
40
0
e a U
Total COD 1 pH = 6.0 • O * Gas COD -• - Liquid COD pH = 6.0
i A /i ... /: /. • . /
/ r: / : ^ ;
/ : / : /
: i • •
/ I • /- i f:: •.. / , TV
f
/J / ' / /
.,///' ... / / : ! J i/A. • z'
r/ ^ (/ : J l/
10 15 20 25 30
60
H 200
CO is 160 .a g 120 o Q O O <u >
•a -S 3 U
80
40
0
-Total COD • O- Gas COD ll'S- Liquid COD
-/•
/' /a . . /.
(.r
• /
pH = 5.6
• ly er' r:,.
10 15
Time, days
20 25 30
Figure 56. Cumulative COD profile for the hydrolysis and aicdogenesis smdy from methane COD and soluble COD in the volatile acids storage tank
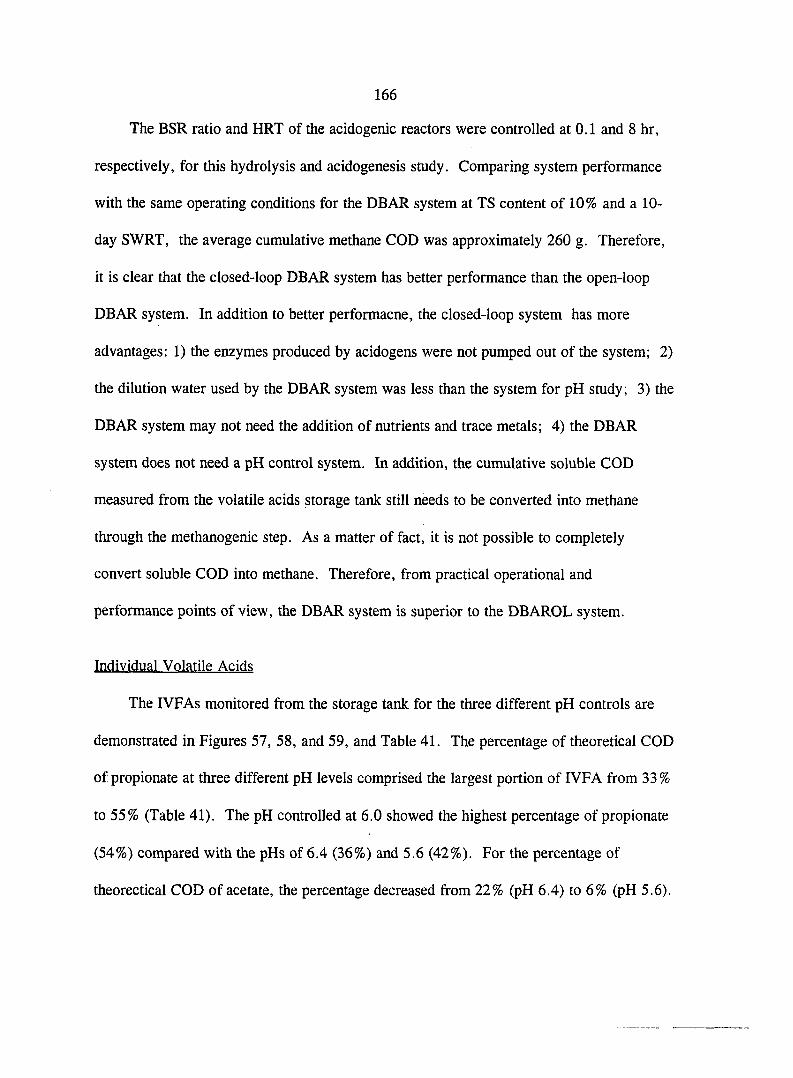
166
The BSR ratio and HRT of the acidogenic reactors were controlled at 0.1 and 8 hr,
respectively, for this hydrolysis and acidogenesis study. Comparing system performance
with the same operating conditions for the DEAR system at TS content of 10% and a 10-
day SWRT, the average cumulative methane COD was approximately 260 g. Therefore,
it is clear that the closed-loop DEAR system has better performance than the open-loop
DEAR system. In addition to better performacne, the closed-loop system has more
advantages: 1) the enzymes produced by acidogens were not pumped out of the system; 2)
the dilution water used by the DEAR system was less than the system for pH study; 3) the
DEAR system may not need the addition of nutrients and trace metals; 4) the DEAR
system does not need a pH control system. In addition, the cumulative soluble COD
measured from the volatile acids storage tank still needs to be converted into methane
through the methanogenic step. As a matter of fact, it is not possible to completely
convert soluble COD into methane. Therefore, from practical operational and
performance points of view, the DEAR system is superior to the DBAROL system.
Individual Volatile Acids
The IVFAs monitored from the storage tank for the three different pH controls are
demonstrated in Figures 57, 58, and 59, and Table 41. The percentage of theoretical COD
of propionate at three different pH levels comprised the largest portion of IVFA from 33%
to 55% (Table 41). The pH controlled at 6.0 showed the highest percentage of propionate
(54%) compared with the pHs of 6.4 (36%) and 5.6 (42%). For the percentage of
theorectical COD of acetate, the percentage decreased from 22% (pH 6.4) to 6% (pH 5.6).
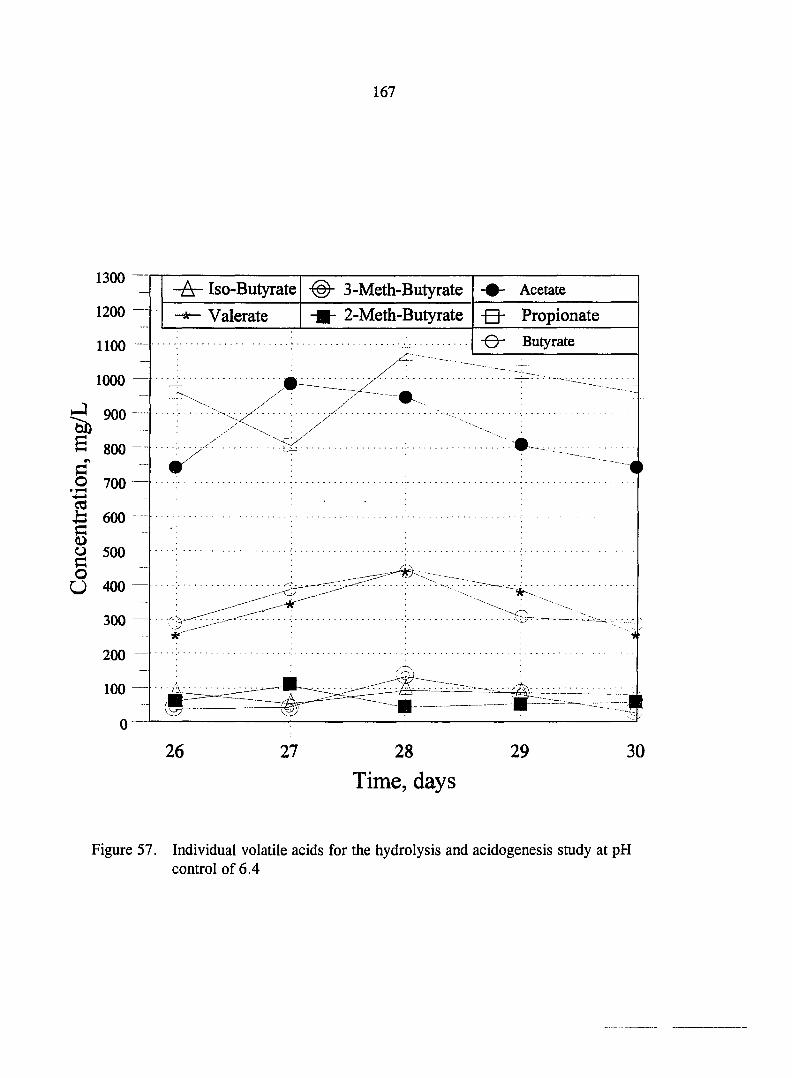
167
1300 —r~i - -2^ Iso-Butyrate 3-Meth-Butyrate Acetate
1200 Valerate 2-Meth-Butyrate -g- Propionate
1 1 0 0 - 0 - B u tyrate
1000
900 bO S 800
.o 700
U 600 C (D O 500 C o O 400
300
200
100 [ 0
26 27 28 29 30
Time, days
-2^ Iso-Butyrate 3-Meth-Butyrate Acetate
Valerate 2-Meth-Butyrate -g- Propionate
-0- Butyrate
Figure 57. Individual volatile acids for the hydrolysis and acidogenesis study at pH control of 6.4
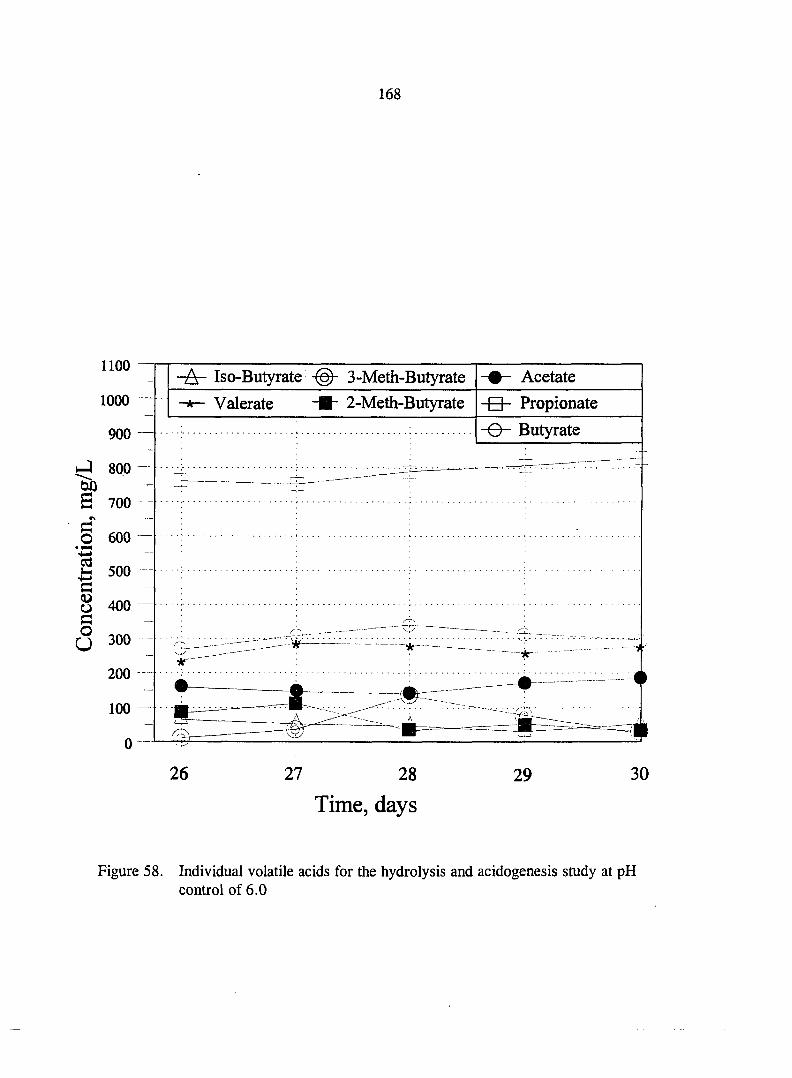
168
_ -2^ Iso-Butyrate 3-Meth-Butyrate Acetate
1000 ~ Valerate 2-Meth-Butyrate -Q- Propionate
900 — ; -0- Butyrate
J 800 ^ 2: J ^-rr^mr:-:Tr:T7 " -
B 700 - : : f N — .
O 600 — • - i
5 500 c - : o 400 — ; : c - ; ; u 300 - -
200 ^ - ^
100 .. .rT
0 ^ ^ ^
26 27 28 29 30
Time, days
-2^ Iso-Butyrate -@- 3-Meth-Butyrate -%- Acetate
Valerate 2-Meth-Butyrate -Q- Propionate Riifi/rntf*
_
" '
— —
--
<
- ^ 1
-
1- A m
--
S==E==?ir-^^^--.i=- .=1
Figure 58. Individual volatile acids for the hydrolysis and acidogenesis study at pH control of 6.0

169
1100
1000
900
800
S 700 «N
c o 600 'i ^ 500
<L> O 400
o O 300
200
100
0
-2^ Iso-Butyrate 3-Meth-Butyrate
Valerate 2-Meth-Butyrate
G-
Acetate
-0- Propionate
-0" Butyrate
—
26 27 28
Time, days
29 30
Figure 59. Individual volatile acids for the hydrolysis and acidogenesis study at pH control of 5.6

Table 41. IVFA concentrations and percentage of IVFA COD in total VFA COD in the system between days 26 and 30 for a TS content of 10% and a 10-day SWRT
Day Acetate Propionate Butyrate Iso-Butyrate 2-Meth-Butyrate 3-Meth-Butyrate Valerate since started Cone. PCOD" Cone. PCOD Cone. PCOD Cone. PCOD Cone. PCOD Cone. PCOD Cone. PCOD
mg/L % mg/L % mg/L % mg/L % mg/L % mg/L % mg/L %
pH = 6.4
26 740 22 960 40 280 14 80 5 60 3 40 2 260 14
27 970 25 810 30 380 17 60 3 120 6 40 2 350 17
28 890 19 1070 33 440 16 100 4 40 2 140 6 450 19
29 810 21 1020 37 310 13 90 4 50 2 80 4 380 18
30 740 22 960 40 280 14 80 5 60 3 40 2 260 14
pH = 6.0
26 310 9 1330 55 260 13 50 3 40 2 0 0 320 18
27 390 10 1520 53 280 12 60 3 30 1 10 0 440 21
28 460 10 1590 48 350 13 100 4 40 2 140 6 450 18
29 210 5 1560 57 240 11 90 5 50 3 20 1 380 19
30 130 4 1380 58 220 11 90 5 50 3 30 2 290 17
pH = 5.6
26 160 7 760 44 270 19 70 6 80 6 10 1 230 18
27 150 5 750 39 310 19 60 4 120 9 40 3 290 20
28 140 5 780 39 340 21 50 4 40 5 140 7 280 19
29 170 6 810 44 310 20 40 3 50 3 70 4 250 18
30 180 7 830 45 290 19 60 4 30 2 40 3 280 20
® Percent of theoretical COD of IVFA in total theoretical COD of IVFA.

171
From the above discussion, it is obvious that the composition of VFA is a function of pH.
For the percentage of theoretical COD of carbon-chain numbers higher than 3, butyrate
plus valerate comprised 31% for the pHs of 6.4 and 6.0 and reached 38% at a pH of 5.6.
In addition, the percentages of theoretical COD of carbon-chain numbers higher than 3
were higher than 55% when the pH was controlled at 5.6..
Summary of Overall Performance
To easily compare the performance between each run, Table 42 provides information
on the average cumulative methane production, specific methane production, percentage
conversion of biodegradable solid waste into methane, dilution water usage, biomass
seeding ratio, and TS and TVS destruction under normal operating conditions.
As shown in Table 42, the operation of single batch acidogenic reactor (SBAR)
system had lower methane production per unit weight of TS than the operation of double
batch acidogenic reactors (DEAR) system. This indicated that the DBAR system has a
higher metabolic rate than the SBAR system. Conversion of biodegradable solid waste into
methane decreased as the TS content increased or SWRT decreased. However, the
operation of DBAR system at a TS content of 15% and a 10-day SWRT has the highest
specific methane production (3.15). This value is higher than the numbers calcualted from
other anaerobic treatment processes on OFMSW as shown in Table 11.
The highest TS content of 15% was used in this study instead of 25 - 30% TS
contents in other processes (Table 11). The plastic tubes and medias installed in the
acidogenic reactors for avoiding clogging problems reduced the loading room for solid
172
waste. However, two shorter solid waste retention times (10 - 14 days) at high conversion
of biodegradable fraction of solid waste into methane (84 - 97%) compared with other
processes (Table 11) lead to this process a better performance; high organic loading rates
(6.5 - 13.7 kg TVS/m^/day) and high specific methane gas production (1.73 - 3.15 m^ CH4
/m^/day). In other words, this process has higher overall biochemical rate on the treatment
ofOFMSW.
Since solid waste were fed and wasted in a batch mode, the reactor volume was
restricted by the allowable loading and wasting rates. This limitation was not severly
confined to a contiunously stirred tank reactor with contiunous feed. Another limited
application of this process is the necessary reseeding biomass from wastewater treatment
plant for each fresh solid waste load. This requirement results in a limited acidogenic
reactor volume based on the available reseeding biomass source. This problem may be
minimized by partially reseeding the digested solid waste. However, this scenario will
reduce the organic loading rate and specific methane gas production.
The unique characteristic of this process compared to other leachate recycle processes
such as SEBAC and BIOCEL is that effluent from the solid bed will be partially treated
through the methanogenic filter. Recycle liquid back to the acidogenic reactors from the
holding/recycling tank contains much less VFA than the efflunet form the solid bed.
Therefore, this process should have better synergeism and higher overall biochemical
reaction rate than a single-stage batch process. The aerobic polish stage proceeded in the
same digested acidogenic reactor provides another advantage of this process.
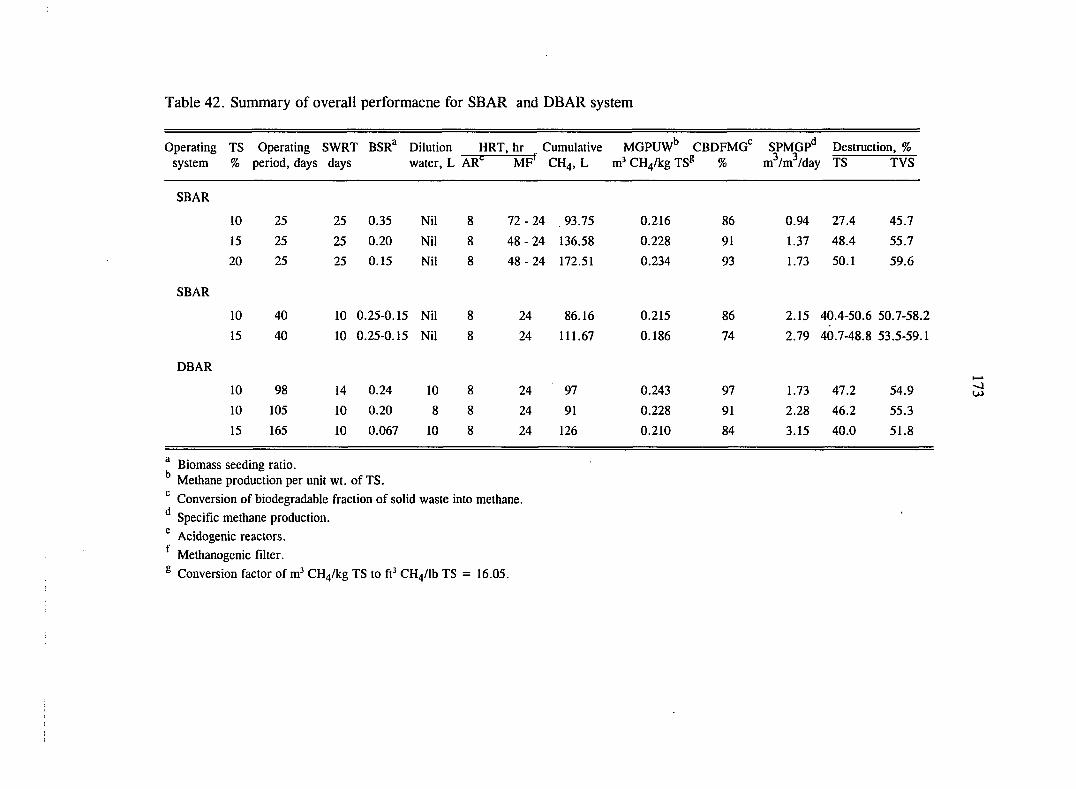
Table 42. Summary of overall performacne for SBAR and DEAR system
Operating TS Operating SWRT BSR^ Dilution HRT.hr Cumulative MGPUW'' CBDFMG'' SPMGP'^ Destruction. % system % period, days days water. L AR® CH4, L m' CH4/kg TS® % m^/m^/day TS TVS
SBAR
SBAR
DBAR
10 25 25 0.35 Nil 8 72-24 . 93.75 0.216 86 0.94 27.4 45.7
15 25 25 0.20 Nil 8 48-24 136.58 0.228 91 1.37 48.4 55.7
20 25 25 0.15 Nil 8 48-24 172.51 0.234 93 1.73 50.1 59.6
10 40 10 0.25-0.15 Nil 8 24 86.16 0.215 86 2.15 40.4-50.6 50.7-58.2
15 40 10 0.25-0.15 Nil 8 24 111.67 0.186 74 2.79 40.7-48.8 53.5-59.1
10 98 14 0.24 10 8 24 97
10 105 10 0.20 8 8 24 91
15 165 10 0.067 10 8 24 126
0.243 97 1.73 47.2 54.9
0.228 91 2.28 46.2 55.3
0.210 84 3.15 40.0 51.8
^ Biomass seeding ratio. '' Methane production per unit wt. of TS.
Conversion of biodegradable fraction of solid waste into methane.
Specific methane production.
® Acidogenic reactors.
^ Methanogenic filter.
® Conversion factor of m' CH4/kg TS to ft' CH4/lb TS = 16.05.
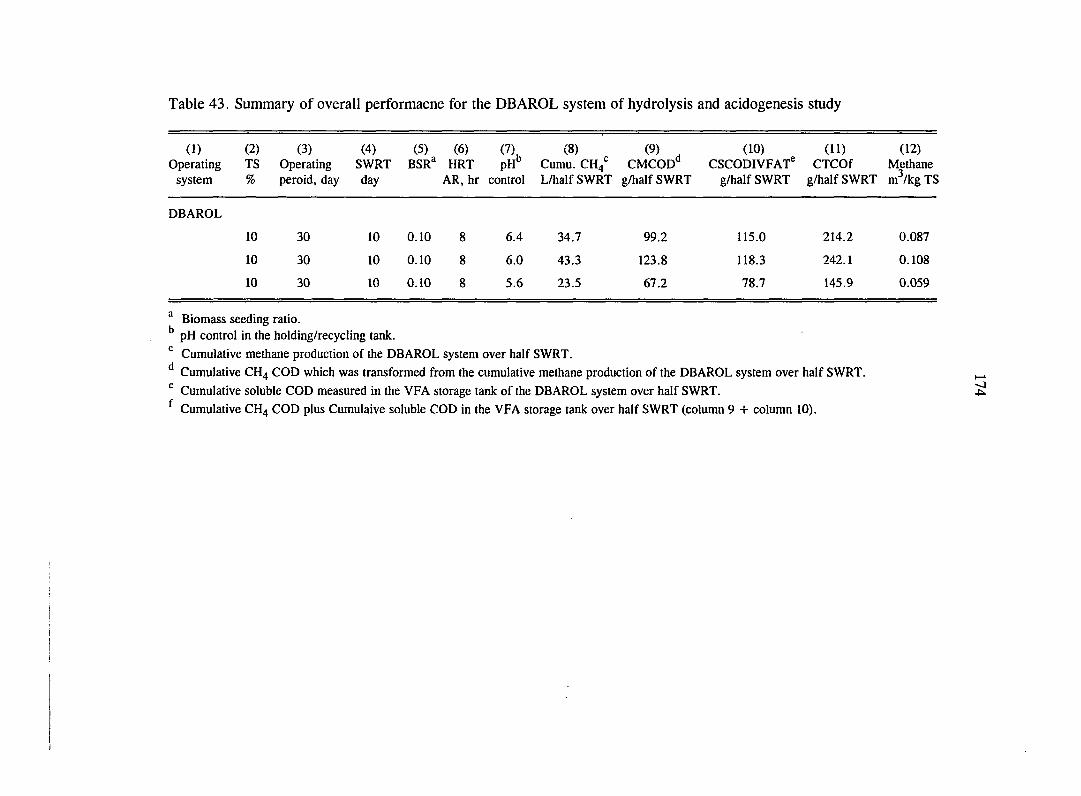
Table 43. Summary of overall performacne for the DBAROL system of hydrolysis and acidogenesis study
(1) (2) (3) (4) (5) (6) (7) (8) (9) (10) (11) (12) Operating TS Operating SWRT BSR^ HRT pH" Cumu. CH4'^ CMCOD CSCODIVFAT® CTCOf Methane
system % peroid, day day AR, hr control L/half SWRT g/half SWRT g/half SWRT g/half SWRT m^/kg TS
DBAROL
10 30 10 0.10 8 6.4 34.7 99.2 115.0 214.2 0.087
10 30 10 0.10 8 6.0 43.3 123.8 118.3 242.1 0.108
10 30 10 0.10 8 5.6 23.5 67.2 78.7 145.9 0.059
® Biomass seeding ratio. '' pH control in the holding/recycling tank.
Cumulative methane production of the DBAROL system over half SWRT.
^ Cumulative CH4 COD which was transformed from the cumulative methane production of the DBAROL system over half SWRT.
® Cumulative soluble COD measured in the VFA storage tank of the DBAROL system over half SWRT.
Cumulative CH4 COD plus Cumulaive soluble COD in the VFA storage tank over half SWRT (column 9 + column 10).
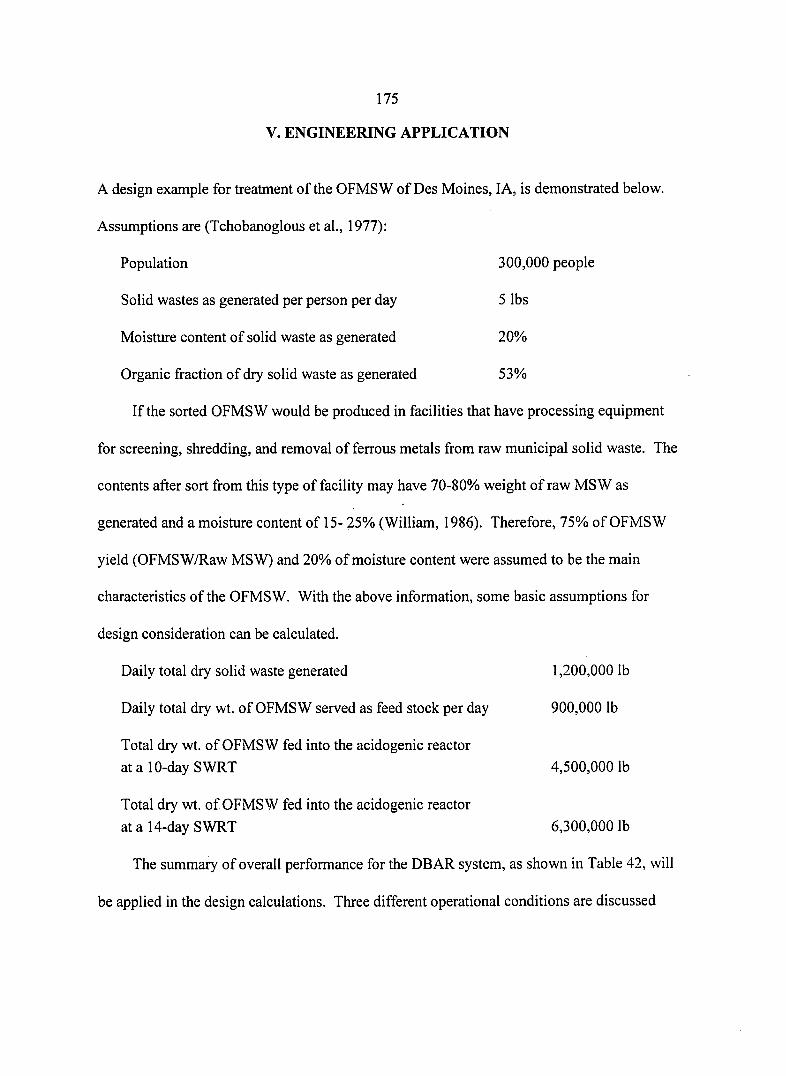
175
V. ENGINEERING APPLICATION
A design example for treatment of the OFMSW of Des Moines, lA, is demonstrated below.
Assumptions are (Tchobanoglous et al., 1977):
Population 300,000 people
Solid wastes as generated per person per day 5 lbs
Moisture content of solid waste as generated 20%
Organic fraction of dry solid waste as generated 53%
If the sorted OFMSW would be produced in facilities that have processing equipment
for screening, shredding, and removal of ferrous metals from raw municipal solid waste. The
contents after sort from this type of facility may have 70-80% weight of raw MSW as
generated and a moisture content of 15- 25% (William, 1986). Therefore, 75% of OFMSW
yield (OFMSW/Raw MSW) and 20% of moisture content were assumed to be the main
characteristics of the OFMSW. With the above information, some basic assumptions for
design consideration can be calculated.
Daily total dry solid waste generated 1,200,000 lb
Daily total dry wt. of OFMSW served as feed stock per day 900,000 lb
Total dry wt. of OFMSW fed into the acidogenic reactor
at a 10-day SWRT 4,500,000 lb
Total dry wt. of OFMSW fed into the acidogenic reactor
at a 14-day SWRT 6,300,000 lb
The summary of overall performance for the DBAR system, as shown in Table 42, will
be applied in the design calculations. Three different operational conditions are discussed
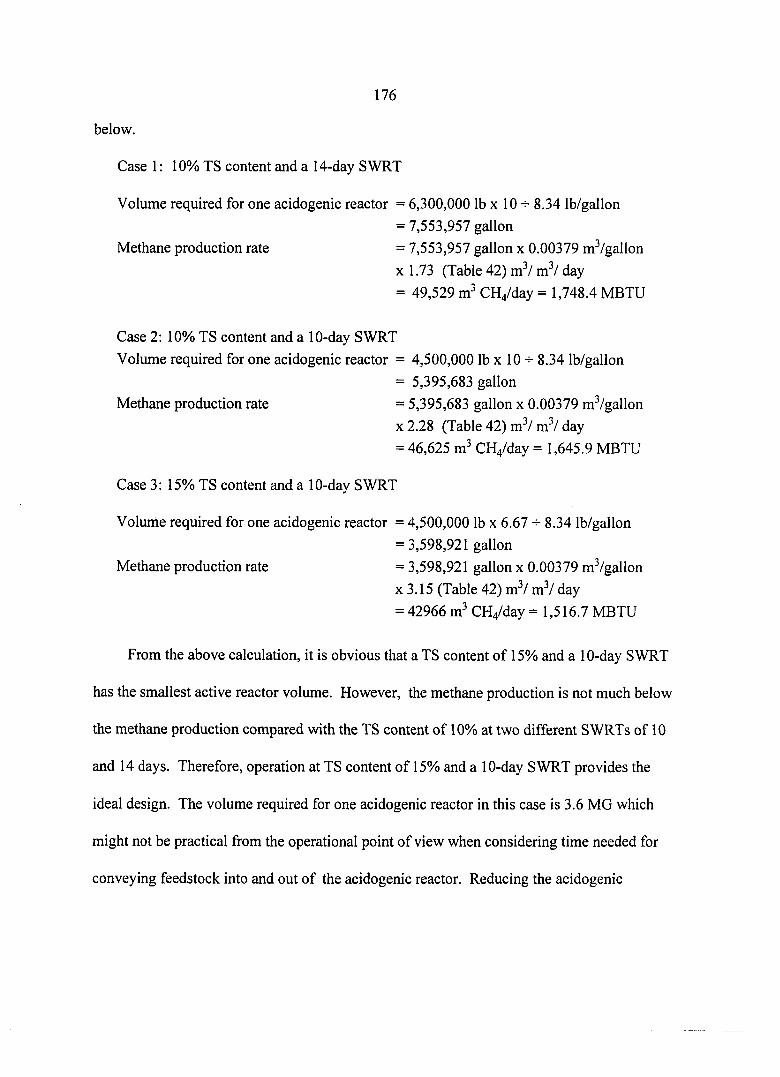
below.
176
Case 1; 10% TS content and a 14-day SWRT
Volume required for one acidogenic reactor = 6,300,000 lb x 10 ^ 8.34 lb/gallon
Case 2: 10% TS content and a 10-day SWRT
Volume required for one acidogenic reactor = 4,500,000 lb x 10 8.34 lb/gallon
Case 3: 15% TS content and a 10-day SWRT
Volume required for one acidogenic reactor = 4,500,000 lb x 6.67 8.34 lb/gallon
From the above calculation, it is obvious that a TS content of 15% and a 10-day SWRT
has the smallest active reactor volume. However, the methane production is not much below
the methane production compared with the TS content of 10% at two different SWRTs of 10
and 14 days. Therefore, operation at TS content of 15% and a 10-day SWRT provides the
ideal design. The volume required for one acidogenic reactor in this case is 3.6 MG which
might not be practical from the operational point of view when considering time needed for
conveying feedstock into and out of the acidogenic reactor. Reducing the acidogenic
Methane production rate
= 7,553,957 gallon
= 7,553,957 gallon x 0.00379 mVgallon
X 1.73 (Table 42) vc?l m^/ day
= 49,529 m^ CH^day = 1,748.4 MBTU
Methane production rate
= 5,395,683 gallon
= 5,395,683 gallon x 0.00379 m^/gallon
X 2.28 (Table 42) mV m^/ day
= 46,625 m^ CH^day = 1,645.9 MBTU
Methane production rate
= 3,598,921 gallon
= 3,598,921 gallon x 0.00379 m'^/gallon
X 3.15 (Table 42) mV mV day
= 42966 m^ CH^day = 1,516.7 MBTU
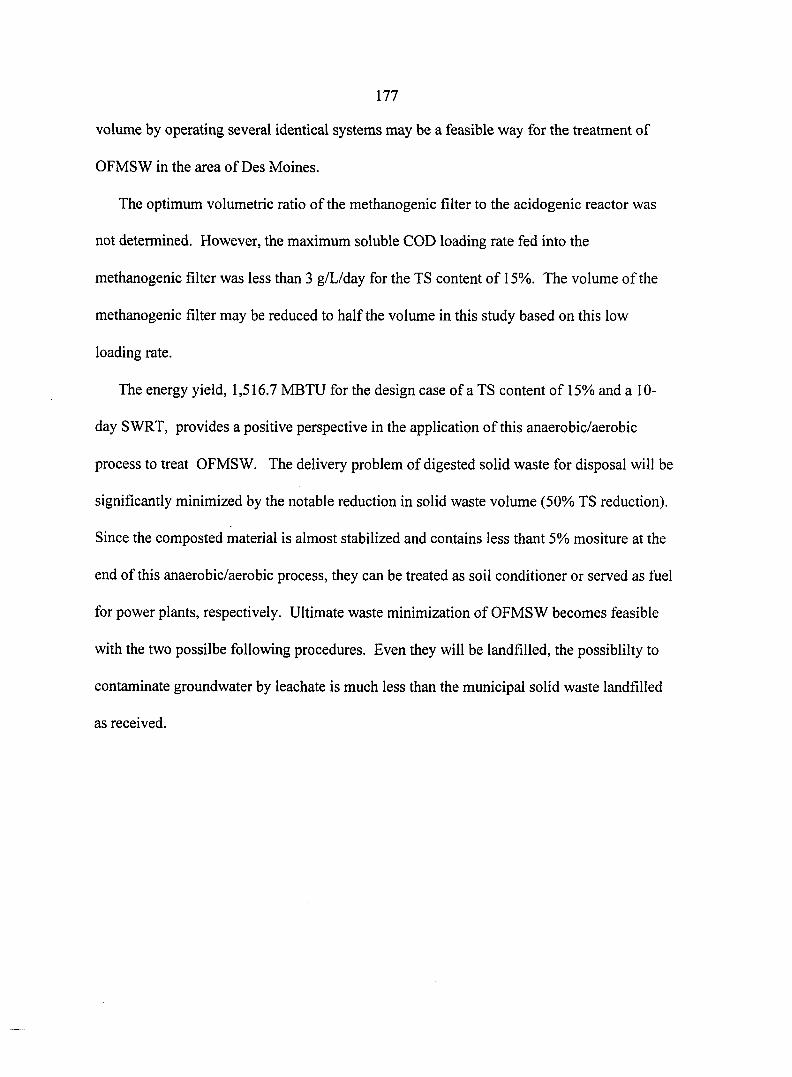
177
volume by operating several identical systems may be a feasible way for the treatment of
OFMSW in the area of Des Moines.
The optimum volumetric ratio of the methanogenic filter to the acidogenic reactor was
not determined. However, the maximum soluble COD loading rate fed into the
methanogenic filter was less than 3 g/L/day for the TS content of 15%. The volume of the
methanogenic filter may be reduced to half the volume in this study based on this low
loading rate.
The energy yield, 1,516.7 MBTU for the design case of a TS content of 15% and a 10-
day SWRT, provides a positive perspective in the application of this anaerobic/aerobic
process to treat OFMSW. The delivery problem of digested solid waste for disposal will be
significantly minimized by the notable reduction in solid waste volume (50% TS reduction).
Since the composted material is almost stabilized and contains less thant 5% mositure at the
end of this anaerobic/aerobic process, they can be treated as soil conditioner or served as fuel
for power plants, respectively. Ultimate waste minimization of OFMSW becomes feasible
with the two possilbe following procedures. Even they will be landfilled, the possibility to
contaminate groundwater by leachate is much less than the municipal solid waste landfilled
as received.

178
VI. CONCLUSIONS
The following conclusions are drawn from the experimental operation of the DBAR
and DBAROL systems.
1. The cumulative methane gas production can approach a maximum value within two
SWRTs for the DBAR system.
2. The most important parameters affecting the overall performance include VS loading
rate, solid waste retention time, biomass seeding ratio, dilution of toxins, and
hydraulic retention time in the acidogenic reactors.
3. The methane and carbon dioxide composition from the methanogenic filter were quite
constant (60 and 38%, respectively) for most operating conditions. However, the
content of methane and carbon dioxide from solid bed were a function of TS
content: A TS content of 15% had lower methane gas profile than 10% TS content.
4. The percentage of cumulative methane gas production from the biofilter increased as
the TS content increased. The percent of cumulative methane gas production from the
solid bed for the DBAR system at a TS content of 10% and two different SWRTS of
10 and 14 days were about 80 and 74%, respectively. However, the percentage from
the solid bed decreased to about 59% for a TS content of 15%. Neverthless, in this
study the cumulative methane production from the solid bed was always higher than
the metahnogenic filter. Therefore, it is not suitable to define the reactors loaded with
solid waste as acidogenic reactors. In stead, a two-stage anaerobic process is more
appropriate to comply with the observations in the system. The pH profile for the TS
content of 15% was lower than the TS content of 10%. This may indicate that
under higher TVS loading pressure the acidogenic reactors would produce less
methane gas.
5. The optimum BSR for the DBAR system operated at TS content of 15% and a 10-day
SWRT was found to be 0.067.
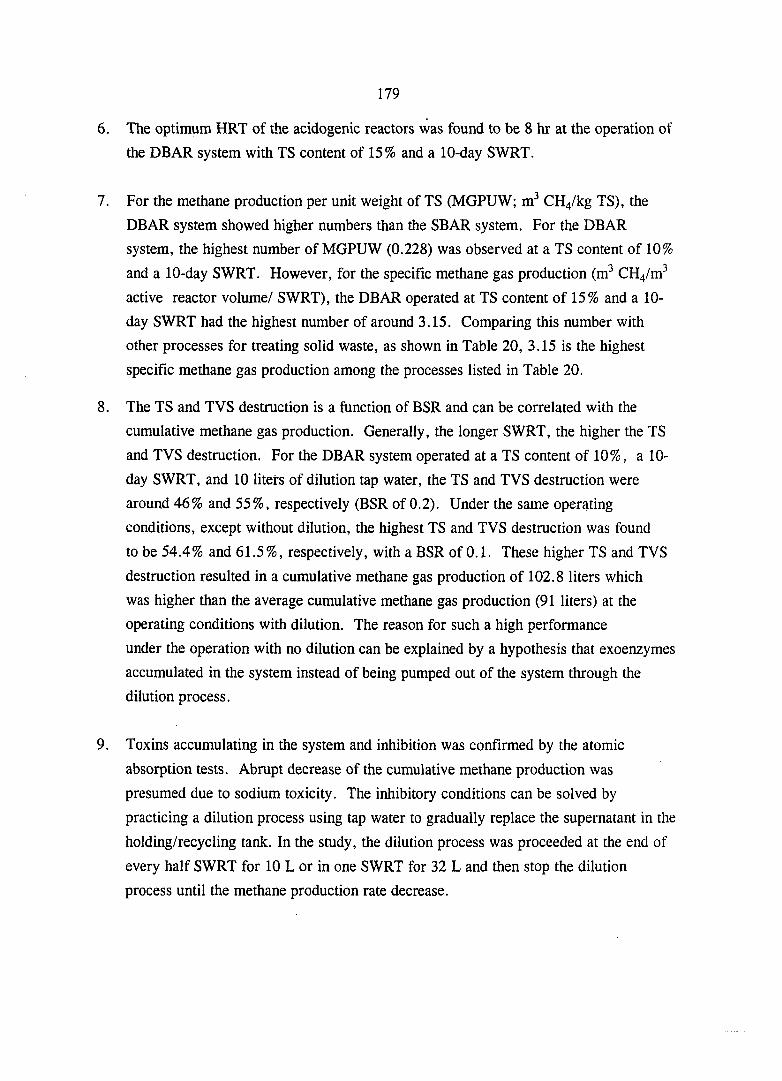
179
6. The optimum HRT of the acidogenic reactors was found to be 8 hr at the operation of
the DEAR system with TS content of 15% and a 10-day SWRT.
7. For the methane production per unit weight of TS (MGPUW; m^ CH4/kg TS), the
DEAR system showed higher numbers than the SEAR system. For the DEAR
system, the highest number of MGPUW (0.228) was observed at a TS content of 10%
and a 10-day SWRT. However, for the specific methane gas production (m^ CH4/m^
active reactor volume/ SWRT), the DEAR operated at TS content of 15% and a 10-
day SWRT had the highest number of around 3.15. Comparing this number with
other processes for treating solid waste, as shown in Table 20, 3.15 is the highest
specific methane gas production among the processes listed in Table 20.
8. The TS and TVS destruction is a function of BSR and can be correlated with the
cumulative methane gas production. Generally, the longer SWRT, the higher the TS
and TVS destruction. For the DEAR system operated at a TS content of 10%, a 10-
day SWRT, and 10 liteirs of dilution tap water, the TS and TVS destruction were
around 46% and 55%, respectively (ESR of 0.2). Under the same operating
conditions, except without dilution, the highest TS and TVS destruction was found
to be 54.4% and 61.5%, respectively, with a ESR of 0.1. These higher TS and TVS
destruction resulted in a cumulative methane gas production of 102.8 liters which
was higher than the average cumulative methane gas production (91 liters) at the
operating conditions with dilution. The reason for such a high performance
under the operation with no dilution can be explained by a hypothesis that exoenzymes
accumulated in the system instead of being pumped out of the system through the
dilution process.
9. Toxins accumulating in the system and inhibition was confirmed by the atomic
absorption tests. Abrupt decrease of the cumulative methane production was
presumed due to sodium toxicity. The inhibitory conditions can be solved by
practicing a dilution process using tap water to gradually replace the supernatant in the
holding/recycling tank. In the study, the dilution process was proceeded at the end of
every half SWRT for 10 L or in one SWRT for 32 L and then stop the dilution
process until the methane production rate decrease.

180
10. For the operation of DBAROL system, pH controlled at 6.0 resulted in the best
performance. This result indicates that the optimum pH conditions for hydrolysis and
acidogenesis was around 6.0. However, the DEAR system still had better
performance than the DBAROL system.
11. The percentage of cumulative methane gas production from the solid bed was around
59% for the TS content of 15%. The percentage was even higher for TS content of
10% (80% and 74%for SWRTs of 14 and 10 days). It is suggested that the acidogenic
reactors should be able to convert volatile acids into methane gas. In other words, the
volumetric ratio of the methanogenic reactors to the acidogenic reactor should be less
than the 1.25 in this study. A number of 0.5 is suggested by the obseration of the
VFA concentrations in the holoding/resycling tank were less than 2 g/L at most
operating conditions.
12. The aerobic process did not significantly increase the destruction of TS and TVS.
However, the moisture content of the digested solid waste can be reduced to less than
5% in a 3-day period.
181
VII. SUGGESTIONS FOR FUTURE WORK
Studies of this anaerobic/aerobic process have shown stable and high performance on
treatment of OFMSW. However, the substrate used in this study was a synthetic solid
waste which is an important factor affecting the overall performance. In addition, the
volume ratio of methanogenic biofilter to acidogenic reactors and the volume ratio of
holding and recycling tank to acidogenic reactors are also important. Therefore, applying
a real substrate from a resource recovery plant on this process is more practical and
studies of the volume ratio is also recommended.
Another interesting suggestion is to apply thermophilic conditions on the acidogenic
reactor and still keep the methanogenic biofilter under mesophilic conditions. The
hydrolysis and acidogenesis rate in the solid bed may be significantly increased due to the
temperature increase, thus decreasing the solid waste retention time.
182
BIBLIOGRAPHY
Andrew, J. F., "Dynamic Model of the Anaerobic Digestion Process." Journal of the Sanitary Engineering Division. 95:SA1, Feburary (1969).
Allen, M. B., "Thermophiles Aerobic Sporeforming Bacteria." Bacteriological Reviews. 17:213 (1953).
Barker, H. A., "Fermentation of Nitrogenous Organic Compounds." The Bacteria. Chapter 3, Vol. II, Gunsalus, I. C. and Stainer, R. Y. (Eds.), Academic Press, New York (1961).
de Bertoldi, M., Vallini, G., and Pera, A., "The Biology of Composting View : A Review." Waste Management & Research. 1:157 (1983).
Bonomo, L., and Higginson, A. E., International Overview on Solid Waste Management. Academic Press, New York (1988).
Bryant, M. P., "Microbial Methane Production - Theoretical Aspects." Journal of Animal Science. 48:193 (1979).
Cecchi, F., Traverso, P. G., and Cescon, P., "Anaerobic Digestion of Organic Fraction of Municipal Solid Wastes." Science and Total Environment. 59:183 (1986).
Cecchi, F., Traverso, P. G., Perin, G., and Vallini, G., "Comparison of Co-digestion Performance of two Differently Collected Organic Fractions of MSW with Sewage Sludge." Environmental and Technology Letters. 9:31 (1988).
Chyi, Y. T., and Dague, R. R., "Effects of Particulate Size in Anaerobic Acidogenesis Using Cellulose as A Sole Carbon Source." Water Environment Research. 66(5):670 (1994).
Chandler, J. A., Jewell, W. J., Gossett, P. J., Vansoset, P. J., and Robertson, J. B., "Predicting Methane Fermentation Biodegradability." Biotechnology and Bioengineering Symposium. 10:93 (1980).
Chynoweth, D. P., Owens, J., O'Keefe, D., Earle, J. F. K., Bosch, G., and Lagrand, R., "Sequential Batch Anaerobic Composting of the Organic Fraction of MSW." Water Science and Technologv. 25(7): 327 (1992).

183
Clark, R. H., and Speece, R. E., "The pH Tolerance of Anaerobic Digestion." Presented at the 5th International Conference on Water Pollution Research, San Francisco, California, July (1970).
Clausen, E. C., and Gaddy, J. L., "High Solid Digestion of MSW to Methane by Anaerobic Digestion." Biotechnology Advances in Processing Muncipal Wastes for Fuel and Chemicals. 22:383 (1987).
Cohen, A., Zoetemeyer, K.J., van Deursen, A., and van Andel, J. G., "Anaerobic Digestion of Glucose with Separated Acid Production and Methane Formation." Water Research. 13:571 (1979).
Compere, A. L., and Griffith, W. L., "Anaerobic Mechanisms for the Degradation of Cellulose." Oak Ridge National Laboratory, NTIS PB 216 556 (1975).
Cooney, C. L., Wang, H. Y., and Mateles, R. I., "Measurement of Heat Evolution and Correlation During Microbial Growth." Biotechnology and Bioengineering. 11(3):269 (1968).
De Bare, L., "High Dry Anaerobic Composting Process for the Organic Fraction of Solid Wastes." Seventh Symposium on Biotechnology for Fuels and Chemicals. Catlingburg, TN, 14-17, May (1985).
Diaz, L. F., Savage, G. C., and Golueke, C. G., "Engineering Studies on MSW as a Substrate for Methanogenesis." Biotechnology Advances in Processing Muncipal Wastes for Fuel and Chemicals. 22:231 (1987).
Dolle, H. W., Bacterial Metabolism. Academic Press, New York (1975).
Dubourguier, H. C., Albagnac, G., and Verrier, D., "Methane Production Processes by Fermentation ofBiomass." In Svnthetic Fuels. Ed. G. E. Beghi, 219-233 (1985).
Eastman, J. A., and Ferguson, J. F., "Solubilization of Particulate Organic Carbon During the Acid Phase of Anaerobic Digestion", Journal of the Water Pollution Control Federation. 53(3):352 (1981).
EPA Report, "Characterization of Municipal Solid Waste in the United State: 1990 Update." EPA/530-SW-90-042A, June 13 (1990).
Ghosh, S., "Leach-bed Two-phase Digestion : The Lanfilgas Concept." Presented at Energy from Biomass and Wates IX, Lake Buena Vista, Florida, January 28-Febuary I (1985).
184
Ghosh, S., "Improved Gasification by Two-Phase Anaerobic Digestion." Fourth International Symposium on Anaerobic Digestion, Journal of Environmental Engineering. 113(6): 1265 (1987).
Golueke, C. G., "Biological Reclamation of Solid Wastes." Rode Press, PA (1977).
Graindorge, P., Cayrol, F., and Pavia, A., "Methane Fermentation of Urban Waste with a High Paper Content", In Energy Biomass and Wastes (Edited by Donald L. Klass), Institute of Gas Technology, Chicago, U.S.A., 8:1080 (1989).
Garrison, W. E. et al., "Pilot-Plant Studies of Waste Activated Sludge Processing." Journal of Water Pollution Control Federation. 42(R29):29 (1981).
Gutschick, V. P., "Energetic of Microbial Fixation of Dinitrogen", In Advances in Biochemical Engineering (Edited by Fiechter, A.), Springer-Verlag, 21:109 (1980).
Haniki, K., Matsuo, T., Nagase, M., and Tabata, Y., "Evaluation of Effectiveness of Two-Phase Anaerobic Digestion Process Degrading Complex Substrate." Water Sicence and Technology. 19:311 (1987).
Hayes, T. D., and Theis, T. L., "Distribution of Heavy Metals in Anaerobic Digestion." Journal of Water Pollution Control Federation. 50:61 (1978).
Huggins, G. M., Bullock, L. D., and Swartzbaugh, J. T., "Enzymatic Enhancement of the Bioconversion of Cellulose to Methane." Advanced in Chemistry Series. 181:151 (1979).
Hutchens, J. O., "Free Energies of Solution and Standard Energy of Formation of Amino Acids in Aqueous Solution at 25°C." Handbook of Biochemistry. 2nd Ed., Chemical Rubber Co., Cleveland Ohio (1970).
Jeris, J. S., and McCarty, P. L., "The Biochemistry of Methane Fermentation Using C'"* Tracers." Journal of Water Pollution Control Federation. 37:178 (1965).
Kayhanian, M., Lindenauer, S., Hardy, S., and Tchobanoglous, G., "Two-Stage Process Combines Anaerobic and Aerobic Methods." Biocycle. 4: 48 (1991).
Kotez, J. P., Thiel, P. G., and Hahingh, W. H., "Anaerobic Digestion II: The Characterization and Control of Anaerobic Digestion." Water Research. 3:459 (1969).
185
Kroeker, E. J., et al., "Anaerobic Treatment Process Stability." Journal of Water Pollution Control Federation. 51:718 (1979).
Kugelman, I. J., and Chin, K. K., "Toxicity, Synergism, and Antagonism in Anaerobic Waste Treatment Processes." Anaerobic Biological Treatment Processes, Advances in Chemistry Series 105, American Chemical Society (1971).
Lehinger, A. L., Biochemistry. 2nd Ed., Worth Publishers Inc., New York (1975).
Lettinga, G., et al., "Use of the Upflow-Sludge-Blanket (USB) Reactor Concept for Biological Wastewater Treatment, Especially for Anaerobic Treatment." Biotechnology and Bioengineering. 22:4, 699 (1980).
Magee, R. J., and Kosaric, N., "Bioconversion of Hemicellulose." Advance in Biochemical Engineering and Biotechnology. 32:61 (1985).
Maatta, R. K., "Anaerobic Wastewater Treatment Processes", Water Science and Technologv. 17:53 (1985).
McCarty, P. L., and McKinney, R. E., "Volatile Acid Toxicity in Anaerobic Digestion." Journal of the Water Pollution Control Federation. 33:223 (1961).
McCarty, P. L., "Anaerobic Waste Treatment Fundamentals: I. Chemistry and Microbiology, II. Environmental Requirements and Control, III. Toxic Materials and Their Control, IV. Process Design." Public Works. Nos. 9-12, Sept.-Dec. (1964).
McCarty, P. L., "Energetics and Kinetics of Anaerobic Treatment." in Anaerobic Biological Treatment Processes, Advance in Chemistrv Series. 105:91 (1971).
McCarty, P. L., "Stoichiometry of Biological Reactions." Progress in Water Technology. 7:157, Pergamon Press, London (1975).
Mclnemey, J. G., and Bryant, M. P., Anaerobes and Anaerobic Infection (Edited by G. Gottschalk), Gustav Fisher Verlag Stuttgart, New York (1980).
Minkevich, F. G., Eroshin, V. K., "Productivity and Heat Generation of Fermentation Under Oxygen Limitation." Folia Microbiologica. 18:376 (1973).
Molnar, L., and Bartha, L., "High Solids Anaerobic Fermentation for Biogas and Compost Production." Biomass. 16:173 (1988).
186
Mosey, F. E., "Assessment of the Maximum Concentration of Heavy Metals of Crude Sludge Which Will Not Inhibit the Anaerobic Digestion of Sludge." Journal of Water Pollution Control Federation. 15:209 (1983).
Niessen, W. R., and Alsobrook, A. F., "Municipal and Industrial Refuse; Composition and Rates." Proceeding of ASME Incinerator Conference (1972).
Okunuki, K., Fermentation Chemistry. Kyoritsu Shuppan Co. (1951).
O'Rourke, J. T., "Kinetics of Anaerobic Waste Treatment at Reduced Temperatures." Ph.D. Thesis, Standford University (1968).
Pohland, F. G., and Ghosh, S., "Developments in Anaerobic Stabilization of Organic Wastes - the Two-phase Concept." Environmental Letters. 4:255 (1971).
Pohland, F. G., "Leachate recycle as landfill management." Journal of the Environmental Engineering Division. 106(EE6):1057 (1980).
Peres, C. S., Sanchez, C. R., Matumoto, C., and Schmidell, W., "Anaerobic Biodegradability of the Organic Components of Municipal Solid Wastes (OFMSW)." Water Science and Technologv. 25(7);285 (1992).
Rivard, C. J., Hinunel, M. E., Vinzant, T. B., Adney, W. S., Wyman, C. E., and Grohmann, K., "Development of a Novel Laboratory Scale High Solid Reactor for the Production of Methane." Applied Biochemistrv and Biotechnology. 20/21:461 (1989).
Robinson, W. D., The Solid Waste Handbook. Chapter 12: Resource Recovery: Prepared Fuels Energy and Materials, p. 398, John Wiley &. Sons, Inc., New York (1986).
Saunamaki, R., "Sludge Handling and Disposal at the Finnish Activated Sludge Plants." In: Proceeding of Second lAWPRC Symposium on Forest Industry Wastewaters. Tampere University of Technology, Tamperre, Finland (1987).
Shin, H. S., Bae, B. U., Lee, J. J., and Park, B. C., "Anaerobic Digestion of Distillery Wastewater in a Two-phase UASB system." Water Science and Technology, 25(7):361 (1992).
Six, W., and de Baere, L., "Dry Anaerobic Conversion of MSW by Means of the DRANCO Process." Water Sicence and Technology. 25(7):295 (1992).
187
Speece, R. E., "Anaerobic Biotechnology for Industrial Wastewater Treatment." Environmental Science and Technology. 17(9): 416A (1983).
Standard Method for the Examination of Water and Wastewater. 16th Ed., American Public Health Association, Washington, D. C. (1985).
Tchobanoglous, G., Theisen, Hilary, and Eliassen, R., "Solid Wastes: Engineering Principles and Management Issues." B. J. Clark and J. W. Maisel (Eds.), McGraw-Hill Book Company., NY, 228-232 (1977).
Ten Brummeler, E., and Koster, W. I., "Enhancement of Dry Anaerobic Batch Digestion of the Organic Fraction of MSW by an Aerobic Pre-Treatment Step." Biological Wastes. 31:199 (1990).
Thauer, R. K., Jungerman, K., and Decker, K., "Energy Conservation in Chemotrophic Anaerobic Bacteria." Bacteriology Review. 41(1): 100 (1977).
Tsao, G. T., "Processing High Solids Concentration of MSW by Anaerobic Digester for Methane Production." Report to DOE, ANL/CNSU-TM-199 (1988).
Wellingen, A., Baserga, U., and Egger, K., "New Systems for the Digestion of Solid Wastes." Water Science and Technology. 25(7);319 (1992).
Williams, V. R., and Williams, H. B., Basic Physical Chemistry for the Life Science. 2nd Ed., W. H. Freeman and Co., San Francisco (1973).
Wise, D. L., Wentworth, R. L., and Augenstein, D. C., "Multi-Stage Digestion of Municipal Solid Waste to Fuel Gas." Resource Recovery and Conversion. 3:41 (1978).
Wood, W. A., "Fermentation of Carbohydrates and Related Compouds." The Bacteria-Metabolism. Vol. II, I. C. Gunsalus and R. Y. Stainer (Eds.), Academic Press, New York (1961).
Wujcik, W. J., and Jewell, W. J., "Dry Anaerobic Fermentation." In: Proceedings from the Second Sumposium on Biotechnology in Energy Production and Conservation. Gatlinburg, TN, 43-65 (1979).
Zhang, T. C., and Noike, T., "Comparison of One-Phase and Two-Phase Anaerobic Digestion Processes in Characteristics of Substrate Degradation and Bacterial Population Levels." Water Science and Technologv. 23:1157 (1911).

188
Zoetemeyer, R. J., Matthijsen, A. J. C. M., and Cohen, A., "Product Inhibition in the Acid Forming Stage of the Anaerobic Digestion Process." Water Research. 16:633 (1982).
189
ACKNOWLEDGEMENTS
The author extends his sincere appreciation to Dr. Richard R. Dague for his continual
patience and support throughout this research. His knowledge and advice were invaluable
to the success of my work.
The time and efforts of my committee members Dague, Dr. Austin, Dr. Jones, Dr.
Ong, Dr. Loynachan, and Dr. Honzakto, are appreciated. Their assistance added to the
quality of this project.
Special thanks are owed to my family, especially my wife, shihmin chyi. She spent
hundreds of hours preparing feed substrate and fully supported me during the system
failure. I would like to say thank you to all those who aided me in my research.
Finally, the author would like to thank the Iowa Department of Economic
Development for providing financial support for this research.

190
APPENDIX A
ULTIMATE METHANE PRODUCTION DATA PROFILE

191
Cumulative methane production ® STP for substrate ultimate methane production tests
Bottle No. 1 Bottle No. 2 Bottle No. 3 Bottle No. 4
Date Day Cumulative CH4 Cumulative CH4 Cumulative CH4 Cumulative CH4
ml @ STP ml @ STP ml @ STP ml ® STP
11/15 1 1.48 3.12 2.13 2.31
11/16 2 10.89 9.44 10.56 10.73
11/17 3 23.76 19.40 21.46 22.43
11/18 4 57.40 39.22 44.20 45.48
11/19 5 123.34 80.14 77.55 77.49
11/20 6 167.97 124.29 108.83 107.36
11/21 7 199.26 155.08 141.67 141.86
11/22 8 228.76 180.80 180.64 179.50
11/23 9 263.67 212.09 227.03 225.89
11/24 10 281.30 229.49 244.83 253.36
11/25 11 295.32 261.91 277.14 280.33
11/26 12 300.30 293.50 308.52 308.33
11/27 13 307.01 315.01 329.28 334.70
11/28 14 321.66 332.71 342.35 349.94
11/29 15
11/30 16 333.65 347.82 354.39 . 365.81
12/1 17
12/2 18 340.77 359.79 361.61 379.15
12/3 19
12/4 20
12/5 21
12/6 22
12/7 23 347.99 372.25 368.91 389.83
12/8 24
12/9 25
12/10 26
12/11 27
12/12 28
12/13 29
12/14 30
12/15 31
12/16 32
12/17 33
12/18 34
12/19 35
12/20 36
12/21 37
12/22 38
12/23 39 351.90 390.29 372.98 396.21
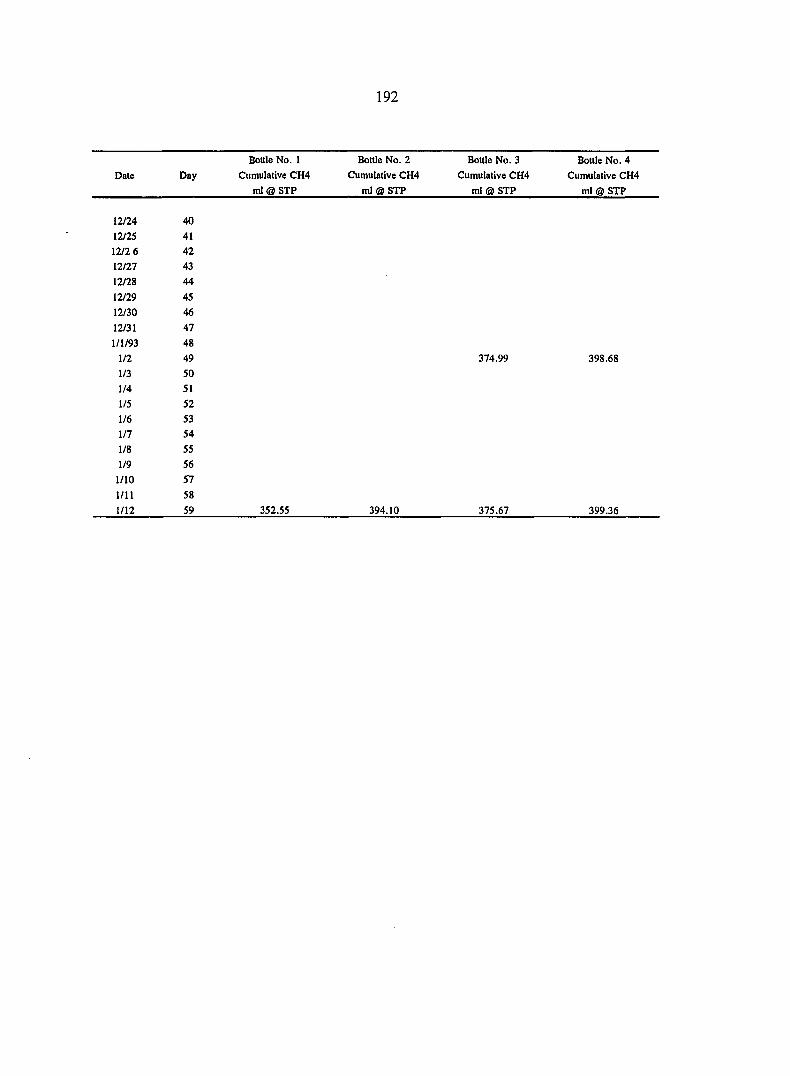
192
Bottle No. 1 Bottle No. 2 Bottle No. 3 Bottle No. 4
Date Day Cumulative CH4 Cumulative CH4 Cumulative CH4 Cumulative CH4
ml® STP ml @ STP ml @ STP ml @ STP
12/24 40
12/25 41
12/2 6 42
12/27 43
12/28 44
12/29 45
12/30 46
12/31 47
1/1/93 48
1/2 49 374.99 398.68
1/3 50
1/4 51
1/5 52
1/6 53
1/7 54
1/8 55
1/9 56
1/10 57
1/11 58
1/12 59 352.55 394.10 375.67 399.36
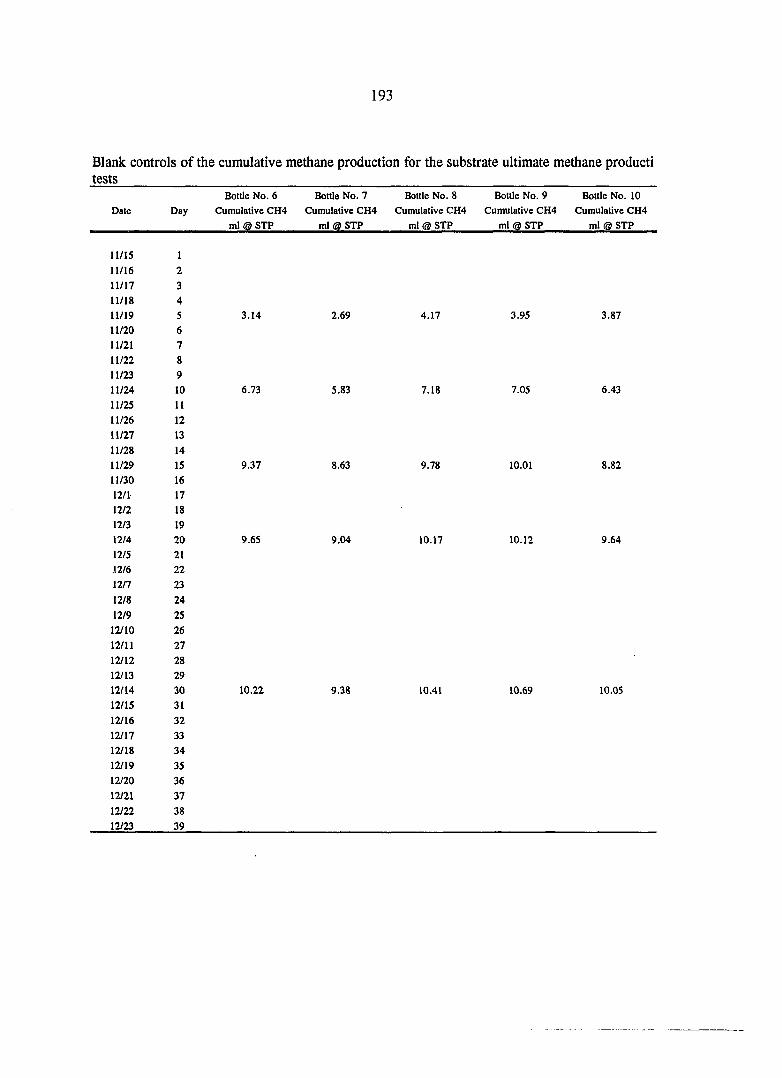
193
Blank controls of the cumulative methane production for the substrate ultimate methane producti tests
Bottle No. 6 Bottle No. 7 Bottle No. 8 Bottle No. 9 Bottle No. 10 Date Day Cumulative CH4 Cumulative CH4 Cumulative CH4 Cumulative CH4 Cumulative CH4
m l ® S T P ml ® STP ml @ STP ml @ STP ml ® STP
11/15 1
11/16 2
11/17 3 11/18 4 n/19 5 3.14 2.69 4.17 3.95 3.87
11/20 6 11/21 7
11/22 8 11/23 9
11/24 10 6.73 5.83 7.18 7.05 6.43
11/25 11
11/26 12 U/27 13
11/28 14 11/29 15 9.37 8.63 9.78 10.01 8.82
11/30 16 12/1 17
12/2 18 12/3 19 12/4 20 9.65 9.04 10.17 10.12 9.64
12/5 21 12/6 22
12/7 23
12/8 24
12/9 25
12/10 26
12/11 27
12/12 28 12/13 29 12/14 30 10.22 9.38 10.41 10.69 10.05
12/15 31
12/16 32
12/17 33
12/18 34
12/19 35 12/20 36 12/21 37
12/22 38
12/23 39

194
Date Day
Bottle No. 6
Cumulative CH4 ml @ STP
Bottle No. 7
Cumulative CH4
ml® STP
Bottle No. 8
Cumulative CH4
ml & STP
Bottle No. 9
Cumulative CH4 ml @ STP
Bottle No. 10
Cumulative CH4 ml @ STP
12/24 40
12/25 41
12/2 6 42
12/27 43
12/28 44
12/29 45
12/30 46
12/31 47
1/1/93 48
1/2 49
1/3 50
1/4 51
1/5 52
1/6 53 1/7 54
1/8 55 1/9 56
1/10 57
1/11 58
1/12 59
10.46
10.68
9.79 10.72
10.03 11.12
10.94
11.29
10.51
10.73
195
APPENDIX B
DATA PROFILE OF THE SBAR SYSTEM AT A 25-DAY OPERATING PERIOD

196
TS content of 10%
Cumulative CH4 Holding/Recycling Tank Eff. from Solid Bed
Date Day over 25 days pH pH ml @ STP
2/6/93 1 2.73 6.86 6.75
2/7 2 6.39 6.79 6.62
2/8 3 10.23 6.74 6.57
2/9 4 15.78 6.88 6.65
2/10 5 21.34 6.88 6.73
2/11 6 26.86 6.90 6.78
2/12 7 32.60 6.93 6.75
2/13 8 38.79 7.00 6.87 2/15 9 44.60 7.01 6.92
2/16 10 49.92 6.90 6.92
2/17 11 54.76 7.04 6.94
2/18 12 59.59 7.02 6.97
2/19 13 64.58 7.07 6.97
2/20 14 69.94 7.20 7.11 2/21 15 74.75 7.21 7.12
2/22 16 78.67 7.12 7.10
2/23 17 81.60 7.24 7.13
2/24 18 83.95 7.29 7.18
2/25 19 85.87 7.35 7.25
2/26 20 87.85 7.36 7.26
2/27 21 89.36 7.37 7.27
2/28 22 90.60 7.39 7.29
3/1 23 91.84 7.40 7.31
3/2 24 92.92 7.40 7.33 3/3 25 93.75 7.40 7.33
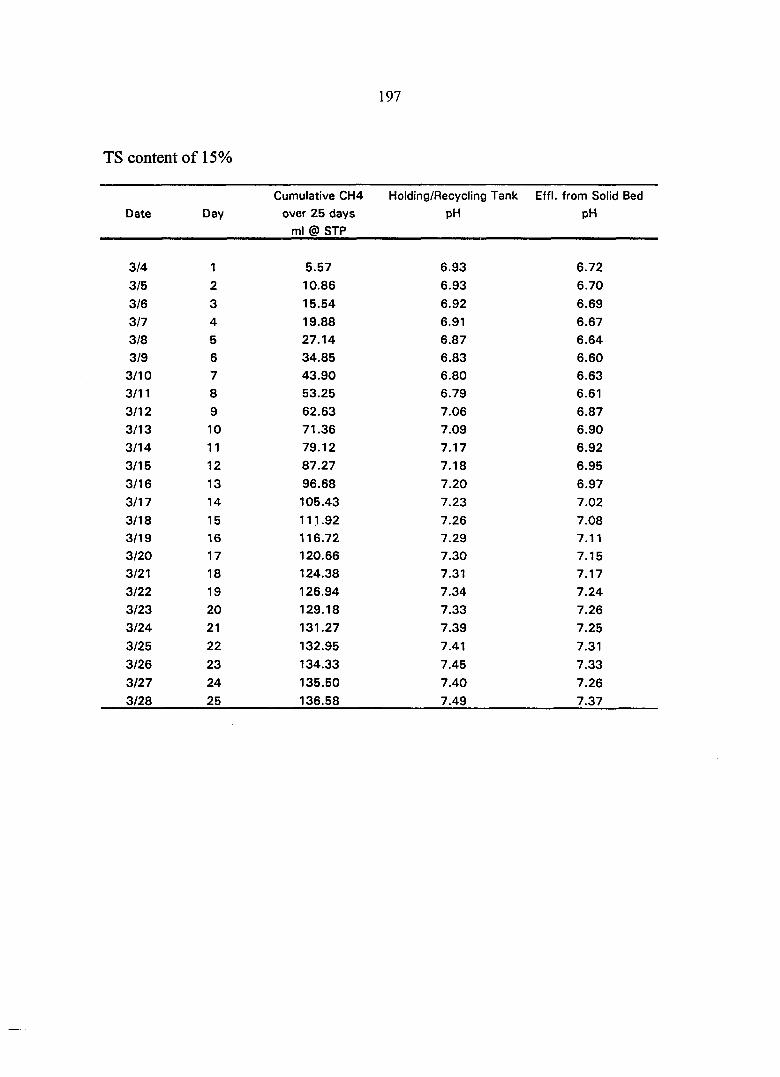
197
TS content of 15%
Cumulative CH4 Holding/Recycling Tank Effl. from Solid Bed
Date Day over 25 days pH pH
ml @ STP
3/4 1 5.57 6.93 6.72
3/5 2 10.86 6.93 6.70
3/6 3 15.54 6.92 6.69
3/7 4 19.88 6.91 6.67
3/8 5 27.14 6.87 6.64
3/9 6 34.85 6.83 6.60
3/10 7 43.90 6.80 6.63
3/11 8 53.25 6.79 6.61
3/12 9 62.63 7.06 6.87
3/13 10 71.36 7.09 6.90
3/14 11 79.12 7.17 6.92
3/15 12 87.27 7.18 6.95
3/16 13 96.68 7.20 6.97
3/17 14 105.43 7.23 7.02
3/18 15 111.92 7.26 7.08
3/19 16 116.72 7.29 7.11
3/20 17 120.66 7.30 7.15
3/21 18 124.38 7.31 7.17
3/22 19 126.94 7.34 7.24
3/23 20 129.18 7.33 7.26
3/24 21 131.27 7.39 7.25
3/25 22 132.95 7.41 7.31
3/26 23 134.33 7.45 7.33
3/27 24 135.50 7.40 7.26
3/28 25 136.58 7.49 7.37
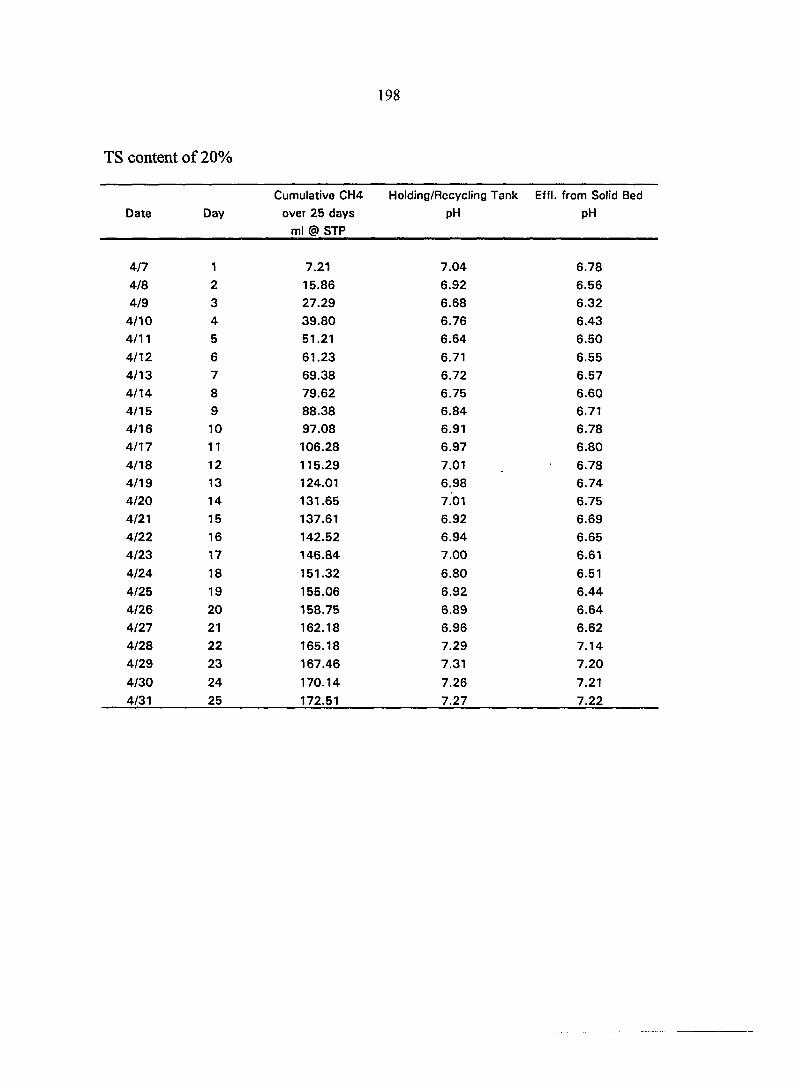
198
TS content of 20%
Cumulative CH4 Holding/Recycling Tank Effl. from Solid Bed
Date Day over 25 days pH pH
ml @ STP
4/7 1 7.21 7.04 6.78
4/8 2 15.86 6.92 6.56
4/9 3 27.29 6.68 6.32
4/10 4 39.80 6.76 6.43
4/11 5 51.21 6.64 6.50
4/12 6 61.23 6.71 6.55
4/13 7 69.38 6.72 6.57
4/14 8 79.62 6.75 6.60
4/15 9 88.38 6.84 6.71
4/16 10 97.08 6.91 6.78
4/17 11 106.28 6.97 6.80
4/18 12 115.29 7.01 6.78
4/19 13 124.01 6.98 6.74
4/20 14 131.65 7.01 6.75
4/21 15 137.61 6.92 6.69
4/22 16 142.52 6.94 6.65
4/23 17 146.84 7.00 6.61
4/24 18 151.32 6.80 6.51
4/25 19 155.06 6.92 6.44
4/26 20 158.75 6.89 6.64
4/27 21 162.18 6.96 6.62
4/28 22 165.18 7.29 7.14
4/29 23 167.46 7.31 7.20
4/30 24 170.14 7.26 7.21
4/31 25 172.51 7.27 7.22

199
APPENDIX C
DATA PROFILE OF THE SBAR SYSTEM AT A 10-DAY SWRT
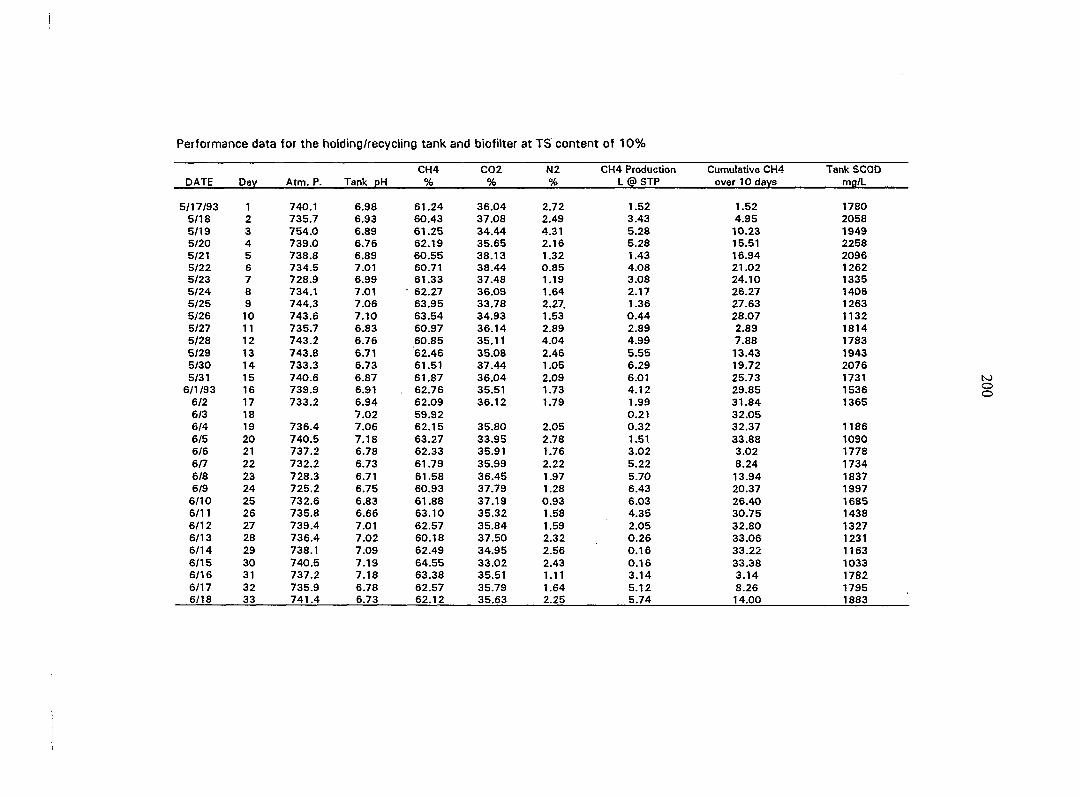
ma^L
1780 2058 1949 2258 2096 1262 1335 1406 1263 1132 1814 1783 1943 2076 1731 1536 1365
1186 1090 1778 1734 1837 1997 1685 1438 1327 1231 1163 1033 1782 1795 1883
Performance data for the holding/recycling tank and biofilter at TS content of 10%
CH4 C02 N2 CH4 Production Cumulative CH4 DATE Day Atm. P. Tank pH % % % L @ STP over 10 days
5/17/93 1 740.1 6.98 61.24 36.04 2.72 1.52 1.52 5/18 2 735.7 6.93 60.43 37.08 2.49 3.43 4.95 5/19 3 754.0 6.89 61.25 34.44 4.31 5.28 10.23 5/20 4 739.0 6.76 62.19 35.65 2.16 5.28 15.51 5/21 5 738.8 6.89 60.55 38.13 1.32 1.43 16.94 5/22 6 734.5 7.01 60.71 38.44 0.85 4.08 21.02 5/23 7 728.9 6.99 61.33 37.48 1.19 3.08 24.10 5/24 8 734.1 7.01 • 62.27 36.09 1.64 2.17 26.27 5/25 9 744.3 7.06 63.95 33.78 2.27 1.36 27.63 5/26 10 743.6 7.10 63.54 34.93 1.53 0.44 28.07 5/27 11 735.7 6.83 60.97 36.14 2.89 2.89 2.89 5/28 12 743.2 6.76 60.85 35.11 4.04 4.99 7.88 5/29 13 743.8 6.71 62.46 35.08 2.46 5.55 13.43 5/30 14 733.3 6.73 61.51 37.44 1.05 6.29 19.72 5/31 15 740.6 6.87 61.87 36.04 2.09 6.01 25.73
6/1/93 16 739.9 6.91 62.76 35.51 1.73 4.12 29.85 6/2 17 733.2 6.94 62.09 36.12 1.79 1.99 31.84 6/3 18 7.02 59.92 0.21 32.05 6/4 19 736.4 7.06 62.15 35.80 2.05 0.32 32.37 6/5 20 740.5 7.18 63.27 33.95 2.78 1.51 33.88 6/6 21 737.2 6.78 62.33 35.91 1.76 3.02 3.02 6/7 22 732.2 6.73 61.79 35.99 2.22 5.22 8.24 6/8 23 728.3 6.71 61.58 36.45 1.97 5.70 13.94 6/9 24 725.2 6.75 60.93 37.79 1.28 6.43 20.37
6/10 25 732.6 6.83 61.88 37.19 0.93 6.03 26.40 6/11 26 735.8 6.66 63.10 35.32 1.58 4.35 30.75 6/12 27 739.4 7.01 62.57 35.84 1.59 2.05 32.80 6/13 28 736.4 7.02 60.18 37.50 2.32 0.26 33.06 6/14 29 738.1 7.09 62.49 34.95 2.56 0.16 33.22 6/15 30 740.5 7.19 64.55 33.02 2.43 0.16 33.38 6/16 31 737.2 7.18 63.38 35.51 1.11 3.14 3.14 6/17 32 735.9 6.78 62.57 35.79 1.64 5.12 8.26 6/18 33 741.4 6.73 62.12 35.63 2.25 5.74 14.00
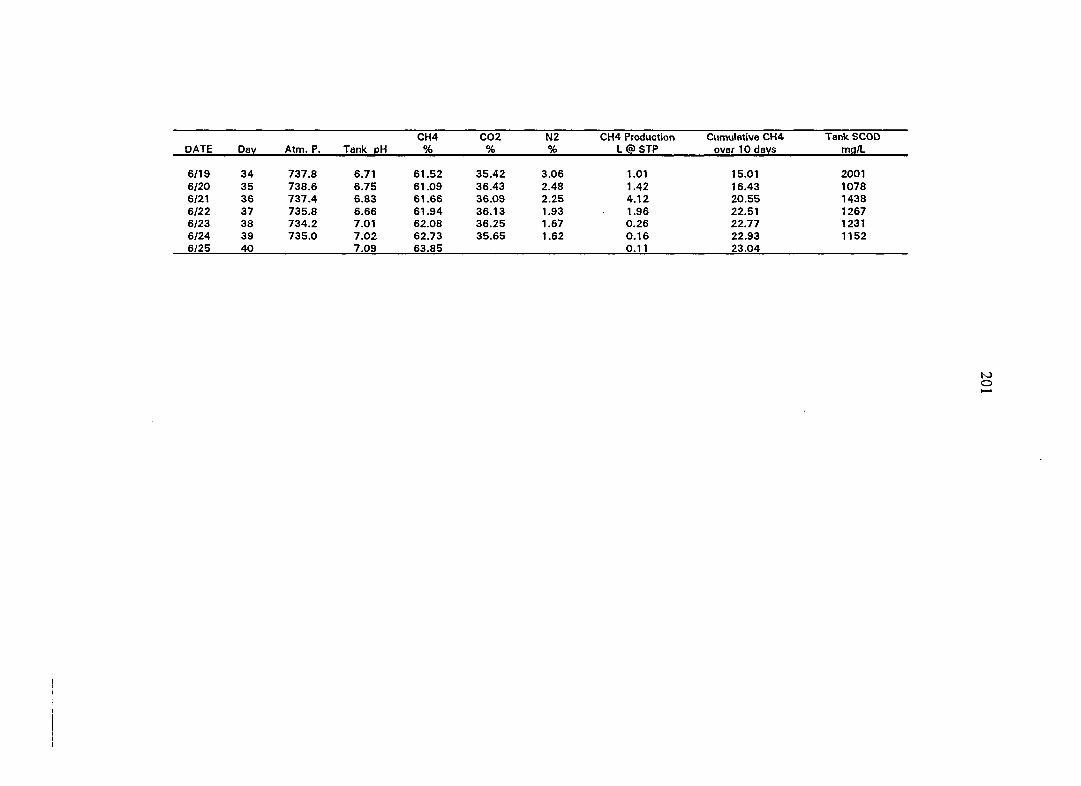
CH4 C02 N2 CH4 Production Cumulative CH4 Tank SCOD DATE Day Atm. P. Tank pH % % % L @ STP over 10 days ma/L
6/19 34 737.8 6.71 61.52 35.42 3.06 1.01 15.01 2001 6/20 35 738.6 6.75 61.09 36.43 2.48 1.42 16.43 1078 6/21 36 737.4 6.83 61.66 36.09 2.25 4.12 20.55 1438 6/22 37 735.8 6.66 61.94 36.13 1.93 1.96 22.51 1267 6/23 38 734.2 7.01 62.08 36.25 1.67 0.26 22.77 1231 6/24 39 735.0 7.02 62.73 35.65 1.62 0.16 22.93 1152 6/25 40 7.09 63.85 0.11 23.04

Performance data for the acidogenic reactors (solid bed) at TS content of 10%
CH4 C02 N2 CH4 Production Cumulative CH4 Eff. SCOD TS TVS DATE Dav Atm. P. Eff. DH % % % L@STP over 10 davs mo/L Destru., % Destru.. %
5/17/93 1 740.1 6.34 25.35 72.83 1.82 2.81 2.81 4088 5/18 2 735.7 6.57 34.17 64.49 1.34 2.04 4.85 2706 5/19 3 754.0 6.38 36.60 61.64 1.76 3.68 8.53 3269 5/20 4 739.0 6.60 38.86 59.67 1.47 3.49 12.02 3428 5/21 5 738.8 6.73 43.64 55.57 0.79 3.49 15.51 2591 5/22 6 734.5 6.82 50.18 48.64 1.18 4.53 20.04 1730 5/23 7 728.9 6.85 52.99 45.46 1.55 5.21 25.25 1684 5/24 8 734.1 6.90 53.59 44.77 1.64 4.34 29.59 1605 5/25 9 744.3 6.97 55.66 43.05 1.29 4.46 34.05 1587 5/26 10 743.6 7.02 56.94 41.12 1.94 3.84 37.89 1524 40.41 50.74 5/27 11 735.7 6.45 27.18 71.20 1.62 5.28 5.28 2827 5/28 12 743.2 6.50 39.06 59.50 1.44 2.91 8.19 2536 5/29 13 743.8 6.43 36.60 61.48 1.92 5.69 13.88 2907 5/30 14 733.3 6.47 40.93 57.72 1.35 5.54 19.42 2707 5/31 15 740.6 6.56 46.91 52.10 0.99 7.09 26.51 2018
6/1/93 16 739.9 6.79 53.63 45.19 1.18 6.64 33.15 1861 6/2 17 733.2 6.84 55.56 42.81 1.63 6.26 39.41 1630 6/3 18 6.95 55.92 3.45 42.86 6/4 19 736.4 7.00 56.24 41.89 1.87 4.54 47.40 1277 6/5 20 740.5 7.11 56.24 42.09 1.67 3.06' 50.46 1156 46.48 54.92 6/6 21 737.2 6.36 28.15 70.40 1.45 5.41 5.41 2645 6/7 22 732.2 6.40 39.67 58.31 2.02 2.97 8.38 2551 6/8 23 728.3 6.43 37.18 61.33 1.49 5.54 13.92 2711 6/9 24 725.2 6.52 42.01 56.86 1.13 6.24 • 20.16 2697
6/10 25 732.6 6.64 47.25 51.21 1.54 7.54 27.70 1947 6/11 26 735.8 6.82 54.93 43.21 1.86 6.42 34.12 1711 6/12 27 739.4 6.91 57.03 41.29 1.68 6.77 40.89 1511 6/13 28 736.4 6.97 58.33 40.20 1.47 3.56 44.45 1207 6/14 29 738.1 7.05 58.62 39.63 1.75 4.46 48.91 1215 6/15 30 740.5 7.12 59.68 38.51 1.81 3.31 52.22 1134 48.35 56.74 6/16 31 737.2 6.35 30.41 67.97 1.62 5.90 5.90 2703 6/17 32 735.9 6.39 38.11 60.46 1.43 2.85 8.75 2667 6/18 33 741.4 6.44 39.23 59.21 1.56 5.89 14.64 2541

CH4 C02 N2 CH4 Production Cumulative CH4 Eff. SCOD TS TVS DATE Day Atm. P. m
D I
% % % L @ STP over 10 days ma/L Destru., % Destru., %
6/19 34 737.8 6.48 44.08 54.23 1.69 6.58 21.22 2133 6/20 35 738.6 6.61 49.15 49.00 1.85 7.04 28.26 1154 6/21 36 737.4 6.79 54.34 43.95 1.71 6.81 35.07 1743 6/22 37 735.8 6.88 57.16 41.18 1.66 6.63 41.70 1511 6123 38 734.2 6.98 58.71 39.66 1.63 4.15 45.85 1207 6/24 39 735.0 7.06 58.93 39.53 1.54 4.25 50.10 1283 6/25 40 7.07 59.44 3.58 53.68 50.67 58.15
to o U)

Performance data for the holding/recycling tank and biofilter at TS content of 15%
CH4 C02 N2 CH4 Production Cumulative CH4 Tanl< SCOD DATE Day Atm. P. Tank pH % % % L @ STP over 10 davs tna/L
6/26 1 739.1 7.02 63.15 34.37 2.48 1.57 1.57 2146 6/27 2 734.4 6.88 62.22 35.14 2.64 7.99 9.56 1538 6/28 3 737.6 6.76 61.64 36.78 1.58 6.50 16.06 1647 6/29 4 735.8 6.68 62.91 36.21 0.88 7.14 23.20 1457 6/30 5 736.0 6.69 61.54 37.53 0.93 6.72 29.92 1394 7/1 6 737.4 6.75 62.48 36.54 0.98 6.15 36.07 1272 7/2 7 6.87 61.45 3.76 39.83 7/3 8 731.8 6.94 61.25 37.74 1.01 3.00 42.83 1148 7/4 9 728.6 7.01 61.80 36.97 1.23 1.96 44,79 1109 7/5 10 731.0 7.07 61.21 36.85 1.94 1.75 46.54 1042 7/6 11 6.68 62.28 36.20 1.52 4.88 4.88 1695 7/7 12 63.94 8.25 13.13 7/8 13 735.0 6.56 61.47 37.53 1.00 9.11 22.24 1797 7/9 14 734.0 6.61 62.07 37.10 0.83 7.84 30.08 1893
7/10 15 737.8 6.72 61.84 37.19 0.97 7.68 37.76 1539 7/11 16 738.4 6.76 61.61 37.25 1.14 5.72 43.48 1311 7/12 17 741.2 6.88 62.03 36.92 1.05 3.52 47.00 1261 7/13 18 738.6 6.97 62.15 36.97 0.88 1.55 48.55 1218 7/14 19 62.93 1.08 49.63 7/15 20 740.9 7.09 63.11 35.51 1.38 1.51 51.14 1096 7/16 21 739.8 6.76 63.01 35.75 1.24 5.10 5.10 1827 7/17 22 737.2 6.66 62.54 36.11 1.35 8.24 13.34 1741 7/18 23 736.1 6.69 62.18 36.34 1.48 9.26 22.60 1857 7/19 24 735.9 6.73 61.66 37.29 1.05 8.10 30.70 1924 7/20 25 734.6 6.77 61.25 37.80 0.95 7.78 38.48 1667 7/21 26 731.5 6.84 61.57 37.46 0.97 5.81 44.29 1476 7/22 27 729.3 6.91 60.89 37.93 1.18 3.57 47.86 1251 7/23 28 731.7 7.03 61.78 36.91 1.31 1.58 49.44 1205 7/24 29 735.4 7.08 62.34 36.22 1.44 1.12 50.56 1155 7/25 30 736.4 7.11 62.78 36.01 1.21 0.38 50.94 1073 7/26 31 736.5 6.83 63.24 35.70 1.06 5.05 5.05 1768 7/27 32 735.2 6.77 62.58 36.55 0.87 8.19 13.24 1741 7/28 33 739.3 6.72 61.99 37.00 1.01 9.43 22.67 1857
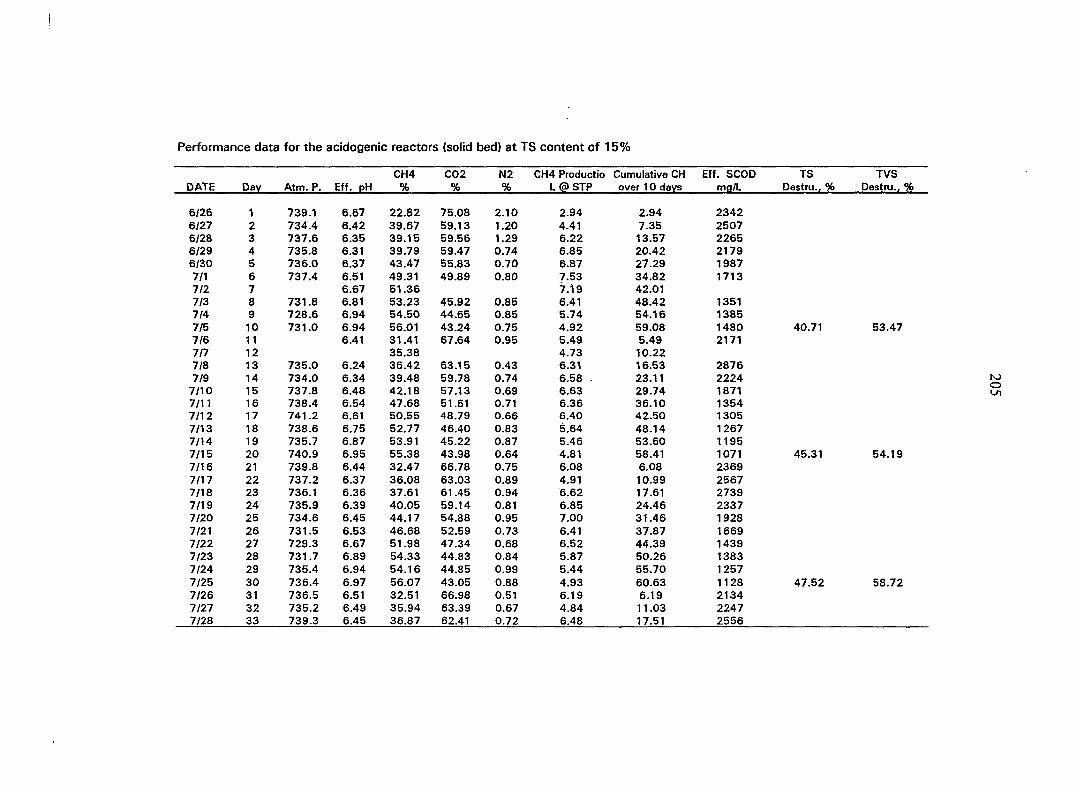
Performance data for the acidogenic reactors (solid bed) at TS content of 15%
CH4 C02 N2 CH4 Productio Cumulative CH Eff. SCOD DATE Dav Atm. P. Eff. pH % % % L @ S T P over 10 davs mg/L
6/26 1 739.1 6.67 22.82 75.08 2.10 2.94 2.94 2342 6/27 2 734.4 6.42 39.67 59.13 1.20 4.41 7.35 2507 6/28 3 737.6 6.35 39.15 59.56 1.29 6.22 13.57 2265 6/29 4 735.8 6.31 39.79 59.47 0.74 6.85 20.42 2179 6/30 5 736.0 6.37 43.47 55.83 0.70 6.87 27.29 1987 7/1 6 737.4 6.51 49.31 49.89 0.80 7.53 34.82 1713 7/2 7 6.67 51.36 7.19 42.01 7/3 8 731.8 6.81 53.23 45.92 0.85 6.41 48.42 1351 7/4 9 728.6 6.94 54.50 44.65 0.85 5.74 54.16 1385 7/5 10 731.0 6.94 56.01 43.24 0.75 4.92 59.08 1480 7/6 11 6.41 31.41 67.64 0.95 5.49 5.49 2171 7/7 12 35.38 4.73 10.22 7/8 13 735.0 6.24 36.42 63.15 0.43 6.31 16.53 2876 7/9 14 734.0 6.34 39.48 59.78 0.74 6.58 . 23.11 2224
7/10 15 737.8 6.48 42.18 57.13 0.69 6.63 29.74 1871 7/n 16 738.4 6.54 47.68 51.61 0.71 6.36 36.10 1354 7/12 17 741.2 6.61 50.55 48.79 0.66 6.40 42.50 1305 7/13 18 738.6 6.75 52.77 46.40 0.83 5.64 48.14 1267 7/14 19 735.7 6.87 53.91 45.22 0.87 5.46 53.60 1195 7/15 20 740.9 6.95 55.38 43.98 0.64 4.81 58.41 1071 7/16 21 739.8 6.44 32.47 66.78 0.75 6,08 6.08 2369 7/17 22 737.2 6.37 36.08 63.03 0.89 4.91 10.99 2567 7/18 23 736.1 6.36 37.61 61.45 0.94 6.62 17.61 2739 7/19 24 735.9 6.39 40.05 59.14 0.81 6.85 24.46 2337 7/20 25 734.6 6.45 44.17 54.88 0.95 7.00 31.46 1928 7/21 26 731.5 6.53 46.68 52.59 0.73 6.41 37.87 1669 7/22 27 729.3 6.67 51.98 47.34 0.68 6.52 44.39 1439 7/23 28 731.7 6.89 54.33 44.83 0.84 5.87 50.26 1383 7/24 29 735.4 6.94 54.16 44.85 0.99 5.44 55.70 1257 7/25 30 736.4 6.97 56.07 43.05 0.88 4.93 60.63 1128 7/26 31 736.5 6.51 32.51 66.98 0.51 6.19 6.19 2134 7/27 32 735.2 6.49 35.94 63.39 0.67 4.84 11.03 2247 7/28 33 739.3 6.45 36.87 62.41 0.72 6.48 17.51 2556
TS Destfu.. %
TVS Destfu.. %
40.71 53.47
to o U1
45.31 54.19
47.52 58.72
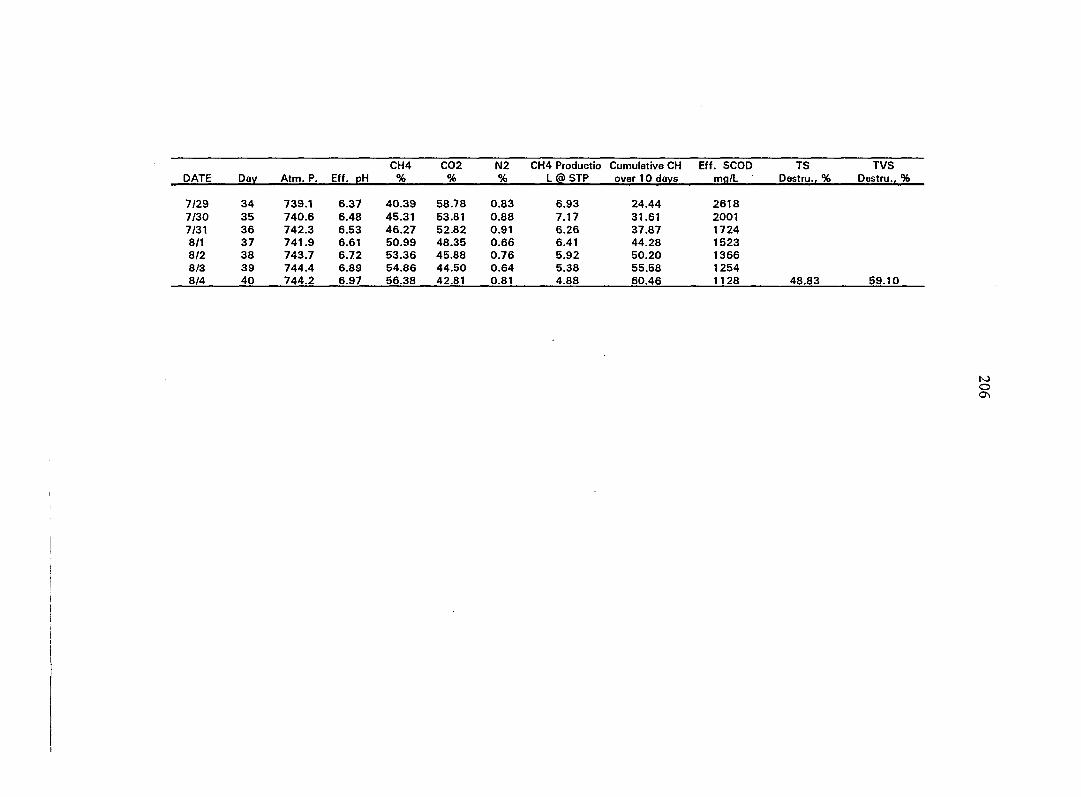
CH4 C02 N2 CH4 Productio Cumulative CH Eff. SCOD TS TVS DATE Day Atm. P. Eff. pH % % % L @) STP over 10 days mq/L ' Destru., % Destru.. %
7/29 34 739.1 6.37 40.39 58.78 0.83 6.93 24.44 2618 7/30 35 740.6 6.48 45.31 53.81 0.88 7.17 31.61 2001 7/31 36 742.3 6.53 46.27 52.82 0.91 6.26 37.87 1724 8/1 37 741.9 6.61 50.99 48.35 0.66 6.41 44.28 1523 8/2 38 743.7 6.72 53.36 45.88 0.76 5.92 50.20 1366 8/3 39 744.4 6.89 54.86 44.50 0.64 5.38 55.58 1254 8/4 40 744.2 6.97 56.38 42.81 0.81 4^88 60.46 1128 48.83 59.10
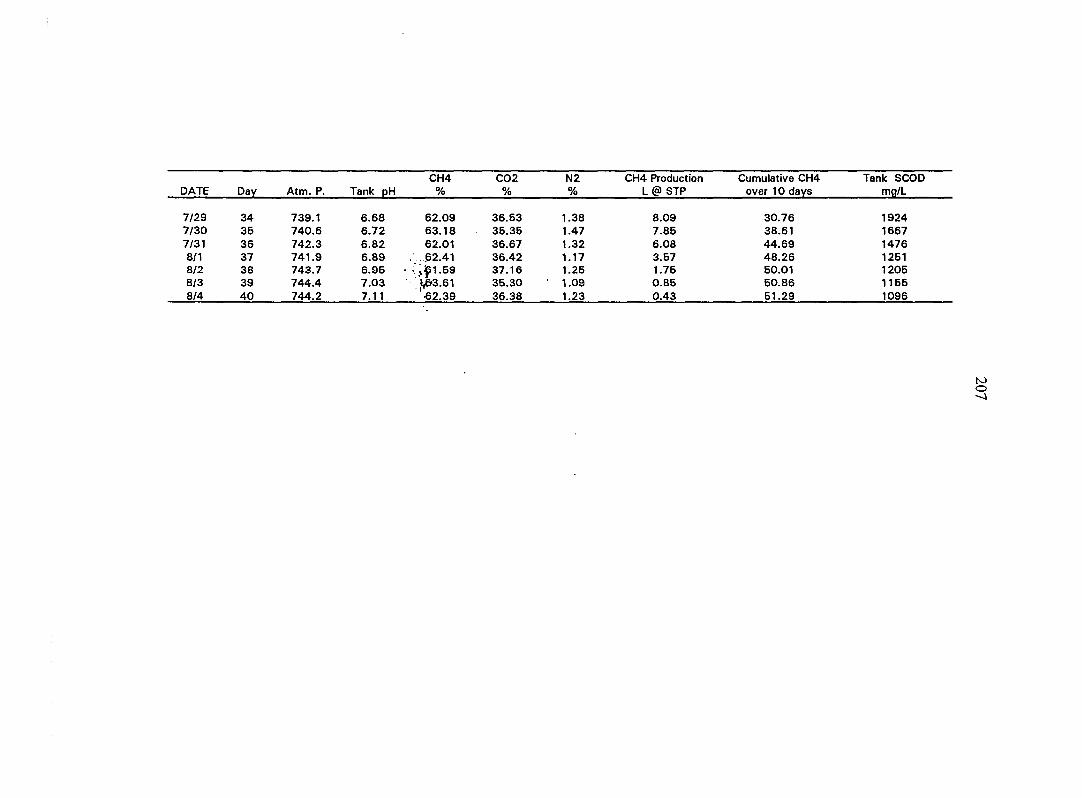
CH4 C02 N2 CH4 Production Cumulative CH4 Tank SCOD DATE Day Atm. P. Tank pH % % % L @ STP over 10 days mg/L
7/29 34 739.1 6.68 62.09 36.63 1.38 8.09 30.76 1924 7/30 35 740.6 6.72 63.18 35.35 1.47 7.85 38.61 1667 7/31 36 742.3 6.82 62.01 36.67 1.32 6.08 44.69 1476 8/1 37 741.9 6.89 , . 62.41 36.42 1.17 3.57 48.26 1251 8/2 38 743.7 6.95 • ',^1.59 37.16 1.26 1.75 50.01 1205 8/3 39 744.4 7.03 ' •»^3.61 35.30 1.09 0.85 50.86 1155 8/4 40 744.2 7.11 '•62.39 36.38 1^23 043 51.29 1096
208
APPENDIX D
DATA PROFILE OF THE DEAR SYSTEM AT A TS CONTENT OF 10% AND A 14-DAY SWRT

Performance data for the acidogenic reactors
CH4 C02 N2 CH4 Production Cumulative CH4 Eff. COD TS TVS
DATE Day Atm. P. Eff. pH % % % L @ S T P over 7 days, L mo/L Destruction., Destruction.,
12/26/92 1 745.40 6.94 26.87 49.73 23.40 3.13 3.13 2933
12/27 2 743.90 6.61 30.87 49.23 19.90 1.03 4.16 3322
12/28 3 741.50 6.54 29.83 50.85 19.32 0.89 5.05 3730
12/29 4 740.70 6.55 30.87 50.60 18.53 0.79 5.84 4208
12/30 5 738.20 6.6 33.06 50.06 16.88 0.52 6.36 3072
12/31 6 750.20 6.87 35.08 48.60 16.32 0.33 6.69 2954
1/1 7 750.10 6.85 38.65 46.60 14.75 0.77 7.46 2490
1/2 8 750.00 6.82 31.45 58.88 9.67 6.93 6.93 3530
1/3 9 736.60 6.62 31.71 61.82 6.47 3.58 10.51 3986
1/4 10 735.40 6.65 37.06 56.47 6.47 3.80 14.32 3478
1/5 11 737.80 6.7 41.71 53.94 4.35 4.27 18.59 3234
1/6 12 740.10 6.78 44.95 50.46 4.60 5.20 23.79 2436
1/7 13 742.00 6.94 48.18 46.98 4.84 6.08 29.87 1738
1/8 14 740.50 6.89 43.58 52.13 4.29 5.98 35.85 1658 33.27 38.06
1/9 15 748.60 6.56 38.98 57.28 3.74 9.91 9.91 3915
1/10 16 750.40 6.65 39.87 57.24 2.89 8.01 17.92 2973
1/11 17 749.30 6.67 44.36 53.31 2.33 9.50 27.41 2493
1/12 18 747.60 6.92 48.94 49.20 1.86 8.30 35.71 1813
1/13 19 744.40 7.1 51.61 46.37 2.03 8.38 44.09 2349
1/14 20 744.60 7.12 54.28 43.53 2.19 6.67 50.76 1743
1/15 21 742.70 7.13 53.29 43.38 3.33 7.73 58.49 1253 47.39 58.88
1/16 22 744.30 6.9 44.53 52.61 2.86 • 13.46 13.46 2349
1/17 23 745.60 6.84 42.51 55.75 1.74 13.62 27.08 2818
1/18 24 749.80 6.97 46.73 50.89 2.38 12.96 40.04 2421
1/19 25 753.00 6.97 51.39 47.08 1.53 12.19 52.23 1789
1/20 26 746.70 7.13 43.49 54.05 2.46 10.29 62.52 1045
1/21 27 740.60 7.17 55.27 42.79 1.94 8.70 71.22 906
1/22 28 739.50 7.11 56.76 40.76 2.48 8.26 79.48 1250 48.95 58.14
1/23 29 730.20 6.97 47.90 50.28 1.82 16.27 16.27 1974
1/24 30 745.20 6.96 44.79 53.65 1.56 15.02 31.29 2068
1/25 31 747.40 6.99 51.59 46.52 1.89 12.85 44.15 1683
1/26 32 742.20 7.02 53.71 44.61 1.68 12.03 56.18 1309 1/27 33 742.50 7.02 55.74 42.44 1.82 9.57 65.76 1645
to o
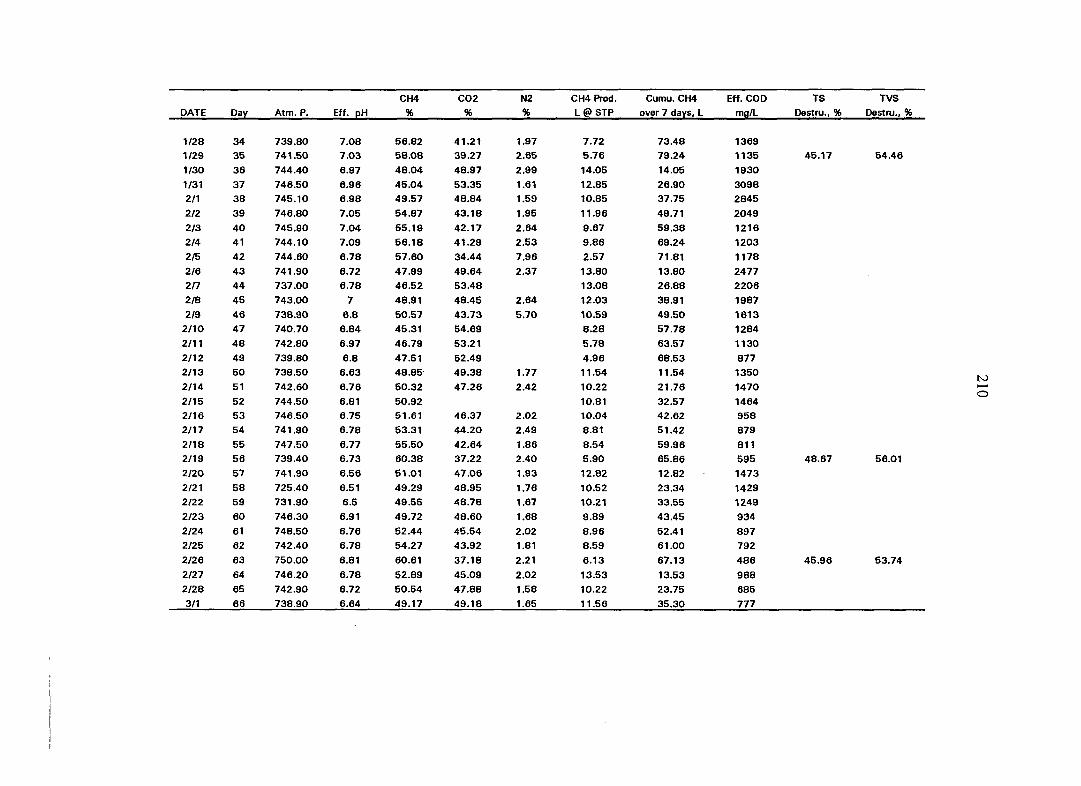
34 35
36
37 38
39
40
41
42
43
44
45
46
47
48
49
50
51
52 53
54
55
56
57
58
59
60
61
62
63
64
65
66
CH4 C02 N2 CH4 Prod. Cumu. CH4 Eff. COD
Atm. P. Eff. pH % % % L @ STP over 7 days, L mg/L
739.80 7.08 56.82 41.21 1.97 7.72 73.48 1369
741.50 7.03 58.08 39.27 2.65 5.76 79.24 1135
744.40 6.97 48.04 48.97 2.99 14.05 14.05 1930
746.50 6.96 45.04 53.35 1.61 12.85 26.90 3098
745.10 6.98 49.57 48.84 1.59 10.85 37.75 2845
746.80 7.05 54.87 43.18 1.95 11.96 49.71 2049
745.90 7.04 55.19 42.17 2.64 9.67 59.38 1216
744.10 7.09 56.18 41.29 2.53 9.86 69.24 1203
744.60 6.78 57.60 34.44 7.96 2.57 71.81 1178
741.90 6.72 47.99 49.64 2.37 13.80 13.80 2477
737.00 6.78 46.52 53.48 13.08 26.88 2206
743.00 7 48.91 48.45 2.64 12.03 38.91 1987
738.90 6.8 50.57 43.73 5.70 10.59 49.50 1613 740.70 6.84 45.31 54.69 8.28 57.78 1284
742.80 6.97 46.79 53.21 5.78 63.57 1130
739.80 6.8 47.51 52.49 4.96 68.53 877
738.50 6.63 48.85 49.38 1.77 11.54 11.54 1350
742.60 6.76 50.32 47.26 2.42 10.22 21.76 1470
744.50 6.81 50.92 10.81 32.57 1464 746.50 6.75 51.61 46.37 2.02 10.04 42.62 958
741.90 6.78 53.31 44.20 2.49 8.81 51.42 879
747.50 6.77 55.50 42.64 1.86 8.54 59.96 811
739.40 6.73 60.38 37.22 2.40 5.90 65.86 595
741.90 6.56 51.01 47.06 1.93 12.82 12.82 1473
725.40 6.51 49.29 48.95 1.76 10.52 23.34 1429
731.90 6.5 49.55 48.78 1.67 10.21 33.55 1249
746.30 6.91 49.72 48.60 1.68 9.89 43.45 934
748.50 6.76 52.44 45.54 2.02 8.96 52.41 897
742.40 6.78 54.27 43.92 1.81 8.59 61.00 792
750.00 6.81 60.61 37.18 2.21 6.13 67.13 486
746.20 6.78 52.89 45.09 2.02 13.53 13.53 988
742.90 6.72 50.54 47.88 1.58 10.22 23.75 685
738.90 6.64 49.17 49.18 1.65 11.56 35.30 777
TS Destru., %
TVS Destru., %
45.17 54.46
48.67 56.01
45.96 53.74

CH4 C02 N2 CH4 Prod. Cumu. CH4 Eff. COD TS TVS
DATE Day Atm. P. Eff. pH % % % L © STP over 7 days, L mg/L Destru., % Destru., %
ztz 67 732.60 6.68 50.26 47.69 2.05 11.43 46.73 782
3/3 68 734.90 6.72 52.40 45.62 1.98 10.78 57.51 761
3/4 69 739.40 6.75 55.33 43.06 1.61 8.83 66.34 748
3/5 70 739.20 6.81 60.96 37.03 2.01 6.42 72.75 46.91 55.06
3/6 71 739.30 6.74 53.87 46.13 11.98 11.98 1371
3/7 72 733.10 6.68 52.94 45.44 1.62 10.27 22.25 1246
3/8 73 741.60 6.55 51.93 48.07 11.93 34.18 1106
3/9 74 740.60 6.75 51.02 47.71 1.27 14.67 48.86 987
3/10 75 740.10 6.8 53.44 45.19 1.37 11.86 60.71
3/11 76 748.40 6.74 55.11 43.17 1.72 8.91 69.62 809
3/12 77 746.20 6.72 59.71 37.84 2.45 6.15 75.77 687 48.08 54.44
3/13 78 742.10 6.69 52.15 45.26 2.59 11.96 11.96 2868
3/14 79 744.20 6.6 50.40 48.14 1.46 11.88 23.84 2685
3/15 80 733.40 6.81 50.01 48.59 1.40 13.61 37.46 1266
3/16 81 738.20 6.85 51.15 47.64 1.21 13.20 50.65
3/17 82 741.20 6.92 53.54 45.24 1.22 10.36 61.02 1163
3/18 83 748.20 6.88 56.05 42.25 1.70 8.70 69.72
3/19 84 744.00 6.79 60.59 37.00 2.41 6.22 75.94 903 46.90 54.76
3/20 85 746.40 6.7 54.44 43.72 1.84 12.32 12.32 1452
3/21 86 744.40 6.67 52.15 46.21 1.64 10.87 23.19 1156
3/22 87 742.00 6.68 50.26 48.29 1.45 12.59 35.78 1277
3/23 88 741.80 6.65 50.40 48.08 1.52 13.59 49.37
3/24 89 742.40 6.67 53.48 45.12 1.40 10.93 60.29 1125
3/25 90 745.40 6.89 56.03 43.97 8.95 69.24
3/26 91 744.00 6.92 60.08 37.77 2.15 6.10 75.34 975 49.32 57.36
3/27 92 742.50 6.77 54.78 42.82 2.40 13.33 13.33 1346
3/28 93 739.40 6.76 52.24 46.06 1.70 11.72 25.05 1299
3/29 94 737.70 6.68 50.36 48.27 1.37 13.86 38.91 3/30 95 732.10 6.71 51.66 46.71 1.63 15.20 54.11 1243
3/31 96 724.40 6.76 53.08 45.37 1.55 12.92 67.03 1221
4/1 97 739.90 55.76 42.28 1.96 9.86 76.90
4/2 98 740.90 59.30 38.14 2.56 6.96 83.86 992 54.98 61.84
4/3 99 743.40 55.54 42.93 1.53 13.94 13.94 1183
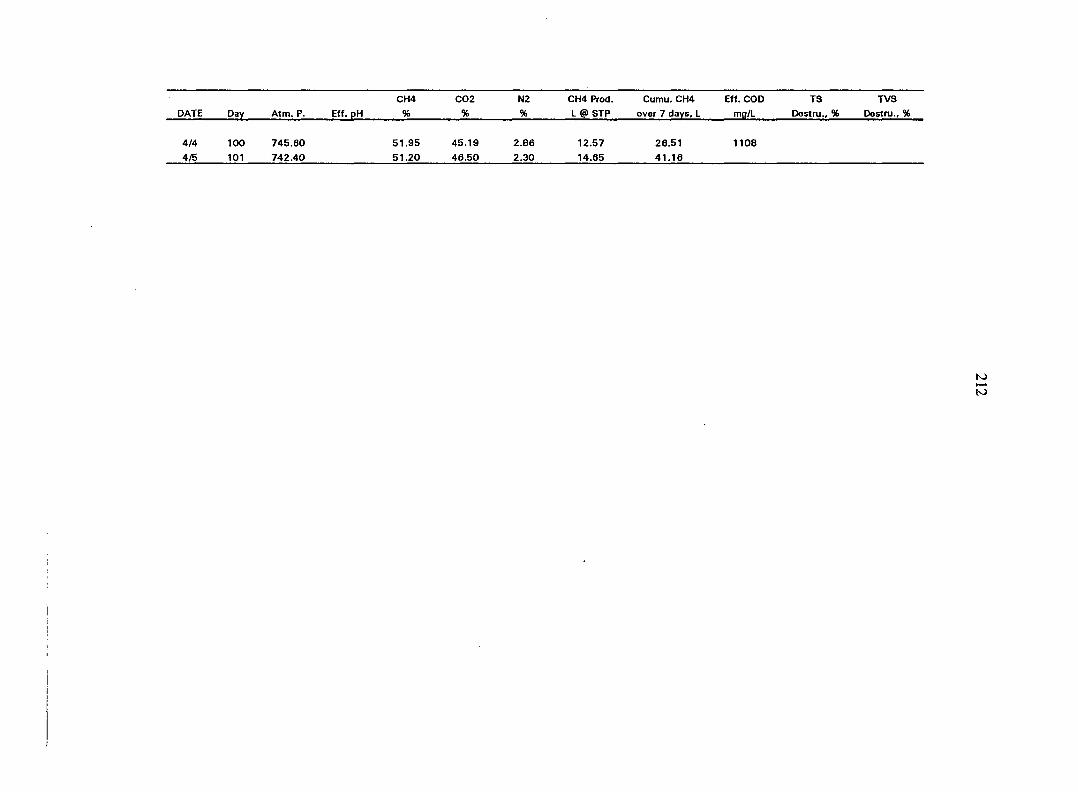
CH4 C02 N2 CH4 Prod. Cumu. CH4 Eff. COD TS TVS
DATE Dav Atm. P. Eff. pH % % % L @ STP over 7 days, L mfl/L Destru., % Destru., %
4/4 100 745.60 51.95 45.19 2.86 12.57 26.51 1108
4/5 101 742.40 51.20 46.50 2.30 14.65 41.16
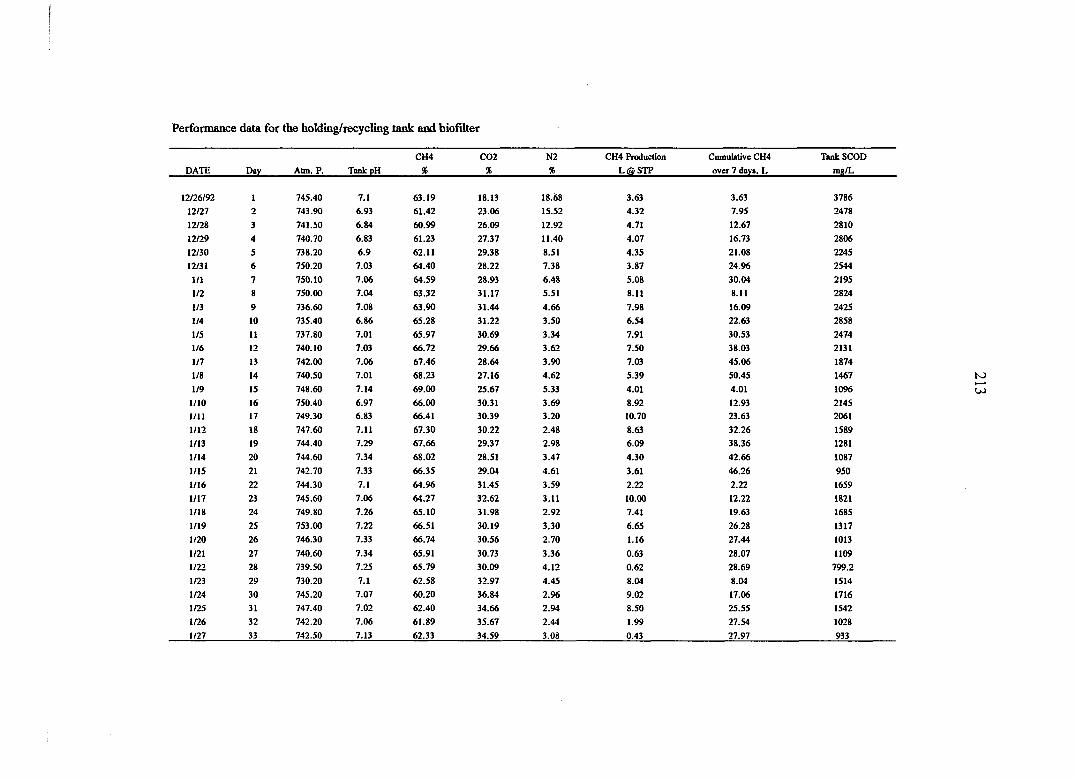
3786
2478
2810
2806
2245
2544
2195
2824
2425
2858
2474
2131
1874
1467
1096
2145
2061
1589
1281
1087
950
1659
1821 1685
1317
1013
1109
799.2
1514
1716
1542
1028
933
Perfonnance data for the holding/recy cling tank and biofilter
CH4 C02 N2 CH4 Production Cumulative
DATE Dav Atni. P. Tank pH % % % L@STP over 7 dayi
12/26/92 1 745.40 7.1 63.19 18.13 18.68 3.63 3.63
12/27 2 743.90 6.93 61.42 23.06 15.52 4.32 7.95
12/28 3 741.50 6.84 60.99 26.09 12.92 4.71 12.67
12/29 4 740.70 6.83 61.23 27.37 11.40 4.07 16.73
12/30 5 738.20 6.9 62.11 29.38 8.51 4.35 21.08
12/31 6 750.20 7.03 64.40 28.22 7.38 3.87 24.96
1/1 7 750.10 7.06 64.59 28.93 6.48 5.08 30.04
1/2 8 750.00 7.04 63.32 31.17 5.51 8.11 8.11
1/3 9 736.60 7.08 63.90 31.44 4.66 7.98 16.09
1/4 10 735.40 6.86 65.28 31.22 3.50 6.54 22.63
1/5 11 737.80 7.01 65.97 30.69 3.34 7.91 30.53
1/6 12 740.10 7.03 66.72 29.66 3.62 7.50 38.03
1/7 13 742.00 7.06 67.46 28.64 3.90 7.03 45.06
1/8 14 740.50 7.01 68.23 27.16 4.62 5.39 50.45
1/9 15 748.60 7.14 69.00 25.67 5.33 4.01 4.01
1/10 16 750.40 6.97 66.00 30.31 3.69 8.92 12.93
1/11 17 749.30 6.83 66.41 30.39 3.20 10.70 23.63
1/12 18 747.60 7.11 67.30 30.22 2.48 8.63 32.26
1/13 19 744.40 7.29 67.66 29.37 2.98 6.09 38.36
1/14 20 744.60 7.34 68.02 28.51 3.47 4.30 42.66
1/15 21 742.70 7.33 66.35 29.04 4.61 3.61 46.26
1/16 22 744.30 7.1 64.96 31.45 3.59 2.22 2.22
1/17 23 745.60 7.06 64.27 32.62 3.U 10.00 12.22
1/18 24 749.80 7.26 65.10 31.98 2.92 7.41 19.63
1/19 25 753.00 7.22 66.51 30.19 3,30 6.65 26.28
1/20 26 746.30 7.33 66.74 30.56 2.70 1.16 27.44
1/21 27 740.60 7.34 65.91 30.73 3.36 0.63 28.07
1/22 28 739.50 7.25 65.79 30.09 4.12 0.62 28.69
1/23 29 730.20 7.1 62.58 32.97 4.45 8.04 8.04
1/24 30 745.20 7.07 60.20 36.84 2.96 9.02 17.06
1/25 31 747.40 7.02 62.40 34.66 2.94 8.50 25.55
1/26 32 742.20 7.06 61.89 35.67 2.44 1.99 27.54
1/27 33 742.50 7.13 62.33 34.59 3.08 0.43 27.97

34
35
36
37
38
39
40
41
42
43
44
45
46
47
48
49
50
51
52
53
54
55
56
57
58
59
60
61
62
63
64
65
CH4 C02 N2 CH4 Prod. Cumu. CH4 Eff. COD
Atm. P. Eff. pH % % % L @ STP over 7 days, L mq/L
739.80 7.08 56.82 41.21 1.97 7.72 73.48 1369
741.50 7.03 58.08 39.27 2.65 5.76 79.24 1135
744.40 6.97 48.04 48.97 2.99 14.05 14.05 1930
746.50 6.96 45.04 53.35 1.61 12.85 26.90 3098
745.10 6.98 49.57 48.84 1.59 10.85 37.75 2845
746.80 7.05 54.87 43.18 1.95 11.96 49.71 2049
745.90 7.04 55.19 42.17 2.64 9.67 59.38 1216
744.10 7.09 56.18 41.29 2.53 9.86 69.24 1203
744.60 6.78 57.60 34.44 7.96 2.57 71.81 1178
741.90 6.72 47.99 49.64 2.37 13.80 13.80 2477
737.00 6.78 46.62 53.48 13.08 26.88 2206
743.00 7 48.91 48.45 2.64 12.03 38.91 1987
738.90 6.8 50.57 43.73 5.70 10.59 49.50 1613
740.70 6.84 45.31 54.69 8.28 57.78 1284
742.80 6.97 46.79 53.21 5.78 63.57 1130
739.80 6.8 47.51 52.49 4.96 68.53 877
738.50 6.63 48.85 49.38 1.77 11.54 11.54 1350
742.60 6.76 50.32 47.26 2.42 10.22 21.76 1470
744.50 6.81 50.92 10.81 32.57 1464
746.50 6.75 51.61 46.37 2.02 10.04 42.62 958
741.90 6.78 53.31 44.20 2.49 8.81 51.42 879
747.50 6.77 55.50 42.64 1.86 8.54 59.96 811 739.40 6.73 60.38 37.22 2.40 5.90 65.86 595
741.90 6.56 51.01 47.06 1.93 12.82 12.82 1473
725.40 6.51 49.29 48.95 1.76 10.52 23.34 1429
731.90 6.5 49.55 48.78 1.67 10.21 33.55 1249
746.30 6.91 49.72 48.60 1.68 0 9.89 43.45 934
748.50 6.76 52.44 45.54 2.02 8.96 52.41 897 742.40 6.78 54.27 43.92 1.81 8.59 61.00 792
750.00 6.81 60.61 37.18 2.21 6.13 67.13 486
746.20 6.78 52.89 45.09 2.02 13.53 13.53 988 742.90 6.72 50.54 47.88 1.58 10.22 23.75 685
738.90 6.64 49.17 49.18 1.65 11.56 35.30 777
TS
Destru., %
TVS
Destru., %
45.17 54.46
to
48.67 56.01
45.96 53.74
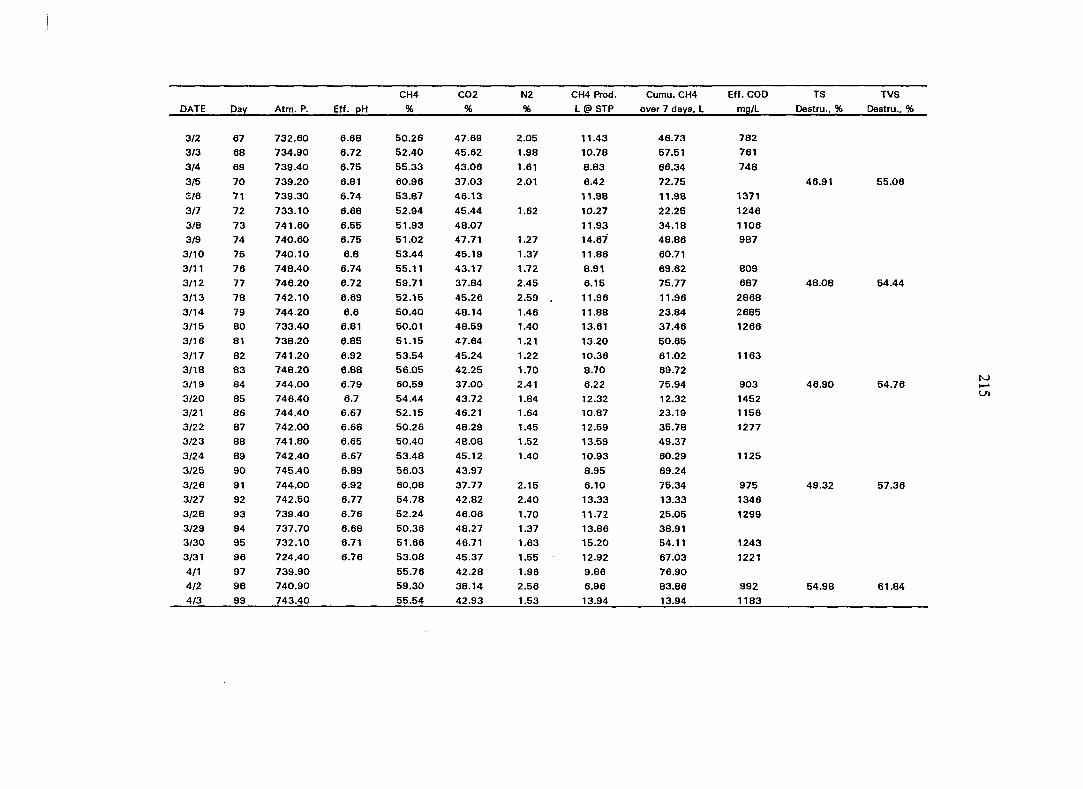
CH4 C02 N2 CH4 Prod. Cumu. CH4 Eff. COD TS TVS
DATE Dav Atm. P. Eff. pH % % % L @ STP over 7 days, L mu/L Destru., % Destru., %
3/2 67 732.60 6.68 50.26 47.69 2.05 11.43 46.73 782
3/3 68 734.90 6.72 52.40 45.62 1.98 10.78 57.51 761
3/4 69 739.40 6.75 55.33 43.06 1.61 8.83 66.34 748
3/5 70 739.20 6.81 60.96 37.03 2.01 6.42 72.75 46.91 55.06
3/6 71 739.30 6.74 53.87 46.13 11.98 11.98 1371
3/7 72 733.10 6.68 52.94 45.44 1.62 10.27 22.25 1246
3/8 73 741.60 6.55 51.93 48.07 11.93 34.18 1106
3/9 74 740.60 6.75 51.02 47.71 1.27 14.67 48.86 987
3/10 75 740.10 6.8 53.44 45.19 1.37 11.86 60.71
3/11 76 748.40 6.74 55.11 43.17 1.72 8.91 69.62 809
3/12 77 746.20 6.72 59.71 37.84 2.45 6.15 75.77 687 48.08 54.44
3/13 78 742.10 6.69 52.15 45.26 2.59 . 11.96 11.96 2868
3/14 79 744.20 6.6 50.40 48.14 1.46 11.88 23.84 2685
3/15 80 733.40 6.81 50.01 48.59 1.40 13.61 37.46 1266
3/16 81 738.20 6.85 51.15 47.64 1.21 13.20 50.65
3/17 82 741.20 6.92 53.54 45.24 1.22 10.36 61.02 1163
3/18 83 748.20 6.88 56.05 42.25 1.70 8.70 69.72
3/19 84 744.00 6.79 60.59 37.00 2.41 6.22 75.94 903 46.90 54.76
3/20 85 746.40 6.7 54.44 43.72 1.84 12.32 12.32 1452
3/21 86 744.40 6.67 52.15 46.21 1.64 10.87 23.19 1156
3/22 87 742.00 6.68 50.26 48.29 1.45 12.59 35.78 1277
3/23 88 741.80 6.65 50.40 48.08 1.52 13.59 49.37
3/24 89 742.40 6.67 53.48 45.12 1.40 10.93 60.29 1125
3/25 90 745.40 6.89 56.03 43.97 8.95 69.24
3/26 91 744.00 6.92 60.08 37.77 2.15 6.10 75.34 975 49.32 57.36
3/27 92 742.50 6.77 54.78 42.82 2.40 13.33 13.33 1346
3/28 93 739.40 6.76 52.24 46.06 1.70 11.72 25.05 1299
3/29 94 737.70 6.68 50.36 48.27 1.37 13.86 38.91 3/30 95 732.10 6.71 51.66 46.71 1.63 15.20 54.11 1243
3/31 96 724.40 6.76 53.08 45.37 1.55 12.92 67.03 1221
4/1 97 739.90 55.76 42.28 1.96 9.86 76.90
4/2 98 740.90 59.30 38.14 2.56 6.96 83.86 992 54.98 61.84
4/3 99 743.40 55.54 42.93 1.53 13.94 13.94 1183
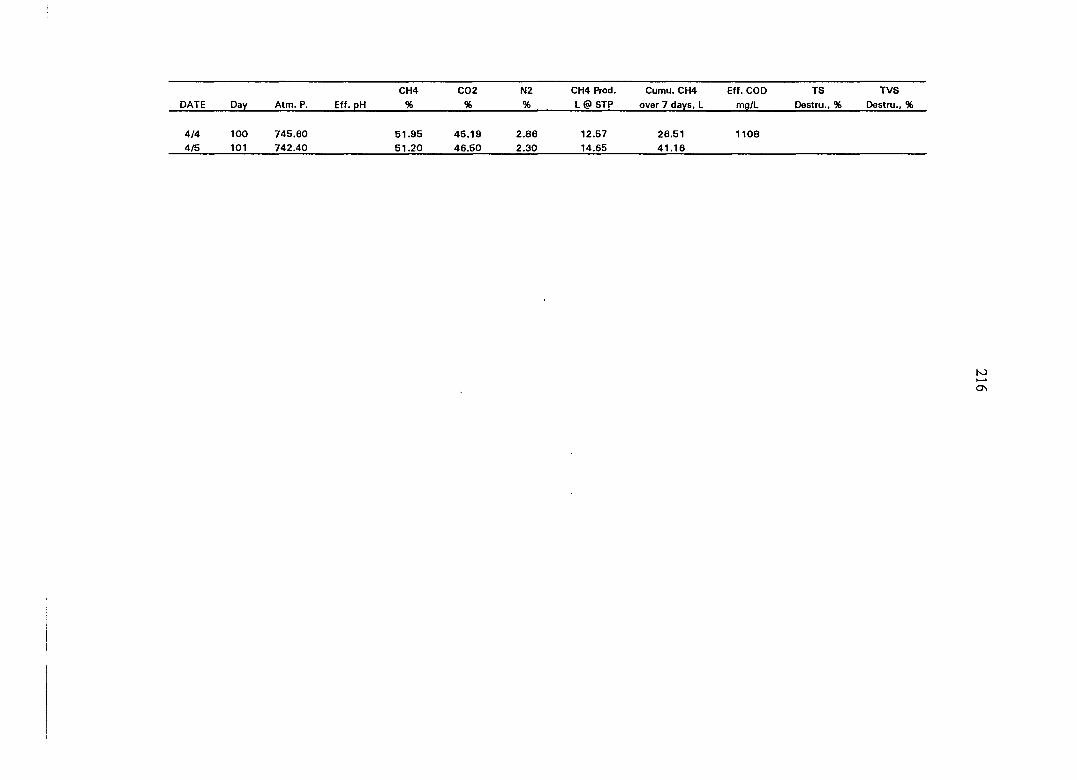
CH4 C02 N2 CH4 Prod. Cumu. CH4 Eff. COD TS TVS
DATE Day Atm. P. Eff. pH % % % L @ STP over 7 days, L mq/L Destru., % Destru., %
4/4 100 745.60 51.95 45.19 2.86 12.57 26.51 1108 4/5 101 742.40 51.20 46.50 2.30 14.65 41.16
217
APPENDIX E
DATA PROFILE OF THE DEAR SYSTEM AT TS CONTENT OF 10% AND A 10-DAY SWRT

Performance data for the holding/recycling tank and biofilter
CH4 C02 N2 CH4 Production Cumulative CH4 Tank SCOl
DATE Day Atm. P. TankpH % % % L@STP over 5 days mg/L
4/3/93 1 740.90 7.17 59.28 36.72 4.00 4.10 4.10 1075
4/4 2 745.60 6.90 60.27 34.62 5.11 2.54 6.64 826
4/5 3 742.40 6.80 59.93 35.22 4.85 2.75 9.40 885
4/6 4 740.50 6.80 59.79 34.56 5.65 3.15 12.55 942
4/7 5 734.90 6.98 60.48 32.18 7.34 1.39 13.94 1023
4/8 6 61.71 31.03 7.26 7.66 7.66
4/9 7 733.60 6.81 62.03 32.10 5.87 3.11 10.77 1076
4/10 8 730.20 6.76 58.14 36.83 5.03 3.37 14.14 1068
4/11 9 730.00 6.78 59.88 35.87 4.25 3.57 17.70 1071
4/12 10 742.20 6.83 57.95 39.14 2.91 2.22 19.93 996
4/13 11 734.20 6.93 60.06 35.99 3.95 2.71 2.71 1085
4/14 12 59.27 3.73 6.44
4/15 13 728.70 6.72 58.91 36.74 4.35 3.42 9.85 967
4/16 14 732.80 6.75 59.42 36.49 4.09 3.63 13.48 825
4/17 15 738.00 6.82 59.28 36.24 4.48 3.31 16.79 650
4/18 16 732.80 6.90 60,04 35.79 4.17 4.90 4.90 867
4/19 17 723.60 6.71 59.94 35.54 4.52 3.98 8.88 828
4/20 18 735.40 6.70 58.69 36.56 4.75 4.10 12.98 832
4/21 19 745.40 6.66 59.31 36.36 4.33 3.09 16.07 913
4/22 20 735.90 6.65 59.05 36.44 4.51 1.42 17.49 654
4/23 21 727.10 7.01 59.33 36.78 3.89 5.30 5.30 894
4/24 22 727.10 6.91 60.75 33.86 5.39 3.90 9.20 871
4/25 23 741.10 6.82 60.06 35.18 4.76 4.62 13.81 807
4/26 24 744.40 6.80 59.92 34.66 5.42 3.79 17.61 824
4/27 25 737.90 6.64 60.45 34.03 5.52 2.94 20.55 765
4/28 26 741.60 6.68 59.81 36.19 4.00 4.29 4.29 837
4/29 27 740.40 6.87 58.86 36.86 4.28 3.68 7.97 895
4/30 28 738.90 6.79 58.54 36.09 5.37 3.80 11.77 845
5/1 29 736.20 6.74 59.49 36.02 4.49 3.28 15.05 562
5/2 30 735.80 6.79 60.07 34.67 5.26 2.40 17.46 393 5/3 31 734.60 6.85 61.25 33.44 5.31 4.43 4.43 756
5/4 32 734.30 6.86 61.99 33.13 4.88 3.59 8.02 852
5/5 33 740.80 6.81 60.08 35.02 4.90 3.52 11.54 891
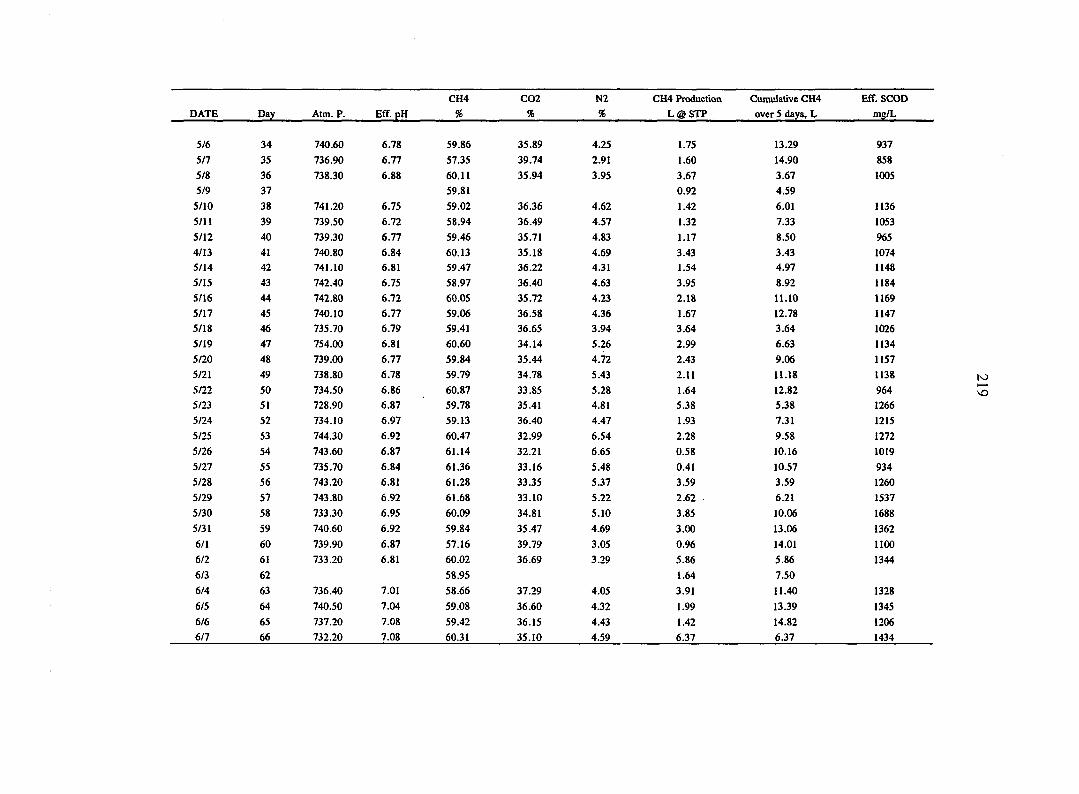
CH4 C02 N2 CH4 Production Cumulative CH4 Eff. SCOE
DATE Day Atm. P. Eff.pH % % % L@STP over 5 days, L mg/L
5/6 34 740.60 6.78 59.86 35.89 4.25 1.75 13.29 937
sn 35 736.90 6.77 57.35 39.74 2.91 1.60 14.90 858
5/8 36 738.30 6.88 60.11 35.94 3.95 3.67 3.67 1005
5/9 37 59.81 0.92 4.59
5/10 38 741.20 6.75 59.02 36.36 4.62 1.42 6.01 1136
5/11 39 739.50 6.72 58.94 36.49 4.57 1.32 7.33 1053
5/12 40 739.30 6.77 59.46 35.71 4.83 1.17 8.50 965
4/13 41 740.80 6.84 60.13 35.18 4.69 3.43 3.43 1074 5/14 42 741.10 6.81 59.47 36.22 4.31 1.54 4.97 1148
5/15 43 742.40 6.75 58.97 36.40 4.63 3.95 8.92 1184
5/16 44 742.80 6.72 60.05 35.72 4.23 2.18 11.10 1169
5/17 45 740.10 6.77 59.06 36.58 4.36 1.67 12.78 1147 5/18 46 735.70 6.79 59.41 36.65 3.94 3.64 3.64 1026
5/19 47 754.00 6.81 60.60 34.14 5.26 2.99 6.63 1134
5/20 48 739.00 6.77 59.84 35.44 4.72 2.43 9.06 1157
5/21 49 738.80 6.78 59.79 34.78 5.43 2.11 11.18 1138
5/22 50 734.50 6.86 60.87 33.85 5.28 1.64 12.82 964
5/23 51 728.90 6.87 59.78 35.41 4.81 5.38 5.38 1266
5/24 52 734.10 6.97 59.13 36.40 4.47 1.93 7.31 1215
5/25 53 744.30 6.92 60.47 32.99 6.54 2.28 9.58 1272
5/26 54 743.60 6.87 61.14 32.21 6.65 0.58 10.16 1019
5/27 55 735.70 6.84 61.36 33.16 5.48 0.41 10.57 934
5/28 56 743.20 6.81 61.28 33.35 5.37 3.59 3.59 1260
5/29 57 743.80 6.92 61.68 33.10 5.22 2.62 6.21 1537
5/30 58 733.30 6.95 60.09 34.81 5.10 3.85 10.06 1688
5/31 59 740.60 6.92 59.84 35.47 4.69 3.00 13.06 1362
6/1 60 739.90 6.87 57.16 39.79 3.05 0.96 14.01 1100 6/2 61 733.20 6.81 60.02 36.69 3.29 5.86 5.86 1344
6/3 62 58.95 1.64 7.50
6/4 63 736.40 7.01 58.66 37.29 4.05 3.91 11.40 1328
6/5 64 740.50 7.04 59.08 36.60 4.32 1.99 13.39 1345 6/6 65 737.20 7.08 59.42 36.15 4.43 1.42 14.82 1206 6/7 66 732.20 7.08 60.31 35.10 4.59 6.37 6.37 1434
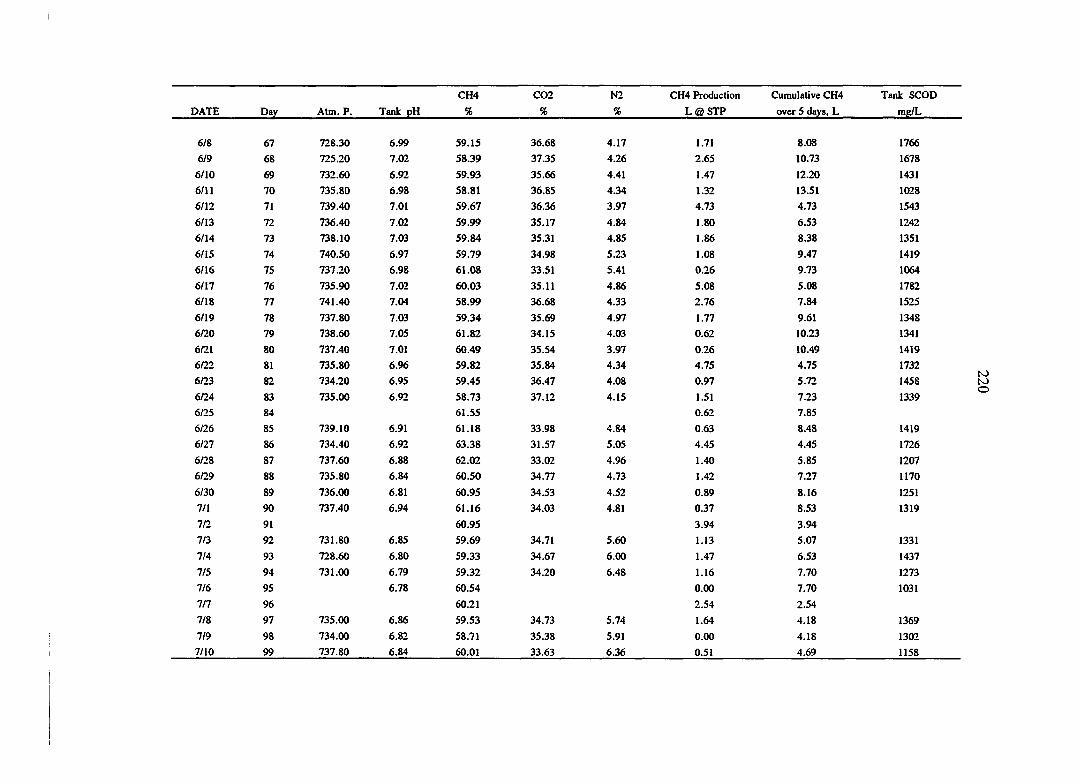
1766
1678
1431
1028
1543
1242
1351
1419
1064
1782
1525
1348
1341
1419
1732
1458
1339
1419
1726
1207
1170
1251
1319
1331
1437
1273
1031
1369
1302
1158
CH4 C02 N2 CH4 Production Cumulative C
DATE Day Atm. P. Tank pH % % % L@STP over 5 days,
6/8 67 728.30 6.99 59.15 36.68 4.17 1.71 8.08
6/9 68 725.20 7.02 58.39 37.35 4.26 2.65 10.73
6/10 69 732.60 6.92 59.93 35.66 4.41 1.47 12.20
6/11 70 735.80 6.98 58.81 36.85 4.34 1.32 13.51
6/12 71 739.40 7.01 59.67 36.36 3.97 4.73 4.73
6/13 72 736.40 7.02 59.99 35.17 4.84 1.80 6.53
6/14 73 738.10 7.03 59.84 35.31 4.85 1.86 8.38
6/15 74 740.50 6.97 59.79 34.98 5.23 1.08 9.47
6/16 75 737.20 6.98 61.08 33.51 5.41 0.26 9.73
6/17 76 735.90 7.02 60.03 35.11 4.86 5.08 5.08
6/18 77 741.40 7.04 58.99 36.68 4.33 2.76 7.84
6/19 78 737.80 7.03 59.34 35.69 4.97 1.77 9.61
6/20 79 738.60 7.05 61.82 34.15 4.03 0.62 10.23
6/21 80 737.40 7.01 60.49 35.54 3.97 0.26 10.49
6/22 81 735.80 6.96 59.82 35.84 4.34 4.75 4.75
6/23 82 734.20 6.95 59.45 36.41 4.08 0.97 5.72
6/24 83 735.00 6.92 58.73 37.12 4.15 1.51 7.23
6/25 84 61.55 0.62 7.85
6/26 85 739.10 6.91 61.18 33.98 4.84 0.63 8.48
6/27 86 734.40 6.92 63.38 31.57 5.05 4.45 4.45
6/28 87 737.60 6.88 62.02 33.02 4.96 1.40 5.85
6/29 88 735.80 6.84 60.50 34.77 4.73 1.42 7.27
6/30 89 736.00 6.81 60.95 34.53 4.52 0.89 8.16
7/1 90 737.40 6.94 61.16 34.03 4.81 0.37 8.53
7/2 91 60.95 3.94 3.94
7/3 92 731.80 6.85 59.69 34.71 5.60 1.13 5.07
7/4 93 728.60 6.80 59.33 34.67 6.00 1.47 6.53
7/5 94 731.00 6.79 59.32 34.20 6.48 1.16 7.70
7/6 95 6.78 60.54 0.00 7.70
7/7 96 60.21 2.54 2.54
7/8 97 735.00 6.86 59.53 M.Ti 5.74 1.64 4.18
7/9 98 734.00 6.82 58.71 35.38 5.91 0.00 4.18
7/10 99 737.80 6.84 60.01 33.63 6.36 0.51 4.69
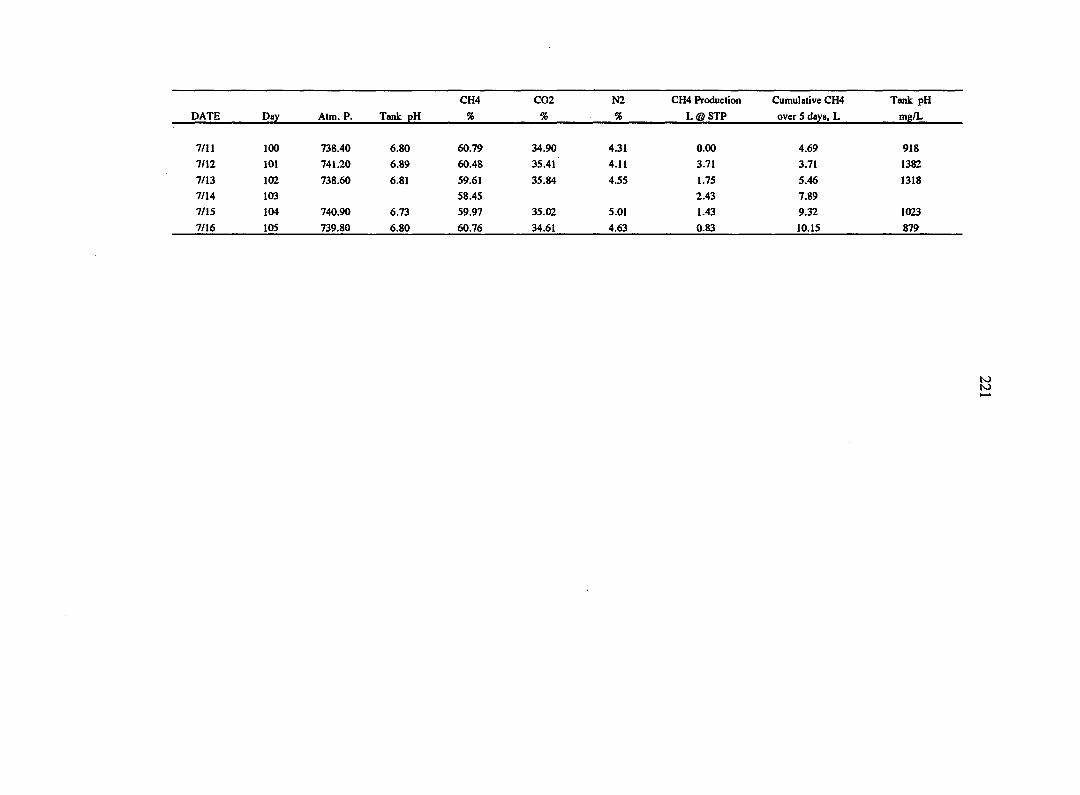
CH4 C02 N2 CH4 Production Cumulative CH4 Tank pH
PATE Day Atm. P. Tank pH % % % L @ STP over 5 days. L mg/L
7/11 100 738.40 6.80 60.79 34.90 4.31 0.00 4.69 918
7/12 101 741.20 6.89 60.48 35.41 4.11 3.71 3.71 1382
7/13 102 738.60 6.81 59.61 35.84 4.55 1.75 5.46 1318
7/14 103 58.45 2.43 7.89
7/15 104 740.90 6.73 59.97 35.02 5.01 1.43 9.32 1023
7/16 105 739.80 6.80 60.76 34.61 4.63 0.83 10.15 879
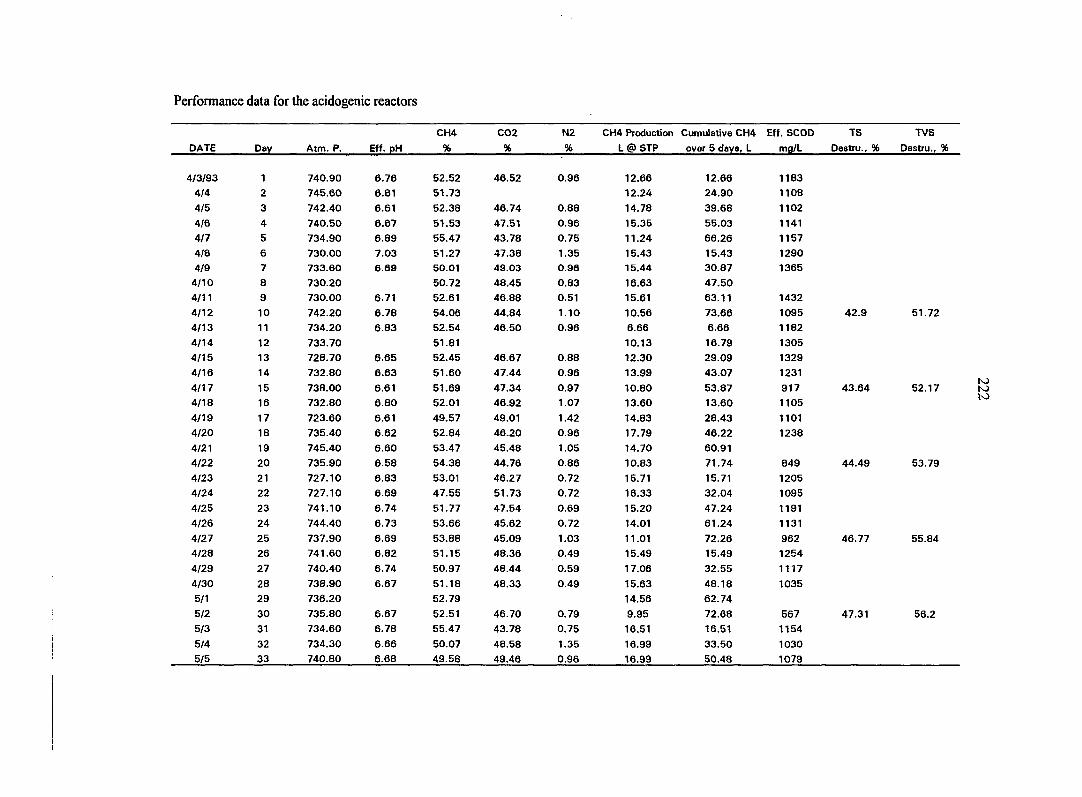
Performance data for the acidogenic reactors
CH4 C02 N2 CH4 Production Cumulative CH4 Eff. SCOD TS TVS
DATE Day Atm. P. Eff. pH % % % L@STP over 5 days, L mg/L Destru., % Destru., %
4/3/93 1 740.90 6.76 52.52 46.52 0.96 12.66 12.66 1183
4/4 2 745.60 6.81 51.73 12.24 24.90 1108
4/5 3 742.40 6.61 52.38 46.74 0.88 14.78 39.68 1102
4/6 4 740.50 6.67 51.53 47.51 0.96 15.35 55.03 1141
4/7 5 734.90 6.89 55.47 43.78 0.75 11.24 66.26 1157
4/8 6 730.00 7.03 51.27 47.38 1.35 15.43 15.43 1290
419 7 733.60 6.69 50.01 49.03 0.96 15.44 30.87 1365
4/10 8 730.20 50.72 48.45 0.83 16.63 47.50
4/11 9 730.00 6.71 52.61 46.88 0.51 15.61 63.11 1432
4/12 10 742.20 6.78 54.06 44.84 1.10 10.56 73.66 1095 42.9 51.72
4/13 11 734.20 6.83 52.54 46.50 0.96 6.66 6.66 1182
4/14 12 733.70 51.81 10.13 16.79 1305
4/15 13 728.70 6.65 52.45 46.67 0.88 12.30 29.09 1329
4/16 14 732.80 6.63 51.60 47.44 0.96 13.99 43.07 1231
4/17 15 738.00 6.61 51.69 47.34 0.97 10.80 53.87 917 43.64 52.17
4/18 16 732.80 6.80 52.01 46.92 1.07 13.60 13.60 1105
4/19 17 723.60 6.61 49.57 49.01 1,42 14.83 28.43 1101
4/20 18 735.40 6.62 52.84 46.20 0.96 17.79 46.22 1238
4/21 19 745.40 6.60 53.47 45.48 1.05 14.70 60.91
4/22 20 735.90 6.58 54.38 44.76 0.86 10.83 71.74 849 44.49 53.79
4/23 21 727.10 6.83 53.01 46.27 0.72 15.71 15.71 1205
4/24 22 727.10 6.69 47.55 51.73 0.72 16.33 32.04 1095
4/25 23 741.10 6.74 51.77 47.54 0.69 15.20 47.24 1191
4/26 24 744.40 6.73 53.66 45.62 0.72 14.01 61.24 1131
4/27 25 737.90 6.69 53.88 45.09 1.03 11.01 72.26 962 46.77 55.84
4/28 26 741.60 6.82 51.15 48.36 0.49 15.49 15.49 1254
4/29 27 740.40 6.74 50.97 48.44 0.59 17.06 32.55 1117
4/30 28 738.90 6.67 51.18 48.33 0.49 15.63 48.18 1035
5/1 29 736.20 52.79 14.56 62.74
5/2 30 735.80 6.67 52.51 46.70 0.79 9.95 72.68 567 47.31 56.2
5/3 31 734.60 6.78 55.47 43.78 0.75 16.51 16.51 1154
5/4 32 734.30 6.66 50.07 48.58 1.35 16.99 33.50 1030
5/5 33 740.80 6.68 49.58 49.46 0.96 16.99 50.48 1079
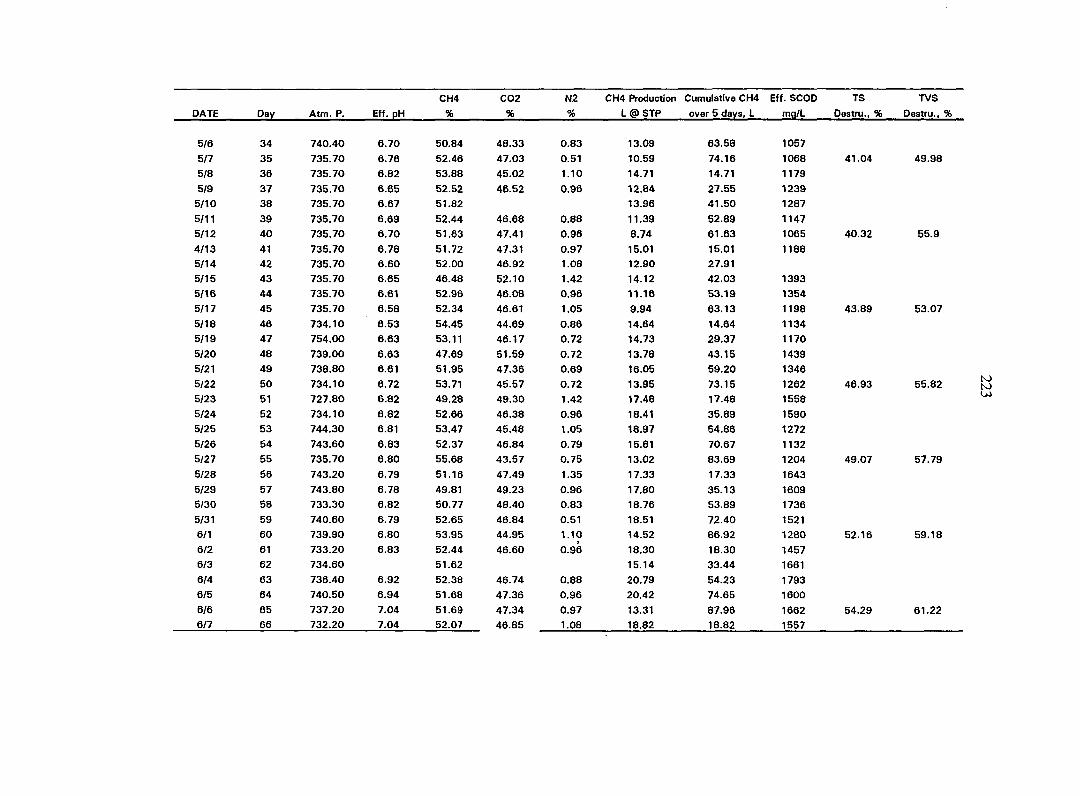
CH4 C02
DATE Day Atm. P. Eff. pH % %
5/6 34 740.40 6.70 50.84 48.33
5/7 35 735.70 6.76 52.46 47.03
5/8 36 735.70 6.82 53.88 45.02
5/9 37 735.70 6.65 52.52 46.52
5/10 38 735.70 6.67 51.82
5/11 39 735.70 6.69 52.44 46.68
5/12 40 735.70 6.70 51.63 47.41
4/13 41 735.70 6.78 51.72 47.31
5/14 42 735.70 6.60 52.00 46.92
5/15 43 735.70 6.65 46.48 52.10
5/16 44 735.70 6.61 52.96 46.08
5/17 45 735.70 6.58 52.34 46.61
5/18 46 734.10 6.53 54.45 44.69
5/19 47 754.00 6.63 53.11 46.17
5/20 48 739.00 6.63 47.69 51.59
5/21 49 738.80 6.61 51.95 47.36
5/22 50 734.10 6.72 53.71 45.57
5/23 51 727.80 6.82 49.28 49.30
5/24 52 734.10 6.82 52.66 46.38
5/25 53 744.30 6.81 53.47 45.48
5/26 54 743.60 6.83 52.37 46.84
5/27 55 735.70 6.80 55.68 43.57
5/28 56 743.20 6.79 51.16 47.49
5/29 57 743.80 6.78 49.81 49.23
5/30 58 733.30 6.82 50.77 48.40
5/31 59 740.60 6.79 52.65 46.84
6/1 60 739.90 6.80 53.95 44.95
6/2 61 733.20 6.83 52.44 46.60
6/3 62 734.60 51.62
6/4 63 736.40 6.92 52.38 46.74
6/5 64 740.50 6.94 51.68 47.36
6/6 65 737.20 7.04 51.69 47.34
6/7 66 732.20 7.04 52.07 46.85
N2 CH4 Production Cumulative CH4 Eff. SCOD TS TVS
% L@STP over 5 days, L mg/L Oestru., % Destru., '
0.83 13.09 63.58 1057
0.51 10.59 74.16 1068 41.04 49.98
1.10 14.71 14.71 1179
0.96 12.84 27.55 1239
13.96 41.50 1287
0.88 11.39 52.89 1147
0.96 8.74 61.63 1065 40.32 55.9
0.97 15.01 15.01 1188
1.08 12.90 27.91
1.42 14.12 42.03 1393
0.96 11.16 53.19 1354
1.05 9.94 63.13 1198 43.89 53.07
0.86 14.64 14.64 1134
0.72 14.73 29.37 1170
0.72 13.78 43.15 1439
0.69 16.05 59.20 1346
0.72 13.95 73.15 1262 46.93 55.82
1.42 17.48 17.48 1558
0.96 18.41 35.89 1590
1.05 18.97 54.86 1272
0.79 15.81 70.67 1132
0.75 13.02 83.69 1204 49.07 57.79
1.35 17.33 17.33 1643
0.96 17.80 35.13 1609
0.83 18.76 53.89 1736
0.51 18.51 72.40 1521
1.10 14.52 86.92 1280 52.16 59.18
0.96 18.30 18.30 1457
15.14 33.44 1661
0.88 20.79 54.23 1793
0.96 20.42 74.65 1600
0.97 13.31 87.96 1662 54.29 61.22
1.08 18.82 18.82 1557
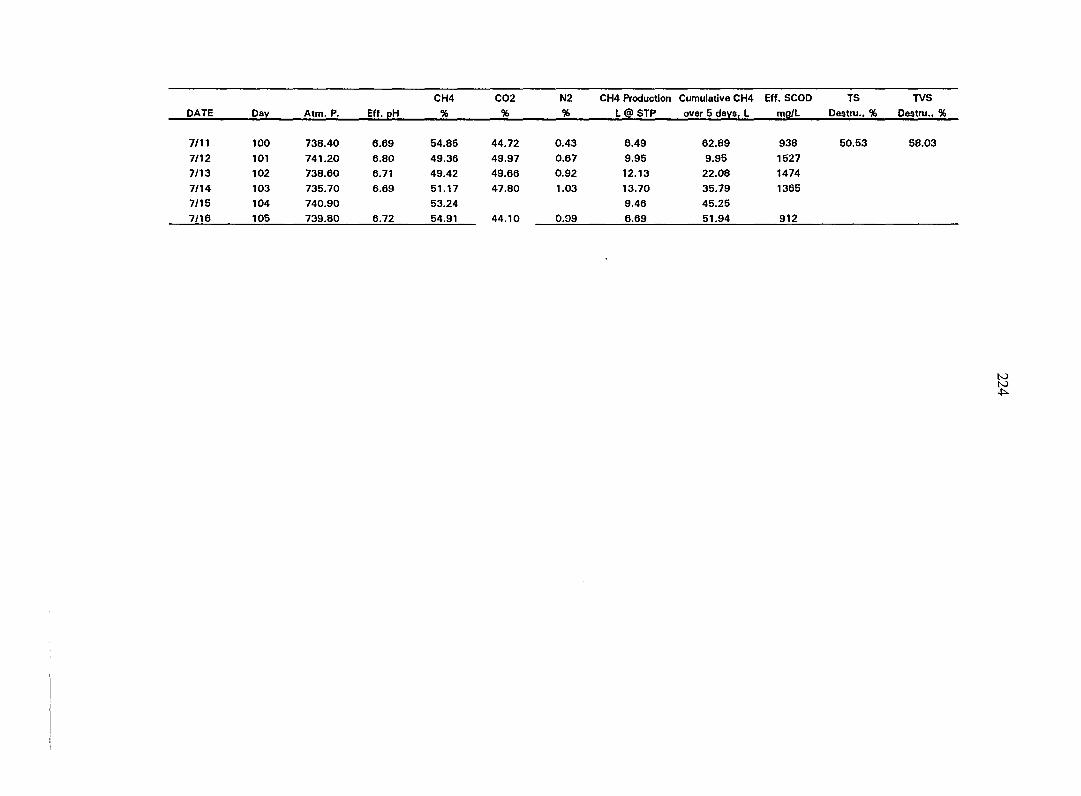
CH4 C02
DATE Day Atm. P. Eff. pH %
7/11 100 738.40 6.69 54.85 44.72
7/12 101 741.20 6.80 49.36 49.97
7/13 102 738.60 6.71 49.42 49.66
7/14 103 735.70 6.69 51.17 47.80
7/15 104 740.90 53.24
7/16 105 739.80 6.72 54.91 44.10
N2 CH4 Production Cumulative CH4 Eff. SCOD TS TVS
% L @ STP over 5 days, L mg/L Destru., % Destru., %
0.43 6.49
0.67 9.95
0.92 12.13
1.03 13.70
9.46
0.09 6.69
62.89 938
9.95 1527
22.08 1474
35.79 1365
45.25
51.94 912
50.53 58.03
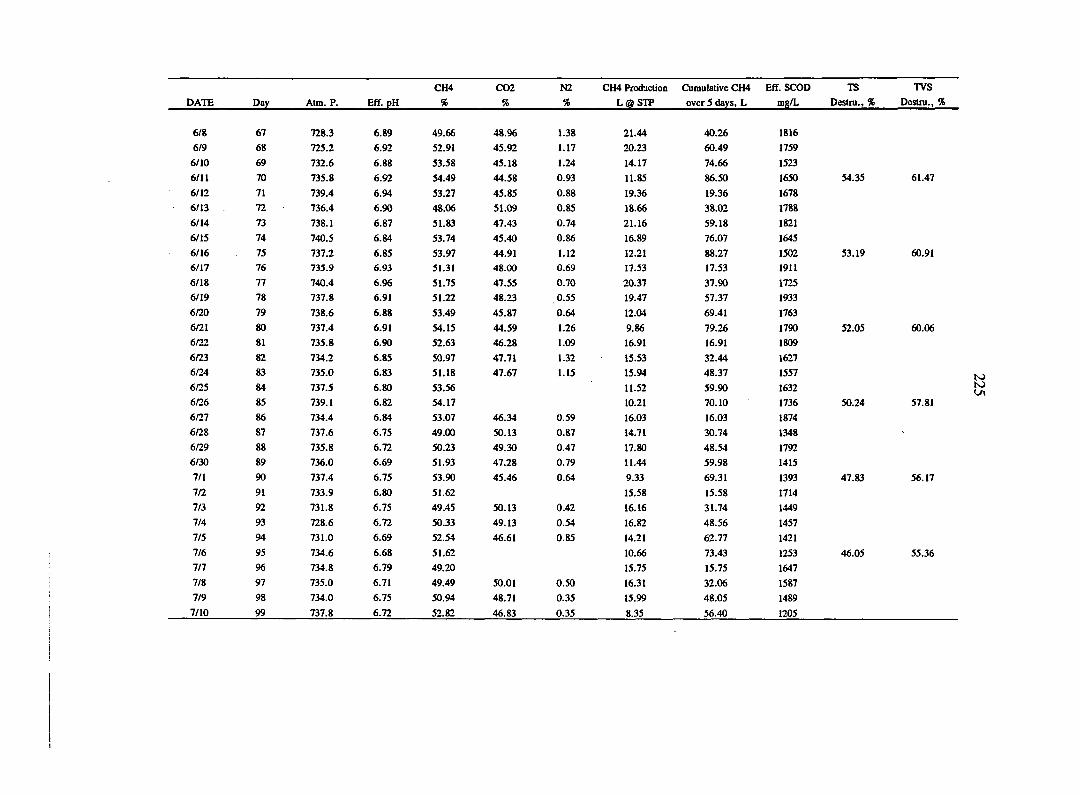
CH4 CXM N2 CH4 Produclion Cumulative CH4 Eff. SCOD TS TVS
DATE Day Atm. P. Eff. pH % % % L@STP over 5 days, L mg/L Destni., % Destni., %
6/8 67 728.3 6.89 49.66 48.% 1.38 21.44 40.26 1816
6/9 68 725.2 6.92 52.91 45.92 1.17 20.23 60.49 1759
6/10 69 732.6 6.88 53.58 45.18 1.24 14.17 74.66 1523 6/11 70 735.8 6.92 54.49 44.58 0.93 11.85 86.50 1650 54.35 61.47
6/12 71 739.4 6.94 53.27 45.85 0.88 19.36 19.36 1678 6/13 72 736.4 6.90 48.06 51.09 0.85 18.66 38.02 1788
6/14 73 738.1 6.87 51.83 47.43 0.74 21.16 59.18 1821
6/15 74 740.5 6.84 53.74 45.40 0.86 16.89 76.07 1645
6/16 75 737.2 6.85 53.97 44.91 1.12 12.21 88.27 1502 53.19 60.91 6/17 76 735.9 6.93 51.31 48.00 0.69 17.53 17.53 1911 6/18 77 740.4 6.96 51.75 47.55 0.70 20.37 37.90 1725 6/19 78 737.8 6.91 51.22 48.23 0.55 19.47 57.37 1933 6/20 79 738.6 6.88 53.49 45.87 0.64 12.04 69.41 1763 6/21 80 737.4 6.91 54.15 44.59 1.26 9.86 79.26 1790 52.05 60.06 6/22 81 735.8 6.90 52.63 46.28 1.09 16.91 16.91 1809 6/23 82 734.2 6.85 50.97 47.71 1.32 15.53 32.44 1627 6/24 83 735.0 6.83 51.18 47.67 1.15 15.94 48.37 1557 6/25 84 737.5 6.80 53.56 11.52 59.90 1632 6/26 85 739.1 6.82 54.17 10.21 70.10 1736 50.24 57.81 6/27 86 734.4 6.84 53.07 46.34 0.59 16.03 16.03 1874 6/28 87 737.6 6.75 49.00 50.13 0.87 14.71 30.74 1348 6/29 88 735.8 6.72 50.23 49.30 0.47 17.80 48.54 1792 6/30 89 736.0 6.69 51.93 47.28 0.79 11.44 59.98 1415 7/1 90 737.4 6.75 53.90 45.46 0.64 9.33 69.31 1393 47.83 56.17 7/2 91 733.9 6.80 51.62 15,58 15.58 1714 7/3 92 731.8 6.75 49.45 50.13 0.42 16.16 31.74 1449 7/4 93 728.6 6.72 50.33 49.13 0.54 16.82 48.56 1457 7/5 94 731.0 6.69 52.54 46.61 0.85 14.21 62.77 1421 7/6 95 734.6 6.68 51.62 10.66 73.43 1253 46.05 55.36 7/7 96 734.8 6.79 49.20 15.75 15.75 1647 7/8 97 735.0 6.71 49.49 50.01 0.50 16.31 32.06 1587 7/9 98 734.0 6.75 50.94 48.71 0.35 15.99 48.05 1489 7/10 99 737.8 6.72 52.82 46.83 0.35 8.35 56.40 1205
ts) N)
226
APPENDIX F
DATA PFOFILE OF THE DBAR SYSTEM AT TS CONTENT OF 15% AND A 10-DAY SWRT
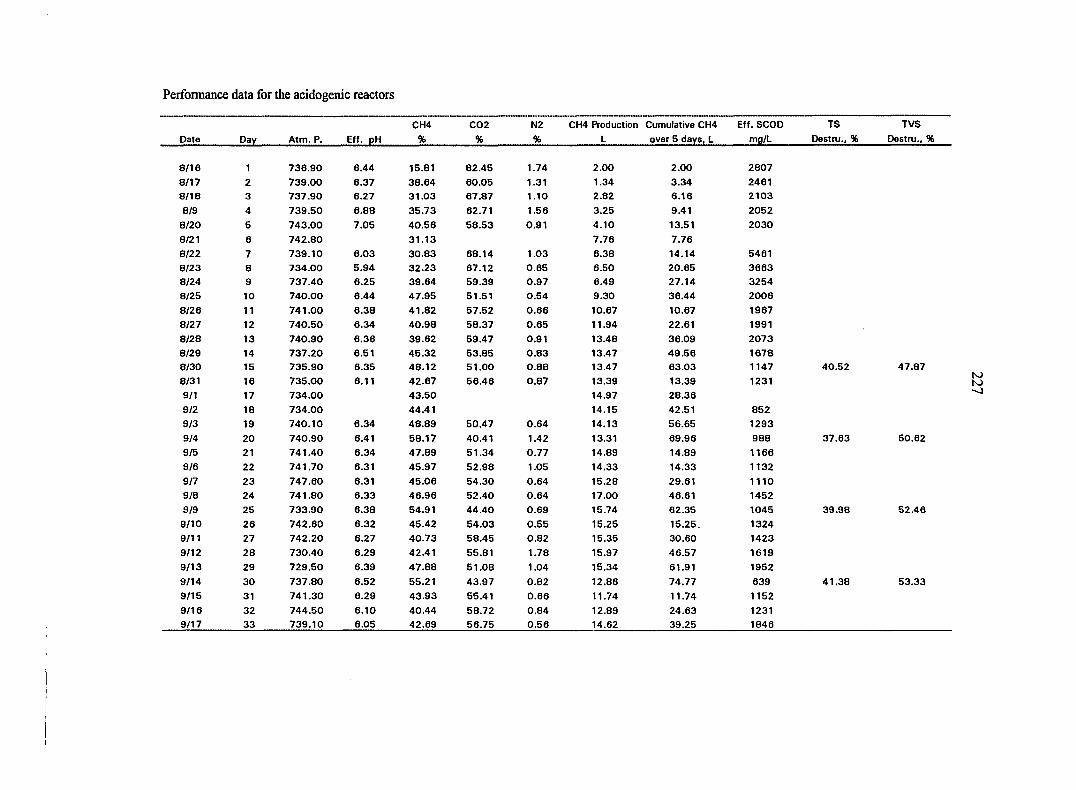
Performance data for the acidogenic reactors
CH4 C02 N2 CH4 Production Cumulative CH4 Eff. SCOD TS TVS
Date Day Atm. P. Eff. pH % % % L over 5 days,L mg/L Destru., % Destru., %
8/16 1 736.90 6.44 15.81 82.45 1.74 2.00 2.00 2807
8/17 2 739.00 6.37 38.64 60.05 1.31 1.34 3.34 2461
8/18 3 737,90 6.27 31.03 67.87 1.10 2.82 6.16 2103
8/9 4 739.50 6.88 35.73 62.71 1.56 3.25 9.41 2052
8/20 5 743.00 7.05 40.56 58.53 0.91 4.10 13.51 2030
8/21 6 742.80 31.13 7.76 7.76
8/22 7 739.10 6.03 30.83 68.14 1.03 6.38 14.14 5461
8/23 8 734.00 5.94 32.23 67.12 0.65 6.50 20.65 3663
8/24 9 737.40 6.25 39.64 59.39 0.97 6.49 27.14 3254
8/25 10 740.00 6.44 47.95 51.51 0.54 9.30 36.44 2006
8/20 11 741.00 6.38 41.82 57.52 0.66 10.67 10.67 1967
8/27 12 740.50 6.34 40.98 58.37 0.65 11.94 22.61 1991
8/28 13 740.90 6.36 39.62 59.47 0.91 13.48 36.09 2073
8/29 14 737.20 6.51 45.32 53.85 0.83 13.47 49.56 1678 8/30 15 735.90 6.35 48.12 51.00 0.88 13.47 63.03 1147 40.52 47.87
8/31 16 735.00 6.11 42.67 56.46 0.87 13.39 13.39 1231
9/1 17 734.00 43.50 14.97 28.36
9/2 18 734.00 44.41 14.15 42.51 852
9/3 19 740.10 6.34 48.89 50.47 0.64 14.13 56.65 1293
9/4 20 740.90 6.41 58.17 40.41 1.42 13.31 69.96 988 37.63 50.62
9/5 21 741.40 6.34 47.89 51.34 0.77 14.89 14.89 1166
9/6 22 741.70 6.31 45.97 52.98 1.05 14.33 14.33 1132
9/7 23 747.60 6.31 45.06 54.30 0.64 15.28 29.61 1110
9/8 24 741.80 6.33 46.96 52.40 0.64 17.00 46.61 1452
9/9 25 733.90 6.38 54.91 44.40 0.69 15.74 62.35 1045 39.98 52.46
9/10 26 742.60 6.32 45.42 54.03 0.55 15.25 15.25, 1324 9/11 27 742.20 6.27 40.73 58.45 0.82 15.35 30.60 1423
9/12 28 730.40 6.29 42.41 55.81 1.78 15.97 46.57 1619
9/13 29 729.50 6.39 47.88 51.08 1.04 15.34 61.91 1952
9/14 30 737.80 6.52 55.21 43.97 0.82 12.86 74.77 639 41.38 53.33
9/15 31 741.30 6.29 43.93 55.41 0.66 11.74 11.74 1152
9/16 32 744.50 6.10 40.44 58.72 0.84 12.89 24.63 1231 9/17 33 739.10 6.05 42.69 56.75 0.56 14.62 39.25 1846
NJ N) -J
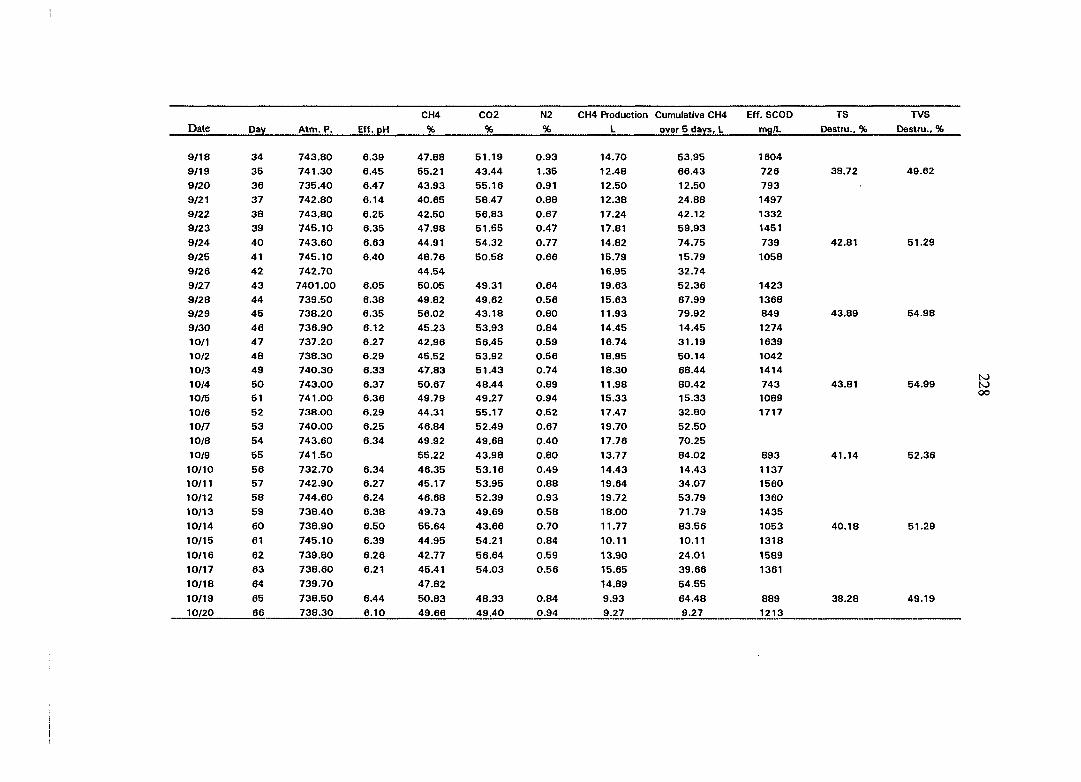
CH4 C02 N2 CH4 Production Cumulative CH4 Eff. SCOD TS TVS
Date Day Atm. P. Eff. pH % % % L over 5 days,L mfl/L Destru., % Destru.,"
9/18 34 743.80 6.39 47.88 51.19 0.93 14.70 53.95 1604
9/19 35 741.30 6.45 55.21 43.44 1.35 12.48 66.43 726 38.72 49.62
9/20 36 735.40 6.47 43.93 55.16 0.91 12.50 12.50 793
9/21 37 742.80 6.14 40.65 58.47 0.88 12.38 24.88 1497
9/22 38 743.80 6.25 42.50 56.83 0.67 17.24 42.12 1332
9/23 39 745.10 6.35 47.98 51.55 0.47 17.81 59.93 1451
9/24 40 743.60 6.63 44.91 54.32 0.77 14.82 74.75 739 42.81 51.29
9/25 41 745.10 6.40 48.76 50.58 0.66 15.79 15.79 1058
QI26 42 742.70 44.54 16.95 32.74
9/27 43 7401.00 6.05 50.05 49.31 0.64 19.63 52.36 1423
9/28 44 739.50 6.38 49.82 49.62 0.56 15.63 67.99 1368
9/29 45 738.20 6.35 56.02 43.18 0.80 11.93 79.92 849 43.89 54.98
9/30 46 736.90 6.12 45.23 53.93 0.84 14.45 14.45 1274
10/1 47 737.20 6.27 42.96 56.45 0.59 16.74 31.19 1639
10/2 48 738.30 6.29 45.52 53.92 0.56 18.95 50.14 1042
10/3 49 740.30 6.33 47.83 51.43 0.74 18.30 68.44 1414
10/4 50 743.00 6.37 50.67 48.44 0.89 11.98 80.42 743 43.81 54.99
10/5 51 741.00 6.36 49.79 49.27 0.94 15.33 15.33 1089
10/6 52 738.00 6.29 44.31 55.17 0.52 17.47 32.80 1717
10/7 53 740.00 6.25 46.84 52.49 0.67 19.70 52.50
10/8 54 743.60 6.34 49.92 49.68 0.40 17.76 70.25
10/9 55 741.50 55.22 43.98 0.80 13.77 84.02 893 41.14 52.36
10/10 56 732.70 6.34 46.35 53.16 0.49 14.43 14.43 1137 10/11 57 742.90 6.27 45.17 53.95 0.88 19.64 34.07 1560
10/12 58 744.60 6.24 46.68 52.39 0.93 19.72 53.79 1360
10/13 59 738.40 6.38 49.73 49.69 0.58 18.00 71.79 1435
10/14 60 738.90 6.50 55.64 43.66 0.70 11.77 83.56 1053 40.18 51.29
10/15 61 745.10 6.39 44.95 54.21 0.84 10.11 10.11 1318
10/16 62 739.80 6.26 42.77 56.64 0.59 13.90 24.01 1589
10/17 63 738.60 6.21 45.41 54.03 0.56 15.65 39.66 1361
10/18 64 739.70 47.82 14.89 54.55
10/19 65 738.50 6.44 50.83 48.33 0.84 9.93 64.48 889 38.28 49.19
10/20 66 738.30 6.10 49.66 49.40 0.94 9.27 9.27 1213
i
I )
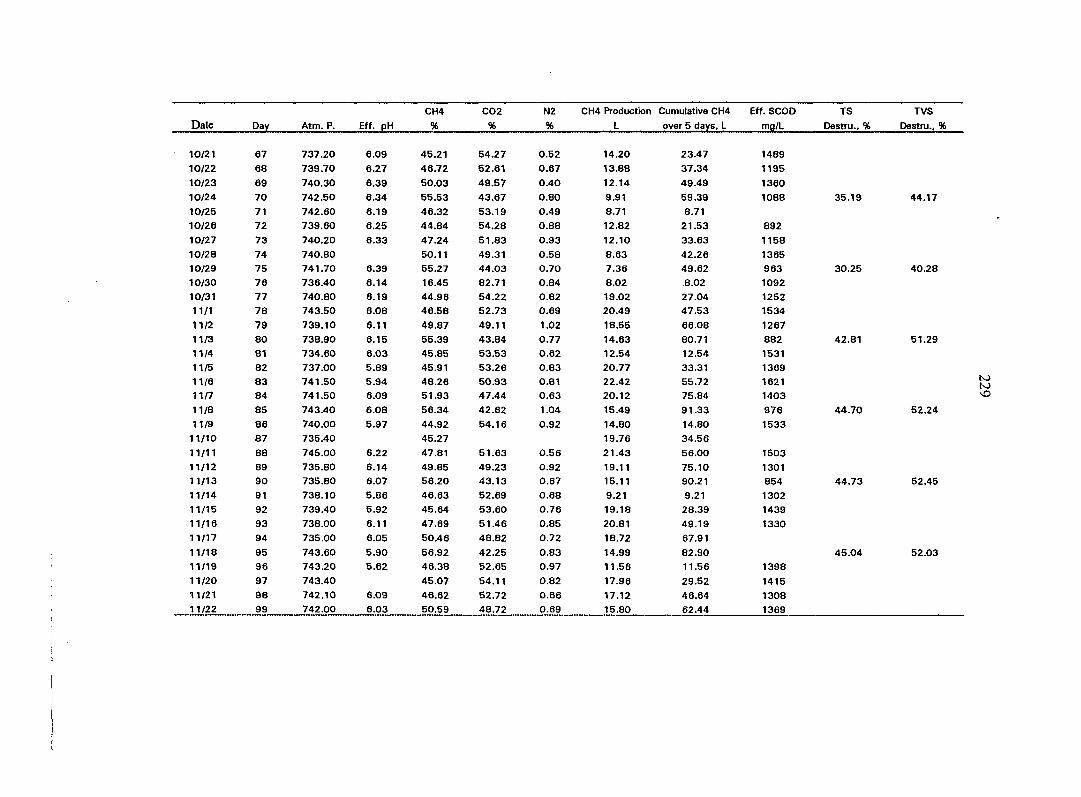
CH4 C02 N2 CH4 Production Cumulative CH4 Eff. SCOD TS TVS
Date Day Atm. P. Eff. pH % % % L over 5 days, L mg/L Destru., % Destru., '
10/21 67 737.20 6.09 45.21 54.27 0.52 14.20 23.47 1489
10/22 68 739.70 6.27 46.72 52.61 0.67 13.88 37.34 1195
10/23 69 740.30 6.39 50.03 49.57 0.40 12.14 49.49 1360
10/24 70 742.50 6.34 55.53 43.67 0.80 9.91 59.39 1088 35.19 44.17 10/25 71 742.60 6.19 46.32 53.19 0.49 8.71 8.71
10/26 72 739.60 6.25 44.84 54.28 0.88 12.82 21.53 892
10/27 73 740.20 6.33 47.24 51.83 0.93 12.10 33.63 1158
10/28 74 740.80 50.11 49.31 0.58 8.63 42.26 1365 10/29 75 741.70 6.39 55.27 44.03 0.70 7.36 49.62 963 30.25 40.28
10/30 76 736.40 6.14 16.45 82.71 0.84 8.02 8.02 1092
10/31 77 740.80 6.19 44.96 54.22 0.82 19.02 27.04 1252 11/1 78 743.50 6.08 46.58 52.73 0.69 20.49 47.53 1534
11/2 79 739.10 6.11 49.87 49.11 1.02 18.55 66.08 1267 11/3 80 738.90 6.15 55.39 43.84 0.77 14.63 80.71 882 42.81 51.29
11/4 81 734.60 8.03 45.85 53.53 0.62 12.54 12.54 1531 11/5 82 737.00 5.89 45.91 53.26 0.83 20.77 33.31 1369 11/a 83 741.50 5.94 48.26 50.93 0.81 22.42 55.72 1621 11/7 84 741.50 6.09 51.93 47.44 0.63 20.12 75.84 1403
11/8 85 743.40 6.08 56.34 42.62 1.04 15.49 91.33 976 44.70 52.24
11/9 86 740.00 5.97 44.92 54.16 0.92 14.80 14.80 1533 11/10 87 735.40 45.27 19.76 34.56
11/11 88 745.00 6.22 47.81 51.63 0.56 21.43 56.00 1503
11/12 89 735.80 6.14 49.85 49.23 0.92 19.11 75.10 1301 11/13 90 735.80 6.07 56.20 43.13 0.67 15.11 90.21 854 44.73 52.45
11/14 91 738.10 5.86 46.63 52.69 0.68 9.21 9.21 1302 11/15 92 739.40 5.92 45.64 53.60 0.76 19.18 28.39 1439
11/16 93 738.00 6.11 47.69 51.46 0.85 20.81 49.19 1330
11/17 94 735.00 6.05 50.46 48.82 0.72 18.72 67.91
11/18 95 743.60 5.90 56.92 42.25 0.83 14.99 82.90 45.04 52.03 11/19 96 743.20 5.62 46.38 52.65 0.97 11.56 11.56 1398
11/20 97 743.40 45.07 54.11 0.82 17.96 29.52 1415 n/21 98 742.10 6.09 46.62 52.72 0.66 17.12 46.64 1308 11/22 99 742.00 6.03 50.59 48.72 0.69 15.80 62.44 1369
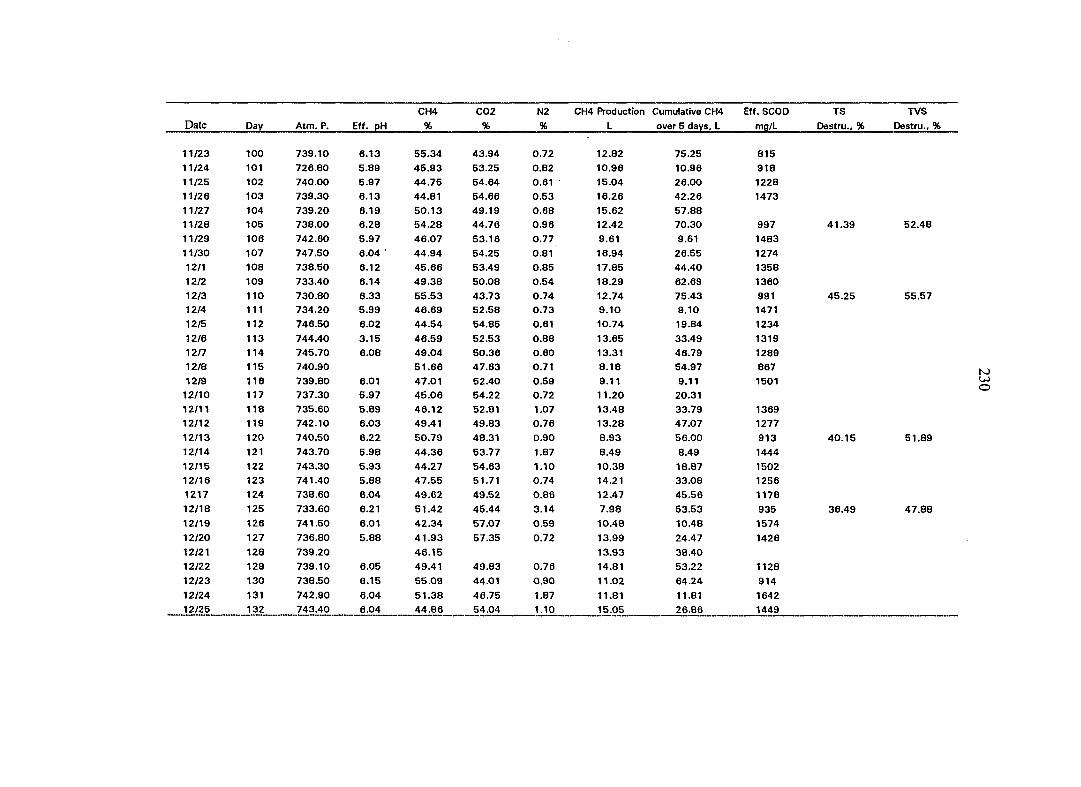
CH4 C02 N2 CH4 Production Cumulative CH4 Eff. SCOD TS TVS
Date Day Atm. P. Eff. pH % % % L over 5 days,L mg/L Destru., % Destru., %
11/23 100 739.10 6.13 55.34 43.94 0.72 12.82 75.25 815 11/24 101 726.80 5.89 45.93 53.25 0.82 10.96 10.96 918 11/25 102 740.00 5.97 44.75 54.64 0.61 15.04 26.00 1228 11/26 103 739.30 6.13 44.81 54.66 0.53 16.26 42.26 1473
11/27 104 739.20 6.19 50.13 49.19 0.68 15.62 57.88 11/28 105 738.00 6.28 54.28 44.76 0.96 12.42 70.30 997 41.39 52.48
11/29 106 742.60 5.97 46.07 53.16 0.77 9.61 9.61 1483
11/30 107 747.50 6.04 • 44.94 54.25 0.81 16.94 26.55 1274
12/1 108 738.50 6.12 45.66 53.49 0.85 17.85 44.40 1358
12/2 109 733.40 6.14 49.38 50.08 0.54 18.29 62.69 1360
12/3 110 730.80 6.33 55.53 43.73 0.74 12.74 75.43 991 45.25 55.57 12/4 111 734.20 5.99 46.69 52.58 0.73 9.10 9.10 1471
12/5 112 746.50 6.02 44.54 54.85 0.61 10.74 19.84 1234
12/6 113 744.40 3.15 46.59 52.53 0.88 13.65 33.49 1319
12/7 114 745.70 6.08 49.04 50.36 0.60 13.31 46.79 1289 12/8 115 740.90 51.66 47.63 0.71 8.18 54.97 867
12/9 116 739.80 6.01 47.01 52.40 0.59 9.11 9.11 1501 12/10 117 737.30 5.97 45.06 54.22 0.72 11.20 20.31
12/11 118 735.60 5.89 46.12 52.81 1.07 13.48 33.79 1369
12/12 119 742.10 6.03 49.41 49.83 0.76 13.28 47.07 1277
12/13 120 740.50 6.22 50.79 48.31 0.90 8.93 56.00 913 40.15 51.89
12/14 121 743.70 5.98 44.36 53.77 1.87 8.49 8.49 1444 12/15 122 743.30 5.93 44.27 54.63 1.10 10.38 18.87 1502 12/16 123 741.40 5.88 47.55 51.71 0.74 14.21 33.08 1256
1217 124 738.60 6.04 49.62 49.52 0.86 12.47 45.56 1176 12/18 125 733.60 6.21 51.42 45.44 3.14 7.98 53.53 935 36.49 47.88 12/19 126 741.50 6.01 42.34 57.07 0.59 10.48 10.48 1574
12/20 127 736.80 5.88 41.93 57.35 0.72 13.99 24.47 1426
12/21 128 739.20 46.15 13.93 38.40 12/22 129 739.10 6.05 49.41 49.83 0.76 14.81 53.22 1128 12/23 130 738.50 6.15 55.09 44.01 0.90 11.02 64.24 914
12/24 131 742.90 6.04 51.38 46.75 1.87 11.81 11.81 1642 12/25 132 743,40 6.04 44.86 54.04 1.10 15.05 26.86 1449
K) u> O
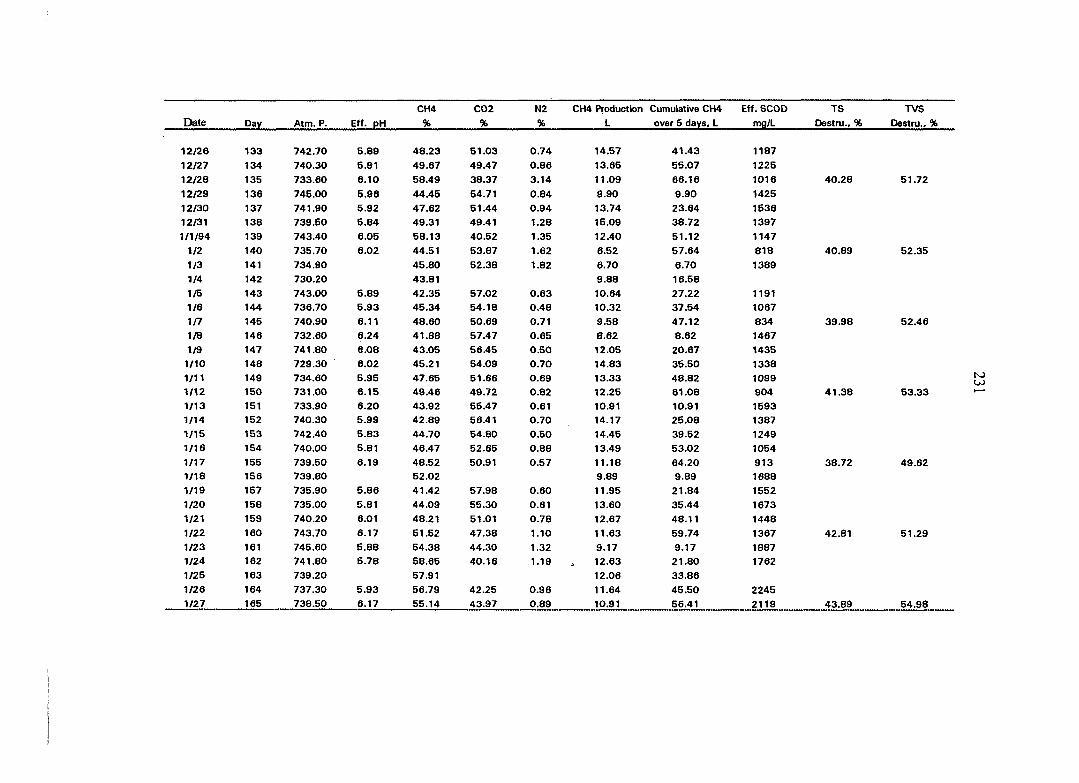
CH4 C02 N2 CH4 Production Cumulative CH4 Eff. SCOD TS TVS Date Day Atm. P. Eff. pH % % % L over 5 days, L mfl/L Oestru., % Destru.,'
12/26 133 742.70 5.89 48.23 51.03 0.74 14.57 41.43 1187
12/27 134 740.30 5.91 49.67 49.47 0.86 13.65 55.07 1225
12/28 135 733.60 6.10 58.49 38.37 3.14 11.09 66.16 1016 40.28 51.72
12/29 136 745.00 5.96 44.45 54.71 0.84 9.90 9.90 1425
12/30 137 741.90 5.92 47.62 51.44 0.94 13.74 23.64 1536 12/31 138 739.50 5.84 49.31 49.41 1.28 15.09 38.72 1397
1/1/94 139 743.40 6.05 58.13 40.52 1.35 12.40 51.12 1147
M2 140 735.70 6.02 44.51 53.87 1.62 6.52 57.64 818 40.89 52.35
1/3 141 734.90 45.80 52.38 1.82 6.70 6.70 1389
1/4 142 730.20 43.81 9.88 16.58
1/5 143 743.00 5.89 42.35 57.02 0.63 10.64 27.22 1191 1/6 144 736.70 5.93 45.34 54.18 0.48 10.32 37.54 1067
1/7 145 740.90 6.11 48.60 50.69 0.71 9.58 47.12 834 39.98 52.46
1/8 146 732.60 6.24 41.88 57.47 0.65 8.62 8.62 1467
1/9 147 741.80 6.08 43.05 56.45 0.50 12.05 20.67 1435 1/10 148 729.30 6.02 45.21 54.09 0.70 14.83 35.50 1338 1/11 149 734.60 5.95 47.65 51.66 0.69 13.33 48.82 1099 1/12 150 731.00 6.15 49.46 49.72 0.82 12.25 61.08 904 41.38 53.33 1/13 151 733.90 6.20 43.92 55.47 0.61 10.91 10.91 1593 1/14 152 740.30 5.99 42.89 56.41 0.70 14.17 25.08 1387 1/15 153 742.40 5.83 44.70 54.80 0.50 14.45 39.52 1249 1/16 154 740.00 5.81 46.47 52.65 0.88 13.49 53.02 1054
1/17 155 739.50 6.19 48.52 50.91 0.57 11.18 64.20 913 38.72 49.62 1/18 156 739.80 52.02 9.89 9.89 1688 1/19 157 735.90 5.86 41.42 57.98 0.60 11.95 21.84 1552 1/20 158 735.00 5.81 44.09 55.30 0.61 13.60 35.44 1673 1/21 159 740.20 6.01 48.21 51.01 0.78 12.67 48.11 1448 1/22 160 743.70 6.17 51.52 47.38 1.10 11.63 59.74 1367 42.81 51.29 1/23 161 745.60 5.88 54.38 44.30 1.32 9.17 9.17 1887 1/24 162 741.80 5.78 58.65 40.16 1.19 12.63 21.80 1762
1/25 163 739.20 57.91 12.06 33.86 1/26 164 737.30 5.93 56.79 42.25 0.96 11.64 45.50 2245 1/27 165 738.50 6.17 55.14 43.97 0.89 10.91 56.41 2119 43.89 54.98
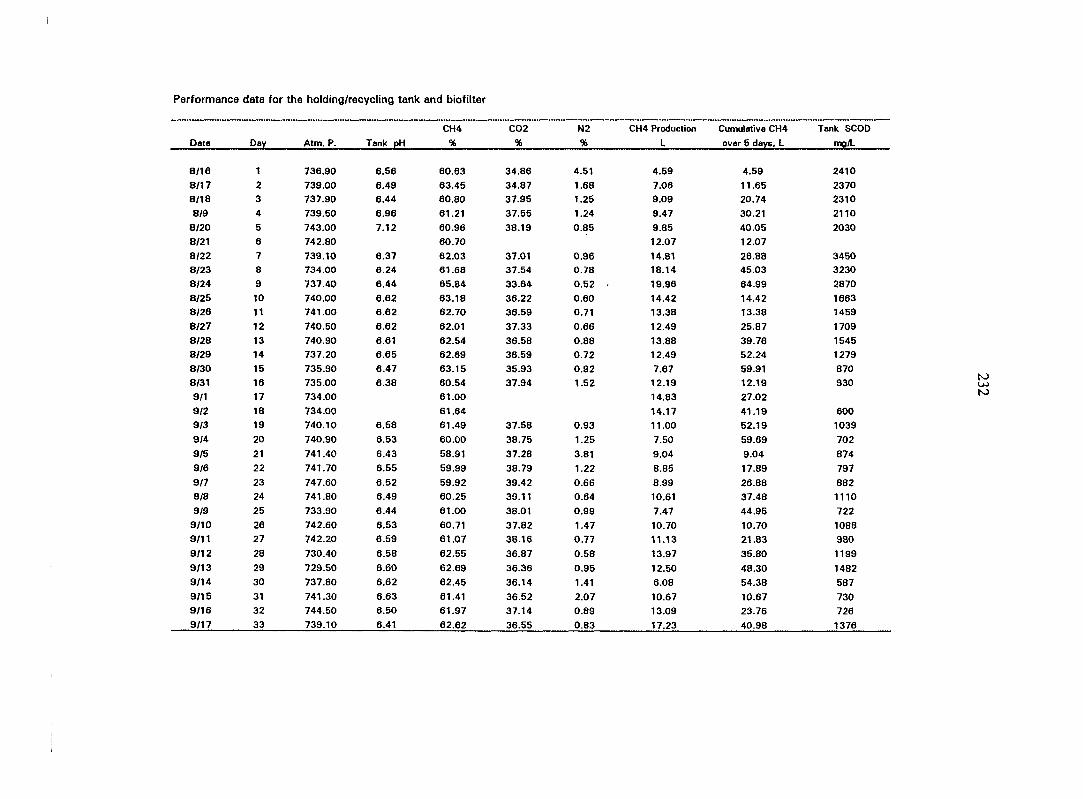
mg/L
2410
2370
2310
2110
2030
3450 3230
2870
1663
1459
1709
1545
1279
870
930
600
1039
702
874
797
882
1110
722
1088
980
1199
1482
587
730
726
Performance data for the holding/recycling tank and biofilter
CH4 C02 N2 CH4 Production Cumulative C
Dote Day Atm. P. Tank pH % % % L over 5 davE.
8/16 1 736.90 6.56 60.63 34.86 4.51 4.59 4.59
8/17 2 739.00 6.49 63.45 34.87 1.68 7.06 11.65 8/18 3 737.90 6.44 60.80 37.95 1.25 9.09 20.74
8/9 4 739.50 6.96 61.21 37.55 1.24 9.47 30.21
8/20 5 743.00 7.12 60.96 38.19 0.85 9.85 40.05 8/21 6 742.80 60.70 12.07 12.07
8/22 7 739.10 6.37 62.03 37.01 0.96 14.81 26.88 8/23 8 734.00 6.24 61.68 37.54 0.78 18.14 45.03
8/24 9 737.40 6.44 65.84 33.64 0.52 • 19.96 64.99
8/25 10 740.00 6.62 63.18 36.22 0.60 14.42 14.42 8/26 11 741.00 6.62 62.70 36.59 0.71 13.38 13.38
8/27 12 740.50 6.62 62.01 37.33 0.66 12.49 25.87
8/28 13 740.90 6.61 62.54 36.58 0.88 13.88 39.76 8/29 14 737.20 6.65 62.69 36.59 0.72 12.49 52.24 8/30 15 735.90 6.47 63.15 35.93 0.92 7.67 59.91 8/31 16 735.00 6.38 60.54 37.94 1.52 12.19 12.19 9/1 17 734.00 61.00 14.83 27.02
9/2 18 734.00 61.64 14.17 41.19 9/3 19 740.10 6.58 61.49 37.58 0.93 11.00 52.19 9/4 20 740.90 6.53 60.00 38.75 1.25 7.50 59.69
9/5 21 741.40 6.43 58.91 37.28 3.81 9.04 9.04
9/6 22 741.70 6.55 59.99 38.79 1.22 8.85 17.89
9/7 23 747.60 6.52 59.92 39.42 0.66 8.99 26.88 9/8 24 741.80 6.49 60.25 39.11 0.64 10.61 37.48
9/9 25 733.90 6.44 61.00 38.01 0.99 7.47 44.95 9/10 26 742.60 6.53 60.71 37.82 1.47 10.70 10.70 9/11 27 742.20 6.59 61.07 38.16 0.77 11.13 21.83
9/12 28 730.40 6.58 62.55 36.87 0.58 13.97 35.80 9/13 29 729.50 6.60 62.69 36.36 0.95 12.50 48.30 9/14 30 737.80 6.62 62.45 36.14 1.41 6.08 54.38
9/15 31 741.30 6.63 61.41 36.52 2.07 10.67 10.67 9/16 32 744.50 6.50 61.97 37.14 0.89 13.09 23.76 9/17 33 739.10 6.41 62.62 36.55 0.83 17.23 40.98
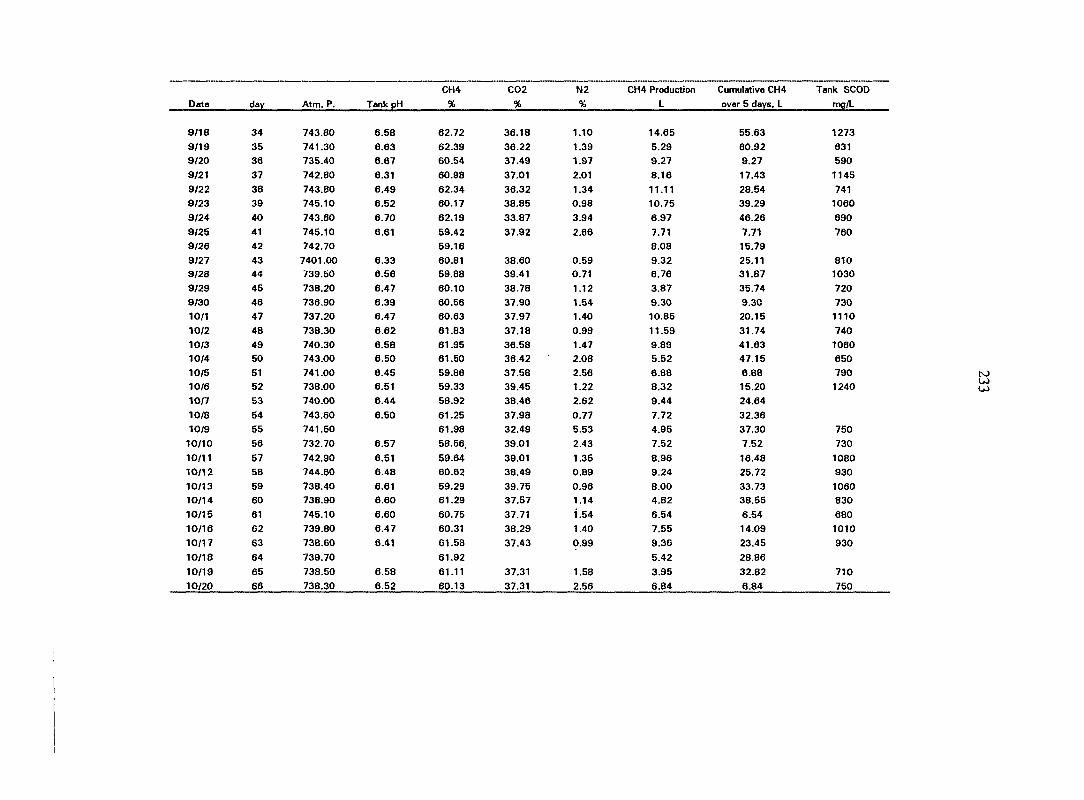
mq/L
1273
631
590
1145
741 1060
690
760
810
1030
720
730 1110
740 1060
650
790
1240
750
730
1080 930
1060
830
680
1010
930
710
750
CH4 C02 N2 CH4 Production Cumulativa i
Date day Atm. P. Tank pH % % % L over 5 dayi
9/18 34 743.80 6.58 62.72 36.18 1.10 14.65 55.63
9/19 35 741.30 6.63 62.39 36.22 1.39 5.29 60.92 9/20 36 735.40 6.67 60.54 37.49 1.97 9.27 9.27
9/21 37 742.80 6.31 60.98 37.01 2.01 8.16 17.43
9/22 38 743.80 6.49 62.34 36.32 1.34 11.11 28.54 9/23 39 745.10 6.52 60.17 38.85 0.98 10.75 39.29
9/24 40 743.60 6.70 62.19 33.87 3.94 6.97 46.26
9/25 41 745.10 6.61 59.42 37.92 2.86 7.71 7.71 9/26 42 742.70 59.16 8.08 15.79
9/27 43 7401.00 6.33 60.81 38.60 0.59 9.32 25.11 9/28 44 739.50 6.56 59.88 39.41 0.71 6.76 31.87
9/29 45 738.20 6.47 60.10 38.78 1.12 3.87 35.74
9/30 46 736.90 6.39 60.56 37.90 1.54 9.30 9.30 10/1 47 737.20 6.47 60.63 37.97 1.40 10.85 20.15
10/2 48 738.30 6.62 61.83 37.18 0.99 11.59 31.74 10/3 49 740.30 6.58 61.95 36.58 1.47 9.89 41.63 10/4 50 743.00 6.50 61.50 36.42 2.08 5.52 47.15
10/5 51 741.00 6.45 59.86 37.58 2.56 6.88 6.88 10/6 52 738.00 6.51 59.33 39.45 1.22 8.32 15.20
10/7 53 740.00 6.44 58.92 38.46 2.62 9.44 24.64
10/8 54 743.60 6.50 61.25 37.98 0.77 7.72 32.36 10/9 55 741.50 61.98 32.49 5.53 4.95 37.30
10/10 56 732.70 6.57 58.56. 39.01 2.43 7.52 7.52
10/11 57 742.90 6.51 59.64 39.01 1.35 8.96 16.48
10/12 58 744.80 6.48 60.62 38.49 0.89 9.24 25.72
10/13 59 738.40 6.61 59.29 39.75 0.96 8.00 33.73 10/14 60 738.90 6.60 61.29 37.57 1.14 4.82 38.55
10/15 61 745.10 6.60 60.75 37.71 i.54 6.54 6.54
10/16 62 739.80 6.47 60.31 38.29 1.40 7.55 14.09
10/17 63 738.60 6.41 61.53 37.43 0.99 9.36 23.45
10/18 64 739.70 61.92 5.42 28.86
10/19 65 738.50 6.58 61.11 37.31 1.58 3.95 32.82
10/20 66 738.30 6.52 60.13 37.31 2.56 6.84 6.84

67
68
69
70
71
72
73
74
75
76 77
78
79 80
81 82
83
84
85
86 87
88
89
90 91
92
93
94
95
96
97
98
99
920
730
980
1020
620 881
773 873
1022
1233
950
850
823
1126 1259
1164
727
1056
1250
1210
694
943
1114
1135
850
980
1050
1260
CH4 C02 N2 CH4 Production Cumulative CH4
Atm. P. Tank pH % % % L over 5 days. L
737.20 6.29 59.56 39.22 1.22 6.41 13.25
739.70 6.41 59.04 38.34 2.62 8.60 21.85
740.30 6.58 61.35 37.88 0.77 4.76 26.62
742.50 6.62 61.87 32.60 5.53 2.29 28.91
742.60 6.49 58.49 39.08 2.43 5.94 5.94 739.60 6.21 59.73 38.92 1.35 6.56 12.50
740.20 6.46 60.48 38.63 0.89 8.93 21.43
740.80 59.33 39.71 0.96 4.97 26.40 741.70 6.54 61.59 36.78 1.63 1.98 28.38
736.40 6.43 62.12 36.01 1.87 5.68 5.68
740.80 6.38 59.25 38.65 2.10 7.89 13.57
743.50 6.23 59.76 38.58 1.66 9.19 22.75
739.10 6.24 60.43 38.29 1.28 7.35 30.10 738.90 6.38 59.91 38.18 1.91 3.56 33.67
734.60 6.35 59.97 37.74 2.29 9.04 9.04
737.00 6.06 61.48 37.53 0.99 10.70 19.74 741.50 6.28 60.81 38.18 1.01 8.99 28.73
741.50 6.27 60.42 38.69 0.89 5.45 34.18 743.40 6.29 60.53 38.48 0.99 4.05 38.23
740.00 6.32 60.12 38.74 1.14 6.66 6.66 735.40 60.78 8.61 15.27 745.00 6.35 61.45 37.67 0.88 9.29 24.56
735.80 6.41 60.34 38.76 0.90 6.64 31.20
735.80 6.47 61.21 37.25 1.54 5.63 36.83 738.10 6.34 60.84 36.73 2.43 8.18 8.18 739.40 6.33 60.50 37.49 2.01 9.19 17.37 738.00 6.26 60.56 38.36 1.08 9.59 26.96
735.00 6.18 59.57 39.39 1.04 7.59 34.55
743.60 6.16 63.22 34.19 2.59 5.34 39.89 743.20 5.93 61.98 35.75 2.27 7.65 7.65
743.40 58.56 39.26 2.18 7.84 15.49 742.10 6.30 59.64 38.69 1.67 9.05 24.54 742.00 6.24 60.24 37.77 1.99 9.42 33.96

mp/L
730
814 958
1130
786
860
910 1030
1150 820
1030
820 1030
1050
796 1110
1050
960 730
1020
1050
860
800
710 1100
1050
830
670
1260
1130
CH4 C02 N2 CH4 Production Cumulative C
Data day Atm. P. Tank pH % % % L over 5 days.
11/23 100 739.10 6.41 59.29 39.36 1.35 1.76 35.72 11/24 101 726.80 6.29 60.38 36.60 3.02 9.03 9.03 11/25 102 740.00 6.18 61.56 37.13 1.31 9.79 18.82
11/26 103 739.30 6.37 62.17 36.97 0.86 9.78 28.60 11/27 104 739.20 6.26 62.20 36.89 0.91 7.24 35.83 11/28 105 738.00 6.35 63.10 35.55 1.35 5.50 41.33
11/29 106 742.60 6.30 62.35 35.90 1.75 8.96 8.96
11/30 107 747.50 6.22 62.40 36.32 1.28 9.03 17.99 12/1 108 738.50 6.31 61.94 37.29 0.77 9.53 27.52
12/2 109 733.40 6.28 62.43 36.84 0.73 8.99 36.51 12/3 110 730.80 6.45 62.50 35.40 2.10 5.48 41.99
12/4 111 734.20 6.33 62.90 34.39 2.71 6.44 6.44
12/5 112 746.50 6.24 62.90 35.71 1.39 6.74 13.18 12/6 113 744.40 6.32 64.47 34.61 0.92 8.51 21.69
12/7 114 745.70 6.29 63.41 35.82 0.77 7.90 29.59
12/8 115 740.90 63.57 33.74 2.69 4.99 34.58 12/9 116 739.80 6.33 62.80 35.60 1.60 7.14 7.14
12/10 117 737.30 6.24 63.10 36.21 0.69 6.62 13.76 12/11 118 735.60 6.19 64.21 35.00 0.79 8.89 22.66
12/12 119 742.10 6.27 63.56 35.68 0.76 7.75 30.40
12/13 120 740.50 6.35 63.17 34.68 2.15 5.73 36.13
12/14 121 743.70 6.34 62.14 34.56 3.30 6.41 6.41
12/15 122 743.30 6.20 62.73 35.43 1.84 6.65 13.06
12/16 123 741.40 6.14 63.42 35.66 0.92 8.94 22.00 1217 124 738.60 6.28 63.18 35.71 1.11 7.42 29.41
12/18 125 733.60 6.40 64.18 34.40 1.42 5.12 34.53 12/19 126 741.50 6.37 58.67 39.73 1.60 12.67 12.67
12/20 127 736.80 6.15 60.08 39.23 0.69 15.47 28.14
12/21 128 739.20 60.39 12.69 40.83 12/22 129 739.10 6.21 61.51 37.73 0.76 9.57 50.40
12/23 130 738.50 6.39 59.80 38.06 2.14 5.22 55.62
12/24 131 742.90 6.47 57.07 39.63 3.30 8.00 8.00 12/25 132 743.40 6.21 58.49 39.67 1.84 9.96 17.96

mg/L
950
1020
820 1160
1030
910
980
630
1120
860
890
670 1180
1090
960
890
750 1166
796
910
1211 1050
1360 1080
1010
1390
1463
1774
1730
CH4 C02 N2 CH4 Production CumulativB C
Date day Atm. P. Tank pH % % % L over 5 days,
12/26 133 742.70 6.09 60.23 38.85 0.92 8.72 26.67
12/27 134 740.30 6.15 59.34 39.19 1.47 6.73 33.40
12/28 135 733.60 6.39 59.12 39.20 1.68 5.05 38.45
12/29 136 745.00 6.26 57.51 40.35 2.14 7.18 7.18 12/30 137 741.90 6.17 58.49 40.19 1.32 10.84 18.02 12/31 138 739.50 6.03 60.47 37.76 1.77 8.85 26.87 1/1/94 139 743.40 6.21 59.36 39.62 1.02 10.34 37.21
1/2 140 735.70 6.27 58.85 40.17 0.98 4.81 42.02 1/3 141 734.90 61.20 37.91 0.89 6.43 6.43 1/4 142 730.20 60.58 7.73 14.16 1/5 143 743.00 6.11 60.52 37.87 1.61 9.73 23.88
1/6 144 736.70 6.29 61.60 37.49 0.91 9.57 33.45
1/7 145 740.90 6.33 60.94 38.19 0.87 8.47 41.92 1/8 146 732.60 6.48 59.82 38.26 1.92 11.14 11.14
1/9 147 741.80 6.30 62.66 36.23 1.11 12.82 23.96 1/10 148 729.30 6.28 61.89 36.79 1.32 13.77 37.73 1/11 149 734.60 6.15 61.35 37.01 1.64 10.72 48.45
1/12 150 731.00 6.49 62.12 36.76 1.12 8.89 57.34 1/13 151 733.90 6.37 60.95 37.45 1.60 9.64 9.64
1/14 152 740.30 6.21 61.78 36.90 1.32 13.35 22.99
1/15 153 742.40 6.14 63.12 35.98 0.90 13.63 36.62 1/16 154 740.00 6.07 62.35 36.97 0.68 10.88 47.51
1/17 155 739.50 6.38 61.25 37.84 0.91 7.89 55.39 1/18 150 739.80 62.34 9.33 9.33 1/19 157 735.90 6.19 60.27 38.80 0.93 10.89 20.22 1/20 158 735.00 6.04 62.53 36.57 0.90 12.11 32.33 1/21 159 740.20 6.27 61.39 37.94 0.67 9.20 41.53 1/22 160 743.70 6.35 61.00 38.11 0.89 6.53 48.06
1/23 161 745.60 6.16 61.59 37.42 0.99 8.52 8.52 1/24 162 741.80 6.04 61.74 37.32 0.94 9.37 17.89 1/25 163 739.20 60.34 11.16 29.05
1/26 164 737.30 6.09 61.16 37.73 1.11 9.54 38.59
1/27 165 738.50 6.21 61.05 37.58 1.37 5.49 44.08

237
APPENDIX G
DATA PROFILE OF THE HYDROLYSIS AND ACIDOGENESIS ON OFMSW
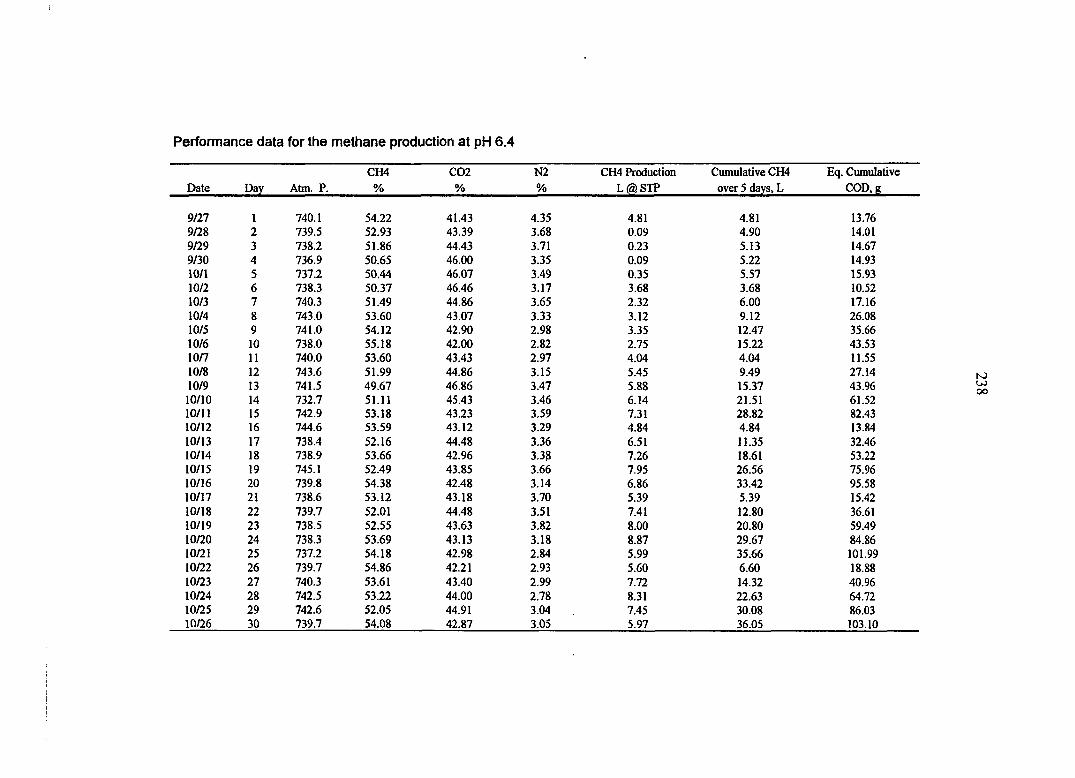
Performance data for the methane production at pH 6.4
CH4 C02 N2 CH4 Production Cumulative CH4 Eq. Cumulative Date Day Atm. P. % % % L®STP over 5 days, L COD.b
mi 1 740.1 54.22 41.43 4.35 4.81 4.81 13.76 9/28 2 739.5 52.93 43.39 3.68 0.09 4.90 14.01 9/29 3 738.2 51.86 44.43 3.71 0.23 5.13 14.67 9/30 4 736.9 50.65 46.00 3.35 0.09 5.22 14.93 10/1 5 737.2 50.44 46.07 3.49 0.35 5.57 15.93 10/2 6 738.3 50.37 46.46 3.17 3.68 3.68 10.52 10/3 7 740.3 51.49 44.86 3.65 2.32 6.00 17.16 10/4 8 743.0 53.60 43.07 3.33 3.12 9.12 26.08 10/5 9 741.0 54.12 42.90 2.98 3.35 12.47 35.66 10/6 10 738.0 55.18 42.00 2.82 2.75 15.22 43.53 10/7 11 740.0 53.60 43.43 2.97 4.04 4.04 11.55 10/8 12 743.6 51.99 44.86 3.15 5.45 9.49 27.14 10/9 13 741.5 49.67 46.86 3.47 5.88 15.37 43.96 10/10 14 732.7 51.11 45.43 3.46 6.14 21.51 61.52 10/11 15 742.9 53.18 43.23 3.59 7.31 28.82 82.43 10/12 16 744.6 53.59 43.12 3.29 4.84 4.84 13.84 10/13 17 738.4 52.16 44.48 3.36 6.51 11.35 32.46 10/14 18 738.9 53.66 42.96 3.38 7.26 18.61 53.22 10/15 19 745.1 52.49 43.85 3.66 7.95 26.56 75.96 10/16 20 739.8 54.38 42.48 3.14 6.86 33.42 95.58 10/17 21 738.6 53.12 43.18 3.70 5.39 5.39 15.42 10/18 22 739.7 52.01 44.48 3.51 7.41 12.80 36.61 10/19 23 738.5 52.55 43.63 3.82 8.00 20.80 59.49 10/20 24 738.3 53.69 43.13 3.18 8.87 29.67 84.86 10/21 25 737.2 54.18 42.98 2.84 5.99 35.66 101.99 10/22 26 739.7 54.86 42.21 2.93 5.60 6.60 18.88 10/23 27 740.3 53.61 43.40 2.99 7.72 14.32 40.96 10/24 28 742.5 53.22 44.00 2.78 8.31 22.63 64.72 10/25 29 742.6 52.05 44.91 3.04 7.45 30.08 86.03 10/26 30 739.7 54.08 42.87 3.05 5.97 36.05 103.10

239
Performacne data for the VFA produced by the system at pH 6.4
SCOD in the VFA Vol. in the VFA Total SCOD produced Cumulative SCOD
Date Day storage tank, mg/L storage tank daily, L by the system daily, g over 5 days, g
9/27 1 3930 5.10 20.04 20.04 9/28 2 4850 5.10 24.74 44.78 9/29 3 4520 4.95 22.37 67.15
9/30 4 4480 5.00 22.40 89.55 10/1 5 3860 4.85 18.72 108.27 10/2 6 4110 5.00 20.55 20.55 10/3 7 4960 5.05 25.05 45.60
10/4 3 4780 5.10 24.38 69.98 10/5 9 4430 5.00 22.15 92.13 10/6 10 3970 5.10 20.25 112.37 10/7 11 3826 4.95 18.94 18.94 10/8 12 5070 4.85 24.59 43.53 10/9 13 4920 5.00 24.60 68.13 10/10 14 4680 5.10 23.87 92.00 10/11 15 3990 4.90 19.55 111.55 10/12 16 4050 4.95 20.05 20.05 10/13 17 4960 5.00 24.80 44.85
10/14 18 5270 4.95 26.09 70.94 10/15 19 4730 5.10 24.12 95.06 10/16 20 4220 5.05 21.31 116.37 10/17 21 4100 5.00 20.50 20.50 10/18 22 5010 5.00 25.05 45.55 10/19 23 5220 5.10 26.62 72.17 10/20 24 4780 5.15 24.62 96.79 10/21 25 3960 5.05 20.00 116.79 10/22 26 3050 4.95 15.10 15.10 10/23 27 4960 5.10 25.30 40.40
10/24 28 5310 5.05 26.82 67.21 10/25 29 4840 5.05 24.44 91.65
10/26 30 4205 5.00 21.03 112.68
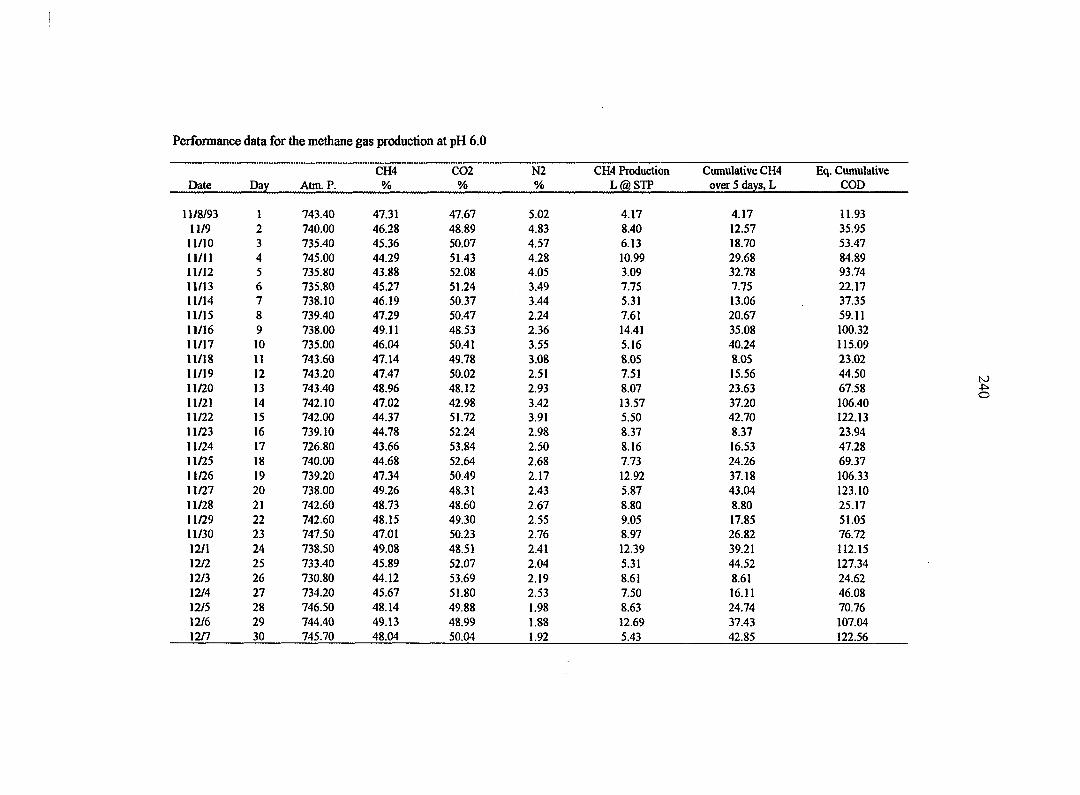
Performance data for the methane gas production at pH 6.0
CH4 C02 N2 CH4 Production Cumulative CH4 Eq. Cumuia Date Day Atm. P. % % % L@STP over 5 days, L COD
11/8/93 1 743.40 47.31 47.67 5.02 4.17 4.17 11.93 11/9 2 740.00 46.28 48.89 4.83 8.40 12.57 35.95 11/10 3 735.40 45.36 50.07 4.57 6.13 18.70 53.47 11/11 4 745.00 44.29 51.43 4.28 10.99 29.68 84.89 11/12 5 735.80 43.88 52.08 4.05 3.09 32.78 93.74 11/13 6 735.80 45.27 51.24 3.49 7.75 7.75 22.17 11/14 7 738.10 46.19 50.37 3.44 5.31 13.06 37.35 11/15 8 739.40 47.29 50.47 2.24 7.61 20.67 59.11 11/16 9 738.00 49.11 48.53 2.36 14.41 35.08 100.32 11/17 10 735.00 46.04 50.41 3.55 5.16 40.24 115.09 11/18 11 743.60 47.14 49.78 3.08 8.05 8.05 23.02 11/19 12 743.20 47.47 50.02 2.51 7.51 15.56 44.50 11/20 13 743.40 48.96 48.12 2.93 8.07 23.63 67.58 11/21 14 742.10 47.02 42.98 3.42 13.57 37.20 106.40 11/22 15 742.00 44.37 51.72 3.91 5.50 42.70 122.13 11/23 16 739.10 44.78 52.24 2.98 8.37 8.37 23.94 11/24 17 726.80 43.66 53.84 2.50 8.16 16.53 47.28 11/25 18 740.00 44.68 52.64 2.68 7.73 24.26 69.37 11/26 19 739.20 47.34 50.49 2.17 12.92 37.18 106.33 11/27 20 738.00 49.26 48.31 2.43 5.87 43.04 123.10 11/28 21 742.60 48.73 48.60 2.67 8.80 8.80 25.17 11/29 22 742.60 48.15 49.30 2.55 9.05 17.85 51.05 11/30 23 747.50 47.01 50.23 2.76 8.97 26.82 76.72 nil 24 738.50 49.08 48.51 2.41 12.39 39.21 112.15 12/2 25 733.40 45.89 52.07 2.04 5.31 44.52 127.34 12/3 26 730.80 44.12 53.69 2.19 8.61 8.61 24.62 12/4 27 734.20 45.67 51.80 2.53 7.50 16.11 46.08 12/5 28 746.50 48.14 49.88 1.98 8.63 24.74 70.76 12/6 29 744.40 49.13 48.99 1.88 12.69 37.43 107.04 12/7 30 745.70 48.04 50.04 1.92 5.43 42.85 122.56
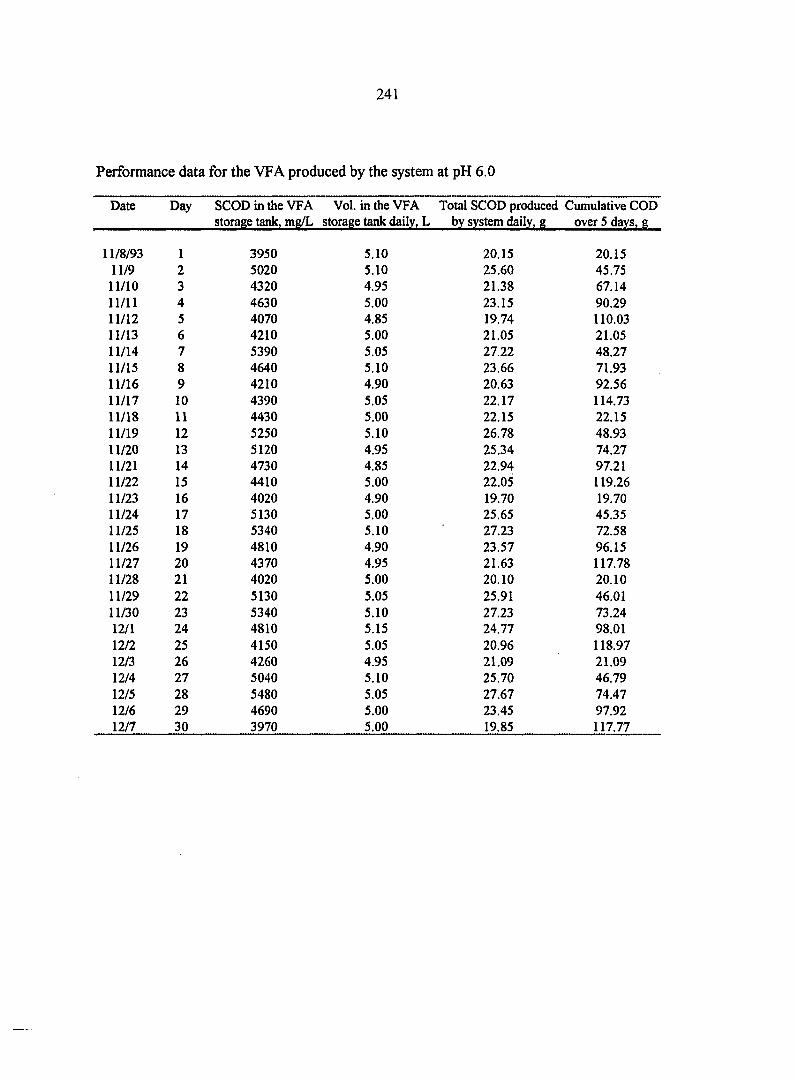
241
Performance data for the VFA produced by the system at pH 6.0
Date Day SCOD in the VFA Vol. in the VFA Total SCOD produced Cumulative COD storage tank. mg/L storage tank daily, L by system daily, g over 5 days, g
11/8/93 1 3950 5.10 20.15 20.15 11/9 2 5020 5.10 25.60 45.75 11/10 3 4320 4.95 21.38 67.14 11/11 4 4630 5.00 23.15 90.29 11/12 5 4070 4.85 19.74 110.03 11/13 6 4210 5.00 21.05 21.05 11/14 7 5390 5.05 27.22 48.27 11/15 8 4640 5.10 23.66 71.93 11/16 9 4210 4.90 20.63 92.56 11/17 10 4390 5.05 22.17 114.73 11/18 11 4430 5.00 22.15 22.15 11/19 12 5250 5.10 26.78 48.93 11/20 13 5120 4.95 25.34 74.27 11/21 14 4730 4.85 22.94 97.21 11/22 15 4410 5.00 22.05 119.26 11/23 16 4020 4.90 19.70 19.70 11/24 17 5130 5.00 25.65 45.35 11/25 18 5340 5.10 27.23 72.58 11/26 19 4810 4.90 23.57 96.15 11/27 20 4370 4.95 21.63 117.78 11/28 21 4020 5.00 20.10 20.10 11/29 22 5130 5.05 25.91 46.01 11/30 23 5340 5.10 27.23 73.24 12/1 24 4810 5.15 24.77 98.01 12/2 25 4150 5.05 20.96 118.97 12/3 26 4260 4.95 21.09 21.09 12/4 27 5040 5.10 25.70 46.79 12/5 28 5480 5.05 27.67 74.47 12/6 29 4690 5.00 23.45 97.92 12/7 30 3970 5.00 19.85 117.77
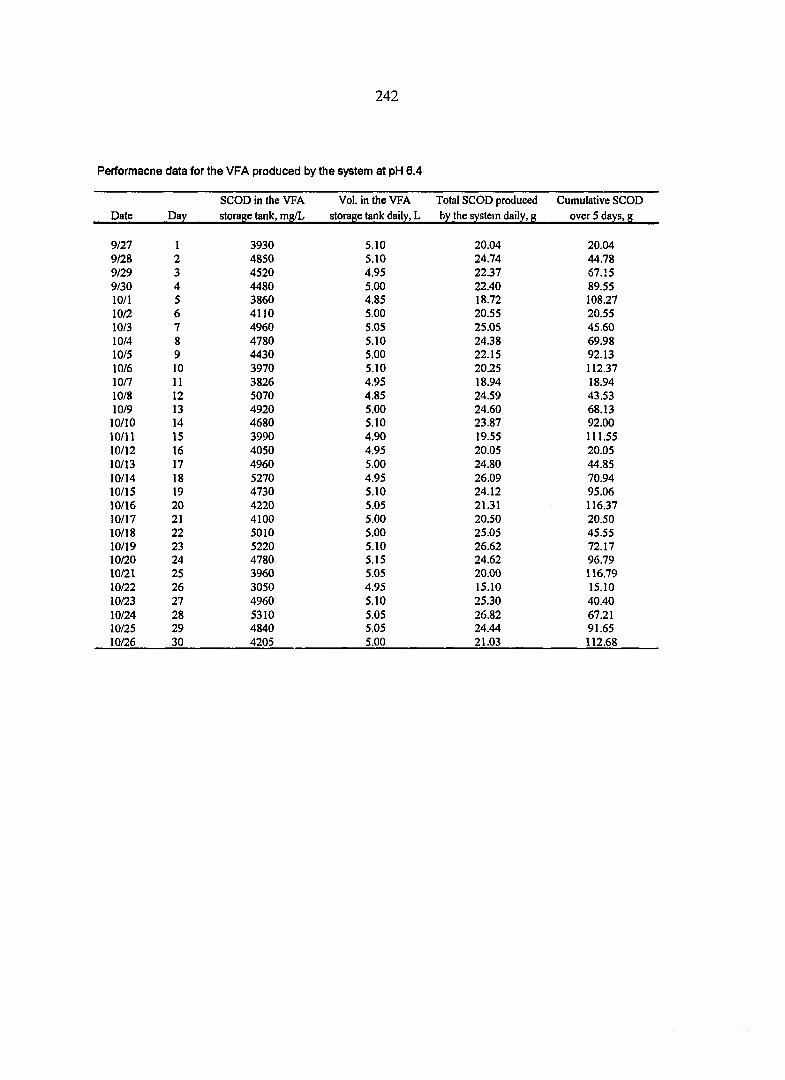
242
Performacne data for the VFA produced by the system at pH 6.4
SCOD in the VFA Vol. in the VFA Total SCOD produced Cumulative SCOD
Date Day storage tank, mg/L storage tank daily, L by the system daily, g over 5 days, g
9/27 1 3930 5.10 20.04 20.04 9/28 2 4850 5.10 24.74 44.78
9/29 3 4520 4,95 22.37 67.15 9/30 4 4480 5.00 22.40 89.55 10/1 5 3860 4.85 18.72 108.27
10/2 6 4110 5.00 20.55 20.55
10/3 7 4960 5.05 25.05 45.60
10/4 8 4780 5.10 24.38 69.98
10/5 9 4430 5.00 22.15 92.13
10/6 10 3970 5.10 20.25 112.37
10/7 11 3826 4.95 18.94 18.94
10/8 12 5070 4.85 24.59 43.53 10/9 13 4920 5.00 24.60 68.13 10/10 14 4680 5.10 23.87 92.00
10/11 15 3990 4.90 19.55 111.55 10/12 16 4050 4.95 20.05 20.05
10/13 17 4960 5.00 24.80 44.85
10/14 18 5270 4.95 26.09 70.94
10/15 19 4730 5.10 24.12 95.06
10/16 20 4220 5.05 21.31 116.37 10/17 21 4100 5.00 20.50 20.50 10/18 22 5010 5.00 25.05 45.55 10/19 23 5220 5.10 26.62 72.17 10/20 24 4780 5.15 24.62 96.79 10/21 25 3960 5.05 20.00 116.79 10/22 26 3050 4.95 15.10 15.10
10/23 27 4960 5.10 25.30 40.40
10/24 28 5310 5.05 26.82 67.21 10/25 29 4840 5.05 24.44 91.65
10/26 30 4205 5.00 21.03 112.68

Performance data for the methane production at pH 5.6
CH4 C02 N2 CH4 Production Cumulative CH4 Eq. Cumulative Date Day Atm. P. % % % L@STP over 5 days, L COD.g
12/8/93 1 740.9 42.49 54.60 2.90 8.04 8.04 22.99 12/9 2 739.8 44.12 53.06 2.82 4.26 12.30 35.18 12/10 3 737.3 45.38 51.55 3.08 4.05 16.35 46.77 12/11 4 735.6 46.33 50.24 3.43 4.32 20.68 59.13 12/12 5 742.1 46.30 50.24 3.16 4.61 25.29 72.33 12/13 6 740.5 43.55 43.15 3.30 5.49 5.49 15.70 12/14 7 743.7 43.90 52.97 3.13 5.08 10.57 30.22 12/15 8 742.3 44.43 51.42 4.15 5.09 15.65 44.77 12/16 9 741.4 45.53 50.54 3.93 4.47 20.12 57.55 12/17 10 738.6 45.80 50.28 3.92 4.60 24.72 70.71 12/18 11 733.6 42.87 53.25 3.89 5.50 5.50 15.73 12/19 12 741.5 45.64 50.42 3.94 6.11 11.61 33.21 12/20 13 736.8 45.39 50.60 4.01 4.40 16.01 45.78 12/21 14 739.2 44.98 49.79 5.23 3.91 19.92 56.97 12/22 15 739.1 45.51 50.03 4.46 3.88 23.80 68.06 12/23 16 738.5 43.10 53.39 3.51 5.57 5.57 15.93 12/24 17 742.9 44.90 51.49 3.61 5.95 11.52 32.94 12/25 18 743.4 45.61 50.90 3.49 4.23 15.75 45.04 12/26 19 742.7 44.91 51.95 3.14 4.07 19.82 56.67 12/27 20 740.3 45.67 50.78 3.55 3.39 23.21 66.38 1/28 21 733.6 42.69 53.98 3.33 5.44 5.44 15.56 12/29 22 745.0 43.18 53.85 2.97 6.08 11.52 32.95 12/30 23 741.9 44.29 52.75 2.96 4.35 15.87 45.40 12/31 24 739.5 44.55 52.17 3.28 3.72 19.59 56.02
1/1 25 743.4 45.88 50.65 3.47 3.88 23.47 67.12 1/2 26 735.7 42.73 53.45 3.82 5.59 5.59 15.99 1/3 27 734.9 43.95 52.30 3.75 5.87 11.46 32.77 1/4 28 730.2 44.83 51.26 3.91 4.23 15.69 44.88 1/5 29 743.0 44.61 51.73 3.66 3.91 19.61 56.08 1/6 30 736.7 45.17 51.16 3.67 3.70 23.31 66.67