Embed Size (px)
Citation preview
Air Force Institute of Technology Air Force Institute of Technology
AFIT Scholar AFIT Scholar
Theses and Dissertations Student Graduate Works
3-1-2018
An Analysis of Aircraft Operating and Support Cost Element An Analysis of Aircraft Operating and Support Cost Element
Structures Structures
Garrett B. O'Hanlon
Follow this and additional works at: https://scholar.afit.edu/etd
Part of the Economics Commons, and the Management and Operations Commons
Recommended Citation Recommended Citation O'Hanlon, Garrett B., "An Analysis of Aircraft Operating and Support Cost Element Structures" (2018). Theses and Dissertations. 1901. https://scholar.afit.edu/etd/1901
This Thesis is brought to you for free and open access by the Student Graduate Works at AFIT Scholar. It has been accepted for inclusion in Theses and Dissertations by an authorized administrator of AFIT Scholar. For more information, please contact [email protected].
AN ANALYSIS OF AIRCRAFT OPERATING AND SUPPORT COST ELEMENT STRUCTURES AND THEIR CONTRIBUTION TO TOTAL COSTS
THESIS
Garrett B. O’Hanlon, First Lieutenant, USAF
AFIT-ENV-MS-18-M-227
DEPARTMENT OF THE AIR FORCE AIR UNIVERSITY
AIR FORCE INSTITUTE OF TECHNOLOGY
Wright-Patterson Air Force Base, Ohio
DISTRIBUTION STATEMENT A. APPROVED FOR PUBLIC RELEASE;
DISTRIBUTION UNLIMITED.
The views expressed in this thesis are those of the author and do not reflect the official policy or position of the United States Air Force, Department of Defense, or the United States Government. This material is declared a work of the U.S. Government and is not subject to copyright protection in the United States.
AFIT-ENV-MS-18-M-227
AN ANALYSIS OF AIRCAFT OPERATING AND SUPPORT COST ELEMENT STRUTURE AND THEIR CONTRINUTION TO TOTAL COSTS
THESIS
Presented to the Faculty
Department of Systems Engineering and Management
Graduate School of Engineering and Management
Air Force Institute of Technology
Air University
Air Education and Training Command
In Partial Fulfillment of the Requirements for the
Degree of Master of Science in Cost Analysis
Garrett B. O’Hanlon, BS
First Lieutenant, USAF
March 2018
DISTRIBUTION STATEMENT A. APPROVED FOR PUBLIC RELEASE; DISTRIBUTION UNLIMITED.
AFIT-ENV-MS-18-M-227
AN ANALYSIS OF AIRCAFT OPERATING AND SUPPORT COST ELEMENT STRUTURE AND THEIR CONTRINUTION TO TOTAL COSTS
Garrett B. O’Hanlon, BS First Lieutenant, USAF
Committee Membership:
Jonathan D. Ritschel, Ph.D Chair
Edward D. White, Ph.D Member
Capt Gregory E. Brown, MS Member
1
AFIT-ENV-MS-18-M-227
Abstract
As the cost of DoD Weapon Systems continue to increase, the ability to more
accurately predict the Operating and Support (O&S) costs for the various weapon
systems has become more vital for long run affordability. The investigation into the O&S
arena has been overshadowed by the research and development (R&D) and acquisition
fields. This research focuses on the O&S portion of the total life cycle costs, specifically
the OSD-CAPE Cost Element Structure (CES) elements and sub-elements. The research
investigates seven categories of 52 aircrafts and their cost expenditures within the CES
from the years 1996-2016. The first portion of the analysis investigates the descriptive
statistics for the 52 aircrafts and their respective categories. The second portion focused
on utilizing statistical tests to compare and contrasts the findings from question one to
illustrate the similarities and differences by cost expenditures depending on aircraft
category. Lastly, we investigate if the elements/sub-elements could be used as metrics to
each other through a multivariate correlation analysis. DoD Cost Estimators and
stakeholders alike can benefit from this research by utilizing the results as baselines for
future analogy based estimates.
2
AFIT-ENV-MS-18-M-227
Dedication
This Thesis is dedicated to my family, friends, and professors who have supported me throughout my educational career. Especially to those who have never given up on me
and encouraged me to always strive to do better.
3
Acknowledgments
I would like to deeply thank my research advisor, Lt Col (Ret.) Daniel Ritschel
for his guidance and support throughout this thesis process. I appreciate his advice and
encouragement while also holding me accountable to produce a thesis that will benefit
the cost analysis community. I would also like to thank Dr. Edward White for his in-
depth expertise within the field of statistics. His in-depth knowledge in the field allowed
to complete this thesis research. I would also like to thank my sponsor, Captain Gregory
Brown, for his support and providing the initial questions in which we based this research
on. Lastly, I would like to thank GCA 18M for making my AFIT experience enjoyable
and a time I will cherish.
Garrett B. O’Hanlon
4
Table of Contents
Page
Abstract ................................................................................................................................1
Dedication ............................................................................................................................2
Acknowledgments................................................................................................................3
Table of Contents .................................................................................................................4
List of Figures ......................................................................................................................6
List of Tables .......................................................................................................................6
Chapter I: Introduction .........................................................................................................9
Purpose .......................................................................................................................11
Research Questions ....................................................................................................13
Methodology...............................................................................................................14
Summary.....................................................................................................................15
Chapter II: Literature Review ............................................................................................17
Chapter Overview .......................................................................................................17
Nunn-McCurdy Act & Weapon Systems Acquisition Reform Act of 2009 ..............17
Definition of Life-Cycle Costs and Operating & Support Costs ................................19
Cost Element Structure Definition .............................................................................22
Relevant Research on Operation & Support Cost ......................................................25
Research into the Cost Element Structure Components .............................................30
Developing Cost Estimates .........................................................................................32
Summary.....................................................................................................................36
Chapter III: Methodology ..................................................................................................38
Chapter Overview .......................................................................................................38
Research Design .........................................................................................................38
5
Cost per Flying Hour ..................................................................................................41
Research Question and Hypotheses ............................................................................42
Descriptive Statistics ..................................................................................................42
Statistical Tests ...........................................................................................................44
Prediction ....................................................................................................................47
Conclusion ..................................................................................................................47
Chapter IV: Analysis and Results ......................................................................................48
Chapter Overview .......................................................................................................48
Research Question I ....................................................................................................48
Research Question II ..................................................................................................71
Research Question III .................................................................................................83
Summary.....................................................................................................................84
Chapter V: Conclusions .....................................................................................................85
Chapter Overview .......................................................................................................85
Research Question I ....................................................................................................85
Research Question II ..................................................................................................87
Research Question III .................................................................................................88
Significance of Research ............................................................................................89
Limitations ..................................................................................................................89
Recommendations for Future Research ......................................................................90
Summary.....................................................................................................................91
Appendix A: Level One Element Correlation Table .........................................................92
Appendix B: Elements 1.0 & 2.0 Sub-Elements Correlation Table ..................................93
Appendix C: Element 3.0 Sub-Elements Correlation Table ..............................................94
6
Appendix D: Element 4.0, 5.0 & 6.0 Sub-Elements Correlation Table .............................95
Appendix E: Cost Element Structure Mean Percentages for Bomber Platforms ...............96
Appendix F: Cost Element Structure Mean Percentages for Fighter Platforms ................98
Appendix G: Cost Element Structure Mean Percentages for Recon Platforms ...............106
Appendix H: Cost Element Structure Mean Percentages for Special Duty Platforms ....108
Appendix I: Cost Element Structure Mean Percentages for Trainer Platforms ...............112
Appendix J: Cost Element Structure Mean Percentages for Transport Platforms ...........115
Appendix K: Cost Element Structure Mean Percentages for UAV/Drone Platforms .....122
Bibliography ....................................................................................................................123
List of Figures
Page Figure 1: Cost Element Structure elements & sub-elements (OSD-CAPE, 2014) ........... 12
Figure 2: OSD-CAPE Cost Estimating Guide: Illustrative System Life Cycle ................ 20
Figure 3: Cost Estimating Guide Cost Element Structure ................................................ 24
Figure 4: Mean AUC Estimate Errors as a Function of Time (Ryan et al., 2013) ........... 27
Figure 5: Role of O&S Estimates by Acquisition Event (OSD CAPE, 2014). ................ 36
List of Tables
Table 1: Additional Research into Operating and Support Costs ..................................... 30
Table 2: Screening Process for Aircrafts .......................................................................... 39
Table 3: Categories and Platforms Analyzed .................................................................... 40
Table 4: Summary Statistics for the 52 Aircrafts Analyzed ............................................. 49
Table 5: OSD-CAPE Cost Element Structure Mean Percentages for Bombers ............... 49
Table 6: OSD-CAPE Cost Element Structure Mean Percentages for Fighters ................ 50
Table 7: OSD-CAPE Cost Element Structure Mean Percentages for Reconnaissance .... 50
7
Table 8: OSD-CAPE Cost Element Structure Mean Percentages for Special Duty ......... 50
Table 9: OSD-CAPE Cost Element Structure Mean Percentages for Trainer .................. 50
Table 10: OSD-CAPE Cost Element Structure Mean Percentages for Transport ............ 51
Table 11: OSD-CAPE Cost Element Structure Mean Percentages for UAV/Drone ........ 51
Table 12: OSD-CAPE Cost Element Structure Mean Percentages for Bombers ............. 52
Table 13: Summary Statistics for the OSD-CAPE Cost Elements for Bomber ............... 53
Table 14: OSD-CAPE Cost Element Structure Mean Percentages for Fighter ................ 54
Table 15: Summary Statistics for the OSD-CAPE Cost Elements for Fighter ................. 56
Table 16: OSD-CAPE Cost Element Structure Mean Percentages for Reconnaissance .. 57
Table 17: Summary Statistics for the OSD-CAPE Cost Elements for Reconnaissance ... 59
Table 18: OSD-CAPE Cost Element Structure Mean Percentages for Special Duty ....... 60
Table 19: Summary Statistics for the OSD-CAPE Cost Elements Special Duty ............. 62
Table 20: OSD-CAPE Cost Element Structure Mean Percentages for Trainer ................ 63
Table 21: Summary Statistics for the OSD-CAPE Cost Elements Trainer ...................... 65
Table 22: OSD-CAPE Cost Element Structure Mean Percentages for Transport ............ 66
Table 23: Summary Statistics for the OSD-CAPE Cost Elements Bomber ..................... 68
Table 24: OSD-CAPE Cost Element Structure Mean Percentages for UAV/Drone ........ 69
Table 25: Summary Statistics for the OSD-CAPE Cost Elements UAV/Drone .............. 70
Table 26: Kruskal Wallis Test Element 1.0 ...................................................................... 73
Table 27: Steel Dwaas Test Element 1.0 .......................................................................... 73
Table 28: Kruskal Wallis Test Element 2.0 ...................................................................... 74
Table 29: Steel Dwaas Test Element 2.0 .......................................................................... 75
Table 30: Kruskal Wallis Test Element 3.0 ...................................................................... 76
8
Table 31: Steel Dwaas Test Element 3.0 .......................................................................... 76
Table 32: Kruskal Wallis Test Element 4.0 ...................................................................... 77
Table 33: Steel Dwaas Test Element 4.0 .......................................................................... 78
Table 34: Kruskal Wallis Test Element 5.0 ...................................................................... 79
Table 35: Steel Dwaas Test Element 5.0 .......................................................................... 79
Table 36: Kruskal Wallis Test Element 6.0 ...................................................................... 80
Table 37: Steel Dwaas Test Element 6.0 .......................................................................... 81
Table 38: Summary of Question II's Significant Results .................................................. 81
Table 39: Results from the Steel Dwaas Tests.................................................................. 82
Table 40: Summary Statistics for the 52 Aircrafts Analyzed ........................................... 86
Table 41: Summary of Question II's Significant Results .................................................. 87
9
Chapter I: Introduction
The United States Air Force (USAF) mission is to ensure unmatched capabilities
in air, space and cyberspace. To accomplish this, a major focus since the inception of the
Air Force has been the acquisition and procurement of aircraft, which ensures superior air
capability and performance globally. Cost was often relegated as a secondary
consideration to performance. While this approach has been strategically and
operationally advantageous it has not been without long-term financial consequences.
This approach has historically emphasized short-term costs (e.g. research and
development or procurement) at the expense of long-term affordability considerations
manifested in the aircraft’s Operating and Support (O&S) costs (Ryan, Jacques, Ritschel,
& Schubert, 2013). Likewise, there is an abundance of research focused on acquisition
and research and development costs while minimal research specifically focused on O&S
costs (Jones, White, Ritschel & Ryan, 2015). The U.S. Air Force and the entirety of the
Department of Defense (DoD) historically emphasized acquisition costs while
overlooking O&S costs within the Life-Cycle Costs (LCC) leading to years of unadjusted
cost estimates, which can ultimately lead to future cost growths. However, more recently,
the U.S. Air Force has emphasized the importance of accurate O&S cost estimates for its
various fleet of weapon systems to determine a more accurate LCC (Congress, 2009).
LCC is defined as the sum of four major cost categories: research and development,
acquisition, O&S, and disposal costs (OSD-CAPE, 2014). O&S costs consists of
sustainment costs incurred from the initial system deployment through the end of system
operations (OSD-CAPE, 2014).
10
O&S costs, despite being within 50%-65% (dependent on type of fixed-wing
aircraft) of an aircraft’s LCC, simply did not historically generate the attention it truly
deserved (Jones, 2015). The Nunn-McCurdy Act, signed into law by President Reagan
with the 1983 Department of Defense Authorization Act (DoDAA), requires “DoD to
report to Congress whenever a major defense acquisition program experiences cost
overruns that exceed certain thresholds” (Schwartz, 2010). However, the Nunn-McCurdy
act only applies to a program during the acquisition and production phase of the life-
cycle. Though many analysts have praised the efforts of the act, others suggest “that
Nunn-McCurdy is not a sufficiently comprehensive reporting mechanism because it does
not apply to all elements of a weapon system’s life-cycle costs, such as its operations,
support, or disposal costs” (Schwartz, 2010). The United States House of Representatives
have noted the weaknesses of the Nunn-McCurdy and amended it a number of times,
however these amendments did not address the issues concerning O&S costs.
The most notable legislation change applicable to O&S costs is the Weapon
Systems Acquisition Reform Act of 2009, commonly known as WSARA, an act that
reformed the acquisition process within the Do D. WSARA highlighted the importance of
accurate information and realistic estimates for DoD programs (Public Law, WSARA
2009). Additionally, WSARA created the office of Cost Assessment and Program
Evaluation (OSD-CAPE) whose primary purpose is to evaluate and assess the accuracy
and affordability of cost estimates for DoD programs. The Director of OSD-CAPE is
“appointed by the President and is the principal advisor to the Secretary of Defense”
(Public Law, 2009). In recent years, the “DoD mandated that each military service
maintain an historical database of actual O&S costs for its systems” which has equipped
11
the service member with the ability to research and analyze the O&S cost for weapon
systems (Public Law, 2009).
Though WSARA is less than a decade old, the emphasis on accurate estimation
has disseminated down to the program offices across the Air Force and to the Air Force
Institute of Technology Cost Analysis Program. The Air Force Institute of Technology
Cost Analysis Program is an organization that has been on the forefront of cost analysis
research. The desire to find better techniques and more accurate methods in developing
O&S estimates has been annotated by many Air Force officers that have participated in
the research into O&S cost estimates and its numerous avenues of interpretation (Jones,
2015; Ryan, 2013). The primary focus of this thesis is the research into O&S cost
estimating relationships (CER) and cost estimating techniques to derive more accurate
estimates within the OSD-CAPE’s cost element structure (CES).
Purpose
This research provides a better understanding of cost relationships within the Air
Force aircrafts fleet to better predict the accuracy of future O&S costs. We utilize the
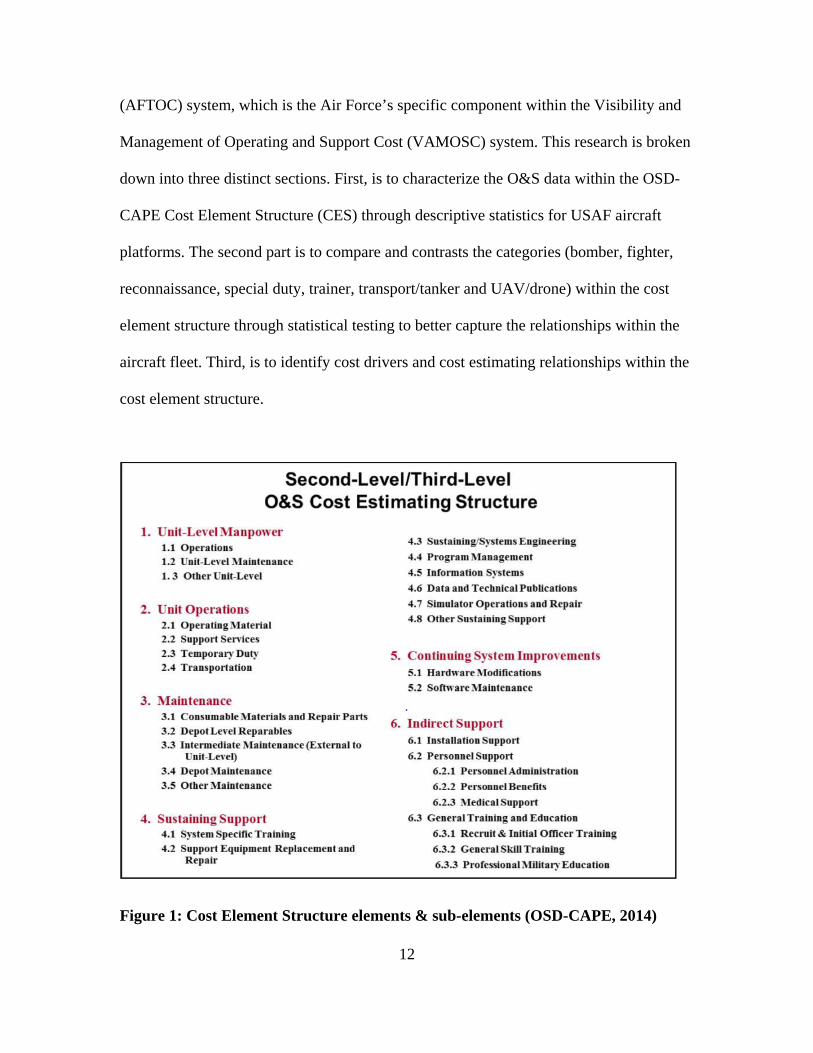
OSD-CAPE’s cost element structure which is composed of six major elements: Unit
Level Manpower, Unit Operations, Maintenance, Sustaining Support, Continuing System
Improvements, and Indirect Support (OSD-CAPE, 2014). However, these six elements
are broken down into various sub-elements (See Figure 1). Extensive research into the
actual costs incurred within these sub-elements are lacking despite the potential benefits
they could provide in furthering the accuracy of future O&S estimates. The data
available on the cost element structure is found in the Air Force Total Ownership Cost
12
(AFTOC) system, which is the Air Force’s specific component within the Visibility and
Management of Operating and Support Cost (VAMOSC) system. This research is broken
down into three distinct sections. First, is to characterize the O&S data within the OSD-
CAPE Cost Element Structure (CES) through descriptive statistics for USAF aircraft
platforms. The second part is to compare and contrasts the categories (bomber, fighter,
reconnaissance, special duty, trainer, transport/tanker and UAV/drone) within the cost
element structure through statistical testing to better capture the relationships within the
aircraft fleet. Third, is to identify cost drivers and cost estimating relationships within the
cost element structure.
Figure 1: Cost Element Structure elements & sub-elements (OSD-CAPE, 2014)
13
Research Questions
What are the expected mean/median/quartile ranges of the various aircrafts per
the OSD-CAPE Cost Element Structure and their relationship to O&S costs? Determine
the O&S cost element structure mean/median/quartile ranges for various aircrafts across
platforms and categories to determine where within the CES the expenditures are
incurred. Having a better understanding of where within the CES the costs are incurred,
the decision makers will have statistical evidence to help make better and more
applicable cost related decisions. The DoD acquisitions community and cost estimators
alike will both benefit from understanding how our weapon systems are actually
incurring costs.
Compare, contrast, and identify the relationships within the OSD-CAPE Cost
Element Structure across the aircraft categories (bomber, fighter, reconnaissance,
special duty, trainer, transport/tanker and UAV/drone). By evaluating the relationships
between aircraft categories, future cost estimators receive a better understanding of the
relationships that compose the entirety of the Air Force aircraft fleet. This provides a
source for different program offices to compare and contrast their results with other
program offices across the Air Force.
What are the potential cost drivers and cost estimating relationships within the
OSD-CAPE Cost Element Structure? The research intends to find potential cost drivers
(i.e. cost estimating relationships) in the O&S data. Within the six major cost elements,
sub-elements exist and their cost could be derived using other elements/sub-elements as
14
factors. We intend to identify these relationships within this research. Therefore, a
quantitative understanding into the techniques and cost estimating methodology for this
method will be researched, analyzed, and properly documented to provide future
estimators a source for utilizing such techniques.
Methodology
The AFTOC database is utilized for this research. The database presents data
broken down into the six OSD-CAPE’s elements and sub-elements. We focus on fixed-
wing aircrafts with available data provided within AFTOC. AFTOC allows the extraction
of normalized data from 1996-2016 of all categories and platforms presented in this
research broken down by the six elements (level one) along with their unique sub-
elements (level two and level three). This enables us to capture the descriptive statistics
needed to answer research question one for each aircraft platform and category. The
second research question is achieved by utilizing statistical tests to compare the results of
question one to develop a better understanding of the relationships between aircraft
categories. The statistical test utilized to accomplish this is the Kruskal-Wallis test along
with the Steel-Dwass test which is used to compare differences between two or more
independent groups. Lastly, question three’s cost drivers are identified using a correlation
matrix using all elements and sub-elements as the independent variables.
Scope and Limitations
The scope of this research is limited to aircraft within the Air Force inventory
present in the AFTOC system. The data utilized has a start date of 1996 as this was when
the VAMOSC system originated. The data spans from 1996-2016 due to the data being
15
actuals of how much was spent rather than estimates of how much was planned on
spending. As a result, 2017 data is not included. With any service-wide database,
AFTOC contains flaws due to human error and error based on consistency. The data
presented in AFTOC is limited to the information provided by various program offices,
however, AFTOC has normalized the data to limit the errors that can occur from different
sources of input.
Though the data utilized is only USAF, the findings may be applicable to other
services with similar platforms. Further research would be needed to compare and
contrast similar platforms within different services however the information presented in
this research will be without this type of exploration. Other limitations would be derived
from incorrect data points and inconsistencies though we recognize that AFTOC updates
the database regularly.
Summary
This research paper is broken down into five unique chapters: Introduction,
Literature Review, Methodology, Results and Conclusion. The Literature Review
contains information on past research that creates the foundation for this thesis. This
chapter is integral in understanding why this research is being conducted and identifies
the gap in the literature this thesis will fill. The Methodology section is a detailed section
about the statistical techniques utilized to accomplish the goals of this research. In this
section, you will find a step by step process to understand how the research was
conducted. The Results section will specifically be a summary of the findings of the tests
16
performed. Lastly, the conclusion will discuss the significance of the findings with
respect to our research questions.
17
Chapter II: Literature Review
Chapter Overview
This Chapter offers insight into past research focused on Operating and Support
Costs (O&S) for Department of Defense (DoD) Weapon Systems. It also provides
background into the OSD-CAPE Cost Element Structure (CES) and the foundation to
which this thesis builds upon. Additional information on terminology and definitions for
the life-cycle cost structure components are essential to provide the background needed to
understand the purpose and goal of this thesis research.
Nunn-McCurdy Act & Weapon Systems Acquisition Reform Act of 2009
The Nunn-McCurdy Act was established in 1983 and signed into law by President
Reagan. The act required DoD officials to report cost overruns to Congress on Major
Defense Acquisition Programs (MDAP) that exceed certain thresholds (Schwartz, 2010).
The primary purpose of the Nunn-McCurdy Act was to hold Pentagon officials and defense
contractors accountable and responsible for managing cost overruns for acquisition
programs across the DoD during the procurement and acquisition process (Schwartz,
2010). Moshe Schwartz of the Congressional Research Service investigated the
effectiveness and shortfalls of the Nunn-McCurdy act nearly three decades after its
implementation. Schwartz states that the “GAO reported that 42% of programs in the
FY2008 portfolio experienced acquisition unit cost growth of at least 25% compared to
37% of programs experiencing cost growth in the FY2000 portfolio” (Schwartz, 2010). Dr.
Jonathan D. Ritschel of the Air Force Institute of Technology found that Nunn-McCurdy
breaches rarely resulted in enforcement of the termination threat when breaches occur.
18
Rather, secondary effects, in the form of program restructuring were found to be prevalent,
but not in those areas that most adversely affected the program (Ritschel, 2012). Though
the Nunn-McCurdy Act has proved sufficient for reporting cost overruns during the
acquisition process, analysts have suggested that it is not a comprehensive reporting tool
because it does not apply to all phases of the life-cycle process such as O&S costs
(Schwartz, 2010). One of the main findings of Schwartz’s research is that DoD acquisition
programs make key decisions during the acquisition phase to lower acquisition costs which
could result in higher long-term O&S costs – ultimately leading to higher overall life-cycle
costs (Schwartz, 2010).
The Weapon Systems Acquisition Reform Act of 2009 (WSARA 2009) is the most
current congressional act that reemphasizes the importance of cost estimating and program
evaluation across the DoD and the first act that put a significant focus on long term O&S
costs. WSARA established the Office of the Secretary of Defense Cost Assessment and
Program Evaluation (OSD-CAPE) whose director became the principal advisor to the
Secretary of Defense for independent analysis and matters regarding long-term
affordability of DoD acquisition programs (Public Law, WSARA 2009). OSD-CAPE was
established to further strengthen the oversight on DoD acquisition programs after the
acquisition phase of the life-cycle (Schwartz, 2010). The Public Law document published
on 22 May 2009 details the functions of WSARA, which is relevant in this research for its
emphasis on affordability after the acquisition phase and into the O&S phase. It
complements the Nunn-McCurdy legislation by continuing the tracking of costs during the
O&S phase and enabling the investigation on such programs that continue to exceed
thresholds past the acquisition phase.
19
The importance of O&S cost and cost estimates has trickled down to various centers
across the DoD and the Air Force specifically. The Air Force Cost Analysis Agency
(AFCAA) at Andrews AFB established an O&S cost division in 2011 while the Air Force
Space Command established an O&S cost section in 2015. AFCAA is currently in the
process of developing an O&S specific guide to cost estimating while also establishing
other guides such as Legacy Aircraft Operations & Support Cost Estimating Guide which
is a “how-to” document offering guidance for developing cost estimates for legacy aircraft
systems. The increased emphasis on operations and support in academia, DoD, and
government supportive agency’s alike is a result after the introduction of WSARA in 2009.
Definition of Life-Cycle Costs and Operating & Support Costs
First, we define the cost categories that make up Life-Cycle Costs. According to
OSD-CAPE’s Cost Estimating Guide, “Life-cycle costs is defined as the sum of four major
categories: (1) research and development costs; (2) investment costs, consisting of
procurement, military construction, and acquisition-related operations and maintenance
(O&M) associated with production and deployment activities; (3) O&S costs; and (4)
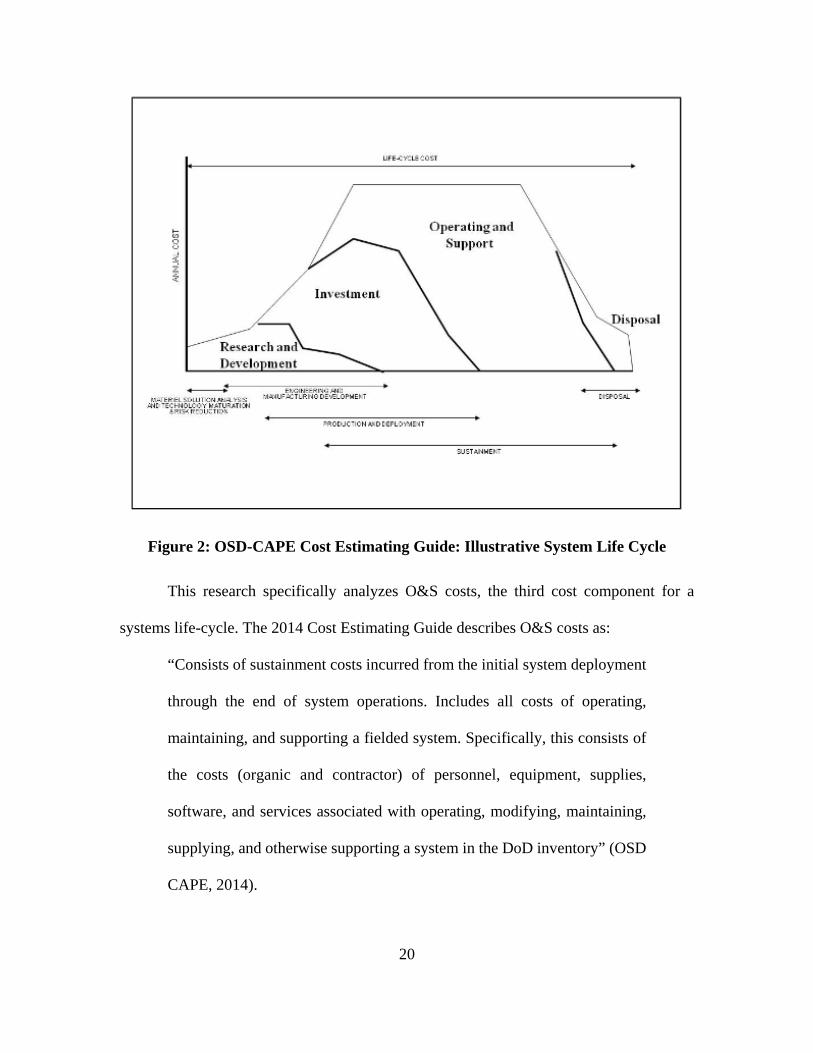
disposal costs” (OSD CAPE, 2014). Historically, O&S costs has been the largest cost
component followed by R&D and investment costs, while, disposal costs have been fairly
minute in regards to overall system life-cycle costs. Figure 2 illustrates this notional
relationship between the cost components of life-cycle costs.
20
Figure 2: OSD-CAPE Cost Estimating Guide: Illustrative System Life Cycle
This research specifically analyzes O&S costs, the third cost component for a
systems life-cycle. The 2014 Cost Estimating Guide describes O&S costs as:
“Consists of sustainment costs incurred from the initial system deployment
through the end of system operations. Includes all costs of operating,
maintaining, and supporting a fielded system. Specifically, this consists of
the costs (organic and contractor) of personnel, equipment, supplies,
software, and services associated with operating, modifying, maintaining,
supplying, and otherwise supporting a system in the DoD inventory” (OSD
CAPE, 2014).
21
The majority of O&S funding is primarily funded by Military Personnel (MILPERS) and
Operations and Maintenance (O&M) appropriations (OSD CAPE, 2014). O&M
appropriations (3400) are one-year appropriations meaning they must be obligated within
the fiscal year issued, however then can be incrementally funded. The Defense Acquisition
University (DAU) provides examples of what type of expense is funded through O&M
appropriations:
“Headquarters operations, civilian salaries and awards, travel, fuel, minor
construction projects of $1M or less, expenses of operational military
forces, training and education, recruiting, depot maintenance, purchases
from Defense Working Capital Funds (e.g., spare parts), base operations
support, and assets with a system unit cost less than the current
expense/investment threshold ($250K)” (DAU, 2016).
O&S costs being funded specifically with O&M appropriations illustrates why specific
weapon systems are sometimes over or underutilized. For example, if the price of fuel is
near its historical highs, certain aircraft will be grounded and utilization rates drop
compared to when fuel costs are lower. This example of the process of estimating years or
even decades prior to when it is actually used is a fundamental issue with O&S estimating.
Additionally, although the majority of O&S funding comes from O&M appropriations, not
all cost incurred during the O&S phase is specific to O&M. The Operating and Support
Cost Management Guidebook states that “Project Managers (PMs) must consider five
appropriation categories when developing requests for program funding: RDT&E,
Procurement, MILCON, MILPERS, and O&M” (DAU, 2016). This leads to additional
22
levels of complexity when estimating for O&S costs years, even decades, before the cost
is actually in the budgetary process. Quantitative techniques, inflation calculators, and
historical trends are utilized to make the most accurate estimate, however, the estimation
is merely an educated guess. The mass uncertainty in countless variables make O&S
estimating extremely difficult and will continue to do so until more accurate techniques are
established.
An accurate estimate would enable smoother preparation for the yearly budgetary
process, however the budgetary process is not the most demanding concern within the O&S
issue. By developing more accurate estimates, it enables decision makers to establish
alternatives and to make more informed long-term financial decisions that can impact
decades of appropriations. Developing less constrained budgetary situations start, on a
foundational level, from accurate estimating to provide the decision makers the tools to
make the most informed decisions they possibly can about weapon systems they are
procuring.
Cost Element Structure Definition
When constructing O&S cost estimates, the Air Force utilizes the OSD-CAPE’s
cost element structure. It is defined by six overarching elements including various levels
of sub-elements. According to the OSD-CAPE Cost Estimating Guide the “cost element
describes and defines the specific elements to be included in the O&S cost estimate in a
disciplined hierarchy” (OSD CAPE, 2014). This hierarchy is generalized and certain sub-
elements may not apply to specific estimates depending on weapon system type. For
example, if a sub element such as Training Munitions does not apply to a specific weapon
23
system, that sub-element would be omitted. The following definitions are provided in the
2014 OSD-CAPE Cost Estimating Guide:
• 1.0 Unit-Level Manpower. Cost of operators, maintainers, and other
support manpower assigned to operating units. May include military,
civilian, and/or contractor manpower.
• 2.0 Units Operations. Cost of unit operating material (e.g., fuel, and
training material), unit support services, and unit travel. Excludes material
for maintenance and repair.
• 3.0 Maintenance. Cost of all system maintenance other than maintenance
manpower assigned to operating units. Consists of organic and contractor
maintenance.
• 4.0 Sustaining Support. Cost of system support activities that are provided
by organizations other than the system’s operating units.
• 5.0 Continuing System Improvements. Cost of system hardware and
software modifications.
• 6.0 Indirect Support. Cost of support activities that provide general
services that lack the visibility of actual support to specific force units or
systems. Indirect support is generally provided by centrally managed
activities that provide a wide range of support to multiple systems and
associated manpower.
24
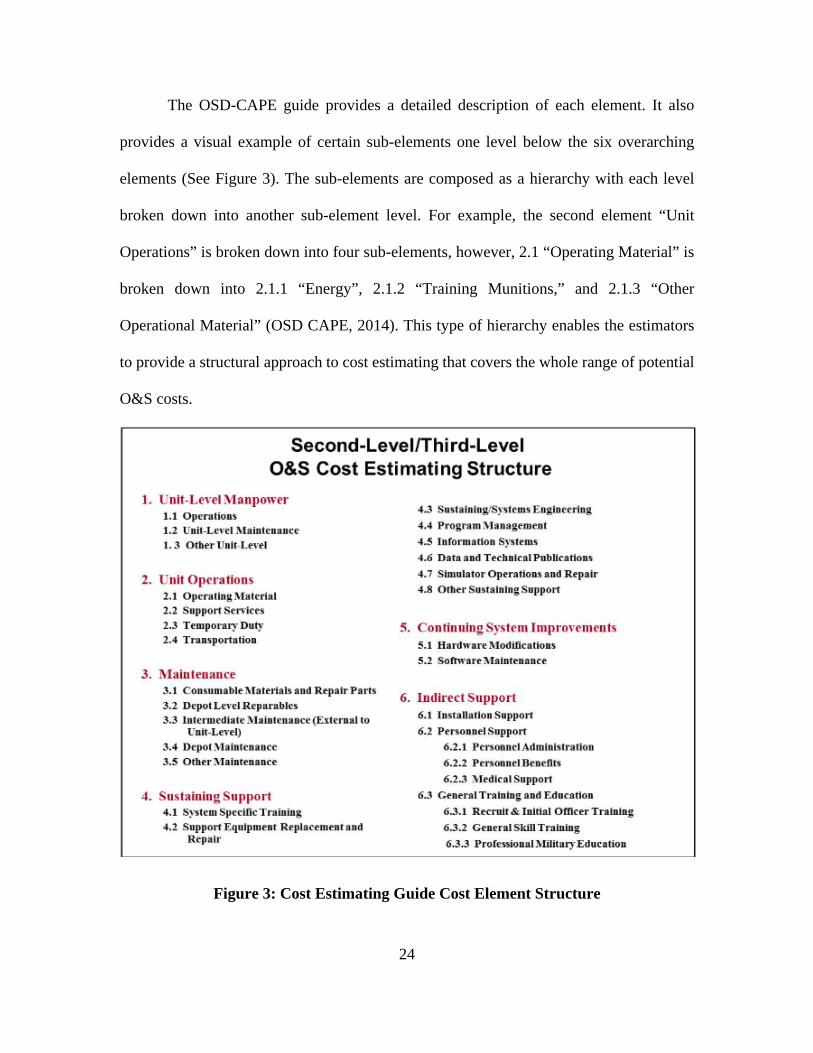
The OSD-CAPE guide provides a detailed description of each element. It also
provides a visual example of certain sub-elements one level below the six overarching
elements (See Figure 3). The sub-elements are composed as a hierarchy with each level
broken down into another sub-element level. For example, the second element “Unit
Operations” is broken down into four sub-elements, however, 2.1 “Operating Material” is
broken down into 2.1.1 “Energy”, 2.1.2 “Training Munitions,” and 2.1.3 “Other
Operational Material” (OSD CAPE, 2014). This type of hierarchy enables the estimators
to provide a structural approach to cost estimating that covers the whole range of potential
O&S costs.
Figure 3: Cost Estimating Guide Cost Element Structure
25
Relevant Research on Operation & Support Cost
Previous research into operating and support costs is minimal compared to the
research into the acquisition costs of DoD weapon systems. Lt Col Ryan states that
“between 1945 and 2009, there were over 130 separate studies and commissions focused
on the acquisition of DoD systems…during this same time period, there appears not to be
a single published study pertaining to how system costs behave during the O&S phase”
(Ryan, Jacques, Colombi, & Schubert, 2012). However, other areas of O&S research has
been traced back to at least 1975 by Marco Fiorello of the Rand Corporation who
investigated the ratio of O&S costs to life-cycle cost (Ryan, 2015). Fiorella also published
Combat Vehicle System Operating and Support Costs: Guidelines for Analysis in 1977
which discussed the increasing cost of operating DoD combat vehicle systems and
researched an effective way of decreasing O&S costs during the life-cycle of a weapon
system (Fiorello, 1977). The research was an analysis into O&S estimating methodologies
and the development of O&S cost review procedures and guidelines for examining cost
impacts for maintaining DoD weapon systems (Fiorello, 1977). However, Fiorello
concluded that the accuracy of long term cost estimating were ill-founded (Fiorello, 1977).
In their published article Trends in Weapon System Operating and Support Cost
(1997), the Institute for Defense Analysis (IDA) explains how the Under Secretary of
Defense for Acquisition and Technology, concerned about the effect of shrinking
modernization budgets, requested IDA to examine whether past efforts to reduce O&S
costs have been effective (Graves, Domin, & Porten, 1997). Their study determined that
O&S costs reduction efforts have not been successful, where fifty percent of the new
weapon systems were more expensive to operate than their predecessor platform (Graves
26
et al., 1997). However, Graves and the other authors also state that new weapon systems
are more complex and have significantly more capability than the weapon systems they are
replacing. Therefore it is not a technologically equivalent system, which makes direct
comparisons difficult. Subsequently, DoD leadership believed the additional capability of
these new weapon systems, which have a higher per unit cost, may have a lower absolute
total O&S cost in the long run due to the smaller fleet size needed to accomplish the same
job (Graves et al., 1997).
More recent research into O&S costs were investigated by USAF Lt Col Ryan and
his coauthors Colombi, Jacques, & Schubert. An article published in 2012 titled A
Proposed Methodology to Characterize the Accuracy of Life Cycle Cost Estimates for DoD
Programs researched the accuracy of life-cycle cost estimates and how they behave over
time while also utilizing data to address the deficiencies within the current analytical
methodology approach to cost estimating (Ryan et al., 2012). The authors state “strategic
decisions of program worth are often anchored in life cycle cost estimates, which simply
cannot be validated if the reliability of the largest cost component is unknown” (Ryan et
al, 2012). The authors continued to state that it “is essential the DoD develop a means of
assessing the accuracy of its O&S cost estimates” and demonstrate their research utilizing
a time-series evaluation of over three dozen MDAPS provides insight into the current
accuracy, or lack thereof, of O&S cost estimates (Ryan et al., 2014). Ryan et al. then
provide recommendations for improving these estimates (Ryan et al., 2012).
The article titled Characterizing the Accuracy of DoD Operating and Support Cost
Estimates written by Lt Col Ryan, Jacques, Ritschel, and Schubert investigates the
fundamental issue that the DoD has limited resources regarding O&S cost estimate
27
accountability and how O&S cost estimates evolve across time (Ryan, Jacques, Ritschel,
& Schubert, 2013). Lt Col Ryan and the other authors are the first recorded attempt to
characterize O&S costs, and given the magnitude of dollars at stake within the O&S arena,
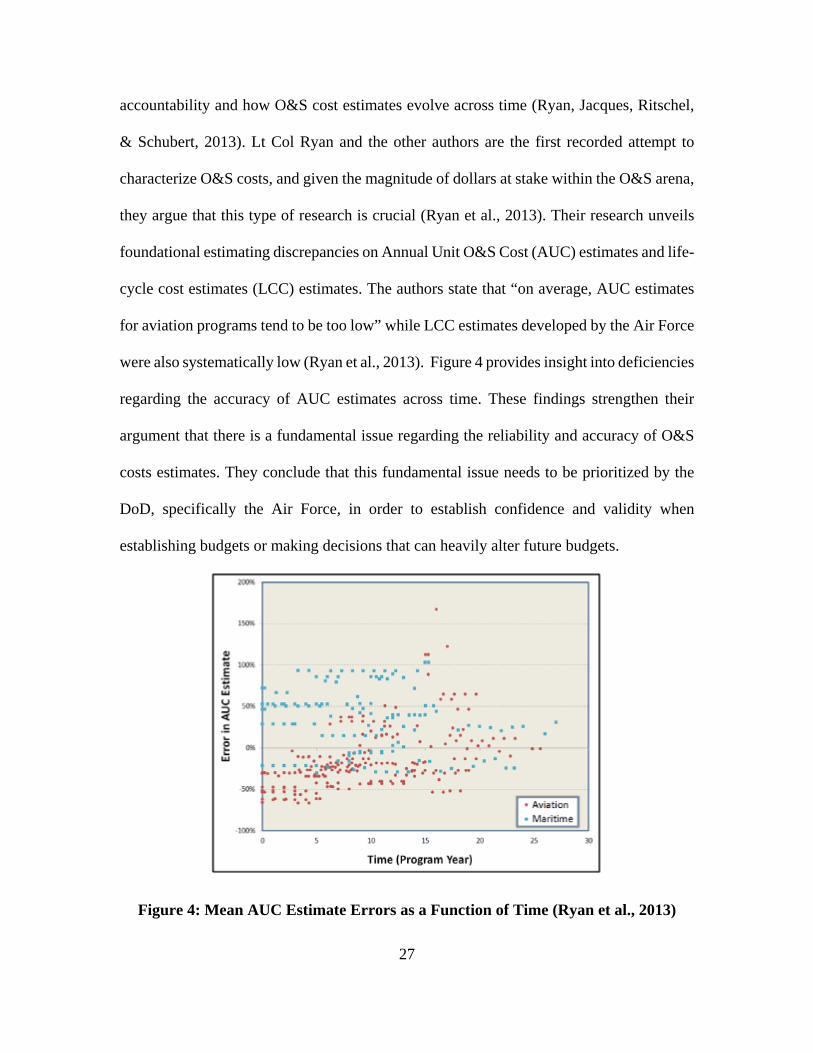
they argue that this type of research is crucial (Ryan et al., 2013). Their research unveils
foundational estimating discrepancies on Annual Unit O&S Cost (AUC) estimates and life-
cycle cost estimates (LCC) estimates. The authors state that “on average, AUC estimates
for aviation programs tend to be too low” while LCC estimates developed by the Air Force
were also systematically low (Ryan et al., 2013). Figure 4 provides insight into deficiencies
regarding the accuracy of AUC estimates across time. These findings strengthen their
argument that there is a fundamental issue regarding the reliability and accuracy of O&S
costs estimates. They conclude that this fundamental issue needs to be prioritized by the
DoD, specifically the Air Force, in order to establish confidence and validity when
establishing budgets or making decisions that can heavily alter future budgets.
Figure 4: Mean AUC Estimate Errors as a Function of Time (Ryan et al., 2013)
28
USAF Capt. Gregory Ferry took a different approach into O&S cost research
when he investigated cost growth above inflation (CGAI) for raw materials for aircraft
within the Air Force inventory. The Air Force utilizes different inflation indices to
calculate O&S cost estimations for future costs; however when these cost are growing
faster than anticipated it puts even more complexity within the already constrained
budgetary process. As Ferry states, quoting former Chairmen of the Joint Chiefs of Staff
Admiral Mullens, “continually increasing debt is the biggest threat we have to our
national security” (Ferry, 2013). Ferry concludes that raw materials, after the data was
evaluated through statistical techniques, is a source of CGAI (Ferry, 2013). These
findings affect previous estimates that did not take CGAI into account and the additional
unaccounted cost increase will lead to cost growth over the life cycle of the program. The
underestimated sustainment costs of the program will lead to increasing budgetary
requests that will demand more resources from an already shrinking and constrained DoD
budget. Another significant finding from this research is the inaccuracy of the inflation
indices utilized by DoD estimators. If these indices are not accurately capturing the
growth of raw materials, it raises uncertainty in other variables that may also be
underestimated.
Adding to the recent research into O&S Costs, USAF Capt. Gary Jones (2014)
investigates the ratio of O&S costs to life-cycle costs. Jones’s research sought to determine
the accuracy of the “golden ratio” of 30:70, acquisition to O&S costs. His findings
determined that the golden ratio lacks foundational accuracy and determined that a single,
fixed ratio is not appropriate due to the varying nature of DoD weapons system platforms.
Jones characterizes the O&S data for eight different groups of weapon systems and found
29
staggering means for O&S costs with missiles being the low mean of roughly 8% of life
cycle cost and the high mean of 72% O&S costs for Unmanned Aerial Vehicles to life
cycle cost (Jones et al, 2015). Additionally, he concludes the difficulty in estimating O&S
costs derives from the varying nature of life expectancies for DoD weapon systems (Jones
et al, 2015). He states that “illustrating the variability of life-cycle proportions among
weapon system categories, … show a more realistic picture of what program analysts and
portfolio managers can expect in terms of sustainment costs” (Jones et al, 2015). Therefore,
the addition of varying life expectancies can allow for cost estimators to estimate for the
various potential life expectancies of DoD weapon systems to better inform the decision
maker of potential O&S costs for the respective system.
There is no doubt that the recent emphasis on O&S costs has led to increased
research in the area. Table 1 outlines additional research with emphasis in O&S cost since
the introduction of WSARA in 2009. With growing emphasis comes increased knowledge
on root causes and fundamental issues into O&S cost estimating. This research adds to the
growing literature by proving insight into techniques that result in more accurate O&S cost
estimating.

30
Table 1: Additional Research into Operating and Support Costs
Research into the Cost Element Structure Components
The OSD-CAPE Cost Estimating Guide version 2007, 2010, and 2014 provides an
informative, detailed section on the Cost Element Structure. However, limited analysis into
the CES and how estimates are derived within the CES exists. Few examples of research
Publication & Title Year Authors Main FindingsUS GAO, DoD Needs Better
Information and Guidance to More Effectively Manage and Reduce Operating and Support Costs of
Major Weapon Systems
2010 US GAO
DoD lacks key information needed to effectively manage and reduce O&S costs for
most of the weapon systems the GAO reviewed.
IDA, WSARA 2009: Joint Strike Fighter Root Cause Analysis 2010
Scot Arnold, Ji Byun, Harley Cloud, Alexander Gallo, Matthew Gonwa, Bruce Harmon, Prashant Patel, Colin Sull ivan,
John Hil ler, & Patricia Broson
The findings list three quantifiable reasons which lead to Nunn-McCurdy breaches: Errors
in the Milestone B estimate resulted in a 23 percent increase, The redesign effort increase the PAUC by 26 percent, and changes in the buy profile led to a 5 percent increase in the
PAUC.
RAND Corporation, Managing U.S. Air Force Aircraft Operating and
Support Costs2012 Michal Boito, Thomas Light, Patrick
Mills, & Laura Baldwin
Fuel costs drove 31% of overall O&S cost growth, unit-level personnel costs 30%,
weapon system sustainment costs 27%, and modifications and other 12%.
US GAO, Improvements Needed to Enhance Oversight of Estimated
Long- term Costs for Operating and Supporting Major Weapon Systems.
Study
2012 US GAO
DoD reports on weapon system O&S estimates to Congress are often inconsistent
and in some cases unreliable, limiting visibility needed for effective oversight of these O&S
cost estimates.
Australian Government DoD, The Impact of Increasing Acquisition
Costs on the Operation and Support Budget for Military
Equipment
2013 Stephen Harrison
The analysis determined that the O&S costs for the various weapon systems examined
are rising. Additionally, a parametric relationship between O&S costs and
acquisition costs exist enabling more accurate O&S estimates during early
acquisition phase. Journal of Cost Analysis and
Parametric, A Macro-Stochastic Model for Improving the Accuracy of Department of Defense Life Cycle
Cost Estimates
2013 Erin Ryan, Christine Schubert Kabban, David Jacques, & Jonathan Ritschel
The authors provide a prognostic cost model which provides more accurate life cycle cost
estimates for various DoD programs.
Naval Postgraduate School, Analyzing the Effects of the Weapon
Systems Acquisition Reform Act2014 Austin Banford, Brad Naegle, Edward
Powley
The analysis concluded a correlation exists between WSARA implementation and
improved cost and schedule performance.
Journal of Transportation Management, Organic or Contract Support? Investigating Cost and
Performance in Aircraft Sustainment
2016 Jonathan Ritschel & Tamiko Ritschel
The authors find percentage of Contracted Logistics Support (CLS) employed in the
maintenance strategy to be the primary driver in O&S maintenance costs.
31
within the CES elements exist and this section is aimed to provide insight into those
research topics.
A recent article by the Rand Corporation titled Metrics to Compare Aircraft
Operating and Support Costs in the Department of Defense researched the effectiveness of
a consistent definition of aircraft O&S cost per flying hour metric that can be utilized across
all DoD platforms (Boito, Keating, Wallace, DeBlois, & Blum, 2015). This type of research
is beneficial to the DoD because it allows for a more standardized method of comparison
for cost per flying hour of different aircrafts. Specifically, Boito et al. focused on the cost
element structure and defined which cost components had either a fixed or variable
relationship to flying hours. The first five elements are self-explanatory and well defined
according to the OSD-CAPE CES; however the last element, Indirect Support, is more
vague and susceptible to individual interpretation. Boito describes Indirect Support as
“costs that are those installation and personnel support costs that cannot be identified
directly (in the budget or FYDP) to the units and personnel that operate and support the
system being analyzed, but nevertheless can be logically attributed to the system and its
associated manpower” (Boito et al., 2015). The importance of sharing Boito’s insight into
the indirect support element is that it is more subjective than the other elements, meaning
what one program office determines indirect support may not be applicable to another
program. Thus, the importance of clear definitions and proper documentations is essential
in creating estimates within the CES. Additionally, the applicability of Boito’s article to
this research is the attempt to characterize cost data utilizing the CES. The information
defining the CES is straight forward and provided by various sources (GAO, OSD CAPE,
32
DoD etc.) however research into the cost estimating techniques when deriving the actual
O&S cost estimates is lacking.
Aside from the definitional information provided in the GAO Cost Estimating &
Assessment Guide and the OSD-CAPE Cost Estimating Guide, the research into the usage
of the Cost Element Structure in cost estimating is lacking. The research by Boito et al.
advanced knowledge into the characterization of the Cost Element Structure elements and
sub-elements however more research is needed to analytically derive cost drivers within
the CES and statistically determine which platforms are driving up the O&S costs within
the Air Force.
Developing Cost Estimates
The GAO Cost Estimating and Assessment Guide and the OSD-CAPE’s Cost
Estimating Guide thoroughly discusses the development of an O&S cost estimate. They
individually highlight on a macro perspective the importance of accurate definitions,
scope, and a step-by-step coverage of what is essential within the O&S estimating
process. The cost estimating guide also provides detailed definitions of the five primary
estimating methods that are utilized in creating O&S cost estimates:
• Parametric. The parametric technique uses regression or other statistical methods
to develop Cost Estimating Relationships (CERs). A CER is an equation or
algorithm used to estimate a given cost element using an established relationship
with one or more independent variables. The relationship may be mathematically
simple or it may involve a complex equation (often derived from regression
analysis of historical systems or subsystems). CERs should be current, applicable
33
to the system or subsystem in question, and appropriate for the range of data
being considered.
• Analogy. An analogy is a technique used to estimate a cost based on historical
data for one (or occasionally two) analogous system(s). In this technique, a
currently fielded system, similar in design and operation to the proposed system,
is used as a basis for the analogy. The cost of the proposed system is then
estimated by adjusting the historical cost of the current system to account for
differences (between the proposed and current systems). Such adjustments can be
made through the use of factors (sometimes called scaling parameters) that
represent differences in size, performance, technology, reliability and
maintainability, complexity, or other attributes. Adjustment factors based on
quantitative data are usually preferable to adjustment factors based on judgments
from subject-matter experts.
• Engineering Estimate. This technique uses discrete estimates of labor and
material costs for maintenance and other support functions. The system being
estimated normally is broken down into lower-level subsystems and components,
each of which is estimated separately. The component costs, with additional
factors for integration, are then aggregated using simple algebraic equations to
estimate the cost of the entire system (hence the common name “bottom-up”
estimate). For example, system maintenance costs could be calculated for each
system component using data inputs such as system operating tempo, component
mean time between maintenance action, component mean labor hours to repair,
and component mean material cost per repair. Engineering estimates require
34
extensive knowledge of a system’s (and its components’) characteristics and a
significant amount of detailed data (sometimes obtained from the system prime
contractor). These methods are normally employed for mature programs.
• Extrapolation of Actual Costs. With this technique, actual cost experience or
trends (from prototypes, engineering development models, and/or early
production items) are used to project future costs for the same system. Such
projections may be made at various levels of detail, depending on the availability
of data. Such projections also may need to account for growth in reliability and
maintainability.
• Cost Factors. Cost factors are applicable to certain cost elements not related to
weapon system characteristics. Often, cost factors are simple per capita factors
that are applied to direct (i.e., unit-level) manpower to estimate indirect cost
elements such as base operations, military medical care, or general training and
education (not associated with a specific weapon system).
As shown above, while the current estimating guides are useful for understanding the
proper procedures and the textbook cost estimating methods of developing an estimate,
they lack a practical approach to real time estimating. The explanation on the process, the
strengths or weaknesses of the primary approaches, and a detailed definition for each
method is present but it lacks a standardize process for real time estimating that could be
utilized across program offices throughout the Air Force.
Currently, the Air Force doesn’t proscribe a standardized method of estimating. It
is largely dependent on which program office, center or organization is completing the
35
cost estimate. This is primarily to ensure a broad scope in estimating to ensure the
accuracy of each estimate. The Air Force has four primary types of cost estimates:
Program Office Estimates (POEs), Non Advocate Cost Assessments (NACAs), Service
Cost Positions (SCPs) and Independent Cost Estimates (ICEs) (Office of the Assistant
Secretary, 2017). POEs are specific to the program office that will be supporting the
project, NACAs are created by an organization that does not directly support the project
and acts merely as a cross-check third party member. The reconciled POE and
independent estimate becomes the official Air Force cost estimate called the SCP
estimate. An ICE, similar to a NACA, is a product of OSD-CAPE when required by
statute for ACAT ID and IAM programs according to DoDI 5000.02 (Office of the
Assistant Secretary, 2017). All these estimates differ in methodology and process to
ensure the Air Force broadly covers every avenue in the estimating process.
Though there is not a standardize method into O&S cost estimating, one reason
could be due to the uniqueness of each cost estimate. Primarily O&S estimating
methodologies differ when estimating for an existing weapon system from a new weapon
system in the acquisition phase. Also, estimates are independent of each other from a
macro perspective regarding which type of weapon system is being estimated. For
example, the methodology and approach of estimating a fixed wing aircraft compared to
a satellite differs tremendously therefore it is understandable that Air Force Space
Command follows a different approach compared to Air Force Life Cycle Management
Center at Wright Patterson AFB. Additionally, estimating intent and methods also differ
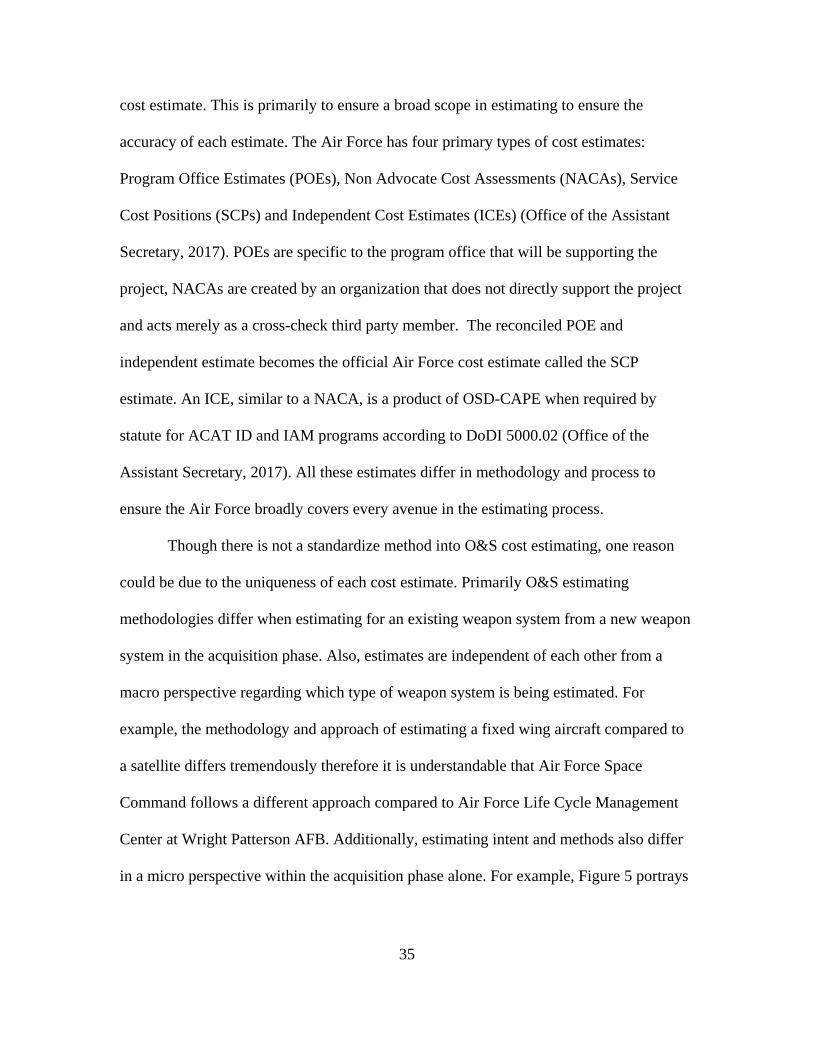
in a micro perspective within the acquisition phase alone. For example, Figure 5 portrays
36
how the intent of an estimate and the role it plays within different stages in the
acquisition process.
Figure 5: Role of O&S Estimates by Acquisition Event (OSD CAPE, 2014).
The intricate details that come along with O&S estimates is what makes them
difficult. To truly establish a detailed instruction guide to creating O&S estimates would
be beneficial but due to the subjective nature of some estimates it may serve only as a
reference tool to developing O&S estimates.
Summary
The intent of this Chapter was to inform on the past research that focused on
Operating and Support (O&S) Cost for Department of Defense Weapon Systems. The
37
importance of accurate O&S cost estimates were emphasized after the introduction of
WSARA in 2009 and the abundance of research to follow serves as evidence that
Congress, the DoD and academia has taken interest in long-term sustainment cost of our
major weapon systems. This Chapter also gave detailed information on the development
of O&S cost estimates and the foundation to developing these estimates within the OSD
CAPE Cost Element Structure. Also, the limited research into the characterization of
O&S data within the cost element structure is displayed in the Chapter due to the minimal
content regarding the subject. Additionally, the information on terminology and
definitions that encompass O&S estimates are essential to provide the background needed
to understand the purpose and goal of this thesis research. The next chapter follows the
methodology of how the data was collected, analyzed, and interpreted.
38
Chapter III: Methodology
Chapter Overview
Chapter 3 is a detailed methodology focusing on the process of collecting data,
utilizing statistical tools, and interpreting the outputs of the statistical test performed in
the analysis of the data. First, we explain the research design followed by the research
questions to inform why the following test were needed. Next, we describe the data
collection process and the assumptions needed to conduct the research.
Research Design
The aircraft O&S data is from the Air Force Total Ownership Cost (AFTOC)
system while being arranged in the OSD-CAPE Cost Element Structure. AFTOC allows
for the extraction of actual O&S cost data ranging from 1996-2016 for the total aircraft
inventory. The data enables us to complete statistical tests and provide descriptive
statistics needed to characterize the O&S data for the various aircrafts. The data is
integral in allowing us to answer the three research questions that are present in this
thesis. Various tests and statistical tools (JMP Statistical Software & Microsoft Excel) are
used to characterize this data. The data derived from AFTOC is raw and needs
standardization and normalization to complete the statistical tests.
Table 2 portrays the screening methodology to derive aircraft platforms and
categories that are examined during this research which is portrayed in Table 3. Each
aircraft platform researched is an ACAT 1 program. AFTOC distinguished aircrafts by
Mission Design (MD) and Mission Design Series (MDS). For example, the F-16’s MD is
F-16 while an example of the MDS is the F-16A. To develop a dataset of actual costs that
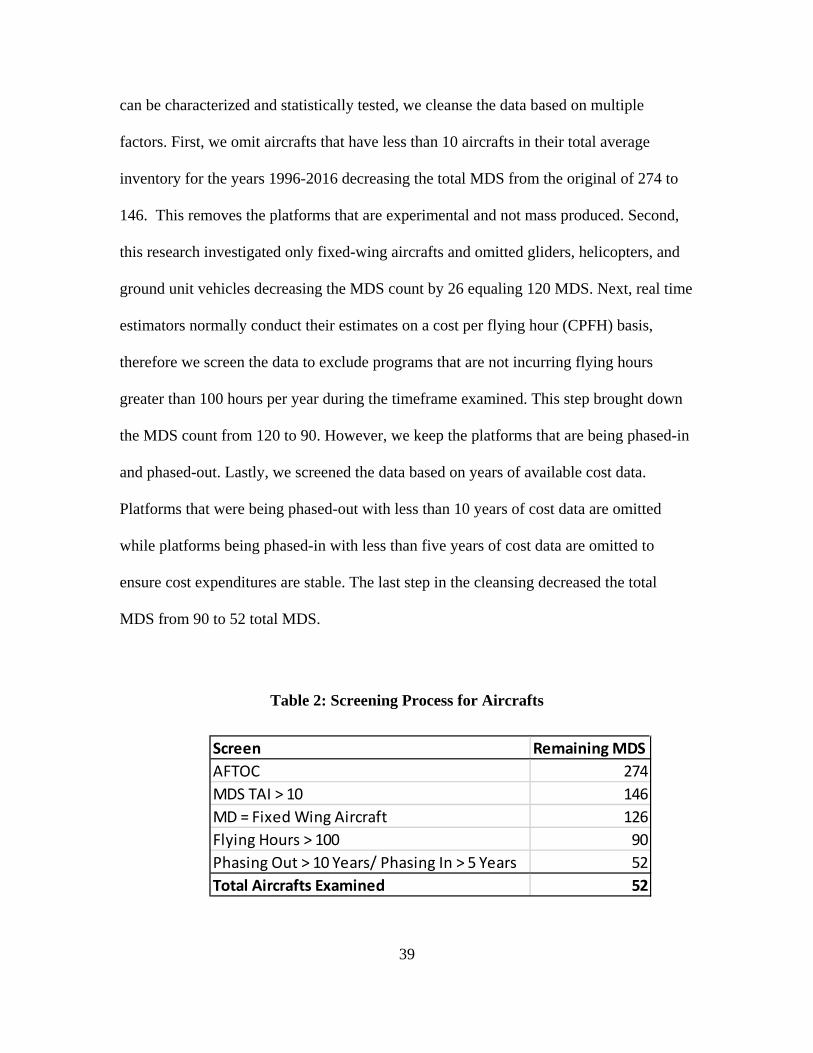
39
can be characterized and statistically tested, we cleanse the data based on multiple
factors. First, we omit aircrafts that have less than 10 aircrafts in their total average
inventory for the years 1996-2016 decreasing the total MDS from the original of 274 to
146. This removes the platforms that are experimental and not mass produced. Second,
this research investigated only fixed-wing aircrafts and omitted gliders, helicopters, and
ground unit vehicles decreasing the MDS count by 26 equaling 120 MDS. Next, real time
estimators normally conduct their estimates on a cost per flying hour (CPFH) basis,
therefore we screen the data to exclude programs that are not incurring flying hours
greater than 100 hours per year during the timeframe examined. This step brought down
the MDS count from 120 to 90. However, we keep the platforms that are being phased-in
and phased-out. Lastly, we screened the data based on years of available cost data.
Platforms that were being phased-out with less than 10 years of cost data are omitted
while platforms being phased-in with less than five years of cost data are omitted to
ensure cost expenditures are stable. The last step in the cleansing decreased the total
MDS from 90 to 52 total MDS.
Table 2: Screening Process for Aircrafts
Screen Remaining MDSAFTOC 274MDS TAI > 10 146MD = Fixed Wing Aircraft 126Flying Hours > 100 90Phasing Out > 10 Years/ Phasing In > 5 Years 52Total Aircrafts Examined 52
40
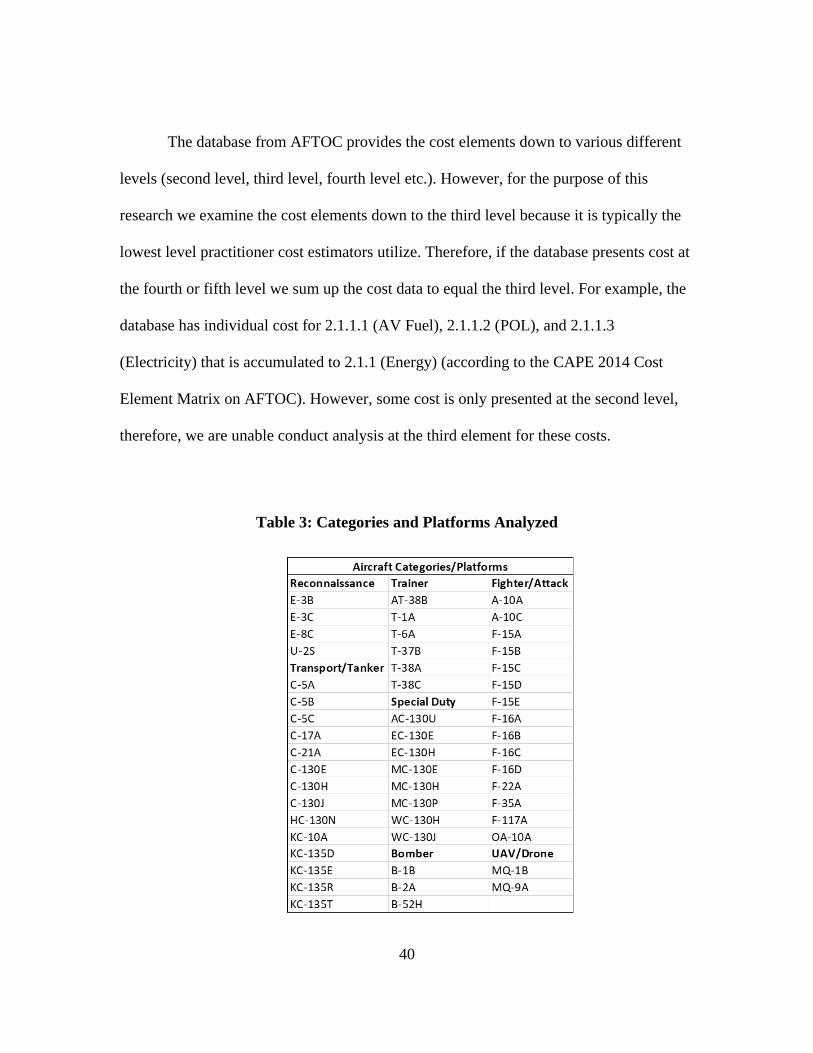
The database from AFTOC provides the cost elements down to various different
levels (second level, third level, fourth level etc.). However, for the purpose of this
research we examine the cost elements down to the third level because it is typically the
lowest level practitioner cost estimators utilize. Therefore, if the database presents cost at
the fourth or fifth level we sum up the cost data to equal the third level. For example, the
database has individual cost for 2.1.1.1 (AV Fuel), 2.1.1.2 (POL), and 2.1.1.3
(Electricity) that is accumulated to 2.1.1 (Energy) (according to the CAPE 2014 Cost
Element Matrix on AFTOC). However, some cost is only presented at the second level,
therefore, we are unable conduct analysis at the third element for these costs.
Table 3: Categories and Platforms Analyzed
41
Cost per Flying Hour
Once the database is established, in order to normalize the O&S cost, we calculate
the cost per flying hour (CPFH) for each aircraft. CPFH is calculated by taking the annual
cost for a certain element and dividing it by the flying hours for that certain platform for
that respective year. This enables us to determine the cost per flying hour for each
specific element. A benefit of calculating the CPFH is it normalizes the data regardless of
years in which platforms were more utilized than other years.
Next, we calculate the percentages for each cost element to the encompassing cost
element. For example, we divide the cost of 1.1 (Operations), 1.2 (Unit-Level
Maintenance), and 1.3 (Other Unit – Level) by the total expenditures for 1.0 (Unit-Level
Manpower) to derive the percentages per element 1.0 Unit-Level Manpower. This same
methodology is utilized for deriving the cost percentages for the six overarching elements
per total expenditures for that platform per year. Calculating CPFH, regardless of ramp-
up or ramp-down, demilitarization, changes in operations tempo, or attrition, is a good
indicator of how the O&S costs behave within the cost element.
𝐶𝐶𝐶𝐶𝐶𝐶𝐶𝐶 𝑃𝑃𝑃𝑃𝑃𝑃 𝐹𝐹𝐹𝐹𝐹𝐹𝐹𝐹𝐹𝐹𝐹𝐹 𝐻𝐻𝐶𝐶𝐻𝐻𝑃𝑃 =𝑌𝑌𝑃𝑃𝑌𝑌𝑃𝑃𝐹𝐹𝐹𝐹 𝐶𝐶𝐶𝐶𝐶𝐶𝐶𝐶 𝐶𝐶𝑜𝑜 𝐴𝐴𝐹𝐹𝑃𝑃𝐴𝐴𝑃𝑃𝑌𝑌𝑜𝑜𝐶𝐶
𝐹𝐹𝑃𝑃𝑌𝑌𝑃𝑃𝐹𝐹𝐹𝐹 𝑜𝑜𝐹𝐹𝐹𝐹𝐹𝐹𝐹𝐹𝐹𝐹 ℎ𝐶𝐶𝐻𝐻𝑃𝑃𝐶𝐶
Prior to calculating the CPFH, it is necessary to normalize costs for inflation. The
Air Force recommends the usage of DoD inflation tables that are issued by the Secretary
of the Air Force Office of Financial Management (SAF/FM) and the Office of
Management and Budget (OMB). The O&S actual costs presented in AFTOC are
42
provided in base-year (BY) and then-year (TY) dollars. The specific database retrieved
from AFTOC is normalized to BY 2016 therefore inflation is already accounted for. This
means, all cost regardless of respective year, is in base year (BY) for 2016.
Research Question and Hypotheses
What are the expected mean/median/quartile ranges of various aircrafts and their
relationship to O&S costs? This is the primary goal of this thesis research. Despite
increased research into O&S costs, the characterization of the cost data varying between
platforms has yet to be examined. The output will portray which cost elements are
costlier for specific platforms and where within the OSD-CAPE CES the cost is incurred.
For example, the mean/median/quartile ranges will be calculated down to element 1.2.1
(Organizational Maintenance) which is a sub element of element 1.2 (Unit Level
Maintenance) under the overarching element 1.0 (Unit Level Manpower). The descriptive
statistics will be broken down by individual platform but also at the category level.
Descriptive Statistics
The formula for mean, which is the average of the variables being collected, used
in this research is the general sum of all variables, ∑𝑥𝑥𝑖𝑖 divided by the total number of
variables that are used for the calculation, 𝐹𝐹.
𝑚𝑚𝑃𝑃𝑌𝑌𝐹𝐹 =∑𝑥𝑥𝑖𝑖𝐹𝐹
After calculating the mean, the median cost is calculated to determine the middle
cost of the data set. The median is calculated by ordering the costs in chronological order
from least to greatest, then determining which cost lies directly in the middle. The median
43
is not exclusively one number at times. When there is an even number of variables in a
set, the median would then be two different, or the same, numbers.
𝑚𝑚𝑃𝑃𝑚𝑚𝐹𝐹𝑌𝑌𝐹𝐹 = {(𝐹𝐹 + 1) ÷ 2}𝐶𝐶ℎ
Next, we determine the interquartile ranges (IQR) within the data set. The
importance of calculating the IQR is to determine the middle 50% of the data while
determining the upper (Q3) and lower (Q1) quartiles to determine the spread of the data
set. This will measure the variability within our data. The calculation of
mean/median/quartile ranges for the data set will help with the overall description of the
data set. The combination of all three helps determine if the mean is representative of the
data, or if not, then the spread of all the costs is too large and this indicates large
differences within the cost data set.
𝐼𝐼𝐼𝐼𝐼𝐼 = 𝐼𝐼3 − 𝐼𝐼1
Compare, contrast, and identify the relationships within the OSD-CAPE Cost
Element Structure across the aircraft categories (bomber, fighter, reconnaissance,
special duty, trainer, transport/tanker and UAV/drone). This will determine the
relationship between the different aircraft categories in relationship to the OSD-CAPE
CES. Provided this information, it helps the decision makers make conscious decisions
regarding the yearly budget and how to best plan for substantial increases/decreases
within the O&S portion of the budgetary process. To ensure that the data is representative
of the categories, we omitted certain actual costs for various reasons due to the
assumption that it is not representative of true population trends. Some of these data may
have logical reasons to why they do not represent the population in which they are
cohorts. Other data points omitted did not have logical reasons to why they were not
44
representative, therefore the omission of these data points will make the findings more
credible. For example, the WC-130H incurred zero cost in element 1.0 Unit Level
Manpower from the years 1996-1998 while incurring the majority of the costs in element
6.0 Indirect Support. This is not aligned with the population trend and allowing these
costs to be remain in the data set would drive down the true representative percentage for
this element. The purpose of this thesis is to educate estimators on the average
expenditures percentages for these six elements for various platforms and categories and
omitting certain data points could best serve this intent. The route of omitting these data
points starts by producing distribution graphs from JPM of each independent element in
reference to the seven categories. The distribution includes Box-and-Whisker Plots that
show the median, upper quartile, the lower quartile, the maximum value excluding
outliers, and the minimum value excluding outliers. The data points outside the maximum
and minimum values are values that are more than a 1.5 multiplier than the upper or low
quartile respectfully. These data points do not represent the population and therefore
skew the descriptive statistics. To ensure accuracy and precision of the results, we omit
these outliers.
Statistical Tests
First, we check if the data set is normally distributed. The JMP Statistical
Software program accomplishes this by outputting a distribution for each independent
category for each respective cost element. If normality is not passed, we treat the data set
in its entirety as not-normal and utilize non-parametric statistical testing to compare the
medians between categories.
45
To limit Type I errors, we are utilizing the Bonferroni Correction normally known
as the Bonferroni Type Adjustment. This is a conservative approach to limiting Type I
errors. A Type I error is the rejection of the null hypothesis in favor of the alternative
hypothesis stating there is a difference between the medians when in truth there is no
statistical difference between the medians. By limiting the probability of committing a
Type I error it adds credibility to the results of the statistical tests that are run in the
analysis. The Bonferroni correction tests each individual hypothesis at a p-value equal to
α, which is the desired p value of .05, divided by the number of hypothesis, which in this
case is 21 individual hypothesis per cost element. Therefore, each individual hypothesis
will be evaluated at 𝑝𝑝 𝑣𝑣𝑌𝑌𝐹𝐹𝐻𝐻𝑃𝑃 ≤ ∝𝑚𝑚
= .0521
= .00238.
To compare the medians within the data set, we utilize the Kruskal-Wallis and
Steel Dwaas tests in JMP. The Kruskal-Wallis test is the appropriate test to use when
comparing two or more groups. It is the non-parametric equivalence to the one-way
analysis of variance (ANOVA) test utilized when the samples are normally distributed.
This test is a rank based nonparametric test that can be used to “determine if there are
statistically significant differences between two or more groups of an independent
variable on a continuous or ordinal dependent variable” (Laerd Statistics, 2017). The
same hypothesis test is used for each categorical comparison. If the p-value > 0.00238 we
fail to reject the null, stating there is no difference between the median ranges of the
categorical variables. However, if the p-value < 0.00238 we reject the null hypothesis and
state that at least one median is statically different from the group.
Kruskal-Wallis Test
HO: Δ1X = ΔY
46
Ha: ΔX ≠ ΔY
The Kruskal-Wallis tests combines all observation for all variables and ranks
them appropriately. Next H is calculated, which is a ratio of the aggregate measure of
group differences over the mean of the sampling distribution (Vassar College, 2017). The
results derive a p-value which is compared to the family-wise error rate (𝛼𝛼𝑒𝑒). If the p-
value is rejected, we complete the Steel Dwaas test, which is the completion of multiple
Mann Whitney tests in JMP, which is a non-parametric test that is used to compare two
sample, or group, medians that come from the same population (Nachar, 2008).
Mann-Whitney Test
𝑈𝑈 = ��𝑍𝑍𝑖𝑖𝑖𝑖
𝑚𝑚
𝑖𝑖=1
𝑛𝑛
𝑖𝑖=1
The Mann Whitney test derives where within the categories the differences lie
within the medians. The Mann Whitney test calculates the test statistic, U. The results of
the Mann Whitney will be compared to the comparison-wise error rate (𝛼𝛼𝑐𝑐). The (𝛼𝛼𝑐𝑐) is
derived by dividing the (𝛼𝛼𝑒𝑒) secondary tests in “accordance with statistical theory on
multiple simultaneous comparisons and error rates known as the Bonferroni Method
(Nachar, 2008). The 𝐹𝐹 and 𝑚𝑚 represent the two-different samples. Again, if the p-value <
0.00238, there is a statistical difference between the two different samples being
compared. The output for the Steel Dwaas test in JMP includes the score mean difference
as well as the p-value for the pair comparisons of 𝐹𝐹 and 𝑚𝑚. The score difference portrays
the strength of the difference while the p-value represents the threshold at which the pair
is either statistically different or statistically the same.
47
What are the potential cost drivers and cost estimating relationships within the
OSD-CAPE Cost Element Structure? This investigation is to determine where within the
cost element structure relationships within cost elements/sub-elements exist. To
determine if these relationships exist, we create a correlation table with all elements/sub-
elements as independent variables. JMP Software allows for the creation of a correlation
table to determine if the continuous variables are related to each other through
multivariate analysis.
Prediction
Taking into account the range of complexity of an aircraft compared to another
we assume that the mean/median/quartile ranges will vary between platforms, some
significantly. However, we assume that variances between platforms should align closely
with each other. Cost drivers are also expected to be unique to the platform/category. For
example, a fighters cost driver may be totally different than a cargo aircrafts cost driver.
The range in designated missions led to this assumption. On a macro level, the
comparison between categories is also expected to result in different characterization of
data and cost drivers.
Conclusion
The data collected is derived from AFTOC. The analysis and tests selected to
normalize, standardize, and characterize the data reflect one approach. We recognize that
other techniques could have been utilized. The decision to normalize to the CPFH is to
maintain a level of homogeneity and is made after discussion with cost estimators in
AFLCMC. Chapter Four will contain the results of the analysis.
48
Chapter IV: Analysis and Results
Chapter Overview
This Chapter is the accumulation of all results of the analysis to portray O&S
costs characteristics of the various categories and platforms that were examined.
Descriptive statistics is utilized to show the percentages incurred by the various elements
in the OSD-CAPE 2014 Cost Element matrix format for various platforms and
categories. The following chapter will include the three research questions and the
analysis and results for each question. The first research question aims to characterize
O&S cost for the seven categories and various platforms. The second research question
utilizes statistical tools and statistical testing to derive if a difference exists between the
different categories in relationship to the OSD-CAPE Cost Element Structure. The third
research question focuses on using a correlation matrix including all the cost
elements/sub-elements to derive which elements are correlated and if relationships exist.
Research Question I
What are the expected mean/median/quartile ranges of various aircrafts and their
relationship to O&S costs? The first set of results is portrayed in Table 4. It depicts the
mean percentages, median, and quartile ranges for the entirety of the aircrafts examined
in this analysis. All the tests are performed and examined in Microsoft Excel and JMP
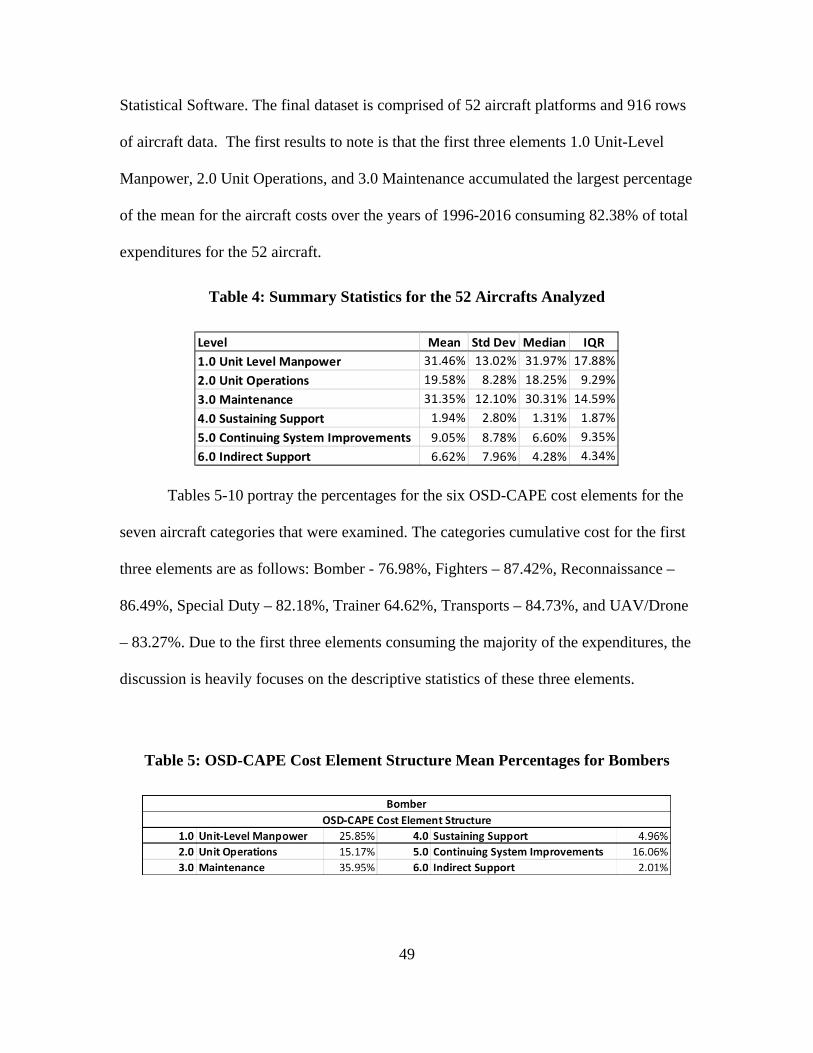
49
Statistical Software. The final dataset is comprised of 52 aircraft platforms and 916 rows
of aircraft data. The first results to note is that the first three elements 1.0 Unit-Level
Manpower, 2.0 Unit Operations, and 3.0 Maintenance accumulated the largest percentage
of the mean for the aircraft costs over the years of 1996-2016 consuming 82.38% of total
expenditures for the 52 aircraft.
Table 4: Summary Statistics for the 52 Aircrafts Analyzed
Tables 5-10 portray the percentages for the six OSD-CAPE cost elements for the
seven aircraft categories that were examined. The categories cumulative cost for the first
three elements are as follows: Bomber - 76.98%, Fighters – 87.42%, Reconnaissance –
86.49%, Special Duty – 82.18%, Trainer 64.62%, Transports – 84.73%, and UAV/Drone
– 83.27%. Due to the first three elements consuming the majority of the expenditures, the
discussion is heavily focuses on the descriptive statistics of these three elements.
Table 5: OSD-CAPE Cost Element Structure Mean Percentages for Bombers
Level Mean Std Dev Median IQR1.0 Unit Level Manpower 31.46% 13.02% 31.97% 17.88%2.0 Unit Operations 19.58% 8.28% 18.25% 9.29%3.0 Maintenance 31.35% 12.10% 30.31% 14.59%4.0 Sustaining Support 1.94% 2.80% 1.31% 1.87%5.0 Continuing System Improvements 9.05% 8.78% 6.60% 9.35%6.0 Indirect Support 6.62% 7.96% 4.28% 4.34%
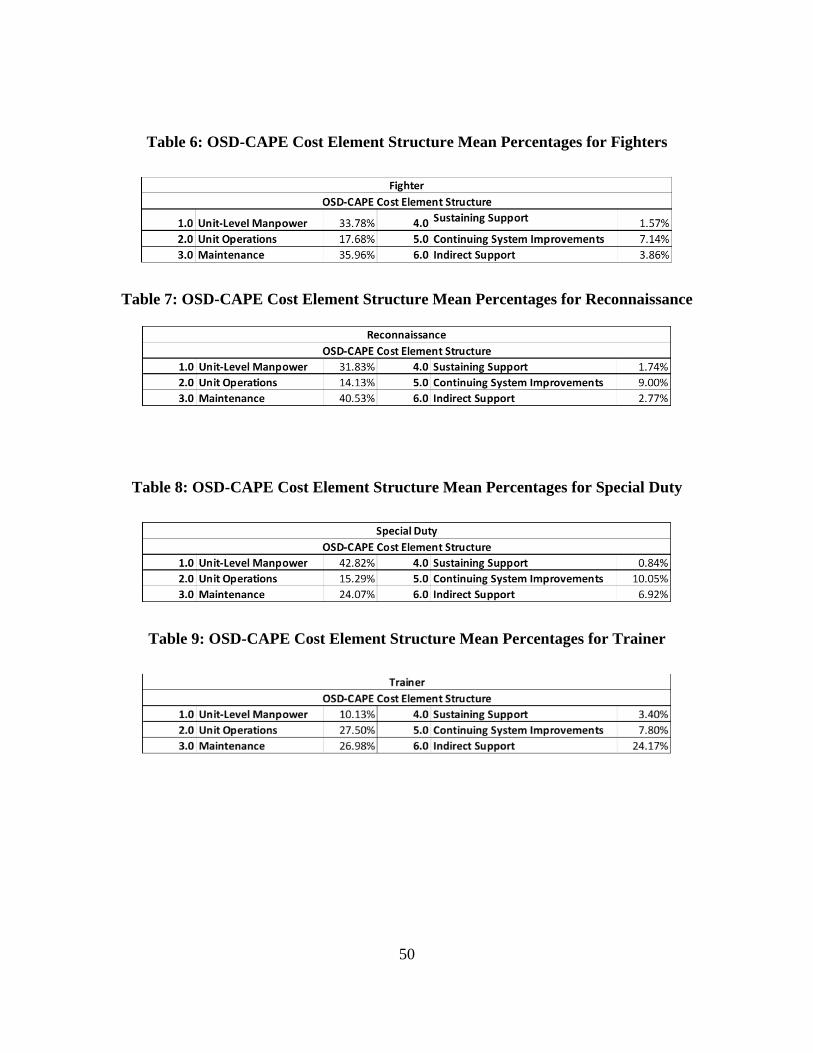
50
Table 6: OSD-CAPE Cost Element Structure Mean Percentages for Fighters
Table 7: OSD-CAPE Cost Element Structure Mean Percentages for Reconnaissance
Table 8: OSD-CAPE Cost Element Structure Mean Percentages for Special Duty
Table 9: OSD-CAPE Cost Element Structure Mean Percentages for Trainer
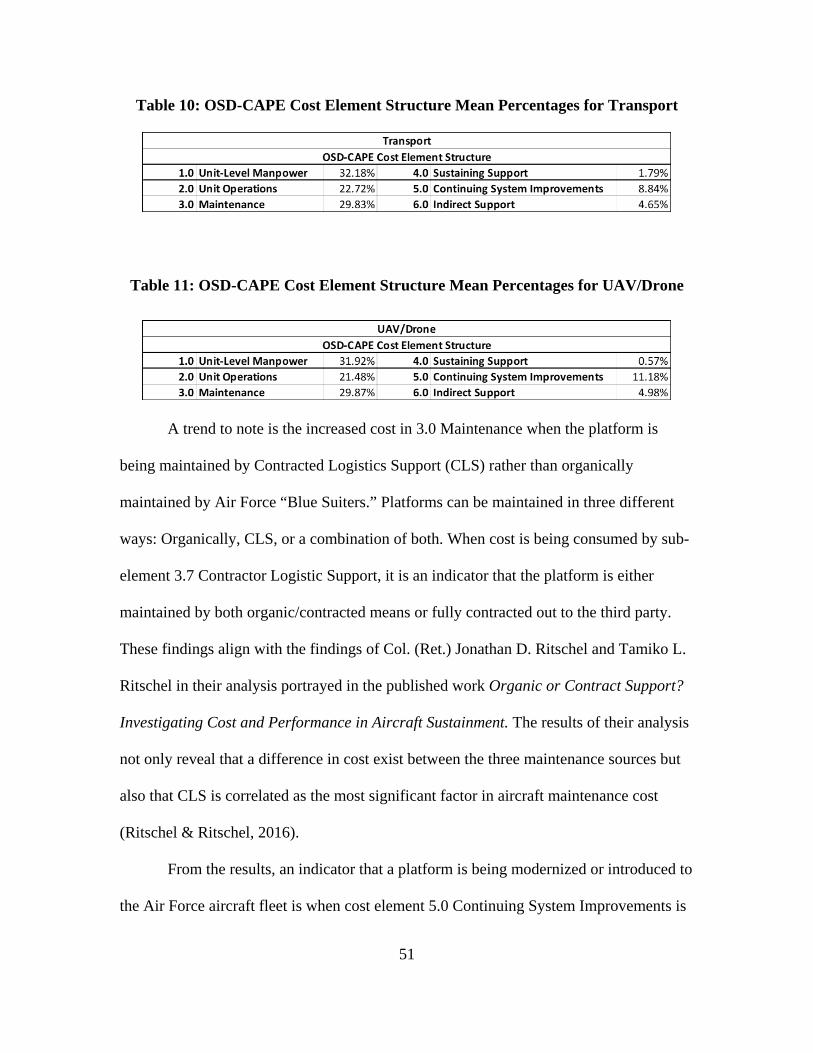
51
Table 10: OSD-CAPE Cost Element Structure Mean Percentages for Transport
Table 11: OSD-CAPE Cost Element Structure Mean Percentages for UAV/Drone
A trend to note is the increased cost in 3.0 Maintenance when the platform is
being maintained by Contracted Logistics Support (CLS) rather than organically
maintained by Air Force “Blue Suiters.” Platforms can be maintained in three different
ways: Organically, CLS, or a combination of both. When cost is being consumed by sub-
element 3.7 Contractor Logistic Support, it is an indicator that the platform is either
maintained by both organic/contracted means or fully contracted out to the third party.
These findings align with the findings of Col. (Ret.) Jonathan D. Ritschel and Tamiko L.
Ritschel in their analysis portrayed in the published work Organic or Contract Support?
Investigating Cost and Performance in Aircraft Sustainment. The results of their analysis
not only reveal that a difference in cost exist between the three maintenance sources but
also that CLS is correlated as the most significant factor in aircraft maintenance cost
(Ritschel & Ritschel, 2016).
From the results, an indicator that a platform is being modernized or introduced to
the Air Force aircraft fleet is when cost element 5.0 Continuing System Improvements is
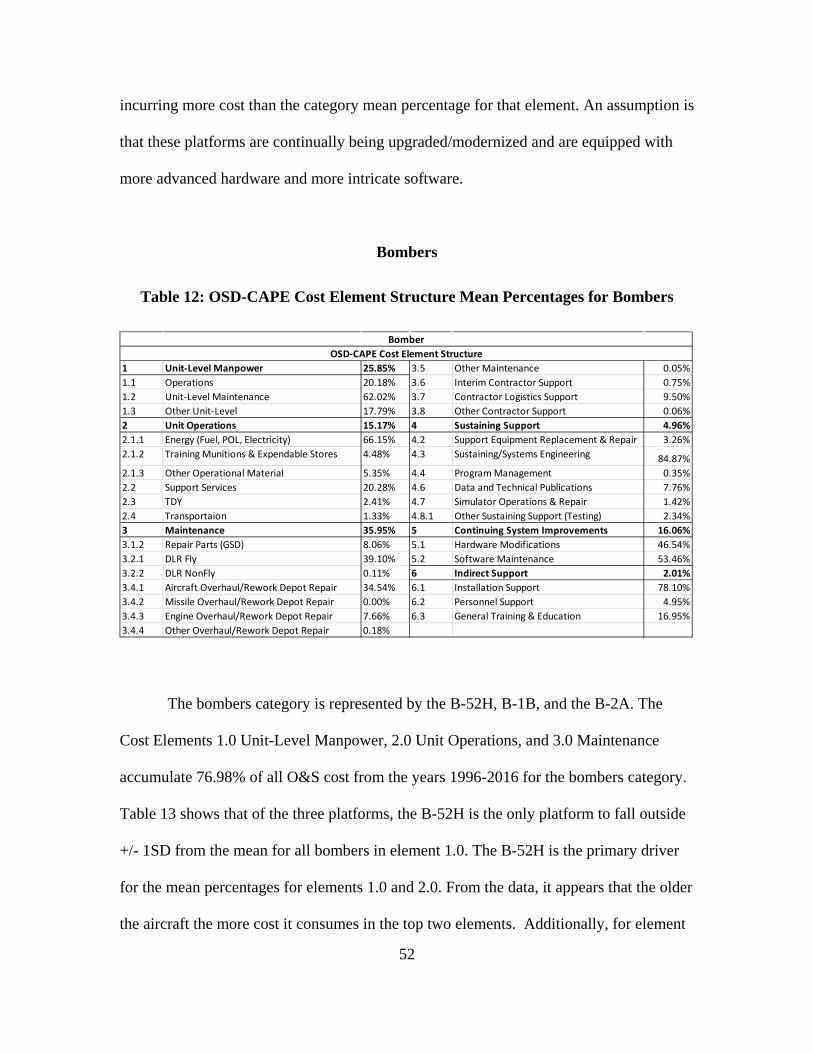
52
incurring more cost than the category mean percentage for that element. An assumption is
that these platforms are continually being upgraded/modernized and are equipped with
more advanced hardware and more intricate software.
Bombers
Table 12: OSD-CAPE Cost Element Structure Mean Percentages for Bombers
The bombers category is represented by the B-52H, B-1B, and the B-2A. The
Cost Elements 1.0 Unit-Level Manpower, 2.0 Unit Operations, and 3.0 Maintenance
accumulate 76.98% of all O&S cost from the years 1996-2016 for the bombers category.
Table 13 shows that of the three platforms, the B-52H is the only platform to fall outside
+/- 1SD from the mean for all bombers in element 1.0. The B-52H is the primary driver
for the mean percentages for elements 1.0 and 2.0. From the data, it appears that the older
the aircraft the more cost it consumes in the top two elements. Additionally, for element
1 Unit-Level Manpower 25.85% 3.5 Other Maintenance 0.05%1.1 Operations 20.18% 3.6 Interim Contractor Support 0.75%1.2 Unit-Level Maintenance 62.02% 3.7 Contractor Logistics Support 9.50%1.3 Other Unit-Level 17.79% 3.8 Other Contractor Support 0.06%2 Unit Operations 15.17% 4 Sustaining Support 4.96%2.1.1 Energy (Fuel, POL, Electricity) 66.15% 4.2 Support Equipment Replacement & Repair 3.26%2.1.2 Training Munitions & Expendable Stores 4.48% 4.3 Sustaining/Systems Engineering 84.87%2.1.3 Other Operational Material 5.35% 4.4 Program Management 0.35%2.2 Support Services 20.28% 4.6 Data and Technical Publications 7.76%2.3 TDY 2.41% 4.7 Simulator Operations & Repair 1.42%2.4 Transportaion 1.33% 4.8.1 Other Sustaining Support (Testing) 2.34%3 Maintenance 35.95% 5 Continuing System Improvements 16.06%3.1.2 Repair Parts (GSD) 8.06% 5.1 Hardware Modifications 46.54%3.2.1 DLR Fly 39.10% 5.2 Software Maintenance 53.46%3.2.2 DLR NonFly 0.11% 6 Indirect Support 2.01%3.4.1 Aircraft Overhaul/Rework Depot Repair 34.54% 6.1 Installation Support 78.10%3.4.2 Missile Overhaul/Rework Depot Repair 0.00% 6.2 Personnel Support 4.95%3.4.3 Engine Overhaul/Rework Depot Repair 7.66% 6.3 General Training & Education 16.95%3.4.4 Other Overhaul/Rework Depot Repair 0.18%
OSD-CAPE Cost Element StructureBomber
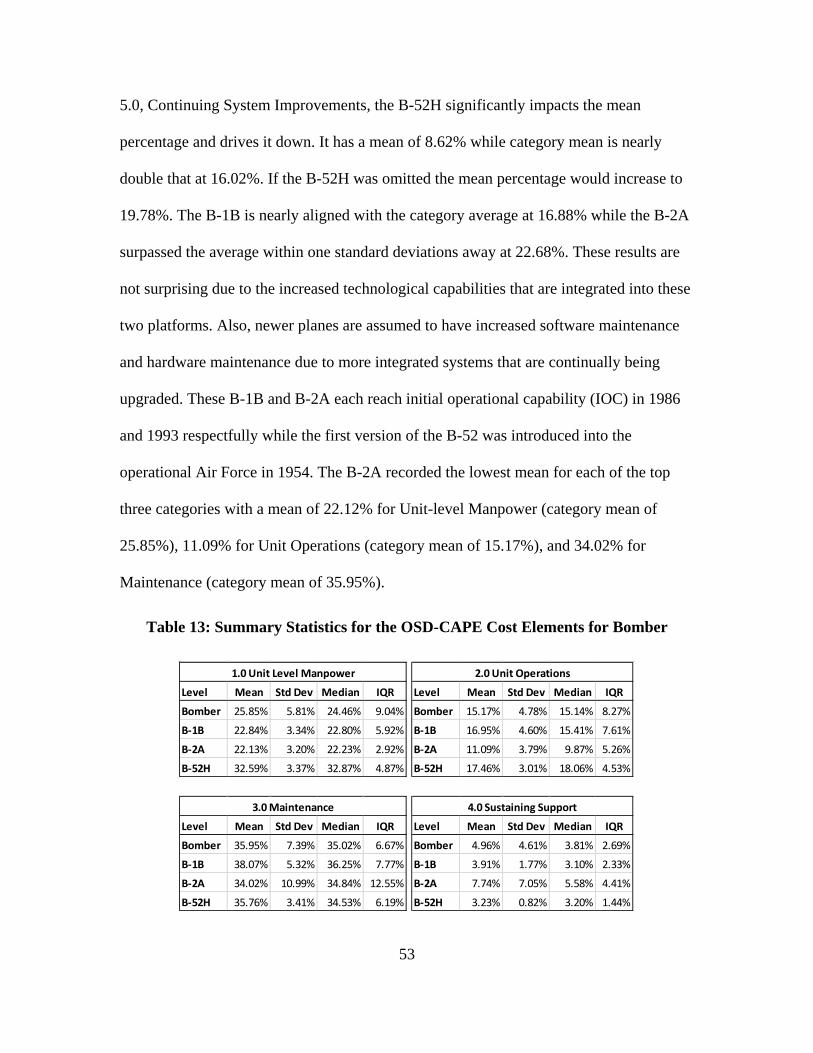
53
5.0, Continuing System Improvements, the B-52H significantly impacts the mean
percentage and drives it down. It has a mean of 8.62% while category mean is nearly
double that at 16.02%. If the B-52H was omitted the mean percentage would increase to
19.78%. The B-1B is nearly aligned with the category average at 16.88% while the B-2A
surpassed the average within one standard deviations away at 22.68%. These results are
not surprising due to the increased technological capabilities that are integrated into these
two platforms. Also, newer planes are assumed to have increased software maintenance
and hardware maintenance due to more integrated systems that are continually being
upgraded. These B-1B and B-2A each reach initial operational capability (IOC) in 1986
and 1993 respectfully while the first version of the B-52 was introduced into the
operational Air Force in 1954. The B-2A recorded the lowest mean for each of the top
three categories with a mean of 22.12% for Unit-level Manpower (category mean of
25.85%), 11.09% for Unit Operations (category mean of 15.17%), and 34.02% for
Maintenance (category mean of 35.95%).
Table 13: Summary Statistics for the OSD-CAPE Cost Elements for Bomber
Level Mean Std Dev Median IQR
Bomber 25.85% 5.81% 24.46% 9.04%
B-1B 22.84% 3.34% 22.80% 5.92%
B-2A 22.13% 3.20% 22.23% 2.92%
B-52H 32.59% 3.37% 32.87% 4.87%
1.0 Unit Level Manpower
Level Mean Std Dev Median IQR
Bomber 15.17% 4.78% 15.14% 8.27%
B-1B 16.95% 4.60% 15.41% 7.61%
B-2A 11.09% 3.79% 9.87% 5.26%
B-52H 17.46% 3.01% 18.06% 4.53%
2.0 Unit Operations
Level Mean Std Dev Median IQR
Bomber 35.95% 7.39% 35.02% 6.67%
B-1B 38.07% 5.32% 36.25% 7.77%
B-2A 34.02% 10.99% 34.84% 12.55%
B-52H 35.76% 3.41% 34.53% 6.19%
3.0 Maintenance
Level Mean Std Dev Median IQR
Bomber 4.96% 4.61% 3.81% 2.69%
B-1B 3.91% 1.77% 3.10% 2.33%
B-2A 7.74% 7.05% 5.58% 4.41%
B-52H 3.23% 0.82% 3.20% 1.44%
4.0 Sustaining Support
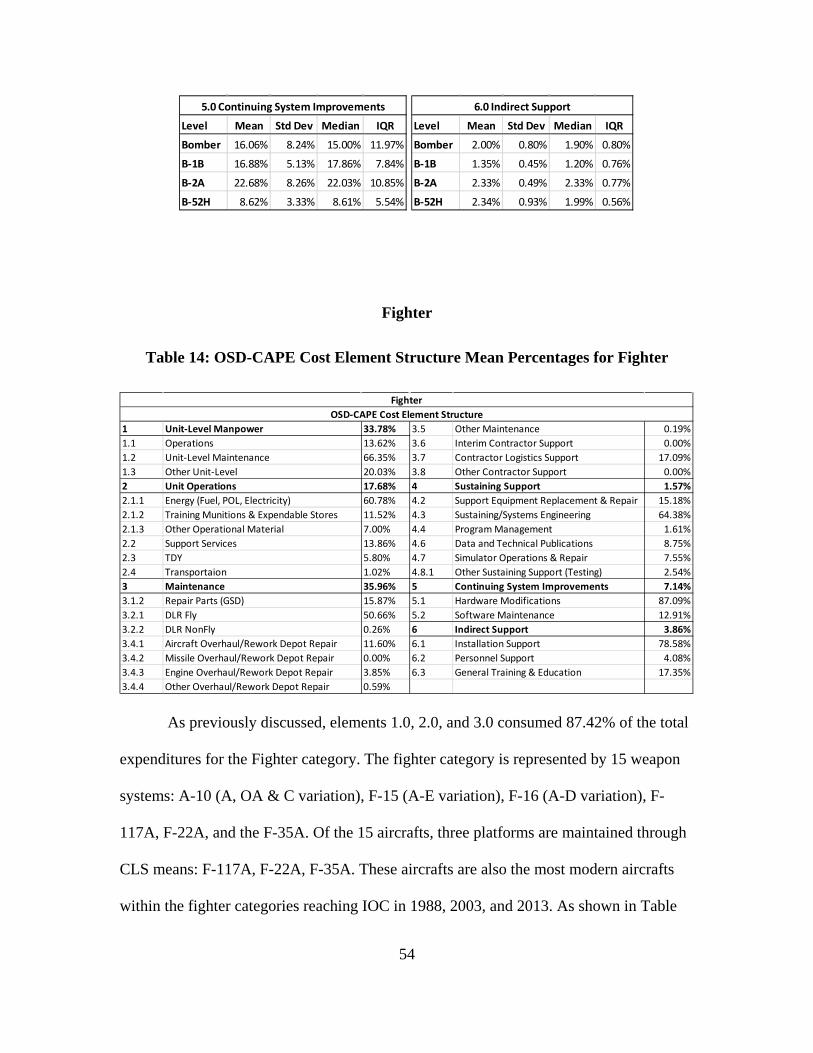
54
Fighter
Table 14: OSD-CAPE Cost Element Structure Mean Percentages for Fighter
As previously discussed, elements 1.0, 2.0, and 3.0 consumed 87.42% of the total
expenditures for the Fighter category. The fighter category is represented by 15 weapon
systems: A-10 (A, OA & C variation), F-15 (A-E variation), F-16 (A-D variation), F-
117A, F-22A, and the F-35A. Of the 15 aircrafts, three platforms are maintained through
CLS means: F-117A, F-22A, F-35A. These aircrafts are also the most modern aircrafts
within the fighter categories reaching IOC in 1988, 2003, and 2013. As shown in Table
Level Mean Std Dev Median IQR
Bomber 16.06% 8.24% 15.00% 11.97%
B-1B 16.88% 5.13% 17.86% 7.84%
B-2A 22.68% 8.26% 22.03% 10.85%
B-52H 8.62% 3.33% 8.61% 5.54%
5.0 Continuing System Improvements
Level Mean Std Dev Median IQR
Bomber 2.00% 0.80% 1.90% 0.80%
B-1B 1.35% 0.45% 1.20% 0.76%
B-2A 2.33% 0.49% 2.33% 0.77%
B-52H 2.34% 0.93% 1.99% 0.56%
6.0 Indirect Support
1 Unit-Level Manpower 33.78% 3.5 Other Maintenance 0.19%1.1 Operations 13.62% 3.6 Interim Contractor Support 0.00%1.2 Unit-Level Maintenance 66.35% 3.7 Contractor Logistics Support 17.09%1.3 Other Unit-Level 20.03% 3.8 Other Contractor Support 0.00%2 Unit Operations 17.68% 4 Sustaining Support 1.57%2.1.1 Energy (Fuel, POL, Electricity) 60.78% 4.2 Support Equipment Replacement & Repair 15.18%2.1.2 Training Munitions & Expendable Stores 11.52% 4.3 Sustaining/Systems Engineering 64.38%2.1.3 Other Operational Material 7.00% 4.4 Program Management 1.61%2.2 Support Services 13.86% 4.6 Data and Technical Publications 8.75%2.3 TDY 5.80% 4.7 Simulator Operations & Repair 7.55%2.4 Transportaion 1.02% 4.8.1 Other Sustaining Support (Testing) 2.54%3 Maintenance 35.96% 5 Continuing System Improvements 7.14%3.1.2 Repair Parts (GSD) 15.87% 5.1 Hardware Modifications 87.09%3.2.1 DLR Fly 50.66% 5.2 Software Maintenance 12.91%3.2.2 DLR NonFly 0.26% 6 Indirect Support 3.86%3.4.1 Aircraft Overhaul/Rework Depot Repair 11.60% 6.1 Installation Support 78.58%3.4.2 Missile Overhaul/Rework Depot Repair 0.00% 6.2 Personnel Support 4.08%3.4.3 Engine Overhaul/Rework Depot Repair 3.85% 6.3 General Training & Education 17.35%3.4.4 Other Overhaul/Rework Depot Repair 0.59%
FighterOSD-CAPE Cost Element Structure
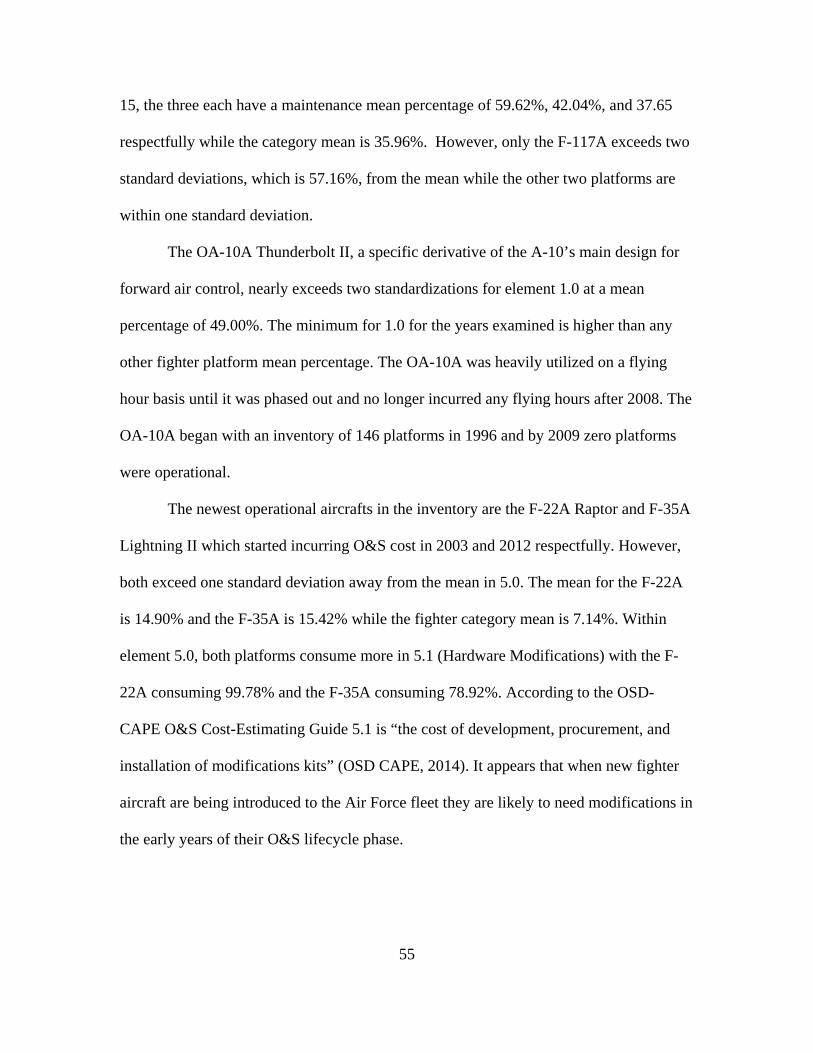
55
15, the three each have a maintenance mean percentage of 59.62%, 42.04%, and 37.65
respectfully while the category mean is 35.96%. However, only the F-117A exceeds two
standard deviations, which is 57.16%, from the mean while the other two platforms are
within one standard deviation.
The OA-10A Thunderbolt II, a specific derivative of the A-10’s main design for
forward air control, nearly exceeds two standardizations for element 1.0 at a mean
percentage of 49.00%. The minimum for 1.0 for the years examined is higher than any
other fighter platform mean percentage. The OA-10A was heavily utilized on a flying
hour basis until it was phased out and no longer incurred any flying hours after 2008. The
OA-10A began with an inventory of 146 platforms in 1996 and by 2009 zero platforms
were operational.
The newest operational aircrafts in the inventory are the F-22A Raptor and F-35A
Lightning II which started incurring O&S cost in 2003 and 2012 respectfully. However,
both exceed one standard deviation away from the mean in 5.0. The mean for the F-22A
is 14.90% and the F-35A is 15.42% while the fighter category mean is 7.14%. Within
element 5.0, both platforms consume more in 5.1 (Hardware Modifications) with the F-
22A consuming 99.78% and the F-35A consuming 78.92%. According to the OSD-
CAPE O&S Cost-Estimating Guide 5.1 is “the cost of development, procurement, and
installation of modifications kits” (OSD CAPE, 2014). It appears that when new fighter
aircraft are being introduced to the Air Force fleet they are likely to need modifications in
the early years of their O&S lifecycle phase.
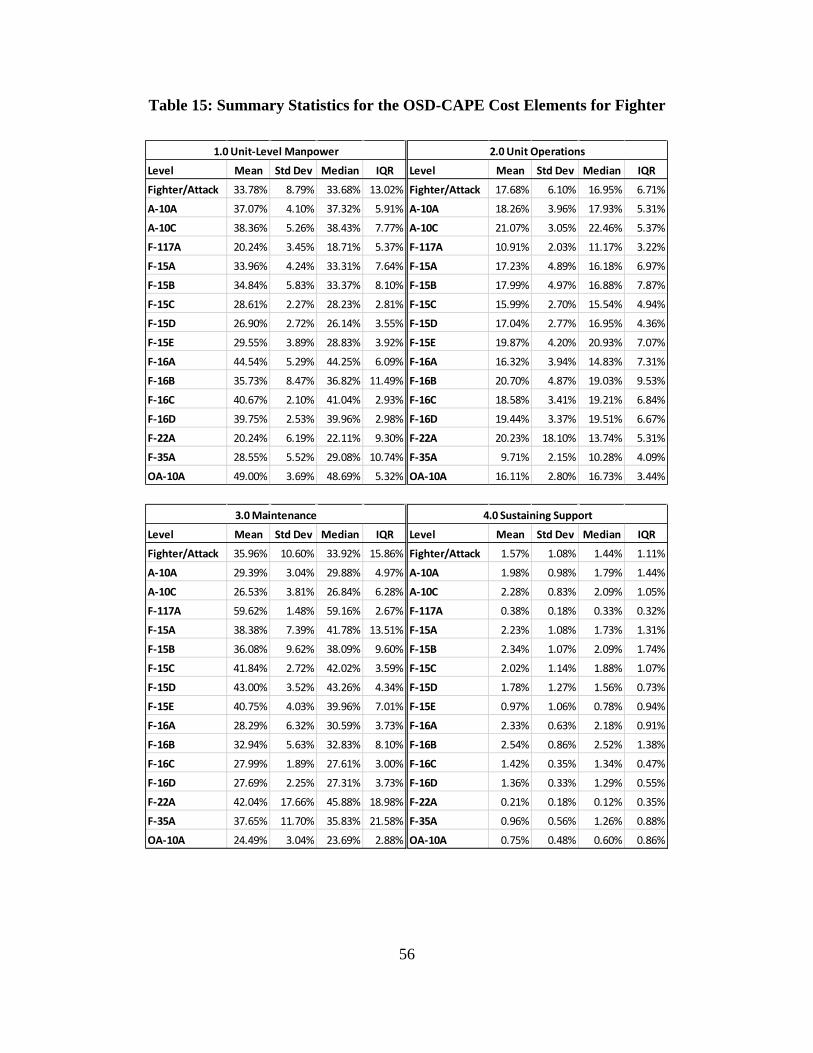
56
Table 15: Summary Statistics for the OSD-CAPE Cost Elements for Fighter
Level Mean Std Dev Median IQR
Fighter/Attack 33.78% 8.79% 33.68% 13.02%
A-10A 37.07% 4.10% 37.32% 5.91%
A-10C 38.36% 5.26% 38.43% 7.77%
F-117A 20.24% 3.45% 18.71% 5.37%
F-15A 33.96% 4.24% 33.31% 7.64%
F-15B 34.84% 5.83% 33.37% 8.10%
F-15C 28.61% 2.27% 28.23% 2.81%
F-15D 26.90% 2.72% 26.14% 3.55%
F-15E 29.55% 3.89% 28.83% 3.92%
F-16A 44.54% 5.29% 44.25% 6.09%
F-16B 35.73% 8.47% 36.82% 11.49%
F-16C 40.67% 2.10% 41.04% 2.93%
F-16D 39.75% 2.53% 39.96% 2.98%
F-22A 20.24% 6.19% 22.11% 9.30%
F-35A 28.55% 5.52% 29.08% 10.74%
OA-10A 49.00% 3.69% 48.69% 5.32%
1.0 Unit-Level Manpower
Level Mean Std Dev Median IQR
Fighter/Attack 17.68% 6.10% 16.95% 6.71%
A-10A 18.26% 3.96% 17.93% 5.31%
A-10C 21.07% 3.05% 22.46% 5.37%
F-117A 10.91% 2.03% 11.17% 3.22%
F-15A 17.23% 4.89% 16.18% 6.97%
F-15B 17.99% 4.97% 16.88% 7.87%
F-15C 15.99% 2.70% 15.54% 4.94%
F-15D 17.04% 2.77% 16.95% 4.36%
F-15E 19.87% 4.20% 20.93% 7.07%
F-16A 16.32% 3.94% 14.83% 7.31%
F-16B 20.70% 4.87% 19.03% 9.53%
F-16C 18.58% 3.41% 19.21% 6.84%
F-16D 19.44% 3.37% 19.51% 6.67%
F-22A 20.23% 18.10% 13.74% 5.31%
F-35A 9.71% 2.15% 10.28% 4.09%
OA-10A 16.11% 2.80% 16.73% 3.44%
2.0 Unit Operations
Level Mean Std Dev Median IQR
Fighter/Attack 35.96% 10.60% 33.92% 15.86%
A-10A 29.39% 3.04% 29.88% 4.97%
A-10C 26.53% 3.81% 26.84% 6.28%
F-117A 59.62% 1.48% 59.16% 2.67%
F-15A 38.38% 7.39% 41.78% 13.51%
F-15B 36.08% 9.62% 38.09% 9.60%
F-15C 41.84% 2.72% 42.02% 3.59%
F-15D 43.00% 3.52% 43.26% 4.34%
F-15E 40.75% 4.03% 39.96% 7.01%
F-16A 28.29% 6.32% 30.59% 3.73%
F-16B 32.94% 5.63% 32.83% 8.10%
F-16C 27.99% 1.89% 27.61% 3.00%
F-16D 27.69% 2.25% 27.31% 3.73%
F-22A 42.04% 17.66% 45.88% 18.98%
F-35A 37.65% 11.70% 35.83% 21.58%
OA-10A 24.49% 3.04% 23.69% 2.88%
3.0 Maintenance
Level Mean Std Dev Median IQR
Fighter/Attack 1.57% 1.08% 1.44% 1.11%
A-10A 1.98% 0.98% 1.79% 1.44%
A-10C 2.28% 0.83% 2.09% 1.05%
F-117A 0.38% 0.18% 0.33% 0.32%
F-15A 2.23% 1.08% 1.73% 1.31%
F-15B 2.34% 1.07% 2.09% 1.74%
F-15C 2.02% 1.14% 1.88% 1.07%
F-15D 1.78% 1.27% 1.56% 0.73%
F-15E 0.97% 1.06% 0.78% 0.94%
F-16A 2.33% 0.63% 2.18% 0.91%
F-16B 2.54% 0.86% 2.52% 1.38%
F-16C 1.42% 0.35% 1.34% 0.47%
F-16D 1.36% 0.33% 1.29% 0.55%
F-22A 0.21% 0.18% 0.12% 0.35%
F-35A 0.96% 0.56% 1.26% 0.88%
OA-10A 0.75% 0.48% 0.60% 0.86%
4.0 Sustaining Support
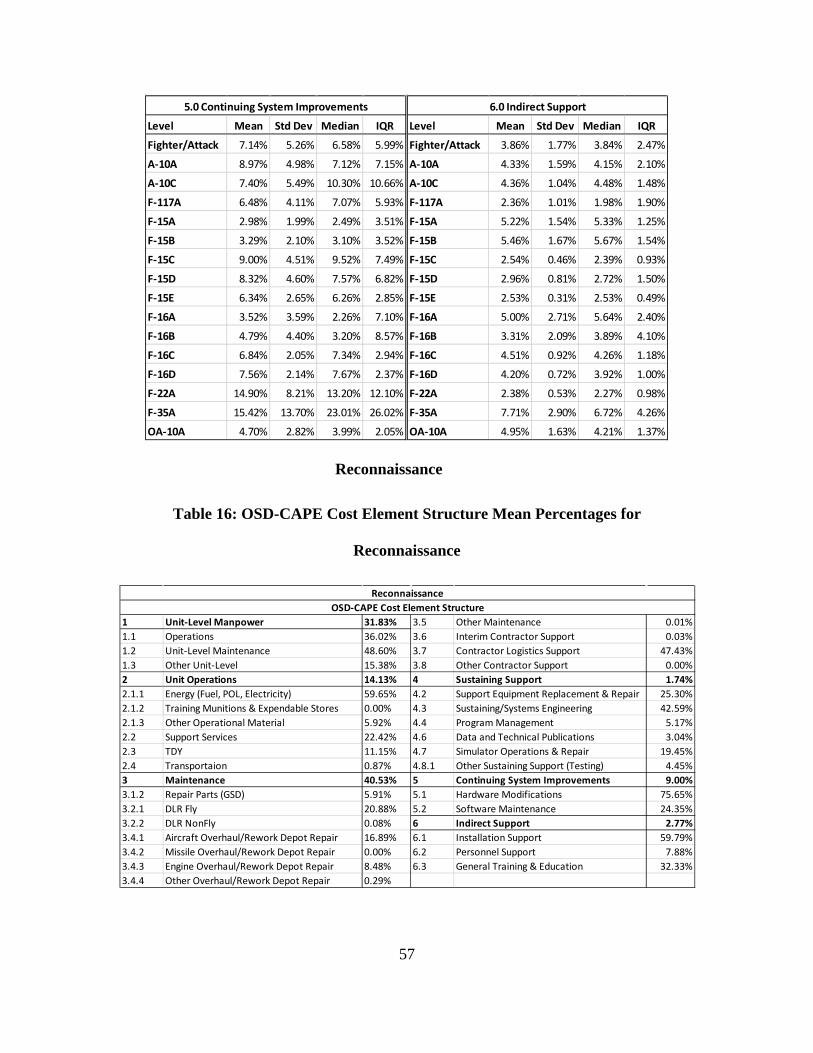
57
Reconnaissance
Table 16: OSD-CAPE Cost Element Structure Mean Percentages for
Reconnaissance
Level Mean Std Dev Median IQR
Fighter/Attack 7.14% 5.26% 6.58% 5.99%
A-10A 8.97% 4.98% 7.12% 7.15%
A-10C 7.40% 5.49% 10.30% 10.66%
F-117A 6.48% 4.11% 7.07% 5.93%
F-15A 2.98% 1.99% 2.49% 3.51%
F-15B 3.29% 2.10% 3.10% 3.52%
F-15C 9.00% 4.51% 9.52% 7.49%
F-15D 8.32% 4.60% 7.57% 6.82%
F-15E 6.34% 2.65% 6.26% 2.85%
F-16A 3.52% 3.59% 2.26% 7.10%
F-16B 4.79% 4.40% 3.20% 8.57%
F-16C 6.84% 2.05% 7.34% 2.94%
F-16D 7.56% 2.14% 7.67% 2.37%
F-22A 14.90% 8.21% 13.20% 12.10%
F-35A 15.42% 13.70% 23.01% 26.02%
OA-10A 4.70% 2.82% 3.99% 2.05%
5.0 Continuing System Improvements
Level Mean Std Dev Median IQR
Fighter/Attack 3.86% 1.77% 3.84% 2.47%
A-10A 4.33% 1.59% 4.15% 2.10%
A-10C 4.36% 1.04% 4.48% 1.48%
F-117A 2.36% 1.01% 1.98% 1.90%
F-15A 5.22% 1.54% 5.33% 1.25%
F-15B 5.46% 1.67% 5.67% 1.54%
F-15C 2.54% 0.46% 2.39% 0.93%
F-15D 2.96% 0.81% 2.72% 1.50%
F-15E 2.53% 0.31% 2.53% 0.49%
F-16A 5.00% 2.71% 5.64% 2.40%
F-16B 3.31% 2.09% 3.89% 4.10%
F-16C 4.51% 0.92% 4.26% 1.18%
F-16D 4.20% 0.72% 3.92% 1.00%
F-22A 2.38% 0.53% 2.27% 0.98%
F-35A 7.71% 2.90% 6.72% 4.26%
OA-10A 4.95% 1.63% 4.21% 1.37%
6.0 Indirect Support
1 Unit-Level Manpower 31.83% 3.5 Other Maintenance 0.01%1.1 Operations 36.02% 3.6 Interim Contractor Support 0.03%1.2 Unit-Level Maintenance 48.60% 3.7 Contractor Logistics Support 47.43%1.3 Other Unit-Level 15.38% 3.8 Other Contractor Support 0.00%2 Unit Operations 14.13% 4 Sustaining Support 1.74%2.1.1 Energy (Fuel, POL, Electricity) 59.65% 4.2 Support Equipment Replacement & Repair 25.30%2.1.2 Training Munitions & Expendable Stores 0.00% 4.3 Sustaining/Systems Engineering 42.59%2.1.3 Other Operational Material 5.92% 4.4 Program Management 5.17%2.2 Support Services 22.42% 4.6 Data and Technical Publications 3.04%2.3 TDY 11.15% 4.7 Simulator Operations & Repair 19.45%2.4 Transportaion 0.87% 4.8.1 Other Sustaining Support (Testing) 4.45%3 Maintenance 40.53% 5 Continuing System Improvements 9.00%3.1.2 Repair Parts (GSD) 5.91% 5.1 Hardware Modifications 75.65%3.2.1 DLR Fly 20.88% 5.2 Software Maintenance 24.35%3.2.2 DLR NonFly 0.08% 6 Indirect Support 2.77%3.4.1 Aircraft Overhaul/Rework Depot Repair 16.89% 6.1 Installation Support 59.79%3.4.2 Missile Overhaul/Rework Depot Repair 0.00% 6.2 Personnel Support 7.88%3.4.3 Engine Overhaul/Rework Depot Repair 8.48% 6.3 General Training & Education 32.33%3.4.4 Other Overhaul/Rework Depot Repair 0.29%
OSD-CAPE Cost Element StructureReconnaissance
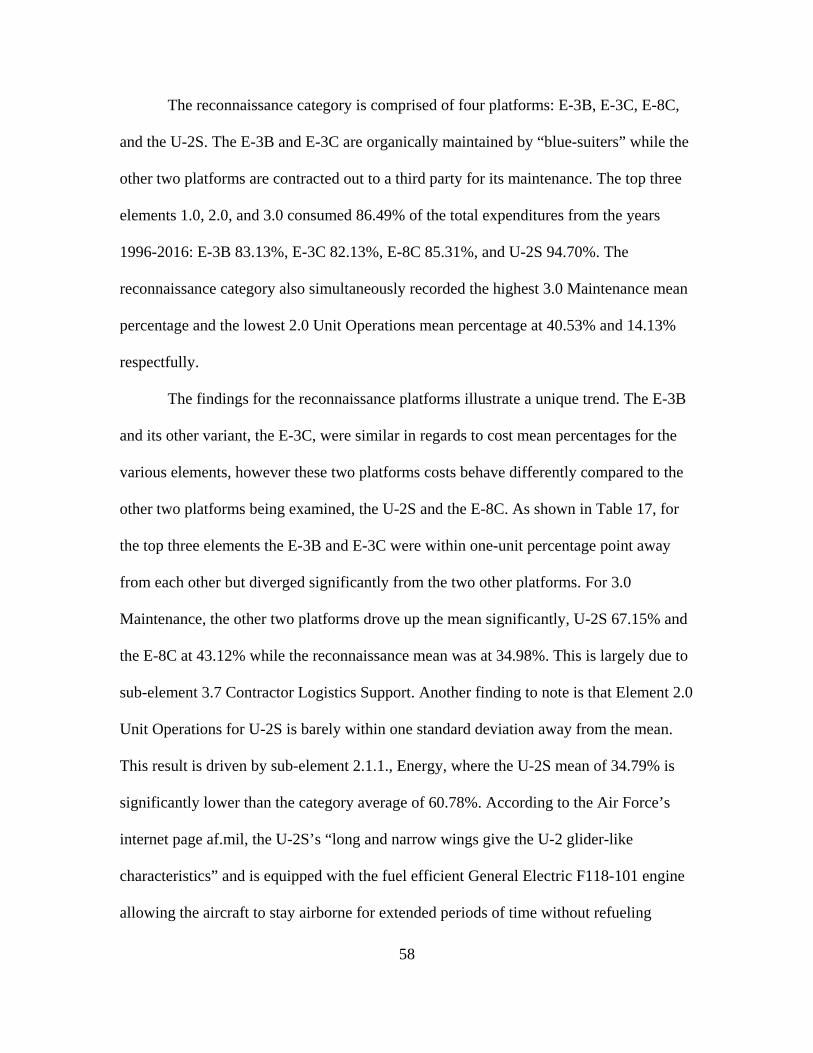
58
The reconnaissance category is comprised of four platforms: E-3B, E-3C, E-8C,
and the U-2S. The E-3B and E-3C are organically maintained by “blue-suiters” while the
other two platforms are contracted out to a third party for its maintenance. The top three
elements 1.0, 2.0, and 3.0 consumed 86.49% of the total expenditures from the years
1996-2016: E-3B 83.13%, E-3C 82.13%, E-8C 85.31%, and U-2S 94.70%. The
reconnaissance category also simultaneously recorded the highest 3.0 Maintenance mean
percentage and the lowest 2.0 Unit Operations mean percentage at 40.53% and 14.13%
respectfully.
The findings for the reconnaissance platforms illustrate a unique trend. The E-3B
and its other variant, the E-3C, were similar in regards to cost mean percentages for the
various elements, however these two platforms costs behave differently compared to the
other two platforms being examined, the U-2S and the E-8C. As shown in Table 17, for
the top three elements the E-3B and E-3C were within one-unit percentage point away
from each other but diverged significantly from the two other platforms. For 3.0
Maintenance, the other two platforms drove up the mean significantly, U-2S 67.15% and
the E-8C at 43.12% while the reconnaissance mean was at 34.98%. This is largely due to
sub-element 3.7 Contractor Logistics Support. Another finding to note is that Element 2.0
Unit Operations for U-2S is barely within one standard deviation away from the mean.
This result is driven by sub-element 2.1.1., Energy, where the U-2S mean of 34.79% is
significantly lower than the category average of 60.78%. According to the Air Force’s
internet page af.mil, the U-2S’s “long and narrow wings give the U-2 glider-like
characteristics” and is equipped with the fuel efficient General Electric F118-101 engine
allowing the aircraft to stay airborne for extended periods of time without refueling
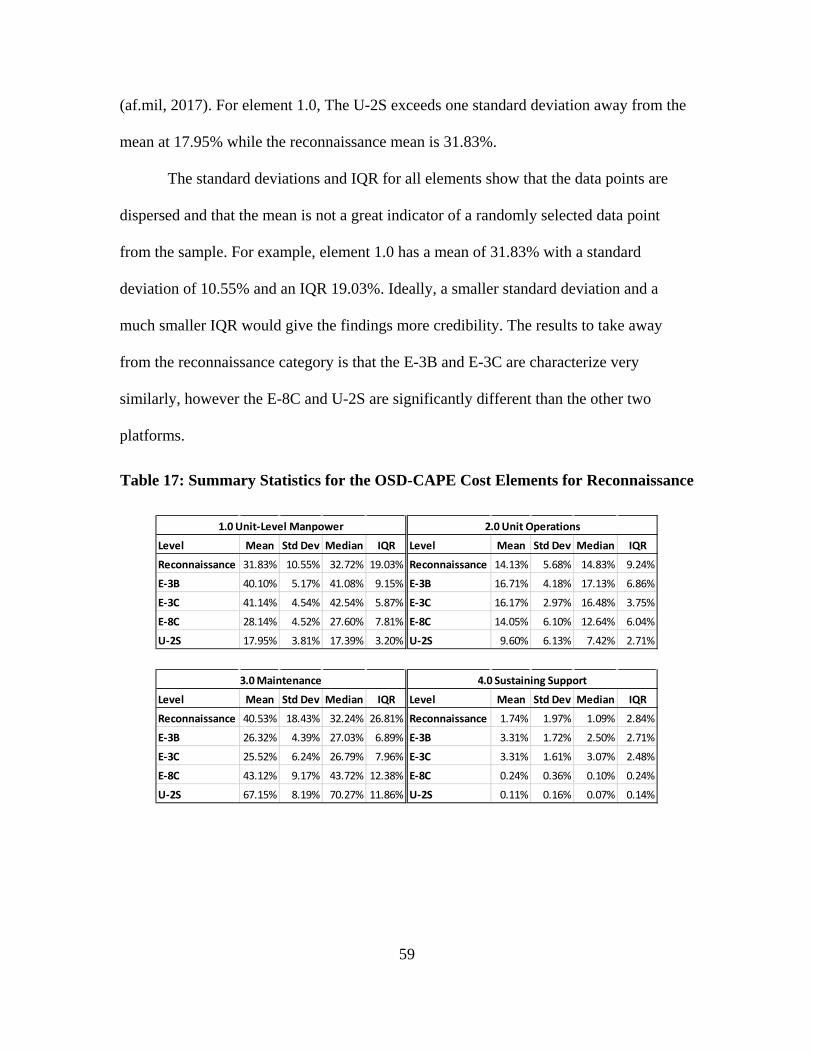
59
(af.mil, 2017). For element 1.0, The U-2S exceeds one standard deviation away from the
mean at 17.95% while the reconnaissance mean is 31.83%.
The standard deviations and IQR for all elements show that the data points are
dispersed and that the mean is not a great indicator of a randomly selected data point
from the sample. For example, element 1.0 has a mean of 31.83% with a standard
deviation of 10.55% and an IQR 19.03%. Ideally, a smaller standard deviation and a
much smaller IQR would give the findings more credibility. The results to take away
from the reconnaissance category is that the E-3B and E-3C are characterize very
similarly, however the E-8C and U-2S are significantly different than the other two
platforms.
Table 17: Summary Statistics for the OSD-CAPE Cost Elements for Reconnaissance
Level Mean Std Dev Median IQR
Reconnaissance 31.83% 10.55% 32.72% 19.03%
E-3B 40.10% 5.17% 41.08% 9.15%
E-3C 41.14% 4.54% 42.54% 5.87%
E-8C 28.14% 4.52% 27.60% 7.81%
U-2S 17.95% 3.81% 17.39% 3.20%
1.0 Unit-Level Manpower
Level Mean Std Dev Median IQR
Reconnaissance 14.13% 5.68% 14.83% 9.24%
E-3B 16.71% 4.18% 17.13% 6.86%
E-3C 16.17% 2.97% 16.48% 3.75%
E-8C 14.05% 6.10% 12.64% 6.04%
U-2S 9.60% 6.13% 7.42% 2.71%
2.0 Unit Operations
Level Mean Std Dev Median IQR
Reconnaissance 40.53% 18.43% 32.24% 26.81%
E-3B 26.32% 4.39% 27.03% 6.89%
E-3C 25.52% 6.24% 26.79% 7.96%
E-8C 43.12% 9.17% 43.72% 12.38%
U-2S 67.15% 8.19% 70.27% 11.86%
3.0 Maintenance
Level Mean Std Dev Median IQR
Reconnaissance 1.74% 1.97% 1.09% 2.84%
E-3B 3.31% 1.72% 2.50% 2.71%
E-3C 3.31% 1.61% 3.07% 2.48%
E-8C 0.24% 0.36% 0.10% 0.24%
U-2S 0.11% 0.16% 0.07% 0.14%
4.0 Sustaining Support
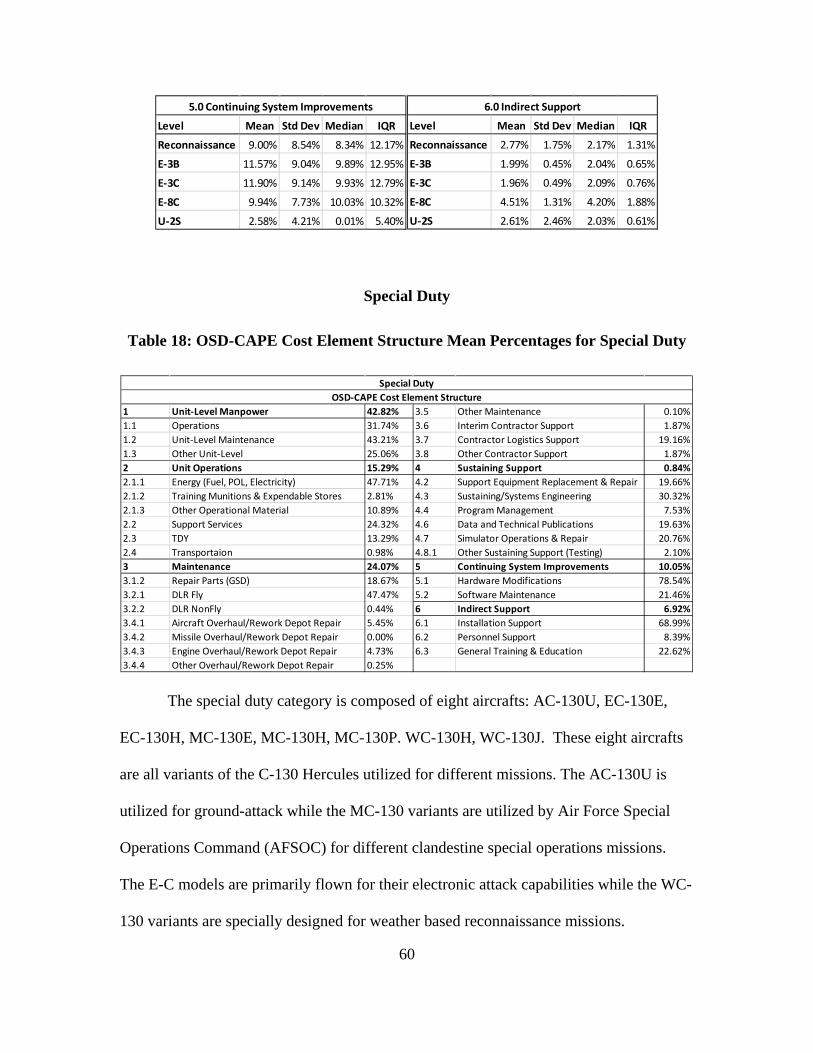
60
Special Duty
Table 18: OSD-CAPE Cost Element Structure Mean Percentages for Special Duty
The special duty category is composed of eight aircrafts: AC-130U, EC-130E,
EC-130H, MC-130E, MC-130H, MC-130P. WC-130H, WC-130J. These eight aircrafts
are all variants of the C-130 Hercules utilized for different missions. The AC-130U is
utilized for ground-attack while the MC-130 variants are utilized by Air Force Special
Operations Command (AFSOC) for different clandestine special operations missions.
The E-C models are primarily flown for their electronic attack capabilities while the WC-
130 variants are specially designed for weather based reconnaissance missions.
Level Mean Std Dev Median IQR
Reconnaissance 9.00% 8.54% 8.34% 12.17%
E-3B 11.57% 9.04% 9.89% 12.95%
E-3C 11.90% 9.14% 9.93% 12.79%
E-8C 9.94% 7.73% 10.03% 10.32%
U-2S 2.58% 4.21% 0.01% 5.40%
5.0 Continuing System Improvements
Level Mean Std Dev Median IQR
Reconnaissance 2.77% 1.75% 2.17% 1.31%
E-3B 1.99% 0.45% 2.04% 0.65%
E-3C 1.96% 0.49% 2.09% 0.76%
E-8C 4.51% 1.31% 4.20% 1.88%
U-2S 2.61% 2.46% 2.03% 0.61%
6.0 Indirect Support
1 Unit-Level Manpower 42.82% 3.5 Other Maintenance 0.10%1.1 Operations 31.74% 3.6 Interim Contractor Support 1.87%1.2 Unit-Level Maintenance 43.21% 3.7 Contractor Logistics Support 19.16%1.3 Other Unit-Level 25.06% 3.8 Other Contractor Support 1.87%2 Unit Operations 15.29% 4 Sustaining Support 0.84%2.1.1 Energy (Fuel, POL, Electricity) 47.71% 4.2 Support Equipment Replacement & Repair 19.66%2.1.2 Training Munitions & Expendable Stores 2.81% 4.3 Sustaining/Systems Engineering 30.32%2.1.3 Other Operational Material 10.89% 4.4 Program Management 7.53%2.2 Support Services 24.32% 4.6 Data and Technical Publications 19.63%2.3 TDY 13.29% 4.7 Simulator Operations & Repair 20.76%2.4 Transportaion 0.98% 4.8.1 Other Sustaining Support (Testing) 2.10%3 Maintenance 24.07% 5 Continuing System Improvements 10.05%3.1.2 Repair Parts (GSD) 18.67% 5.1 Hardware Modifications 78.54%3.2.1 DLR Fly 47.47% 5.2 Software Maintenance 21.46%3.2.2 DLR NonFly 0.44% 6 Indirect Support 6.92%3.4.1 Aircraft Overhaul/Rework Depot Repair 5.45% 6.1 Installation Support 68.99%3.4.2 Missile Overhaul/Rework Depot Repair 0.00% 6.2 Personnel Support 8.39%3.4.3 Engine Overhaul/Rework Depot Repair 4.73% 6.3 General Training & Education 22.62%3.4.4 Other Overhaul/Rework Depot Repair 0.25%
Special DutyOSD-CAPE Cost Element Structure
61
The first three elements consume 82.18% of the total expenditures for the special
duty category. As shown in Table 19, the weather reconnaissance specific variances, the
WC-130H and WC-130J, drive down the mean percentage for element 3.0 at 18.52% and
12.32% respectfully. The mean for 3.0 is 24.07%. Another interesting result to note is the
differences between the EC-130 variants. They both have similar mission sets and
eventually both were replaced by the EC-130J model, however, their O&S cost mean
percentages are very different. For element 1.0, the difference is 16.18%, element 2.0 it is
9.69%, and element 3.0 it is 18.68%. These findings go against the traditional assumption
that variants of the same platform would act similarly in expenditures.
Lastly, due to the mission and the hazardous conditions that these aircrafts are
utilized, an assumption was that 3.0 would consume the largest percentage for special
duty, however it was 1.0 Unit Level Manpower that consumed 42.82% of the total
expenditures for the eight aircrafts.
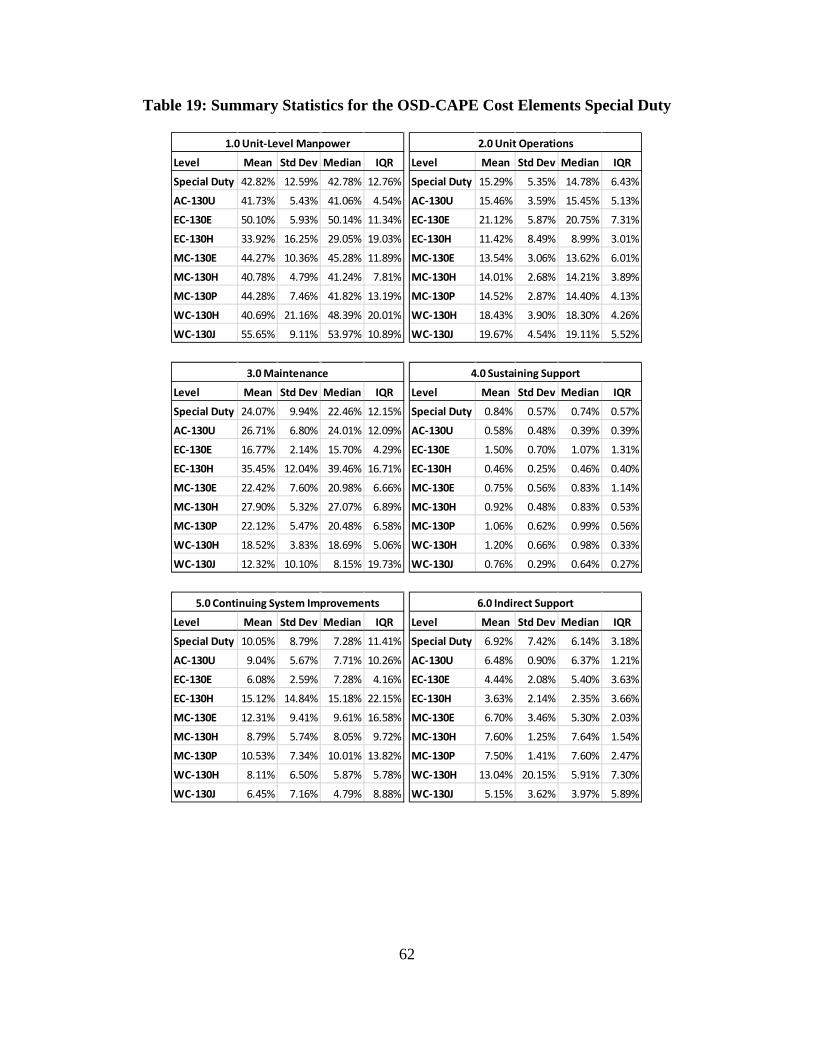
62
Table 19: Summary Statistics for the OSD-CAPE Cost Elements Special Duty
Level Mean Std Dev Median IQR
Special Duty 42.82% 12.59% 42.78% 12.76%
AC-130U 41.73% 5.43% 41.06% 4.54%
EC-130E 50.10% 5.93% 50.14% 11.34%
EC-130H 33.92% 16.25% 29.05% 19.03%
MC-130E 44.27% 10.36% 45.28% 11.89%
MC-130H 40.78% 4.79% 41.24% 7.81%
MC-130P 44.28% 7.46% 41.82% 13.19%
WC-130H 40.69% 21.16% 48.39% 20.01%
WC-130J 55.65% 9.11% 53.97% 10.89%
1.0 Unit-Level Manpower
Level Mean Std Dev Median IQR
Special Duty 15.29% 5.35% 14.78% 6.43%
AC-130U 15.46% 3.59% 15.45% 5.13%
EC-130E 21.12% 5.87% 20.75% 7.31%
EC-130H 11.42% 8.49% 8.99% 3.01%
MC-130E 13.54% 3.06% 13.62% 6.01%
MC-130H 14.01% 2.68% 14.21% 3.89%
MC-130P 14.52% 2.87% 14.40% 4.13%
WC-130H 18.43% 3.90% 18.30% 4.26%
WC-130J 19.67% 4.54% 19.11% 5.52%
2.0 Unit Operations
Level Mean Std Dev Median IQR
Special Duty 24.07% 9.94% 22.46% 12.15%
AC-130U 26.71% 6.80% 24.01% 12.09%
EC-130E 16.77% 2.14% 15.70% 4.29%
EC-130H 35.45% 12.04% 39.46% 16.71%
MC-130E 22.42% 7.60% 20.98% 6.66%
MC-130H 27.90% 5.32% 27.07% 6.89%
MC-130P 22.12% 5.47% 20.48% 6.58%
WC-130H 18.52% 3.83% 18.69% 5.06%
WC-130J 12.32% 10.10% 8.15% 19.73%
3.0 Maintenance
Level Mean Std Dev Median IQR
Special Duty 0.84% 0.57% 0.74% 0.57%
AC-130U 0.58% 0.48% 0.39% 0.39%
EC-130E 1.50% 0.70% 1.07% 1.31%
EC-130H 0.46% 0.25% 0.46% 0.40%
MC-130E 0.75% 0.56% 0.83% 1.14%
MC-130H 0.92% 0.48% 0.83% 0.53%
MC-130P 1.06% 0.62% 0.99% 0.56%
WC-130H 1.20% 0.66% 0.98% 0.33%
WC-130J 0.76% 0.29% 0.64% 0.27%
4.0 Sustaining Support
Level Mean Std Dev Median IQR
Special Duty 10.05% 8.79% 7.28% 11.41%
AC-130U 9.04% 5.67% 7.71% 10.26%
EC-130E 6.08% 2.59% 7.28% 4.16%
EC-130H 15.12% 14.84% 15.18% 22.15%
MC-130E 12.31% 9.41% 9.61% 16.58%
MC-130H 8.79% 5.74% 8.05% 9.72%
MC-130P 10.53% 7.34% 10.01% 13.82%
WC-130H 8.11% 6.50% 5.87% 5.78%
WC-130J 6.45% 7.16% 4.79% 8.88%
5.0 Continuing System Improvements
Level Mean Std Dev Median IQR
Special Duty 6.92% 7.42% 6.14% 3.18%
AC-130U 6.48% 0.90% 6.37% 1.21%
EC-130E 4.44% 2.08% 5.40% 3.63%
EC-130H 3.63% 2.14% 2.35% 3.66%
MC-130E 6.70% 3.46% 5.30% 2.03%
MC-130H 7.60% 1.25% 7.64% 1.54%
MC-130P 7.50% 1.41% 7.60% 2.47%
WC-130H 13.04% 20.15% 5.91% 7.30%
WC-130J 5.15% 3.62% 3.97% 5.89%
6.0 Indirect Support
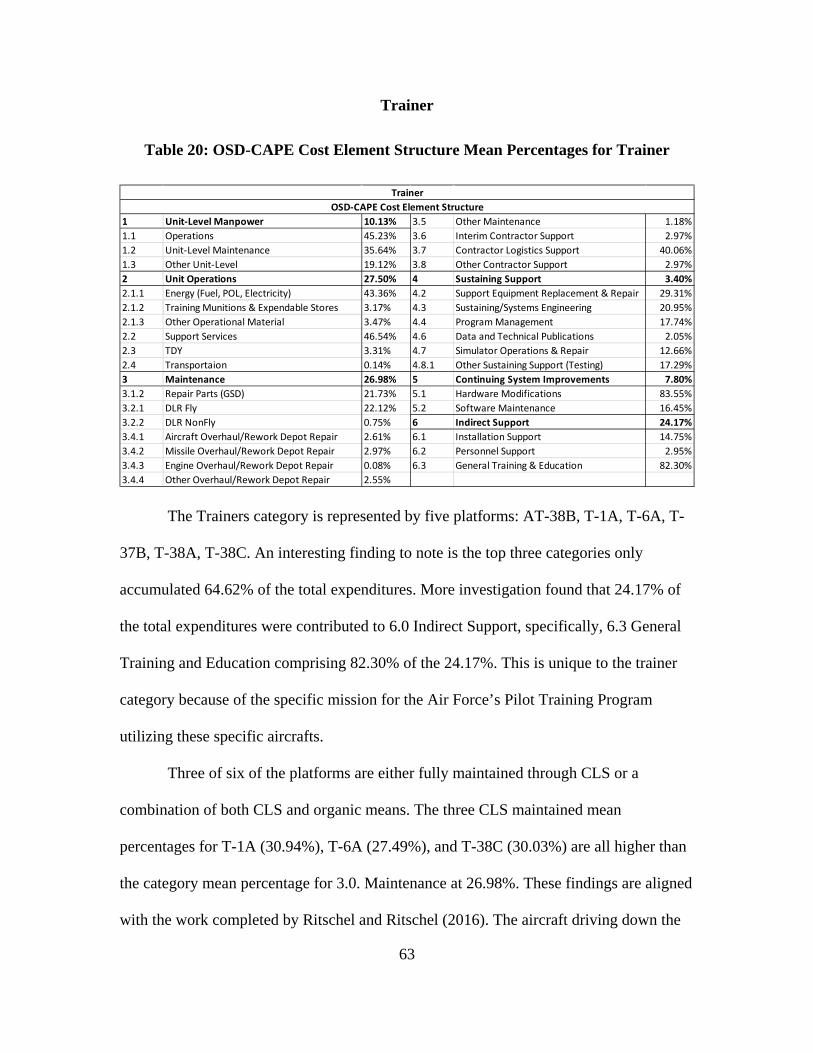
63
Trainer
Table 20: OSD-CAPE Cost Element Structure Mean Percentages for Trainer
The Trainers category is represented by five platforms: AT-38B, T-1A, T-6A, T-
37B, T-38A, T-38C. An interesting finding to note is the top three categories only
accumulated 64.62% of the total expenditures. More investigation found that 24.17% of
the total expenditures were contributed to 6.0 Indirect Support, specifically, 6.3 General
Training and Education comprising 82.30% of the 24.17%. This is unique to the trainer
category because of the specific mission for the Air Force’s Pilot Training Program
utilizing these specific aircrafts.
Three of six of the platforms are either fully maintained through CLS or a
combination of both CLS and organic means. The three CLS maintained mean
percentages for T-1A (30.94%), T-6A (27.49%), and T-38C (30.03%) are all higher than
the category mean percentage for 3.0. Maintenance at 26.98%. These findings are aligned
with the work completed by Ritschel and Ritschel (2016). The aircraft driving down the
1 Unit-Level Manpower 10.13% 3.5 Other Maintenance 1.18%1.1 Operations 45.23% 3.6 Interim Contractor Support 2.97%1.2 Unit-Level Maintenance 35.64% 3.7 Contractor Logistics Support 40.06%1.3 Other Unit-Level 19.12% 3.8 Other Contractor Support 2.97%2 Unit Operations 27.50% 4 Sustaining Support 3.40%2.1.1 Energy (Fuel, POL, Electricity) 43.36% 4.2 Support Equipment Replacement & Repair 29.31%2.1.2 Training Munitions & Expendable Stores 3.17% 4.3 Sustaining/Systems Engineering 20.95%2.1.3 Other Operational Material 3.47% 4.4 Program Management 17.74%2.2 Support Services 46.54% 4.6 Data and Technical Publications 2.05%2.3 TDY 3.31% 4.7 Simulator Operations & Repair 12.66%2.4 Transportaion 0.14% 4.8.1 Other Sustaining Support (Testing) 17.29%3 Maintenance 26.98% 5 Continuing System Improvements 7.80%3.1.2 Repair Parts (GSD) 21.73% 5.1 Hardware Modifications 83.55%3.2.1 DLR Fly 22.12% 5.2 Software Maintenance 16.45%3.2.2 DLR NonFly 0.75% 6 Indirect Support 24.17%3.4.1 Aircraft Overhaul/Rework Depot Repair 2.61% 6.1 Installation Support 14.75%3.4.2 Missile Overhaul/Rework Depot Repair 2.97% 6.2 Personnel Support 2.95%3.4.3 Engine Overhaul/Rework Depot Repair 0.08% 6.3 General Training & Education 82.30%3.4.4 Other Overhaul/Rework Depot Repair 2.55%
TrainerOSD-CAPE Cost Element Structure
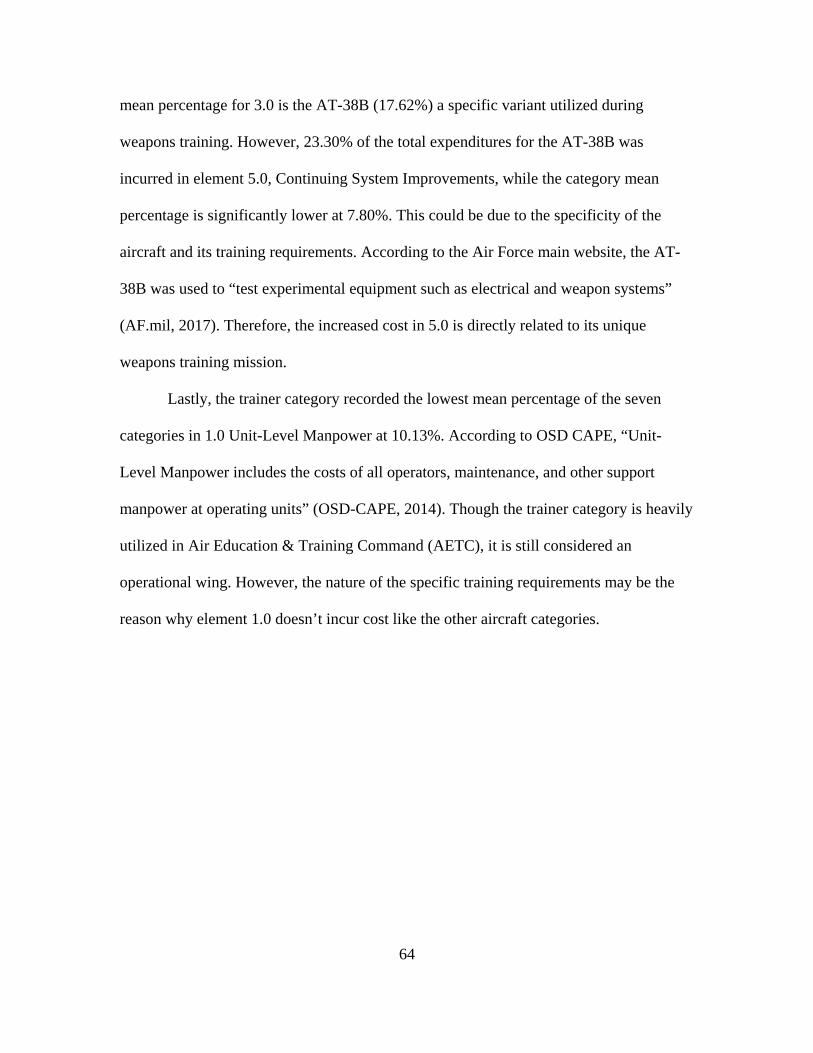
64
mean percentage for 3.0 is the AT-38B (17.62%) a specific variant utilized during
weapons training. However, 23.30% of the total expenditures for the AT-38B was
incurred in element 5.0, Continuing System Improvements, while the category mean
percentage is significantly lower at 7.80%. This could be due to the specificity of the
aircraft and its training requirements. According to the Air Force main website, the AT-
38B was used to “test experimental equipment such as electrical and weapon systems”
(AF.mil, 2017). Therefore, the increased cost in 5.0 is directly related to its unique
weapons training mission.
Lastly, the trainer category recorded the lowest mean percentage of the seven
categories in 1.0 Unit-Level Manpower at 10.13%. According to OSD CAPE, “Unit-
Level Manpower includes the costs of all operators, maintenance, and other support
manpower at operating units” (OSD-CAPE, 2014). Though the trainer category is heavily
utilized in Air Education & Training Command (AETC), it is still considered an
operational wing. However, the nature of the specific training requirements may be the
reason why element 1.0 doesn’t incur cost like the other aircraft categories.
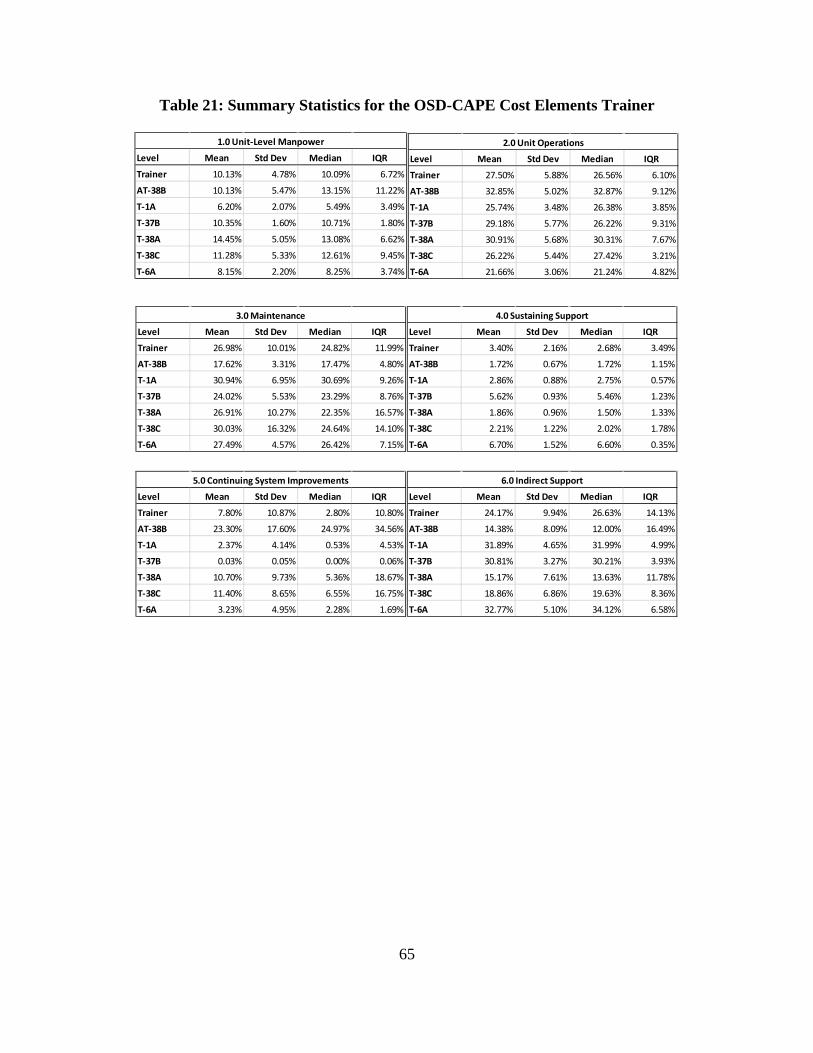
65
Table 21: Summary Statistics for the OSD-CAPE Cost Elements Trainer
Level Mean Std Dev Median IQR
Trainer 10.13% 4.78% 10.09% 6.72%
AT-38B 10.13% 5.47% 13.15% 11.22%
T-1A 6.20% 2.07% 5.49% 3.49%
T-37B 10.35% 1.60% 10.71% 1.80%
T-38A 14.45% 5.05% 13.08% 6.62%
T-38C 11.28% 5.33% 12.61% 9.45%
T-6A 8.15% 2.20% 8.25% 3.74%
1.0 Unit-Level Manpower
Level Mean Std Dev Median IQR
Trainer 27.50% 5.88% 26.56% 6.10%
AT-38B 32.85% 5.02% 32.87% 9.12%
T-1A 25.74% 3.48% 26.38% 3.85%
T-37B 29.18% 5.77% 26.22% 9.31%
T-38A 30.91% 5.68% 30.31% 7.67%
T-38C 26.22% 5.44% 27.42% 3.21%
T-6A 21.66% 3.06% 21.24% 4.82%
2.0 Unit Operations
Level Mean Std Dev Median IQR
Trainer 26.98% 10.01% 24.82% 11.99%
AT-38B 17.62% 3.31% 17.47% 4.80%
T-1A 30.94% 6.95% 30.69% 9.26%
T-37B 24.02% 5.53% 23.29% 8.76%
T-38A 26.91% 10.27% 22.35% 16.57%
T-38C 30.03% 16.32% 24.64% 14.10%
T-6A 27.49% 4.57% 26.42% 7.15%
3.0 Maintenance
Level Mean Std Dev Median IQR
Trainer 3.40% 2.16% 2.68% 3.49%
AT-38B 1.72% 0.67% 1.72% 1.15%
T-1A 2.86% 0.88% 2.75% 0.57%
T-37B 5.62% 0.93% 5.46% 1.23%
T-38A 1.86% 0.96% 1.50% 1.33%
T-38C 2.21% 1.22% 2.02% 1.78%
T-6A 6.70% 1.52% 6.60% 0.35%
4.0 Sustaining Support
Level Mean Std Dev Median IQR
Trainer 7.80% 10.87% 2.80% 10.80%
AT-38B 23.30% 17.60% 24.97% 34.56%
T-1A 2.37% 4.14% 0.53% 4.53%
T-37B 0.03% 0.05% 0.00% 0.06%
T-38A 10.70% 9.73% 5.36% 18.67%
T-38C 11.40% 8.65% 6.55% 16.75%
T-6A 3.23% 4.95% 2.28% 1.69%
5.0 Continuing System Improvements
Level Mean Std Dev Median IQR
Trainer 24.17% 9.94% 26.63% 14.13%
AT-38B 14.38% 8.09% 12.00% 16.49%
T-1A 31.89% 4.65% 31.99% 4.99%
T-37B 30.81% 3.27% 30.21% 3.93%
T-38A 15.17% 7.61% 13.63% 11.78%
T-38C 18.86% 6.86% 19.63% 8.36%
T-6A 32.77% 5.10% 34.12% 6.58%
6.0 Indirect Support
66
Transport
Table 22: OSD-CAPE Cost Element Structure Mean Percentages for Transport
The transport category is composed of 14 aircrafts: C-130E, C-130H, C-130J, C-
17A, C-21A, C-5A, C-5B, C-5C, HC-130N, KC-10A, KC-135D, KC-135E, KC-135R,
KC-135T. The first three cost elements consume 84.73% of the total expenditures. Like
previous categories, CLS or organic maintenance is both utilized in this category.
However, of the four platforms utilizing the CLS means to maintenance, only one
platform, the KC-10A with a mean percentage of 36.10%, exceeds the mean percentage
for the category for element 3.0 with 29.83%. The other three platforms, the C-130J, C-
17A, and the C-21A all have lower mean percentages for 3.0. These results are unlike the
other categories results. The three platforms that are driving the maintenance mean
percentage up is the C-5 series (variation A, B & C). With a mean percentage of 35.09%,
35.86%, and 37.15%, the C-5 series just within one standard deviation from the category
mean.
1 Unit-Level Manpower 32.18% 3.5 Other Maintenance 0.35%1.1 Operations 26.73% 3.6 Interim Contractor Support 0.25%1.2 Unit-Level Maintenance 49.46% 3.7 Contractor Logistics Support 29.06%1.3 Other Unit-Level 23.81% 3.8 Other Contractor Support 0.00%2 Unit Operations 22.72% 4 Sustaining Support 1.79%2.1.1 Energy (Fuel, POL, Electricity) 69.48% 4.2 Support Equipment Replacement & Repair 18.59%2.1.2 Training Munitions & Expendable Stores 0.09% 4.3 Sustaining/Systems Engineering 44.49%2.1.3 Other Operational Material 5.96% 4.4 Program Management 2.57%2.2 Support Services 11.77% 4.6 Data and Technical Publications 11.24%2.3 TDY 10.26% 4.7 Simulator Operations & Repair 22.71%2.4 Transportaion 2.44% 4.8.1 Other Sustaining Support (Testing) 0.40%3 Maintenance 29.83% 5 Continuing System Improvements 8.84%3.1.2 Repair Parts (GSD) 11.09% 5.1 Hardware Modifications 92.01%3.2.1 DLR Fly 21.87% 5.2 Software Maintenance 7.99%3.2.2 DLR NonFly 0.17% 6 Indirect Support 4.65%3.4.1 Aircraft Overhaul/Rework Depot Repair 25.05% 6.1 Installation Support 77.92%3.4.2 Missile Overhaul/Rework Depot Repair 0.00% 6.2 Personnel Support 4.58%3.4.3 Engine Overhaul/Rework Depot Repair 12.00% 6.3 General Training & Education 17.50%3.4.4 Other Overhaul/Rework Depot Repair 0.16%
TransportOSD-CAPE Cost Element Structure
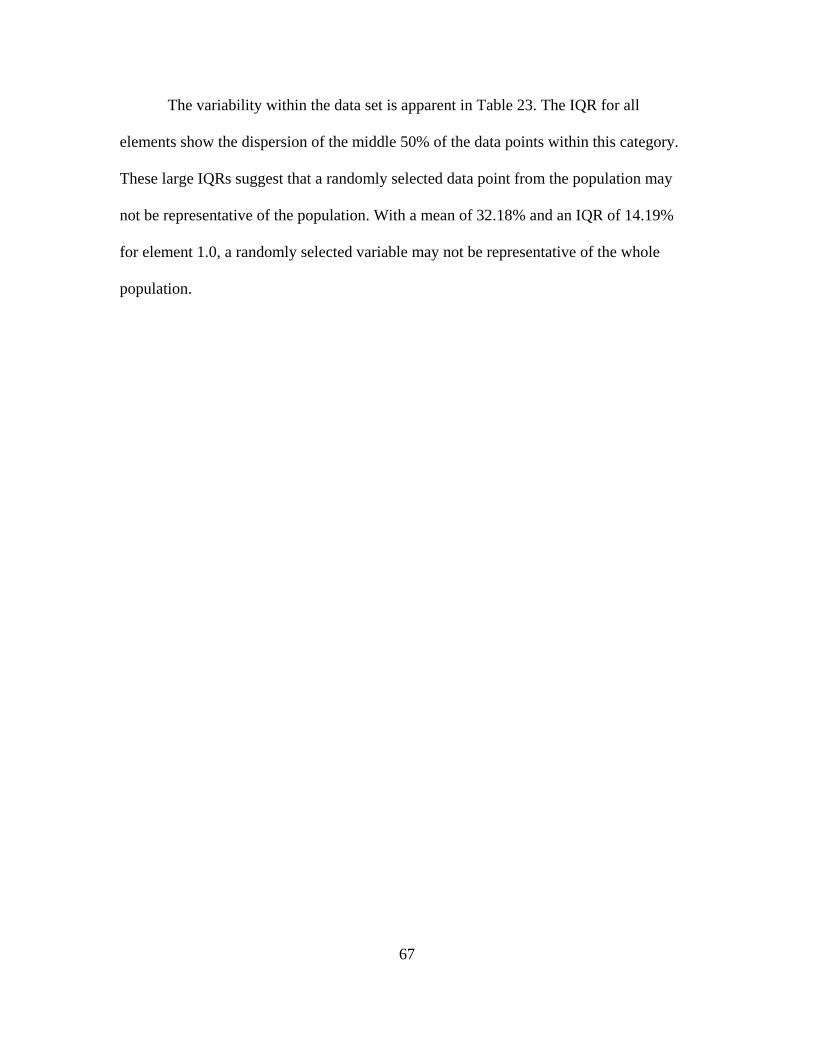
67
The variability within the data set is apparent in Table 23. The IQR for all
elements show the dispersion of the middle 50% of the data points within this category.
These large IQRs suggest that a randomly selected data point from the population may
not be representative of the population. With a mean of 32.18% and an IQR of 14.19%
for element 1.0, a randomly selected variable may not be representative of the whole
population.
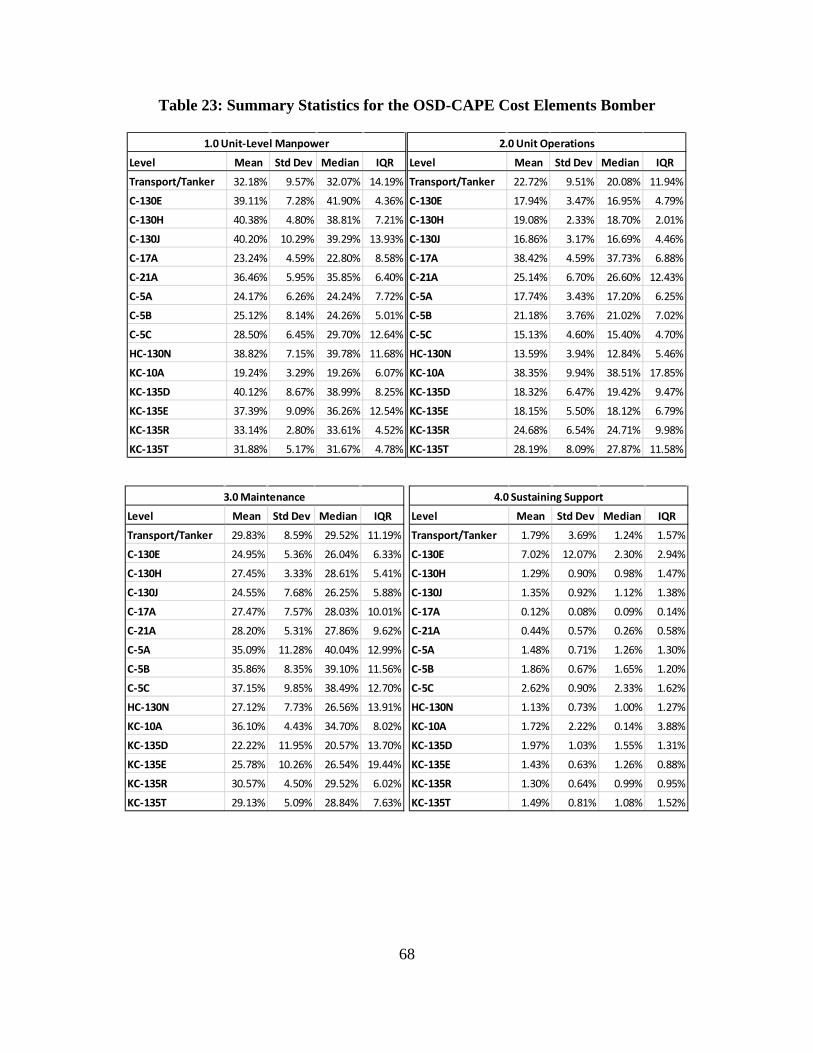
68
Table 23: Summary Statistics for the OSD-CAPE Cost Elements Bomber
Level Mean Std Dev Median IQR
Transport/Tanker 32.18% 9.57% 32.07% 14.19%
C-130E 39.11% 7.28% 41.90% 4.36%
C-130H 40.38% 4.80% 38.81% 7.21%
C-130J 40.20% 10.29% 39.29% 13.93%
C-17A 23.24% 4.59% 22.80% 8.58%
C-21A 36.46% 5.95% 35.85% 6.40%
C-5A 24.17% 6.26% 24.24% 7.72%
C-5B 25.12% 8.14% 24.26% 5.01%
C-5C 28.50% 6.45% 29.70% 12.64%
HC-130N 38.82% 7.15% 39.78% 11.68%
KC-10A 19.24% 3.29% 19.26% 6.07%
KC-135D 40.12% 8.67% 38.99% 8.25%
KC-135E 37.39% 9.09% 36.26% 12.54%
KC-135R 33.14% 2.80% 33.61% 4.52%
KC-135T 31.88% 5.17% 31.67% 4.78%
1.0 Unit-Level Manpower
Level Mean Std Dev Median IQR
Transport/Tanker 22.72% 9.51% 20.08% 11.94%
C-130E 17.94% 3.47% 16.95% 4.79%
C-130H 19.08% 2.33% 18.70% 2.01%
C-130J 16.86% 3.17% 16.69% 4.46%
C-17A 38.42% 4.59% 37.73% 6.88%
C-21A 25.14% 6.70% 26.60% 12.43%
C-5A 17.74% 3.43% 17.20% 6.25%
C-5B 21.18% 3.76% 21.02% 7.02%
C-5C 15.13% 4.60% 15.40% 4.70%
HC-130N 13.59% 3.94% 12.84% 5.46%
KC-10A 38.35% 9.94% 38.51% 17.85%
KC-135D 18.32% 6.47% 19.42% 9.47%
KC-135E 18.15% 5.50% 18.12% 6.79%
KC-135R 24.68% 6.54% 24.71% 9.98%
KC-135T 28.19% 8.09% 27.87% 11.58%
2.0 Unit Operations
Level Mean Std Dev Median IQR
Transport/Tanker 29.83% 8.59% 29.52% 11.19%
C-130E 24.95% 5.36% 26.04% 6.33%
C-130H 27.45% 3.33% 28.61% 5.41%
C-130J 24.55% 7.68% 26.25% 5.88%
C-17A 27.47% 7.57% 28.03% 10.01%
C-21A 28.20% 5.31% 27.86% 9.62%
C-5A 35.09% 11.28% 40.04% 12.99%
C-5B 35.86% 8.35% 39.10% 11.56%
C-5C 37.15% 9.85% 38.49% 12.70%
HC-130N 27.12% 7.73% 26.56% 13.91%
KC-10A 36.10% 4.43% 34.70% 8.02%
KC-135D 22.22% 11.95% 20.57% 13.70%
KC-135E 25.78% 10.26% 26.54% 19.44%
KC-135R 30.57% 4.50% 29.52% 6.02%
KC-135T 29.13% 5.09% 28.84% 7.63%
3.0 Maintenance
Level Mean Std Dev Median IQR
Transport/Tanker 1.79% 3.69% 1.24% 1.57%
C-130E 7.02% 12.07% 2.30% 2.94%
C-130H 1.29% 0.90% 0.98% 1.47%
C-130J 1.35% 0.92% 1.12% 1.38%
C-17A 0.12% 0.08% 0.09% 0.14%
C-21A 0.44% 0.57% 0.26% 0.58%
C-5A 1.48% 0.71% 1.26% 1.30%
C-5B 1.86% 0.67% 1.65% 1.20%
C-5C 2.62% 0.90% 2.33% 1.62%
HC-130N 1.13% 0.73% 1.00% 1.27%
KC-10A 1.72% 2.22% 0.14% 3.88%
KC-135D 1.97% 1.03% 1.55% 1.31%
KC-135E 1.43% 0.63% 1.26% 0.88%
KC-135R 1.30% 0.64% 0.99% 0.95%
KC-135T 1.49% 0.81% 1.08% 1.52%
4.0 Sustaining Support
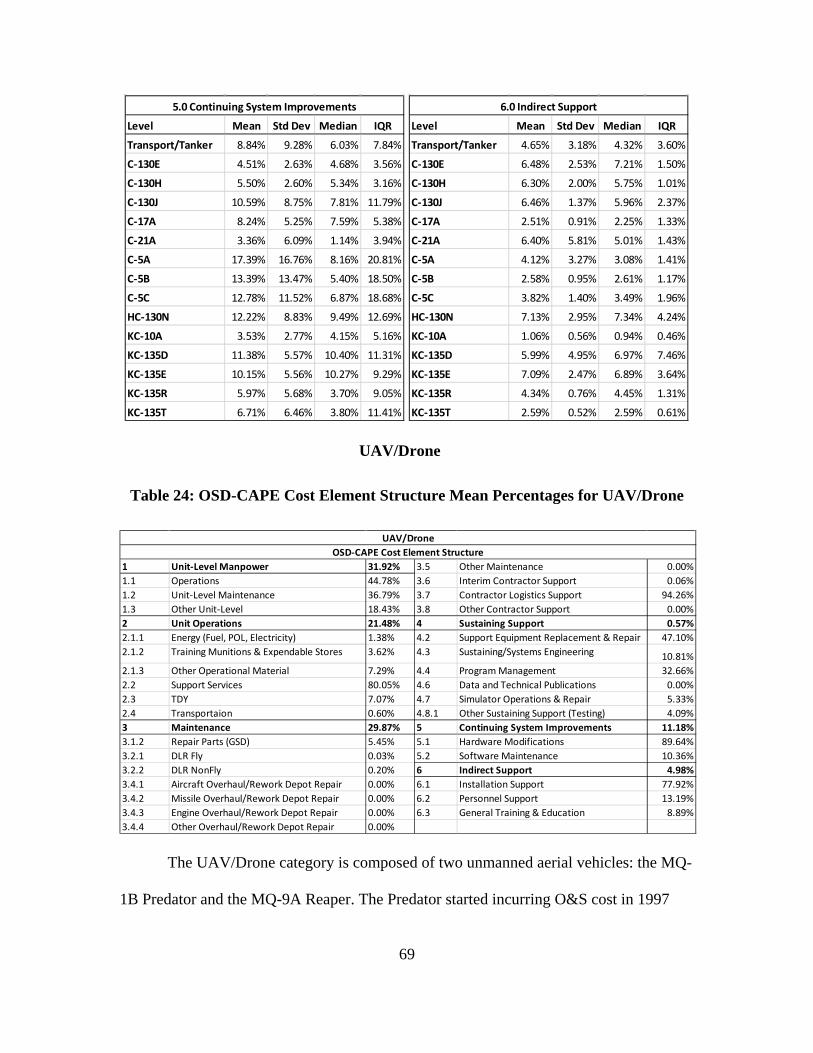
69
UAV/Drone
Table 24: OSD-CAPE Cost Element Structure Mean Percentages for UAV/Drone
The UAV/Drone category is composed of two unmanned aerial vehicles: the MQ-
1B Predator and the MQ-9A Reaper. The Predator started incurring O&S cost in 1997
Level Mean Std Dev Median IQR
Transport/Tanker 8.84% 9.28% 6.03% 7.84%
C-130E 4.51% 2.63% 4.68% 3.56%
C-130H 5.50% 2.60% 5.34% 3.16%
C-130J 10.59% 8.75% 7.81% 11.79%
C-17A 8.24% 5.25% 7.59% 5.38%
C-21A 3.36% 6.09% 1.14% 3.94%
C-5A 17.39% 16.76% 8.16% 20.81%
C-5B 13.39% 13.47% 5.40% 18.50%
C-5C 12.78% 11.52% 6.87% 18.68%
HC-130N 12.22% 8.83% 9.49% 12.69%
KC-10A 3.53% 2.77% 4.15% 5.16%
KC-135D 11.38% 5.57% 10.40% 11.31%
KC-135E 10.15% 5.56% 10.27% 9.29%
KC-135R 5.97% 5.68% 3.70% 9.05%
KC-135T 6.71% 6.46% 3.80% 11.41%
5.0 Continuing System Improvements
Level Mean Std Dev Median IQR
Transport/Tanker 4.65% 3.18% 4.32% 3.60%
C-130E 6.48% 2.53% 7.21% 1.50%
C-130H 6.30% 2.00% 5.75% 1.01%
C-130J 6.46% 1.37% 5.96% 2.37%
C-17A 2.51% 0.91% 2.25% 1.33%
C-21A 6.40% 5.81% 5.01% 1.43%
C-5A 4.12% 3.27% 3.08% 1.41%
C-5B 2.58% 0.95% 2.61% 1.17%
C-5C 3.82% 1.40% 3.49% 1.96%
HC-130N 7.13% 2.95% 7.34% 4.24%
KC-10A 1.06% 0.56% 0.94% 0.46%
KC-135D 5.99% 4.95% 6.97% 7.46%
KC-135E 7.09% 2.47% 6.89% 3.64%
KC-135R 4.34% 0.76% 4.45% 1.31%
KC-135T 2.59% 0.52% 2.59% 0.61%
6.0 Indirect Support
1 Unit-Level Manpower 31.92% 3.5 Other Maintenance 0.00%1.1 Operations 44.78% 3.6 Interim Contractor Support 0.06%1.2 Unit-Level Maintenance 36.79% 3.7 Contractor Logistics Support 94.26%1.3 Other Unit-Level 18.43% 3.8 Other Contractor Support 0.00%2 Unit Operations 21.48% 4 Sustaining Support 0.57%2.1.1 Energy (Fuel, POL, Electricity) 1.38% 4.2 Support Equipment Replacement & Repair 47.10%2.1.2 Training Munitions & Expendable Stores 3.62% 4.3 Sustaining/Systems Engineering 10.81%2.1.3 Other Operational Material 7.29% 4.4 Program Management 32.66%2.2 Support Services 80.05% 4.6 Data and Technical Publications 0.00%2.3 TDY 7.07% 4.7 Simulator Operations & Repair 5.33%2.4 Transportaion 0.60% 4.8.1 Other Sustaining Support (Testing) 4.09%3 Maintenance 29.87% 5 Continuing System Improvements 11.18%3.1.2 Repair Parts (GSD) 5.45% 5.1 Hardware Modifications 89.64%3.2.1 DLR Fly 0.03% 5.2 Software Maintenance 10.36%3.2.2 DLR NonFly 0.20% 6 Indirect Support 4.98%3.4.1 Aircraft Overhaul/Rework Depot Repair 0.00% 6.1 Installation Support 77.92%3.4.2 Missile Overhaul/Rework Depot Repair 0.00% 6.2 Personnel Support 13.19%3.4.3 Engine Overhaul/Rework Depot Repair 0.00% 6.3 General Training & Education 8.89%3.4.4 Other Overhaul/Rework Depot Repair 0.00%
UAV/DroneOSD-CAPE Cost Element Structure
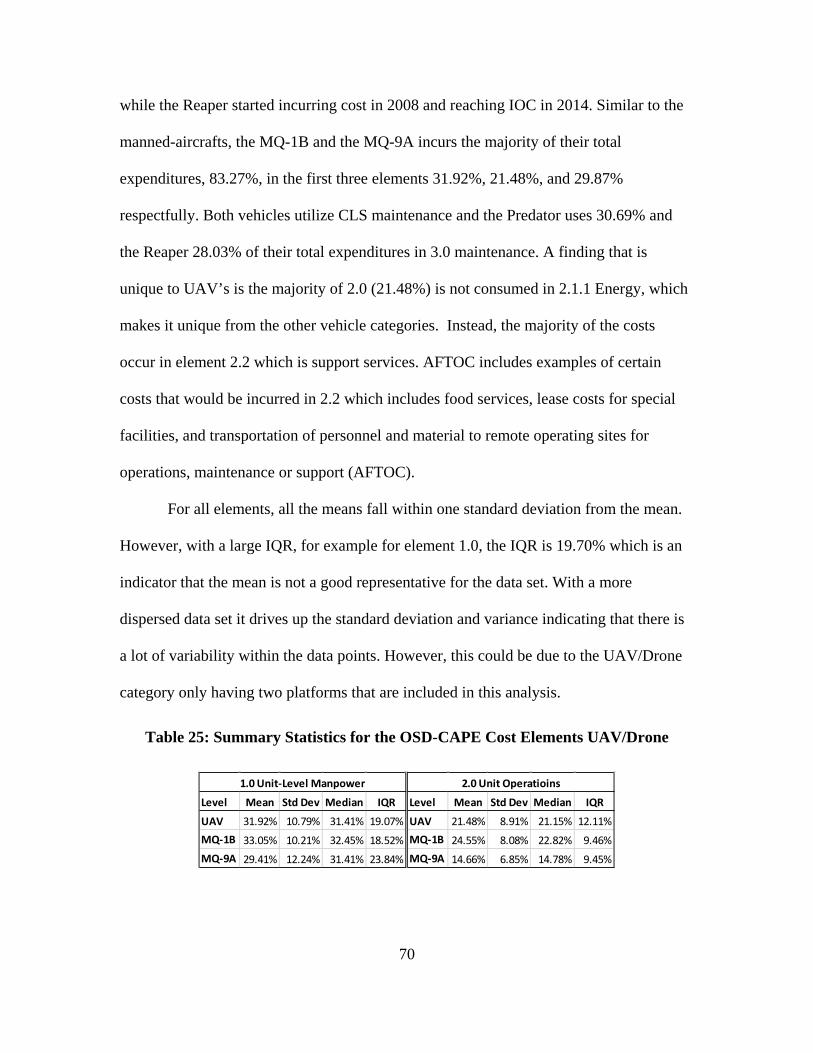
70
while the Reaper started incurring cost in 2008 and reaching IOC in 2014. Similar to the
manned-aircrafts, the MQ-1B and the MQ-9A incurs the majority of their total
expenditures, 83.27%, in the first three elements 31.92%, 21.48%, and 29.87%
respectfully. Both vehicles utilize CLS maintenance and the Predator uses 30.69% and
the Reaper 28.03% of their total expenditures in 3.0 maintenance. A finding that is
unique to UAV’s is the majority of 2.0 (21.48%) is not consumed in 2.1.1 Energy, which
makes it unique from the other vehicle categories. Instead, the majority of the costs
occur in element 2.2 which is support services. AFTOC includes examples of certain
costs that would be incurred in 2.2 which includes food services, lease costs for special
facilities, and transportation of personnel and material to remote operating sites for
operations, maintenance or support (AFTOC).
For all elements, all the means fall within one standard deviation from the mean.
However, with a large IQR, for example for element 1.0, the IQR is 19.70% which is an
indicator that the mean is not a good representative for the data set. With a more
dispersed data set it drives up the standard deviation and variance indicating that there is
a lot of variability within the data points. However, this could be due to the UAV/Drone
category only having two platforms that are included in this analysis.
Table 25: Summary Statistics for the OSD-CAPE Cost Elements UAV/Drone
Level Mean Std Dev Median IQR
UAV 31.92% 10.79% 31.41% 19.07%MQ-1B 33.05% 10.21% 32.45% 18.52%MQ-9A 29.41% 12.24% 31.41% 23.84%
1.0 Unit-Level Manpower
Level Mean Std Dev Median IQR
UAV 21.48% 8.91% 21.15% 12.11%MQ-1B 24.55% 8.08% 22.82% 9.46%MQ-9A 14.66% 6.85% 14.78% 9.45%
2.0 Unit Operatioins
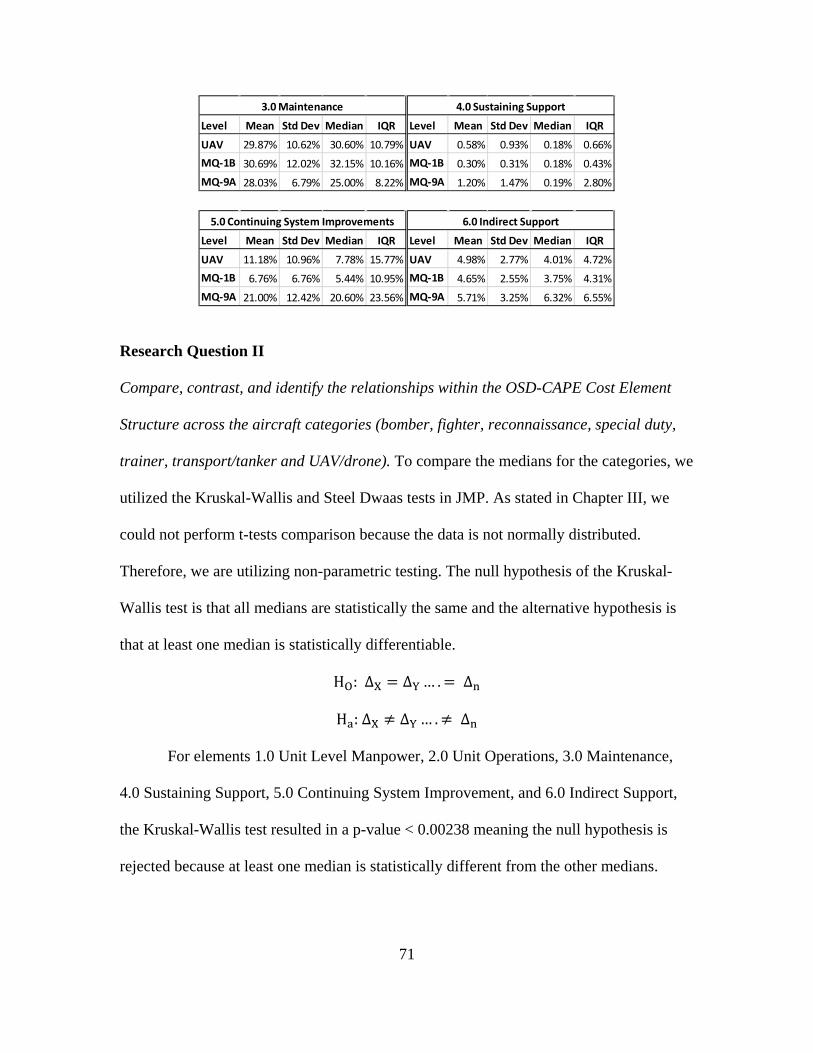
71
Research Question II
Compare, contrast, and identify the relationships within the OSD-CAPE Cost Element
Structure across the aircraft categories (bomber, fighter, reconnaissance, special duty,
trainer, transport/tanker and UAV/drone). To compare the medians for the categories, we
utilized the Kruskal-Wallis and Steel Dwaas tests in JMP. As stated in Chapter III, we
could not perform t-tests comparison because the data is not normally distributed.
Therefore, we are utilizing non-parametric testing. The null hypothesis of the Kruskal-
Wallis test is that all medians are statistically the same and the alternative hypothesis is
that at least one median is statistically differentiable.
HO: ΔX = ΔY … . = Δn
Ha: ΔX ≠ ΔY … .≠ Δn
For elements 1.0 Unit Level Manpower, 2.0 Unit Operations, 3.0 Maintenance,
4.0 Sustaining Support, 5.0 Continuing System Improvement, and 6.0 Indirect Support,
the Kruskal-Wallis test resulted in a p-value < 0.00238 meaning the null hypothesis is
rejected because at least one median is statistically different from the other medians.
Level Mean Std Dev Median IQR
UAV 29.87% 10.62% 30.60% 10.79%MQ-1B 30.69% 12.02% 32.15% 10.16%MQ-9A 28.03% 6.79% 25.00% 8.22%
3.0 Maintenance
Level Mean Std Dev Median IQR
UAV 0.58% 0.93% 0.18% 0.66%MQ-1B 0.30% 0.31% 0.18% 0.43%MQ-9A 1.20% 1.47% 0.19% 2.80%
4.0 Sustaining Support
Level Mean Std Dev Median IQR
UAV 11.18% 10.96% 7.78% 15.77%MQ-1B 6.76% 6.76% 5.44% 10.95%MQ-9A 21.00% 12.42% 20.60% 23.56%
5.0 Continuing System Improvements
Level Mean Std Dev Median IQR
UAV 4.98% 2.77% 4.01% 4.72%MQ-1B 4.65% 2.55% 3.75% 4.31%MQ-9A 5.71% 3.25% 6.32% 6.55%
6.0 Indirect Support
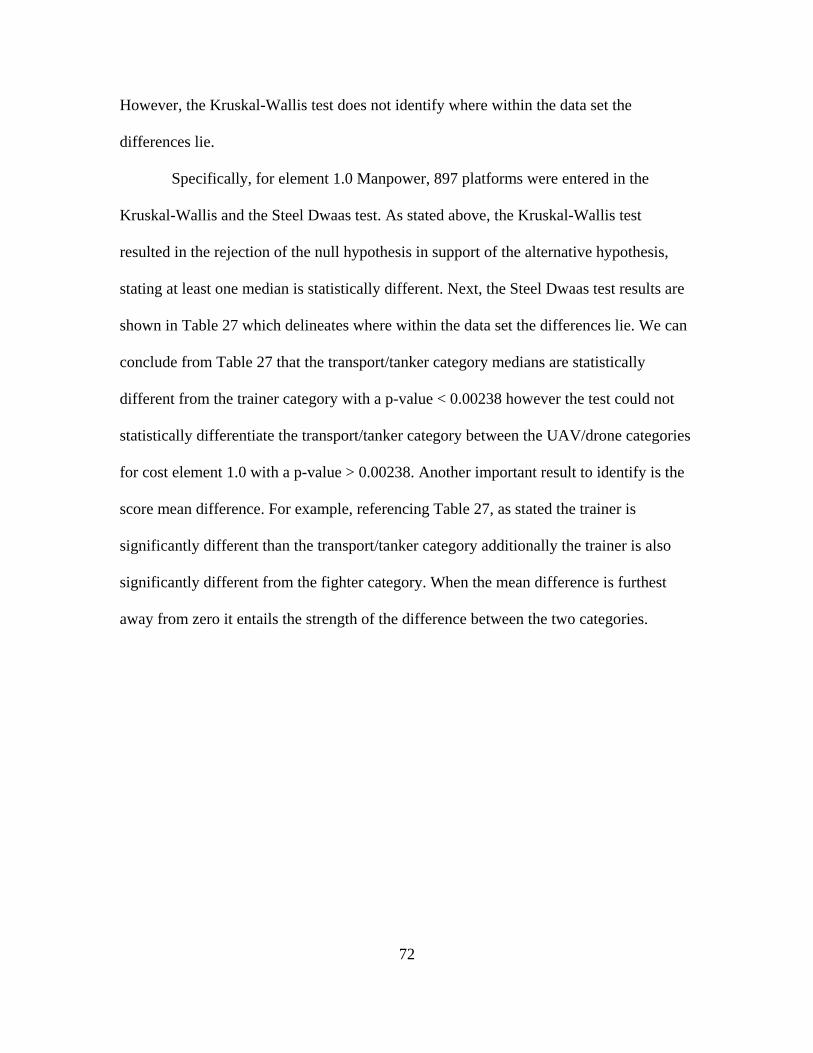
72
However, the Kruskal-Wallis test does not identify where within the data set the
differences lie.
Specifically, for element 1.0 Manpower, 897 platforms were entered in the
Kruskal-Wallis and the Steel Dwaas test. As stated above, the Kruskal-Wallis test
resulted in the rejection of the null hypothesis in support of the alternative hypothesis,
stating at least one median is statistically different. Next, the Steel Dwaas test results are
shown in Table 27 which delineates where within the data set the differences lie. We can
conclude from Table 27 that the transport/tanker category medians are statistically
different from the trainer category with a p-value < 0.00238 however the test could not
statistically differentiate the transport/tanker category between the UAV/drone categories
for cost element 1.0 with a p-value > 0.00238. Another important result to identify is the
score mean difference. For example, referencing Table 27, as stated the trainer is
significantly different than the transport/tanker category additionally the trainer is also
significantly different from the fighter category. When the mean difference is furthest
away from zero it entails the strength of the difference between the two categories.
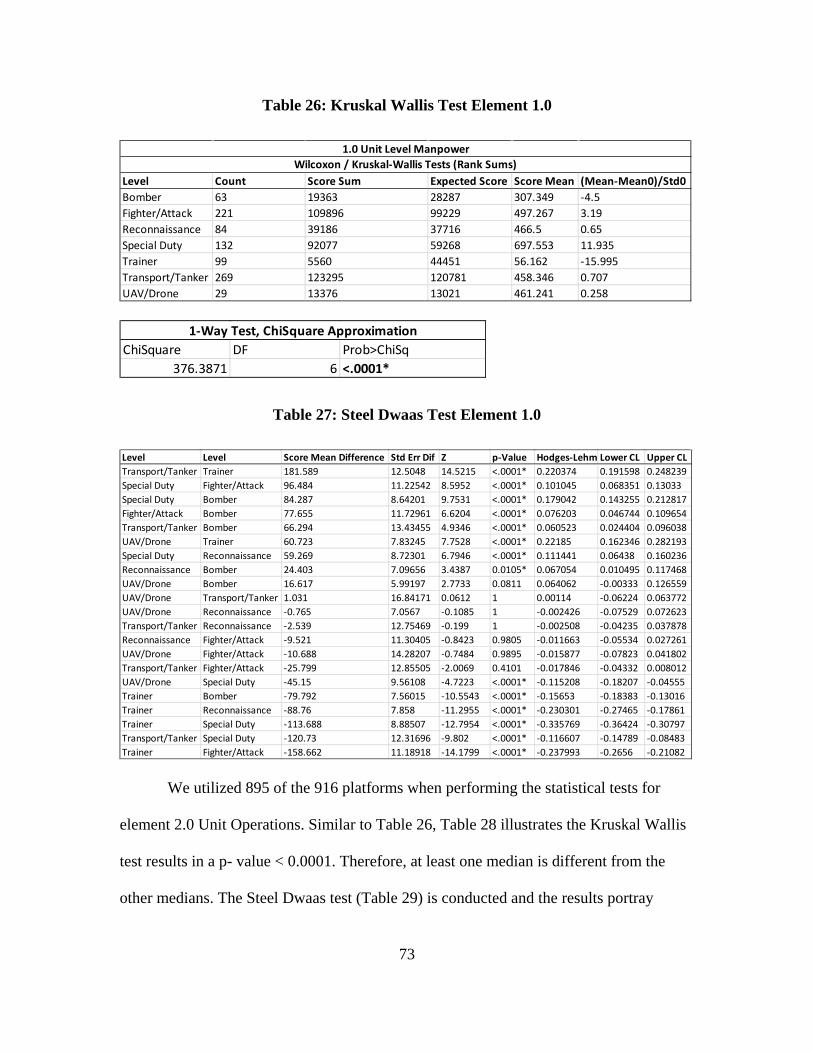
73
Table 26: Kruskal Wallis Test Element 1.0
Table 27: Steel Dwaas Test Element 1.0
We utilized 895 of the 916 platforms when performing the statistical tests for
element 2.0 Unit Operations. Similar to Table 26, Table 28 illustrates the Kruskal Wallis
test results in a p- value < 0.0001. Therefore, at least one median is different from the
other medians. The Steel Dwaas test (Table 29) is conducted and the results portray
Level Count Score Sum Expected Score Score Mean (Mean-Mean0)/Std0Bomber 63 19363 28287 307.349 -4.5Fighter/Attack 221 109896 99229 497.267 3.19Reconnaissance 84 39186 37716 466.5 0.65Special Duty 132 92077 59268 697.553 11.935Trainer 99 5560 44451 56.162 -15.995Transport/Tanker 269 123295 120781 458.346 0.707UAV/Drone 29 13376 13021 461.241 0.258
Wilcoxon / Kruskal-Wallis Tests (Rank Sums)1.0 Unit Level Manpower
ChiSquare DF Prob>ChiSq376.3871 6 <.0001*
1-Way Test, ChiSquare Approximation
Level Level Score Mean Difference Std Err Dif Z p-Value Hodges-Lehm Lower CL Upper CLTransport/Tanker Trainer 181.589 12.5048 14.5215 <.0001* 0.220374 0.191598 0.248239Special Duty Fighter/Attack 96.484 11.22542 8.5952 <.0001* 0.101045 0.068351 0.13033Special Duty Bomber 84.287 8.64201 9.7531 <.0001* 0.179042 0.143255 0.212817Fighter/Attack Bomber 77.655 11.72961 6.6204 <.0001* 0.076203 0.046744 0.109654Transport/Tanker Bomber 66.294 13.43455 4.9346 <.0001* 0.060523 0.024404 0.096038UAV/Drone Trainer 60.723 7.83245 7.7528 <.0001* 0.22185 0.162346 0.282193Special Duty Reconnaissance 59.269 8.72301 6.7946 <.0001* 0.111441 0.06438 0.160236Reconnaissance Bomber 24.403 7.09656 3.4387 0.0105* 0.067054 0.010495 0.117468UAV/Drone Bomber 16.617 5.99197 2.7733 0.0811 0.064062 -0.00333 0.126559UAV/Drone Transport/Tanker 1.031 16.84171 0.0612 1 0.00114 -0.06224 0.063772UAV/Drone Reconnaissance -0.765 7.0567 -0.1085 1 -0.002426 -0.07529 0.072623Transport/Tanker Reconnaissance -2.539 12.75469 -0.199 1 -0.002508 -0.04235 0.037878Reconnaissance Fighter/Attack -9.521 11.30405 -0.8423 0.9805 -0.011663 -0.05534 0.027261UAV/Drone Fighter/Attack -10.688 14.28207 -0.7484 0.9895 -0.015877 -0.07823 0.041802Transport/Tanker Fighter/Attack -25.799 12.85505 -2.0069 0.4101 -0.017846 -0.04332 0.008012UAV/Drone Special Duty -45.15 9.56108 -4.7223 <.0001* -0.115208 -0.18207 -0.04555Trainer Bomber -79.792 7.56015 -10.5543 <.0001* -0.15653 -0.18383 -0.13016Trainer Reconnaissance -88.76 7.858 -11.2955 <.0001* -0.230301 -0.27465 -0.17861Trainer Special Duty -113.688 8.88507 -12.7954 <.0001* -0.335769 -0.36424 -0.30797Transport/Tanker Special Duty -120.73 12.31696 -9.802 <.0001* -0.116607 -0.14789 -0.08483Trainer Fighter/Attack -158.662 11.18918 -14.1799 <.0001* -0.237993 -0.2656 -0.21082
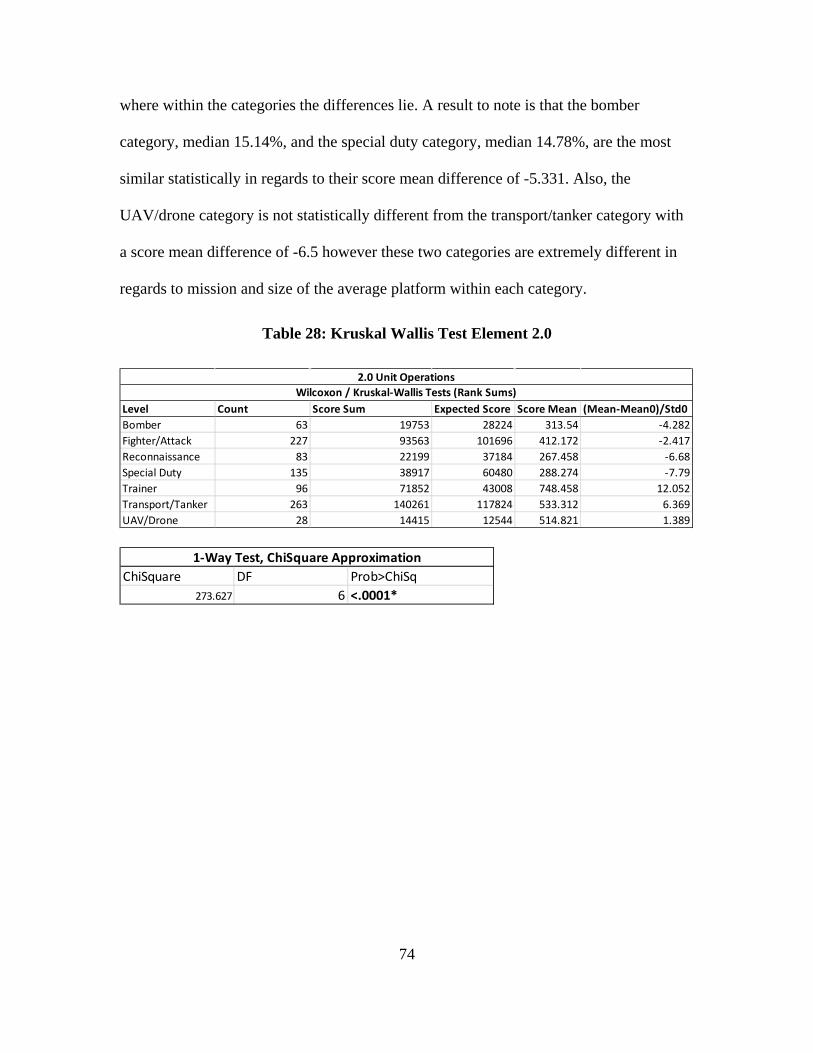
74
where within the categories the differences lie. A result to note is that the bomber
category, median 15.14%, and the special duty category, median 14.78%, are the most
similar statistically in regards to their score mean difference of -5.331. Also, the
UAV/drone category is not statistically different from the transport/tanker category with
a score mean difference of -6.5 however these two categories are extremely different in
regards to mission and size of the average platform within each category.
Table 28: Kruskal Wallis Test Element 2.0
Level Count Score Sum Expected Score Score Mean (Mean-Mean0)/Std0Bomber 63 19753 28224 313.54 -4.282Fighter/Attack 227 93563 101696 412.172 -2.417Reconnaissance 83 22199 37184 267.458 -6.68Special Duty 135 38917 60480 288.274 -7.79Trainer 96 71852 43008 748.458 12.052Transport/Tanker 263 140261 117824 533.312 6.369UAV/Drone 28 14415 12544 514.821 1.389
2.0 Unit OperationsWilcoxon / Kruskal-Wallis Tests (Rank Sums)
ChiSquare DF Prob>ChiSq273.627 6 <.0001*
1-Way Test, ChiSquare Approximation
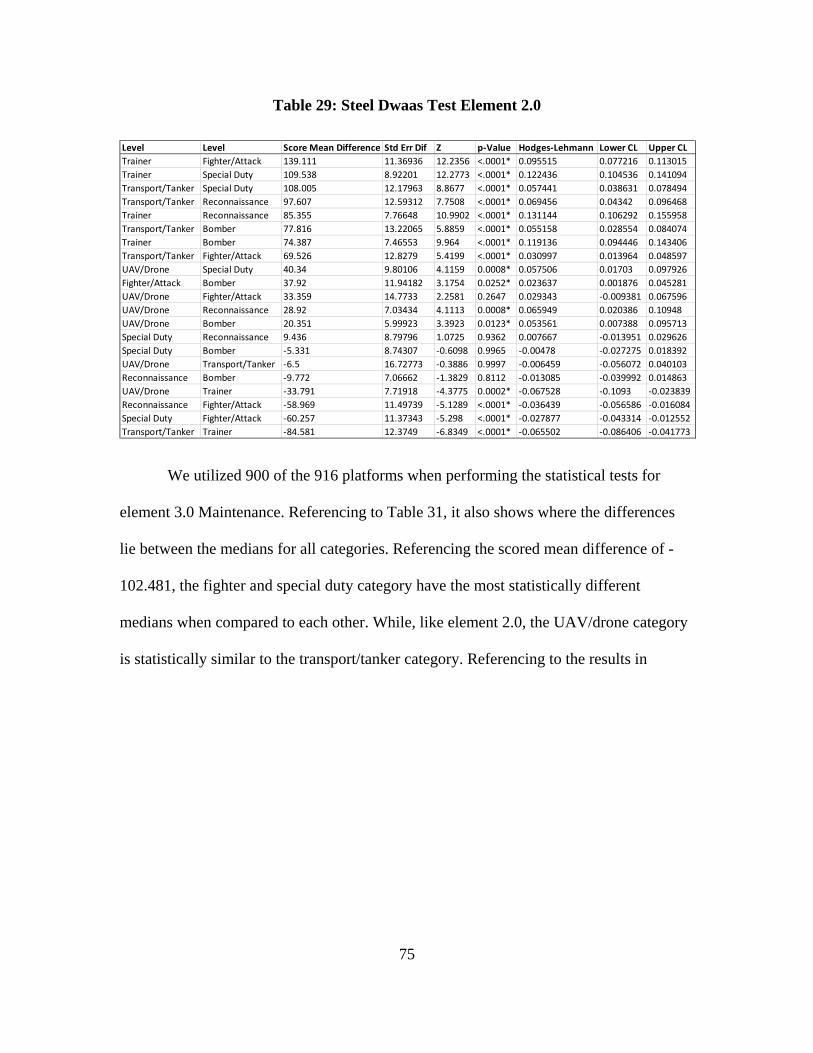
75
Table 29: Steel Dwaas Test Element 2.0
We utilized 900 of the 916 platforms when performing the statistical tests for
element 3.0 Maintenance. Referencing to Table 31, it also shows where the differences
lie between the medians for all categories. Referencing the scored mean difference of -
102.481, the fighter and special duty category have the most statistically different
medians when compared to each other. While, like element 2.0, the UAV/drone category
is statistically similar to the transport/tanker category. Referencing to the results in
Level Level Score Mean Difference Std Err Dif Z p-Value Hodges-Lehmann Lower CL Upper CLTrainer Fighter/Attack 139.111 11.36936 12.2356 <.0001* 0.095515 0.077216 0.113015Trainer Special Duty 109.538 8.92201 12.2773 <.0001* 0.122436 0.104536 0.141094Transport/Tanker Special Duty 108.005 12.17963 8.8677 <.0001* 0.057441 0.038631 0.078494Transport/Tanker Reconnaissance 97.607 12.59312 7.7508 <.0001* 0.069456 0.04342 0.096468Trainer Reconnaissance 85.355 7.76648 10.9902 <.0001* 0.131144 0.106292 0.155958Transport/Tanker Bomber 77.816 13.22065 5.8859 <.0001* 0.055158 0.028554 0.084074Trainer Bomber 74.387 7.46553 9.964 <.0001* 0.119136 0.094446 0.143406Transport/Tanker Fighter/Attack 69.526 12.8279 5.4199 <.0001* 0.030997 0.013964 0.048597UAV/Drone Special Duty 40.34 9.80106 4.1159 0.0008* 0.057506 0.01703 0.097926Fighter/Attack Bomber 37.92 11.94182 3.1754 0.0252* 0.023637 0.001876 0.045281UAV/Drone Fighter/Attack 33.359 14.7733 2.2581 0.2647 0.029343 -0.009381 0.067596UAV/Drone Reconnaissance 28.92 7.03434 4.1113 0.0008* 0.065949 0.020386 0.10948UAV/Drone Bomber 20.351 5.99923 3.3923 0.0123* 0.053561 0.007388 0.095713Special Duty Reconnaissance 9.436 8.79796 1.0725 0.9362 0.007667 -0.013951 0.029626Special Duty Bomber -5.331 8.74307 -0.6098 0.9965 -0.00478 -0.027275 0.018392UAV/Drone Transport/Tanker -6.5 16.72773 -0.3886 0.9997 -0.006459 -0.056072 0.040103Reconnaissance Bomber -9.772 7.06662 -1.3829 0.8112 -0.013085 -0.039992 0.014863UAV/Drone Trainer -33.791 7.71918 -4.3775 0.0002* -0.067528 -0.1093 -0.023839Reconnaissance Fighter/Attack -58.969 11.49739 -5.1289 <.0001* -0.036439 -0.056586 -0.016084Special Duty Fighter/Attack -60.257 11.37343 -5.298 <.0001* -0.027877 -0.043314 -0.012552Transport/Tanker Trainer -84.581 12.3749 -6.8349 <.0001* -0.065502 -0.086406 -0.041773
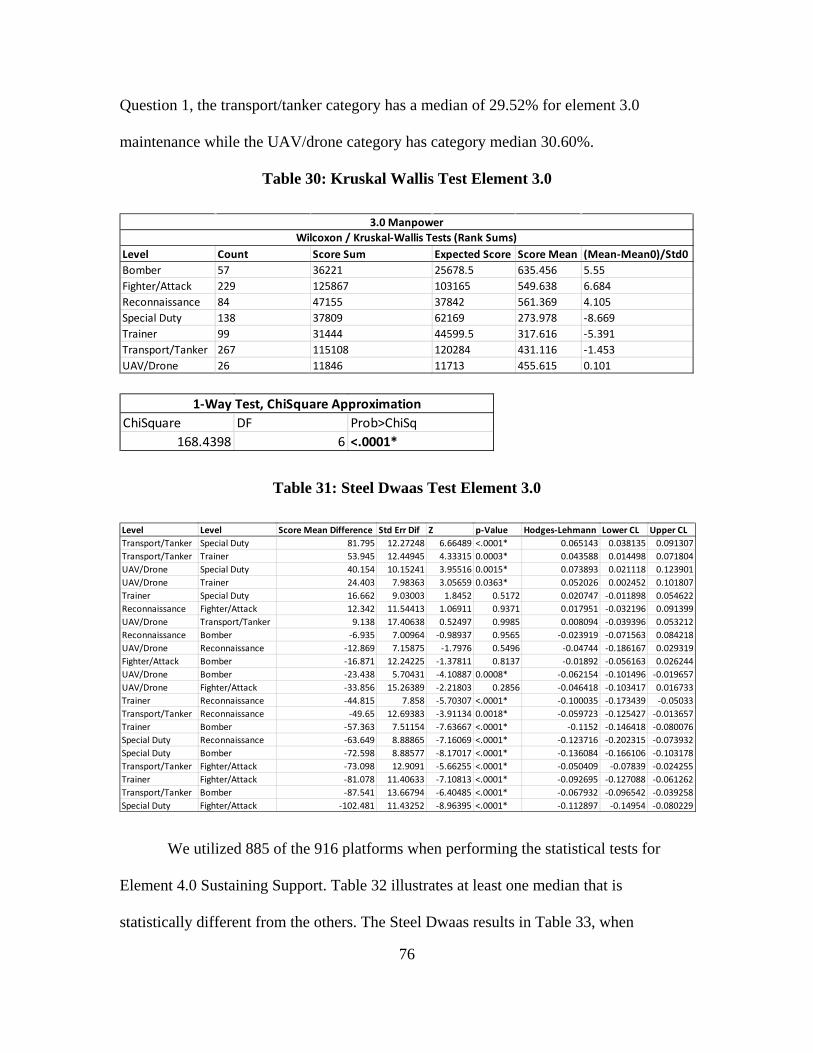
76
Question 1, the transport/tanker category has a median of 29.52% for element 3.0
maintenance while the UAV/drone category has category median 30.60%.
Table 30: Kruskal Wallis Test Element 3.0
Table 31: Steel Dwaas Test Element 3.0
We utilized 885 of the 916 platforms when performing the statistical tests for
Element 4.0 Sustaining Support. Table 32 illustrates at least one median that is
statistically different from the others. The Steel Dwaas results in Table 33, when
Level Count Score Sum Expected Score Score Mean (Mean-Mean0)/Std0Bomber 57 36221 25678.5 635.456 5.55Fighter/Attack 229 125867 103165 549.638 6.684Reconnaissance 84 47155 37842 561.369 4.105Special Duty 138 37809 62169 273.978 -8.669Trainer 99 31444 44599.5 317.616 -5.391Transport/Tanker 267 115108 120284 431.116 -1.453UAV/Drone 26 11846 11713 455.615 0.101
3.0 ManpowerWilcoxon / Kruskal-Wallis Tests (Rank Sums)
ChiSquare DF Prob>ChiSq168.4398 6 <.0001*
1-Way Test, ChiSquare Approximation
Level Level Score Mean Difference Std Err Dif Z p-Value Hodges-Lehmann Lower CL Upper CLTransport/Tanker Special Duty 81.795 12.27248 6.66489 <.0001* 0.065143 0.038135 0.091307Transport/Tanker Trainer 53.945 12.44945 4.33315 0.0003* 0.043588 0.014498 0.071804UAV/Drone Special Duty 40.154 10.15241 3.95516 0.0015* 0.073893 0.021118 0.123901UAV/Drone Trainer 24.403 7.98363 3.05659 0.0363* 0.052026 0.002452 0.101807Trainer Special Duty 16.662 9.03003 1.8452 0.5172 0.020747 -0.011898 0.054622Reconnaissance Fighter/Attack 12.342 11.54413 1.06911 0.9371 0.017951 -0.032196 0.091399UAV/Drone Transport/Tanker 9.138 17.40638 0.52497 0.9985 0.008094 -0.039396 0.053212Reconnaissance Bomber -6.935 7.00964 -0.98937 0.9565 -0.023919 -0.071563 0.084218UAV/Drone Reconnaissance -12.869 7.15875 -1.7976 0.5496 -0.04744 -0.186167 0.029319Fighter/Attack Bomber -16.871 12.24225 -1.37811 0.8137 -0.01892 -0.056163 0.026244UAV/Drone Bomber -23.438 5.70431 -4.10887 0.0008* -0.062154 -0.101496 -0.019657UAV/Drone Fighter/Attack -33.856 15.26389 -2.21803 0.2856 -0.046418 -0.103417 0.016733Trainer Reconnaissance -44.815 7.858 -5.70307 <.0001* -0.100035 -0.173439 -0.05033Transport/Tanker Reconnaissance -49.65 12.69383 -3.91134 0.0018* -0.059723 -0.125427 -0.013657Trainer Bomber -57.363 7.51154 -7.63667 <.0001* -0.1152 -0.146418 -0.080076Special Duty Reconnaissance -63.649 8.88865 -7.16069 <.0001* -0.123716 -0.202315 -0.073932Special Duty Bomber -72.598 8.88577 -8.17017 <.0001* -0.136084 -0.166106 -0.103178Transport/Tanker Fighter/Attack -73.098 12.9091 -5.66255 <.0001* -0.050409 -0.07839 -0.024255Trainer Fighter/Attack -81.078 11.40633 -7.10813 <.0001* -0.092695 -0.127088 -0.061262Transport/Tanker Bomber -87.541 13.66794 -6.40485 <.0001* -0.067932 -0.096542 -0.039258Special Duty Fighter/Attack -102.481 11.43252 -8.96395 <.0001* -0.112897 -0.14954 -0.080229
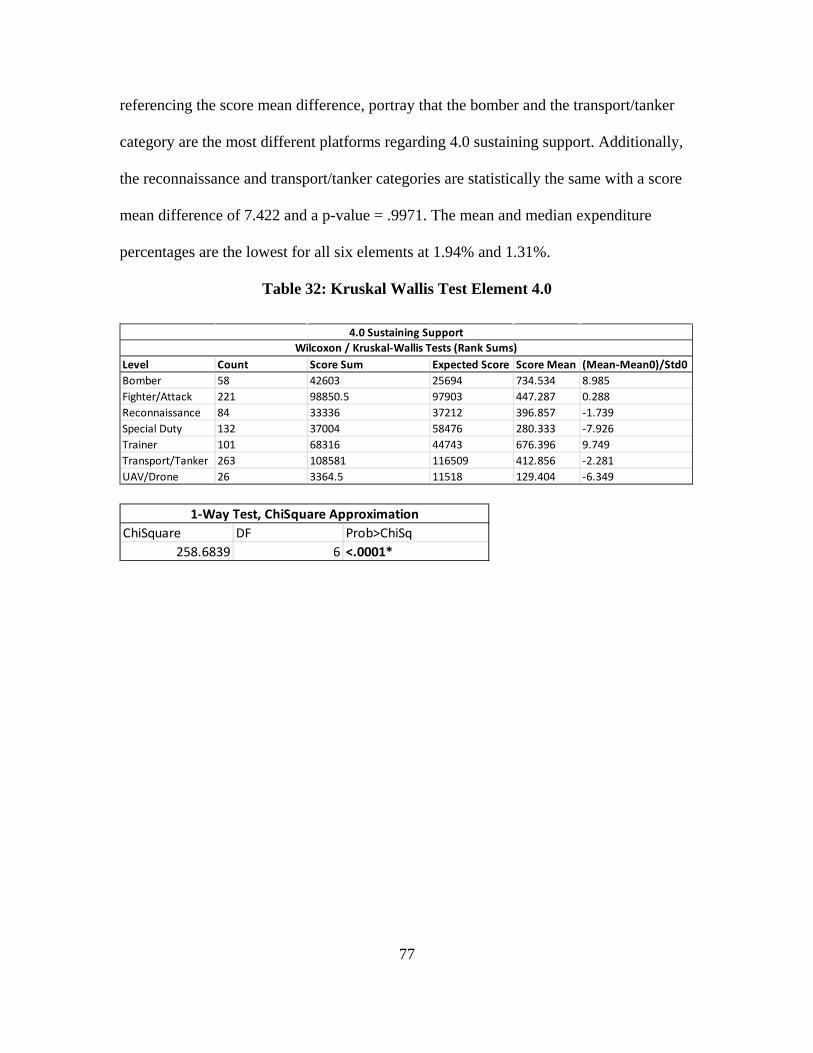
77
referencing the score mean difference, portray that the bomber and the transport/tanker
category are the most different platforms regarding 4.0 sustaining support. Additionally,
the reconnaissance and transport/tanker categories are statistically the same with a score
mean difference of 7.422 and a p-value = .9971. The mean and median expenditure
percentages are the lowest for all six elements at 1.94% and 1.31%.
Table 32: Kruskal Wallis Test Element 4.0
Level Count Score Sum Expected Score Score Mean (Mean-Mean0)/Std0Bomber 58 42603 25694 734.534 8.985Fighter/Attack 221 98850.5 97903 447.287 0.288Reconnaissance 84 33336 37212 396.857 -1.739Special Duty 132 37004 58476 280.333 -7.926Trainer 101 68316 44743 676.396 9.749Transport/Tanker 263 108581 116509 412.856 -2.281UAV/Drone 26 3364.5 11518 129.404 -6.349
4.0 Sustaining SupportWilcoxon / Kruskal-Wallis Tests (Rank Sums)
ChiSquare DF Prob>ChiSq258.6839 6 <.0001*
1-Way Test, ChiSquare Approximation
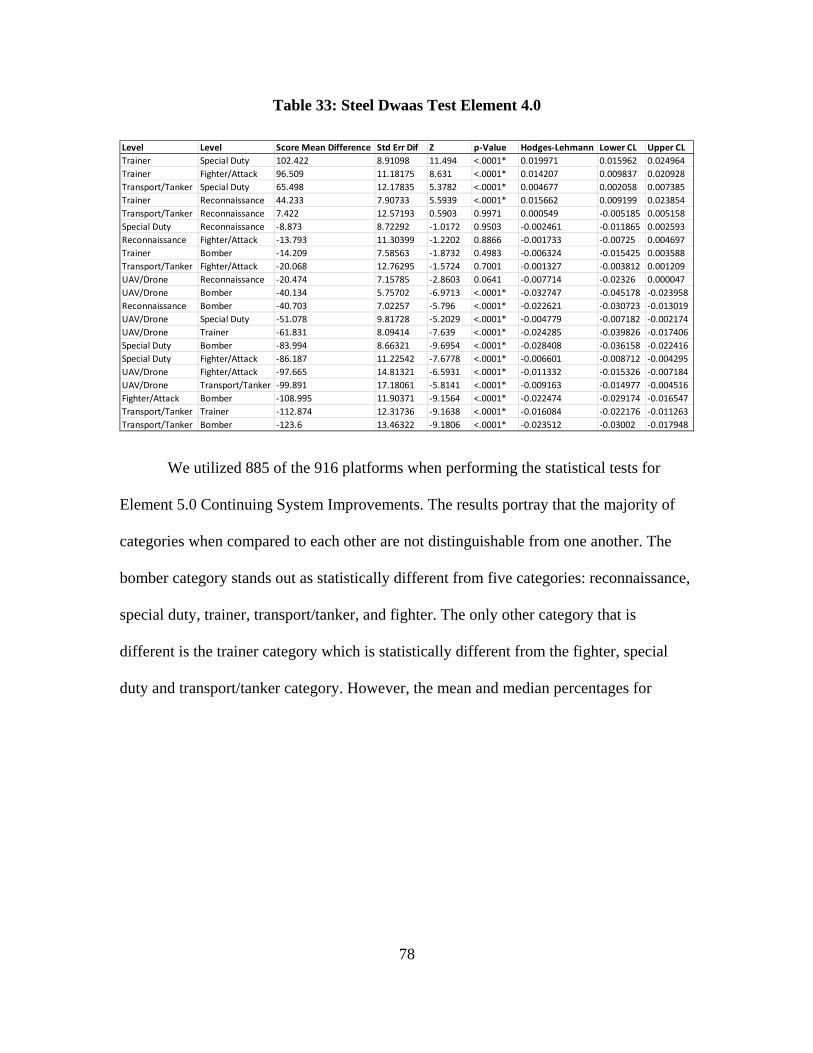
78
Table 33: Steel Dwaas Test Element 4.0
We utilized 885 of the 916 platforms when performing the statistical tests for
Element 5.0 Continuing System Improvements. The results portray that the majority of
categories when compared to each other are not distinguishable from one another. The
bomber category stands out as statistically different from five categories: reconnaissance,
special duty, trainer, transport/tanker, and fighter. The only other category that is
different is the trainer category which is statistically different from the fighter, special
duty and transport/tanker category. However, the mean and median percentages for
Level Level Score Mean Difference Std Err Dif Z p-Value Hodges-Lehmann Lower CL Upper CLTrainer Special Duty 102.422 8.91098 11.494 <.0001* 0.019971 0.015962 0.024964Trainer Fighter/Attack 96.509 11.18175 8.631 <.0001* 0.014207 0.009837 0.020928Transport/Tanker Special Duty 65.498 12.17835 5.3782 <.0001* 0.004677 0.002058 0.007385Trainer Reconnaissance 44.233 7.90733 5.5939 <.0001* 0.015662 0.009199 0.023854Transport/Tanker Reconnaissance 7.422 12.57193 0.5903 0.9971 0.000549 -0.005185 0.005158Special Duty Reconnaissance -8.873 8.72292 -1.0172 0.9503 -0.002461 -0.011865 0.002593Reconnaissance Fighter/Attack -13.793 11.30399 -1.2202 0.8866 -0.001733 -0.00725 0.004697Trainer Bomber -14.209 7.58563 -1.8732 0.4983 -0.006324 -0.015425 0.003588Transport/Tanker Fighter/Attack -20.068 12.76295 -1.5724 0.7001 -0.001327 -0.003812 0.001209UAV/Drone Reconnaissance -20.474 7.15785 -2.8603 0.0641 -0.007714 -0.02326 0.000047UAV/Drone Bomber -40.134 5.75702 -6.9713 <.0001* -0.032747 -0.045178 -0.023958Reconnaissance Bomber -40.703 7.02257 -5.796 <.0001* -0.022621 -0.030723 -0.013019UAV/Drone Special Duty -51.078 9.81728 -5.2029 <.0001* -0.004779 -0.007182 -0.002174UAV/Drone Trainer -61.831 8.09414 -7.639 <.0001* -0.024285 -0.039826 -0.017406Special Duty Bomber -83.994 8.66321 -9.6954 <.0001* -0.028408 -0.036158 -0.022416Special Duty Fighter/Attack -86.187 11.22542 -7.6778 <.0001* -0.006601 -0.008712 -0.004295UAV/Drone Fighter/Attack -97.665 14.81321 -6.5931 <.0001* -0.011332 -0.015326 -0.007184UAV/Drone Transport/Tanker -99.891 17.18061 -5.8141 <.0001* -0.009163 -0.014977 -0.004516Fighter/Attack Bomber -108.995 11.90371 -9.1564 <.0001* -0.022474 -0.029174 -0.016547Transport/Tanker Trainer -112.874 12.31736 -9.1638 <.0001* -0.016084 -0.022176 -0.011263Transport/Tanker Bomber -123.6 13.46322 -9.1806 <.0001* -0.023512 -0.03002 -0.017948
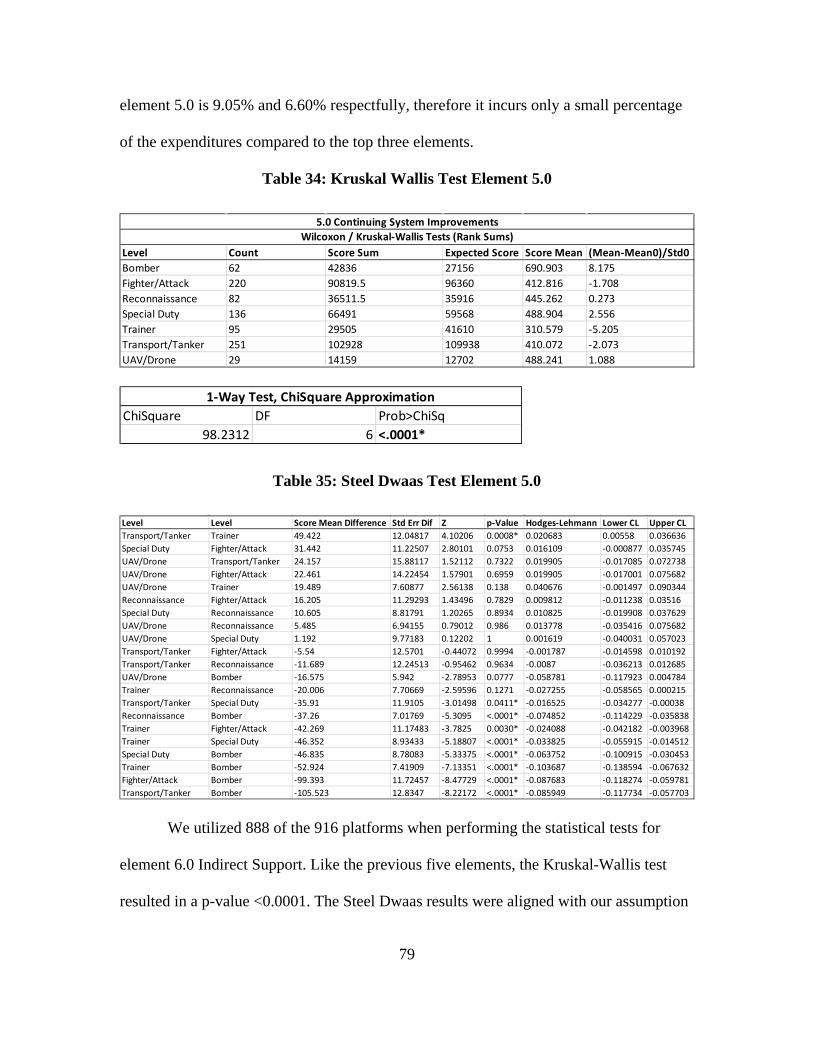
79
element 5.0 is 9.05% and 6.60% respectfully, therefore it incurs only a small percentage
of the expenditures compared to the top three elements.
Table 34: Kruskal Wallis Test Element 5.0
Table 35: Steel Dwaas Test Element 5.0
We utilized 888 of the 916 platforms when performing the statistical tests for
element 6.0 Indirect Support. Like the previous five elements, the Kruskal-Wallis test
resulted in a p-value <0.0001. The Steel Dwaas results were aligned with our assumption
Level Count Score Sum Expected Score Score Mean (Mean-Mean0)/Std0Bomber 62 42836 27156 690.903 8.175Fighter/Attack 220 90819.5 96360 412.816 -1.708Reconnaissance 82 36511.5 35916 445.262 0.273Special Duty 136 66491 59568 488.904 2.556Trainer 95 29505 41610 310.579 -5.205Transport/Tanker 251 102928 109938 410.072 -2.073UAV/Drone 29 14159 12702 488.241 1.088
5.0 Continuing System ImprovementsWilcoxon / Kruskal-Wallis Tests (Rank Sums)
ChiSquare DF Prob>ChiSq98.2312 6 <.0001*
1-Way Test, ChiSquare Approximation
Level Level Score Mean Difference Std Err Dif Z p-Value Hodges-Lehmann Lower CL Upper CLTransport/Tanker Trainer 49.422 12.04817 4.10206 0.0008* 0.020683 0.00558 0.036636Special Duty Fighter/Attack 31.442 11.22507 2.80101 0.0753 0.016109 -0.000877 0.035745UAV/Drone Transport/Tanker 24.157 15.88117 1.52112 0.7322 0.019905 -0.017085 0.072738UAV/Drone Fighter/Attack 22.461 14.22454 1.57901 0.6959 0.019905 -0.017001 0.075682UAV/Drone Trainer 19.489 7.60877 2.56138 0.138 0.040676 -0.001497 0.090344Reconnaissance Fighter/Attack 16.205 11.29293 1.43496 0.7829 0.009812 -0.011238 0.03516Special Duty Reconnaissance 10.605 8.81791 1.20265 0.8934 0.010825 -0.019908 0.037629UAV/Drone Reconnaissance 5.485 6.94155 0.79012 0.986 0.013778 -0.035416 0.075682UAV/Drone Special Duty 1.192 9.77183 0.12202 1 0.001619 -0.040031 0.057023Transport/Tanker Fighter/Attack -5.54 12.5701 -0.44072 0.9994 -0.001787 -0.014598 0.010192Transport/Tanker Reconnaissance -11.689 12.24513 -0.95462 0.9634 -0.0087 -0.036213 0.012685UAV/Drone Bomber -16.575 5.942 -2.78953 0.0777 -0.058781 -0.117923 0.004784Trainer Reconnaissance -20.006 7.70669 -2.59596 0.1271 -0.027255 -0.058565 0.000215Transport/Tanker Special Duty -35.91 11.9105 -3.01498 0.0411* -0.016525 -0.034277 -0.00038Reconnaissance Bomber -37.26 7.01769 -5.3095 <.0001* -0.074852 -0.114229 -0.035838Trainer Fighter/Attack -42.269 11.17483 -3.7825 0.0030* -0.024088 -0.042182 -0.003968Trainer Special Duty -46.352 8.93433 -5.18807 <.0001* -0.033825 -0.055915 -0.014512Special Duty Bomber -46.835 8.78083 -5.33375 <.0001* -0.063752 -0.100915 -0.030453Trainer Bomber -52.924 7.41909 -7.13351 <.0001* -0.103687 -0.138594 -0.067632Fighter/Attack Bomber -99.393 11.72457 -8.47729 <.0001* -0.087683 -0.118274 -0.059781Transport/Tanker Bomber -105.523 12.8347 -8.22172 <.0001* -0.085949 -0.117734 -0.057703
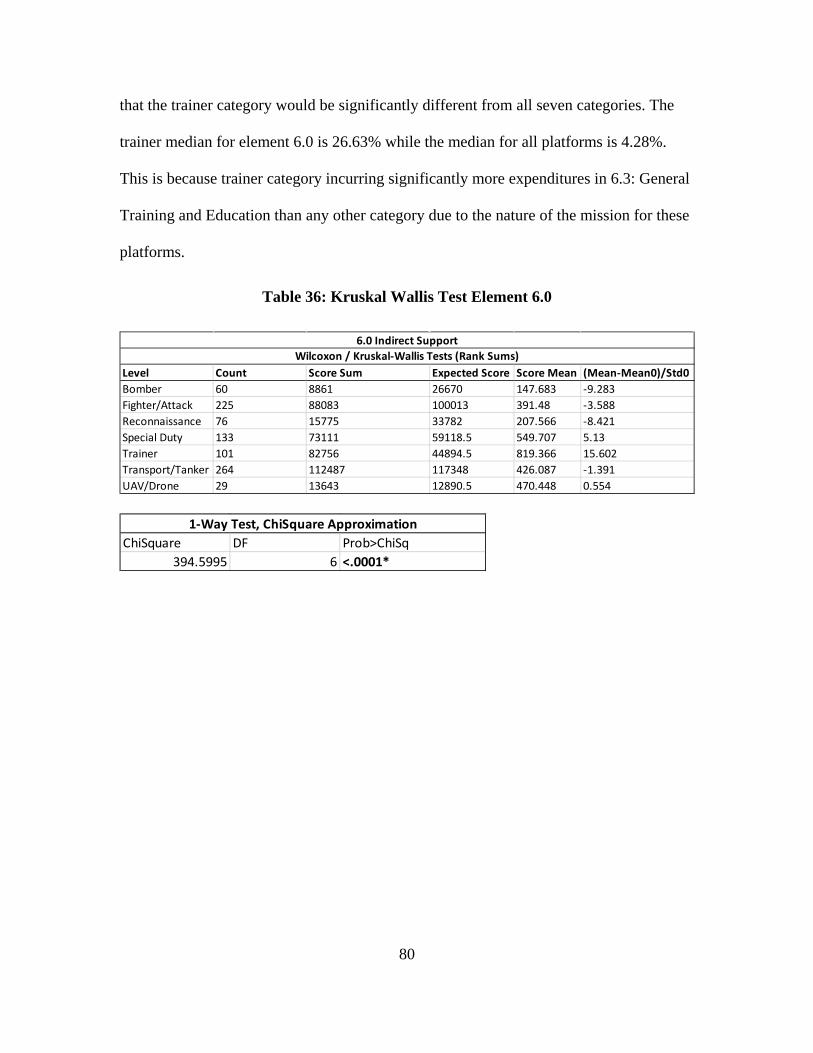
80
that the trainer category would be significantly different from all seven categories. The
trainer median for element 6.0 is 26.63% while the median for all platforms is 4.28%.
This is because trainer category incurring significantly more expenditures in 6.3: General
Training and Education than any other category due to the nature of the mission for these
platforms.
Table 36: Kruskal Wallis Test Element 6.0
Level Count Score Sum Expected Score Score Mean (Mean-Mean0)/Std0Bomber 60 8861 26670 147.683 -9.283Fighter/Attack 225 88083 100013 391.48 -3.588Reconnaissance 76 15775 33782 207.566 -8.421Special Duty 133 73111 59118.5 549.707 5.13Trainer 101 82756 44894.5 819.366 15.602Transport/Tanker 264 112487 117348 426.087 -1.391UAV/Drone 29 13643 12890.5 470.448 0.554
6.0 Indirect SupportWilcoxon / Kruskal-Wallis Tests (Rank Sums)
ChiSquare DF Prob>ChiSq394.5995 6 <.0001*
1-Way Test, ChiSquare Approximation
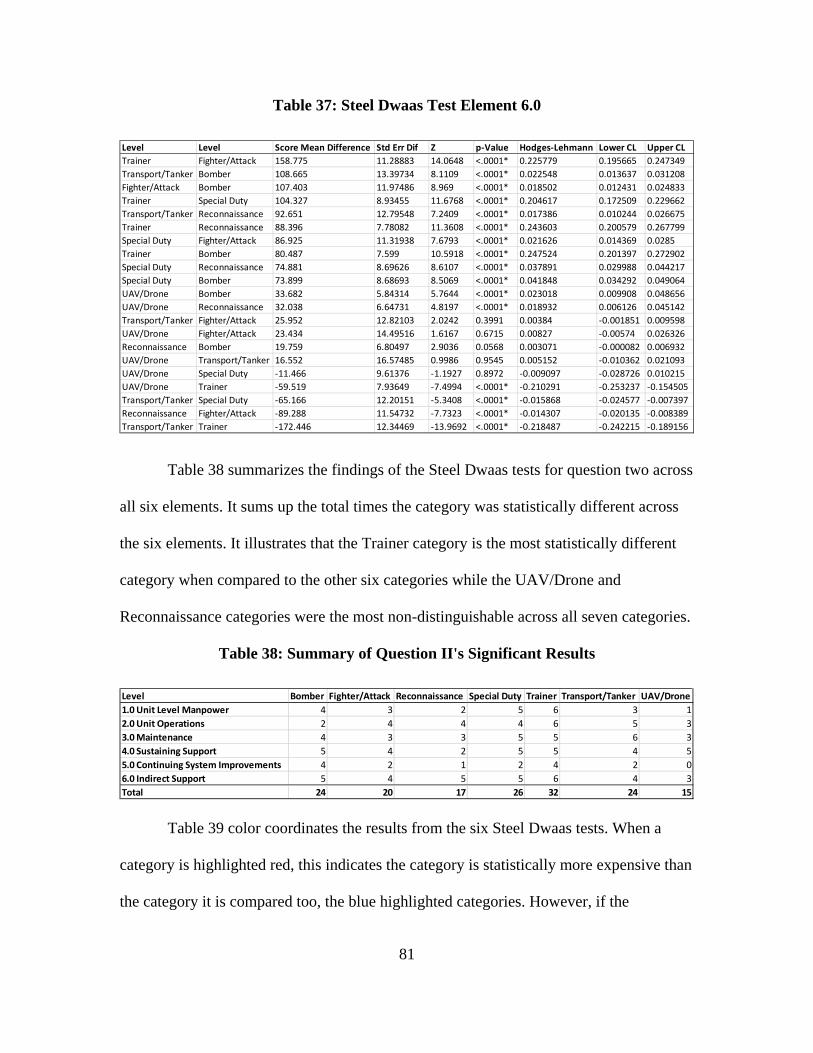
81
Table 37: Steel Dwaas Test Element 6.0
Table 38 summarizes the findings of the Steel Dwaas tests for question two across
all six elements. It sums up the total times the category was statistically different across
the six elements. It illustrates that the Trainer category is the most statistically different
category when compared to the other six categories while the UAV/Drone and
Reconnaissance categories were the most non-distinguishable across all seven categories.
Table 38: Summary of Question II's Significant Results
Table 39 color coordinates the results from the six Steel Dwaas tests. When a
category is highlighted red, this indicates the category is statistically more expensive than
the category it is compared too, the blue highlighted categories. However, if the
Level Level Score Mean Difference Std Err Dif Z p-Value Hodges-Lehmann Lower CL Upper CLTrainer Fighter/Attack 158.775 11.28883 14.0648 <.0001* 0.225779 0.195665 0.247349Transport/Tanker Bomber 108.665 13.39734 8.1109 <.0001* 0.022548 0.013637 0.031208Fighter/Attack Bomber 107.403 11.97486 8.969 <.0001* 0.018502 0.012431 0.024833Trainer Special Duty 104.327 8.93455 11.6768 <.0001* 0.204617 0.172509 0.229662Transport/Tanker Reconnaissance 92.651 12.79548 7.2409 <.0001* 0.017386 0.010244 0.026675Trainer Reconnaissance 88.396 7.78082 11.3608 <.0001* 0.243603 0.200579 0.267799Special Duty Fighter/Attack 86.925 11.31938 7.6793 <.0001* 0.021626 0.014369 0.0285Trainer Bomber 80.487 7.599 10.5918 <.0001* 0.247524 0.201397 0.272902Special Duty Reconnaissance 74.881 8.69626 8.6107 <.0001* 0.037891 0.029988 0.044217Special Duty Bomber 73.899 8.68693 8.5069 <.0001* 0.041848 0.034292 0.049064UAV/Drone Bomber 33.682 5.84314 5.7644 <.0001* 0.023018 0.009908 0.048656UAV/Drone Reconnaissance 32.038 6.64731 4.8197 <.0001* 0.018932 0.006126 0.045142Transport/Tanker Fighter/Attack 25.952 12.82103 2.0242 0.3991 0.00384 -0.001851 0.009598UAV/Drone Fighter/Attack 23.434 14.49516 1.6167 0.6715 0.00827 -0.00574 0.026326Reconnaissance Bomber 19.759 6.80497 2.9036 0.0568 0.003071 -0.000082 0.006932UAV/Drone Transport/Tanker 16.552 16.57485 0.9986 0.9545 0.005152 -0.010362 0.021093UAV/Drone Special Duty -11.466 9.61376 -1.1927 0.8972 -0.009097 -0.028726 0.010215UAV/Drone Trainer -59.519 7.93649 -7.4994 <.0001* -0.210291 -0.253237 -0.154505Transport/Tanker Special Duty -65.166 12.20151 -5.3408 <.0001* -0.015868 -0.024577 -0.007397Reconnaissance Fighter/Attack -89.288 11.54732 -7.7323 <.0001* -0.014307 -0.020135 -0.008389Transport/Tanker Trainer -172.446 12.34469 -13.9692 <.0001* -0.218487 -0.242215 -0.189156
Level Bomber Fighter/Attack Reconnaissance Special Duty Trainer Transport/Tanker UAV/Drone1.0 Unit Level Manpower 4 3 2 5 6 3 12.0 Unit Operations 2 4 4 4 6 5 33.0 Maintenance 4 3 3 5 5 6 34.0 Sustaining Support 5 4 2 5 5 4 55.0 Continuing System Improvements 4 2 1 2 4 2 06.0 Indirect Support 5 4 5 5 6 4 3Total 24 20 17 26 32 24 15
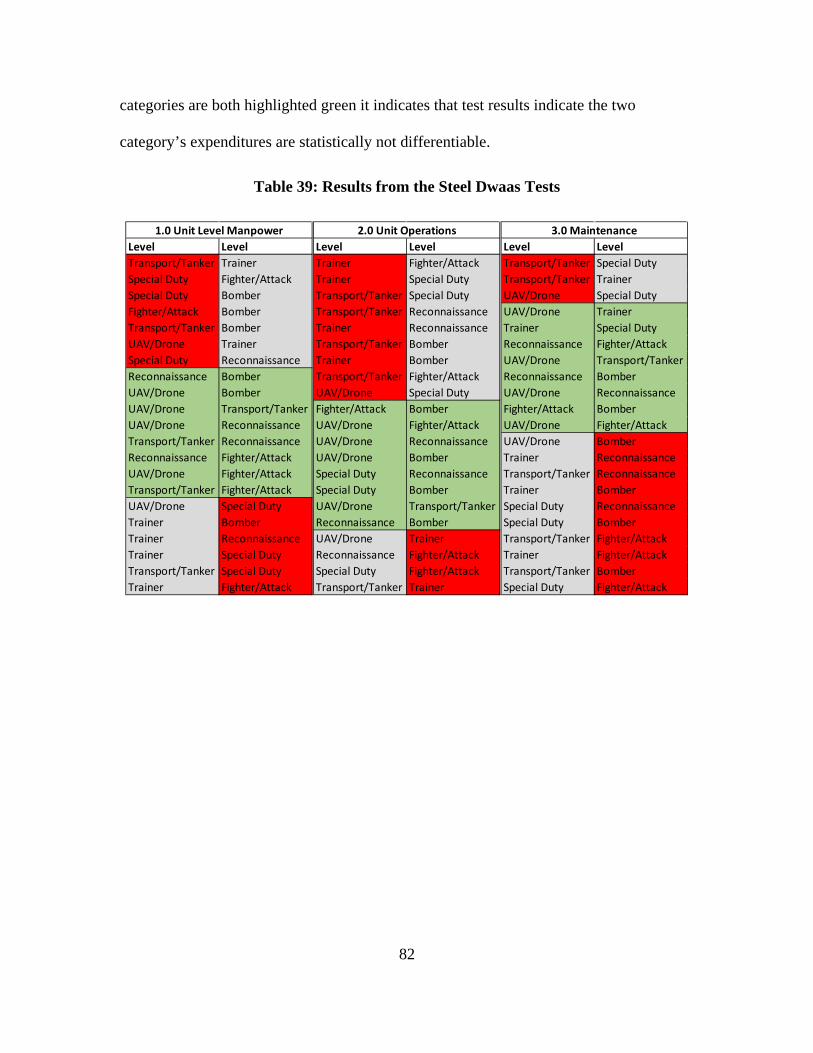
82
categories are both highlighted green it indicates that test results indicate the two
category’s expenditures are statistically not differentiable.
Table 39: Results from the Steel Dwaas Tests
Level LevelTransport/Tanker TrainerSpecial Duty Fighter/AttackSpecial Duty BomberFighter/Attack BomberTransport/Tanker BomberUAV/Drone TrainerSpecial Duty ReconnaissanceReconnaissance BomberUAV/Drone BomberUAV/Drone Transport/TankerUAV/Drone ReconnaissanceTransport/Tanker ReconnaissanceReconnaissance Fighter/AttackUAV/Drone Fighter/AttackTransport/Tanker Fighter/AttackUAV/Drone Special DutyTrainer BomberTrainer ReconnaissanceTrainer Special DutyTransport/Tanker Special DutyTrainer Fighter/Attack
1.0 Unit Level ManpowerLevel LevelTrainer Fighter/AttackTrainer Special DutyTransport/Tanker Special DutyTransport/Tanker ReconnaissanceTrainer ReconnaissanceTransport/Tanker BomberTrainer BomberTransport/Tanker Fighter/AttackUAV/Drone Special DutyFighter/Attack BomberUAV/Drone Fighter/AttackUAV/Drone ReconnaissanceUAV/Drone BomberSpecial Duty ReconnaissanceSpecial Duty BomberUAV/Drone Transport/TankerReconnaissance BomberUAV/Drone TrainerReconnaissance Fighter/AttackSpecial Duty Fighter/AttackTransport/Tanker Trainer
2.0 Unit OperationsLevel LevelTransport/Tanker Special DutyTransport/Tanker TrainerUAV/Drone Special DutyUAV/Drone TrainerTrainer Special DutyReconnaissance Fighter/AttackUAV/Drone Transport/TankerReconnaissance BomberUAV/Drone ReconnaissanceFighter/Attack BomberUAV/Drone Fighter/AttackUAV/Drone BomberTrainer ReconnaissanceTransport/Tanker ReconnaissanceTrainer BomberSpecial Duty ReconnaissanceSpecial Duty BomberTransport/Tanker Fighter/AttackTrainer Fighter/AttackTransport/Tanker BomberSpecial Duty Fighter/Attack
3.0 Maintenance
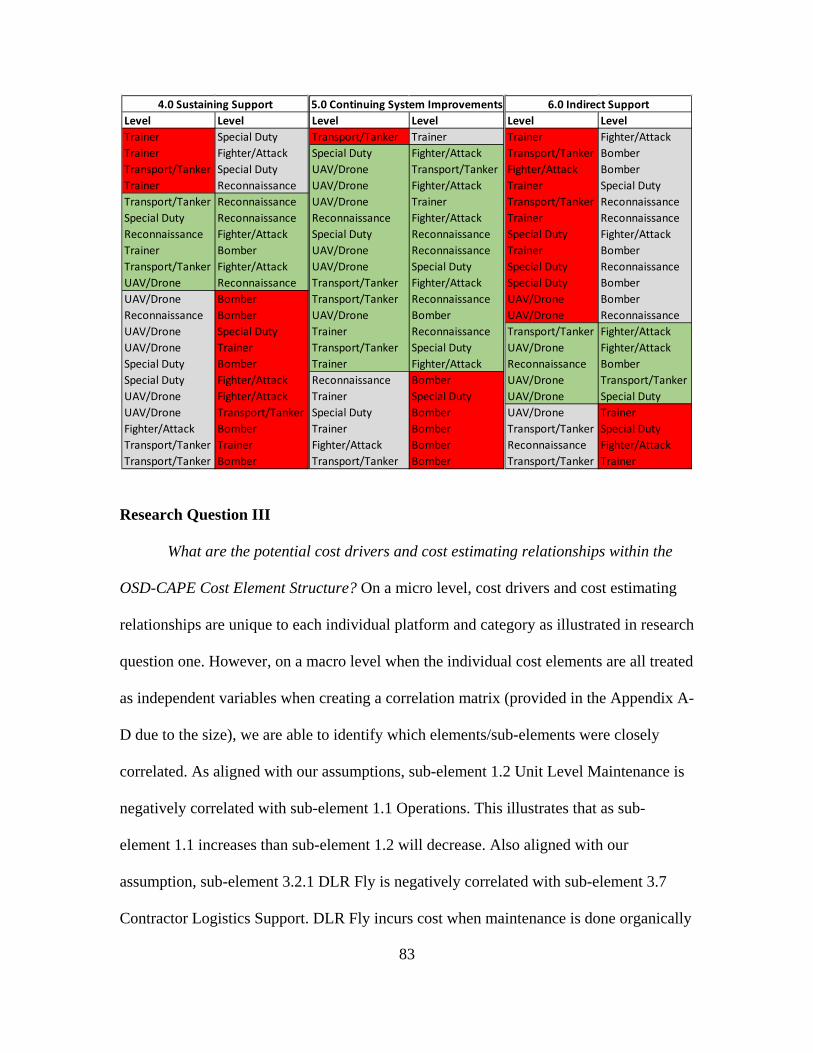
83
Research Question III
What are the potential cost drivers and cost estimating relationships within the
OSD-CAPE Cost Element Structure? On a micro level, cost drivers and cost estimating
relationships are unique to each individual platform and category as illustrated in research
question one. However, on a macro level when the individual cost elements are all treated
as independent variables when creating a correlation matrix (provided in the Appendix A-
D due to the size), we are able to identify which elements/sub-elements were closely
correlated. As aligned with our assumptions, sub-element 1.2 Unit Level Maintenance is
negatively correlated with sub-element 1.1 Operations. This illustrates that as sub-
element 1.1 increases than sub-element 1.2 will decrease. Also aligned with our
assumption, sub-element 3.2.1 DLR Fly is negatively correlated with sub-element 3.7
Contractor Logistics Support. DLR Fly incurs cost when maintenance is done organically
Level LevelTrainer Special DutyTrainer Fighter/AttackTransport/Tanker Special DutyTrainer ReconnaissanceTransport/Tanker ReconnaissanceSpecial Duty ReconnaissanceReconnaissance Fighter/AttackTrainer BomberTransport/Tanker Fighter/AttackUAV/Drone ReconnaissanceUAV/Drone BomberReconnaissance BomberUAV/Drone Special DutyUAV/Drone TrainerSpecial Duty BomberSpecial Duty Fighter/AttackUAV/Drone Fighter/AttackUAV/Drone Transport/TankerFighter/Attack BomberTransport/Tanker TrainerTransport/Tanker Bomber
4.0 Sustaining SupportLevel LevelTransport/Tanker TrainerSpecial Duty Fighter/AttackUAV/Drone Transport/TankerUAV/Drone Fighter/AttackUAV/Drone TrainerReconnaissance Fighter/AttackSpecial Duty ReconnaissanceUAV/Drone ReconnaissanceUAV/Drone Special DutyTransport/Tanker Fighter/AttackTransport/Tanker ReconnaissanceUAV/Drone BomberTrainer ReconnaissanceTransport/Tanker Special DutyTrainer Fighter/AttackReconnaissance BomberTrainer Special DutySpecial Duty BomberTrainer BomberFighter/Attack BomberTransport/Tanker Bomber
5.0 Continuing System ImprovementsLevel LevelTrainer Fighter/AttackTransport/Tanker BomberFighter/Attack BomberTrainer Special DutyTransport/Tanker ReconnaissanceTrainer ReconnaissanceSpecial Duty Fighter/AttackTrainer BomberSpecial Duty ReconnaissanceSpecial Duty BomberUAV/Drone BomberUAV/Drone ReconnaissanceTransport/Tanker Fighter/AttackUAV/Drone Fighter/AttackReconnaissance BomberUAV/Drone Transport/TankerUAV/Drone Special DutyUAV/Drone TrainerTransport/Tanker Special DutyReconnaissance Fighter/AttackTransport/Tanker Trainer
6.0 Indirect Support
84
at the unit level by “blue suiters”, however Contractor Logistics Support incurs cost when
the maintenance is contracted out to a third party. Therefore, if sub-element 3.7 is
incurring substantial cost than the weapon system is most likely not going to incur cost in
sub-element 3.2.1, unless the weapon system is both maintained organically and
contractor support. The most correlated relationship is sub-element 6.1 Installation
Support to sub-element 6.3 General Training & Education at -.96. The only sub-element
that is correlated to a level one element is 3.4.2 Missile Overhaul/Rework Depot Repair
which is correlated to element 6.0 Indirect Support at .72. However, there is no clear
reason for the correlation therefore it could be a spurious relationship with no direct
casual connection.
Summary
This chapter outlines the results of the research questions. It provides the results
from the descriptive statistics methods and statistical tests that were outlined in the third
chapter. First it shows the mean/median/quartile ranges for all categories and platforms.
Followed by the results of the Kruskal-Wallis and Steel Dwaas tests that identified the
categories that were statistically different when compared to each other. Lastly, it
provided insight into the correlations between elements and sub-elements. Chapter Five
utilizes these results presented in Chapter Four to derive our conclusion.
85
Chapter V: Conclusions
Chapter Overview
The purpose of this chapter is to provide the conclusions to the three research
questions and our recommendations regarding each. The chapter also outlines the
importance from the findings and how the findings can benefit the acquisition and cost
analysis community. The major findings include the characterization of the different
aircraft categories and platforms based on the OSD-CAPE Cost Element Structure (CES),
the statistical comparisons between the aircraft categories, and some insight into the
correlations between the cost elements/sub-elements.
Research Question I
Question one is the driving research question into investigating the cost
expenditures within the OSD-CAPE CES for the various aircraft categories and
platforms. As illustrated in chapter four and the graphs/tables regarding the individual
aircraft platforms and categories, the individual platforms within a category vary greatly
from one another. Therefore, for example, when creating an analogy based estimate it is
important to identify the most similar aircraft within the category. The variability of the
data also show that these aircrafts are more unique than originally assumed prior to this
research. Our assumption when starting this thesis was that aircrafts within the same
category should be similar with small variability, however as noted in the results for the
various categories, specifically the bomber category, aircrafts within the same category
are sometimes on the opposite ends of the spectrum.
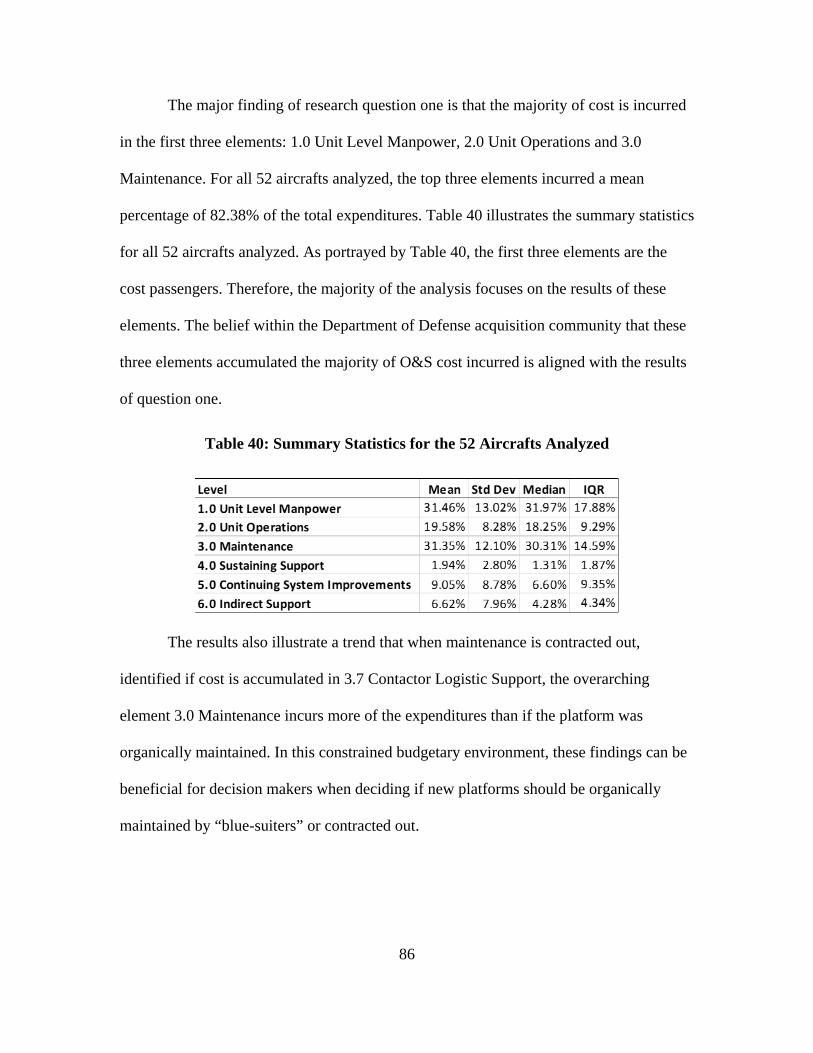
86
The major finding of research question one is that the majority of cost is incurred
in the first three elements: 1.0 Unit Level Manpower, 2.0 Unit Operations and 3.0
Maintenance. For all 52 aircrafts analyzed, the top three elements incurred a mean
percentage of 82.38% of the total expenditures. Table 40 illustrates the summary statistics
for all 52 aircrafts analyzed. As portrayed by Table 40, the first three elements are the
cost passengers. Therefore, the majority of the analysis focuses on the results of these
elements. The belief within the Department of Defense acquisition community that these
three elements accumulated the majority of O&S cost incurred is aligned with the results
of question one.
Table 40: Summary Statistics for the 52 Aircrafts Analyzed
The results also illustrate a trend that when maintenance is contracted out,
identified if cost is accumulated in 3.7 Contactor Logistic Support, the overarching
element 3.0 Maintenance incurs more of the expenditures than if the platform was
organically maintained. In this constrained budgetary environment, these findings can be
beneficial for decision makers when deciding if new platforms should be organically
maintained by “blue-suiters” or contracted out.
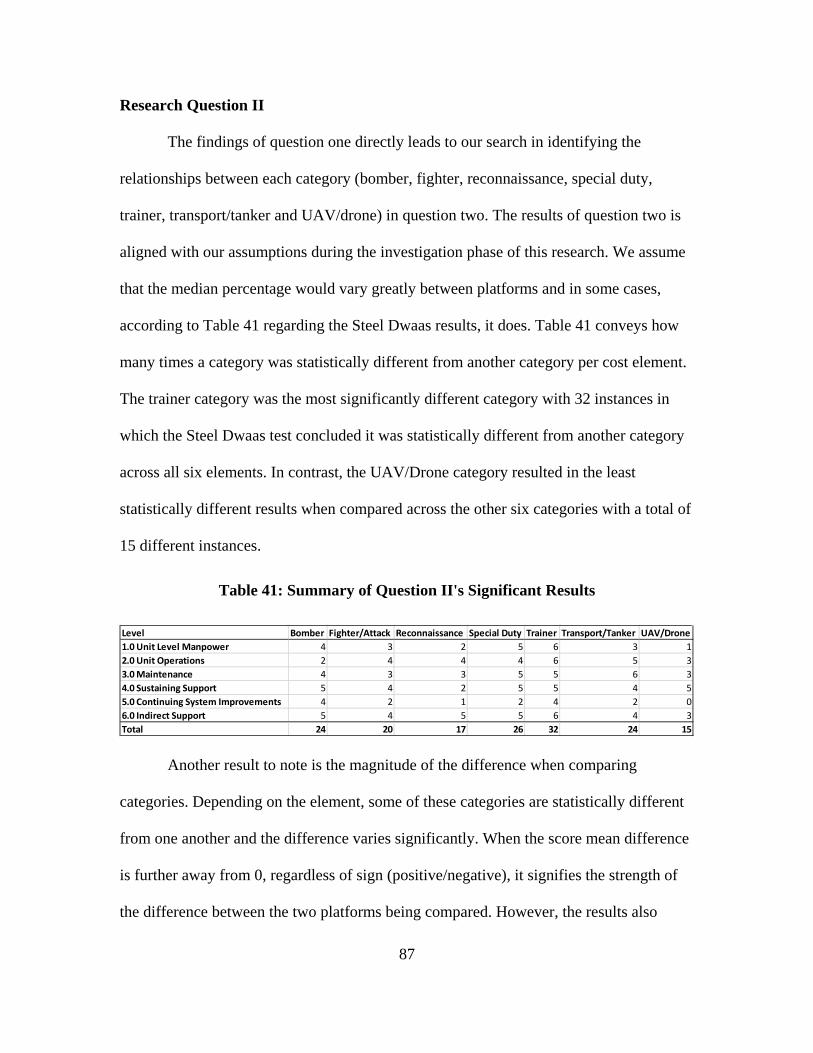
87
Research Question II
The findings of question one directly leads to our search in identifying the
relationships between each category (bomber, fighter, reconnaissance, special duty,
trainer, transport/tanker and UAV/drone) in question two. The results of question two is
aligned with our assumptions during the investigation phase of this research. We assume
that the median percentage would vary greatly between platforms and in some cases,
according to Table 41 regarding the Steel Dwaas results, it does. Table 41 conveys how
many times a category was statistically different from another category per cost element.
The trainer category was the most significantly different category with 32 instances in
which the Steel Dwaas test concluded it was statistically different from another category
across all six elements. In contrast, the UAV/Drone category resulted in the least
statistically different results when compared across the other six categories with a total of
15 different instances.
Table 41: Summary of Question II's Significant Results
Another result to note is the magnitude of the difference when comparing
categories. Depending on the element, some of these categories are statistically different
from one another and the difference varies significantly. When the score mean difference
is further away from 0, regardless of sign (positive/negative), it signifies the strength of
the difference between the two platforms being compared. However, the results also
Level Bomber Fighter/Attack Reconnaissance Special Duty Trainer Transport/Tanker UAV/Drone1.0 Unit Level Manpower 4 3 2 5 6 3 12.0 Unit Operations 2 4 4 4 6 5 33.0 Maintenance 4 3 3 5 5 6 34.0 Sustaining Support 5 4 2 5 5 4 55.0 Continuing System Improvements 4 2 1 2 4 2 06.0 Indirect Support 5 4 5 5 6 4 3Total 24 20 17 26 32 24 15
88
outline the similarities between different categories. These findings are valuable to cost
estimators regardless of program office. The intent of this question is to enable cost
estimators to have a baseline comparison when creating estimates. For example, in some
cases highlighted in the Wilcoxon-Man-Whitney test for Element 1.0 Unit Level
Manpower, the UAV/drone category incurs cost very similarly to the transport/tanker
category. Therefore, if needed, one program office can contact the other to seek advice if
a problem was to occur during the estimation process, adding an additional outlet for
guidance and educational purposes.
Research Question III
The results from question three were not as fruitful as originally anticipated.
Before the research began, one of our assumptions followed the idea that cost sub-
elements could potentially have cost estimating relationships and significant correlations
with the other overarching level one elements. This thought led to the belief that certain
elements can be used as metrics for sub-elements. However, only a few significant
correlations were found. In these cases where correlations are present, the majority of
these correlations are expected given the relationship of the CES. For example, as stated
in chapter four, sub-element 1.2 Unit Level Maintenance is negatively correlated with
sub-element 1.1 Operations. This conveys that the more 1.1 incurs in expenditures the
less 1.2 incurs. Therefore, these findings are not as useful as originally anticipated.
According to the correlation table, no sub-element (level two or level three) is
significantly correlated to any of the six-overarching level one elements.
89
Significance of Research
This research provides decision makers and cost estimators a better understanding
on where within the OSD-CAPE CES the expenditures truly lie for the various categories
and platforms. Also, where within the CES the majority of the cost exists. Through
referencing the variability of each category, cost estimators have a more realistic picture
of how different the platforms within a category are from one another. Lastly, this
research could benefit cost estimators across the various program offices in the Air Force
by understanding how their specific program incurs cost and how it relates to the other
programs Air Force wide. Only when cost estimators truly understand how these
platforms incur costs can we achieve more efficient ways to estimate and cut costs in this
limited resource environment.
Limitations
One of the first limitations is the accuracy of the data set. The data set was pulled
from the Air Force Total Ownership Cost (AFTOC) database however some costs were
zeroed out for no identifiable reason. For example, the WC-130H, from the years 1996-
1998 did not incur any costs in 1.0 Unit Level Manpower. However, the aircraft incurred
flying hours during these years which undoubtedly requires manpower. Therefore,
during the investigation process we had to exclude those years. Another limitation is the
inconsistency of the number of platforms investigated for each category. The more data
the more reliable the results are. However, the UAV/drone only had two platforms, the
bomber category had three platforms, while the fighter and transport/tanker categories
each had fifteen and fourteen platforms respectfully. This limitation is due to the
90
availability in the Air Force arsenal. In the years to come, when more UAV/drones are in
the arsenal, cost estimators will have more information and more data to get a better
indicator of where the cost is truly incurred within the CES. Lastly, when a platform is
either being phased-in or phased-out, the costs act sporadically. Therefore, the results for
the platforms being phased in (F-35A, A-10C and MQ-9A etc.) act differently than
platforms that have reached stability. The data for the various other stable platforms
illustrate a small standard deviation between a single element year to year while
platforms being phased in/out have large variability from year to year.
Recommendations for Future Research
Multiple avenues for future research can be taken to continue on this research into
the investigation of cost expenditures within the OSD-CAPE Cost Element Structure.
First, some platforms within the same category vary greatly from one another per CES.
We recommend an investigation into the root differences between these platforms due to
the belief it would help cost estimators and decision makers alike. Deriving the
conclusions on why this variability occurs can supplements this research and the results
of this thesis because we identified the descriptive statistics for the various platforms and
categories however did not deeply investigate into the reasoning of the variability.
Second, we suggest future researchers perform a deeper investigation into Cost
Estimating Relationships (CERs) as highlighted in question three. Perhaps a regression
model to derive CERs can potentially lead to significant findings. Lastly, an investigation
into why certain categories and platforms incur cost differently. For example, element 1.0
Unit Level Manpower for special duty category incurs 42.82% of the total expenditures
91
while the trainer category incurs only 10.13% of total expenditures for manpower. An
investigation to why this is could be beneficial to cost estimators, stakeholders, and
decision-makers alike.
Summary
The descriptive statistics and statistical significant results that were derived from
the investigation into the cost incurred within the OSD-CAPE Cost Element Structure are
beneficial to all stakeholders within the cost estimating community. Though AFTOC was
established in 1996, the exploration into the descriptive statistics based on the OSD-
CAPE CES is nonexistent to date. Therefore, these findings are instrumental in
establishing baselines for various categories and platforms based on the data.
In order to understand the complexity of cost estimating each weapon system, the
DoD and other stakeholders must understand where the true cost lies within each
platform and category. The data needed to understand the true actual costs and the
relationships within the expenditures for each platform are present within AFTOC.
Utilizing AFTOC to study the historical cost to predict the future costs of our weapon
systems will serve essential for cost estimators and stakeholders alike. In today’s
environment, weapon systems continue to grow in price and costs while the budget for
our nation’s defense is continuing to decline. Therefore, understanding and investigating
the information provided about our arsenal is more essential now than ever before.
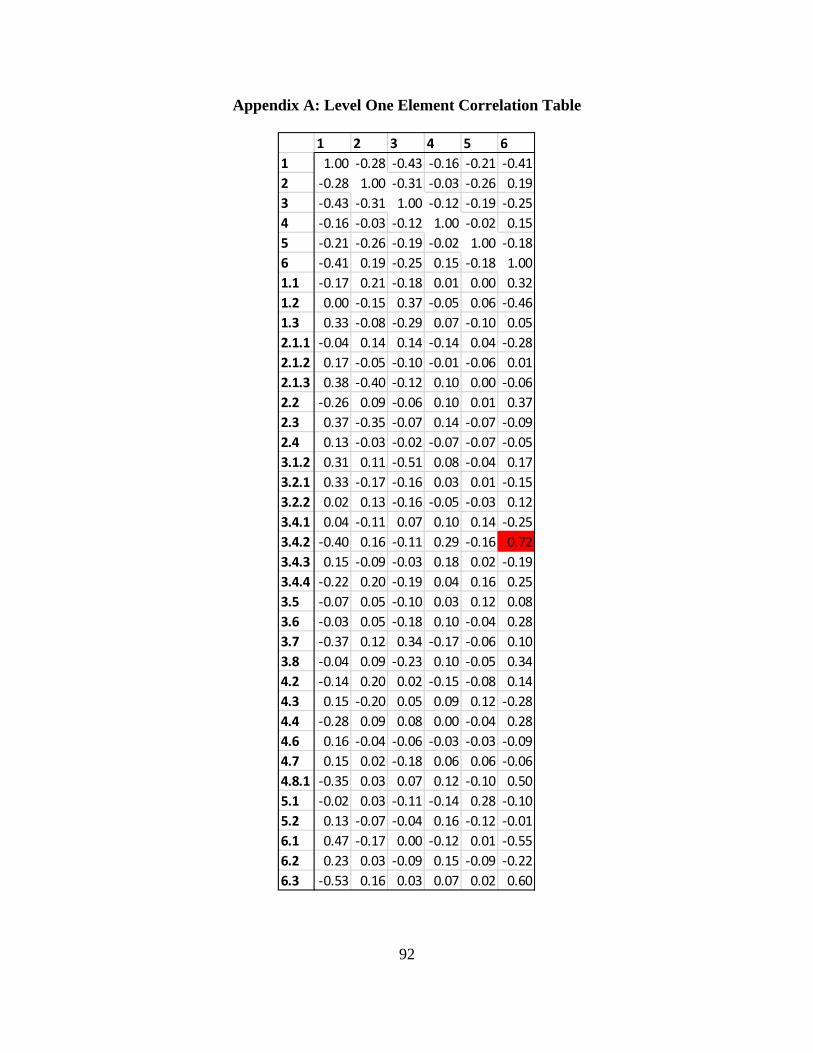
92
Appendix A: Level One Element Correlation Table
1 2 3 4 5 61 1.00 -0.28 -0.43 -0.16 -0.21 -0.412 -0.28 1.00 -0.31 -0.03 -0.26 0.193 -0.43 -0.31 1.00 -0.12 -0.19 -0.254 -0.16 -0.03 -0.12 1.00 -0.02 0.155 -0.21 -0.26 -0.19 -0.02 1.00 -0.186 -0.41 0.19 -0.25 0.15 -0.18 1.001.1 -0.17 0.21 -0.18 0.01 0.00 0.321.2 0.00 -0.15 0.37 -0.05 0.06 -0.461.3 0.33 -0.08 -0.29 0.07 -0.10 0.052.1.1 -0.04 0.14 0.14 -0.14 0.04 -0.282.1.2 0.17 -0.05 -0.10 -0.01 -0.06 0.012.1.3 0.38 -0.40 -0.12 0.10 0.00 -0.062.2 -0.26 0.09 -0.06 0.10 0.01 0.372.3 0.37 -0.35 -0.07 0.14 -0.07 -0.092.4 0.13 -0.03 -0.02 -0.07 -0.07 -0.053.1.2 0.31 0.11 -0.51 0.08 -0.04 0.173.2.1 0.33 -0.17 -0.16 0.03 0.01 -0.153.2.2 0.02 0.13 -0.16 -0.05 -0.03 0.123.4.1 0.04 -0.11 0.07 0.10 0.14 -0.253.4.2 -0.40 0.16 -0.11 0.29 -0.16 0.723.4.3 0.15 -0.09 -0.03 0.18 0.02 -0.193.4.4 -0.22 0.20 -0.19 0.04 0.16 0.253.5 -0.07 0.05 -0.10 0.03 0.12 0.083.6 -0.03 0.05 -0.18 0.10 -0.04 0.283.7 -0.37 0.12 0.34 -0.17 -0.06 0.103.8 -0.04 0.09 -0.23 0.10 -0.05 0.344.2 -0.14 0.20 0.02 -0.15 -0.08 0.144.3 0.15 -0.20 0.05 0.09 0.12 -0.284.4 -0.28 0.09 0.08 0.00 -0.04 0.284.6 0.16 -0.04 -0.06 -0.03 -0.03 -0.094.7 0.15 0.02 -0.18 0.06 0.06 -0.064.8.1 -0.35 0.03 0.07 0.12 -0.10 0.505.1 -0.02 0.03 -0.11 -0.14 0.28 -0.105.2 0.13 -0.07 -0.04 0.16 -0.12 -0.016.1 0.47 -0.17 0.00 -0.12 0.01 -0.556.2 0.23 0.03 -0.09 0.15 -0.09 -0.226.3 -0.53 0.16 0.03 0.07 0.02 0.60
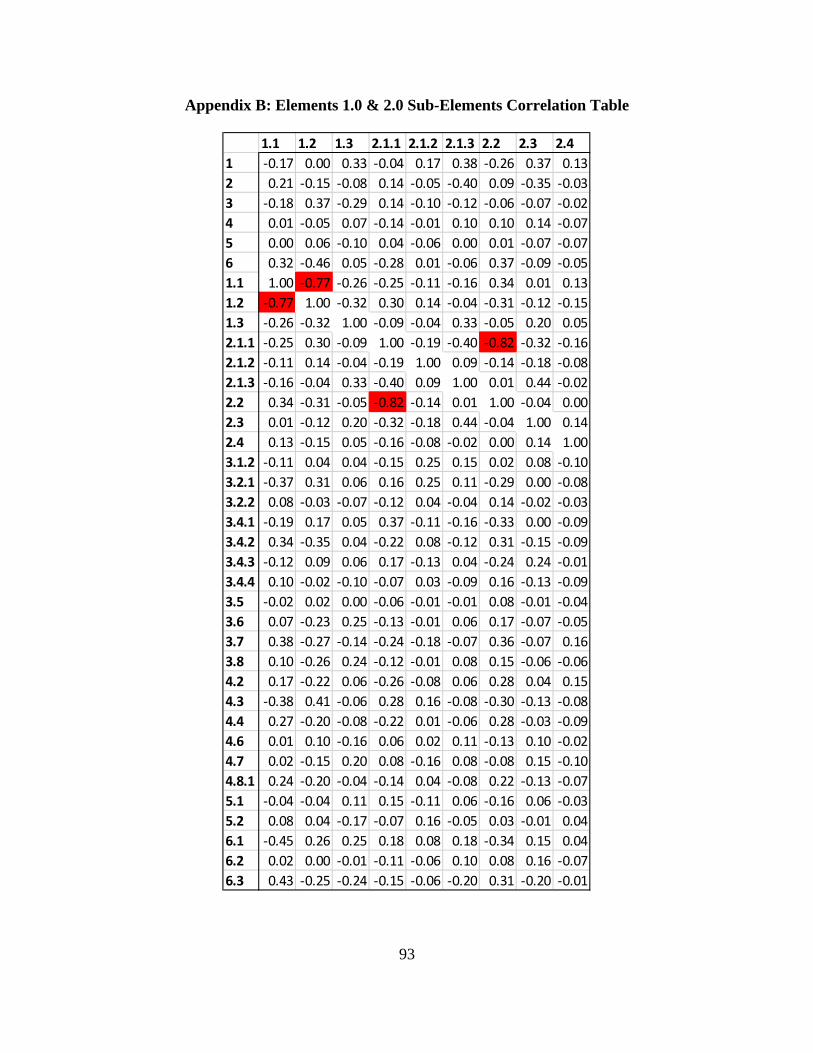
93
Appendix B: Elements 1.0 & 2.0 Sub-Elements Correlation Table
1.1 1.2 1.3 2.1.1 2.1.2 2.1.3 2.2 2.3 2.41 -0.17 0.00 0.33 -0.04 0.17 0.38 -0.26 0.37 0.132 0.21 -0.15 -0.08 0.14 -0.05 -0.40 0.09 -0.35 -0.033 -0.18 0.37 -0.29 0.14 -0.10 -0.12 -0.06 -0.07 -0.024 0.01 -0.05 0.07 -0.14 -0.01 0.10 0.10 0.14 -0.075 0.00 0.06 -0.10 0.04 -0.06 0.00 0.01 -0.07 -0.076 0.32 -0.46 0.05 -0.28 0.01 -0.06 0.37 -0.09 -0.051.1 1.00 -0.77 -0.26 -0.25 -0.11 -0.16 0.34 0.01 0.131.2 -0.77 1.00 -0.32 0.30 0.14 -0.04 -0.31 -0.12 -0.151.3 -0.26 -0.32 1.00 -0.09 -0.04 0.33 -0.05 0.20 0.052.1.1 -0.25 0.30 -0.09 1.00 -0.19 -0.40 -0.82 -0.32 -0.162.1.2 -0.11 0.14 -0.04 -0.19 1.00 0.09 -0.14 -0.18 -0.082.1.3 -0.16 -0.04 0.33 -0.40 0.09 1.00 0.01 0.44 -0.022.2 0.34 -0.31 -0.05 -0.82 -0.14 0.01 1.00 -0.04 0.002.3 0.01 -0.12 0.20 -0.32 -0.18 0.44 -0.04 1.00 0.142.4 0.13 -0.15 0.05 -0.16 -0.08 -0.02 0.00 0.14 1.003.1.2 -0.11 0.04 0.04 -0.15 0.25 0.15 0.02 0.08 -0.103.2.1 -0.37 0.31 0.06 0.16 0.25 0.11 -0.29 0.00 -0.083.2.2 0.08 -0.03 -0.07 -0.12 0.04 -0.04 0.14 -0.02 -0.033.4.1 -0.19 0.17 0.05 0.37 -0.11 -0.16 -0.33 0.00 -0.093.4.2 0.34 -0.35 0.04 -0.22 0.08 -0.12 0.31 -0.15 -0.093.4.3 -0.12 0.09 0.06 0.17 -0.13 0.04 -0.24 0.24 -0.013.4.4 0.10 -0.02 -0.10 -0.07 0.03 -0.09 0.16 -0.13 -0.093.5 -0.02 0.02 0.00 -0.06 -0.01 -0.01 0.08 -0.01 -0.043.6 0.07 -0.23 0.25 -0.13 -0.01 0.06 0.17 -0.07 -0.053.7 0.38 -0.27 -0.14 -0.24 -0.18 -0.07 0.36 -0.07 0.163.8 0.10 -0.26 0.24 -0.12 -0.01 0.08 0.15 -0.06 -0.064.2 0.17 -0.22 0.06 -0.26 -0.08 0.06 0.28 0.04 0.154.3 -0.38 0.41 -0.06 0.28 0.16 -0.08 -0.30 -0.13 -0.084.4 0.27 -0.20 -0.08 -0.22 0.01 -0.06 0.28 -0.03 -0.094.6 0.01 0.10 -0.16 0.06 0.02 0.11 -0.13 0.10 -0.024.7 0.02 -0.15 0.20 0.08 -0.16 0.08 -0.08 0.15 -0.104.8.1 0.24 -0.20 -0.04 -0.14 0.04 -0.08 0.22 -0.13 -0.075.1 -0.04 -0.04 0.11 0.15 -0.11 0.06 -0.16 0.06 -0.035.2 0.08 0.04 -0.17 -0.07 0.16 -0.05 0.03 -0.01 0.046.1 -0.45 0.26 0.25 0.18 0.08 0.18 -0.34 0.15 0.046.2 0.02 0.00 -0.01 -0.11 -0.06 0.10 0.08 0.16 -0.076.3 0.43 -0.25 -0.24 -0.15 -0.06 -0.20 0.31 -0.20 -0.01
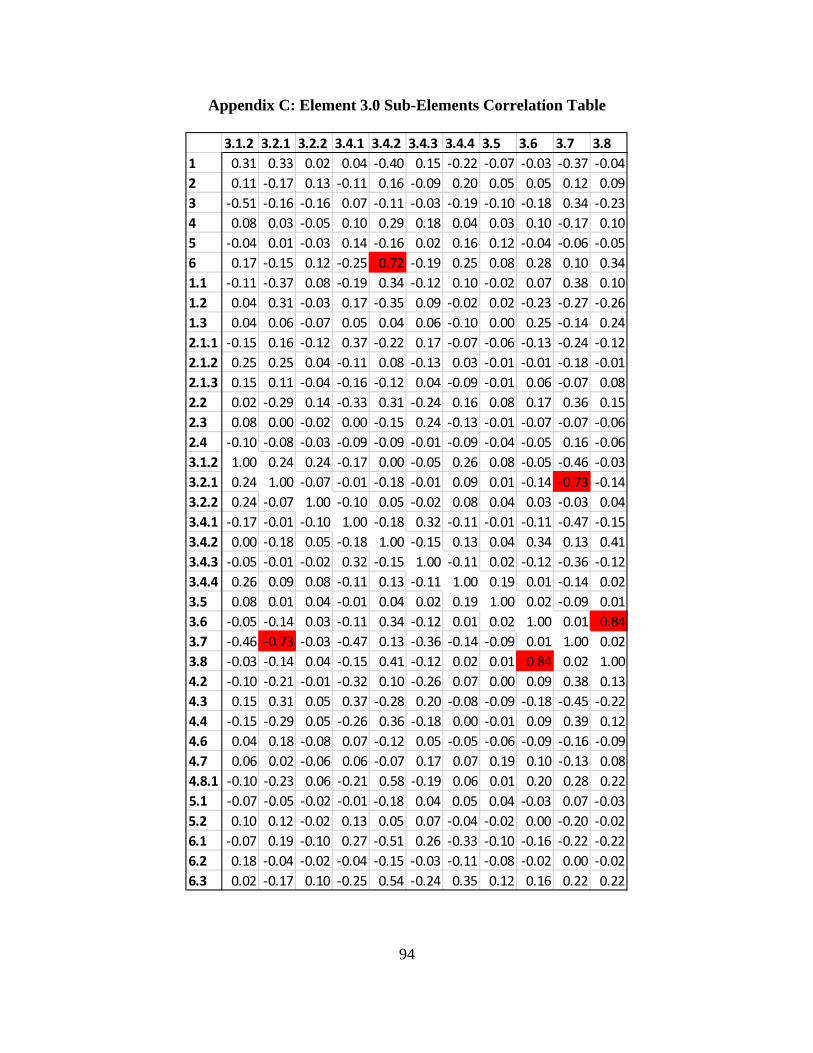
94
Appendix C: Element 3.0 Sub-Elements Correlation Table
3.1.2 3.2.1 3.2.2 3.4.1 3.4.2 3.4.3 3.4.4 3.5 3.6 3.7 3.81 0.31 0.33 0.02 0.04 -0.40 0.15 -0.22 -0.07 -0.03 -0.37 -0.042 0.11 -0.17 0.13 -0.11 0.16 -0.09 0.20 0.05 0.05 0.12 0.093 -0.51 -0.16 -0.16 0.07 -0.11 -0.03 -0.19 -0.10 -0.18 0.34 -0.234 0.08 0.03 -0.05 0.10 0.29 0.18 0.04 0.03 0.10 -0.17 0.105 -0.04 0.01 -0.03 0.14 -0.16 0.02 0.16 0.12 -0.04 -0.06 -0.056 0.17 -0.15 0.12 -0.25 0.72 -0.19 0.25 0.08 0.28 0.10 0.341.1 -0.11 -0.37 0.08 -0.19 0.34 -0.12 0.10 -0.02 0.07 0.38 0.101.2 0.04 0.31 -0.03 0.17 -0.35 0.09 -0.02 0.02 -0.23 -0.27 -0.261.3 0.04 0.06 -0.07 0.05 0.04 0.06 -0.10 0.00 0.25 -0.14 0.242.1.1 -0.15 0.16 -0.12 0.37 -0.22 0.17 -0.07 -0.06 -0.13 -0.24 -0.122.1.2 0.25 0.25 0.04 -0.11 0.08 -0.13 0.03 -0.01 -0.01 -0.18 -0.012.1.3 0.15 0.11 -0.04 -0.16 -0.12 0.04 -0.09 -0.01 0.06 -0.07 0.082.2 0.02 -0.29 0.14 -0.33 0.31 -0.24 0.16 0.08 0.17 0.36 0.152.3 0.08 0.00 -0.02 0.00 -0.15 0.24 -0.13 -0.01 -0.07 -0.07 -0.062.4 -0.10 -0.08 -0.03 -0.09 -0.09 -0.01 -0.09 -0.04 -0.05 0.16 -0.063.1.2 1.00 0.24 0.24 -0.17 0.00 -0.05 0.26 0.08 -0.05 -0.46 -0.033.2.1 0.24 1.00 -0.07 -0.01 -0.18 -0.01 0.09 0.01 -0.14 -0.73 -0.143.2.2 0.24 -0.07 1.00 -0.10 0.05 -0.02 0.08 0.04 0.03 -0.03 0.043.4.1 -0.17 -0.01 -0.10 1.00 -0.18 0.32 -0.11 -0.01 -0.11 -0.47 -0.153.4.2 0.00 -0.18 0.05 -0.18 1.00 -0.15 0.13 0.04 0.34 0.13 0.413.4.3 -0.05 -0.01 -0.02 0.32 -0.15 1.00 -0.11 0.02 -0.12 -0.36 -0.123.4.4 0.26 0.09 0.08 -0.11 0.13 -0.11 1.00 0.19 0.01 -0.14 0.023.5 0.08 0.01 0.04 -0.01 0.04 0.02 0.19 1.00 0.02 -0.09 0.013.6 -0.05 -0.14 0.03 -0.11 0.34 -0.12 0.01 0.02 1.00 0.01 0.843.7 -0.46 -0.73 -0.03 -0.47 0.13 -0.36 -0.14 -0.09 0.01 1.00 0.023.8 -0.03 -0.14 0.04 -0.15 0.41 -0.12 0.02 0.01 0.84 0.02 1.004.2 -0.10 -0.21 -0.01 -0.32 0.10 -0.26 0.07 0.00 0.09 0.38 0.134.3 0.15 0.31 0.05 0.37 -0.28 0.20 -0.08 -0.09 -0.18 -0.45 -0.224.4 -0.15 -0.29 0.05 -0.26 0.36 -0.18 0.00 -0.01 0.09 0.39 0.124.6 0.04 0.18 -0.08 0.07 -0.12 0.05 -0.05 -0.06 -0.09 -0.16 -0.094.7 0.06 0.02 -0.06 0.06 -0.07 0.17 0.07 0.19 0.10 -0.13 0.084.8.1 -0.10 -0.23 0.06 -0.21 0.58 -0.19 0.06 0.01 0.20 0.28 0.225.1 -0.07 -0.05 -0.02 -0.01 -0.18 0.04 0.05 0.04 -0.03 0.07 -0.035.2 0.10 0.12 -0.02 0.13 0.05 0.07 -0.04 -0.02 0.00 -0.20 -0.026.1 -0.07 0.19 -0.10 0.27 -0.51 0.26 -0.33 -0.10 -0.16 -0.22 -0.226.2 0.18 -0.04 -0.02 -0.04 -0.15 -0.03 -0.11 -0.08 -0.02 0.00 -0.026.3 0.02 -0.17 0.10 -0.25 0.54 -0.24 0.35 0.12 0.16 0.22 0.22
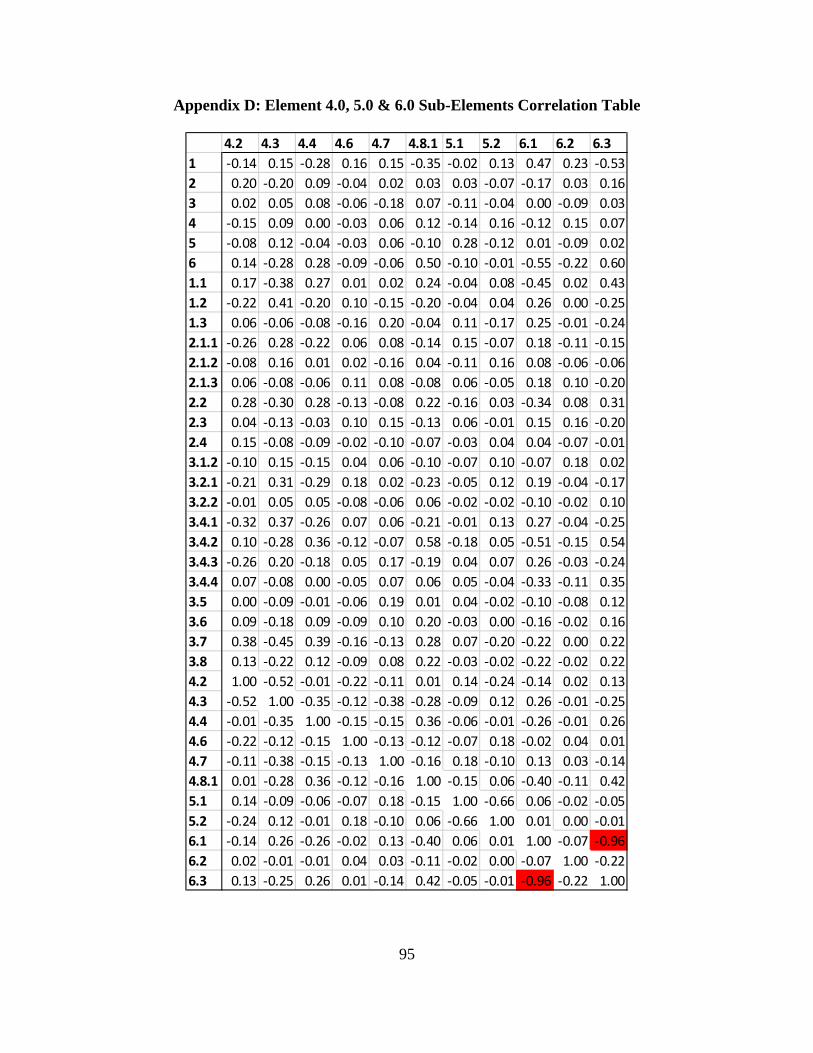
95
Appendix D: Element 4.0, 5.0 & 6.0 Sub-Elements Correlation Table
4.2 4.3 4.4 4.6 4.7 4.8.1 5.1 5.2 6.1 6.2 6.31 -0.14 0.15 -0.28 0.16 0.15 -0.35 -0.02 0.13 0.47 0.23 -0.532 0.20 -0.20 0.09 -0.04 0.02 0.03 0.03 -0.07 -0.17 0.03 0.163 0.02 0.05 0.08 -0.06 -0.18 0.07 -0.11 -0.04 0.00 -0.09 0.034 -0.15 0.09 0.00 -0.03 0.06 0.12 -0.14 0.16 -0.12 0.15 0.075 -0.08 0.12 -0.04 -0.03 0.06 -0.10 0.28 -0.12 0.01 -0.09 0.026 0.14 -0.28 0.28 -0.09 -0.06 0.50 -0.10 -0.01 -0.55 -0.22 0.601.1 0.17 -0.38 0.27 0.01 0.02 0.24 -0.04 0.08 -0.45 0.02 0.431.2 -0.22 0.41 -0.20 0.10 -0.15 -0.20 -0.04 0.04 0.26 0.00 -0.251.3 0.06 -0.06 -0.08 -0.16 0.20 -0.04 0.11 -0.17 0.25 -0.01 -0.242.1.1 -0.26 0.28 -0.22 0.06 0.08 -0.14 0.15 -0.07 0.18 -0.11 -0.152.1.2 -0.08 0.16 0.01 0.02 -0.16 0.04 -0.11 0.16 0.08 -0.06 -0.062.1.3 0.06 -0.08 -0.06 0.11 0.08 -0.08 0.06 -0.05 0.18 0.10 -0.202.2 0.28 -0.30 0.28 -0.13 -0.08 0.22 -0.16 0.03 -0.34 0.08 0.312.3 0.04 -0.13 -0.03 0.10 0.15 -0.13 0.06 -0.01 0.15 0.16 -0.202.4 0.15 -0.08 -0.09 -0.02 -0.10 -0.07 -0.03 0.04 0.04 -0.07 -0.013.1.2 -0.10 0.15 -0.15 0.04 0.06 -0.10 -0.07 0.10 -0.07 0.18 0.023.2.1 -0.21 0.31 -0.29 0.18 0.02 -0.23 -0.05 0.12 0.19 -0.04 -0.173.2.2 -0.01 0.05 0.05 -0.08 -0.06 0.06 -0.02 -0.02 -0.10 -0.02 0.103.4.1 -0.32 0.37 -0.26 0.07 0.06 -0.21 -0.01 0.13 0.27 -0.04 -0.253.4.2 0.10 -0.28 0.36 -0.12 -0.07 0.58 -0.18 0.05 -0.51 -0.15 0.543.4.3 -0.26 0.20 -0.18 0.05 0.17 -0.19 0.04 0.07 0.26 -0.03 -0.243.4.4 0.07 -0.08 0.00 -0.05 0.07 0.06 0.05 -0.04 -0.33 -0.11 0.353.5 0.00 -0.09 -0.01 -0.06 0.19 0.01 0.04 -0.02 -0.10 -0.08 0.123.6 0.09 -0.18 0.09 -0.09 0.10 0.20 -0.03 0.00 -0.16 -0.02 0.163.7 0.38 -0.45 0.39 -0.16 -0.13 0.28 0.07 -0.20 -0.22 0.00 0.223.8 0.13 -0.22 0.12 -0.09 0.08 0.22 -0.03 -0.02 -0.22 -0.02 0.224.2 1.00 -0.52 -0.01 -0.22 -0.11 0.01 0.14 -0.24 -0.14 0.02 0.134.3 -0.52 1.00 -0.35 -0.12 -0.38 -0.28 -0.09 0.12 0.26 -0.01 -0.254.4 -0.01 -0.35 1.00 -0.15 -0.15 0.36 -0.06 -0.01 -0.26 -0.01 0.264.6 -0.22 -0.12 -0.15 1.00 -0.13 -0.12 -0.07 0.18 -0.02 0.04 0.014.7 -0.11 -0.38 -0.15 -0.13 1.00 -0.16 0.18 -0.10 0.13 0.03 -0.144.8.1 0.01 -0.28 0.36 -0.12 -0.16 1.00 -0.15 0.06 -0.40 -0.11 0.425.1 0.14 -0.09 -0.06 -0.07 0.18 -0.15 1.00 -0.66 0.06 -0.02 -0.055.2 -0.24 0.12 -0.01 0.18 -0.10 0.06 -0.66 1.00 0.01 0.00 -0.016.1 -0.14 0.26 -0.26 -0.02 0.13 -0.40 0.06 0.01 1.00 -0.07 -0.966.2 0.02 -0.01 -0.01 0.04 0.03 -0.11 -0.02 0.00 -0.07 1.00 -0.226.3 0.13 -0.25 0.26 0.01 -0.14 0.42 -0.05 -0.01 -0.96 -0.22 1.00
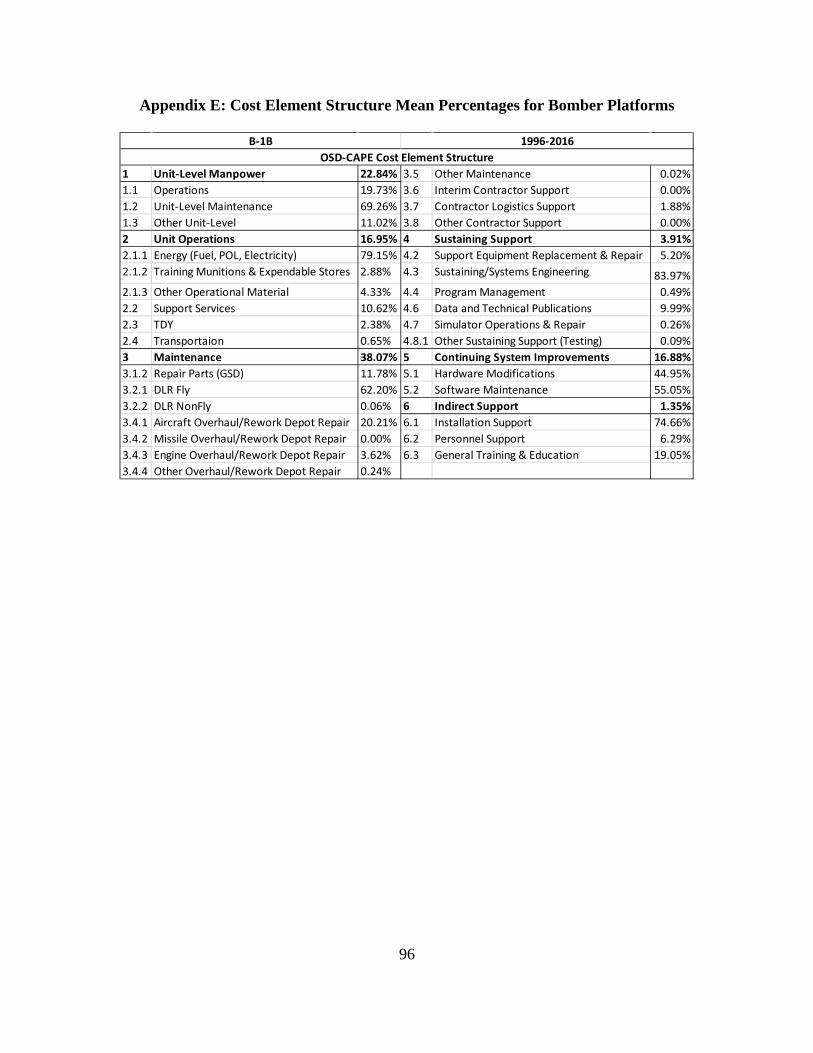
96
Appendix E: Cost Element Structure Mean Percentages for Bomber Platforms
1 Unit-Level Manpower 22.84% 3.5 Other Maintenance 0.02%1.1 Operations 19.73% 3.6 Interim Contractor Support 0.00%1.2 Unit-Level Maintenance 69.26% 3.7 Contractor Logistics Support 1.88%1.3 Other Unit-Level 11.02% 3.8 Other Contractor Support 0.00%2 Unit Operations 16.95% 4 Sustaining Support 3.91%2.1.1 Energy (Fuel, POL, Electricity) 79.15% 4.2 Support Equipment Replacement & Repair 5.20%2.1.2 Training Munitions & Expendable Stores 2.88% 4.3 Sustaining/Systems Engineering 83.97%2.1.3 Other Operational Material 4.33% 4.4 Program Management 0.49%2.2 Support Services 10.62% 4.6 Data and Technical Publications 9.99%2.3 TDY 2.38% 4.7 Simulator Operations & Repair 0.26%2.4 Transportaion 0.65% 4.8.1 Other Sustaining Support (Testing) 0.09%3 Maintenance 38.07% 5 Continuing System Improvements 16.88%3.1.2 Repair Parts (GSD) 11.78% 5.1 Hardware Modifications 44.95%3.2.1 DLR Fly 62.20% 5.2 Software Maintenance 55.05%3.2.2 DLR NonFly 0.06% 6 Indirect Support 1.35%3.4.1 Aircraft Overhaul/Rework Depot Repair 20.21% 6.1 Installation Support 74.66%3.4.2 Missile Overhaul/Rework Depot Repair 0.00% 6.2 Personnel Support 6.29%3.4.3 Engine Overhaul/Rework Depot Repair 3.62% 6.3 General Training & Education 19.05%3.4.4 Other Overhaul/Rework Depot Repair 0.24%
1996-2016B-1BOSD-CAPE Cost Element Structure
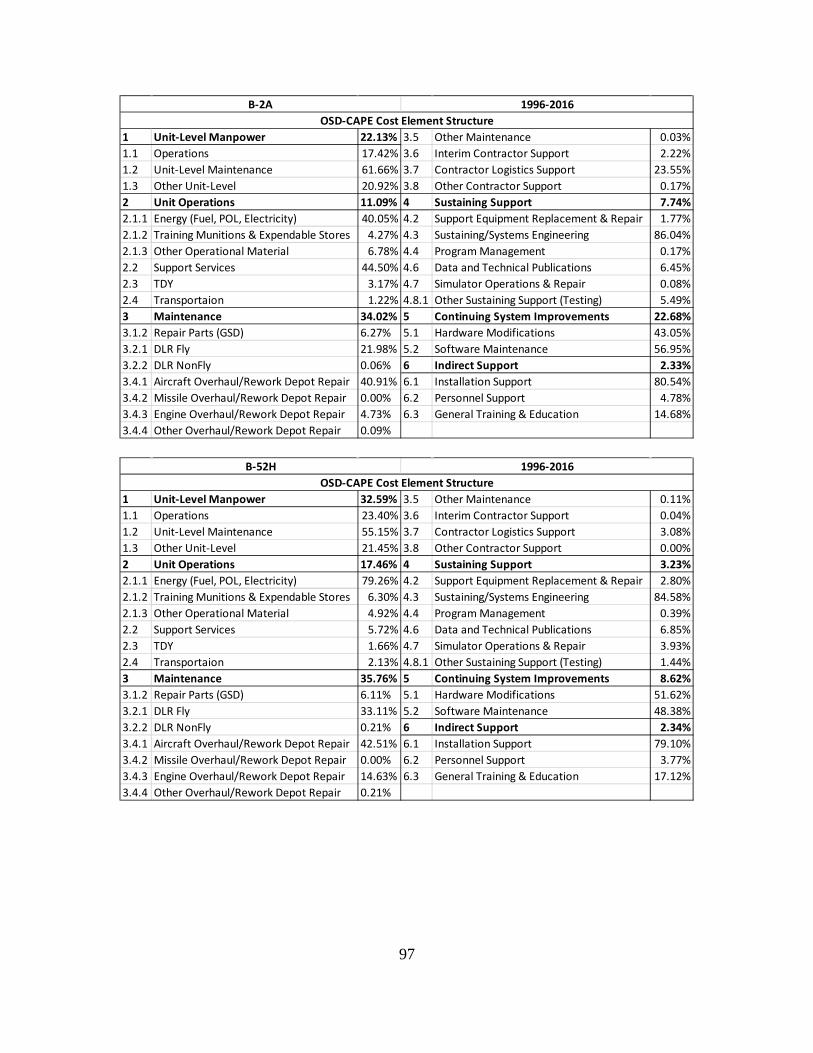
97
1 Unit-Level Manpower 22.13% 3.5 Other Maintenance 0.03%1.1 Operations 17.42% 3.6 Interim Contractor Support 2.22%1.2 Unit-Level Maintenance 61.66% 3.7 Contractor Logistics Support 23.55%1.3 Other Unit-Level 20.92% 3.8 Other Contractor Support 0.17%2 Unit Operations 11.09% 4 Sustaining Support 7.74%2.1.1 Energy (Fuel, POL, Electricity) 40.05% 4.2 Support Equipment Replacement & Repair 1.77%2.1.2 Training Munitions & Expendable Stores 4.27% 4.3 Sustaining/Systems Engineering 86.04%2.1.3 Other Operational Material 6.78% 4.4 Program Management 0.17%2.2 Support Services 44.50% 4.6 Data and Technical Publications 6.45%2.3 TDY 3.17% 4.7 Simulator Operations & Repair 0.08%2.4 Transportaion 1.22% 4.8.1 Other Sustaining Support (Testing) 5.49%3 Maintenance 34.02% 5 Continuing System Improvements 22.68%3.1.2 Repair Parts (GSD) 6.27% 5.1 Hardware Modifications 43.05%3.2.1 DLR Fly 21.98% 5.2 Software Maintenance 56.95%3.2.2 DLR NonFly 0.06% 6 Indirect Support 2.33%3.4.1 Aircraft Overhaul/Rework Depot Repair 40.91% 6.1 Installation Support 80.54%3.4.2 Missile Overhaul/Rework Depot Repair 0.00% 6.2 Personnel Support 4.78%3.4.3 Engine Overhaul/Rework Depot Repair 4.73% 6.3 General Training & Education 14.68%3.4.4 Other Overhaul/Rework Depot Repair 0.09%
1996-2016B-2AOSD-CAPE Cost Element Structure
1 Unit-Level Manpower 32.59% 3.5 Other Maintenance 0.11%1.1 Operations 23.40% 3.6 Interim Contractor Support 0.04%1.2 Unit-Level Maintenance 55.15% 3.7 Contractor Logistics Support 3.08%1.3 Other Unit-Level 21.45% 3.8 Other Contractor Support 0.00%2 Unit Operations 17.46% 4 Sustaining Support 3.23%2.1.1 Energy (Fuel, POL, Electricity) 79.26% 4.2 Support Equipment Replacement & Repair 2.80%2.1.2 Training Munitions & Expendable Stores 6.30% 4.3 Sustaining/Systems Engineering 84.58%2.1.3 Other Operational Material 4.92% 4.4 Program Management 0.39%2.2 Support Services 5.72% 4.6 Data and Technical Publications 6.85%2.3 TDY 1.66% 4.7 Simulator Operations & Repair 3.93%2.4 Transportaion 2.13% 4.8.1 Other Sustaining Support (Testing) 1.44%3 Maintenance 35.76% 5 Continuing System Improvements 8.62%3.1.2 Repair Parts (GSD) 6.11% 5.1 Hardware Modifications 51.62%3.2.1 DLR Fly 33.11% 5.2 Software Maintenance 48.38%3.2.2 DLR NonFly 0.21% 6 Indirect Support 2.34%3.4.1 Aircraft Overhaul/Rework Depot Repair 42.51% 6.1 Installation Support 79.10%3.4.2 Missile Overhaul/Rework Depot Repair 0.00% 6.2 Personnel Support 3.77%3.4.3 Engine Overhaul/Rework Depot Repair 14.63% 6.3 General Training & Education 17.12%3.4.4 Other Overhaul/Rework Depot Repair 0.21%
OSD-CAPE Cost Element Structure1996-2016B-52H
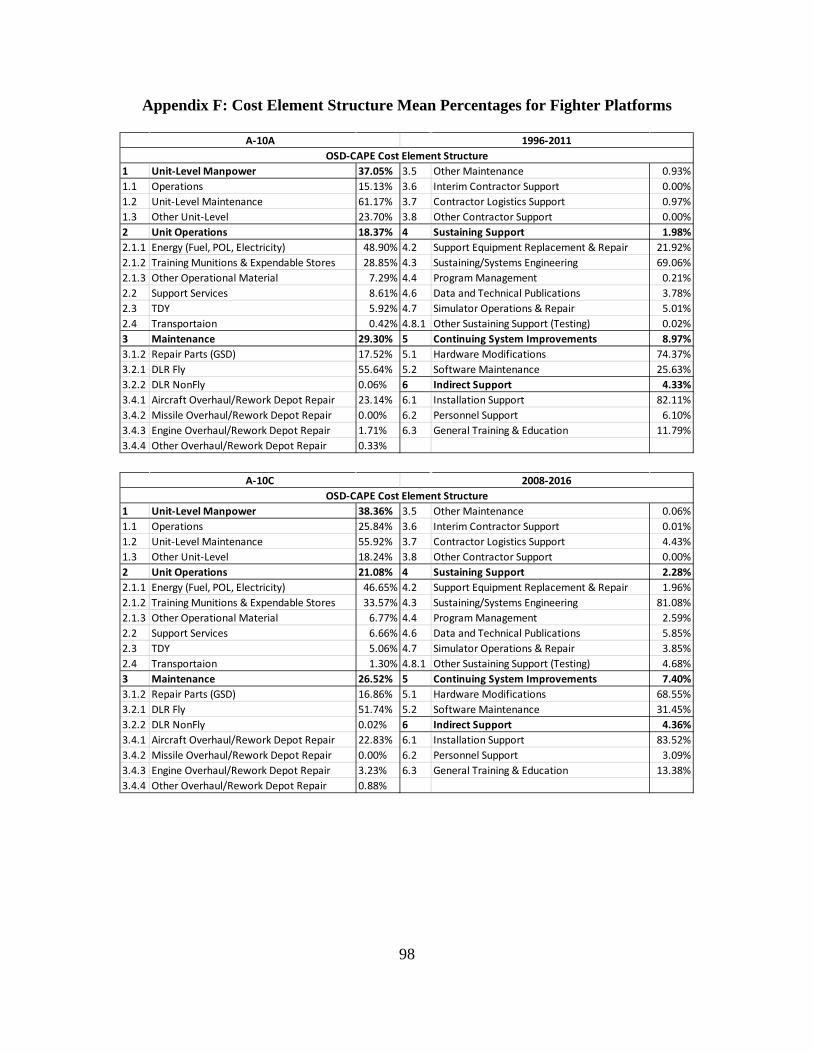
98
Appendix F: Cost Element Structure Mean Percentages for Fighter Platforms
1 Unit-Level Manpower 37.05% 3.5 Other Maintenance 0.93%1.1 Operations 15.13% 3.6 Interim Contractor Support 0.00%1.2 Unit-Level Maintenance 61.17% 3.7 Contractor Logistics Support 0.97%1.3 Other Unit-Level 23.70% 3.8 Other Contractor Support 0.00%2 Unit Operations 18.37% 4 Sustaining Support 1.98%2.1.1 Energy (Fuel, POL, Electricity) 48.90% 4.2 Support Equipment Replacement & Repair 21.92%2.1.2 Training Munitions & Expendable Stores 28.85% 4.3 Sustaining/Systems Engineering 69.06%2.1.3 Other Operational Material 7.29% 4.4 Program Management 0.21%2.2 Support Services 8.61% 4.6 Data and Technical Publications 3.78%2.3 TDY 5.92% 4.7 Simulator Operations & Repair 5.01%2.4 Transportaion 0.42% 4.8.1 Other Sustaining Support (Testing) 0.02%3 Maintenance 29.30% 5 Continuing System Improvements 8.97%3.1.2 Repair Parts (GSD) 17.52% 5.1 Hardware Modifications 74.37%3.2.1 DLR Fly 55.64% 5.2 Software Maintenance 25.63%3.2.2 DLR NonFly 0.06% 6 Indirect Support 4.33%3.4.1 Aircraft Overhaul/Rework Depot Repair 23.14% 6.1 Installation Support 82.11%3.4.2 Missile Overhaul/Rework Depot Repair 0.00% 6.2 Personnel Support 6.10%3.4.3 Engine Overhaul/Rework Depot Repair 1.71% 6.3 General Training & Education 11.79%3.4.4 Other Overhaul/Rework Depot Repair 0.33%
A-10A 1996-2011OSD-CAPE Cost Element Structure
1 Unit-Level Manpower 38.36% 3.5 Other Maintenance 0.06%1.1 Operations 25.84% 3.6 Interim Contractor Support 0.01%1.2 Unit-Level Maintenance 55.92% 3.7 Contractor Logistics Support 4.43%1.3 Other Unit-Level 18.24% 3.8 Other Contractor Support 0.00%2 Unit Operations 21.08% 4 Sustaining Support 2.28%2.1.1 Energy (Fuel, POL, Electricity) 46.65% 4.2 Support Equipment Replacement & Repair 1.96%2.1.2 Training Munitions & Expendable Stores 33.57% 4.3 Sustaining/Systems Engineering 81.08%2.1.3 Other Operational Material 6.77% 4.4 Program Management 2.59%2.2 Support Services 6.66% 4.6 Data and Technical Publications 5.85%2.3 TDY 5.06% 4.7 Simulator Operations & Repair 3.85%2.4 Transportaion 1.30% 4.8.1 Other Sustaining Support (Testing) 4.68%3 Maintenance 26.52% 5 Continuing System Improvements 7.40%3.1.2 Repair Parts (GSD) 16.86% 5.1 Hardware Modifications 68.55%3.2.1 DLR Fly 51.74% 5.2 Software Maintenance 31.45%3.2.2 DLR NonFly 0.02% 6 Indirect Support 4.36%3.4.1 Aircraft Overhaul/Rework Depot Repair 22.83% 6.1 Installation Support 83.52%3.4.2 Missile Overhaul/Rework Depot Repair 0.00% 6.2 Personnel Support 3.09%3.4.3 Engine Overhaul/Rework Depot Repair 3.23% 6.3 General Training & Education 13.38%3.4.4 Other Overhaul/Rework Depot Repair 0.88%
A-10C 2008-2016OSD-CAPE Cost Element Structure

99
1 Unit-Level Manpower 34.39% 3.5 Other Maintenance 0.14%1.1 Operations 6.33% 3.6 Interim Contractor Support 0.00%1.2 Unit-Level Maintenance 65.97% 3.7 Contractor Logistics Support 5.56%1.3 Other Unit-Level 27.70% 3.8 Other Contractor Support 0.00%2 Unit Operations 17.45% 4 Sustaining Support 2.25%2.1.1 Energy (Fuel, POL, Electricity) 72.11% 4.2 Support Equipment Replacement & Repair 12.16%2.1.2 Training Munitions & Expendable Stores 4.29% 4.3 Sustaining/Systems Engineering 87.15%2.1.3 Other Operational Material 7.89% 4.4 Program Management 0.13%2.2 Support Services 6.29% 4.6 Data and Technical Publications 0.40%2.3 TDY 8.42% 4.7 Simulator Operations & Repair 0.15%2.4 Transportaion 1.00% 4.8.1 Other Sustaining Support (Testing) 0.01%3 Maintenance 38.85% 5 Continuing System Improvements 1.77%3.1.2 Repair Parts (GSD) 10.88% 5.1 Hardware Modifications 94.65%3.2.1 DLR Fly 65.86% 5.2 Software Maintenance 5.35%3.2.2 DLR NonFly 0.18% 6 Indirect Support 5.29%3.4.1 Aircraft Overhaul/Rework Depot Repair 12.98% 6.1 Installation Support 95.08%3.4.2 Missile Overhaul/Rework Depot Repair 0.00% 6.2 Personnel Support 2.25%3.4.3 Engine Overhaul/Rework Depot Repair 4.12% 6.3 General Training & Education 2.67%3.4.4 Other Overhaul/Rework Depot Repair 0.33%
F-15A 1996-2010OSD-CAPE Cost Element Structure
1 Unit-Level Manpower 35.20% 3.5 Other Maintenance 0.15%1.1 Operations 5.88% 3.6 Interim Contractor Support 0.00%1.2 Unit-Level Maintenance 67.72% 3.7 Contractor Logistics Support 7.13%1.3 Other Unit-Level 26.41% 3.8 Other Contractor Support 0.00%2 Unit Operations 18.16% 4 Sustaining Support 2.35%2.1.1 Energy (Fuel, POL, Electricity) 70.66% 4.2 Support Equipment Replacement & Repair 13.70%2.1.2 Training Munitions & Expendable Stores 6.91% 4.3 Sustaining/Systems Engineering 85.14%2.1.3 Other Operational Material 7.12% 4.4 Program Management 0.60%2.2 Support Services 6.01% 4.6 Data and Technical Publications 0.55%2.3 TDY 8.29% 4.7 Simulator Operations & Repair 0.00%2.4 Transportaion 1.01% 4.8.1 Other Sustaining Support (Testing) 0.01%3 Maintenance 36.47% 5 Continuing System Improvements 2.32%3.1.2 Repair Parts (GSD) 9.98% 5.1 Hardware Modifications 93.80%3.2.1 DLR Fly 62.10% 5.2 Software Maintenance 6.20%3.2.2 DLR NonFly 0.21% 6 Indirect Support 5.51%3.4.1 Aircraft Overhaul/Rework Depot Repair 15.30% 6.1 Installation Support 95.53%3.4.2 Missile Overhaul/Rework Depot Repair 0.00% 6.2 Personnel Support 2.01%3.4.3 Engine Overhaul/Rework Depot Repair 4.79% 6.3 General Training & Education 2.47%3.4.4 Other Overhaul/Rework Depot Repair 0.35%
OSD-CAPE Cost Element StructureF-15B 1996-2009

100
1 Unit-Level Manpower 28.62% 3.5 Other Maintenance 0.03%1.1 Operations 12.68% 3.6 Interim Contractor Support 0.00%1.2 Unit-Level Maintenance 74.06% 3.7 Contractor Logistics Support 5.33%1.3 Other Unit-Level 13.26% 3.8 Other Contractor Support 0.00%2 Unit Operations 16.00% 4 Sustaining Support 2.02%2.1.1 Energy (Fuel, POL, Electricity) 75.82% 4.2 Support Equipment Replacement & Repair 8.00%2.1.2 Training Munitions & Expendable Stores 4.52% 4.3 Sustaining/Systems Engineering 79.44%2.1.3 Other Operational Material 5.21% 4.4 Program Management 0.92%2.2 Support Services 10.42% 4.6 Data and Technical Publications 11.18%2.3 TDY 3.34% 4.7 Simulator Operations & Repair 0.00%2.4 Transportaion 0.69% 4.8.1 Other Sustaining Support (Testing) 0.46%3 Maintenance 41.82% 5 Continuing System Improvements 9.00%3.1.2 Repair Parts (GSD) 9.13% 5.1 Hardware Modifications 97.21%3.2.1 DLR Fly 61.09% 5.2 Software Maintenance 2.79%3.2.2 DLR NonFly 0.03% 6 Indirect Support 2.54%3.4.1 Aircraft Overhaul/Rework Depot Repair 21.28% 6.1 Installation Support 75.68%3.4.2 Missile Overhaul/Rework Depot Repair 0.00% 6.2 Personnel Support 5.41%3.4.3 Engine Overhaul/Rework Depot Repair 2.62% 6.3 General Training & Education 18.91%3.4.4 Other Overhaul/Rework Depot Repair 0.57%
F-15C 1996-2016OSD-CAPE Cost Element Structure
1 Unit-Level Manpower 29.55% 3.5 Other Maintenance 0.00%1.1 Operations 18.08% 3.6 Interim Contractor Support 0.00%1.2 Unit-Level Maintenance 73.05% 3.7 Contractor Logistics Support 1.88%1.3 Other Unit-Level 8.87% 3.8 Other Contractor Support 0.00%2 Unit Operations 19.88% 4 Sustaining Support 0.97%2.1.1 Energy (Fuel, POL, Electricity) 78.51% 4.2 Support Equipment Replacement & Repair 26.23%2.1.2 Training Munitions & Expendable Stores 10.31% 4.3 Sustaining/Systems Engineering 45.27%2.1.3 Other Operational Material 4.14% 4.4 Program Management 1.33%2.2 Support Services 3.27% 4.6 Data and Technical Publications 24.11%2.3 TDY 3.36% 4.7 Simulator Operations & Repair 0.47%2.4 Transportaion 0.41% 4.8.1 Other Sustaining Support (Testing) 2.58%3 Maintenance 40.73% 5 Continuing System Improvements 6.34%3.1.2 Repair Parts (GSD) 10.80% 5.1 Hardware Modifications 85.05%3.2.1 DLR Fly 68.80% 5.2 Software Maintenance 14.95%3.2.2 DLR NonFly 0.07% 6 Indirect Support 2.53%3.4.1 Aircraft Overhaul/Rework Depot Repair 16.38% 6.1 Installation Support 46.29%3.4.2 Missile Overhaul/Rework Depot Repair 0.00% 6.2 Personnel Support 5.65%3.4.3 Engine Overhaul/Rework Depot Repair 1.86% 6.3 General Training & Education 48.06%3.4.4 Other Overhaul/Rework Depot Repair 0.26%
F-15E 1996-2016OSD-CAPE Cost Element Structure

101
1 Unit-Level Manpower 26.90% 3.5 Other Maintenance 0.03%1.1 Operations 12.35% 3.6 Interim Contractor Support 0.00%1.2 Unit-Level Maintenance 71.79% 3.7 Contractor Logistics Support 5.27%1.3 Other Unit-Level 15.86% 3.8 Other Contractor Support 0.00%2 Unit Operations 17.04% 4 Sustaining Support 1.78%2.1.1 Energy (Fuel, POL, Electricity) 71.36% 4.2 Support Equipment Replacement & Repair 11.17%2.1.2 Training Munitions & Expendable Stores 5.50% 4.3 Sustaining/Systems Engineering 77.59%2.1.3 Other Operational Material 5.16% 4.4 Program Management 1.22%2.2 Support Services 14.50% 4.6 Data and Technical Publications 9.41%2.3 TDY 3.00% 4.7 Simulator Operations & Repair 0.08%2.4 Transportaion 0.48% 4.8.1 Other Sustaining Support (Testing) 0.52%3 Maintenance 42.99% 5 Continuing System Improvements 8.33%3.1.2 Repair Parts (GSD) 9.27% 5.1 Hardware Modifications 96.73%3.2.1 DLR Fly 59.92% 5.2 Software Maintenance 3.27%3.2.2 DLR NonFly 0.03% 6 Indirect Support 2.96%3.4.1 Aircraft Overhaul/Rework Depot Repair 22.78% 6.1 Installation Support 74.18%3.4.2 Missile Overhaul/Rework Depot Repair 0.00% 6.2 Personnel Support 3.79%3.4.3 Engine Overhaul/Rework Depot Repair 2.21% 6.3 General Training & Education 22.03%3.4.4 Other Overhaul/Rework Depot Repair 0.54%
F-15D 1996-2016OSD-CAPE Cost Element Structure
1 Unit-Level Manpower 29.55% 3.5 Other Maintenance 0.00%1.1 Operations 18.08% 3.6 Interim Contractor Support 0.00%1.2 Unit-Level Maintenance 73.05% 3.7 Contractor Logistics Support 1.88%1.3 Other Unit-Level 8.87% 3.8 Other Contractor Support 0.00%2 Unit Operations 19.88% 4 Sustaining Support 0.97%2.1.1 Energy (Fuel, POL, Electricity) 78.51% 4.2 Support Equipment Replacement & Repair 26.23%2.1.2 Training Munitions & Expendable Stores 10.31% 4.3 Sustaining/Systems Engineering 45.27%2.1.3 Other Operational Material 4.14% 4.4 Program Management 1.33%2.2 Support Services 3.27% 4.6 Data and Technical Publications 24.11%2.3 TDY 3.36% 4.7 Simulator Operations & Repair 0.47%2.4 Transportaion 0.41% 4.8.1 Other Sustaining Support (Testing) 2.58%3 Maintenance 40.73% 5 Continuing System Improvements 6.34%3.1.2 Repair Parts (GSD) 10.80% 5.1 Hardware Modifications 85.05%3.2.1 DLR Fly 68.80% 5.2 Software Maintenance 14.95%3.2.2 DLR NonFly 0.07% 6 Indirect Support 2.53%3.4.1 Aircraft Overhaul/Rework Depot Repair 16.38% 6.1 Installation Support 46.29%3.4.2 Missile Overhaul/Rework Depot Repair 0.00% 6.2 Personnel Support 5.65%3.4.3 Engine Overhaul/Rework Depot Repair 1.86% 6.3 General Training & Education 48.06%3.4.4 Other Overhaul/Rework Depot Repair 0.26%
F-15E 1996-2016OSD-CAPE Cost Element Structure
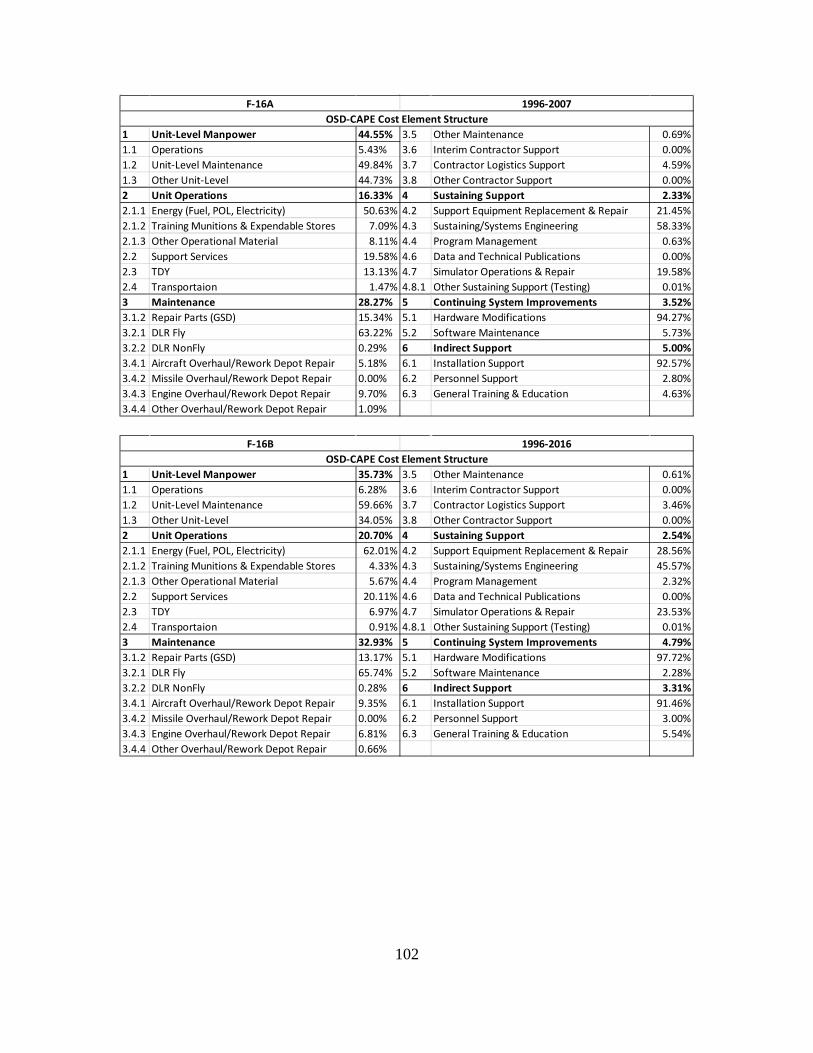
102
1 Unit-Level Manpower 44.55% 3.5 Other Maintenance 0.69%1.1 Operations 5.43% 3.6 Interim Contractor Support 0.00%1.2 Unit-Level Maintenance 49.84% 3.7 Contractor Logistics Support 4.59%1.3 Other Unit-Level 44.73% 3.8 Other Contractor Support 0.00%2 Unit Operations 16.33% 4 Sustaining Support 2.33%2.1.1 Energy (Fuel, POL, Electricity) 50.63% 4.2 Support Equipment Replacement & Repair 21.45%2.1.2 Training Munitions & Expendable Stores 7.09% 4.3 Sustaining/Systems Engineering 58.33%2.1.3 Other Operational Material 8.11% 4.4 Program Management 0.63%2.2 Support Services 19.58% 4.6 Data and Technical Publications 0.00%2.3 TDY 13.13% 4.7 Simulator Operations & Repair 19.58%2.4 Transportaion 1.47% 4.8.1 Other Sustaining Support (Testing) 0.01%3 Maintenance 28.27% 5 Continuing System Improvements 3.52%3.1.2 Repair Parts (GSD) 15.34% 5.1 Hardware Modifications 94.27%3.2.1 DLR Fly 63.22% 5.2 Software Maintenance 5.73%3.2.2 DLR NonFly 0.29% 6 Indirect Support 5.00%3.4.1 Aircraft Overhaul/Rework Depot Repair 5.18% 6.1 Installation Support 92.57%3.4.2 Missile Overhaul/Rework Depot Repair 0.00% 6.2 Personnel Support 2.80%3.4.3 Engine Overhaul/Rework Depot Repair 9.70% 6.3 General Training & Education 4.63%3.4.4 Other Overhaul/Rework Depot Repair 1.09%
OSD-CAPE Cost Element StructureF-16A 1996-2007
1 Unit-Level Manpower 35.73% 3.5 Other Maintenance 0.61%1.1 Operations 6.28% 3.6 Interim Contractor Support 0.00%1.2 Unit-Level Maintenance 59.66% 3.7 Contractor Logistics Support 3.46%1.3 Other Unit-Level 34.05% 3.8 Other Contractor Support 0.00%2 Unit Operations 20.70% 4 Sustaining Support 2.54%2.1.1 Energy (Fuel, POL, Electricity) 62.01% 4.2 Support Equipment Replacement & Repair 28.56%2.1.2 Training Munitions & Expendable Stores 4.33% 4.3 Sustaining/Systems Engineering 45.57%2.1.3 Other Operational Material 5.67% 4.4 Program Management 2.32%2.2 Support Services 20.11% 4.6 Data and Technical Publications 0.00%2.3 TDY 6.97% 4.7 Simulator Operations & Repair 23.53%2.4 Transportaion 0.91% 4.8.1 Other Sustaining Support (Testing) 0.01%3 Maintenance 32.93% 5 Continuing System Improvements 4.79%3.1.2 Repair Parts (GSD) 13.17% 5.1 Hardware Modifications 97.72%3.2.1 DLR Fly 65.74% 5.2 Software Maintenance 2.28%3.2.2 DLR NonFly 0.28% 6 Indirect Support 3.31%3.4.1 Aircraft Overhaul/Rework Depot Repair 9.35% 6.1 Installation Support 91.46%3.4.2 Missile Overhaul/Rework Depot Repair 0.00% 6.2 Personnel Support 3.00%3.4.3 Engine Overhaul/Rework Depot Repair 6.81% 6.3 General Training & Education 5.54%3.4.4 Other Overhaul/Rework Depot Repair 0.66%
F-16B 1996-2016OSD-CAPE Cost Element Structure

103
1 Unit-Level Manpower 40.67% 3.5 Other Maintenance 0.20%1.1 Operations 10.88% 3.6 Interim Contractor Support 0.02%1.2 Unit-Level Maintenance 67.50% 3.7 Contractor Logistics Support 3.34%1.3 Other Unit-Level 21.63% 3.8 Other Contractor Support 0.00%2 Unit Operations 18.58% 4 Sustaining Support 1.42%2.1.1 Energy (Fuel, POL, Electricity) 60.38% 4.2 Support Equipment Replacement & Repair 15.03%2.1.2 Training Munitions & Expendable Stores 14.71% 4.3 Sustaining/Systems Engineering 54.21%2.1.3 Other Operational Material 6.62% 4.4 Program Management 1.27%2.2 Support Services 9.96% 4.6 Data and Technical Publications 8.99%2.3 TDY 6.12% 4.7 Simulator Operations & Repair 15.67%2.4 Transportaion 2.21% 4.8.1 Other Sustaining Support (Testing) 4.83%3 Maintenance 27.99% 5 Continuing System Improvements 6.84%3.1.2 Repair Parts (GSD) 17.74% 5.1 Hardware Modifications 77.58%3.2.1 DLR Fly 65.51% 5.2 Software Maintenance 22.42%3.2.2 DLR NonFly 0.11% 6 Indirect Support 4.51%3.4.1 Aircraft Overhaul/Rework Depot Repair 4.70% 6.1 Installation Support 82.43%3.4.2 Missile Overhaul/Rework Depot Repair 0.00% 6.2 Personnel Support 3.95%3.4.3 Engine Overhaul/Rework Depot Repair 7.42% 6.3 General Training & Education 13.62%3.4.4 Other Overhaul/Rework Depot Repair 0.97%
F-16C 1996-2016OSD-CAPE Cost Element Structure
1 Unit-Level Manpower 39.75% 3.5 Other Maintenance 0.12%1.1 Operations 11.71% 3.6 Interim Contractor Support 0.02%1.2 Unit-Level Maintenance 71.28% 3.7 Contractor Logistics Support 3.56%1.3 Other Unit-Level 17.01% 3.8 Other Contractor Support 0.00%2 Unit Operations 19.44% 4 Sustaining Support 1.36%2.1.1 Energy (Fuel, POL, Electricity) 55.90% 4.2 Support Equipment Replacement & Repair 17.24%2.1.2 Training Munitions & Expendable Stores 19.42% 4.3 Sustaining/Systems Engineering 49.77%2.1.3 Other Operational Material 6.48% 4.4 Program Management 2.54%2.2 Support Services 11.60% 4.6 Data and Technical Publications 9.50%2.3 TDY 5.05% 4.7 Simulator Operations & Repair 17.97%2.4 Transportaion 1.55% 4.8.1 Other Sustaining Support (Testing) 2.96%3 Maintenance 27.69% 5 Continuing System Improvements 7.56%3.1.2 Repair Parts (GSD) 15.99% 5.1 Hardware Modifications 78.59%3.2.1 DLR Fly 67.16% 5.2 Software Maintenance 21.41%3.2.2 DLR NonFly 0.09% 6 Indirect Support 4.20%3.4.1 Aircraft Overhaul/Rework Depot Repair 5.63% 6.1 Installation Support 74.31%3.4.2 Missile Overhaul/Rework Depot Repair 0.00% 6.2 Personnel Support 3.56%3.4.3 Engine Overhaul/Rework Depot Repair 6.38% 6.3 General Training & Education 22.14%3.4.4 Other Overhaul/Rework Depot Repair 1.05%
F-16D 1996-2016OSD-CAPE Cost Element Structure

104
1 Unit-Level Manpower 28.55% 3.5 Other Maintenance 0.00%1.1 Operations 26.42% 3.6 Interim Contractor Support 0.00%1.2 Unit-Level Maintenance 66.03% 3.7 Contractor Logistics Support 99.45%1.3 Other Unit-Level 7.55% 3.8 Other Contractor Support 0.00%2 Unit Operations 9.71% 4 Sustaining Support 0.96%2.1.1 Energy (Fuel, POL, Electricity) 53.65% 4.2 Support Equipment Replacement & Repair 0.00%2.1.2 Training Munitions & Expendable Stores 0.44% 4.3 Sustaining/Systems Engineering 41.47%2.1.3 Other Operational Material 12.55% 4.4 Program Management 0.00%2.2 Support Services 25.67% 4.6 Data and Technical Publications 18.28%2.3 TDY 7.22% 4.7 Simulator Operations & Repair 0.12%2.4 Transportaion 0.47% 4.8.1 Other Sustaining Support (Testing) 40.14%3 Maintenance 37.65% 5 Continuing System Improvements 15.42%3.1.2 Repair Parts (GSD) 0.21% 5.1 Hardware Modifications 78.92%3.2.1 DLR Fly 0.00% 5.2 Software Maintenance 21.08%3.2.2 DLR NonFly 0.00% 6 Indirect Support 7.71%3.4.1 Aircraft Overhaul/Rework Depot Repair 0.01% 6.1 Installation Support 70.55%3.4.2 Missile Overhaul/Rework Depot Repair 0.00% 6.2 Personnel Support 2.77%3.4.3 Engine Overhaul/Rework Depot Repair 0.03% 6.3 General Training & Education 26.67%3.4.4 Other Overhaul/Rework Depot Repair 0.29%
OSD-CAPE Cost Element StructureF-35A 2012-2016
1 Unit-Level Manpower 20.24% 3.5 Other Maintenance 0.00%1.1 Operations 10.77% 3.6 Interim Contractor Support 0.01%1.2 Unit-Level Maintenance 76.25% 3.7 Contractor Logistics Support 97.48%1.3 Other Unit-Level 12.99% 3.8 Other Contractor Support 0.00%2 Unit Operations 20.23% 4 Sustaining Support 0.21%2.1.1 Energy (Fuel, POL, Electricity) 56.52% 4.2 Support Equipment Replacement & Repair 32.84%2.1.2 Training Munitions & Expendable Stores 3.42% 4.3 Sustaining/Systems Engineering 25.13%2.1.3 Other Operational Material 6.41% 4.4 Program Management 4.28%2.2 Support Services 29.05% 4.6 Data and Technical Publications 21.51%2.3 TDY 4.04% 4.7 Simulator Operations & Repair 9.57%2.4 Transportaion 0.55% 4.8.1 Other Sustaining Support (Testing) 6.67%3 Maintenance 42.04% 5 Continuing System Improvements 14.90%3.1.2 Repair Parts (GSD) 1.95% 5.1 Hardware Modifications 99.78%3.2.1 DLR Fly 0.19% 5.2 Software Maintenance 0.22%3.2.2 DLR NonFly 0.05% 6 Indirect Support 2.38%3.4.1 Aircraft Overhaul/Rework Depot Repair 0.14% 6.1 Installation Support 69.83%3.4.2 Missile Overhaul/Rework Depot Repair 0.00% 6.2 Personnel Support 4.07%3.4.3 Engine Overhaul/Rework Depot Repair 0.01% 6.3 General Training & Education 26.10%3.4.4 Other Overhaul/Rework Depot Repair 0.18%
F-22A 2003-2016OSD-CAPE Cost Element Structure
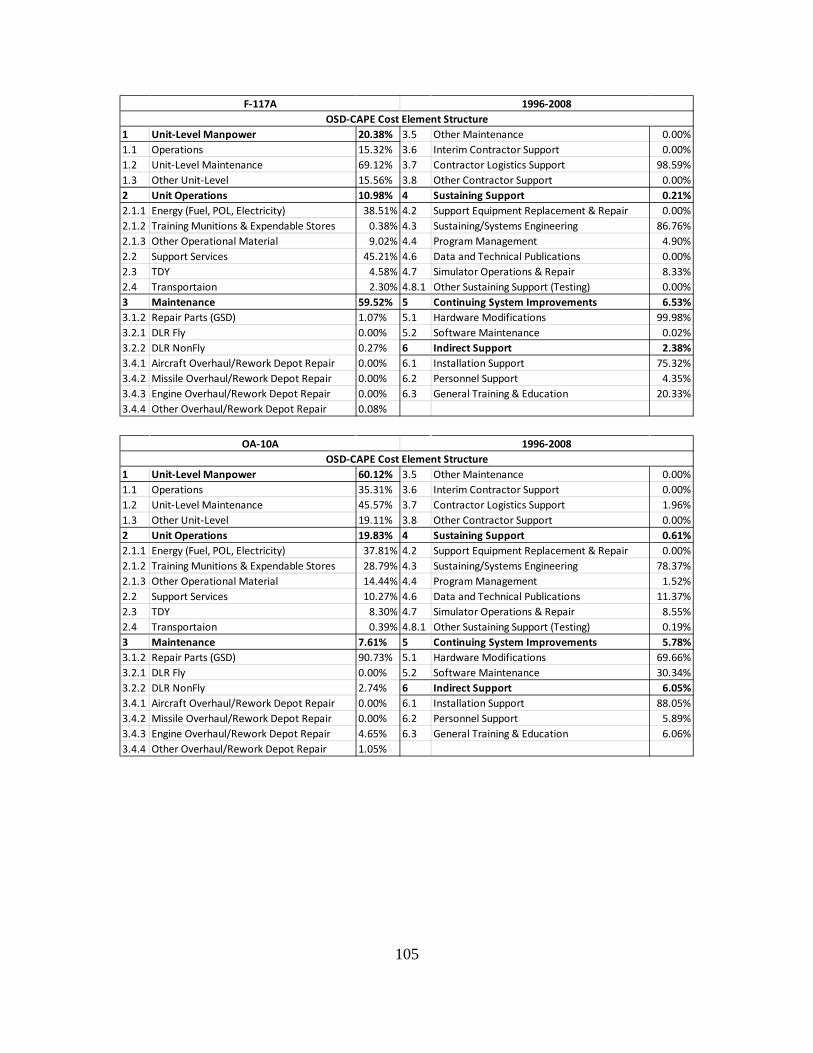
105
1 Unit-Level Manpower 20.38% 3.5 Other Maintenance 0.00%1.1 Operations 15.32% 3.6 Interim Contractor Support 0.00%1.2 Unit-Level Maintenance 69.12% 3.7 Contractor Logistics Support 98.59%1.3 Other Unit-Level 15.56% 3.8 Other Contractor Support 0.00%2 Unit Operations 10.98% 4 Sustaining Support 0.21%2.1.1 Energy (Fuel, POL, Electricity) 38.51% 4.2 Support Equipment Replacement & Repair 0.00%2.1.2 Training Munitions & Expendable Stores 0.38% 4.3 Sustaining/Systems Engineering 86.76%2.1.3 Other Operational Material 9.02% 4.4 Program Management 4.90%2.2 Support Services 45.21% 4.6 Data and Technical Publications 0.00%2.3 TDY 4.58% 4.7 Simulator Operations & Repair 8.33%2.4 Transportaion 2.30% 4.8.1 Other Sustaining Support (Testing) 0.00%3 Maintenance 59.52% 5 Continuing System Improvements 6.53%3.1.2 Repair Parts (GSD) 1.07% 5.1 Hardware Modifications 99.98%3.2.1 DLR Fly 0.00% 5.2 Software Maintenance 0.02%3.2.2 DLR NonFly 0.27% 6 Indirect Support 2.38%3.4.1 Aircraft Overhaul/Rework Depot Repair 0.00% 6.1 Installation Support 75.32%3.4.2 Missile Overhaul/Rework Depot Repair 0.00% 6.2 Personnel Support 4.35%3.4.3 Engine Overhaul/Rework Depot Repair 0.00% 6.3 General Training & Education 20.33%3.4.4 Other Overhaul/Rework Depot Repair 0.08%
F-117A 1996-2008OSD-CAPE Cost Element Structure
1 Unit-Level Manpower 60.12% 3.5 Other Maintenance 0.00%1.1 Operations 35.31% 3.6 Interim Contractor Support 0.00%1.2 Unit-Level Maintenance 45.57% 3.7 Contractor Logistics Support 1.96%1.3 Other Unit-Level 19.11% 3.8 Other Contractor Support 0.00%2 Unit Operations 19.83% 4 Sustaining Support 0.61%2.1.1 Energy (Fuel, POL, Electricity) 37.81% 4.2 Support Equipment Replacement & Repair 0.00%2.1.2 Training Munitions & Expendable Stores 28.79% 4.3 Sustaining/Systems Engineering 78.37%2.1.3 Other Operational Material 14.44% 4.4 Program Management 1.52%2.2 Support Services 10.27% 4.6 Data and Technical Publications 11.37%2.3 TDY 8.30% 4.7 Simulator Operations & Repair 8.55%2.4 Transportaion 0.39% 4.8.1 Other Sustaining Support (Testing) 0.19%3 Maintenance 7.61% 5 Continuing System Improvements 5.78%3.1.2 Repair Parts (GSD) 90.73% 5.1 Hardware Modifications 69.66%3.2.1 DLR Fly 0.00% 5.2 Software Maintenance 30.34%3.2.2 DLR NonFly 2.74% 6 Indirect Support 6.05%3.4.1 Aircraft Overhaul/Rework Depot Repair 0.00% 6.1 Installation Support 88.05%3.4.2 Missile Overhaul/Rework Depot Repair 0.00% 6.2 Personnel Support 5.89%3.4.3 Engine Overhaul/Rework Depot Repair 4.65% 6.3 General Training & Education 6.06%3.4.4 Other Overhaul/Rework Depot Repair 1.05%
OA-10A 1996-2008OSD-CAPE Cost Element Structure
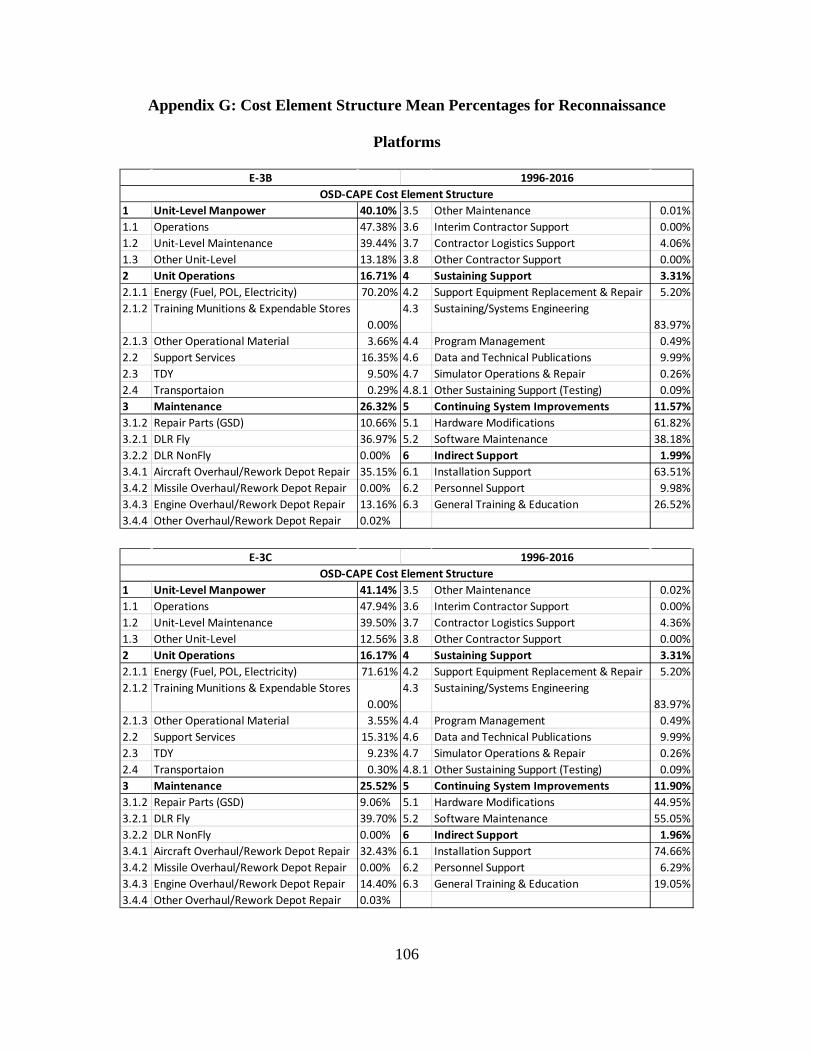
106
Appendix G: Cost Element Structure Mean Percentages for Reconnaissance
Platforms
1 Unit-Level Manpower 40.10% 3.5 Other Maintenance 0.01%1.1 Operations 47.38% 3.6 Interim Contractor Support 0.00%1.2 Unit-Level Maintenance 39.44% 3.7 Contractor Logistics Support 4.06%1.3 Other Unit-Level 13.18% 3.8 Other Contractor Support 0.00%2 Unit Operations 16.71% 4 Sustaining Support 3.31%2.1.1 Energy (Fuel, POL, Electricity) 70.20% 4.2 Support Equipment Replacement & Repair 5.20%2.1.2 Training Munitions & Expendable Stores
0.00%4.3 Sustaining/Systems Engineering
83.97%2.1.3 Other Operational Material 3.66% 4.4 Program Management 0.49%2.2 Support Services 16.35% 4.6 Data and Technical Publications 9.99%2.3 TDY 9.50% 4.7 Simulator Operations & Repair 0.26%2.4 Transportaion 0.29% 4.8.1 Other Sustaining Support (Testing) 0.09%3 Maintenance 26.32% 5 Continuing System Improvements 11.57%3.1.2 Repair Parts (GSD) 10.66% 5.1 Hardware Modifications 61.82%3.2.1 DLR Fly 36.97% 5.2 Software Maintenance 38.18%3.2.2 DLR NonFly 0.00% 6 Indirect Support 1.99%3.4.1 Aircraft Overhaul/Rework Depot Repair 35.15% 6.1 Installation Support 63.51%3.4.2 Missile Overhaul/Rework Depot Repair 0.00% 6.2 Personnel Support 9.98%3.4.3 Engine Overhaul/Rework Depot Repair 13.16% 6.3 General Training & Education 26.52%3.4.4 Other Overhaul/Rework Depot Repair 0.02%
E-3B 1996-2016OSD-CAPE Cost Element Structure
1 Unit-Level Manpower 41.14% 3.5 Other Maintenance 0.02%1.1 Operations 47.94% 3.6 Interim Contractor Support 0.00%1.2 Unit-Level Maintenance 39.50% 3.7 Contractor Logistics Support 4.36%1.3 Other Unit-Level 12.56% 3.8 Other Contractor Support 0.00%2 Unit Operations 16.17% 4 Sustaining Support 3.31%2.1.1 Energy (Fuel, POL, Electricity) 71.61% 4.2 Support Equipment Replacement & Repair 5.20%2.1.2 Training Munitions & Expendable Stores
0.00%4.3 Sustaining/Systems Engineering
83.97%2.1.3 Other Operational Material 3.55% 4.4 Program Management 0.49%2.2 Support Services 15.31% 4.6 Data and Technical Publications 9.99%2.3 TDY 9.23% 4.7 Simulator Operations & Repair 0.26%2.4 Transportaion 0.30% 4.8.1 Other Sustaining Support (Testing) 0.09%3 Maintenance 25.52% 5 Continuing System Improvements 11.90%3.1.2 Repair Parts (GSD) 9.06% 5.1 Hardware Modifications 44.95%3.2.1 DLR Fly 39.70% 5.2 Software Maintenance 55.05%3.2.2 DLR NonFly 0.00% 6 Indirect Support 1.96%3.4.1 Aircraft Overhaul/Rework Depot Repair 32.43% 6.1 Installation Support 74.66%3.4.2 Missile Overhaul/Rework Depot Repair 0.00% 6.2 Personnel Support 6.29%3.4.3 Engine Overhaul/Rework Depot Repair 14.40% 6.3 General Training & Education 19.05%3.4.4 Other Overhaul/Rework Depot Repair 0.03%
E-3C 1996-2016OSD-CAPE Cost Element Structure

107
1 Unit-Level Manpower 28.14% 3.5 Other Maintenance 0.00%1.1 Operations 38.51% 3.6 Interim Contractor Support 0.11%1.2 Unit-Level Maintenance 42.36% 3.7 Contractor Logistics Support 82.73%1.3 Other Unit-Level 19.14% 3.8 Other Contractor Support 0.00%2 Unit Operations 14.05% 4 Sustaining Support 0.24%2.1.1 Energy (Fuel, POL, Electricity) 61.98% 4.2 Support Equipment Replacement & Repair 46.56%2.1.2 Training Munitions & Expendable Stores
0.00%4.3 Sustaining/Systems Engineering
45.77%2.1.3 Other Operational Material 7.42% 4.4 Program Management 6.25%2.2 Support Services 20.01% 4.6 Data and Technical Publications 1.41%2.3 TDY 9.30% 4.7 Simulator Operations & Repair 0.00%2.4 Transportaion 1.29% 4.8.1 Other Sustaining Support (Testing) 0.00%3 Maintenance 43.12% 5 Continuing System Improvements 9.94%3.1.2 Repair Parts (GSD) 3.22% 5.1 Hardware Modifications 97.53%3.2.1 DLR Fly 6.47% 5.2 Software Maintenance 2.47%3.2.2 DLR NonFly 0.05% 6 Indirect Support 4.51%3.4.1 Aircraft Overhaul/Rework Depot Repair 0.00% 6.1 Installation Support 54.18%3.4.2 Missile Overhaul/Rework Depot Repair 0.00% 6.2 Personnel Support 3.31%3.4.3 Engine Overhaul/Rework Depot Repair 6.36% 6.3 General Training & Education 42.51%3.4.4 Other Overhaul/Rework Depot Repair 1.06%
OSD-CAPE Cost Element StructureE-8C 1996-2016
1 Unit-Level Manpower 17.95% 3.5 Other Maintenance 0.00%1.1 Operations 10.24% 3.6 Interim Contractor Support 0.00%1.2 Unit-Level Maintenance 73.11% 3.7 Contractor Logistics Support 98.56%1.3 Other Unit-Level 16.65% 3.8 Other Contractor Support 0.00%2 Unit Operations 9.60% 4 Sustaining Support 0.11%2.1.1 Energy (Fuel, POL, Electricity) 34.79% 4.2 Support Equipment Replacement & Repair 5.20%2.1.2 Training Munitions & Expendable Stores
0.00%4.3 Sustaining/Systems Engineering
83.97%2.1.3 Other Operational Material 9.06% 4.4 Program Management 0.49%2.2 Support Services 38.00% 4.6 Data and Technical Publications 9.99%2.3 TDY 16.56% 4.7 Simulator Operations & Repair 0.26%2.4 Transportaion 1.59% 4.8.1 Other Sustaining Support (Testing) 0.09%3 Maintenance 67.15% 5 Continuing System Improvements 2.58%3.1.2 Repair Parts (GSD) 0.71% 5.1 Hardware Modifications 90.87%3.2.1 DLR Fly 0.39% 5.2 Software Maintenance 9.13%3.2.2 DLR NonFly 0.28% 6 Indirect Support 2.61%3.4.1 Aircraft Overhaul/Rework Depot Repair 0.00% 6.1 Installation Support 56.97%3.4.2 Missile Overhaul/Rework Depot Repair 0.00% 6.2 Personnel Support 6.93%3.4.3 Engine Overhaul/Rework Depot Repair 0.00% 6.3 General Training & Education 36.10%3.4.4 Other Overhaul/Rework Depot Repair 0.07%
U-2S 1996-2016OSD-CAPE Cost Element Structure
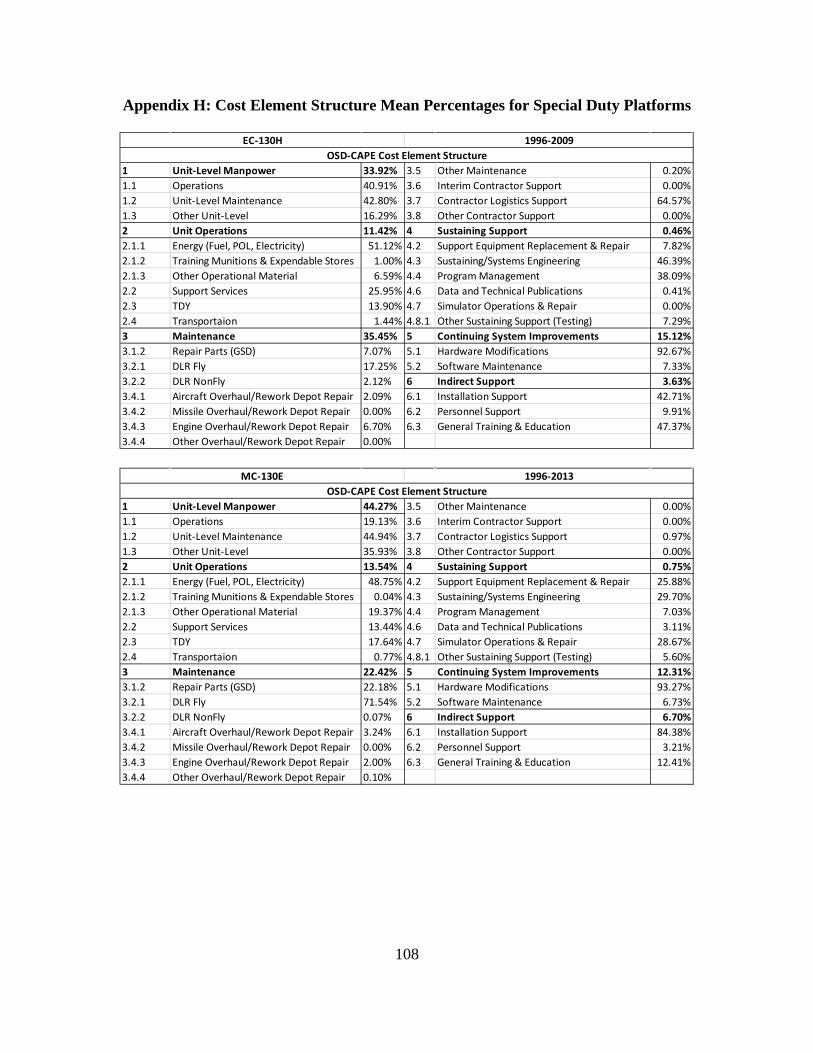
108
Appendix H: Cost Element Structure Mean Percentages for Special Duty Platforms
1 Unit-Level Manpower 33.92% 3.5 Other Maintenance 0.20%1.1 Operations 40.91% 3.6 Interim Contractor Support 0.00%1.2 Unit-Level Maintenance 42.80% 3.7 Contractor Logistics Support 64.57%1.3 Other Unit-Level 16.29% 3.8 Other Contractor Support 0.00%2 Unit Operations 11.42% 4 Sustaining Support 0.46%2.1.1 Energy (Fuel, POL, Electricity) 51.12% 4.2 Support Equipment Replacement & Repair 7.82%2.1.2 Training Munitions & Expendable Stores 1.00% 4.3 Sustaining/Systems Engineering 46.39%2.1.3 Other Operational Material 6.59% 4.4 Program Management 38.09%2.2 Support Services 25.95% 4.6 Data and Technical Publications 0.41%2.3 TDY 13.90% 4.7 Simulator Operations & Repair 0.00%2.4 Transportaion 1.44% 4.8.1 Other Sustaining Support (Testing) 7.29%3 Maintenance 35.45% 5 Continuing System Improvements 15.12%3.1.2 Repair Parts (GSD) 7.07% 5.1 Hardware Modifications 92.67%3.2.1 DLR Fly 17.25% 5.2 Software Maintenance 7.33%3.2.2 DLR NonFly 2.12% 6 Indirect Support 3.63%3.4.1 Aircraft Overhaul/Rework Depot Repair 2.09% 6.1 Installation Support 42.71%3.4.2 Missile Overhaul/Rework Depot Repair 0.00% 6.2 Personnel Support 9.91%3.4.3 Engine Overhaul/Rework Depot Repair 6.70% 6.3 General Training & Education 47.37%3.4.4 Other Overhaul/Rework Depot Repair 0.00%
EC-130H 1996-2009OSD-CAPE Cost Element Structure
1 Unit-Level Manpower 44.27% 3.5 Other Maintenance 0.00%1.1 Operations 19.13% 3.6 Interim Contractor Support 0.00%1.2 Unit-Level Maintenance 44.94% 3.7 Contractor Logistics Support 0.97%1.3 Other Unit-Level 35.93% 3.8 Other Contractor Support 0.00%2 Unit Operations 13.54% 4 Sustaining Support 0.75%2.1.1 Energy (Fuel, POL, Electricity) 48.75% 4.2 Support Equipment Replacement & Repair 25.88%2.1.2 Training Munitions & Expendable Stores 0.04% 4.3 Sustaining/Systems Engineering 29.70%2.1.3 Other Operational Material 19.37% 4.4 Program Management 7.03%2.2 Support Services 13.44% 4.6 Data and Technical Publications 3.11%2.3 TDY 17.64% 4.7 Simulator Operations & Repair 28.67%2.4 Transportaion 0.77% 4.8.1 Other Sustaining Support (Testing) 5.60%3 Maintenance 22.42% 5 Continuing System Improvements 12.31%3.1.2 Repair Parts (GSD) 22.18% 5.1 Hardware Modifications 93.27%3.2.1 DLR Fly 71.54% 5.2 Software Maintenance 6.73%3.2.2 DLR NonFly 0.07% 6 Indirect Support 6.70%3.4.1 Aircraft Overhaul/Rework Depot Repair 3.24% 6.1 Installation Support 84.38%3.4.2 Missile Overhaul/Rework Depot Repair 0.00% 6.2 Personnel Support 3.21%3.4.3 Engine Overhaul/Rework Depot Repair 2.00% 6.3 General Training & Education 12.41%3.4.4 Other Overhaul/Rework Depot Repair 0.10%
MC-130E 1996-2013OSD-CAPE Cost Element Structure
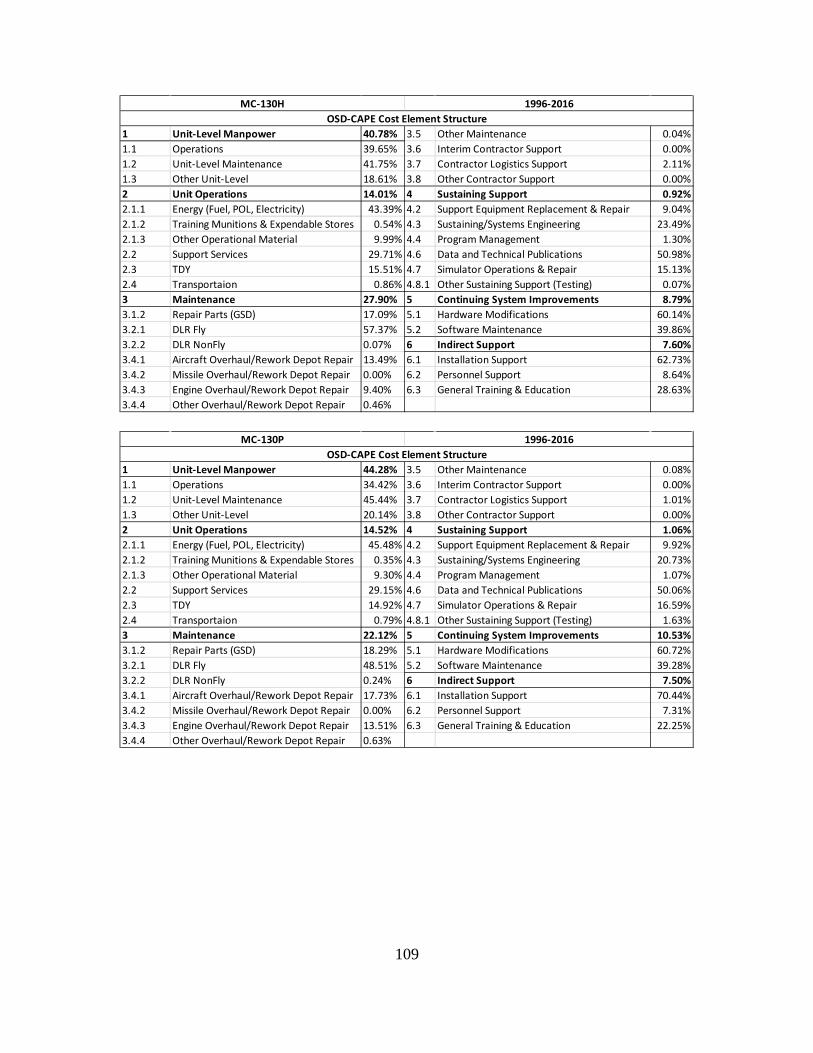
109
1 Unit-Level Manpower 40.78% 3.5 Other Maintenance 0.04%1.1 Operations 39.65% 3.6 Interim Contractor Support 0.00%1.2 Unit-Level Maintenance 41.75% 3.7 Contractor Logistics Support 2.11%1.3 Other Unit-Level 18.61% 3.8 Other Contractor Support 0.00%2 Unit Operations 14.01% 4 Sustaining Support 0.92%2.1.1 Energy (Fuel, POL, Electricity) 43.39% 4.2 Support Equipment Replacement & Repair 9.04%2.1.2 Training Munitions & Expendable Stores 0.54% 4.3 Sustaining/Systems Engineering 23.49%2.1.3 Other Operational Material 9.99% 4.4 Program Management 1.30%2.2 Support Services 29.71% 4.6 Data and Technical Publications 50.98%2.3 TDY 15.51% 4.7 Simulator Operations & Repair 15.13%2.4 Transportaion 0.86% 4.8.1 Other Sustaining Support (Testing) 0.07%3 Maintenance 27.90% 5 Continuing System Improvements 8.79%3.1.2 Repair Parts (GSD) 17.09% 5.1 Hardware Modifications 60.14%3.2.1 DLR Fly 57.37% 5.2 Software Maintenance 39.86%3.2.2 DLR NonFly 0.07% 6 Indirect Support 7.60%3.4.1 Aircraft Overhaul/Rework Depot Repair 13.49% 6.1 Installation Support 62.73%3.4.2 Missile Overhaul/Rework Depot Repair 0.00% 6.2 Personnel Support 8.64%3.4.3 Engine Overhaul/Rework Depot Repair 9.40% 6.3 General Training & Education 28.63%3.4.4 Other Overhaul/Rework Depot Repair 0.46%
MC-130H 1996-2016OSD-CAPE Cost Element Structure
1 Unit-Level Manpower 44.28% 3.5 Other Maintenance 0.08%1.1 Operations 34.42% 3.6 Interim Contractor Support 0.00%1.2 Unit-Level Maintenance 45.44% 3.7 Contractor Logistics Support 1.01%1.3 Other Unit-Level 20.14% 3.8 Other Contractor Support 0.00%2 Unit Operations 14.52% 4 Sustaining Support 1.06%2.1.1 Energy (Fuel, POL, Electricity) 45.48% 4.2 Support Equipment Replacement & Repair 9.92%2.1.2 Training Munitions & Expendable Stores 0.35% 4.3 Sustaining/Systems Engineering 20.73%2.1.3 Other Operational Material 9.30% 4.4 Program Management 1.07%2.2 Support Services 29.15% 4.6 Data and Technical Publications 50.06%2.3 TDY 14.92% 4.7 Simulator Operations & Repair 16.59%2.4 Transportaion 0.79% 4.8.1 Other Sustaining Support (Testing) 1.63%3 Maintenance 22.12% 5 Continuing System Improvements 10.53%3.1.2 Repair Parts (GSD) 18.29% 5.1 Hardware Modifications 60.72%3.2.1 DLR Fly 48.51% 5.2 Software Maintenance 39.28%3.2.2 DLR NonFly 0.24% 6 Indirect Support 7.50%3.4.1 Aircraft Overhaul/Rework Depot Repair 17.73% 6.1 Installation Support 70.44%3.4.2 Missile Overhaul/Rework Depot Repair 0.00% 6.2 Personnel Support 7.31%3.4.3 Engine Overhaul/Rework Depot Repair 13.51% 6.3 General Training & Education 22.25%3.4.4 Other Overhaul/Rework Depot Repair 0.63%
OSD-CAPE Cost Element StructureMC-130P 1996-2016
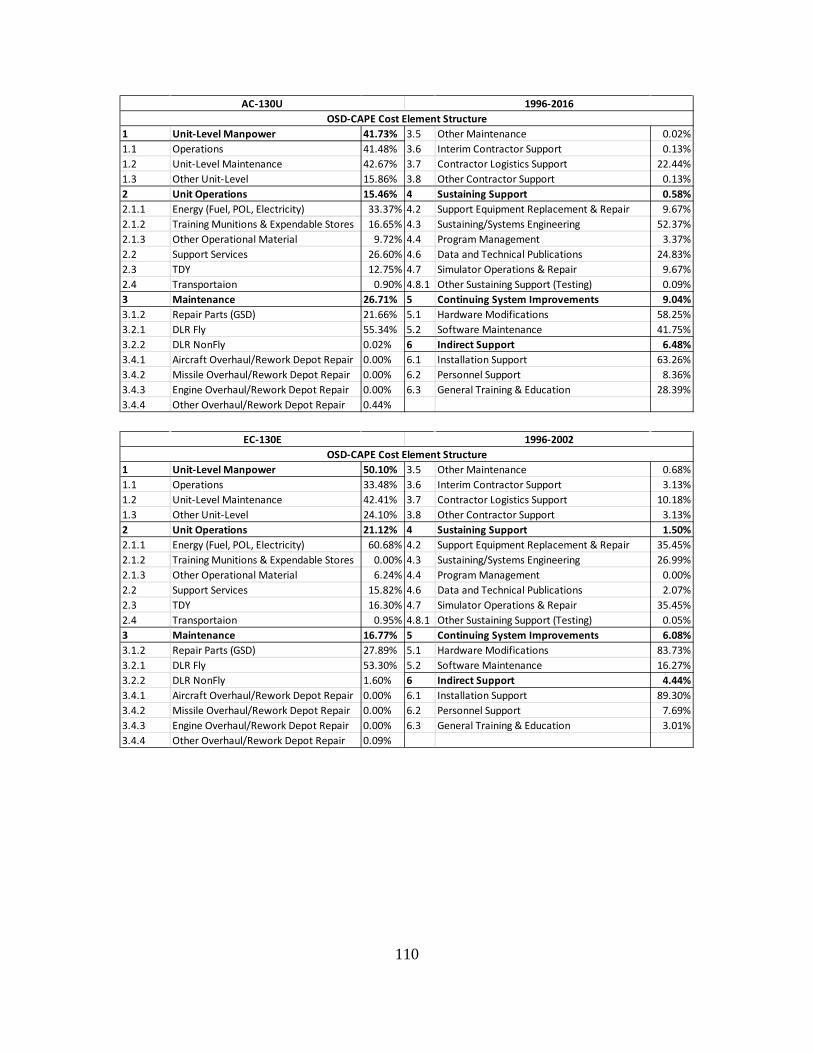
110
1 Unit-Level Manpower 41.73% 3.5 Other Maintenance 0.02%1.1 Operations 41.48% 3.6 Interim Contractor Support 0.13%1.2 Unit-Level Maintenance 42.67% 3.7 Contractor Logistics Support 22.44%1.3 Other Unit-Level 15.86% 3.8 Other Contractor Support 0.13%2 Unit Operations 15.46% 4 Sustaining Support 0.58%2.1.1 Energy (Fuel, POL, Electricity) 33.37% 4.2 Support Equipment Replacement & Repair 9.67%2.1.2 Training Munitions & Expendable Stores 16.65% 4.3 Sustaining/Systems Engineering 52.37%2.1.3 Other Operational Material 9.72% 4.4 Program Management 3.37%2.2 Support Services 26.60% 4.6 Data and Technical Publications 24.83%2.3 TDY 12.75% 4.7 Simulator Operations & Repair 9.67%2.4 Transportaion 0.90% 4.8.1 Other Sustaining Support (Testing) 0.09%3 Maintenance 26.71% 5 Continuing System Improvements 9.04%3.1.2 Repair Parts (GSD) 21.66% 5.1 Hardware Modifications 58.25%3.2.1 DLR Fly 55.34% 5.2 Software Maintenance 41.75%3.2.2 DLR NonFly 0.02% 6 Indirect Support 6.48%3.4.1 Aircraft Overhaul/Rework Depot Repair 0.00% 6.1 Installation Support 63.26%3.4.2 Missile Overhaul/Rework Depot Repair 0.00% 6.2 Personnel Support 8.36%3.4.3 Engine Overhaul/Rework Depot Repair 0.00% 6.3 General Training & Education 28.39%3.4.4 Other Overhaul/Rework Depot Repair 0.44%
AC-130U 1996-2016OSD-CAPE Cost Element Structure
1 Unit-Level Manpower 50.10% 3.5 Other Maintenance 0.68%1.1 Operations 33.48% 3.6 Interim Contractor Support 3.13%1.2 Unit-Level Maintenance 42.41% 3.7 Contractor Logistics Support 10.18%1.3 Other Unit-Level 24.10% 3.8 Other Contractor Support 3.13%2 Unit Operations 21.12% 4 Sustaining Support 1.50%2.1.1 Energy (Fuel, POL, Electricity) 60.68% 4.2 Support Equipment Replacement & Repair 35.45%2.1.2 Training Munitions & Expendable Stores 0.00% 4.3 Sustaining/Systems Engineering 26.99%2.1.3 Other Operational Material 6.24% 4.4 Program Management 0.00%2.2 Support Services 15.82% 4.6 Data and Technical Publications 2.07%2.3 TDY 16.30% 4.7 Simulator Operations & Repair 35.45%2.4 Transportaion 0.95% 4.8.1 Other Sustaining Support (Testing) 0.05%3 Maintenance 16.77% 5 Continuing System Improvements 6.08%3.1.2 Repair Parts (GSD) 27.89% 5.1 Hardware Modifications 83.73%3.2.1 DLR Fly 53.30% 5.2 Software Maintenance 16.27%3.2.2 DLR NonFly 1.60% 6 Indirect Support 4.44%3.4.1 Aircraft Overhaul/Rework Depot Repair 0.00% 6.1 Installation Support 89.30%3.4.2 Missile Overhaul/Rework Depot Repair 0.00% 6.2 Personnel Support 7.69%3.4.3 Engine Overhaul/Rework Depot Repair 0.00% 6.3 General Training & Education 3.01%3.4.4 Other Overhaul/Rework Depot Repair 0.09%
EC-130E 1996-2002OSD-CAPE Cost Element Structure

111
1 Unit-Level Manpower 40.69% 3.5 Other Maintenance 0.06%1.1 Operations 16.57% 3.6 Interim Contractor Support 1.95%1.2 Unit-Level Maintenance 44.94% 3.7 Contractor Logistics Support 8.22%1.3 Other Unit-Level 38.50% 3.8 Other Contractor Support 1.95%2 Unit Operations 18.43% 4 Sustaining Support 1.20%2.1.1 Energy (Fuel, POL, Electricity) 54.41% 4.2 Support Equipment Replacement & Repair 34.53%2.1.2 Training Munitions & Expendable Stores 0.04% 4.3 Sustaining/Systems Engineering 30.52%2.1.3 Other Operational Material 9.91% 4.4 Program Management 0.00%2.2 Support Services 26.08% 4.6 Data and Technical Publications 0.42%2.3 TDY 7.99% 4.7 Simulator Operations & Repair 34.53%2.4 Transportaion 1.58% 4.8.1 Other Sustaining Support (Testing) 0.00%3 Maintenance 18.52% 5 Continuing System Improvements 8.11%3.1.2 Repair Parts (GSD) 28.47% 5.1 Hardware Modifications 96.62%3.2.1 DLR Fly 59.27% 5.2 Software Maintenance 3.38%3.2.2 DLR NonFly 0.05% 6 Indirect Support 13.04%3.4.1 Aircraft Overhaul/Rework Depot Repair 0.00% 6.1 Installation Support 89.02%3.4.2 Missile Overhaul/Rework Depot Repair 0.00% 6.2 Personnel Support 3.26%3.4.3 Engine Overhaul/Rework Depot Repair 0.00% 6.3 General Training & Education 7.71%3.4.4 Other Overhaul/Rework Depot Repair 0.03%
WC-130H 1996-2016OSD-CAPE Cost Element Structure
1 Unit-Level Manpower 55.65% 3.5 Other Maintenance 0.05%1.1 Operations 16.91% 3.6 Interim Contractor Support 14.56%1.2 Unit-Level Maintenance 40.03% 3.7 Contractor Logistics Support 39.29%1.3 Other Unit-Level 43.06% 3.8 Other Contractor Support 14.56%2 Unit Operations 19.67% 4 Sustaining Support 0.76%2.1.1 Energy (Fuel, POL, Electricity) 58.43% 4.2 Support Equipment Replacement & Repair 50.00%2.1.2 Training Munitions & Expendable Stores 0.02% 4.3 Sustaining/Systems Engineering 0.00%2.1.3 Other Operational Material 15.41% 4.4 Program Management 0.00%2.2 Support Services 19.33% 4.6 Data and Technical Publications 0.00%2.3 TDY 6.32% 4.7 Simulator Operations & Repair 50.00%2.4 Transportaion 0.50% 4.8.1 Other Sustaining Support (Testing) 0.00%3 Maintenance 12.32% 5 Continuing System Improvements 6.45%3.1.2 Repair Parts (GSD) 14.21% 5.1 Hardware Modifications 99.91%3.2.1 DLR Fly 17.19% 5.2 Software Maintenance 0.09%3.2.2 DLR NonFly 0.14% 6 Indirect Support 5.15%3.4.1 Aircraft Overhaul/Rework Depot Repair 0.00% 6.1 Installation Support 71.41%3.4.2 Missile Overhaul/Rework Depot Repair 0.00% 6.2 Personnel Support 20.25%3.4.3 Engine Overhaul/Rework Depot Repair 0.00% 6.3 General Training & Education 8.34%3.4.4 Other Overhaul/Rework Depot Repair 0.00%
OSD-CAPE Cost Element StructureWC-130J 1996-2016
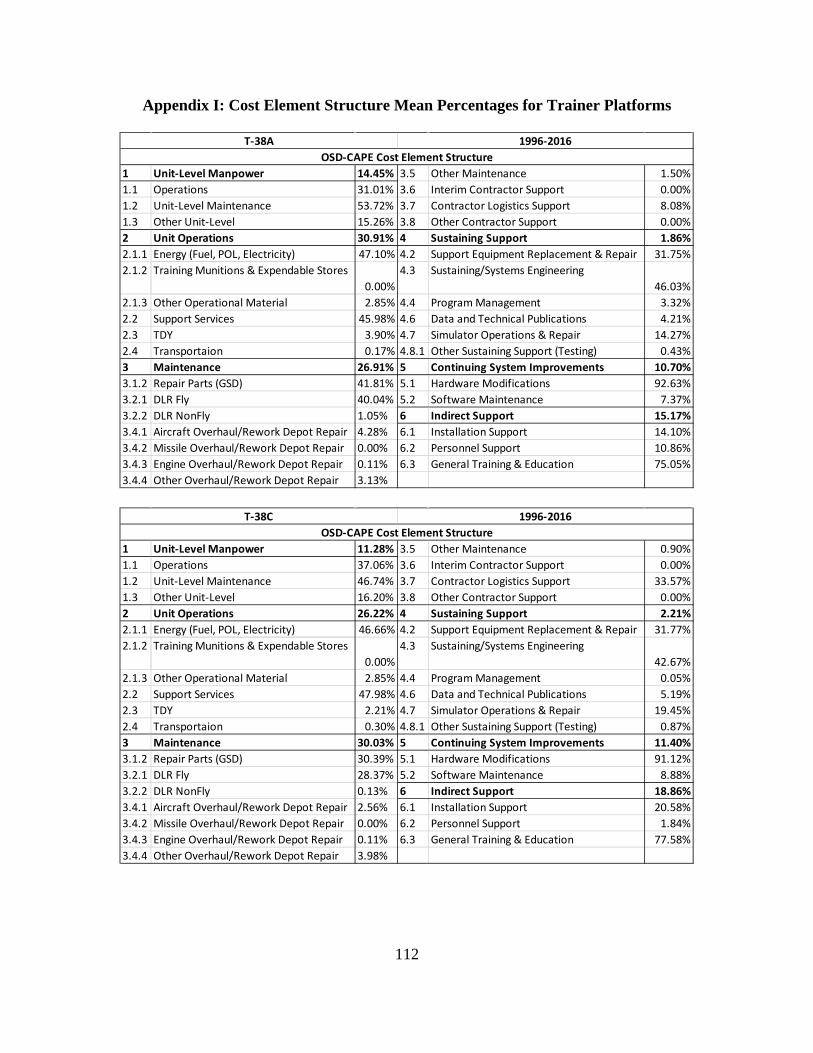
112
Appendix I: Cost Element Structure Mean Percentages for Trainer Platforms
1 Unit-Level Manpower 14.45% 3.5 Other Maintenance 1.50%1.1 Operations 31.01% 3.6 Interim Contractor Support 0.00%1.2 Unit-Level Maintenance 53.72% 3.7 Contractor Logistics Support 8.08%1.3 Other Unit-Level 15.26% 3.8 Other Contractor Support 0.00%2 Unit Operations 30.91% 4 Sustaining Support 1.86%2.1.1 Energy (Fuel, POL, Electricity) 47.10% 4.2 Support Equipment Replacement & Repair 31.75%2.1.2 Training Munitions & Expendable Stores
0.00%4.3 Sustaining/Systems Engineering
46.03%2.1.3 Other Operational Material 2.85% 4.4 Program Management 3.32%2.2 Support Services 45.98% 4.6 Data and Technical Publications 4.21%2.3 TDY 3.90% 4.7 Simulator Operations & Repair 14.27%2.4 Transportaion 0.17% 4.8.1 Other Sustaining Support (Testing) 0.43%3 Maintenance 26.91% 5 Continuing System Improvements 10.70%3.1.2 Repair Parts (GSD) 41.81% 5.1 Hardware Modifications 92.63%3.2.1 DLR Fly 40.04% 5.2 Software Maintenance 7.37%3.2.2 DLR NonFly 1.05% 6 Indirect Support 15.17%3.4.1 Aircraft Overhaul/Rework Depot Repair 4.28% 6.1 Installation Support 14.10%3.4.2 Missile Overhaul/Rework Depot Repair 0.00% 6.2 Personnel Support 10.86%3.4.3 Engine Overhaul/Rework Depot Repair 0.11% 6.3 General Training & Education 75.05%3.4.4 Other Overhaul/Rework Depot Repair 3.13%
T-38A 1996-2016OSD-CAPE Cost Element Structure
1 Unit-Level Manpower 11.28% 3.5 Other Maintenance 0.90%1.1 Operations 37.06% 3.6 Interim Contractor Support 0.00%1.2 Unit-Level Maintenance 46.74% 3.7 Contractor Logistics Support 33.57%1.3 Other Unit-Level 16.20% 3.8 Other Contractor Support 0.00%2 Unit Operations 26.22% 4 Sustaining Support 2.21%2.1.1 Energy (Fuel, POL, Electricity) 46.66% 4.2 Support Equipment Replacement & Repair 31.77%2.1.2 Training Munitions & Expendable Stores
0.00%4.3 Sustaining/Systems Engineering
42.67%2.1.3 Other Operational Material 2.85% 4.4 Program Management 0.05%2.2 Support Services 47.98% 4.6 Data and Technical Publications 5.19%2.3 TDY 2.21% 4.7 Simulator Operations & Repair 19.45%2.4 Transportaion 0.30% 4.8.1 Other Sustaining Support (Testing) 0.87%3 Maintenance 30.03% 5 Continuing System Improvements 11.40%3.1.2 Repair Parts (GSD) 30.39% 5.1 Hardware Modifications 91.12%3.2.1 DLR Fly 28.37% 5.2 Software Maintenance 8.88%3.2.2 DLR NonFly 0.13% 6 Indirect Support 18.86%3.4.1 Aircraft Overhaul/Rework Depot Repair 2.56% 6.1 Installation Support 20.58%3.4.2 Missile Overhaul/Rework Depot Repair 0.00% 6.2 Personnel Support 1.84%3.4.3 Engine Overhaul/Rework Depot Repair 0.11% 6.3 General Training & Education 77.58%3.4.4 Other Overhaul/Rework Depot Repair 3.98%
OSD-CAPE Cost Element StructureT-38C 1996-2016

113
1 Unit-Level Manpower 10.13% 3.5 Other Maintenance 4.56%1.1 Operations 42.13% 3.6 Interim Contractor Support 1.18%1.2 Unit-Level Maintenance 47.67% 3.7 Contractor Logistics Support 14.38%1.3 Other Unit-Level 10.20% 3.8 Other Contractor Support 1.18%2 Unit Operations 32.85% 4 Sustaining Support 1.72%2.1.1 Energy (Fuel, POL, Electricity) 50.57% 4.2 Support Equipment Replacement & Repair 11.66%2.1.2 Training Munitions & Expendable Stores
0.63%4.3 Sustaining/Systems Engineering
30.91%2.1.3 Other Operational Material 3.33% 4.4 Program Management 11.66%2.2 Support Services 42.69% 4.6 Data and Technical Publications 1.41%2.3 TDY 2.70% 4.7 Simulator Operations & Repair 32.68%2.4 Transportaion 0.07% 4.8.1 Other Sustaining Support (Testing) 11.66%3 Maintenance 17.62% 5 Continuing System Improvements 23.30%3.1.2 Repair Parts (GSD) 20.86% 5.1 Hardware Modifications 99.35%3.2.1 DLR Fly 36.34% 5.2 Software Maintenance 0.65%3.2.2 DLR NonFly 2.13% 6 Indirect Support 14.38%3.4.1 Aircraft Overhaul/Rework Depot Repair 10.82% 6.1 Installation Support 10.94%3.4.2 Missile Overhaul/Rework Depot Repair 1.18% 6.2 Personnel Support 0.11%3.4.3 Engine Overhaul/Rework Depot Repair 0.30% 6.3 General Training & Education 88.95%3.4.4 Other Overhaul/Rework Depot Repair 7.09%
AT-38B 1996-2006OSD-CAPE Cost Element Structure
1 Unit-Level Manpower 6.70% 3.5 Other Maintenance 0.00%1.1 Operations 63.82% 3.6 Interim Contractor Support 2.72%1.2 Unit-Level Maintenance 10.30% 3.7 Contractor Logistics Support 91.07%1.3 Other Unit-Level 25.88% 3.8 Other Contractor Support 2.72%2 Unit Operations 26.02% 4 Sustaining Support 2.92%2.1.1 Energy (Fuel, POL, Electricity) 56.29% 4.2 Support Equipment Replacement & Repair 31.44%2.1.2 Training Munitions & Expendable Stores
3.41%4.3 Sustaining/Systems Engineering
0.01%2.1.3 Other Operational Material 3.53% 4.4 Program Management 31.44%2.2 Support Services 33.79% 4.6 Data and Technical Publications 0.06%2.3 TDY 2.89% 4.7 Simulator Operations & Repair 5.61%2.4 Transportaion 0.09% 4.8.1 Other Sustaining Support (Testing) 31.44%3 Maintenance 32.89% 5 Continuing System Improvements 1.05%3.1.2 Repair Parts (GSD) 0.14% 5.1 Hardware Modifications 74.34%3.2.1 DLR Fly 0.00% 5.2 Software Maintenance 25.66%3.2.2 DLR NonFly 0.33% 6 Indirect Support 30.42%3.4.1 Aircraft Overhaul/Rework Depot Repair 0.12% 6.1 Installation Support 14.41%3.4.2 Missile Overhaul/Rework Depot Repair 2.72% 6.2 Personnel Support 0.67%3.4.3 Engine Overhaul/Rework Depot Repair 0.00% 6.3 General Training & Education 84.92%3.4.4 Other Overhaul/Rework Depot Repair 0.18%
T-1A 1996-2016OSD-CAPE Cost Element Structure
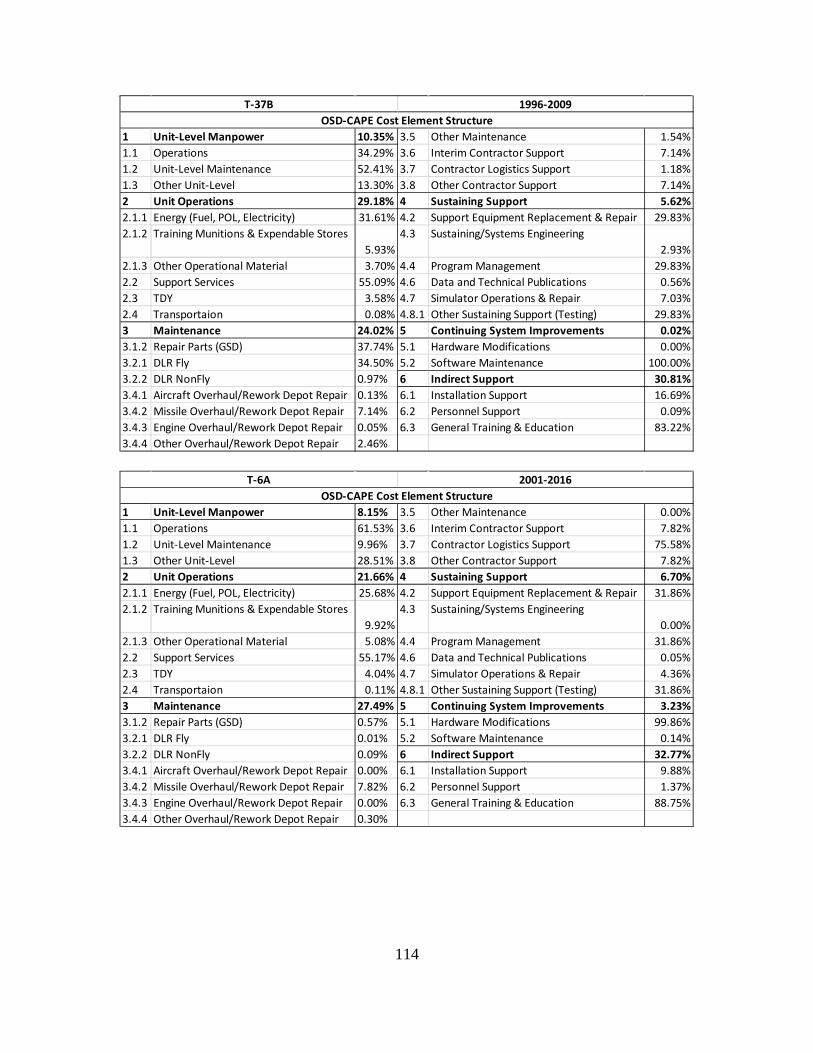
114
1 Unit-Level Manpower 10.35% 3.5 Other Maintenance 1.54%1.1 Operations 34.29% 3.6 Interim Contractor Support 7.14%1.2 Unit-Level Maintenance 52.41% 3.7 Contractor Logistics Support 1.18%1.3 Other Unit-Level 13.30% 3.8 Other Contractor Support 7.14%2 Unit Operations 29.18% 4 Sustaining Support 5.62%2.1.1 Energy (Fuel, POL, Electricity) 31.61% 4.2 Support Equipment Replacement & Repair 29.83%2.1.2 Training Munitions & Expendable Stores
5.93%4.3 Sustaining/Systems Engineering
2.93%2.1.3 Other Operational Material 3.70% 4.4 Program Management 29.83%2.2 Support Services 55.09% 4.6 Data and Technical Publications 0.56%2.3 TDY 3.58% 4.7 Simulator Operations & Repair 7.03%2.4 Transportaion 0.08% 4.8.1 Other Sustaining Support (Testing) 29.83%3 Maintenance 24.02% 5 Continuing System Improvements 0.02%3.1.2 Repair Parts (GSD) 37.74% 5.1 Hardware Modifications 0.00%3.2.1 DLR Fly 34.50% 5.2 Software Maintenance 100.00%3.2.2 DLR NonFly 0.97% 6 Indirect Support 30.81%3.4.1 Aircraft Overhaul/Rework Depot Repair 0.13% 6.1 Installation Support 16.69%3.4.2 Missile Overhaul/Rework Depot Repair 7.14% 6.2 Personnel Support 0.09%3.4.3 Engine Overhaul/Rework Depot Repair 0.05% 6.3 General Training & Education 83.22%3.4.4 Other Overhaul/Rework Depot Repair 2.46%
T-37B 1996-2009OSD-CAPE Cost Element Structure
1 Unit-Level Manpower 8.15% 3.5 Other Maintenance 0.00%1.1 Operations 61.53% 3.6 Interim Contractor Support 7.82%1.2 Unit-Level Maintenance 9.96% 3.7 Contractor Logistics Support 75.58%1.3 Other Unit-Level 28.51% 3.8 Other Contractor Support 7.82%2 Unit Operations 21.66% 4 Sustaining Support 6.70%2.1.1 Energy (Fuel, POL, Electricity) 25.68% 4.2 Support Equipment Replacement & Repair 31.86%2.1.2 Training Munitions & Expendable Stores
9.92%4.3 Sustaining/Systems Engineering
0.00%2.1.3 Other Operational Material 5.08% 4.4 Program Management 31.86%2.2 Support Services 55.17% 4.6 Data and Technical Publications 0.05%2.3 TDY 4.04% 4.7 Simulator Operations & Repair 4.36%2.4 Transportaion 0.11% 4.8.1 Other Sustaining Support (Testing) 31.86%3 Maintenance 27.49% 5 Continuing System Improvements 3.23%3.1.2 Repair Parts (GSD) 0.57% 5.1 Hardware Modifications 99.86%3.2.1 DLR Fly 0.01% 5.2 Software Maintenance 0.14%3.2.2 DLR NonFly 0.09% 6 Indirect Support 32.77%3.4.1 Aircraft Overhaul/Rework Depot Repair 0.00% 6.1 Installation Support 9.88%3.4.2 Missile Overhaul/Rework Depot Repair 7.82% 6.2 Personnel Support 1.37%3.4.3 Engine Overhaul/Rework Depot Repair 0.00% 6.3 General Training & Education 88.75%3.4.4 Other Overhaul/Rework Depot Repair 0.30%
OSD-CAPE Cost Element StructureT-6A 2001-2016
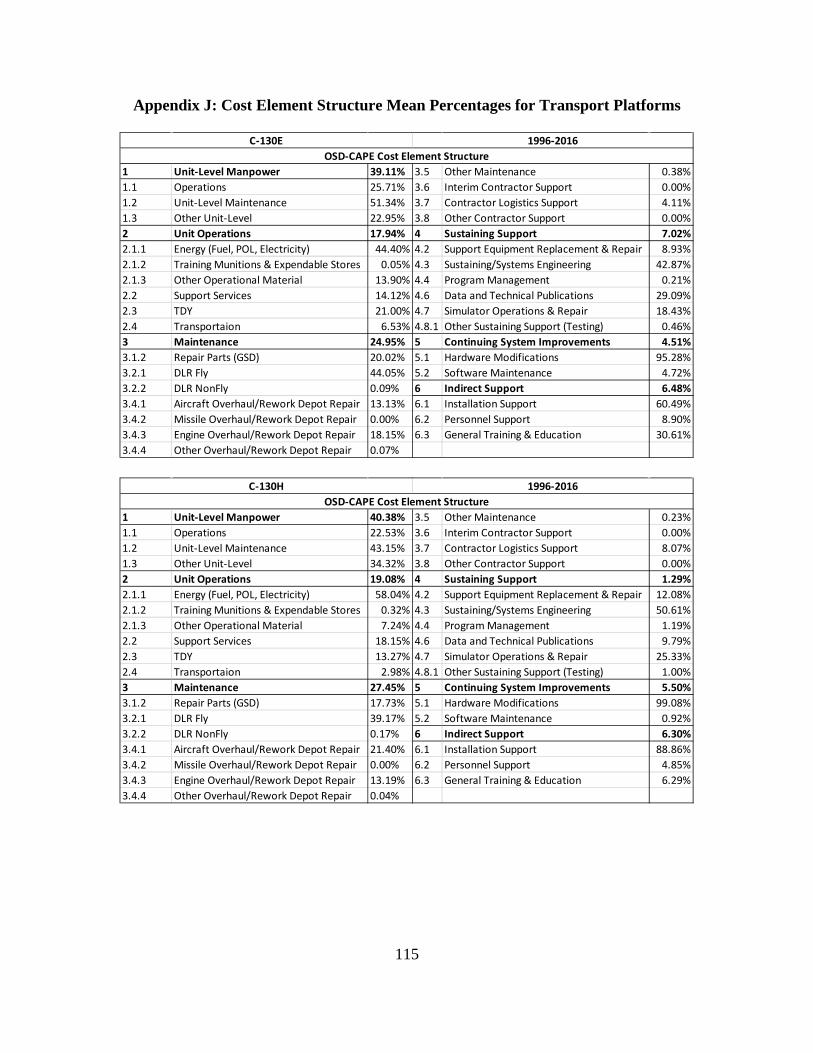
115
Appendix J: Cost Element Structure Mean Percentages for Transport Platforms
1 Unit-Level Manpower 39.11% 3.5 Other Maintenance 0.38%1.1 Operations 25.71% 3.6 Interim Contractor Support 0.00%1.2 Unit-Level Maintenance 51.34% 3.7 Contractor Logistics Support 4.11%1.3 Other Unit-Level 22.95% 3.8 Other Contractor Support 0.00%2 Unit Operations 17.94% 4 Sustaining Support 7.02%2.1.1 Energy (Fuel, POL, Electricity) 44.40% 4.2 Support Equipment Replacement & Repair 8.93%2.1.2 Training Munitions & Expendable Stores 0.05% 4.3 Sustaining/Systems Engineering 42.87%2.1.3 Other Operational Material 13.90% 4.4 Program Management 0.21%2.2 Support Services 14.12% 4.6 Data and Technical Publications 29.09%2.3 TDY 21.00% 4.7 Simulator Operations & Repair 18.43%2.4 Transportaion 6.53% 4.8.1 Other Sustaining Support (Testing) 0.46%3 Maintenance 24.95% 5 Continuing System Improvements 4.51%3.1.2 Repair Parts (GSD) 20.02% 5.1 Hardware Modifications 95.28%3.2.1 DLR Fly 44.05% 5.2 Software Maintenance 4.72%3.2.2 DLR NonFly 0.09% 6 Indirect Support 6.48%3.4.1 Aircraft Overhaul/Rework Depot Repair 13.13% 6.1 Installation Support 60.49%3.4.2 Missile Overhaul/Rework Depot Repair 0.00% 6.2 Personnel Support 8.90%3.4.3 Engine Overhaul/Rework Depot Repair 18.15% 6.3 General Training & Education 30.61%3.4.4 Other Overhaul/Rework Depot Repair 0.07%
C-130E 1996-2016OSD-CAPE Cost Element Structure
1 Unit-Level Manpower 40.38% 3.5 Other Maintenance 0.23%1.1 Operations 22.53% 3.6 Interim Contractor Support 0.00%1.2 Unit-Level Maintenance 43.15% 3.7 Contractor Logistics Support 8.07%1.3 Other Unit-Level 34.32% 3.8 Other Contractor Support 0.00%2 Unit Operations 19.08% 4 Sustaining Support 1.29%2.1.1 Energy (Fuel, POL, Electricity) 58.04% 4.2 Support Equipment Replacement & Repair 12.08%2.1.2 Training Munitions & Expendable Stores 0.32% 4.3 Sustaining/Systems Engineering 50.61%2.1.3 Other Operational Material 7.24% 4.4 Program Management 1.19%2.2 Support Services 18.15% 4.6 Data and Technical Publications 9.79%2.3 TDY 13.27% 4.7 Simulator Operations & Repair 25.33%2.4 Transportaion 2.98% 4.8.1 Other Sustaining Support (Testing) 1.00%3 Maintenance 27.45% 5 Continuing System Improvements 5.50%3.1.2 Repair Parts (GSD) 17.73% 5.1 Hardware Modifications 99.08%3.2.1 DLR Fly 39.17% 5.2 Software Maintenance 0.92%3.2.2 DLR NonFly 0.17% 6 Indirect Support 6.30%3.4.1 Aircraft Overhaul/Rework Depot Repair 21.40% 6.1 Installation Support 88.86%3.4.2 Missile Overhaul/Rework Depot Repair 0.00% 6.2 Personnel Support 4.85%3.4.3 Engine Overhaul/Rework Depot Repair 13.19% 6.3 General Training & Education 6.29%3.4.4 Other Overhaul/Rework Depot Repair 0.04%
OSD-CAPE Cost Element StructureC-130H 1996-2016

116
1 Unit-Level Manpower 40.20% 3.5 Other Maintenance 0.31%1.1 Operations 19.60% 3.6 Interim Contractor Support 3.71%1.2 Unit-Level Maintenance 45.86% 3.7 Contractor Logistics Support 50.32%1.3 Other Unit-Level 34.54% 3.8 Other Contractor Support 0.00%2 Unit Operations 16.86% 4 Sustaining Support 1.35%2.1.1 Energy (Fuel, POL, Electricity) 61.70% 4.2 Support Equipment Replacement & Repair 18.32%2.1.2 Training Munitions & Expendable Stores 0.12% 4.3 Sustaining/Systems Engineering 37.96%2.1.3 Other Operational Material 7.31% 4.4 Program Management 0.07%2.2 Support Services 19.20% 4.6 Data and Technical Publications 21.04%2.3 TDY 9.00% 4.7 Simulator Operations & Repair 22.55%2.4 Transportaion 2.67% 4.8.1 Other Sustaining Support (Testing) 0.06%3 Maintenance 24.55% 5 Continuing System Improvements 10.59%3.1.2 Repair Parts (GSD) 10.46% 5.1 Hardware Modifications 89.68%3.2.1 DLR Fly 17.05% 5.2 Software Maintenance 10.32%3.2.2 DLR NonFly 0.09% 6 Indirect Support 6.46%3.4.1 Aircraft Overhaul/Rework Depot Repair 17.87% 6.1 Installation Support 65.07%3.4.2 Missile Overhaul/Rework Depot Repair 0.00% 6.2 Personnel Support 4.62%3.4.3 Engine Overhaul/Rework Depot Repair 0.01% 6.3 General Training & Education 30.31%3.4.4 Other Overhaul/Rework Depot Repair 0.18%
C-130J 1996-2016OSD-CAPE Cost Element Structure
1 Unit-Level Manpower 23.24% 3.5 Other Maintenance 0.00%1.1 Operations 32.36% 3.6 Interim Contractor Support 0.01%1.2 Unit-Level Maintenance 55.05% 3.7 Contractor Logistics Support 81.46%1.3 Other Unit-Level 12.58% 3.8 Other Contractor Support 0.00%2 Unit Operations 38.42% 4 Sustaining Support 0.12%2.1.1 Energy (Fuel, POL, Electricity) 87.43% 4.2 Support Equipment Replacement & Repair 51.66%2.1.2 Training Munitions & Expendable Stores 0.03% 4.3 Sustaining/Systems Engineering 14.87%2.1.3 Other Operational Material 2.29% 4.4 Program Management 0.00%2.2 Support Services 5.92% 4.6 Data and Technical Publications 20.31%2.3 TDY 4.28% 4.7 Simulator Operations & Repair 13.17%2.4 Transportaion 0.05% 4.8.1 Other Sustaining Support (Testing) 0.00%3 Maintenance 27.47% 5 Continuing System Improvements 8.24%3.1.2 Repair Parts (GSD) 9.81% 5.1 Hardware Modifications 96.23%3.2.1 DLR Fly 7.55% 5.2 Software Maintenance 3.77%3.2.2 DLR NonFly 1.07% 6 Indirect Support 2.51%3.4.1 Aircraft Overhaul/Rework Depot Repair 0.08% 6.1 Installation Support 69.13%3.4.2 Missile Overhaul/Rework Depot Repair 0.00% 6.2 Personnel Support 2.79%3.4.3 Engine Overhaul/Rework Depot Repair 0.00% 6.3 General Training & Education 28.09%3.4.4 Other Overhaul/Rework Depot Repair 0.01%
C-17A 1996-2016OSD-CAPE Cost Element Structure

117
1 Unit-Level Manpower 36.46% 3.5 Other Maintenance 0.00%1.1 Operations 59.84% 3.6 Interim Contractor Support 0.00%1.2 Unit-Level Maintenance 18.75% 3.7 Contractor Logistics Support 98.44%1.3 Other Unit-Level 21.41% 3.8 Other Contractor Support 0.00%2 Unit Operations 25.14% 4 Sustaining Support 0.44%2.1.1 Energy (Fuel, POL, Electricity) 34.63% 4.2 Support Equipment Replacement & Repair 99.69%2.1.2 Training Munitions & Expendable Stores 0.00% 4.3 Sustaining/Systems Engineering 0.00%2.1.3 Other Operational Material 3.34% 4.4 Program Management 0.00%2.2 Support Services 34.07% 4.6 Data and Technical Publications 0.01%2.3 TDY 12.48% 4.7 Simulator Operations & Repair 0.30%2.4 Transportaion 15.47% 4.8.1 Other Sustaining Support (Testing) 0.00%3 Maintenance 28.20% 5 Continuing System Improvements 3.36%3.1.2 Repair Parts (GSD) 0.91% 5.1 Hardware Modifications 78.68%3.2.1 DLR Fly 0.16% 5.2 Software Maintenance 21.32%3.2.2 DLR NonFly 0.12% 6 Indirect Support 6.40%3.4.1 Aircraft Overhaul/Rework Depot Repair 0.36% 6.1 Installation Support 70.54%3.4.2 Missile Overhaul/Rework Depot Repair 0.00% 6.2 Personnel Support 1.29%3.4.3 Engine Overhaul/Rework Depot Repair 0.02% 6.3 General Training & Education 28.17%3.4.4 Other Overhaul/Rework Depot Repair 0.00%
C-21A 1996-2016OSD-CAPE Cost Element Structure
1 Unit-Level Manpower 24.17% 3.5 Other Maintenance 0.53%1.1 Operations 13.24% 3.6 Interim Contractor Support 0.00%1.2 Unit-Level Maintenance 59.53% 3.7 Contractor Logistics Support 3.50%1.3 Other Unit-Level 27.23% 3.8 Other Contractor Support 0.00%2 Unit Operations 17.74% 4 Sustaining Support 1.48%2.1.1 Energy (Fuel, POL, Electricity) 84.74% 4.2 Support Equipment Replacement & Repair 5.14%2.1.2 Training Munitions & Expendable Stores 0.00% 4.3 Sustaining/Systems Engineering 69.15%2.1.3 Other Operational Material 3.85% 4.4 Program Management 0.00%2.2 Support Services 5.85% 4.6 Data and Technical Publications 2.62%2.3 TDY 5.28% 4.7 Simulator Operations & Repair 23.10%2.4 Transportaion 0.27% 4.8.1 Other Sustaining Support (Testing) 0.00%3 Maintenance 35.09% 5 Continuing System Improvements 17.39%3.1.2 Repair Parts (GSD) 13.54% 5.1 Hardware Modifications 96.84%3.2.1 DLR Fly 30.30% 5.2 Software Maintenance 3.16%3.2.2 DLR NonFly 0.03% 6 Indirect Support 4.12%3.4.1 Aircraft Overhaul/Rework Depot Repair 33.19% 6.1 Installation Support 87.68%3.4.2 Missile Overhaul/Rework Depot Repair 0.00% 6.2 Personnel Support 1.40%3.4.3 Engine Overhaul/Rework Depot Repair 18.90% 6.3 General Training & Education 10.92%3.4.4 Other Overhaul/Rework Depot Repair 0.02%
OSD-CAPE Cost Element StructureC-5A 1996-2016

118
1 Unit-Level Manpower 25.12% 3.5 Other Maintenance 0.21%1.1 Operations 22.53% 3.6 Interim Contractor Support 0.00%1.2 Unit-Level Maintenance 62.97% 3.7 Contractor Logistics Support 6.75%1.3 Other Unit-Level 14.50% 3.8 Other Contractor Support 0.00%2 Unit Operations 21.18% 4 Sustaining Support 1.86%2.1.1 Energy (Fuel, POL, Electricity) 81.57% 4.2 Support Equipment Replacement & Repair 2.14%2.1.2 Training Munitions & Expendable Stores 0.06% 4.3 Sustaining/Systems Engineering 62.45%2.1.3 Other Operational Material 3.50% 4.4 Program Management 0.00%2.2 Support Services 7.96% 4.6 Data and Technical Publications 15.58%2.3 TDY 6.58% 4.7 Simulator Operations & Repair 19.83%2.4 Transportaion 0.34% 4.8.1 Other Sustaining Support (Testing) 0.00%3 Maintenance 35.86% 5 Continuing System Improvements 13.39%3.1.2 Repair Parts (GSD) 13.67% 5.1 Hardware Modifications 86.56%3.2.1 DLR Fly 36.35% 5.2 Software Maintenance 13.44%3.2.2 DLR NonFly 0.03% 6 Indirect Support 2.58%3.4.1 Aircraft Overhaul/Rework Depot Repair 23.55% 6.1 Installation Support 84.69%3.4.2 Missile Overhaul/Rework Depot Repair 0.00% 6.2 Personnel Support 3.08%3.4.3 Engine Overhaul/Rework Depot Repair 19.44% 6.3 General Training & Education 12.22%3.4.4 Other Overhaul/Rework Depot Repair 0.00%
C-5B 1996-2016OSD-CAPE Cost Element Structure
1 Unit-Level Manpower 28.50% 3.5 Other Maintenance 0.42%1.1 Operations 25.44% 3.6 Interim Contractor Support 0.00%1.2 Unit-Level Maintenance 63.21% 3.7 Contractor Logistics Support 9.34%1.3 Other Unit-Level 11.35% 3.8 Other Contractor Support 0.00%2 Unit Operations 15.13% 4 Sustaining Support 2.62%2.1.1 Energy (Fuel, POL, Electricity) 64.68% 4.2 Support Equipment Replacement & Repair 2.10%2.1.2 Training Munitions & Expendable Stores 0.03% 4.3 Sustaining/Systems Engineering 59.31%2.1.3 Other Operational Material 5.65% 4.4 Program Management 0.00%2.2 Support Services 15.44% 4.6 Data and Technical Publications 17.95%2.3 TDY 13.22% 4.7 Simulator Operations & Repair 20.64%2.4 Transportaion 0.97% 4.8.1 Other Sustaining Support (Testing) 0.00%3 Maintenance 37.15% 5 Continuing System Improvements 12.78%3.1.2 Repair Parts (GSD) 5.95% 5.1 Hardware Modifications 80.42%3.2.1 DLR Fly 18.48% 5.2 Software Maintenance 19.58%3.2.2 DLR NonFly 0.05% 6 Indirect Support 3.82%3.4.1 Aircraft Overhaul/Rework Depot Repair 35.99% 6.1 Installation Support 82.96%3.4.2 Missile Overhaul/Rework Depot Repair 0.00% 6.2 Personnel Support 0.79%3.4.3 Engine Overhaul/Rework Depot Repair 29.77% 6.3 General Training & Education 16.24%3.4.4 Other Overhaul/Rework Depot Repair 0.01%
C-5C 1996-2015OSD-CAPE Cost Element Structure

119
1 Unit-Level Manpower 38.82% 3.5 Other Maintenance 0.29%1.1 Operations 24.76% 3.6 Interim Contractor Support 0.00%1.2 Unit-Level Maintenance 43.04% 3.7 Contractor Logistics Support 13.47%1.3 Other Unit-Level 32.20% 3.8 Other Contractor Support 0.00%2 Unit Operations 13.59% 4 Sustaining Support 1.13%2.1.1 Energy (Fuel, POL, Electricity) 55.84% 4.2 Support Equipment Replacement & Repair 13.45%2.1.2 Training Munitions & Expendable Stores 0.52% 4.3 Sustaining/Systems Engineering 54.11%2.1.3 Other Operational Material 12.96% 4.4 Program Management 0.31%2.2 Support Services 18.64% 4.6 Data and Technical Publications 6.68%2.3 TDY 9.93% 4.7 Simulator Operations & Repair 24.96%2.4 Transportaion 2.11% 4.8.1 Other Sustaining Support (Testing) 0.49%3 Maintenance 27.12% 5 Continuing System Improvements 12.22%3.1.2 Repair Parts (GSD) 20.46% 5.1 Hardware Modifications 98.35%3.2.1 DLR Fly 39.63% 5.2 Software Maintenance 1.65%3.2.2 DLR NonFly 0.17% 6 Indirect Support 7.13%3.4.1 Aircraft Overhaul/Rework Depot Repair 18.60% 6.1 Installation Support 64.12%3.4.2 Missile Overhaul/Rework Depot Repair 0.00% 6.2 Personnel Support 5.38%3.4.3 Engine Overhaul/Rework Depot Repair 7.20% 6.3 General Training & Education 30.51%3.4.4 Other Overhaul/Rework Depot Repair 0.17%
HC-130N 1996-2016OSD-CAPE Cost Element Structure
1 Unit-Level Manpower 19.24% 3.5 Other Maintenance 0.00%1.1 Operations 40.83% 3.6 Interim Contractor Support 0.00%1.2 Unit-Level Maintenance 46.72% 3.7 Contractor Logistics Support 98.47%1.3 Other Unit-Level 12.45% 3.8 Other Contractor Support 0.00%2 Unit Operations 38.35% 4 Sustaining Support 1.72%2.1.1 Energy (Fuel, POL, Electricity) 95.25% 4.2 Support Equipment Replacement & Repair 17.22%2.1.2 Training Munitions & Expendable Stores 0.00% 4.3 Sustaining/Systems Engineering 1.53%2.1.3 Other Operational Material 0.95% 4.4 Program Management 29.85%2.2 Support Services 0.54% 4.6 Data and Technical Publications 0.00%2.3 TDY 3.25% 4.7 Simulator Operations & Repair 48.50%2.4 Transportaion 0.00% 4.8.1 Other Sustaining Support (Testing) 2.90%3 Maintenance 36.10% 5 Continuing System Improvements 3.53%3.1.2 Repair Parts (GSD) 0.53% 5.1 Hardware Modifications 99.99%3.2.1 DLR Fly 0.00% 5.2 Software Maintenance 0.01%3.2.2 DLR NonFly 0.01% 6 Indirect Support 1.06%3.4.1 Aircraft Overhaul/Rework Depot Repair 0.99% 6.1 Installation Support 86.62%3.4.2 Missile Overhaul/Rework Depot Repair 0.00% 6.2 Personnel Support 11.58%3.4.3 Engine Overhaul/Rework Depot Repair 0.00% 6.3 General Training & Education 1.80%3.4.4 Other Overhaul/Rework Depot Repair 0.00%
OSD-CAPE Cost Element StructureKC-10A 1996-2016
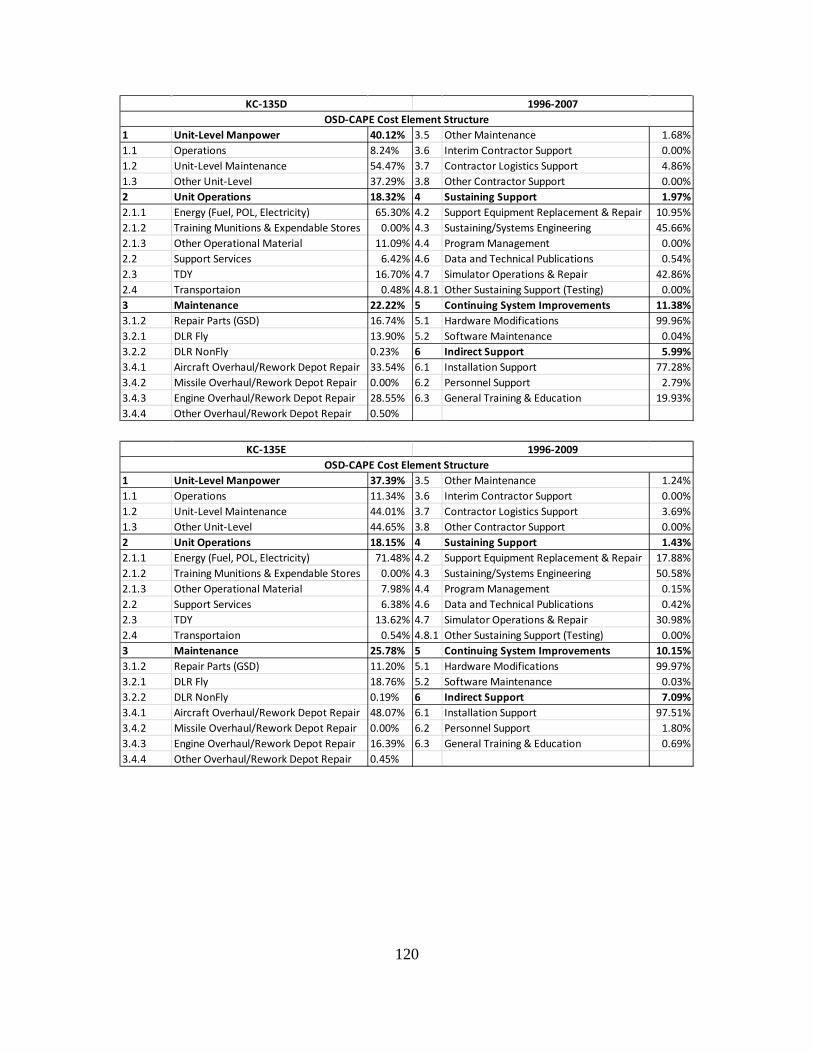
120
1 Unit-Level Manpower 40.12% 3.5 Other Maintenance 1.68%1.1 Operations 8.24% 3.6 Interim Contractor Support 0.00%1.2 Unit-Level Maintenance 54.47% 3.7 Contractor Logistics Support 4.86%1.3 Other Unit-Level 37.29% 3.8 Other Contractor Support 0.00%2 Unit Operations 18.32% 4 Sustaining Support 1.97%2.1.1 Energy (Fuel, POL, Electricity) 65.30% 4.2 Support Equipment Replacement & Repair 10.95%2.1.2 Training Munitions & Expendable Stores 0.00% 4.3 Sustaining/Systems Engineering 45.66%2.1.3 Other Operational Material 11.09% 4.4 Program Management 0.00%2.2 Support Services 6.42% 4.6 Data and Technical Publications 0.54%2.3 TDY 16.70% 4.7 Simulator Operations & Repair 42.86%2.4 Transportaion 0.48% 4.8.1 Other Sustaining Support (Testing) 0.00%3 Maintenance 22.22% 5 Continuing System Improvements 11.38%3.1.2 Repair Parts (GSD) 16.74% 5.1 Hardware Modifications 99.96%3.2.1 DLR Fly 13.90% 5.2 Software Maintenance 0.04%3.2.2 DLR NonFly 0.23% 6 Indirect Support 5.99%3.4.1 Aircraft Overhaul/Rework Depot Repair 33.54% 6.1 Installation Support 77.28%3.4.2 Missile Overhaul/Rework Depot Repair 0.00% 6.2 Personnel Support 2.79%3.4.3 Engine Overhaul/Rework Depot Repair 28.55% 6.3 General Training & Education 19.93%3.4.4 Other Overhaul/Rework Depot Repair 0.50%
KC-135D 1996-2007OSD-CAPE Cost Element Structure
1 Unit-Level Manpower 37.39% 3.5 Other Maintenance 1.24%1.1 Operations 11.34% 3.6 Interim Contractor Support 0.00%1.2 Unit-Level Maintenance 44.01% 3.7 Contractor Logistics Support 3.69%1.3 Other Unit-Level 44.65% 3.8 Other Contractor Support 0.00%2 Unit Operations 18.15% 4 Sustaining Support 1.43%2.1.1 Energy (Fuel, POL, Electricity) 71.48% 4.2 Support Equipment Replacement & Repair 17.88%2.1.2 Training Munitions & Expendable Stores 0.00% 4.3 Sustaining/Systems Engineering 50.58%2.1.3 Other Operational Material 7.98% 4.4 Program Management 0.15%2.2 Support Services 6.38% 4.6 Data and Technical Publications 0.42%2.3 TDY 13.62% 4.7 Simulator Operations & Repair 30.98%2.4 Transportaion 0.54% 4.8.1 Other Sustaining Support (Testing) 0.00%3 Maintenance 25.78% 5 Continuing System Improvements 10.15%3.1.2 Repair Parts (GSD) 11.20% 5.1 Hardware Modifications 99.97%3.2.1 DLR Fly 18.76% 5.2 Software Maintenance 0.03%3.2.2 DLR NonFly 0.19% 6 Indirect Support 7.09%3.4.1 Aircraft Overhaul/Rework Depot Repair 48.07% 6.1 Installation Support 97.51%3.4.2 Missile Overhaul/Rework Depot Repair 0.00% 6.2 Personnel Support 1.80%3.4.3 Engine Overhaul/Rework Depot Repair 16.39% 6.3 General Training & Education 0.69%3.4.4 Other Overhaul/Rework Depot Repair 0.45%
KC-135E 1996-2009OSD-CAPE Cost Element Structure

121
1 Unit-Level Manpower 33.14% 3.5 Other Maintenance 0.48%1.1 Operations 21.45% 3.6 Interim Contractor Support 0.00%1.2 Unit-Level Maintenance 53.17% 3.7 Contractor Logistics Support 2.01%1.3 Other Unit-Level 25.38% 3.8 Other Contractor Support 0.00%2 Unit Operations 24.68% 4 Sustaining Support 1.30%2.1.1 Energy (Fuel, POL, Electricity) 81.98% 4.2 Support Equipment Replacement & Repair 9.81%2.1.2 Training Munitions & Expendable Stores 0.00% 4.3 Sustaining/Systems Engineering 60.93%2.1.3 Other Operational Material 3.89% 4.4 Program Management 0.50%2.2 Support Services 4.74% 4.6 Data and Technical Publications 10.01%2.3 TDY 9.21% 4.7 Simulator Operations & Repair 18.69%2.4 Transportaion 0.18% 4.8.1 Other Sustaining Support (Testing) 0.07%3 Maintenance 30.57% 5 Continuing System Improvements 5.97%3.1.2 Repair Parts (GSD) 9.50% 5.1 Hardware Modifications 89.17%3.2.1 DLR Fly 18.81% 5.2 Software Maintenance 10.83%3.2.2 DLR NonFly 0.07% 6 Indirect Support 4.34%3.4.1 Aircraft Overhaul/Rework Depot Repair 55.55% 6.1 Installation Support 77.07%3.4.2 Missile Overhaul/Rework Depot Repair 0.00% 6.2 Personnel Support 3.83%3.4.3 Engine Overhaul/Rework Depot Repair 13.23% 6.3 General Training & Education 19.10%3.4.4 Other Overhaul/Rework Depot Repair 0.36%
KC-135R 1996-2009OSD-CAPE Cost Element Structure
1 Unit-Level Manpower 31.88% 3.5 Other Maintenance 0.15%1.1 Operations 30.37% 3.6 Interim Contractor Support 0.00%1.2 Unit-Level Maintenance 52.18% 3.7 Contractor Logistics Support 2.12%1.3 Other Unit-Level 17.45% 3.8 Other Contractor Support 0.00%2 Unit Operations 28.19% 4 Sustaining Support 1.49%2.1.1 Energy (Fuel, POL, Electricity) 81.65% 4.2 Support Equipment Replacement & Repair 8.53%2.1.2 Training Munitions & Expendable Stores 0.00% 4.3 Sustaining/Systems Engineering 62.51%2.1.3 Other Operational Material 3.37% 4.4 Program Management 0.27%2.2 Support Services 4.07% 4.6 Data and Technical Publications 13.52%2.3 TDY 10.83% 4.7 Simulator Operations & Repair 15.15%2.4 Transportaion 0.08% 4.8.1 Other Sustaining Support (Testing) 0.03%3 Maintenance 29.13% 5 Continuing System Improvements 6.71%3.1.2 Repair Parts (GSD) 7.79% 5.1 Hardware Modifications 83.96%3.2.1 DLR Fly 16.97% 5.2 Software Maintenance 16.04%3.2.2 DLR NonFly 0.12% 6 Indirect Support 2.59%3.4.1 Aircraft Overhaul/Rework Depot Repair 59.48% 6.1 Installation Support 82.58%3.4.2 Missile Overhaul/Rework Depot Repair 0.00% 6.2 Personnel Support 9.18%3.4.3 Engine Overhaul/Rework Depot Repair 12.73% 6.3 General Training & Education 8.24%3.4.4 Other Overhaul/Rework Depot Repair 0.64%
OSD-CAPE Cost Element StructureKC-135T 1996-2009
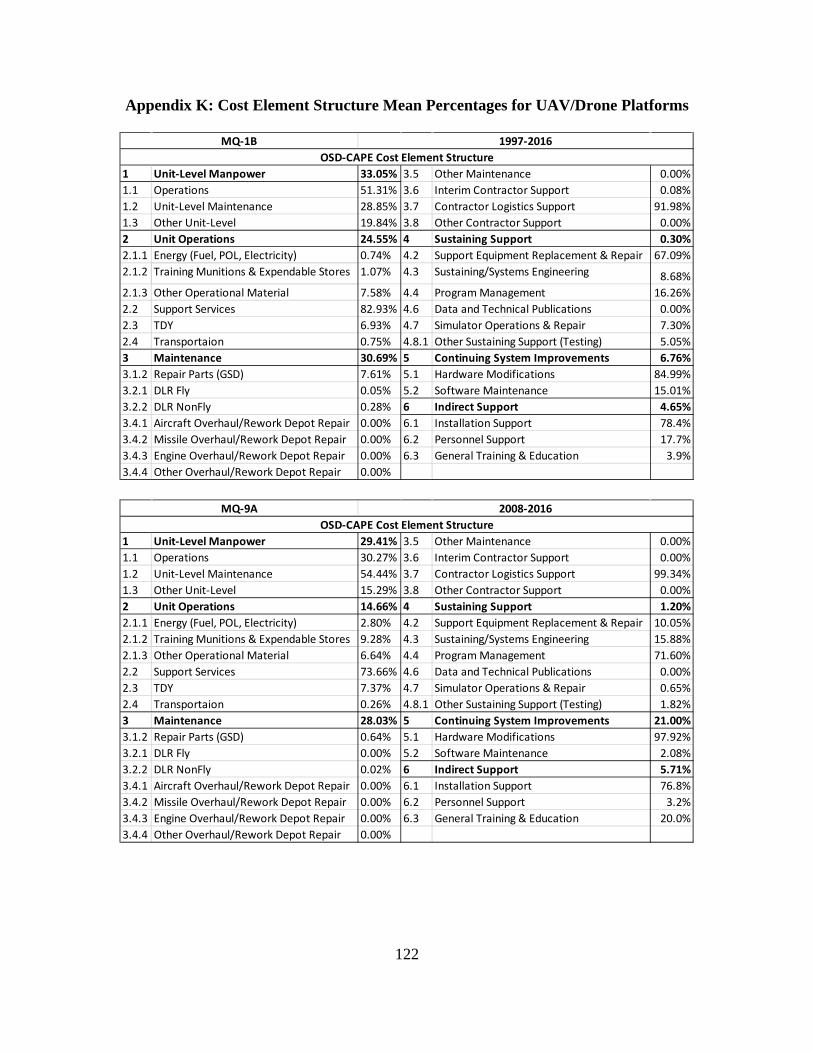
122
Appendix K: Cost Element Structure Mean Percentages for UAV/Drone Platforms
1 Unit-Level Manpower 33.05% 3.5 Other Maintenance 0.00%1.1 Operations 51.31% 3.6 Interim Contractor Support 0.08%1.2 Unit-Level Maintenance 28.85% 3.7 Contractor Logistics Support 91.98%1.3 Other Unit-Level 19.84% 3.8 Other Contractor Support 0.00%2 Unit Operations 24.55% 4 Sustaining Support 0.30%2.1.1 Energy (Fuel, POL, Electricity) 0.74% 4.2 Support Equipment Replacement & Repair 67.09%2.1.2 Training Munitions & Expendable Stores 1.07% 4.3 Sustaining/Systems Engineering 8.68%2.1.3 Other Operational Material 7.58% 4.4 Program Management 16.26%2.2 Support Services 82.93% 4.6 Data and Technical Publications 0.00%2.3 TDY 6.93% 4.7 Simulator Operations & Repair 7.30%2.4 Transportaion 0.75% 4.8.1 Other Sustaining Support (Testing) 5.05%3 Maintenance 30.69% 5 Continuing System Improvements 6.76%3.1.2 Repair Parts (GSD) 7.61% 5.1 Hardware Modifications 84.99%3.2.1 DLR Fly 0.05% 5.2 Software Maintenance 15.01%3.2.2 DLR NonFly 0.28% 6 Indirect Support 4.65%3.4.1 Aircraft Overhaul/Rework Depot Repair 0.00% 6.1 Installation Support 78.4%3.4.2 Missile Overhaul/Rework Depot Repair 0.00% 6.2 Personnel Support 17.7%3.4.3 Engine Overhaul/Rework Depot Repair 0.00% 6.3 General Training & Education 3.9%3.4.4 Other Overhaul/Rework Depot Repair 0.00%
MQ-1BOSD-CAPE Cost Element Structure
1997-2016
1 Unit-Level Manpower 29.41% 3.5 Other Maintenance 0.00%1.1 Operations 30.27% 3.6 Interim Contractor Support 0.00%1.2 Unit-Level Maintenance 54.44% 3.7 Contractor Logistics Support 99.34%1.3 Other Unit-Level 15.29% 3.8 Other Contractor Support 0.00%2 Unit Operations 14.66% 4 Sustaining Support 1.20%2.1.1 Energy (Fuel, POL, Electricity) 2.80% 4.2 Support Equipment Replacement & Repair 10.05%2.1.2 Training Munitions & Expendable Stores 9.28% 4.3 Sustaining/Systems Engineering 15.88%2.1.3 Other Operational Material 6.64% 4.4 Program Management 71.60%2.2 Support Services 73.66% 4.6 Data and Technical Publications 0.00%2.3 TDY 7.37% 4.7 Simulator Operations & Repair 0.65%2.4 Transportaion 0.26% 4.8.1 Other Sustaining Support (Testing) 1.82%3 Maintenance 28.03% 5 Continuing System Improvements 21.00%3.1.2 Repair Parts (GSD) 0.64% 5.1 Hardware Modifications 97.92%3.2.1 DLR Fly 0.00% 5.2 Software Maintenance 2.08%3.2.2 DLR NonFly 0.02% 6 Indirect Support 5.71%3.4.1 Aircraft Overhaul/Rework Depot Repair 0.00% 6.1 Installation Support 76.8%3.4.2 Missile Overhaul/Rework Depot Repair 0.00% 6.2 Personnel Support 3.2%3.4.3 Engine Overhaul/Rework Depot Repair 0.00% 6.3 General Training & Education 20.0%3.4.4 Other Overhaul/Rework Depot Repair 0.00%
MQ-9AOSD-CAPE Cost Element Structure
2008-2016
123
Bibliography
Arnold, S., Byun, J., Cloud, H., Gallo, A., Gonwa, M., Harmon, B., Patel, P., Sullivan, C., Hiller, J., & Broson, P. (2010). Institute for Defense Analyses. WSARA 2009:
Joint Strike Root Cause Analysis
Banford, A., Naegle, B., & Powley, E. (2014). Naval Postgraduate School. Analyzing the Effects of the Weapon Systems Acquisition Reform Act.
Boito, M., Keating, E. G., Wallace, J., & Deblois, B. (n.d.). Metrics to Compare Aircraft
Operating and Support Costs in the Department of Defense. Boito, M., Light, T., Mills, P.,& Baldwin, L. (2012). RAND Corporation. Managing U.S.
Air Force Aircraft Operating and Support Costs. Fiorello, M. R. (1975). Getting "Real" Data for Life-Cycle Costing. RAND. Fiorello, M. R. (1975). Combat Vehicle System Operating and Support Costs: Guidelines
for Analysis. RAND. Graves, T. J., Leader, P., Domin, J. S., & Porten, R. E. (1997). Trend in Weapon System
Operating and Support Costs
Harrison, S. (2013). The Impact of Increasing Acquisition Costs on the Operation and Support Budget for Military Equipment. Australian Defense Science and Technology Organisation, (June).
Jones, G., White, E., Ryan, E. T., & Ritschel, J. D. (2014). Investigation Into the Ratio of
OS to Life-Cycle Costs for DoD Weapon Systems. Defense Acquistion Review Journal, 21(1), 442–464.
Nachar, Nadim (2008). The Mann-Whitney U: A Test for Assessing Whether Two Independent Samples Come from the Same Distribution. Tutorials in Quantitative Methods for Psychology
Office of the Secretary of Defense: Cost Analysis Improvement Group. (2007). Operating and Support Cost-Estimating Guide
Office of the Secretary of Defense: Cost Assessment and Program Evaluation. (2010).
Operating and Support Cost-Estimating Guide
Office of the Secretary of Defense: Cost Assessment and Program Evaluation. (2014). Operating and Support Cost-Estimating Guide
124
Petter, J. (2014). An Analysis of Stability Properties in Earned Value Managements Cost Performance Index and Earned Schedules Schedule Performance Index. Air Force Institute of Technology.
Ritschel, J.D. (2012). Efficacy of US Legislation in Military Acquisition Programs:
Nunn–McCurdy Act Unveiled. Economic Papers, 31(4), 491-500. Ritschel, J.D. (2016). Organic or Contract Support: Investigating Cost and Performance
in Aircraft Sustainment. Journal of Transportation Management. Ryan, E. T, Jacques, D. R, Colombi, J. A, & Schubert, C. M. (2012). A Proposed
Methodology to Characterize the Accuracy of Life Cycle Cost Estimates for DoD Programs. Procedia Computer Science, 8, 361–369.
Ryan, E. T., Jacques, D. R., Ritschel, J. D., & Schubert, C. M. (2013). Characterizing The
Accuracy of DOD Operating and Support Cost Estimates. Journal of Public Procurement, 13(1), 103–132.
Ryan, E., Kabban S. C., Jacques, D., & Ritschel, J. (2013). A Macro-Stochastic Model for Improving the Accuracy of Department of Defense Life Cycle Cost Estimates. Journal of Cost Analysis and Parametric.
Schwartz, M. (2010). The Nunn-McCurdy Act : Background , Analysis , and Issues for
Congress. US GAO. (2009). Cost Estimating and Assessment Guide: Best Practices for Developing
and Managing Capital Program Costs. Retrieved August 2017
US GAO. (2010). Defense Management: DOD Needs Better Information and Guidance to More Effectively Manage and Reduce Operating and Support Costs of Major Weapon Systems. Study. Retrieved August 2017
US GAO (2012). Defense Logistics: Improvements Needed to Enhance Oversight of
Estimated Long- Term Costs for Operating and Supporting Major Weapon Systems. Study. Retrieved August 2017
US GAO. (2010). DoD Needs Better Information and Guidance to More Effectively
Manage and Reduce Opeating and Support Costs of Major Weapon Systems. US GAO. (2012). Improvements Needed to Enhance Oversight of Estimated Long-term
Costs for Operating and Supporting Major Weapon Systems. Study. Weapon Systems Acquisition Reform Act of 2009, Pub. L.–31. 111-13, 123 Stat. 1704,
codified as amended at 10 U.S.C.

125
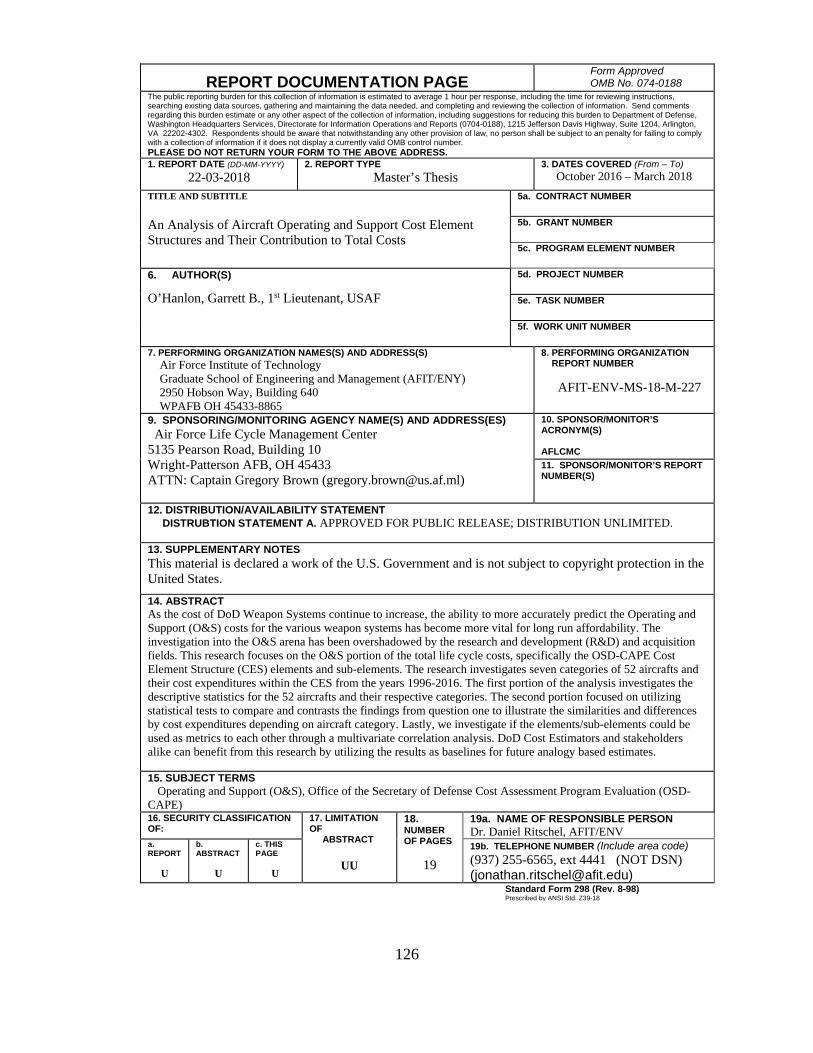
126
REPORT DOCUMENTATION PAGE Form Approved OMB No. 074-0188
The public reporting burden for this collection of information is estimated to average 1 hour per response, including the time for reviewing instructions, searching existing data sources, gathering and maintaining the data needed, and completing and reviewing the collection of information. Send comments regarding this burden estimate or any other aspect of the collection of information, including suggestions for reducing this burden to Department of Defense, Washington Headquarters Services, Directorate for Information Operations and Reports (0704-0188), 1215 Jefferson Davis Highway, Suite 1204, Arlington, VA 22202-4302. Respondents should be aware that notwithstanding any other provision of law, no person shall be subject to an penalty for failing to comply with a collection of information if it does not display a currently valid OMB control number. PLEASE DO NOT RETURN YOUR FORM TO THE ABOVE ADDRESS. 1. REPORT DATE (DD-MM-YYYY)
22-03-2018 2. REPORT TYPE
Master’s Thesis 3. DATES COVERED (From – To)
October 2016 – March 2018
TITLE AND SUBTITLE An Analysis of Aircraft Operating and Support Cost Element Structures and Their Contribution to Total Costs
5a. CONTRACT NUMBER
5b. GRANT NUMBER 5c. PROGRAM ELEMENT NUMBER
6. AUTHOR(S) O’Hanlon, Garrett B., 1st Lieutenant, USAF
5d. PROJECT NUMBER
5e. TASK NUMBER
5f. WORK UNIT NUMBER
7. PERFORMING ORGANIZATION NAMES(S) AND ADDRESS(S) Air Force Institute of Technology Graduate School of Engineering and Management (AFIT/ENY) 2950 Hobson Way, Building 640 WPAFB OH 45433-8865
8. PERFORMING ORGANIZATION REPORT NUMBER AFIT-ENV-MS-18-M-227
9. SPONSORING/MONITORING AGENCY NAME(S) AND ADDRESS(ES) Air Force Life Cycle Management Center 5135 Pearson Road, Building 10 Wright-Patterson AFB, OH 45433 ATTN: Captain Gregory Brown ([email protected])
10. SPONSOR/MONITOR’S ACRONYM(S) AFLCMC 11. SPONSOR/MONITOR’S REPORT NUMBER(S)
12. DISTRIBUTION/AVAILABILITY STATEMENT DISTRUBTION STATEMENT A. APPROVED FOR PUBLIC RELEASE; DISTRIBUTION UNLIMITED.
13. SUPPLEMENTARY NOTES This material is declared a work of the U.S. Government and is not subject to copyright protection in the United States. 14. ABSTRACT As the cost of DoD Weapon Systems continue to increase, the ability to more accurately predict the Operating and Support (O&S) costs for the various weapon systems has become more vital for long run affordability. The investigation into the O&S arena has been overshadowed by the research and development (R&D) and acquisition fields. This research focuses on the O&S portion of the total life cycle costs, specifically the OSD-CAPE Cost Element Structure (CES) elements and sub-elements. The research investigates seven categories of 52 aircrafts and their cost expenditures within the CES from the years 1996-2016. The first portion of the analysis investigates the descriptive statistics for the 52 aircrafts and their respective categories. The second portion focused on utilizing statistical tests to compare and contrasts the findings from question one to illustrate the similarities and differences by cost expenditures depending on aircraft category. Lastly, we investigate if the elements/sub-elements could be used as metrics to each other through a multivariate correlation analysis. DoD Cost Estimators and stakeholders alike can benefit from this research by utilizing the results as baselines for future analogy based estimates. 15. SUBJECT TERMS Operating and Support (O&S), Office of the Secretary of Defense Cost Assessment Program Evaluation (OSD-CAPE) 16. SECURITY CLASSIFICATION OF:
17. LIMITATION OF ABSTRACT
UU
18. NUMBER OF PAGES
19
19a. NAME OF RESPONSIBLE PERSON Dr. Daniel Ritschel, AFIT/ENV
a. REPORT
U
b. ABSTRACT
U
c. THIS PAGE
U
19b. TELEPHONE NUMBER (Include area code) (937) 255-6565, ext 4441 (NOT DSN) ([email protected])
Standard Form 298 (Rev. 8-98) Prescribed by ANSI Std. Z39-18