Embed Size (px)
Citation preview
AN ANALYSIS OF ASSESSMENT AND
EVALUATION OF TECHNOLOGY
EDUCATION TEACHERS IN WISCONSIN
by
Thomas DeLain
A Research Paper
Submitted in Partial Fulfillment of theRequirements for the
Master of Science DegreeWith a Major in
Industrial/Technology Education
Approved: 2 Semester Credits
___________________Dr. Howard Lee
Investigation Advisor
The Graduate CollegeUniversity of Wisconsin-Stout
May 19, 2000

i
The Graduate CollegeUniversity of Wisconsin - StoutMenomonie, Wisconsin 53751
ABTRACT
DeLain Thomas G. (Writer) (Last Name) (First) (Initial)
Measurement and Assessment in Technology Education (Title)
Industrial Technology Education Dr. Howard Lee 5/00 80 (Graduate Major) (Research Advisor) (Month/ Year) (Pages)
American Psychological Association (APA) Publication Manual (Name of Style Manual Used in this Study)
The problem that this research addressed was the shortage of information regarding
how technology education teachers within the State of Wisconsin are assessing grades 6 –
12 students. To gather information on contemporary assessment procedures a cross
sectional survey was developed and administered to 85 teachers. Each of these teachers
had, or was working towards DPI subject code 220, and was currently employed within a
WI school district.
Significant findings from this research include that technology education teachers do
frequently reference academic standards while creating lessons plans and assessment
instruments. Over half of all assessments administered by the sample group over the past
year were performance based. Common methods of measuring student psychomotor
performance included the use of checklists and rating scales. One-third of all
assessments were written tests, while oral examinations were only rarely used. The
sample group utilized a high proportion of objective test questions, but rarely used

ii
portfolios as an assessment strategy. Authentic assessments strategies were well
represented by the sample group.

iii
Table of Contents
Abstract……………………………………………………………………….……....…i
Table of Contents…………………………………………………..…………….……..iii
List of Tables………………………..……………………………………….….………v
Chapter I – Introduction……………………………………………………….….…….1
Statement of the Problem……………………………………………….………7
Purpose of the Study…………………………………………………….………8
Research Questions……………………………………………………………..9
Justification for the Study………………………………………………………10
Limitations of the Study………………………………………………………..11
Methodology……………………………………………………………………12
Chapter II – Review of Literature………………………………………………………13
Introduction……………………………………………………………………..13
Domains of Learning……………………………………………………………14
The Cognitive Domain…………………………………………………………..14
The Psychomotor Domain……………………………………………………….16
The Affective Domain…………………………………………………………...18
Educational Taxonomies and Assessment Methodologies………………………20
When and Why Assessments Occur……………………………………………..21
Categories of Cognitive Tests……………………………………………………23
Performance Assessments………………………………………………………..27
Oral Assessments…………………………………………………………...……29
iv
Other Assessments………………………………………………………………30
Assessments Within Technology Education…………………………………….31
Chapter III – Methods and Procedures…………………………………………………..33
Method of Study…………………………………………………………………33
Sample Selection…………………………………………………………………35
Instrumentation…………………………………………………………………..36
Pilot Test…………………………………………………………………………40
Procedures Followed……………………………………………………………..41
Data Analysis…………………………………………………………………….41
Chapter IV – Results and Discussion…………………………………………………….43
A Profile of Respondents…………………………………………………..…… 43
Survey Results Related to Research Questions……………………………….…46
Chapter V – Summary, Conclusions, and Recommendations……………………….…59
Restatement of the Problem…………………………………………………….59
Methods and Procedures Used………………………………………………….61
Major Findings………………………………………………………………….62
Conclusions…………………………………………………………………….63
Recommendations Related to This Study………………………………………67
Recommendations for Further Study…………………………………………...69
References………………………………………………………………………………70
Appendix A – A Survey of Technology Education Teachers………………………….73
Appendix B – Directions and Human Resource Consent Form………………………..75
v
List of Tables
Table 1 - Respondents Undergraduate Degree…………………………………….…….44
Table 2 - Respondents Graduate Degree…………………………………………….…..45
Table 3 - Respondents and Grade Level Instructed……………………………………..46
Table 4 - Referencing of Academic Standards…………………………………………..47
Table 5 - Use of Oral, Written, and Performance Based Assessments……………….…48
Table 6 - Analysis of Written Test Components…………………………………..…….48
Table 7 - Percentages of Objective Assessment Items……………………………….…50
Table 8 - Use of Checklists…………………………………………………….……..…51
Table 9 - Use of Rating Scales…………………………………………………….……52
Table 10 - Percentage of Authentic Assessments…………………………………..…..53
Table 11 - Use of Portfolios……………………………………………………………..54
Table 12 - Response Means and Standard Deviations……………………………...…..56
Table 13 - T-Test for Equality of Selected Means…………………………..…………58

1
Chapter I - Introduction
The main purpose of education is to aid students in achieving or mastering a series of
intended learning objectives. These objectives are typically related to enhancing the
students’ cognitive thought patterns, affective or emotional development, or psychomotor
activities (Linn & Gronlund, 2000). The Wisconsin Department of Public Instruction
(DPI) has put a tremendous amount of effort into quantifying these goals and has recently
published standards for eighteen separate subject areas. Standards have been developed
for the study of technology education. These academic standards describe what the
student population needs to learn and be able to do at specific times within their academic
program. Standards logically provide the foundation for testing; and test results are a
critical barometer of both student and teacher success (Wisconsin Department of Public
Instruction, 1998). At least in theory, academic standards tell the technology education
instructor what subject matter needs to be taught, and what material should be included
within our assessment tools for the evaluation of students’ progress.
Once the goals of an instructional program have been established, it is necessary to
determine if the students possess the knowledge and skills needed to embark upon the
planned instruction (Linn & Gronlund, 2000). There are several ways to conduct this
initial placement evaluation. The teacher can administer a pre-instructional test to assess
the student’s current knowledge of the topic, review student records regarding past
performance, make first hand personal observations of the students, administer student
self-report inventories, or talk to prior instructors.

2
It is only after this initial placement evaluation that it is possible for teachers and
other professionals to develop learning activities and experiences that are intended to
bring about desired changes. After periods of instruction and student practice, teachers
review student work and administer formative tests with the goal of ascertaining if the
student is making progress towards attainment of the desired academic goals (Hopkins,
1998). Graphically the three interacting components of education would look as shown
in Figure 1.
Figure 1. A graphic representation of the three interacting components of the educationalprocess.
The bi-directional arrows positioned between the text boxes indicate that this is a very
fluid and dynamic relationship. Decisions and results in one area continually cause
revisions to occur in the other areas.
Assessments, measurements, and evaluations are closely related concepts that are
confusing and frequently misused. People who have chosen education as their field of
employment should make every effort to understand the subtle differences between these
terms. Assessment refers to specific procedures and instruments used to gather
EducationalObjectives /State AcademicStandards.
Curriculum andLearningExperiences.
EvaluationProcedures and Assessment Tools.

3
information regarding student performance (Turnbull, Turnbull, Shank, & Leal, 1999).
Assessment tools and procedures are varied but include standardized and non-
standardized tests, the student’s cumulative school record, observations of the student in
the school setting, checklists or rating scales being employed by the instructor while
observing a task or finished product, or reviewing a portfolio of student work. Tests are
assessment instruments, but can be further defined as systematic procedures for
measuring a sample of behavior by posing a set of questions in a uniform manner (Linn,
& Gronlund, 2000).
A great amount of student assessment takes the form of tests. All tests can be
categorized as either written, oral, or manipulation and performance based (Wolansky,
1985). Oral and performance based tests are both extremely old. Wolansky states the
philosophers of ancient Greece used oral tests, and performance tests would have been
used as quality checks within early craft industries. Written tests are a more recent
development and would not have been commonly used until literacy rates improved
throughout the post medieval period.
Colleagues within the technology education discipline, college technology education
professors, and administrators at the State DPI, all have excellent suggestions and
theories about how students should be assessed. However, there appears to be a severe
shortage of information documenting exactly how Wisconsin’s technology education
teachers are actually assessing their students. Further study of actual assessment
procedures would be beneficial to current technology education teachers, college
instructors, and Department of Public Instruction administrators.

4
Modern technologically advanced societies routinely measure distances, areas,
volumes, temperatures, speeds, energy levels, power usage, skill levels, and individual
knowledge or intelligence levels. Some of these measurements are considered to be
“direct” because we can place a scale directly upon the object in question, and then count
off the metric or English units. In the field of education, measurement can be defined as
the process of obtaining a numerical description of the degree to which an individual
possesses a particular characteristic (Linn & Gronlund, 2000). Measuring student skill,
knowledge, and intelligence levels can be a very challenging task for educators. These
are intangible concepts that cannot be touched in any physical sense (Bott, 1995).
Educators frequently rely upon the students’ performance on assignments and tests as
“indirect” measurements regarding skill, knowledge, and intelligence levels. Whether the
numerical description is good or bad cannot be determined by solely examining this raw
assessment score.
Evaluation is the interpretation of the information secured though assessment
(Turnbull, Turnbull, Shank, and Leal, 1999). The evaluation process tells the student,
and their guardians what the scores mean. An evaluation is thus a summing-up process in
which value judgments can play a significant role. Educators use two distinctly different
evaluation processes. The first is referred to as criterion-referenced and the second is
called a norm-referenced evaluation. A norm-referenced evaluation describes a student’s
test performance in relation to a distribution of test scores arranged from the lowest to the
highest (Bott, 1995). The distribution of test scores can be from the current group of test
takers, or any prior group of test takers. The group of students’ scores that is used to
compare an individual’s score against is called the “norm group”. Examples of norm

5
groups could include all students within a specific classroom, all same grade students
within a given state, or all same grade students within the entire nation. Percentiles are a
common example of how norm-referenced assessment results are communicated. A
student is in the 90th percentile if the student outperforms 90% of the scores within the
norm group.
There are however, two problems with norm referenced testing procedures that
reduce its usefulness to the technology education teacher. First, there is the situation
where all students do extremely poor on a given exam. It is possible that a student would
only get 50% correct and still be at the top of the norm group. There are few instructors
if any that can justify an “A” evaluation for a student who only achieved 50% correct
responses. Secondly, while norm referenced tests adopt easily to the traditional “A”
through “ F” grading system, the uniqueness of each student makes it difficult for
technology education teachers to use norm referencing on a daily basis. No two students
enter the classroom with the same social and educational background. Student rankings
upon completion of a unit of instruction have considerably less value when the students
did not begin the educational program with the same knowledge base.
An alternative to “norm referencing” is the concept of “criterion referenced”
evaluations. Criterion-referenced evaluations are also referred to as being objective
based because they use assessment tools that measure whether students can perform a
specific task (Linn & Gronlund, 2000). Manual training schools, industrial arts
programs, and technology education instructors all have rich histories of using
performance objectives because of the extensive integration of labs and projects within
their curriculum.
6
A correctly designed performance objective has three components. First, it must
identify what the learner needs to do in behavioral terms. This behavioral performance,
or the results of the performance, needs to be available for the instructor to observe.
Secondly, the performance objective must also describe the relevant conditions under
which the performance will occur. Lastly, the objective must define what criterion will
be used to determine if the student has successfully completed the task (Bott, 1995, p.22).
Typing 30 words per minute, during a classroom examination, with a maximum of two
errors is an example of a performance objective that has all three of the fore mentioned
components.
Philosophically there is one other huge difference between norm referencing and
criterion referencing. Norm referencing is a more traditional approach to education
where the time the students remain on task remains fixed, and what varies is the degree of
competency achieved by the student. When an instructor uses norm referencing it is
assumed that assessment results will have a normal bell shaped distribution, and that
some percentage of students will fail. In contrast those instructors who stress
performance-based assessments require that all students achieve some minimal level of
competence prior too moving on to the next goal. With performance assessments it is
assumed that all students can and will “pass” the assessments (Wolansky, 1985).
Assessments are an extremely critical component within the educational process.
Studies have shown that students pursue course objectives more vigorously when they are
aware that tests are frequently administered. This makes intuitive sense as people in
general, and students in particular, are routinely faced with multiple demands being
placed upon a limited amount of time. As a result of this time squeeze students give less
7
attention to those courses where the instructors are not as active in assessing their
progress. Knowing that tests or other assessments are forthcoming makes the student
more receptive to learning new materials, and encourages retention of new information
for a longer period of time (Hopkins, 1998). Numerous small tests are a more effective
motivator of students than infrequent long tests.
Statement of the Problem
An evaluation is a process that relies on tests and other assessment devices to
determine if goals are being achieved. The problem this research will address is the
shortage of information regarding how technology education teachers within the State of
Wisconsin are assessing their grades 6 through 12 students. This research will quantify
the degree to which technology education teachers are relying upon oral, written, and
performance tests. It will also determine the frequency that specific types of questions
are being used on written examinations. These question types include true false, multiple
choice, matching, short answer, and essay. A secondary consideration within this
research will be to determine how extensively technology education teachers are using
checklists, rating scales, and portfolios. Only brief references will be made regarding the
evaluation or interpretation of the resulting scores. By focusing on assessment
instruments used, and not the interpretation of the information secured, it is hoped that
this research can bypass some of the value judgments that do materialize when grading
and promoting students.

8
Purpose of the Study
This study was conducted in an effort to improve the educational system at both the
state and local level. Through out the 1990’s, the University of Wisconsin-Stout has been
the only state university to offer a program that leads to a DPI certification to teach
technology education within the State of Wisconsin. To graduate from Stout’s program
in the year 2000 requires the student complete both a basic and an advanced course in
Curriculum Methods and Assessment. However, once the student receives his/her
teaching license there is no long-term follow-up procedure to determine if the practices
and principles being promoted in class are actually being used. This is not meant as a
criticism of Stout’s program as all other teacher preparation programs statewide have the
same problem in insuring long term implementation of proper teaching techniques.
This study will specifically examine the assessment practices being used today
within Wisconsin technology education classrooms. A thorough examination of current
assessment practices in the area of technology education could indicate that teachers are
doing a fabulous job, or it might identify serious deficiencies that need to be addressed.
Potential problems include not using appropriate assessment tools, not relating
curriculum and assessments to the statewide technology standards, or not using the
results to modify and refine existing learning activities. Veteran teachers pass on both
good and bad practices to their understudies. It is hoped that this study will aid those
college professors that are actively involved in the education of our next generation of
technology education teachers.
It is also hoped that any individual technology education teacher reading the results
of this study will find it enlightening and beneficial to their own teaching career. The
9
results of this study will minimally provide those teachers with a yardstick with which to
judge their own assessment practices.
Research Questions
This research will answer the following questions:
1. How frequently are technology education teachers referencing some defined set of
academic standards as they construct their lesson plans and subsequent assessment
tools?
2. What percentage of assessments given by technology education teachers could be
categorized as oral, written and performance based?
3. When technology education teachers make written assessments what percentages of
questions were True-false, multiple choice, matching, short answer, and essay?
4. To what extent are technology education teachers using objective versus subjective
assessments to assess their students?
5. To what extent are technology education teachers using checklists or rating scales to
assess processes or finished products?
6. What importance do technology education teachers place upon the concept of
authentic assessment?
7. How frequently do technology education teachers use student portfolios to evaluate
long-term progress?
8. Is there a difference in assessment practices between technology education teachers
that have graduated from the University of Wisconsin-Stout, versus those that
graduated from other educational institutions?

10
Justification for the Study
How students are assessed is of concern to a wide range of people. Many students
and parents want to know how current assessments relate to Wisconsin’s Model
Academic Standards. These academic standards are statements of what students should
know and be able to demonstrate at a given time in their educational process
(http://www.dpi.state.wi.us/dpi/oea/hsgtq&a.html). State law currently stipulates that
beginning in the 2002-03 school year, no school district can grant a diploma to any
student who does not pass a high school graduation test. Local school districts have the
option of either adopting the State graduation standards, or they may establish their own
local graduation standards, and to track their students progress towards the attainment of
those standards. Testing will be in the subject areas of English language arts,
mathematics, science, and social studies. Properly designed assessment instruments need
to correlate very highly with the goals contained in whichever set of standards the local
school board adopts.
Elected officials are also asking educators to set high standards to insure our students
remain competitive and capable of competing on an international basis. Classroom
instruction needs to provide students with the opportunity to learn and attain the
knowledge and skills that are needed in our information based society.
The business community is also interested because assessments serve to verify
claimed knowledge or competence, or to appraise readiness to master the training needed
in order to perform specific job tasks. Entrepreneurs and business managers view
assessments as a critical element in improving the match between the worker and a
prospective job. If American corporate enterprises are to remain competitive on an

11
international basis, it is critical that our schools provide them with a continuous supply of
technologically literate entry-level workers.
Taxpayers within the State of Wisconsin also have a vested interest in assessments
because they are paying the State’s education bill. The State of Wisconsin’s general
budget for fiscal year 2001 projects expenditures for General and Categorical School
Aids will total $4.35 billion. This represents 39.4% of the total projected $11.04 billion
State budget (State of Wisconsin Budget in Brief, 1999). Taxpayers want and need to see
tangible results from all of their monetary investments. Education is one of the most
sensitive areas of the budget due to the shear size of the monetary investment.
Limitations of the Study
1. According to the Wisconsin D.P.I. there were 1316 active technology education
teachers employed by a Wisconsin school districts as of September 1999. Each of
these teachers had D.P.I.’s technology education subject code 220 listed on their State
of Wisconsin teacher’s license, or were teaching under a provisional license while
completing a certification program. The only people asked to complete the survey
instrument used within this study were technology education teachers currently
employed by a Wisconsin school district for the 1999-2000 school year. Therefore,
the survey results are only intended to reflect assessment techniques used within
Wisconsin technology education courses during the 1999-2000 school year. The
conclusions should not be applied to any other disciplines, or to technology education
courses outside of the State of Wisconsin.

12
2. Secondly, only 85 actively employed technology education teachers completed the
survey. This is 6.5% of the 1316 employed technology education teachers within the
State of Wisconsin. All survey instruments are unreliable to some degree, and those
surveys with a small number of responses are subject to a greater probability of
chance errors (Fowler, 1993).
3. Lastly, the Hawthorne Effect is another limitation to be considered. The Hawthorne
effect is named after a study performed in the 1930’s in Hawthorne Illinois in which
it was discovered that the act of merely studying behaviors could impact and alter the
behavior being studied. The Hawthorne effect in clinical trials is sometimes
associated with the placebo effect (IQToolkit™ Glossary).
Methodology
The methodology used was a one page long cross sectional survey. The wording
within the survey questions was carefully selected to insure the validity and reliability of
the instrument. Each survey item addressed only one specific issue, and the instrument
supplied the participant with a predetermined set of possible responses. The actual
survey instrument is reprinted in Appendix “A” for your review.
The survey was distributed to employed technology education teachers in attendance at
the 31’ST Annual Spring Conference and Trade Show of the Wisconsin Technology
Education Association (WTEA). The WTEA is a professional association whose goal is
to be an advocate and recognized leader for technology education (www.wtea-wis.org).
The annual conference was held March 30– 31, 2000 at the Chula Vista Resort in the
Wisconsin Dells.

13
Chapter II - Review of Literature
Introduction
The problem that this research will address is a perceived shortage of information
regarding how technology education teachers are assessing their students. However, the
educational process is very dynamic. This review of literature takes into consideration
the earlier mentioned three-way multidirectional interaction between educational
standards and objectives, curriculum and learning objectives, and assessment tools and
evaluation procedures. Educational taxonomies are the first topic to be discussed within
this review of literature. Educational taxonomies contribute to assessment efforts by
categorizing and simplifying educational objectives. In a very broad context these
taxonomies list the changes that we hope will be occurring within our students.
Assessment tools then attempt to measure if those changes have occurred. After the
review of what is being assessed, this review of literature will discuss the various
purposes and functions that assessments serve within the classroom. Placement,
formative, and summative assessments are all discussed. This section answers the
question of “when and why” assessments occur. The last section of this review of
literature will discuss “how to” assess students. It will examine specific categories of
assessment tools. Assessments will be categorized as either oral, written, or performance
based. Furthermore, the roles of true false, multiple choice, matching, short answer, and
essay questions will be analyzed. Each type of assessment has its place within the
education of our student population. There is no one single correct assessment technique
because both objectives and the population of students are both so tremendously diverse.

14
Domains of Learning
Dr. Benjamin Bloom, and other education professionals in the 1950’s developed a
taxonomy, or classification system for educational objectives that is still relevant today
(Woolfolk, 1993). Dr. Bloom and his colleagues identified three major areas in which
learning occurs. These three distinct fields of learning have been named the cognitive
domain, the affective domain, and the psychomotor domain. Each of the three domains
was further divided into levels of learning that go from the simple to the complex (Bott,
1996). While the model portrays a hierarchical pattern to learning, Bloom and
colleagues understood that learning is does not always follow a linear path. Learning is
an ongoing process during which students are continually receiving information,
interpreting that information, connecting it to what they already know and have
experienced, and reorganizing and revising their internal conceptions of the world
(Herman, Aschbacher, & Winters, 1992). Taxonomies are relevant to this research
document because educators have found that specific assessment techniques have higher
success rates than others depending on which knowledge domain is being assessed. Even
within specific knowledge domains there is a need to use multiple assessment techniques.
The Cognitive Domain
The cognitive domain encompasses memory and reasoning skills. When ranked
according to “degree of challenge” the six objectives within the cognitive domain include
knowledge, comprehension, application, analysis, synthesis, and evaluation (Bloom,
Hastings, & Madaus, 1971). Knowledge according to Bloom, Hastings, and Madaus was
merely recalling factual information. In this relatively narrow context, a student who

15
knows a fact may not yet understand the relevance of the information, or how to apply it
in everyday life. Asking a student to define or name the parts of a camera or other
similar facts would be one way for a technology education teacher to ascertain if the
student had acquired knowledge (Bott, 1995). Comprehension is the second objective
within the cognitive domain. Students comprehend material when they understand the
material, and can restate the material into their own words. Application is the third
objective within Bloom’s taxonomy. It means that the student can use the learned
material. Application of knowledge is when a student solves a problem by inserting
appropriate values into a general rule or concept. For example, a student might insert
voltage and resistance values into Ohm’s Law to calculate the current flowing though an
electrical circuit. The fourth objective within the cognitive domain is analysis. This
means that the student is able to break material into its component parts. When students
analyze material they attempt to recognize unstated assumptions, and distinguish between
facts and inferences. Teachers frequently assess students’ analytical skills by asking
them to compare technologies, or debate issues. The fifth level of the cognitive domain
is synthesis. Synthesis is when the student can take a new or different idea and combine
them together to create something new. One example of how a technology education
teacher could check if the student has synthesized the material in a residential
construction course would be to ask the student to design a residential house. This would
require combining or synthesizing ideas on material selection, construction techniques,
building codes, and traffic flow into one finished product. The highest level of the
cognitive domain is evaluation. Evaluation occurs when the student is able to judge the

16
value of the materials or concepts learned. Asking the student to select the best design, or
rating various designs, would exemplify the evaluation process.
Bloom’s taxonomy of objectives is helpful in planning student assessments. This is
because some assessment procedures are simply more efficient than others in measuring
student learning both within and across various knowledge domains. Written and oral
tests are effective in assessing student learning within the cognitive domain (Bott, 1996).
Written tests are used more frequently because the instructor can test an entire class
simultaneously, whereas oral testing takes more of the instructor’s time. There is
evidence to suggest that knowledge, comprehension, application and analysis objectives
can be measured with true-false, short-answer, matching, or multiple-choice tests
questions (Woolfolk, 1993). Essay tests are an option for testing the middle levels of the
cognitive domains, but must be used when measuring synthesis and evaluation
objectives.
The Psychomotor Domain
The second broad area of learning is referred to as the psychomotor domain. One way
to conceptualize the psychomotor domain is to think of it as voluntary muscle capabilities
that require endurance, strength, flexibility, agility or speed (Kubiszyn & Borich, 2000).
The psychomotor domain also relates to the student’s ability to perform specific tasks.
Psychomotor activities are thus physical movements that range from reflex actions to
elaborate skilled motions. The psychomotor domain can be segmented into four skill
levels. These four levels of skill are referred to as observation, imitation, practice, and
adaptation (Bott, 1996). Observation being the lowest level merely requires that the

17
students watch or observe the teacher’s actions. For example, a technology education
teacher might ask the student to observe while molten aluminum is poured into a mold.
Imitation is the second level of the psychomotor domain. Imitation occurs within the
technology education classroom when the instructor demonstrates the correct procedure
to perform a task, and then asks the student to replicate the operation. Following a
written list of instructions on how to cut a piece of steel with an oxyacetylene torch can
also be considered a form of imitation because you are retracing the actions of a more
experienced person. Practice is the third level within the psychomotor domain. Practice
is similar to imitation, but implies working with less supervision. Technology students
might be asked to practice their shielded metal arc welding. The highest level of the
psychomotor domain is that of adaptation. Adaptation occurs when the student can take
learned skills, and apply them to new or novel situations. For example, a mechanical
design student who has successfully used various computer software packages should be
able to adapt when the lab installs a new or updated program.
Technology instructors need to be concerned with psychomotor assessment strategies
because many of the laboratory objectives within technology education curriculums are
related to physical movements. These physical movements range from directing a
computer by manipulating a computer keyboard or mouse, to altering the appearance of a
piece of wood by running it through a table saw or planer. While the technology
education curriculum is not specifically to prepare the student for future employment
opportunities within craft industries, the curriculum does acknowledge the importance of
well-developed hand and eye coordination.

18
Testing within the psychomotor domain relies heavily upon establishing performance
objectives as defined in the introduction to this research review. Vocational, technical,
and physical education teachers have tested within the psychomotor domain for decades,
but it is only recently that other disciplines have begun to realize the potential benefit to
these psychomotor assessments (Woolfolk, 1993). Momentarily, this review of literature
will expand upon how checklists and rating scales are used along with performance
objectives to improve assessments within the psychomotor domain.
While psychomotor objectives on the surface indicate mere manipulative behaviors,
they also include behaviors from the cognitive and affective domains. For example, the
manufacturing of a wooden furniture piece might require the student to design and the
select the wood stock for use in their design. Both the design and material selection
process requires that the student use cognitive thinking skills. The shaping, smoothing,
and finishing of the individual pieces can only be accomplished with a degree of
craftsmanship that relies heavily upon the affective domain.
The Affective Domain
The last domain of learning to be discussed within this research document is referred
to as the affective domain. The affective domain pertains to attitudes, feelings, values
and emotions. As with the cognitive and psychomotor domains there is again a ranking
of objectives. This ranking begins with the student having only a mild commitment to a
belief, and concludes with being extremely committed. In order of commitment the five
basic objectives within the affective domain were categorized as receiving, responding,
valuing, organizing, and characterization (Bloom, Hastings & Madaus, 1971). By being

19
aware of, or paying attention to something in the environment, a person is receiving a
message. Think of the many times every day that a student is aware of some message
coming across the schools public address system. At the second level within the affective
domain a person might respond, or participate in the environmental activity. Tapping out
the beat as you listen to a song, or clapping at the conclusion of the schools theatrical
performance would be examples of responding. Valuing is the middle level of the
affective domain. When a person values something they show a commitment or
involvement with the activity or belief. Students show they value activities whenever
they attend extracurricular activities outside of the routine 8:00 AM – 3:00 PM school
day. Organization is the next layer to last layer within the affective domain.
Organization means the student has integrated a belief into their general set of values.
Educational psychologists suggest that teachers can observe which values are high on the
student’s internal organization by monitoring which receive long-term commitments.
The highest level of the affective domain is characterization. Characterization occurs
when the person adopts and behaves in accordance to a long-term philosophy or value
system.
Assessing student values, feelings, and emotions is more challenging than measuring
their cognitive or psychomotor capabilities. Some students consider their feelings and
values to be private, and outside the proper realm of the classroom. This explains why it
is extremely difficult to directly assess students for affective learning by means of a
written or oral examination. Accurate affective domain assessments can only occur when
the teacher acknowledges student privacy concerns when writing unit objectives. Some
professionals advocate writing these objectives in terms of observable behaviors (Bott,
20
1996). Student behaviors and actions are then used to indirectly assess their feelings and
attitudes. For example, a student who routinely ignores requests to use safety guards
while operating power equipment is clearly exhibiting a negative attitude towards safety.
Conversely a student who routinely shows up for class on time, and helps with clean-up
task is displaying a positive attitude towards both punctuality and responsibility.
Educational Taxonomies and Assessment Methodologies
Two general comments should be made about the relationship between educational
taxonomies and assessment methodologies. First, most educators view knowledge
domain objectives as a hierarchy with each skill building upon those below it.
Conceptualizing the objectives as a hierarchy is helpful even though close scrutiny would
find a few exceptions to the general rule (Woolfolk, 1993). Because educators think of
objectives as a hierarchy, it is common to hear and read references to lower-level and
higher-level objectives. In reality the higher-level tasks may not be more difficult for the
student to accomplish. Rather the objective may only require that the student possess a
greater understanding of the subject material. A benefit of the hierarchical
conceptualization is that it helps to explain why there are different assessment strategies
for the various levels within the knowledge domains.
The second comment that must be made is that educational taxonomies were an
attempt to simplify educational objectives. While that is a worthy goal, it is equally
important to recognize the complexity of human behaviors. Student behaviors rarely can
be isolated into only one of the knowledge domains. In contrast, behaviors frequently
cross over into all three or the knowledge domains simultaneously. For example, a social

21
studies student answering an essay question on the holocaust of World War II would
draw from all three learning domains. The student is remembering and analyzing facts
from the cognitive domain. The act of writing out the answer is a simple psychomotor
task, and it is extremely likely that the student would experience some emotional
response from the affective domain. Likewise, a technology education student engaged
in laboratory tasks will frequently engage all learning domains simultaneously.
When and Why Assessments Occur
Assessment procedures and tests can be categorized according to the function that
they serve within the classroom. Chronologically, the first assessment that the student
would encounter would be referred to as a placement assessment. Placement assessments
are made prior to any instruction, and serve to verify that the students have the
prerequisite skills to succeed in reaching the stated goals (Linn & Gronlund, 2000). Only
after the instructor acquires a sense for what the students currently know can general
course goals get translated into actual classroom lessons and learning activities.
Formative assessments are conducted while the learning activities are going on.
They monitor and guide the learning process and are intended to improve the learning
process (Airasian, 1994). Informal formative assessments occur continuously as the
teacher makes minute-by-minute decisions about how to proceed with any ongoing
lesson. Experienced teachers are constantly examining student facial expressions, body
language, and general classroom interaction as a guide to whether students are engaged
by the lesson. While somewhat unusual, formative assessments in the form of quizzes,
worksheets, and assignments can be recorded for future evaluation purposes. Formative

22
assessments benefit both the students and the teacher. Feedback to the student includes
positive reinforcement for mastering unit objectives, or identification of those areas that
need further study and practice. Feedback to the teacher helps to determine if additional
time is needed prior too moving on to new objectives. If the role of the teacher is that of
mentor, students should be able to convince instructors to radically adjust their lessons
and learning activities under the guise of formative assessment.
There may be times when obstacles to the learning process cannot be overcome by
routine formative assessments. When a student repeatedly fails in their attempt to master
a subject, it may be necessary to do a diagnostic assessment. These diagnostic
assessments search for the underlying causes to learning problems. They may be quite
detailed and employ the services of trained educational and medical associates.
Diagnostic assessments frequently result in the student receiving additional support
services as authorized by the Individuals with Disabilities Education Act. Additional
student support services are prescribed and outlined an Individualized Education Plan
(IEP) for the student (Linn & Gronlund, 2000).
At the end of any instructional unit or course there needs to be a summative
assessment to determine if the student has achieved the prescribed instructional goals and
objectives. These assessments are frequently in the form of formal tests, projects, or term
papers. Typically the results are in writing, and do get factored into the teacher’s
evaluation of student’s progress for that lesson. Remember that the assessment is the tool
or procedure used for determining student learning. The evaluation process then
interprets the results of the assessment and provides the official interpretation of the
results to the individual student, and their legal guardian (Airasian, 1994).

23
Categories of Cognitive Tests
There are three broad categories of tests used by teachers to assess students
(Wolansky, 1985). These three broad categories are written tests, performance tests, and
oral tests. All tests have unique characteristics by which their usefulness can be judged.
Several of these characteristics include reliability, validity, objectivity, and efficiency.
Tests are reliable when they give consistent measurement results over the course of
several repeated applications, and they are valid when the test actually measures what it
claims to be measuring (Farr & Trumbull, 1997). Objectivity is the opposite of
subjectivity. A test is subjective if test responses are vulnerable to the scorer’s personal
biases and prejudices. Objective test results do not depend on the mood, identity, or
personal judgement of the scorer. Increasing test objectivity has a very favorable impact
upon the validity of the test (Hopkins, 1998). Test efficiency is also a consideration
because time spent taking tests allows less time for other new learning experiences.
Reliability, validity, objectivity, and efficiency are all desirable test characteristics that
educational professionals need to keep in mind as they construct their tests. However, as
you will shortly see, improvements in one test attribute are frequently made only at the
expense of other desirable attributes.
Written tests include true or false questions, multiple choice questions, matching
items, short answer, and essay questions. True-false tests present the student with a
statement and ask the student to state if it is true or false. True and false questions are
extremely objective and efficient, but not a very reliable indicator of student progress
because you can guess the correct answer 50% of the time. Some teachers have

24
attempted to increase the reliability of the true-false question by adding an “explain”
column in which the student has to justify their answer (Davis, 1993).
Multiple choice test items present the test taker with a stem statement that either
contains a question, or an incomplete statement. The student is then required to select an
answer from a list of four or five possible answers (Popham, 2000). The major advantage
to using correctly designed multiple-choice questions is that they are capable of
measuring the entire spectrum of the cognitive domain. Multiple-choice tests are
efficient because many questions can be answered and scored quickly. They are also
objective because there is only one correct response. Negative aspects regarding multiple
choice questions include being somewhat unreliable in determining student
comprehension because of a high probability of guessing the correct answer, and being of
little value in assessing within the psychomotor and affective domains.
Matching test items present the student with two lists of words that need to be
matched together. The list of words that require a match is called the premises, and the
list from which selections are to be made are called the responses. Matching is efficient,
objective, and somewhat reliable if you include more responses than there are stimuli.
The greatest problems with the use of matching is that it can promote a students
memorization of low-level factual information at the expense of higher level thinking
skills, and that its use is restricted to a fairly short list of associated words (Popham,
2000).
Historically, true false, multiple choice, and matching questions have been associated
with standardized written tests. These standardized tests consist of identical questions
that have been given to large groups of students. With standardized tests, all students

25
receive the same instructions, and have the same time restrictions. Standardized
achievement tests focus on general skills that are valued across many school districts.
Because they are given to large groups at one time they tend to be easy to administer,
cost-effective, and easy to score with electromechanical scoring devices. Standardized
tests are also sometimes referred to as “norm referenced” tests because the results can be
used to determine how well any particular student did in comparison to all other test
takers. However, standardized tests have been criticized for emphasizing factual
information at the expense of problem solving and critical thinking skills. Furthermore,
educators are now aware that many traditional norm referenced tests have contained
significant cultural and economic biases (Popham, 2000). This test bias was
unintentionally introduced into the test because white middle-class professionals wrote
the questions, and normed on the results obtained by white middle class students. Many
test items common to the experiences shared by white middle class students were quite
foreign to member of other ethnic, racial, geographical, economic groups.
Written tests can also include short answer items that either takes the form an
incomplete sentence or a question. How to correctly finish the incomplete sentence, or
how to answer the question asked, must be retrieved from memory or deduced by the test
taker. This is more challenging than merely picking the correct answer from a list of
suggested answers. Requiring the test taker to supply the answer greatly improves test
reliability. The improvement in test reliability is because the chance of guessing the
correct answer is much lower than when the student is presented with a list of possible
answers.
26
Short answer test questions can also be designed to be extremely objective. This is
accomplished by wording them so they can be correctly answered with only a single
word, number, or phrase answer. When short answer questions require that the student
provide a more lengthy response, a degree of grader subjectivity may be introduced.
Short answer test questions are easier to write than multiple-choice questions, but take a
longer time to score (Hopkins, 1998).
Multiple-choice, and short answer questions that require only one word to answer are
used when the instructor desires to assess a student’s mastery of specific knowledge or
details. A review of educational literature suggests that tests have relied too heavily upon
the student’s mere recall of factual information (Davis, 1993). Many educators are
claiming it is much more beneficial to assess students at higher taxonomy levels. This is
because assessing at higher levels correlates better with the broader educational
objectives set forth in course goals, and district wide standards (Hopkins, 1998). A
second criticism of using test questions that have only one rigidly defined correct answer
is that the student cannot do anything to dispute or redefine the question (Rowntree,
1987). There is no way for the student to explain or justify why an alternative answer
was chosen.
To test beyond the mere recall of factual information, and begin to assess the higher
levels of the cognitive domain, educators can use essay questions. Essay questions are
effective in determining the student’s ability to organize, integrate, analyze, and evaluate
concepts and issues (Wolansky, 1985). The challenge to using essay questions is that they
require sensitive and thoughtful judgements on behalf of the scorer. Using untrained
clerks or electromechanical devices to score essay questions is not a viable option. Even

27
when trained scorers are employed, caution must be exercised to insure that subjectivity
and bias do not seriously impact the reliability of the assessment (Hopkins, 1998). Essay
tests may also have validity problems because there are frequently only a few questions
asked per test (Davis, 1993).
Performance Assessment
The second major category of assessments can be described as being performance
based. Performance assessments require students to actively accomplish complex and
significant tasks, while bringing to bear prior knowledge, recent learning, and relevant
skills to solve realistic or authentic problems (Herman, Aschbacher, & Winters, 1992).
More simply stated, the teacher is checking to see if the student can perform a task.
Performance tests can assess how well the student has successfully learned to execute the
procedures, or it can assess learning indirectly by examining critical characteristics of the
finished product (Wolansky, 1985). Whether assessing the product or the process, the
performance test is based upon clearly defined objectives. Correctly designed
performance objectives have three components. First, it must identify what the learner
needs to do in behavioral terms. This behavioral performance, or the results of the
performance, needs to be available for the instructor to observe. Secondly, the
performance objective must also describe the relevant conditions under which the
performance will occur. Lastly, the objective must tell the student what constitutes an
acceptable performance (Bott, 1995). The drawback to using the performance-based
evaluations is that they are more difficult to develop, costly, and subject to bias on behalf

28
of the scorer (Hopkins, 1998). Extensive training is required for valid administration and
scoring, and typically only one person or product can be tested at a time.
Technology education teachers frequently write performance objectives in what is
referred to as a checklist. While observing the student’s performance the instructor
observes whether the performance meets the defined performance criterion. If it does a
checkmark is placed next to that criterion, and if the behavior was not present the
checkmark is omitted. Technology education instructors also use checklists in assessing
whether physical features are present within the products students have completed in their
lab sessions. Checklists are popular because they can be used with multiple students or
with the same student over time to gage the student’s individual progress. The
disadvantage of the checklist is that there are only two choices for scoring. An action or
feature is either present or not. There is no middle or intermediate scoring possible.
(Airasian, 1994).
To overcome the rigidity found in checklist based assessments many technology
education instructors introduced rating scales into their assessment procedures. Rating
scales have student behaviors or characteristics of the finished product, and some type of
scale for indicating the degree to which each attribute is present (Linn & Gronlund,
2000). The scales used can be either numerical or descriptive. If numerical the scale
begins with zero on the low side, and progresses up to five or ten on the high side.
Descriptive rating scales substitute performance related phrases in place of the numbers
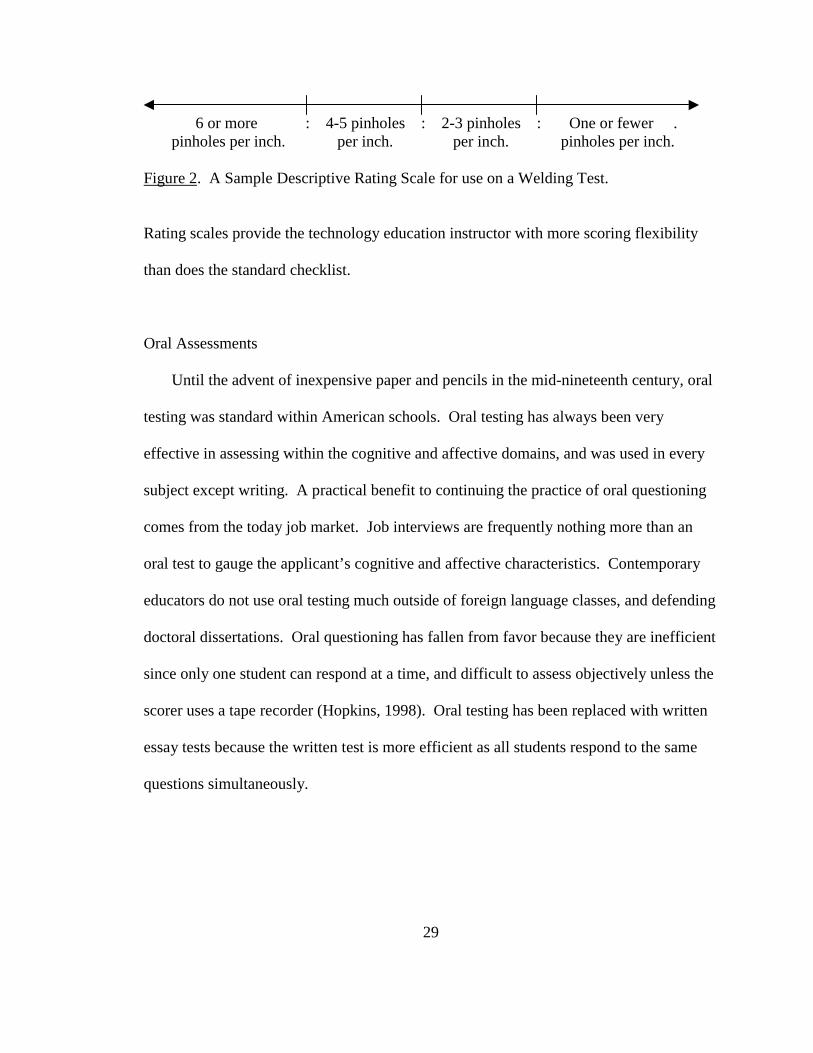
as an aid to the technology education instructor in evaluating a student’s work. For
example, a descriptive scale for use on a welding test might appear as shown in Figure 2.
29
6 or more : 4-5 pinholes : 2-3 pinholes : One or fewer . pinholes per inch. per inch. per inch. pinholes per inch.
Figure 2. A Sample Descriptive Rating Scale for use on a Welding Test.
Rating scales provide the technology education instructor with more scoring flexibility
than does the standard checklist.
Oral Assessments
Until the advent of inexpensive paper and pencils in the mid-nineteenth century, oral
testing was standard within American schools. Oral testing has always been very
effective in assessing within the cognitive and affective domains, and was used in every
subject except writing. A practical benefit to continuing the practice of oral questioning
comes from the today job market. Job interviews are frequently nothing more than an
oral test to gauge the applicant’s cognitive and affective characteristics. Contemporary
educators do not use oral testing much outside of foreign language classes, and defending
doctoral dissertations. Oral questioning has fallen from favor because they are inefficient
since only one student can respond at a time, and difficult to assess objectively unless the
scorer uses a tape recorder (Hopkins, 1998). Oral testing has been replaced with written
essay tests because the written test is more efficient as all students respond to the same
questions simultaneously.

30
Other Assessments
It is difficult to assess student psychomotor and affective development using written
assessment instruments. Over the past few years there has been a growing interest in
developing alternative assessment instruments where students not only complete or
demonstrate desired behaviors, but also accomplish them in a real life context (Baron and
Boschee, 1995). Some of these performance-based tools were given the name
“authentic” because the instructional methods and assessments are designed to present
tasks that are worthwhile, significant and meaningful. One of the underlying premises of
authentic instruction and assessment is that students are able to learn new materials more
rapidly, and will retain the knowledge longer, if the student is an active participant and
can apply what they are learning. In other words there is substantially less emphasis on
objective questions, and tests that can be answered by mere memorization of textbook
facts.
The portfolio is an example of an authentic assessment tool that has gained
acceptance within the field of technology education as an alternative to paper and pencil
tests. Introduced in the early 1980’s portfolios are collections of a student’s work that
attempt to illustrate the student’s intellectual growth over time. Student portfolios consist
of homework assignments, artwork, and individual projects that can be used by educators
to assess the strengths and needs of their individual students. Portfolios are unique in that
they focus on the student’s strengths potential, and not on the deficiencies typically
identified through traditional testing (Gredler, 1999). Some technology education
instructors find the portfolio a useful tool because it encourages the student to accept
responsibility for learning, and emphasizes education as a process or journey.
31
Assessments Within Technology Education
The focus of this research document is to determine how technology education
teachers are assessing their students. This review of literature began by discussing how
educational taxonomies categorize and simplify educational objectives. The purpose of
discussing the taxonomy was to examine in broad terms what educators assess for. In
fact, it was stated that knowledge and intellectual growth was not something that could
even be directly assessed. Educators are forced to rely upon the students’ performance
on assignments and tests as “indirect” measurements regarding improvements in both
skill and knowledge.
Several pages were also dedicated to the various functions that assessments perform
within the school environment. In general those pages answered the questions of why
teachers assess students, and when that assessment occurred. One of the main
conclusions resulting from that review was that there is no single ideal or correct
assessment technique. Certainly, individual students are unique and bring into the
classroom different genetic capabilities, life experiences, and personal goals. One could
predict that the professional technology education instructor would use many different
assessment tools to accurately determine the degree of new knowledge that was acquired
by each individual student.
Testing and Assessment in Occupational and Technical Education (1995), authored
by Paul Bott, gives the reader some excellent insights on how technology education
teachers are assessing students at the national level. Here are a few of his major
conclusions. First, expect technology education teachers to extensively use performance-
based objectives. Manual training schools, industrial arts programs, and contemporary

32
technology education courses all have rich histories of using performance objectives
because of the extensive integration of labs and projects within their curriculum.
Secondly, that technology education teachers will be less interested in norm referenced
evaluation schemes. This is because the aforementioned performance-based assessments
require that all students achieve some minimal level of competence prior too moving on
to the next goal. Performance assessments assume that all students can and will “pass”
the assessments, whereas norm referencing and standardized assessments require that
some students fail. Thirdly, while both written and oral tests are equally effective in
assessing learning within the cognitive domain, technology education teachers rely more
upon written tests than oral ones. This is because with a written test the instructor can
test an entire class simultaneously, whereas oral testing must be done individually and
takes more of the instructor’s time. This is purely an efficiency consideration. Fourthly,
that checklists and rating scales will be extensively used as measurement tools while
assessing within the psychomotor domain. Checklists and rating scales are desirable as
they require the instructor to define grading criteria. These criteria can then be shared
with the students at the start of a unit of study. Lastly, Bott asserts that technology
education teachers will look with favor upon and extensively use the concept of authentic
assessment. Assessments will be conducted under conditions that closely approximate
real life situations.

33
Chapter III - Methods and Procedures
This research document is quantitative in nature. It is quantitative because it
attempts to describe in mathematical terms the prevalence of specific assessment related
activities currently being practiced by technology education teachers within the State of
Wisconsin. The methods and procedures utilized within this study are explained in this
chapter under the general headings of (1) method of study, (2) sample selection, (3)
instrumentation, (4) procedures followed, and (5) method of analysis.
Research Design
Reviewing a multitude of published works on the subject of assessment in
technology education was critical to the design of this research project. By reading
through a sampling of both historical and contemporary publications it was possible to
identify the major issues surrounding the assessment of our students. A very brief
summary of those issues would include the following. First, that state legislators believe
that teachers need to incorporate academic standards into their curriculums. Lawmakers
have passed legislation that stipulates that beginning with the 2002-2003 school year, no
school district can grant a diploma to any student who does not pass competency test
upon completion of their high school education. Secondly, assessments can be
categorized as being either written, oral, or performance based. The literature advises
that no single assessment method will work in every situation, but rather the literature
suggests a combination of techniques is needed to accurately assess student progress.

34
Thirdly, test questions that required the student to compose responses, in contrast to
selecting an answer from a list, were better at engaging students in higher order cognitive,
affective, and psychomotor activities. Lastly, by using objective assessments students are
assured that favoritism and prejudices are not influencing assessment scores. This
research was designed to address these issues.
Professional researchers categorize quantitative studies as descriptive, correlation, or
comparative. This research is a descriptive study because it looked at, or attempted to
describe, the features and behaviors of one population or group of people. The group
being described is technology education teachers within the State of Wisconsin. There
was no desire to correlate or compare technology education teachers against any other
group of teachers.
Descriptive studies can either be made by direct observation of the target population,
or by administering a survey instrument to a sample of the population. Both methods
have a lengthy and successful history, but the technique chosen for this research was the
survey. There were two primary reasons for using the survey instead of direct
observation. First, the survey was more efficient from both a time and monetary
perspective. A representative sample group was available at one location over a span of
only two days. Direct observation would have required driving to many different
locations, and taken significantly more days to complete. Secondly, was the belief that
the study could be more accurately replicated if the population was asked to respond to a
series of written survey questions. Duplicating studies that entail direct observation are
difficult because the results are always greatly impacted by the amount of training the
observer has received. The survey was therefore chosen as being easier to replicate. It is

35
entirely possible that another researcher may be able to use the results as reference data
for some future longitudinal study.
Sample Selection
Surveys are administered to a representative sample or subgroup of some larger
population. The researcher typically studies the sample population with the intention of
generalizing the findings to the entire population. For this research The Wisconsin
Department of Public Instruction provided a computerized database that indicated that
there were 1316 active technology education teachers employed by Wisconsin school
districts as of September 1999. These 1316 teachers are the entire population for this
research. Each of these teachers had DPI’s technology education subject code 220 listed
on their State of Wisconsin teachers’ license, or were teaching under a provisional license
while completing a certification program.
The sample group for this research was those technology education teachers in
attendance at the 31’ST Annual Spring Conference and Trade Show of the Wisconsin
Technology Education Association (WTEA). This conference was held at the Chula
Vista Resort in the Wisconsin Dells on March 30-31, 2000. Students, school
administrators, commercial representatives and other non-teaching conference attendees
were not allowed to participate in this survey. There were two distinct advantages to
selecting the technology education teachers in attendance at WTEA conference as the
sample population for this study. First, the teachers in attendance did represent a cross
section of the larger population. Technology education teachers were in attendance from
all geographic areas of the state. There were teachers from northern, southern, eastern,

36
and western districts in attendance. Furthermore, there were teachers from rural and
urban districts. Secondly, the teachers in attendance had wide-ranging experience levels.
There were first year teachers in attendance as well as veterans with forty years of
experience.
The “central limits theorem” is a mathematical law that states that a sampling of a
larger population begins to distribute in a representative curve after sixty samples
(Wagner, 1992). Over the course of the two-day WTEA conference a total of 85 actively
employed technology education teachers were randomly identified and asked to complete
the survey. Everyone that was asked to fill out the survey acquiesced. This random
sample of 85 respondents represents 6.5% of the total 1316 employed technology
education teachers within the State of Wisconsin.
Instrumentation
The survey instrument used in this research was individually constructed by the
researcher to determine what assessment tools and procedures were used within
technology education classrooms this past school year. A copy of the actual survey
instrument used can be found in the Appendix A. The survey instrument was developed
to answer the eight research questions listed in the introduction to this research document.
At this would be appropriate here to briefly discuss the rational for each survey question
in the context of the eight general research questions listed in the introductory chapter.
• Survey question one asked the respondent about their educational background.
This survey item will be used to answer the last of the research questions listed in
the introductory chapter. The survey responses would be statistically analyzed to

37
determine if there was a difference in the assessment practices between
technology education teachers that received their education at the University of
Wisconsin – Stout, versus those that graduated from other academic institutions.
• Survey question two asked the respondent what grade levels they normally
instructed. This question was included for two reasons. First, it served as
verification that all survey respondents were indeed currently teaching technology
education classes within the State of Wisconsin. Secondly, it further defined who
was included within the sample group.
• Survey question three asked respondents how frequently they considered
academic standards in developing curricular activities and subsequent
assessments. This question was the very first research question itemized within
the introductory chapter. It is important because the State of Wisconsin has
mandated that school districts administer standards based examinations beginning
in the 2002-03 school year prior to the granting of high school diplomas. This
question will gauge how much support there is for academic standards among
technology education teachers.
• Survey question four asked the respondents to categorize all assessments
administered over the past year as either oral, written, or performance based.
This survey question directly asks the respondents the second research question as
listed within the introductory chapter. The rational for asking the question was
that the review of literature stated that oral testing is rarely used because it is
relatively time consuming and subjective. Conversely, performance testing was

38
thought to be in common use within the technology education classroom because
of extensive integration of laboratory-based projects. This question should clarify
these expectations and perceptions. Additionally, the results may prove of
interest in determining whether the location of the respondent’s academic
training, has an impact on the types of assessments used.
• Survey question five asks the respondent to examine all written tests administered
over the past academic year and to estimate how the proportions of true-false,
multiple choice, matching, short answer, and essay question. This question is a
restatement of the third research question listed in the introductory chapter. The
review of literature states that if teachers want students to engage higher order
cognitive skills, some educational psychologists advocate using written test
questions that require the student to compose, rather than select an answer from a
predetermined list of answers (Woolfolk, 1993). However, by using the open-
ended short answer and essay questions, the teacher loose some test objectivity.
The purpose of this question is to find out how technology education teachers are
managing this trade-off between objectivity and creativity. Additionally, the
responses to this question may allow for further statistical analysis to ascertain if
the location of the respondent’s academic training has an impact on the types of
assessments used.
• Survey question six follows up on the previous question by asking the respondent
how objective they perceive their assessment items to be. This question is the
fourth research question listed in the introductory chapter. As with the previous

39
question, the responses will indicate how technology education teachers are
managing this trade-off between objectivity and creativity.
• Questions seven and eight can be discussed together. Question seven asks how
frequently checklists are used, and question eight asks how frequently rating
scales are used. These questions restate and will be used to answer the fifth
research question found in the introductory chapter. The review of literature
states that checklists and rating scales were frequently used in Manual Training
and Industrial Arts classes because of the extensive integration of laboratories. It
is predicted that checklists and rating scales are similarly used in technology
education classrooms while evaluating projects and student psychomotor skills
(Wolansky1985). These two questions will quantify the degree to which these
assessment tools are used.
• Survey question nine asks the respondent what percentage of assessments they
consider to be authentic. It answers the sixth research question found in the
introductory chapter. The question is designed to determine the importance that
technology education teachers place upon performing tasks in a real life context.
• The last question on the survey asks how frequently the respondent uses the
portfolio as an assessment tool. This was the seventh research question listed in
the introductory chapter. This question also allows for further statistical analysis
to ascertain if the location of the respondent’s academic training has an impact on
the types of assessments used.
40
There is an inverse relationship between survey length and response rate. With that
in mind the survey instrument was limited to one page in length. To improve the post
survey statistical analysis each question presented the respondent with a limited number
of responses.
Pilot Study
A rough draft of the survey instrument was submitted to three Baraboo High School
technology education teachers as a pilot test. There were three objectives to conducting
the pilot study. First, it was imperative that the respondents had a clear understanding of
what was being asked. In other words, were the instructions clearly stated, and adequate
definitions provided. Secondly, these three teachers were asked to time how long it took
them to take the survey. The length of time required to complete a survey is directly
related to the survey response rate. It was hoped that the ten questions could be answered
in less than five minutes. Thirdly, the pilot would allow general comments and
suggestions for improvements prior to duplicating large quantities of the finished survey.
The pilot testing of the survey instrument yielded three results. First, the three
technology education teachers that completed the pilot study all agreed that they
considered the survey questions to be clearly stated, that the terms were clearly defined,
and no changes were needed to the questions themselves. Secondly, the fastest
respondent completed the survey in three minutes while the slowest took five minutes to
answer all ten questions. A statement would be added to the general instructions
indicating that most respondents complete the survey in less than five minutes. The third
result was that another category of answers was added to the first survey question.
41
Technology education teachers could check a “both” box if they had undergraduate or
graduate degrees from both UW-Stout and another university.
Procedures Followed
The general directions for taking the survey and a “Human Resources Consent
Form” were typed up onto one sheet of paper. This document was used as a cover sheet
for the survey instrument. A copy of this cover sheet can be found in Appendix B. The
cover sheet, survey instrument, and formal request to distribute the survey at the WTEA
Spring Conference were e-mailed to Executive Director Joseph Ciontea, and Conference
Coordinator Jeff Dowd. Approval to distribute the assessment survey at their 31’st
annual WTEA Spring Conference and Trade Show being held March 30 – 31, 2000 came
in the form of a phone call from Conference Coordinator Jeff Dowd.
When conference attendees checked in with the WTEA upon arrival at the Chula
Vista Resort, they were given a nametag. Since the nametag included the attendee’s job
title and/or place of employment, it was relatively easy to distinguish between vendors,
administrators, and teachers. As attendees entered and exited the central vendor display
area it was possible to verify that the person was actively teaching, and to ask if they
would complete a ten-question survey that required 5 minutes of their time. In total 85
conference attendees were asked to take the survey. All 85 agreed to participate.
Data Analysis
The University of Wisconsin – Stout employs a full time research associate to aid
graduate student with the statistical analysis of data being used for their research project.

42
The 85 surveys were therefore sent to the UW – Stout Information and Operations
Systems center for analysis. The primary focus of each statistical analysis was to find a
middle number, or a “central tendency”, that could be used to represent the results to each
survey question. Loosely defined, the “central tendency” of a set of numbers is the
tendency of the data to cluster around certain numerical values (Wagner, 1992).
43
Chapter IV - Results and Discussion
It was stated in the chapter on methods and procedures that this research is
quantitative because it would describe in mathematical terms the prevalence of specific
assessment related activities currently being used by technology education teachers in the
State of Wisconsin. This analysis of the survey results does assume a basic
comprehension of descriptive statistics. Terms such as algebraic mean, percentage,
frequency and standard deviation are not defined. Many results are summarized in a
tabular format.
A Profile of Respondents
The first two questions of the survey instrument were included to establish a profile
of who had taken the survey. The analysis of the completed surveys revealed 58
respondents, or 68.2 % of the total, received their undergraduate degree from the UW –
Stout. The remaining 27 respondents or 31.8% had undergraduate degrees from other
universities. This statistical breakdown is represented in Table 1.

44
Table 1
Respondents Undergraduate Degree
Undergraduate Degree From Number Percent
University of Wisconsin - Stout 58 68.2
Other University 27 31.8
Total Respondents 85 100.0
Further analysis of the responses to the first survey question also indicates that forty-
one respondents, or 48.2% or the 85 respondents, had not yet completed a graduate
degree. A total of 44 respondents or 51.8 % of the 85 respondents had completed a
graduate degree program. Twenty-five respondents reported a graduate degree received
from the UW – Stout, 18 reported a graduate degree from another university, and 1
respondent had a graduate degree from both UW – Stout and another university. This
data is summarized in Table 2 as shown below.

45
Table 2
Respondents Graduate Degree
Graduate Degree From Number Percent
Graduate Degree Not Completed 41 48.2
University of Wisconsin – Stout 25 29.4
Other University 18 21.2
Both UW-Stout and Other University 1 1.2
Total 85 100.0
The second survey question asked the respondents which grades they were currently
teaching. Sixty-two respondents or 72.9% stated they were teaching grades 9-12.
Twenty-one respondents or 24.7% stated they taught grades 6-8. The two remaining
respondents stated they taught a combination of middle and high school classes. Simply
stated this means that three-fourths of the sample group was employed at the high school
level. Table 3 summarizes these results.

46
Table 3
Respondents and Grade Level Instructed
Grades Instructed Number Frequency
Grades 6-8 21 24.7
Grades 9-12 62 72.9
Combination 6-8 and 9-12 2 2.4
Total 85 100.0
Survey Results Related to Research Questions
The first research question listed in the introduction to this research document was
“how frequently are technology education teachers referencing some defined set of
academic standards as they construct their lesson plans and subsequent assessment
tools”? The responses to survey question 3 provided data on the frequency of referencing
academic standards. The survey limited respondents to answering in one of four
following categories.
• Rarely (0-25%) considered standards.
• Occasionally (26-50%) considered standards.
• Frequently (51-75%) considered standards.
• Extensively (76-100%) considered standards
The results from this survey question are presented below in Table 4. This table reports
that 55 of the 85 respondents occasionally or frequently referred to academic standards as

47
the constructed lesson plans and subsequent assessment instruments. These 55
“occasional or frequent responses” represent approximately two-thirds, of the sample
group.
Table 4
Referencing of Academic Standards
Frequency Standards Referenced Number Percentage Respondents
Rarely (0-25%) considered 21 24.7
Occasionally (26-50%) considered 18 21.2
Frequently (51-75%) considered 37 43.5
Extensively (76-100%) considered 9 10.6
Total 85 100.0
The second question listed in the introduction to this research document was “what
percentage of assessments given by technology education teachers could be categorized
as oral, written and performance based?” The fourth question on the survey instrument
defined the terms, and then asked each respondent to estimate these percentages based
upon their experiences over the past year. An algebraic mean for the 85 survey responses
has been calculated, and these values are presented below in Table 5. What this table
shows is that over half of the assessments given by the sample group over the past school
year were performance based. Furthermore, over one-third of the samples groups’
assessments were written, and just over one tenth were oral in nature.

48
Table 5
Use of Oral, Written, and Performance Based Assessments
% Oral Assessments % Written Assessments % Performance Based
Mean 11.62 36.14 52.24
The third research question listed in the introductory chapter asked, “What types of
questions did technology education teachers use when they constructed written
assessments”. The fifth question on the survey asked each respondent to estimate what
percentages of questions on their own written tests within the past school year were True-
false, multiple choice, matching, short answer, and essay. The algebraic mean was
computed for the responses given by the sample group. These values are shown below in
Table 6. What the data describes is a sample group that uses short answer questions over
one-fourth of the time, and multiple-choice questions almost one-third of the time.
Furthermore, multiple-choice questions were twice as common as either true-false or
matching questions, and three times as prevalent as essay questions.
Table 6
Analysis of Written Test Components – Algebraic Means of Respondents’ PercentageAnswers Given in Answer to Survey Question 5
% True-False % Multiple Choice % Matching % Short Answer % Essay
Mean 16.21 32.02 14.23 26.56 10.98
Note. Algebraic means based on 84 survey responses. One respondent indicated nowritten tests were administered over the past year.
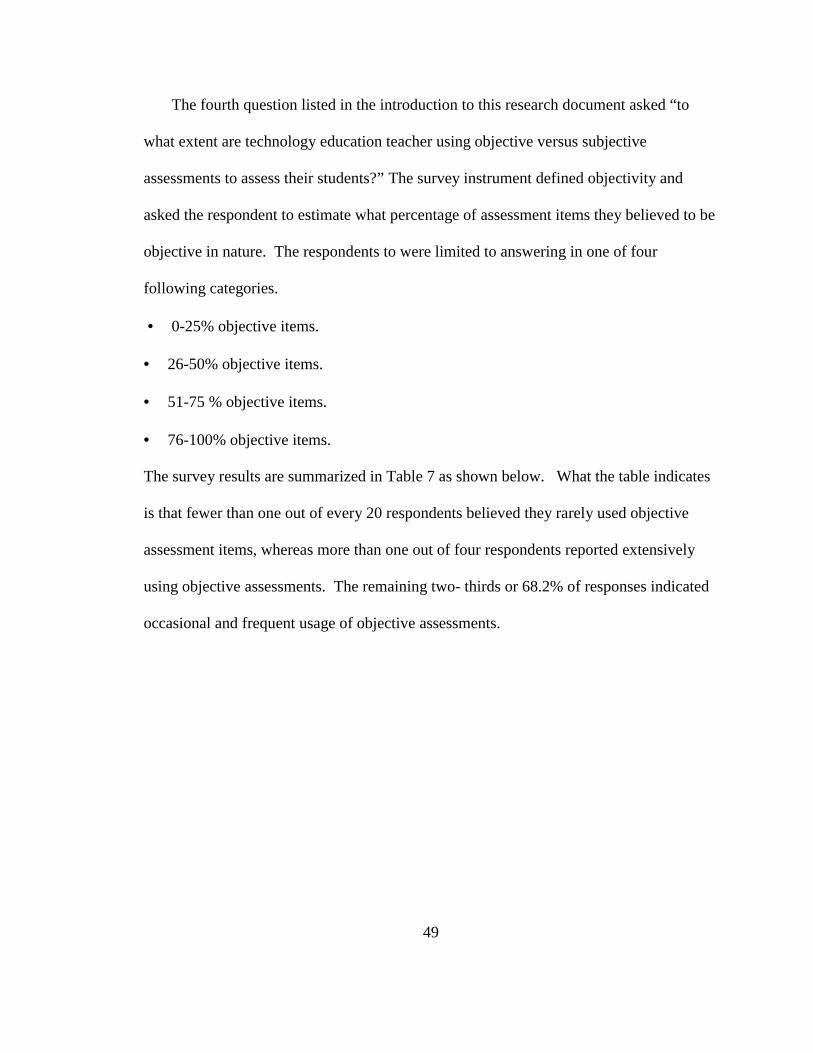
49
The fourth question listed in the introduction to this research document asked “to
what extent are technology education teacher using objective versus subjective
assessments to assess their students?” The survey instrument defined objectivity and
asked the respondent to estimate what percentage of assessment items they believed to be
objective in nature. The respondents to were limited to answering in one of four
following categories.
• 0-25% objective items.
• 26-50% objective items.
• 51-75 % objective items.
• 76-100% objective items.
The survey results are summarized in Table 7 as shown below. What the table indicates
is that fewer than one out of every 20 respondents believed they rarely used objective
assessment items, whereas more than one out of four respondents reported extensively
using objective assessments. The remaining two- thirds or 68.2% of responses indicated
occasional and frequent usage of objective assessments.
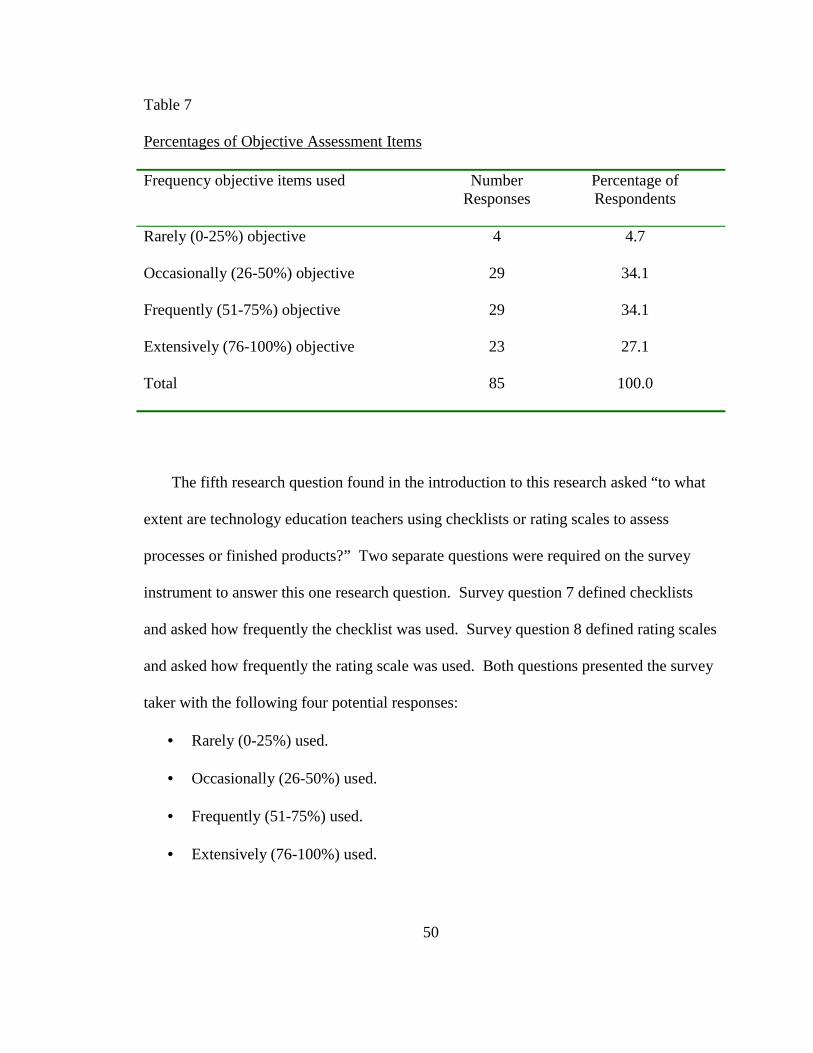
50
Table 7
Percentages of Objective Assessment Items
Frequency objective items used NumberResponses
Percentage ofRespondents
Rarely (0-25%) objective 4 4.7
Occasionally (26-50%) objective 29 34.1
Frequently (51-75%) objective 29 34.1
Extensively (76-100%) objective 23 27.1
Total 85 100.0
The fifth research question found in the introduction to this research asked “to what
extent are technology education teachers using checklists or rating scales to assess
processes or finished products?” Two separate questions were required on the survey
instrument to answer this one research question. Survey question 7 defined checklists
and asked how frequently the checklist was used. Survey question 8 defined rating scales
and asked how frequently the rating scale was used. Both questions presented the survey
taker with the following four potential responses:
• Rarely (0-25%) used.
• Occasionally (26-50%) used.
• Frequently (51-75%) used.
• Extensively (76-100%) used.

51
Table 8 as shown below shows the breakdown of responses as they relate to checklist and
Table 9 gives the survey results with respect to the use of rating scales. Analysis and
comparison of the survey responses yielded quite similar responses for both survey
questions. Table 8 shows 45.8% of respondents reported frequent or extensive use of
checklists and Table 9 shows 61.2% of respondents with frequent or extensive use of
rating scales.
Table 8
Use of Checklists
Frequency checklists used NumberResponses
Percentage ofRespondents
Rarely (0-25%) used 17 20.0
Occasionally (26-50%) used 29 34.1
Frequently (51-75%) used 28 32.9
Extensively (76-100%) used 11 12.9
Total 85 100.0

52
Table 9
Use of Rating Scales
Frequency rating scales used NumberResponses
Percentage ofRespondents
Rarely (0-25%) used 14 16.5
Occasionally (26-50%) used 19 22.4
Frequently (51-75%) used 34 40.0
Extensively (76-100%) used 18 21.2
Total 85 100.0
The sixth research question listed in the introductory chapter asks “what importance
do technology education teachers place upon the concept of authentic assessment.” The
ninth survey question defined authentic assessment, and then asked respondents what
percentage of their assessments they considered to be authentic. A summary of the
respondents answers are shown in Table 10 using the same format as earlier tables. What
the tabulated results mean is that 78.8% of respondents did in fact believe they were in
fact using authentic assessments.

53
Table 10
Percentage of Authentic Assessments
Percentage of authentic assessments NumberResponses
Percentage ofRespondents
0-25% of all assessments used 18 21.2
26-50% of all assessments used 31 36.5
51-75% of all assessment used 28 32.9
76-100% of all assessments used 7 8.2
Total 84 100.0
Note. Number of responses is 84 as 1 respondent failed to answer this question.
The seventh research question listed in the introductory chapter asked, “how
frequently are technology education teachers using portfolios to evaluate long-term
progress?” The tenth and final survey question provided the data that was used for
analysis regarding this question. A summary of the survey responses is presented in
Table 11. What the table shows is that over one half of all respondents state they rarely
use portfolios. Furthermore, more than three-fourths of the survey respondents stated
they rarely or only occasionally use portfolios.

54
Table 11
Use of Portfolios
Frequency of portfolio use NumberResponses
Percentage ofRespondents
Rarely (0-25%) used 46 54.1
Occasionally (26-50%) used 20 23.5
Frequently (51-75%) used 8 9.4
Extensively (76-100%) used 11 12.9
Total 85 100.0
The very last research question posed in the introductory chapter was “Is there a
difference in assessment practices between technology education teachers that have
graduated from the University of Wisconsin-Stout, versus those that graduated from other
educational institutions?” The first survey question asked where respondents acquired
their undergraduate and graduate degrees. As indicated in Table 1 there were 58
respondents that earned their undergraduate degree from UW – Stout, and 27 that earned
their undergraduate degree from an alternative source. No analysis was done based upon
where respondents acquired their graduate degree.
The UW – Stout Information and Operations Systems Department used their
computer system to analyze all survey responses according to the source of the
respondent’s undergraduate degree. This analysis was uncomplicated for survey

55
questions 4 and 5 where the respondent was required to estimate percentages that
characterized his/her own assessments over the past year. For survey questions 3, and 6 -
10, some improvisation was required. Each of these survey questions asked the
respondent to place a check mark in front of the answer that most closely approximated
their answer. In order to statistically compare the responses according to where the
respondent received their undergraduate degree, a numerical value was assigned to these
checkmark style answers. Numerical values were assigned as shown here:
• Rarely (0-25%) perceived, considered, or used given 1 point.
• Occasionally (26-50%) perceived, considered, or used given 2 points.
• Frequently (51-75%) perceived, considered, or used given 3 points.
• Extensively (76-100%) perceived, considered, or used given 4 points
Having established this method of converting checkmark style answers into a numeric
format, it was possible to compute average answers to the survey questions according to
where the respondent received their undergraduate degree. These algebraic means and
standard deviations resulting from that analysis are summarized below in Table 12.

56
Table 12
Response Means and Standard Deviations by Location of Undergraduate Degree
Research Question UndergradDegree From
Number Mean St.Dev.
Frequency of Referencing Standards UW – Stout 58 2.22 .92Other Univ. 27 2.78 1.01
Assessments - % Oral over past year UW – Stout 58 9.86 11.52Other Univ. 27 15.41 14.24
Assessments - % Written over past year UW - Stout 58 35.02 17.77Other Univ. 27 38.56 17.28
Assessments - % Performance Based UW - Stout 58 55.12 18.94Other Univ. 27 46.04 17.72
% T-F Questions used on Written Tests UW – Stout 57 15.82 14.10Other Univ. 27 17.04 13.35
% M. C. Questions used on Written Tests UW – Stout 57 31.93 24.42Other Univ. 27 32.22 23.91
% Matching Questions on Written Tests UW - Stout 57 13.42 10.27Other Univ. 27 15.93 13.59
% Short Answer Questions on Wr. Tests UW – Stout 57 26.16 25.69Other Univ. 27 27.41 27.37
% Essay Questions on Written Tests UW – Stout 57 12.67 18.45Other Univ. 27 7.41 12.53
Use of Objective Items in Assessments UW - Stout 58 2.83 .86Other Univ. 27 2.85 .95
Use of Checklists to Define and Assess UW – Stout 58 2.47 1.01Other Univ. 27 2.22 .80
Use of Rating Scales to Define & Assess UW – Stout 58 2.62 1.02Other Univ. 27 2.74 .94
Use of Authentic Assessments UW - Stout 57 2.25 .93Other Univ. 27 2.37 .84
Use of Portfolios UW - Stout 58 1.84 1.07Other Univ. 27 1.74 1.06
Note. In a few categories there were only 57 UW – Stout respondents. One UW – Stoutrespondent had no written assessments over the past year, and could not analyze thecomposition of written test questions. A second UW Stout respondent neglected toanswer the question on authentic assessments.
Reviewing Table 12 figures reveals several large differences in the means of the two
groups. The following differences are noteworthy.

57
1. There was a difference of .55 in how frequently the respondent referred to academic
standards while constructing lessons and assessments. Graduates of other universities
referred to standards more frequently.
2. Graduates of other universities used oral assessments more frequently than UW – Stout
graduates did. Here the respective percentages were 9.86% of all assessments for UW –
Stout graduates versus 15.41% for graduates of other institutions.
3. Third, graduates of other universities used performance-based assessments less
frequently than UW – Stout graduates did. Here the respective percentages were 46.04%
for graduates of other institutions versus 55.12% for UW – Stout graduates.
4. Graduates of other universities used essay questions less frequently than UW – Stout
graduates did. Here the respective percentages were 7.41% for graduates of other
institutions versus 12.67% for UW – Stout graduates.
5. Graduates of other universities used essay questions less frequently than UW – Stout
graduates did. Here the respective means were 2.22 for graduates of other institutions
versus 2.47 for UW – Stout graduates.
The algebraic means for respondents’ answers sorted according to where they
received their undergraduate have further value. It is a common statistical procedure to
compare the means of two sample groups to make inferences about the populations from
which the samples were drawn (Wagner, 1992). Stated in lay terms, it is desirable to
ascertain if the differences in averages exhibited by the sample group, can be applied to
the larger populations. Statisticians frequently use “t-Tests” to determine if the
differences shown in the sample groups are truly representative of the larger population.
The five differences identified in the preceding paragraph are presented in Table 13
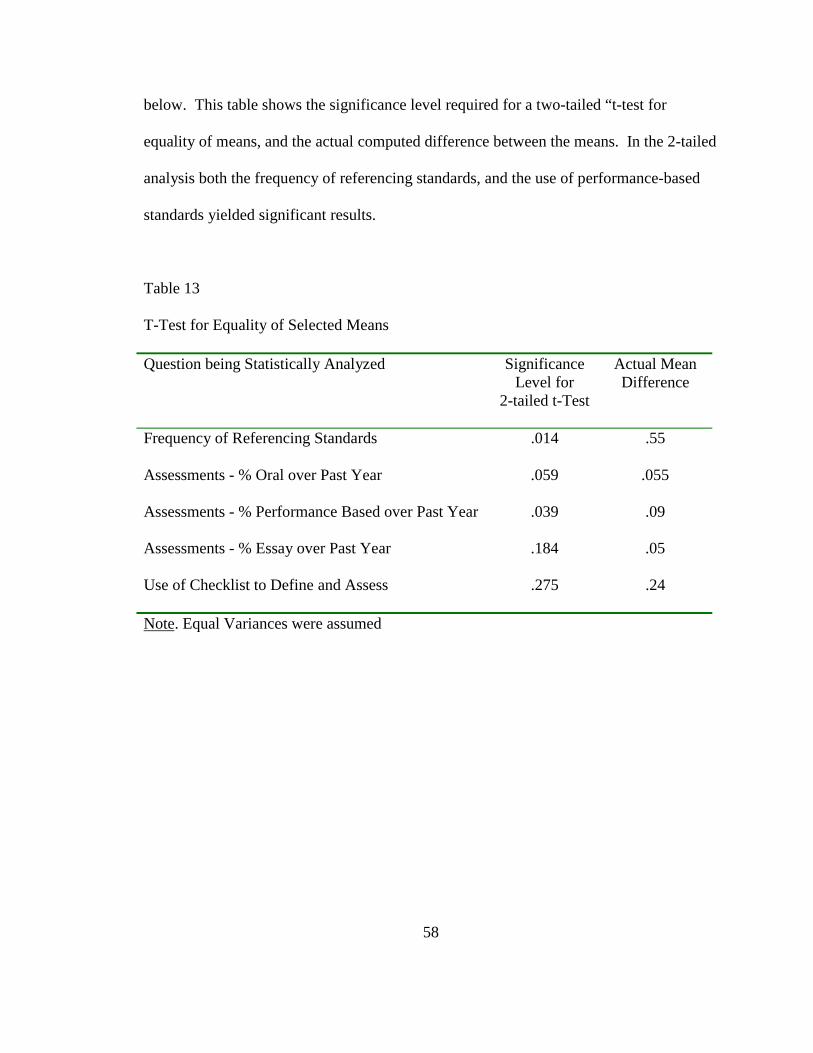
58
below. This table shows the significance level required for a two-tailed “t-test for
equality of means, and the actual computed difference between the means. In the 2-tailed
analysis both the frequency of referencing standards, and the use of performance-based
standards yielded significant results.
Table 13
T-Test for Equality of Selected Means
Question being Statistically Analyzed SignificanceLevel for
2-tailed t-Test
Actual MeanDifference
Frequency of Referencing Standards .014 .55
Assessments - % Oral over Past Year .059 .055
Assessments - % Performance Based over Past Year .039 .09
Assessments - % Essay over Past Year .184 .05
Use of Checklist to Define and Assess .275 .24
Note. Equal Variances were assumed
59
Chapter V - Summary, Conclusions and Recommendations
This final chapter is divided into three distinct sections. It begins with a summary
section, which reviews the entire study. The second section will be on the conclusions
that can be drawn from the analysis of the survey data. Lastly, will be a section that
discusses both recommendations related to this study, and recommendations for future
studies.
Summary
Because this section sums up the entire study, it will be subdivided into three more
manageable topics. First, there is a brief restatement of the general research problem.
The research questions are repeated on last time under this topical heading. Second, there
is a summary review of the methods and procedures used in the study. Under this
heading can be found information regarding the cross sectional survey used, who the
sample group was, and when the survey was administered. Lastly, there is a brief
overview of the major finding resulting from the study.
Restatement of the Problem
The problem that this research addressed was the shortage of information regarding
how contemporary technology education teachers within the State of Wisconsin are
assessing grades 6 – 12 students. Data was gathered to answer the following research
questions:

60
1. How frequently are technology education teachers referencing some defined set of
academic standards as they construct their lesson plans and subsequent
assessment tools?
2. What percentages of assessments given by technology education teachers could
be categorized as oral, written or performance based?
3. When technology education teachers make written assessments what percentages
of questions could be categorized as true false, multiple choice, matching, short
answer, and essay?
4. To what extent are technology education teachers using objective versus
subjective assessments to assess their students?
5. To what extent are technology education teachers using checklists or rating scales
to assess processes or finished products?
6. What importance do technology education teachers place upon the concept of
authentic assessment?
7. How frequently do technology education teachers use student portfolios to
evaluate long-term progress?
8. Is there a difference in assessment practices between technology education
teachers that have graduated from the University of Wisconsin-Stout, versus those
that graduated from other educational institutions?

61
Methods and Procedures Used
To gather information on contemporary assessment procedures a ten-question survey
was created. The survey had 2 questions to aid in creating a profile of the respondents as
a sample group, and 8 questions that would supply the data for answering the
aforementioned research questions. Permission was secured from the WTEA to
administer the survey instrument to current technology education teachers in attendance
at their Spring Conference and Trade Show. This conference was held at the Chula Vista
Resort in the Wisconsin Dells on March 30-31, 2000.
This research project was designed to be cross sectional analysis of the assessment
practices of technology education teachers in Wisconsin. It was felt that the teachers in
attendance at the WTEA Conference were in fact representative of the entire population
of 1316 technology education teachers statewide. After all, the sample did come from all
geographic areas of the state, worked in urban as well as rural environments, and had a
wide range of classroom teaching experience. The response rate for this survey was
100%. Everyone that was asked to fill out the survey acquiesced. This random sample of
85 respondents represents 6.5% of the total 1316 employed technology education
teachers within the State of Wisconsin in September of 1999.
The 85 completed surveys were sent to the University of Wisconsin – Stout
Information and Operations Systems Department where a research associate helped to
compile and statistically analyze the raw data. The goal was to be able to describe in
mathematical terms the prevalence of specific assessment related activities currently
being practiced by technology education teachers within the State of Wisconsin. The
most commonly used mathematical descriptors used were mean, percentage, and

62
frequency. Many tables were constructed to summarize the results obtained from the
analysis of the raw data.
Major Findings
Analysis of the survey results yielded three facts that were helpful in creating a
profile of the sample group. First, was that slightly over two-thirds (68.2 %) of the
sample group had undergraduate degrees from UW – Stout. Second, was that slightly
over half (51.2%) of the respondents had completed a graduate level degree program.
Lastly, it was determined that three-fourths (72.9%) of the respondents exclusively
instructed classes for grades 9 – 12 students.
Analysis of the survey results revealed many important findings. The most
significant findings are briefly summarized here. First, a majority of respondents
(64.7%) stated they either occasionally or frequently referenced academic standards
while constructing lessons and assessment instruments. Second, that the sample group
used performance based assessments 52.2% of all time, written assessments 36.1% of the
time, and oral assessments only 11.6% of the time. The third major finding was that
multiple choice questions and short answer questions comprised 58.6% of all questions
used by the sample group in the construction of their written examinations. The
remainder of assessment questions being somewhat proportionally divided between true
false, matching, and essay questions. The fourth finding was that only 4.7% of all sample
respondents stated they “rarely used” objective test items, where as 27.1% stated they
“extensively used” objective items. The fifth major finding was that roughly two-thirds
of respondents claimed occasional or frequent use of both checklists and rating scales to

63
measure performance on an assessment instrument. The sixth major finding of this study
is that 69.4% of all respondents claimed that they considered their assessments to be
authentic between 26 and 75% of the time. The seventh major finding was that 54.1% of
all sample respondents claimed they rarely used portfolios as an assessment strategy.
Lastly, a few conclusions were possible regarding how UW – Stout graduates assess
differently than do graduates from other universities. UW – Stout graduates did not
reference academic standards as frequently, did use more performance-based
assessments, and did use checklists more frequently than graduates of other universities.
Conclusions
The sample group for this study was 85 technology education teachers currently
employed in the State of Wisconsin. Conclusions are only intended to apply to this small
sample group. However, the study was designed to be cross sectional with regards to the
entire population of technology education teachers within the State of Wisconsin. The
reader is free to individually decide if conclusions being made about the sample group
have relevance to the larger statewide population of 1316 technology education teachers.
This researcher believes extrapolation to the general population of technology education
teachers can be justified. While the reader may elect to extrapolate conclusions to the
larger population of technology education teachers, it must be stressed that this study
made no attempt to correlate or compare the assessment practices of technology
education teachers against the assessment practices occurring in other geographic areas or
disciplines.

64
The previous chapter presented the survey results in mathematical terms. Many
tables were utilized because the tabular format is efficient when summarizing large
quantities of information. Those results were presented in as scientific a fashion as
possible. There were no personal interjections, or conjectures.
The conclusions stated here are quite different. While they are based upon the same
statistical analysis, these conclusions do contain personal insights and conjectures. All
eight of the original research questions will be discussed in proper sequence.
1. The first research objective was to determine the frequency that technology education
teachers are referencing academic standards as they construct lesson plans and
assessment tools. Table 4 indicated that the sample population of technology education
varied greatly in their perception of academic standards. However, since 54.1% of the
respondents stated they either frequently or extensively considered standards while
creating lesson plans and assessment instruments, it can be assumed that there is general
support among technology education teachers for academic standards. A majority of the
sample group believed that the standards have merit in describing what students need to
learn in order to be successful in their adult lives.
2. The second research objective was to ascertain the percentages of oral, written, and
performance based assessments currently being used by technology education teachers.
Data was presented in Table 5 that showed 52.2% of all assessments created by the
sample group over the past school year were performance based. The discussion of
performance-based assessments can be found in the review of literature. It was stated
that performance-based assessments required that all students achieve some minimal
level of competence prior too moving on to the next goal. Performance assessments

65
assume that all students can and will “pass” the assessments, whereas norm referencing
and standardized assessments require that some students would fail (Woolfolk, 1993).
This data supports the contention that technology education teachers adhere to the
philosophy of “criterion referencing”. Additionally, since performance based testing is
generally associated with testing within the psychomotor domain, it can be assumed that
technology education teachers frequently assess within the psychomotor domain.
The review of literature also stated that contemporary educators do not use oral
testing much outside of foreign language classes, practicing for future job interviews, and
defending doctoral dissertations. It was claimed that oral questioning has fallen from
favor because oral assessments are inefficient since only one student can respond at a
time, and difficult to assess objectively unless the scorer uses a tape recorder (Wolansky,
1985). The survey data agrees that technology education teachers largely ignore the
option of oral testing.
3. The third research objective was to determine the composition of written assessments.
The results presented in Table 6 indicate that 62.5% of all test questions are multiple
choice, true false and matching. These question types are frequently given to groups of
students at one time. They tend to be easy to administer, cost-effective, and easy to score
with electromechanical scoring devices. These question types are extremely objective in
that the questions can be scored by anyone in possession of the answer key (Bott, 1996).
This data supports the conclusion that technology education teachers value objectivity
and efficiency. However, the downside of using these question types is that these
question types can promote a students memorization of low-level factual information at
the expense of higher level thinking skills (Bloom, Hastings, and Madaus, 1971).

66
4. The fourth research objective was to determine how frequently technology education
teachers used objective assessments. Objective assessment items were not vulnerable to
the scorer’s personal biases and prejudices (Bott, 1996). The data presented in Table 7
indicated only 4.7% of respondents stated that they “rarely used” objective assessment
items. This data clearly supports the conclusion that the sample group does value
objectivity as a desirable assessment characteristic.
5. The fifth research goal was to determine the extent to which checklists and rating
scales were used to assess a process or a finished product. The review of literature stated
that checklists were popular because they can be used with multiple students, or with the
same student over time, to gage the student’s individual progress (Wolansky, 1985). The
statistical analysis presented in Tables 8 and 9 indicates roughly two-thirds of the
respondents do in fact occasionally or frequently use them. However, there were also
significant numbers of respondents that were at the extremes on the use of checklists and
rating scales. One can conclude that most technology education teachers find checklists
and rating scales to be useful tools, but not an absolute necessity. Other options do exist
for scoring assessment instruments.
6. The sixth research objective was to determine the importance that technology
education teachers place upon the concept of authentic assessments. Assessments were
defined as being authentic when they asked students to do things in a real life context.
The theory is that students will learn new materials more rapidly, and will retain the
knowledge longer, if the student is an active participant and can apply what they are
learning (Baron and Boschee, 1995). The data in Table 10 states that 21.2% of the
sample group used authentic strategies less than 25% of the time assessments were given.

67
However, 69.4% of the sample group used authentic strategies for between 26 and 75%
of their assessments.
7. The seventh research question asked how frequently technology education teachers
are using portfolios to evaluate long-term progress. The data presented in Table 11
shows 54.1% of respondents rarely use portfolios. These supports the conclusion that
portfolios were a fad of the 1980’s, and are losing favor among technology education
teachers.
8. The very last research question posed in the introductory chapter was “Is there a
difference in assessment practices between technology education teachers that have
graduated from the University of Wisconsin-Stout, versus those that graduated from other
educational institutions?” The data stated indicated two areas of difference that were
statistically significant according to the 2-tailed t-test for equality of means. These
differences were that graduates of other universities used academic standards more
frequently than did UW – Stout graduates. Secondly, the graduates of other universities
did not use performance-based assessments as frequently as UW – Stout graduates.
Professional scholars do state the use of academic standards and performance tests are
desirable. More effort needs to be made to show and explain the benefits of standards to
UW – Stout graduates.
Recommendations Related to This Study
Research projects are designed to answer questions. This study was successful in
answering the eight research questions that it set out to study. However, descriptive
statistics frequently raise additional questions because the reader wants to know why

68
something is as the data describes. The data analysis from this study did raise additional
questions. Some of them are listed here.
1. While 54.1% of respondents frequently or extensively considered standards while
creating lessons and assessments. This means that a majority of the sample group
believes that standards are beneficial and probably do describe what students need to
learn if they are to be successful as adults. But what about the 24.7% of the sample
population that responded that they rarely considered standards? Do they consider
standards a passing fad, or a form of ivory tower bureaucratic meddling within their
classroom? Certainly, by passing post high school testing requirements state legislators
believe that teachers need to incorporate academic standards into their curriculums.
Administrators, DPI, and colleagues must provide continuing justifications for using
standards.
2. Given that teachers are supposed to prepare students for a productive life beyond high
school, how is it that 21.2% of the sample respondents rarely used authentic assessments?
Certainly no single assessment method will work in every situation, but this researcher
found it surprising that so many technology education teachers did not use authentic
strategies. Was it that the respondents who did not use authentic strategies were also the
respondents that also relied most heavily upon objective questions? If so, are there still
technology education teachers in the workforce that insist upon using questions that can
only be answered by mere memorization of textbook facts? More research into authentic
assessment could answer these questions.

69
Recommendations for Further Study
1. A brief section within the Review of Literature chapter was devoted to learning and
assessment within the affective domain. It was explained there that the affective domain
pertaining to students attitudes, feelings, values and emotions. This research document
focused mostly upon assessment within the cognitive and psychomotor domain. More
research needs to be done on how technology education teachers are assessing within the
affective domain.
2. The review of literature clearly stated that there is no single ideal or correct
assessment technique for all situations. Certainly, individual students are unique and will
continue bringing into the classroom different genetic capabilities, life experiences, and
personal goals. One can predict that the assessment practices in use by technology
education teachers will continue to change as new academic standards, curriculums, and
assessment tools become available. Any researcher that wishes to conduct a longitudinal
study may use the data from this research study.
3. Lastly, it is always a good idea to replicate any study to verify the findings. This
study is no different, and should be held to the same academic standards. A follow-up
study is warranted.
70
References
Airasian, Peter W. (1994). Classroom Assessment (2nd edition). New York, NY.:
McGraw-Hill, Inc.
Baron, Mark A. and Boschee, Floyd (1995). Authentic Assessment The Key to
Unlocking Student Success. Lancaster, PA.: Technomic Publishing Company, Inc.
Bloom, B.S., Hastings, J.T., & Madaus, G.F. (1971). Handbook on Formative and
Summarized Evaluation of Student Learning. New York, N.Y.: McGraw-Hill.
Bott, Paul A. (1996). Testing and Assessment in Occupational and Technical
Education. Boston, MA.: Allyn & Bacon
Canelosi, J.S. (1990). Designing Tools for Evaluating Student Achievement. New
York, NY.: Longman.
Davis, Barbara Gross (1993). Tools for Teaching. San Francisco, CA.: Jossey-
Bass Inc.
Fowler, Floyd J. Jr. (1993). Survey Research Methods. Newbury Park, CA.: SAGE
Publications, Inc.
Gredler, Margaret E. (1999). Classroom Assessment and Learning. New York, NY.:
Addison Wesley Longman, Inc.
Herman, Joan L., Aschbacher, Pamela R., and Winters, Lynn (1992). A Practical
Guide to Alternative Assessment. Alexandria VA.: Association for Supervision and
Curriculum Development.
Hopkins, Kenneth D. (1998). Educational and Psychological Measurement and
Evaluation. Needham Heights, MA.: Allyn & Bacon, a Viacom Company

71
IQToolkit™ Glossary (On-line). Available:
http:www.healthiq.com/healthcareresources/glossary/g498.htm
Kubiszyn, Tom and Borich, Gary (2000). Educational Testing and Measurement
New York, NY.: John Wiley & Sons, Inc.
Lindeman, Richard H. (1987). Educational Measurement. Glenview, IL.: Scott,
Foresman and Company.
Linn, Robert L. and Gronlund, Norman E. (2000). Measurement and Assessment in
Teaching (8th ed.). Upper Saddle River, NJ.: Prentice-Hall, Inc.
Milton, Ohmer (1976). The Testing and Grading of Students. New York, NY.:
Change Publications Inc.
National Research Council (1997) Educating One and All. Washington D.C.:
National Academy Press
Popham, James W. (2000) Modern Educational Measurement Practical Guidelines
for Educational Leaders. Needham, MA.: Allyn and Bacon
Rowntree, Derek (1987) Assessing Students: How shall we know them? New York,
NY.: Nichols Publishing Company
State of Wisconsin Department of Administration - Division of Executive Budget
and Finance (February 1999). State of Wisconsin Budget in Brief. Madison, WI.
Turnbull, A., Turnbull R., Shank, M., & Leal, D. (1999). Exceptional Lives Special
Education in Today’s Schools. Upper Saddle River, NJ.: Prentice-Hall, Inc.
Wagner, Susan F. (1992). Introduction to Statistics. New York, NY.: HarperCollins
Publishers, Inc.

72
Wisconsin Department of Public Instruction (1998). Wisconsin’s Model Academic
Standards. Madison, WI.
Wolansky, William D. (1985). Evaluating Student Performance in Vocational
Education. Ames, IA.: The Iowa State University Press
Woolfolk, Anita E. (1993). Educational Psychology. Boston, MA.: Allyn and
Bacon.

73
Appendix AA Survey of Technology Education Teachers
1.) Undergraduate degree earned from: Graduate degree (if applicable) earned from:
_____ UW-Stout. _____ UW-Stout. _____ Other university. _____ Other university. _____ Both _____ Both
2.) What grades do you most frequently teach?
_____Grades 1-5, ____ Grades 6-8, ____ Grades 9-12, ____ Post High School.
3.) When constructing lesson plans and subsequent assessment instruments, howfrequently do you consider some defined set of academic standards? Standards couldbe from your local school district, State, or professional association such as WTEA.
_____ Rarely (0-25%) considered._____ Occasionally (26-50%) considered._____ Frequently (51-75%) considered._____ Extensively (76-100%) considered.
4.) Oral tests are answered with only the human voice. Written tests contain true-false,multiple choice, matching, short answer, and essay questions. Performance basedtests rely on the student demonstrating a procedure, or submitting a finished product,and are frequently assessed with checklists or rating scales. This past school yearwhat percentages of your assessment were oral, written, and performance based?
_____ % Oral Assessments_____ % Written Assessments_____ % Performance based Assessments 100 % of Assessments. Do your percentages total 100?
5.) Thinking back over the past academic school year to all your written tests. What percentage of questions were True-false, multiple choice, matching, short answer, or essay type questions?
_____ % True-false test questions,_____ % Multiple choice test questions,
_____ % Matching test questions,_____ % Short answer test questions_____ % Essay test questions
100 % of test questions. Do your percentages total 100?

74
Objectivity refers to the degree to which an item can be scored without bias or the personal opinion of the scorer affecting the grades. What percentage of your assessment items would you describe as being objective in nature. _____ 0-25% objective items, _____ 26-50% objective items, _____ 51-75 % objective items, _____ 76-100% objective items.
Checklists and rating scales can be used to assess a student’s competence indemonstrating a process, or in determining the degree that a finished product exhibitspredefined characteristics.6.) Checklists itemize predefined performance objectives. Checkmarks are recorded
when objectives are achieved, and omitted when actions or features of the finishedproduct are missing. How frequently do you use checklists?
_____ Rarely (0-25%) use checklists,_____ Occasionally (26-50%) use checklists,_____ Frequently (51-75%) use checklists,_____ Extensively (76-100%) use checklists.
7.) Rating scales provide a numerical or descriptive scale that is used to score how well astudent has performed required actions, or how well the finished product exhibitsdesired characteristics. How frequently do you use rating scales?
_____ Rarely (0-25%) use rating scales,_____ Occasionally (26-50%) use rating scales,_____ Frequently (51-75%) use rating scales,_____ Extensively (76-100%) use rating scales.
8.) Authentic assessment can be defined, as a process where students are asked to complete or demonstrate desired behaviors in a real life context. What percentage of your assessments do you consider to be “authentic”? _____ 0-25% of assessments _____ 26-50% of assessments _____ 51-75 % of assessments _____ 76-100% of assessments
10.) Portfolios are collections of a student’s work that attempt to illustrate student intellectual growth over time. How frequently do you use portfolios?
_____ Rarely (0-25%) use portfolios,_____ Occasionally (26-50%) use portfolios,_____ Frequently (51-75%) use portfolios,_____ Extensively (76-100%) use portfolios.

75
Appendix B
Thank you, for consenting to complete this brief survey. Most respondents find they cancomplete the survey in less than five minutes. Fill in the blank, or place a check mark infront of the answer that most closely approximates your situation. Address any questionsto the survey administrator.
Tom DeLain333 Fourth StreetBaraboo, WI 53913Phone: (608) 356-0767E-mail: [email protected]
Human Research Consent Form
I understand that by completing and returning the attached survey, I am giving myinformed consent as a participating volunteer in this study. I understand that the basicnature of the study is to determine teacher assessment practices currently in use, andagree that any potential risks are exceedingly small. I am aware that the information isbeing sought in a specific manner so that no identifiers are needed, and so thatconfidentiality is guaranteed. I realize that I have the right to refuse to participate andthat my right to withdraw from participation at any time during the study will berespected with no coercion or prejudice.
Note: Questions or concerns about participation in the research, or subsequent complaintsshould be addressed first to the researcher or research advisor, and second to Dr. TedKnous, Chair, UW-Stout Institutional Review Board for the Protection of HumanSubjects in Research, 11 Harvey Hall, UW-Stout, Menomonie, WI, 54751, phone (715)232-1126.