Embed Size (px)
Citation preview

Louisiana State UniversityLSU Digital Commons
LSU Historical Dissertations and Theses Graduate School
1972
An Analysis of Public School Expenditures inLouisiana on a Per-Pupil Basis.James George Bailey JrLouisiana State University and Agricultural & Mechanical College
Follow this and additional works at: https://digitalcommons.lsu.edu/gradschool_disstheses
This Dissertation is brought to you for free and open access by the Graduate School at LSU Digital Commons. It has been accepted for inclusion inLSU Historical Dissertations and Theses by an authorized administrator of LSU Digital Commons. For more information, please [email protected].
Recommended CitationBailey, James George Jr, "An Analysis of Public School Expenditures in Louisiana on a Per-Pupil Basis." (1972). LSU HistoricalDissertations and Theses. 2322.https://digitalcommons.lsu.edu/gradschool_disstheses/2322

73- 13,646BAILEY, Jr., James George, 1923- AN ANALYSIS OF PUBLIC SCHOOL EXPENDITURES IN LOUISIANA ON A PER-PUPIL BASIS.The Louisiana State University and Agricultural and Mechanical College, Ed.D., 1972 Education, administration
University Microfilms, A XEROX Com pany, Ann Arbor, Michigan
THIS DISSERTATION HAS BEEN MICROFILMED EXACTLY AS RECEIVED

AN ANALYSIS OF PUBLIC SCHOOL EXPENDITURES IN LOUISIANA ON A PER-PUPIL BASIS
A Dissertation
Submitted to the Graduate Faculty of the Louisiana State University and
Agricultural and Mechanical College in partial fulfillment of the requirements for the degree of
Doctor of Educationin
The Department of Education
byJames G. Bailey, Jr.
•S•, Northwestern Louisiana State College, 1947 M.M.E., Louisiana State University, 1948
December, 1972

PLEASE NOTE:
S o m e p a g e s m a y h a v e i n d i s t i n c t print.F i l m e d as received.
U n i v e r s i t y M i c r o f i l m s , A X e r o x E d u c a t i o n C o m p a n y

ACKNOWLEDGMENTS
The writer wishes to acknowledge his gratitude and indebtedness to his Major Professor, Dr. J. Berton Gremillion, for his counsel, encouragement, and assistance rendered this writer in guiding him in his doctoral program. Without his assistance this study would not have been made.
The writer also wishes to express his appreciation for the wise counsel and assistance of his committee, composed of Dr, G. C. Gibson, Dr. Richard A. Musemeche,Dr. Robert F. Shambaugh, Dr. Fred M. Smith, and Dr.Robert C. Von Brock.
A special note of thanks goes to Mr. Harvell Pierce, Business Manager of the Washington Parish School Board and Mrs. Aline K. Smith, Secretary in the Washington Parish School System, for their valuable assistance in this study.
Also, the writer wishes to thank his family for their patience and understanding while he was pursuing a doctoral program and making this study.

TABLE OF CONTENTS
Chapter PageI. INTRODUCTION ............................. 1
THE P R O B L E M ........................... 1Purpose of the Study................. 4Delimitations • • ................... 5
IMPORTANCE OF THE S T U D Y ............... 5METHOD OF PROCEDURE ................... 6DEFINITION OF T E R M S ................... 3SOURCES OF D A T A ....................... 22ORGANIZATION OF THE S T U D Y ............. 23
II. REVIEW OF RELATED LITERATURE............. 24NATIONAL LEVEL . . . . . . . .......... 24STATE L E V E L ........................... 33
III. PROCEDURES USED IN THE STUDY............. 36
DETERMINATION OF THE CLASSIFICATION OF SCHOOL DISTRICTS ACCORDING TO AVERAGE DAILY MEMBERSHIP ............. 36
THE DEVELOPMENT OF THE COST OFEDUCATION INDEX USED IN THE STUDY . . 41
A COMPARISON OF THE NATIONAL ANDSTATE COST OF EDUCATION INDEXES . . . 69
THE DEVELOPMENT OF THE FORMULA USED IN COMPUTING COMPARABLE EXPENDITURE PER-PUPIL YEAR D A T A ................. 76
S U M M A R Y ............................... 77iii

ivChapter Page
IV. PRESENTATION AND ANALYSIS OF DATA IN TERMS OF SPECIFIC AVERAGE DAILY MEMBERSHIP GROUPS OF LOCAL SCHOOL SYSTEMS................................. 7#AVERAGE DAILY MEMBERSHIP GROUP I • • • • 73AVERAGE DAILY MEMBERSHIP GROUP II . . . 37AVERAGE DAILY MEMBERSHIP GROUP III . . . 95AVERAGE DAILY MEMBERSHIP GROUP IV . . . . 103AVERAGE DAILY MEMBERSHIP GROUP V . . . . 110AVERAGE DAILY MEMBERSHIP GROUP VI . . . . 113SUMMARY................................. 127
V. COMPARISON OF PER-PUPIL EXPENDITURES FOR VARYING SIZES OF SCHOOL SYSTEMS FOR THE YEARS 1961-62, 1966-67, and 1969-70 ............................. 1231961-62 SCHOOL Y E A R ...................... 1231966-6? SCHOOL Y E A R ............... 14-01969-70 SCHOOL Y E A R ...................... 154-SUMMARY ....................... 163
VI. SUMMARY AND CONCLUSIONS................... 169SUMMARY................................. 169CONCLUSIONS............................. 202
BIBLIOGRAPHY...................................... 205A P P E N D I X .......................................... 203V I T A ........................... 279

LIST OF TABLES
Table Page1, Distribution of Parish and City School
Systems in Louisiana in Terms ofAverage Daily Membership, 1961-62 • • « • 1+2
2, Distribution of Parish and City SchoolSystems in Louisiana in Terms ofAverage Daily Membership, 1966-67 . • • • l+k
3m Distribution of Parish and City SchoolSystems in Louisiana in Terms ofAverage Daily Membership, 1967-63 • • . • 1+ 6
J+m Distribution of Parish and City SchoolSystems in Louisiana in Terms ofAverage Daily Membership, 1963-69 • • • •
5. Distribution of Parish and City SchoolSystems in Louisiana in Terms ofAverage Daily Membership, 1969-70 • • • • 50
6. Summary of Distribution of Parish andCity School Systems in Louisianain Terms of Average Daily Membership • • 52
7. Number of Expenditure Items Reportedfor Current Operation in the AnnualReport of the State Department ofEducation • • • • « • • • • ............. 53
3, Steps in Preparing a Cost of EducationIndex for Louisiana ............ 56
9* Summary of Functions and ExpenditureItems Included in the Development ofthe State Cost of Education Index • • • • 63
10, A Comparison of Functions andExpenditure Items Included in the National and State Cost ofEducation Indexes , 0 ................... 70
v

viTable Page
11. Summary of Functions and Expenditure Items Included in the National and State Cost of Education Indexes....... 73
12* Trends in Expenditures Per-Pupil Yearin Average Daily Membership Group I • • • 79
13• Trends in Expenditures Per-Pupil Yearin Average Daily Membership Group II • • $8
14« Trends in Expenditures Per-Pupil Yearin Average Daily Membership Group III • • 96
15* Trends in Expenditures Per-Pupil Yearin Average Daily Membership Group IV • • 104
16• Trends in Expenditures Per-Pupil Yearin Average Daily Membership Group V • • • 112
17* Trends in Expenditures Per-Pupil Yearin Average Daily Membership Group VI • • 120
18, Distribution of Expenditures Per-PupilYear in Terms of Varying Sizes of School Systems in 1961-62 ............... 129
19* Distribution of Expenditures Per-Pupil Year in Terms of Varying Sizes of School Systems in 1966-67 ............... 141
20, Distribution of Expenditures Per-PupilYear in Terms of Varying Sizes ofSchool Systems in 1969-70 • • • • • « » » 155
21, Summary of Expenditures Per-Pupil Yearfor All Items Included in the Costof Education Index for the Years1961-62, 1966-67, and 1969-70 .......... 209
22, Distribution of Parish and City SchoolSystems of Louisiana in Terms ofAverage Daily Membership in 1961-62 , , , 211
23, Distribution of Parish and City SchoolSystems of Louisiana in Terms ofAverage Daily Membership in 1966-67 • • • 213

viiTable Page
24. Distribution of Parish and City SchoolSystems of Louisiana in Terms ofAverage Daily Membership in 1967-68 • • • 215
25* Distribution of Parish and City SchoolSystems of Louisiana in Terms ofAverage Daily Membership in 1968-69 • • • 217
26. Distribution of Parish and City SchoolSystems of Louisiana in Terms ofAverage Daily Membership in 1969-70 . . . 219
27. Comparison of Expenditures for GeneralControl, Professional Salaries........ .. 221
28. Comparison of Expenditures for GeneralControl, Clerks and Secretaries .......... 223
29. Comparison of Expenditures for GeneralControl, Other Expenditures .......... • 225
30. Comparison of Expenditures for GeneralControl, Total • • • • • • • • • • • • • 227
31. Comparison of Expenditures forInstructional Services, ClassroomTeachers' Salaries • • • • • • • • • • • 229
32. Comparison of Expenditures forInstructional Services, Salariesof Other Professionals • • • • • • • • • 231
33. Comparison of Expenditures forInstructional Services, Clerksand Secretaries' Salaries • • • • • • • • 233
34. Comparison of Expenditures forInstructional Services, Textbooks . . . . 235
35. Comparison of Expenditures forInstructional Services, Suppliesand Materials for Teaching 237
36. Comparison of Expenditures forInstructional Services, OtherExpenditures. • • • • ............. 239

viiiTable Page
37. Comparison of Expenditures forInstructional Services, Total • • • • • • 241
3#* Comparison of Expenditures for Operation of Plant, Custodial Salaries • .......... • • • • • • • • • 243
39* Comparison of Expenditures for Operation of Plant, AllUtilities Including Heat and Fuel • • • • 245
40. Comparison of Expenditures forOperation of Plant, OtherExpenditures .......... • • • • • • • • 247
41. Comparison of Expenditures forOperation of Plant, Total.......... • • 249
42* Comparison of Expenditures for Maintenance of Plant,Maintenance Salaries • • • • • • • • • • 231
43* Comparison of Expenditures forMaintenance of Plant, Repair and Upkeep of Buildings and Grounds Including the Repair andReplacement of Equipment • < > • • • • • • 253
44. Comparison of Expenditures for Maintenance of Plant,Other Expenditures • • • • • • • • • • • 255
45* Comparison of Expenditures forMaintenance of Plant, Total • • • • • • • 257
46, Comparison of Expenditures forAuxiliary Services, Transportation • • • 259
47* Comparison of Expenditures forAuxiliary Services, School Lunch Including the National SchoolMilk Program • • • • • • • • • • • • • • 261

ixTable Page
4#. Comparison of Expenditures for Auxiliary Services, OtherExpenditures • • . ........ • • • • • • • 263
49* Comparison of Expenditures forAuxiliary Services, Total • • • • • • » • 265
50. Comparison of Expenditures forFixed Charges, Employee Benefits • • • • • 267
51. Comparison of Expenditures forFixed Charges, Other Expenditures • • • • 269
52. Comparison of Expenditures forFixed Charges, Total • • • • • • • • « • • 271
53• Comparison of Expenditures forCurrent Operation, Total ...........273
54« Distribution of Expenditures Per-Pupil Year in Terms of Varying Sizes of SchoolSystems in 1967-6# . « • • • • • • • • • • 275
55* Distribution of Expenditures Per-Pupil Year in Terms of Varying Sizes of SchoolSystems in 196B-69 . . < > • » • • • • • • • 277

ABSTRACT
The purpose of this study was to analyze data concerned with the cost of elementary and secondary public education for current operation in Louisiana for the years 1961-62, 1966-67, 1967-63, 1963-69, and 1969-70 in terms of varying sizes of school districts, through the use of a Cost of Education Index, developed for use in this study. More specifically, an attempt was made to determine:
1, Items that were included in a Cost of Education Index for Louisiana Public Schools,
2, Differences between the National Cost of Education Index and the Index used in this study,
3* Variations in trends in expenditures on a per-pupil basis in terms of varying sizes of school systems,
4. Variations in trends in expenditures per- pupil year for varying sizes of school districts for the years 1961-62, 1966-67, and 1969-70,
5. Variations in trends in per-pupil expenditures on a State-wide basis,
x

xi
The sixty-six (66) school systems of Louisiana were divided into six (6) population groups according to average daily membership, as follows:
a. 75,000 and overb. 35,000 to 74,999c. 20,000 to 34,999d. 10,000 to 19,999e. 5,000 to 9,999f. Less than 5,000A survey of available data was made and specific
items of expenditure for current operation were classified under the following six (6) major budgetary functions:
a. General Controlb. Instructional Servicesc. Operation of School Plantd. Maintenance of School Plante. Auxiliary Servicesf. Fixed ChargesThe following conclusions were reached:1. The per-pupil cost of education increased
significantly from 1961-62 to 1969-70.2. The optimum size school district for general
control expenditures was determined to be systems that had an enrollment of 20,000 to 34,999. Expenditures for

xii
general control were higher in the smaller school districts than in the larger school districts, and this function increased more in the smaller school districts than in the larger school districts,
3, The largest expenditure per-pupil was for instructional services and primarily classroom teachers' salaries. Classroom teacher salaries have increased considerably in the past ten years, but have increased even more in the larger school systems than in the smaller school systems,
4, Per-pupil expenditures for operation of the plant were higher in the larger school districts than in the smaller school districts, and generally, these expenditures increased at a more rapid rate in the larger school districts,
5, Per-pupil expenditures for maintenance of the plant increased for all school systems from 1961-62 to 1966-67; however, per-pupil expenditures for this function decreased in the larger school systems and increased in the smaller school systems in the period 1966-67 to 1969-70, The largest school system included in the study spent more for this function than did the remaining school systems,
6, Per-pupil expenditures for auxiliary services increased as the sizes of the school systems decreased,

xiii
and the over-all per-pupil cost increased from 1961-62 to 1969-70. This function represented the second largest per-pupil cost figure in the over-all Index.
7. Per-pupil expenditures for fixed charges were comparable for the various school systems and increased from 1961-62 to 1969-70. Employee benefits represented an extremely significant item in this function.
8. Over-all per-pupil expenditures on a Statewide basis increased from 1961-62 to 1969-70. However, one exception was noted in terms of the six basic functions. Maintenance of the plant decreased from 1966-67 to 1969-70.

CHAPTER I
INTRODUCTION
I. THE PROBLEM
Education costs increased consistently in the past twenty-five years, but in the last decade the increase has been at a much more rapid rate. According to the January, 1971 issue of School Management, the average cost of education increased from $315 per-pupil in 1961-62 to $5$2 in 1969-70 and to an estimated $667 per-pupil in 1970-71.^
The 1970-71 issue of Estimates of School Statistics published by the National Education Association reported that the national average cost of education increased from $394 per-pupil in average daily membership (ADM) in 1961-62 to $722 in 1969-70, and to an estimated cost of $7&7 per student in 1970-71.^ While the above
^"Orlando F. Furno and Paul K. Cuneo, "Cost of Education Index 1970-71," School Management, XV, 1 (January, 1971), p. 11.
^National Education Association (NEA), "Current Expenditures per-Pupil in ADM," Estimates of School Statistics, 1970-71, ed. Beatrice C. Lee (,1970-Rl!?; Washington: NeA, 1970), p. 21.
1
references reported different figures, the rate of increase was consistent, one hundred and eighty-five (135) per cent according to School Management and one hundred and ninety-six (196) per cent according to the National Education Association.
The cost of education in Louisiana closely parallels the national trend. In 1961-62 the expenditure per-pupil in average daily membership was revealed as $361.56, and in 1969-70 the expenditure was indicated as $653.72.^ These cost figures represented an increase of one hundred and eighty (130) per cent during the nine-year period.
These statistics were indicative of the increase in the cost of education in recent years. While the expenditure per-pupil in Louisiana was slightly below the national average, the amount of the increase was significant. While many reasons were cited for the rise in the cost of education in Louisiana, the following were among the more significant:
1. Inflation.
■^Louisiana State Department of Education, One Hundred Thirteenth Annual Report for the Session 19&1-62, p. 3l.
^Louisiana State Department of Education, One Hundred and Twenty-First Annual Report for the Session1969-70. p. 5:----------- ------------------------

2. Increased instructional staff members*3. Added new programs and services.4* Expanded programs.5. Increased salary schedules for professional
and non-professional personnel.Superintendents and school boards, in preparing
budgets and allocating funds, have need of information concerned with the amounts expended in the various categorical functions on a per-pupil basis. There was also need of data that permitted a functional and composite comparison of expenditures among school systems of similar or varying sizes.
Some indices were available to local school boards5to aid in making such comparisons. School Management
initiated such a study on a national level in 1957, and has published an updated report of average current expenditures in January of each year.
In Louisiana, the cost of education was not a subject which has been researched in detail in terms of state level data or in terms of varying sizes of school systems. Therefore, there was need for a study which provided this specific information.
cOrlando F. Furno and Paul K. Cuneo, "Cost of Education Index 1961-62,” School Management, VI, 1 (January, 1962), p. 176.

KPurpose of the Study
It was the purpose of this study to analyze data concerned with the cost of elementary and secondary public education in Louisiana for the years 1961-62, 1966-67, 1967-68, 1968-69 and 1969-70 in terms of varying sizes of school districts. Comparisons were determined by use of a Cost of Education Index developed for this study. The year 1961-62 was considered as the base period for making the study and drawing comparisons because it represented the end of a fairly stable period of economic growth. It also preceded a major change in state government administration and the impact of integration upon the cost of education.
Some specific questions for which answers were sought were:
1. What significant expenditure items have been utilized in the development of a State Cost of Education Index in order to facilitate the determination of reliable and valid trends?
2. What differences existed in the items utilized in the National Cost of Education Index and the State Cost of Education Index used in this study?
3. What were the trends in expenditures per-pupil year in each average daily membership group for the years included in this study?

4. What were the variations in trends in expenditure per-pupil year in terms of varying size of school system?
5. What were the trends in expenditures per- pupil year on a state-wide basis?
DelimitationsThe following limitations were made applicable
to this study:1. In order to limit the scope, only data for
the years 1961-62, 1966-67, 1967-63, 1963-69, and 1969-70 were utilized,
2. This study was restricted to the public school systems in Louisiana and specifically to data reported for these systems in the Annual Statistical Reports for Louisiana published by the State Department of Education,
3. This study and analysis were restricted to expenditures for current operations for public elementary and secondary education made by the local school systems in Louisiana.
II. IMPORTANCE OF THE STUDY
This study was important for the followingreasons:
1* No cost index was available to school systems of Louisiana for analyzing current expenditures.
2. A need existed for comparing expenditure data of local school systems of comparable average daily membership in order to determine the areas that were over or under extended.
3. No data were available which provided local school superintendents and business managers with an objective means of analyzing school expenditures.
4. There existed a need to provide the lay public with school expenditure data that were easily defined and comprehensible.
III. METHOD OF PROCEDURE
The following procedures were used in this study:1. In order to facilitate comparisons of ex
penditures, local school systems were divided into the following six (6) average daily membership groups:
ADMG-I - All urban— 75,000 ADM and overADMG-II - Highly urban and low rural— 35,000
to 74,999 ADMADMG-III - Moderately urban and sizeable rural—20.000 to 34,999 ADM
ADMG-IV - Sizeable urban and moderately rural—10.000 to 19,999 ADM
ADMG-V - Low urban and highly rural— 5,000 to 9,999 ADMADMG-VI - All rural— Less than 5,000 ADM

72. A survey of available data was made for the
purpose of compiling specific expenditure items included in each of the following six (6) major budgetary functions and items included in the State Index:
General Control(1) Professional salaries(2) Clerks and secretaries(3) Other expendituresInstructional Services(1) Classroom teachers(2) Other professionals(3) Clerks and secretaries(4) Supplies and materials for teaching (5; Textbooks(6) Other expendituresOperation of School Plant (1) Custodial salaries (2; All utilities(5) Other expendituresMaintenance of School Plant(1) Maintenance salaries(2) Repair and upkeep of building and grounds
and repair and replacement of equipment(3) Other expendituresAuxiliary Services(1) Transportation(2) School lunch and National School Milk (3; Other expendituresFixed Charges(1) Employee benefits(2; Other expenditures
3. Each of the above items was utilized in presenting per-pupil cost data based on average daily membership and the Cost of Education Index for Louisiana (CEI) developed for use in this study.

8if. An analysis of state expenditures was made
for the years 1961-62, 1966-67, 1967-68, 1968-69, and 1969-70.
5. An analysis and comparison of expenditures were made for the six (6) ADM groups for years 1961-62, 1966-67, 1967-68, 1963-69, and 1969-70.
IV. DEFINITION OF TERMS
MembershipA pupil was defined a member of a class or
school— from the time he presented himself at the school or was placed on the current school roll— until he permanently leaves the class or school for one or more of the causes recognized as sufficient by the State.The date of permanent withdrawal was recognized as the date upon which it becomes officially known that the student has withdrawn from school— which shall not necessarily be the day following his last day of attendance
^United States Department of Health, Education and Welfare, Office of Education, Pupil Accounting for Local and State School Systems, Handbook V, Unitea States Government Printing Office, Washington: 1965,p. 102.

9Current Operation
The terra current operation referred to any expenditure which was made for the day-by-day operation of local school systems, with the exception of expenditures for capital outlay and debt service. Specifically included in current operation costs were expenditures for the following: (1) general control; (2) instructionalservices; (3) operation of plant; (4) maintenance of plant; (5) auxiliary services; and (6) fixed charges.^
Day in SessionA day on which the school was open, and the
pupils were under the guidance and direction of teachers engaged in the process of teaching, was considered as a day in session. Days on which the school was closed— for holidays, teachers' institutes, inclement weather, or for some unforeseen event— were not considered as days in session. Legally, a minimum day in session in the public schools of Louisiana has been designated as
7Louisiana State Department of Public Education. Suggestions to Assist Parish and City School Superintendents in the Preparation of the Part il Annual Statistical Report for the 1971 Fiscal Year, May, w n , pp. 19-38.— ----------------------
United States Department of Health, Education and Welfare, op. cit., p. 117.

10gfive hours in length. For purposes of this study, however, a six-hour day has been used. It was recognized that the length of the school day for a vast majority of the public school teachers far exceeded the usual five- hour minimum.
School SessionA school term was designated legally as consisting
of one hundred and eighty (180) days in session.^
Expenditure Data FormulaFor purposes of this report, the following formula
was utilized:
Expenditures Per-Pupil Year
Expenditures for Current OperationEPPY = -----------------------------------
Average Daily Membership
or
ECOEPP = ---
ADM
qLouisiana Revised Statutes, Vol. XIII. West Publishing Company (St. Paul, 1963), p. 326.
■^Louisiana State Department of Education. Handbook for School Administrators, Bulletin 741 Revised (baton ftouge: 196&;, p. 30.

Cost of Education Index (CEI)This term was used to express expenditures by
functional categories on a per-pupil basis. Six major functions were identified and each function included a number of specific items. ^
General ControlThis function included those activities which
have as their purpose the general regulation, direction,12and control of the local school board.
Professional SalariesIncluded in this category were the salaries of
the superintendent and the assistant superintendent, salaries of directors, and the salaries of business managers, bookkeepers, accountants, and purchasing agents.
Clerks and SecretariesClassified in this category were the salaries of
clerks and secretaries who served in the central or area school board offices.^
1]-Ibid., pp. 20-31.12Ibid., p. 20.13Ibid., p. 21.^Ibid.

12Other Expenditures
Grouped in this category were expendituresassociated with the normal operation of the schoolboard, such as mileage and per diem of the board, duesto national and state school board associations, andtravel of school board members to national and stateconventions and workshops. Also listed were travelexpenses incurred by the professional administrativestaff of the board, fees to the assessors for servicesrendered for the school system, and expenditures made in
15connection with local school board elections.
Instructional ServicesAll expenditures directly concerned with the
instructional program were considered in this function. Specific categories identified with this function included salaries of classroom teachers, salaries of other professional personnel associated with the instructional program, and clerical and secretarial salaries, as well as textbooks, materials and supplies for teaching, and other expenditures.^
15Ibid., pp. 20-22.l6Ibid., pp. 23-25.

13Salaries of Classroom Teachers
Expenditures for salaries of classroom teachers serving in kindergarten programs, in elementary and secondary grades and subject matter areas, crippled children's programs, and driver education were reported in this category. Also included were salaries of classroom teachers in vocational evening classes, adult edu-
17cation, and certain federally subsidized programs. 1
Salaries of Other Professional PersonnelClassified in this category were the salaries of
school principals, supervisors of instruction, and visiting teachers. Although the latter group was reported as an auxiliary service in some of the states, it was
1$designated as an instructional service item in Louisiana.
Salaries of Clerks and SecretariesExpenditures for salaries of clerks and secretaries
who served in individual schools were reported in this category. No other clerical or secretarial group was classified in this item. Service was restricted to em-
19ployment in schools operated by the local school board.
^Ibid., p. 23. lgIbid., pp. 24-25.19Ibid., p. 25.

TextbooksAllotments for textbooks, school supplies, and
library books, which the parish and city school boards received as a direct result of an appropriation made by the State Legislature, were included in this category.The allocation for each board was determined on a per student basis. This program was administered by the State Department of Education. The local systems ordered textbooks, school supplies, and library books according to previously determined total allocations; and, while these amounts were not reported as either receipts or asactual expenditures of the school boards, these items
20were included as expenditures.
Materials and Supplies for TeachingExpenditures grouped in this category included
supplementary amounts expended by local school boards for materials and supplies utilized by the teaching staff.21
Other ExpendituresThis category was concerned with funds expended
by the parish and city school boards for substitute teacher pay; payment of personnel on sabbatical leave;
20Ibid., p. 3221Ibid., p. 25

15and travel expenses of instructional personnel, includingteachers, principals, supervisors, and visiting teachers.Expenditures for special education services, contractedwith state colleges and universities by local boards,
22were also covered in this category.
Operation of the School PlantActivities involved in keeping the physical
plant open and ready for use pertained to this function. Specific categories under which these expenditures were reported related to the following: custodial salaries;heating of the school plant; all other utilities, such as electricity, water, power, telephone and telegraph; operational supplies; and other miscellaneous operating costs .2^
Salaries of the Custodial StaffAll amounts expended by the school boards for
salaries of janitors, janitorial assistants, and maidspiwere classified in this category.
22Ibid., pp. 23-25.2^United States Department of Health, Education
and Welfare. Staff Financial Accounting for Local and State School Systems (Washington, iybb), p. 22b.
^Louisiana State Department of Education, op. cit., p. 26.

16All Utilities
This classification was concerned with funds expended for all utilities. Such expenditures includeheat, electricity, water, power, and telephone and
25telegraph services.
Other ExpendituresExpenditures regarding janitorial and other
supplies, upkeep of automobiles employed in driver education programs, and expenses incurred in the transportation of goods for use by the school systems were reported in this category. Charges in this area included goods transported by private carrier, as well as expenses incurred in the operation of fleets of transport trucks. Minor miscellaneous items of expense were reported in this category.
Maintenance of the School PlantThis function pertains to activities concerned
with keeping buildings, grounds, and equipment at their original condition of completeness or efficiency, either through repairs or replacements. Specific areas of expenditure included: salaries of maintenance personnel;
25Ibid.26Ibid.
17the repair and upkeep of buildings and grounds; repairand replacement of equipment; and other miscellaneous
27items of expense.
Salaries of Maintenance PersonnelFunds expended for salaries of the supervisor of
maintenance, carpenters, plumbers, electricians, painters,and watchmen (or guards) were included in this area of
2$school board expenditures.
Repair and Upkeep of Buildings and Grounds jncluding the Repair and Replacement of Equipment
Costs of repairs and other factors associatedwith keeping the school plant and grounds in first-classcondition were reported in this category. Expensesincurred for painting, carpentry, plumbing, and electricalwork were included. Another significant item designatedunder this listing covers the repair and replacement ofequipment. Expenditures for such new equipment wereassociated with maintenance and were not reported,
29therefore, as capital outlay.
^United States Department of Health, Education and Welfare, op. cit., p. 227.
pdLouisiana State Department of Education, op. cit., pp. 26-27.
29Ibid., p. 27.

18Other Expenditures
Other maintenance costs that have not been considered in the above mentioned categories were grouped in this classification, including travel expenses of maintenance personnel. Also considered were unusual costs, such as damages to school plants and facilities resulting from hurricanes and other causes.
Auxiliary ServicesA number of other services directly related to
the school program— chiefly among which were schooltransportation and the school lunch program, includingthe National School Milk Program— pertained to thisfunction. Other costs, however, such as school libraries,health, agricultural extension and home demonstrationservices, parish rallies (literary and athletic), andrecreation programs, were also considered within this
31classification.
TransportationThis category was concerned with expenditures
for salaries of personnel in the school transportation
3<3Ibid., pp. 26-27.31Ibid., pp. 27-29.

19program, in addition to costs for repairs, gasoline, oil,
32tires, and insurance.
School Lunch and the National School Milk Program
All amounts expended for salaries of schoollunch employees were reported in this category. Alsoincluded were expenditures for foods, utilities, andother items concerned with the operation of the schoollunch program, including the National School Milk
33Program.
Other ExpendituresOther auxiliary provisions supported by local
school boards included agricultural extension and homedemonstration programs, recreation activities, schoollibraries, literary and athletic rallies, and health
34programs. ^Specifically, expenditures listed in this area
for school libraries excluded allotments for library books, as provided by the State Department of Education.
32Ibid., pp. 27-28.33Ibid., pp. 28-29.3^Ibid., pp. 27-29.

20As indicated previously, this item was defined and included as an instructional services item. '
Expenditures for the health program pertained to monies paid directly to parish health units for services provided by local boards of health. In some instances, however, these amounts were expended for the
oemployment of a full-time medical staff.
Fixed ChargesThese charges of a generally recurrent nature
and not suitably identified with any of the functions outlined above were reported in this classification. Specific employee benefits and building expenses (limited to insurance and rental fees) were listed under these charges. Also considered in this expense area were contributions, tuition, and other miscellaneous items.3^
Employee BenefitsAmounts referred to in this category included
employers’ contributions to various employee retirement
3^Ibid., p. 33.36Ibid., p. 28.3^United States Department of Health, Education
and Welfare, op. cit., p. 223.

21programs, social security, workmen's compensation, and insurance benefits. Special note was taken of the State's present (1969-70) contribution rate to the teachers' retirement program— 9.96 per cent of salaries paid. The State has appropriated and paid funds for the employer's share of the retirement program. Each parish and city school board was credited with the amount necessary to cover the professional employees. Although this amount was reported neither as an item of receipt nor as an item of expenditure in the budgets of the local boards, it was considered in determining per-pupil costs. For purposes of this report, therefore, this
3$item has been included as a school board expenditure.
Other ExpendituresContributions made by the school boards were
reported in this category, as were tuition costs paid to adjacent school systems. The latter program was authorized by legislation to provide for the education of children residing in remote areas of local school districts. By appropriate agreement between the superintendents of the school systems concerned, tuition was charged to allay the
39burden of additional pupils from another parish or county. '
3 $* Louisiana State Department of Education, op. cit., pp. 29-30.
39Ibid., pp. 29-30.

22Other expenditures considered within this cate
gory included rental fees paid by the school board for the use of buildings or facilities, and insurance payments on buildings and property owned by the board. Insurance charges for the school transportation program are excluded, since this item was reported as an auxiliary service.^
V. SOURCES OF DATA
Sources of data utilized in this study were:1. State Department of Education reports and
other publications.2. American Association of School Administrators’
publications.3. National Education Association publications.4. United States Department of Health, Education
and Welfare publications.5. United States Census Bureau statistical
reports.6. Other reports and publications related to the
problem.
40ibid

VI. ORGANIZATION OF THE STUDY23
In Chapter I, a background for the problem investigated was presented. The rising cost of education on a national and state basis was indicated. The terms used to classify information were discussed.
In Chapter II, was presented a synopsis of related literature surveyed by the investigator. Trends in national and state expenditures were noted. Related sources of information for current expenditures were cited.
The development of a cost of education index including the selection of expenditure items and the classification of school systems were indicated in Chapter III.
In Chapter IV, a presentation and analysis of data in terms of specific average daily membership groups of local school systems were included.
In Chapter V, a comparison of per-pupil expenditures for varying sizes of school system in Louisiana for specific school years was presented.
In Chapter VI, the summary and conclusion based upon this study were indicated.

CHAPTER II
REVIEW OF RELATED LITERATURE
I. NATIONAL LEVEL
Literature concerned with various facets of budgetary procedures utilized by local school districts was plentiful* However, there appeared to be a limited number of studies pertaining directly to the development of a cost of education index and the application of such an index in computing per-pupil cost for varying sizesof school districts.
1Paul Mort, one of the nation's foremost authorities on educational finance and spending, was one of the first administrators to recognize the need for comparing school board budgets in terms of expenditures. He stated:
A comparison of expenditures will yield valuable information about the qualities of a community's education. Merely spending the money does not guarantee anything, but if you can find how other districts have spent it to great advantage, then you've taken a step in the right direction.
^School Management Magazine (January, 1962), Tape Recorded Interview with Dr. Paul Mort, p. 129.
24

25At the very least, a comparative study becomes
an indicator of trend— it can tell whether or not your district is falling behind the times, barely keeping up, or stepping out ahead.
Even this basic information becomes useful in long-range 2planning. Mort continued by adding:
A comparative study can be a very useful guide to quality. Comparing is an old habit applied to education more than any other form of government.The problem for a school district is in knowing how to use the results; a good comparison is more than just an exercise in statistics. Since everyone operates under the same handicaps of inflation, high living standards, increasing school population and the urge for school improvement, it's wise for a community to know how it is responding to these forces as compared with other communities. It may find it is lagging behind; it might find itself out ahead and have reason to be very proud. (The latter depends upon whether the advancement was accidental or planned.) A community that is really facing up to this and knows what it is doing, and why, has every reason to be pleased. A community that has been gaining more than 7% is working toward a higher level; a community that has been gaining less than 7 is working toward a lower level.3
As early as 1#93» a U. S. Senate Committee on Finance employed Dr. Roland Faulkner to construct an index number for teachers’ salaries. Almost three decades later, in the early 1920's, both Leonard P. Ayres in his "An Index Number for State School Systems," computed index numbers. In 193&, the National Education
^Paul Mort, "Cost of Education Index I960—61," School Management, Vol. VI:1 (January, 1962), p. 130.
3Ibid.

26Association's research bureau computed a cost of education index in the study, "Why Schools Cost More."^
In the late '40's, Mort succeeded in persuading the New York State Educational Conference Board to support a pilot study concerned with the development of a cost of education index. Under Mort's direction,Lorne Woollatt developed a cost of education index for New York State.^
One decade later, in 195$, Woollatt developed a cost of education index for eighteen (1$) large citieswith populations over 500,000. Yet, a truly National
£Cost of Education Index was needed.
School Management, at the suggestion and under the guidance of Dr. Orlando F. Fumo, proceeded to underwrite the large costs involved in conducting the necessary research for a series of pilot "Cost of Education Index" studies.7
^"Orlando F. Furno, "A Statistical Look at the Cost of Education Index," School Management, Vol. VI:1 (January, 1962), p. 130.
5Ibid.6Ibid.7Ibid.

27Nearly 1,200 school districts participated in
building School Management's National Cost of EducationIndex. Each school district completed a detailedfive-page questionnaire which itemized expenditures fordozens of budgetary items for a two-year period including1960-61 and 196l-62.g
The questionnaire itself was devised by Furao.His early work at Columbia University, and particularlyhis involvement as a statistical research analyst in theInstitute of Administrative Research, established his
areputation as an educational research statistician.The school districts used in the carefully
weighted sample were selected because each represented a randomly selected unit of measurement in terms of geographical location, student population, and expenditures
10per-pupil.In the first CEI reports (published in School
Management * s April, May, June, July, and August I960, issues) the total sample included five hundred and eighty-three (5#3) school districts. For the 1960-61 index (published in January 1961), the size of the
SIbid., p. 141.9Ibid.
1 0 - r u • jIbid.

2$
sample was increased. To further assure the reliability of the statistics published in the most recent CEI, a second group of six hundred (600) districts completed a short form designed to reinforce the statistical validity of the CEI panel.^
The accumulated data were computed by School Management * s research staff and placed on punched cards.This made it possible to analyze all the data by region, district size, and expenditure level, as well as on a
~ I?national basis.A comprehensive outline of the instrument
developed by Furno was presented several years ago inSchool Management Magazine. Organization of the Index
13was outlined in terms of the following categories:1. How to use the cost of education index.2. The National Cost of Education Index 1961-62.3. How to evaluate your districts financial effort.4. How much should you spend on administration
and instruction?5. How much should you spend on maintenance and
operation?
U Ibid.12Ibid.13Ibid., pp. S6-177.

296. How much should you spend on auxiliary
services?7. How much should you spend on debt service
and capital outlay?B. What can comparison prove?9. How to compare expenditures.
10. How to do it yourself.11. How much has inflation taken from your
school?12. A statistical look at the Cost of Education
Index.Furno indicated that the Cost of Education Index
was developed to help school men define, compare, andequate their pupil cost. The Index was a scientificallydevised instrument designed to reflect all the controllableand un-controllable elements in school cost and also toreflect their relative importance in the school budget.^
Furno further revealed that the Cost of Education15Index can serve at least the following useful purposes:
1. Measuring the purchasing power of the educational dollar over the years.
14Ibid., p. 159.15Ibid., p. 161.

2. Evaluating trends in revenues and expenditures for education.
3. Obtaining greater educational returns for each dollar of school expenditure; i.e., increasing educational productivity.
4. Helping local, state, and federal officials develop sound fiscal policies for the improvement of school quality.
5. Providing for the automatic adjustment of a state's foundation program to offset the deteriorating effects of inflation.
6. Yielding invaluable information for the sale of bond issues at the most propitious times.
The Cost of Education Index as developed by16Furno included the following specific categories:
Administration!1} Professional salaries 2) Clerks and secretaries 3) Other expenditures
Instruction(1) Classroom teachers(2) Other professionals(3) Clerks and secretaries(4) Textbooks(5) Other teaching materials(6) Other expendituresHealth(1} Professional salaries(2) Other expenditures
l6Ibid., p. 94

31Operation(1) Custodial salaries(2) Heat(3) Utilities other than heat (4; Other expendituresMaintenance(1) Maintenance salaries(2) Other expendituresFixed Charges(1) Retirement funds(2) Other expendituresOther ServicesNet Current ExpendituresTransportation(1) Salaries(2) OtherCapital Outlay Debt Services Total ExpendituresThe Cost of Education Index has become an instru
ment for facilitating comparisons. Last year hundreds of districts from Vancouver, Washington, to Burlington,Vermont, used the Index to bring to their citizens the
17story of rising school costs.In Vancouver, Superintendent R. C. Bates used
the CEI figures to show his board— and voters— how Vancouver measured up to other school districts in the nation and the immediate area, and how inflation was
"^Ibid., p. 141

32affecting school costs* He was also able to show graphically and dramatically, exactly what a school levy defeat
lghad meant to his community's schools.In Glens Falls, New York, Administrative Assistant
Robert A, Churchill took advantage of the CEI figures to prepare an inexpensive brochure comparing his district’s expenditures with those of other districts in his vicinity. He chose this variable, rather than district size, because he felt that expenditures in Glens Falls
19were most closely controlled by the factor of location.In South Dakota, fourteen (14) districts pooled
their expenditure information in order to compare theirspending patterns among themselves and with otherdistricts.2*
Robert W. Cope, supervising principal inSchwenksville, Pennsylvania, made use of the figures toprepare a small mimeographed leaflet designed to help thecitizens of his town "understand how our school is
21supported."
^Ibid.19Ibid.20Ibid.21Ibid.

33Cope placed most of his emphasis on the need for
improving the tax base of his community, showing theproblems involved both in terms of available funds andincreasing school costs. He showed that his districtwas lagging behind the average districts in his region in
22its expenditures for education.These were just a few of the districts across
the nation that have used the Cost of Education Index. Some have compared themselves with the nation, others with their neighbors, their region, or districts of their size.23
II. STATE LEVEL
In Louisiana, no Cost of Education Index has been developed nor have comparisons been made of expenditures of local school boards in terms of sizes of school districts. Detailed expenditures for current operation by the local school districts in Louisiana have been presented each year in the annual reports of the State Department of Education.
22Ibid.23Ibid.

34According to Section 16 of Title 17 of the
Louisiana Revised Statutes of 1 9 5 0 , the State Superintendent shall prepare an annual report to the Governor and to members of the Legislature on the condition and progress made, and on possible improvements to be made in the public schools. This report must contain among other items the following:
. . . A complete financial report on the receipts and expenditures of the department and of the various educational institutions under the supervision of the state board of education. . . .
In these annual reports, expenditure data have been presented under six basic functions related to current operation. These are: general control,instructional services, operation of plant, maintenance of plant, auxiliary services, and fixed charges.Detailed items have been reported for each category. Per-pupil cost, as determined in this report, has been calculated by utilizing public school average daily membership and cumulative expenditures for current operation. This cumulative expenditure figure includes the employer’s contribution to the teacher retirement program and materials of instruction including textbooks,
^Louisiana Revised Statutes, Title 17, par. 16. 25Ibid.

35library books, and school supplies purchased under the state program.
This approach, utilized in Louisiana for reporting per-pupil cost, has been in use for several years.No additional effort has been made in the state to classify these expenditures in terms of an approved index and for varying sizes of school districts.
Therefore, literature in this field for Louisiana was non-existent. Hence, the need for the development of an appropriate index to be utilized by school administrators for budget preparation and comparisons with a composite of systems with comparable membership data was evident•

CHAPTER III
PROCEDURES USED IN THE STUDY
The appropriate procedures utilized in developing this study were significant and therefore, require additional explanation other than a brief presentation. Important sections of this Chapter included the following: (1) determination of the classification of schooldistricts according to average daily membership, (2) the development of the cost of education index used in analyzing expenditures for current operation by local school districts, (3) & comparison of the National and State Cost of Educational Indexes, (4) the development of appropriate formulas used in determining comparable cost data, and (5) summary.
I. DETERMINATION OF THE CLASSIFICATION OF SCHOOL DISTRICTS ACCORDING TO AVERAGE DAILY MEMBERSHIP
A study of the National Cost of Education Index revealed that computations were based upon actual enrollment figures. For the purpose of this study it was considered more feasible to utilize public school average daily membership data. Use of membership figures was
36

considered to be a more valid figure for computing cost data and making reliable comparisons among school systems since average daily membership referred to the actual number of pupils on the class roll. Furthermore, the use of average daily membership was considered more realistic since the State Department of Education uses average daily membership data in allocating teachers to local school systems under the State’s Minimum Foundation Program. Further use of average daily membership was made in the Foundation Program in determining allocations in the "other cost" item of the cost phase.
In determining sizes of school districts, aneffort was made to utilize the classifications made byF u m o for the national study. These classifications^ wereidentified as being:
Size 1 — More than 25,000 Size 2 - 10,001 to 25,000 Size 3 — 5,001 to 10,000 Size 4 - 2,501 to 5,000 Size 5 - 1,201 to 2,500 Size 6 — 601 to 1,200 Size 7 — 300 to 600
^Orlando F. Furno, "How to Use the Cost of Education Index," School Management, VI:1 (January, 1962), p. ^7

33However, a review of these classifications
indicated that use of these groupings was limited because of the small categories reported. This caused a very large number of school systems to be placed in an extremely limited number of average daily membership groups, particularly in the 25,000 and over category. Rather, an effort was made to develop a classification of school systems which was more practical and applicable to Louisiana.
Louisiana utilizes the county or parish as the basic school administrative unit. Hence, Louisiana has sixty-two parish-wide (county) units, two large school districts, and two city school systems or a total of sixty-six basic school administrative units in the State. As a result, the State's local structure for administering public education has been highly centralized with a tendency toward large districts both in geographic size and school population.
In Tables 22-26 in the Appendix a listing of the parish and city school systems in Louisiana in terms of average daily membership for the following years 1961-62, 1966-67, 1967-63, 1963-69, and 1969-70 was presented. During the period 1961-62 through 1969-70, average daily membership increased from 706,413*3 to 341,512.4. However, the highest average daily membership was recorded

39in 1968-69 when a total of 856,692.0 was noted. School systems with large urban areas reported high average daily membership data while highly rural systems reported low membership figures. In addition, there were several urban-rural systems reporting in the State. Generally, the larger average daily membership systems were located in South Louisiana while the lower average daily membership systems were located in North Louisiana. There were exceptions, however, in Caddo, Ouachita, and Rapides Parishes. Due to the wide extremes existing in membership data, it was deemed advisable to utilize groupings which tended to classify the systems into the following broadclassifications:
ADMG-I - All urban— 75,000 or moreADMG-II - Highly urban— low rural~35,000-74,999ADMG-III - Moderately urban— sizeable rural—
20,000-34,999ADMG-IV - Sizeable urban— moderately rural—
10,000-19,999ADMG-V - Low urban— highly rural— 5,000-9,999ADMG-VI - All rural— less than 5,000In Tables 1-5 distributions of parish and city
school systems in Louisiana in terms of the specific average daily membership groups utilized in the study for the 1962, 1967, 1968, 1969, and 1970 years were indicated. A summary of these distributions was reported in Table 6. An analysis of these data revealed that one school system, Orleans, reported an average daily membership of75,000 or more for the period.

40In ADMG-II the number of school systems increased
from three to four during the period included in the study. Included in this category for 1962 and 1967 were Caddo, East Baton Rouge, and Jefferson. Beginning in 1968 and continuing through 1969 and 1970, the average daily membership in Calcasieu Parish increased by virtue of consolidation with the City System of Lake Charles School System. This system was added to ADMG-II.
The number of systems reported in ADMG-III fluctuated between a low of two in 1962 to a high of four in 1969. In 1970, three systems were reported in this category. They were Lafayette, Rapides, and Terrebonne. ADMG-IV included school systems with an average daily membership of 10,000-19,999. No less than ten systems and no more than twelve systems were reported in this group. In 1970, the twelve systems included: Acadia, Bossier, Iberia, Lafourche, Ouachita, St. Bernard, St, Landry, St. Mary, St. Tammany, Tangipahoa, Webster, and the City of Monroe.
The largest number of parishes and city school systems were included in ADMG-V. During the period 1962 through 1969 as many as twenty-seven school systems were included in this group; however, in 1970, twenty-four school systems were listed in this category. They were: Allen, Ascension, Assumption, Avoyelles, Beauregard,

41Concordia, DeSoto, Evangeline, Franklin, Iberville, Jefferson Davis, Lincoln, Livingston, Morehouse, Natchitoches, Richland, St. Charles, St. James, St. John, St. Martin, Vermilion, Vernon, Washington, and the City of Bogalusa.
The number of school systems in ADMG-VI has decreased from twenty-four to twenty-two in the period 1962-1970. Listed in this classification were:Bienville, Caldwell, Cameron, Catahoula, Claiborne,East Carroll, East Feliciana, Grant, Jackson, LaSalle, Madison, Plaquemines, Pointe Coupee, Red River, Sabine,St. Helena, Tensas, Union, West Baton Rouge, West Carroll, West Feliciana, and Winn.
II. THE DEVELOPMENT OF THE COST OF EDUCATION INDEX USED
IN THE STUDY
The annual reports of the Louisiana State Department of Education presents expenditures for current operations in terms of six major functions; namely, general control, instructional services, operation of plant, maintenance of plant, auxiliary services, and fixed charges. Each of these major functions includes numerous expenditure items.

Table 1
Distribution of Parish and City School Systems in Louisiana in Terms of Average Daily Membership, 1961-62
75,000 or more
35,00074,999
20,00034,999
10,00019,999
5,0009,999
Less than 5,000
Orleans Caddo Calcasieu Bossier Acadia AssumptionE. Baton Rouge Rapides Iberia Allen BienvilleJefferson Lafayette Ascension Caldwell
Lafourche Avoyelles CameronOuachita Beauregard CatahoulaSt. Landry Concordia ClaiborneSt. Mary DeSoto East CarrollTangipahoa Evangeline East FelicianaTerrebonne Franklin GrantWebster Iberville Jackson
Jefferson Davis LaSalleLincoln MadisonLivingston Red RiverMorehouse SabineNatchitoches St. HelenaPlaquemines St. JamesPointe Coupee St. John
■p-

Table 1 (continued)
75,000 or more
35,00074,999
20,00034,999
10,00019,999
5,0009,999
Less than 5,000
Richland St. Bernard St. Charles St. Martin St. Tammany Vermilion Vernon Washington C. of Bogalusa C . of Monroe
TensasUnionWest Baton Rouge West Carroll West Feliciana WinnC. of Lake Charles
1 3 2 10 27 24
92,436.3 136,771.1 50,719.9 142,606.1 192,615.0 91,214.9

Table 2
Distribution of Parish and City School Systems in Louisianain Terms of Average Daily Membership, 1966-67
75,000 35,000 20,000 10,000 5,000 Less than 5,000or more 74,999 34,999 19,999 9,999
Orleans Caddo Calcasieu AcadiaE. Baton Rouge Lafayette BossierJefferson Rapides Iberia
St. Landry Lafourche Ouachita St. Bernard St. Mary St. Tammany Tangipahoa Terrebonne WebsterC. of Monroe
AllenAscensionAvoyellesBeauregardConcordiaDeSotoEvangelineFranklinIbervilleJefferson DavisLincolnLivingstonMorehouseNatchitochesPointe CoupeeRichland
AssumptionBienvilleCaldwellCameronCatahoulaClaiborneEast CarrollEast FelicianaGrantJacksonLaSalleMadisonPlaqueminesRed RiverSabineSt. Helena
•p-

Table 2 (continued)
75,000 35,000 or more 74,999
20,00034,999
10,00019,999
5,0009,999
Less than 5,000
St, Charles St. James St. John St. Martin Vermilion Vernon Washington C. of Bogalusa
TensasUnionWest Baton Rouge West Carroll West Feliciana WinnC. of Lake Charles
1 3 4 12 24 23
106,044.7 166,637.1 102,306.5 170,7^3,8 176,606.6 87,515.1
■F-vn

Table 3
Distribution of Parish and City School Systems in Louisianain Terms of Average Daily Membership, 1967-63
75,000 35,000 20,000 10,000 5,000 Less than 5,000or more 74,999 34,999 19,999 9,999
Orleans CaddoCalcasieu E. Baton Rouge Jefferson
Lafayette Rapides
AcadiaBossier
St. Landry IberiaLafourche Ouachita St. Bernard St. Mary St. Tammany Tangipahoa Terrebonne Webster
AllenAscensionAssumptionAvoyellesBeauregardConcordiaDeSotoEvangelineFranklinIbervilleJefferson Davis
C, of Monroe LincolnLivingston Morehouse Natchitoches Pointe Coupee
BienvilleCaldwellCameronCatahoulaClaiborneEast CarrollEast FelicianaGrantJacksonLaSalleMadisonPlaqueminesRed RiverSabineSt. HelenaTensas
-p-Os

Table 3 (continued)
75,000 35,000 or more 74,999
20,00034,999
10,00019,999
5,0009,999
Less than 5,000
Richland St, Charles St. James St. John St. Martin Vermilion Vernon Washington C . of Bogalusa
UnionWest Baton Rouge West Carroll West Feliciana Winn
1 4 3 12 25 21
107,204.0 213,272.5 73,274.3 174,642.0 184,580.8 77,681.1

Table 4
Distribution of Parish and City School Systems in Louisianain Terms of Average Daily Membership, 196&-69
75,000 35,000 20,000 10,000 5,000 Less than 5,000or more 74,999 34,999 19,999 9,999
Orleans CaddoCalcasieu E. Baton Rouge Jefferson
Lafayette Rapides St. Landry Iberia Terrebonne Lafourche
Ouachita St. Bernard St. Mary St. Tammany Tangipahoa Webster
Acadia AllenBossier Ascension
Assumption Avoyelles Beauregard Concordia DeSoto Evangeline Franklin Iberville
C. of Monroe Jefferson Davis Lincoln Livingston Morehouse Natchitoches Plaquemines
BienvilleCaldwellCameronCatahoulaClaiborneEast CarrollEast FelicianaGrantJacksonLaSalleMadisonRed RiverSabineSt. HelenaTensasUnion
•p-oa

Table 4 (continued)
75,000 35,000 or more 74,999
20,00034,999
10,00019,999
5,0009,999
Less than 5,000
Pointe Coupee Richland St. Charles St. James St. John St. Martin Vermilion Vernon Washington C . of Bogalusa
West Baton Rouge West Carroll West Feliciana Winn
1 4 4 11 26 20
108,682,9 221,453.2 95,103.4 161,537.1 192,551.3 74,034.1
•r-vO

Table 5
Distribution of Parish and City School Systems in Louisianain Terms of Average Daily Membership, 1969-70
75,000 35,000 20,000 10,000 5,000 Less than 5,000or more 74,999 34,999 19,999 9,999
Orleans Caddo Lafayette AcadiaCalcasieu Rapides BossierE* Baton Rouge Terrebonne IberiaJefferson Lafourche
Ouachita St. Bernard St. Landry St. Mary St. Tammany Tangipahoa Webster C. of Monroe
AllenAscensionAssumptionAvoyellesBeauregardConcordiaDeSotoEvangelineFranklinIbervilleJefferson DavisLincolnLivingstonMorehouseNatchitochesRichland
BienvilleCaldwellCameronCatahoulaClaiborneEast CarrollEast FelicianaGrantJacksonLaSalleMadisonPlaqueminesPointe CoupeeRed RiverSabineSt. Helena
VXlO
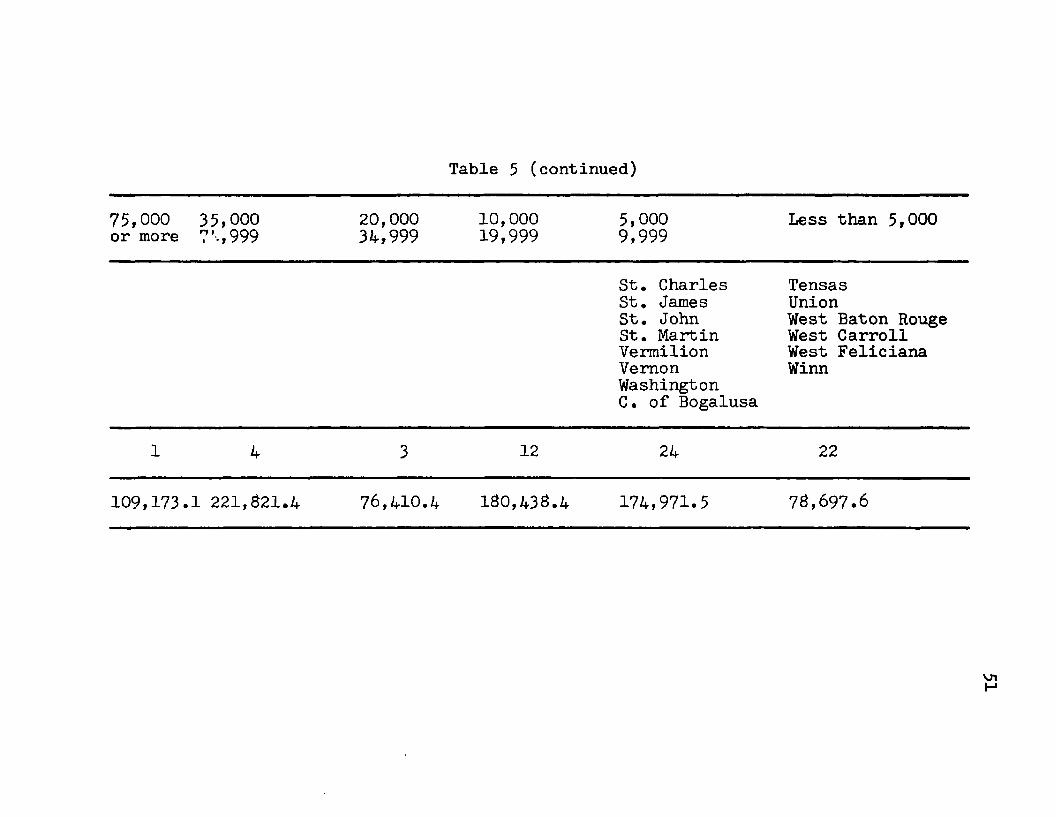
Table 5 (continued)
75,000 35,000 or more ?'.,999
20,00034,999
10,00019,999
5,0009,999
Less than 5,000
St. Charles St. James St. John St. Martin Vermilion Vernon Washington C. of Bogalusa
TensasUnionWest Baton Rouge West Carroll West Feliciana Winn
1 4 3 12 24 22
109,173.1 221,$21.4 76,410.4 180,43$.4 174,971.5 78,697.6
H

Table 6
Summary of Distribution of Parish and City School Systems in Louisianain Terms of Average Daily Membership
1961-62 1966-67 1967-68 1968-69 1969-70Group No. ADM No. ADM No. ADM No. ADM No. AIM
75,000 or more 1 92,486.3 1 106,044.7 1 107,204.0 1 108,682.9 1 109,173.135,000-74,999 3 136,771.1 3 166,687.1 4 213,272.5 4 221,453.2 4 221,821.420,000-34,999 2 50,719.9 4 102,306.5 3 73,274.3 4 98,103.4 3 76,410.410,000-19,999 10 142,606.1 12 170,788.8 12 174,642.0 11 161,537.1 12 180,438.45,000-9,999 27 192,615.0 24 176,606.6 25 184,580.8 26 192,881.3 24 174,971.5Less than 5,000 24 91,214.9 23 87,515.1 21 77,681.1 20 74,034.1 22 78,697.6
Total 67 706,413.3 67 809,948.8 66 830,654.7 66 856,692.0 66 841,512.4
VJtto

53In Table 7 was reported the number of individual
expenditure items included as current operation in the Annual Reports of the State Department of Education for 1962, 1967, 1963, 1969, and 1970.
Table 7
Number of Expenditure Items Reported for Current Operation in the Annual Report of the State Department of Education
Year Number of Items
1962 1211967 1031963 1051969 1051970 111
Note: 1963 figures based upon unpublished datasecured from Louisiana State Department of Education.
An analysis of Table 7 revealed that the number of expenditure items reported for current operation varied from a low of one hundred and three (103) items in 1967 to a high of one hundred and twenty-one (121) items reported in 1962. Little change was noted in the successive year period beginning in 1967 and ending in 1970.

54Items fluctuated between one hundred and three (103) and one hundred and eleven (111) for this four-year period.
An effort was made to adapt and apply the National Cost of Education Index developed by Furno to expenditures available for local school systems in Louisiana. However, its applicability was not feasible for the following reasons:
1. The National Study placed Health Services and Transportation of pupils to school in separate categories, whereas in Louisiana these items were reported as auxiliary services.
2. Expenditures for the School Lunch Program were excluded from the National Index, whereas in this study this item was reported as an auxiliary service.
3. Minor expenditures for such auxiliary services as agricultural extension, home demonstration programs, recreation programs, and literary and athletic rallies sponsored by a school district were reported as auxiliary services.
4* Fees paid assessors and local sheriffs for services rendered in the administration of the local school board's ad valorem tax program were included.
5. Expenditures incurred by certain school boards for repairs resulting from hurricanes have been included as maintenance items.

556. Expenditures of funds made available for
current operation from several federal programs have been included.
7. Expenditures for such items as sick leave, sabbatical leave, substitute pay, and special education have been reported as instructional items.
As a result of these major differences it was deemed advisable to develop, an index in terms of budgetary and expenditure categories required from local school systems in the State. In Table & was reported a list of the expenditure items in terms of each major function.In Step 1 was enumerated expenditures reported by school boards. In Step 2 was indicated the consolidation of items which occurred in terms of preparing the final index. Close scrutiny of the consolidations effected in Step 2 revealed the following:
General ControlThere were four expenditure items under Professional
Salaries. These four items were: superintendent's salary,assistant superintendent's salary, director's salary, and business manager's salary have been consolidated under one item, professional salaries. Clerks and secretaries remained as a separate item of expenditure. The remaining ten items of expenditure for general control were

Table S
Steps in Preparing a Cost of Education Indexfor Louisiana
General ControlStep 1 Step 21. Professional Salaries 1. Professional Salaries
a. Superintendent's Salaryb. Assistant Superintendent's Salaryc. Directors' Salariesd. Business Manager, Bookkeepers,
and Purchasing AgentsSub Total
2. Clerks and Secretaries 2. Clerks and Secretaries3. Other Expenditures 3* Other Expenditures
a. Mileage and per diem of school board
b. State and National School Board Association Dues
c. Travel and Expenses of school board
d. Superintendent’s Travele. Assistant Superintendent's
Travelf. Directors’ Travelg. Travel of Business Manager,
Bookkeepers, and Purchasing Agents
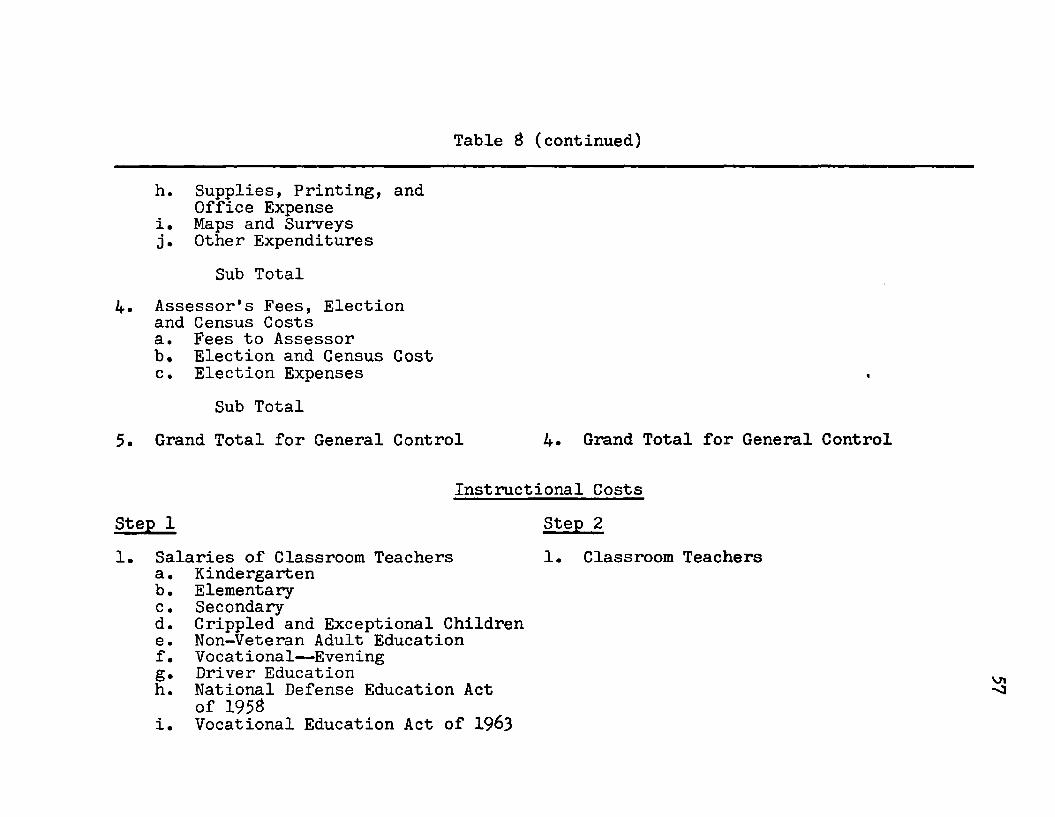
Table 3 (continued)
h. Supplies, Printing, and Office Expense
i. Maps and Surveys j. Other Expenditures
Sub Total4. Assessor's Fees, Election
and Census Costsa. Fees to Assessorb. Election, and Census Costc. Election Expenses
Sub Total5. Grand Total for General Control 4. Grand Total for General Control
Instructional Costs Step 1 Step 21. Salaries of Classroom Teachers 1. Classroom Teachers
a. Kindergartenb. Elementaryc. Secondaryd. Crippled and Exceptional Childrene. Non-Veteran Adult Educationf. Vocational-Eveningg. Driver Educationh. National Defense Education Act
of 195Si. Vocational Education Act of 1963

Table £ (continued)
2.
j. Elementary and Secondary Education Act of 1965
k. Adult Education Act of 1966 1. Office of Economic Opportunity—
Headstart m. Summer School n. Adult Civil Defenseo. Miscellaneous— -Special Teachers
Sub TotalOther Professionals
Principals SupervisorsSpecial Area Supervisors Visiting Teachers
a.b.c.d.
Sub Total3. Clerks and Secretaries4. Textbooks5. Materials and Supplies for Teaching6. Other Expenditures
a. Substitute Payb. Evening Schoolsc. Sabbatical Leaved. Travel of Supervisors
2, Other Professionals
3. Clerks and Secretaries4. Textbooks5. Materials and Supplies for Teaching6. Other Expenditures

Table & (continued)
e. Travel of Special Area Supervisorsf. Travel of Visiting Teacherg. Travel of Teachers and Principalsh. Special Education— -Collegesi. Southern Association Dues j. Conferences and Workshops k. Purchase of Private Special
Education1. Adult Education Act, 1966 in. Teacher Aidesn. ESEA 1965o. EPDAp. Miscellaneousq. Voc. Ed. Act 1963 f Work Study
Sub Total7. Grand Total for Instructional Costs 7. Grand Total for Instructional Costs
Step 11. Custodial Salaries
Operation of Plant Step 21. Custodial Salaries
2. Heat3. Utilities Other than Heat
a. Lights, Water, Power and Fuel Cost
b. Telephone and Telegraph
2. All Utilities
Sub Total

Table 8 (continued)
4. Supplies5. Other Expenditures
a. Operation of Driver Education Carsb. Drayage and School Board Trucksc. Garbage and Sewerage Feesd. Miscellaneous Items
Sub Total6. Grand Total for Operation of Plant
Other Expenditures
4. Grand Total for Operation of Plant
Maintenance of PlantStep 11. Maintenance Salaries
a. Supervisorb. Carpenters, Painters, etc.
Sub Total2. Repairs and Upkeep of Buildings
and Grounds
3. Repair and Replacement of Equipment4. Other Expenditures
a. Travel of Supervisorb. Travel of Other Employeesc. Elementary and Secondary
Education Act of 1965
Step 21. Maintenance Salaries
2. Repair and Upkeep of Buildings and Grounds, and repair and replacement of equipment
3. Other Expenditures
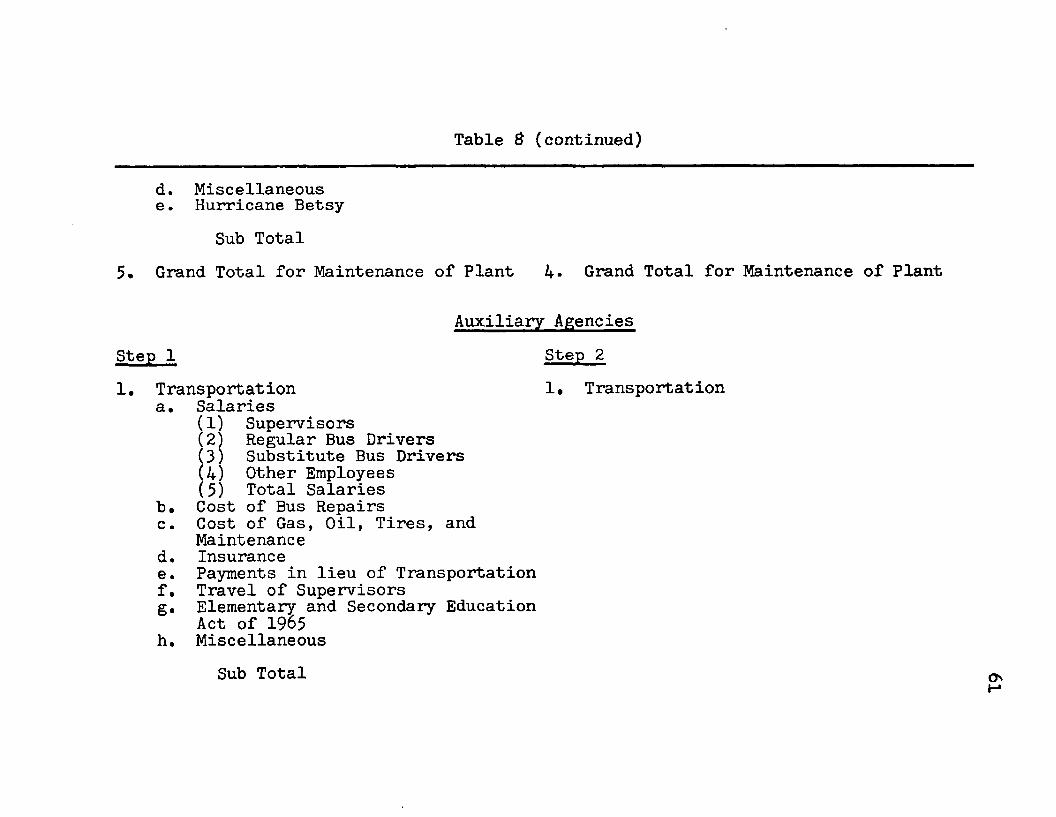
Table 6 (continued)
d. Miscellaneouse. Hurricane Betsy
Sub Total5. Grand Total for Maintenance of Plant 4« Grand Total for Maintenance of Plant
Auxiliary AgenciesStep 1 Step 21, Transportation 1. Transportation
a* Salaries(1) Supervisors(2) Regular Bus Drivers(3) Substitute Bus Drivers(4) Other Employees(5) Total Salaries
b. Cost of Bus Repairsc. Cost of Gas, Oil, Tires, and
Maintenanced. Insurancee. Payments in lieu of Transportationf. Travel of Supervisorsg. Elementary and Secondary Education
Act of 1965h. Miscellaneous
Sub Total

Table
School Lunch and National School Milk Programa. Salary of Supervisorsb. Travel of Supervisorsc. Salaries of Other School Lunch
Employeesd. All Other Expenditurese. National School Milk Program
Sub Total School Libraries Healtha. Parish Health Unitb. Other Personnel, Supplies, etc.
Sub TotalOther Expendituresa. Agricultural Extension and
Home Demonstrationb. Parish Ralliesc. Recreation Programsd. Miscellaneous
Sub Total Grand Total for Auxiliary Agencies
8 (continued)
2. School Lunch and National School Milk Program
3. Other Expenditures
Grand Total for Auxiliary AgenciesoN>
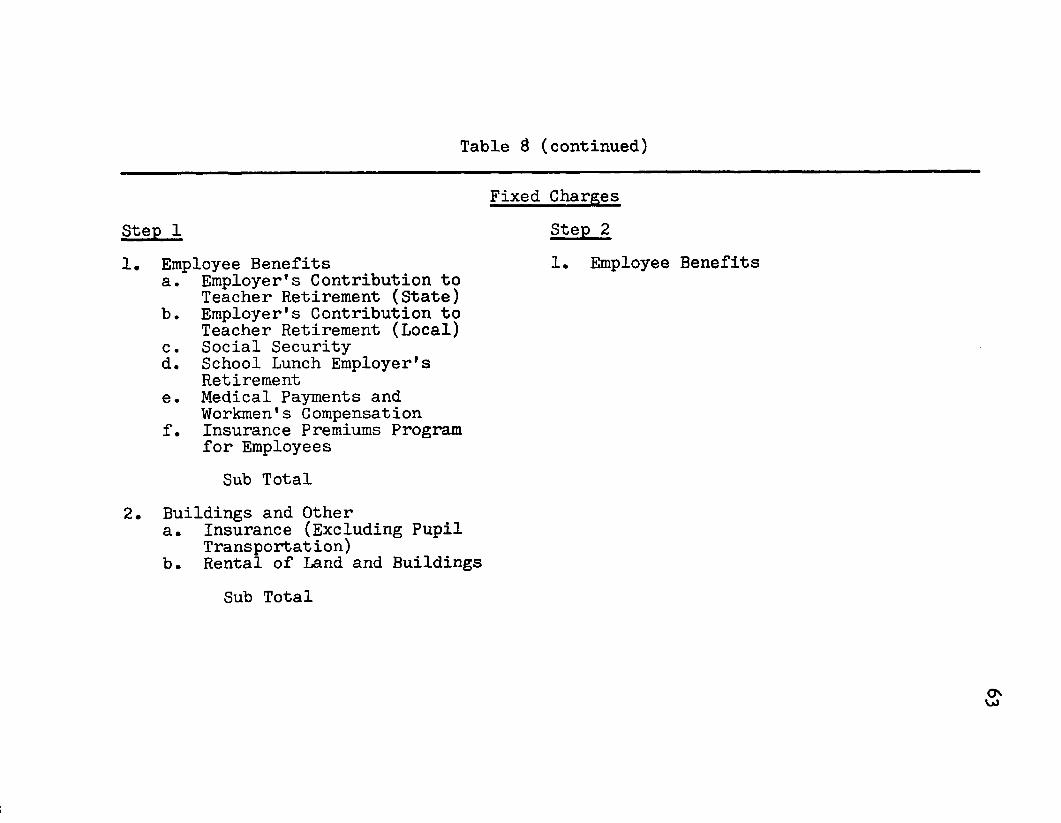
Table S (continued)
1. Employee BenefitsStep 1
Fixed Charges Step 21. Employee Benefits
a. Employer’s Contribution to Teacher Retirement (State)
b. Employer's Contribution to Teacher Retirement (Local)
c. Social Securityd. School Lunch Employer's
Retiremente. Medical Payments and
Workmen's Compensationf. Insurance Premiums Program
for EmployeesSub Total
2* Buildings and Othera. Insurance (Excluding Pupil
Transportation)b. Rental of Land and Buildings
Sub Total

Table 8 (continued)
3. Other Expenditures 2. Other Expendituresa. Contributionsb. Tuitionc. Audit of School Accountsd. Rental of Electronic Data
Processing Equipmente. Miscellaneous
Sub Total4. Grand Total for Fixed Charges 3. Grand Total for Fixed Charges
ON-F-

consolidated as one item, and referred to as other expenditures. A total of four items was reported in the consolidated index for general control.
Instructional ServicesSalaries of classroom teachers were reported in
fifteen sub-categories, and these data were consolidated under one specific category referred to in Step 2 as classroom teachers salaries. The item, other professional personnel, includes sub-categories in Step 1 which related to salaries of principals, supervisors, area supervisors, and visiting teachers. In Step 2 these sub-categories have been consolidated as other professionals. Clerks and secretaries, textbooks and materials, and supplies for teaching listed as separate items in Step 1, were reported as separate items of expenditure in Step 2. All other items of expenditure under instructional services were consolidated and referred to as other expenditures.There were six separate items in Step 2 that were used as Cost of Education Index items for instructional services.
Operation of PlantCustodial salaries, reported as a single item in
Step 1, remained unchanged in Step 2. Supplies, heat, and all other utilities were placed under one classification and referred to as all utilities. The remaining

66number of items for operation of plant was grouped together under other expenditures. A total of three items was used in Step 2 for operation of plant in the Cost of Education Index.
Maintenance of PlantTwo items of expenditure under maintenance
salaries were consolidated into one category and referred to as maintenance salaries in Step 2. Repairs and upkeep of buildings and grounds and the repair and replacement of equipment were combined to form one item as indicated in Step 2. The remaining items of expenditure were grouped under one classification in Step 2 referred and reported as other expenditures. There were three specific classifications of maintenance items in Step 2 that were used in the Cost of Education Index.
Auxiliary AgenciesTwenty items of expenditure were reported under
this area of spending. Of this number, twelve were concerned with pupil transportation. The transportation cost items were consolidated under one item and referred to as transportation. Five items of expenditure related to the operation of the school lunch program and the national school milk program were consolidated under one item and referred to as the school lunch program including the

National School Milk Program. The remaining items were classified as other expenditures. These three items of expenditure for auxiliary agencies in Step 2 were used as Cost of Education Index items.
Fixed ChargesThe six items of expenditures under employee
benefits in Step 1 were consolidated and referred to as employer benefits. All other items were grouped under one expenditure item referred to as other expenditures. These two items of expenditure listed in Step 2 were used as Cost of Education Index items.
In Table 9 was reported a summary of major functions and expenditure items included in the development of the State Cost of Education Index. As indicated, a total of one hundred and eleven (111) expenditure items was included in Step 1. In Step 2, as a result of consolidation, the number of items was reduced to twenty

Table 9
Summary of Functions and Expenditure ItemsIncluded in the Development of the
State Cost of Education Index
Function Items Function Items
General Control 18 General Control 3Instructional Services 39 Instructional Services 6Operation of Plant 9 Operation of Plant 3Maintenance of Plant 9 Maintenance of Plant 3Auxiliary Agencies 23 Auxiliary Agencies 3Fixed Charges 13 Fixed Charges 2
Net Current Expenditures 111 Net Current Expenditures 20
ON00-

69I I I . A COMPARISON OF THE NATIONAL AND STATE COST
OF EDUCATION INDEXES
Similar to the research by Furno, this study also classified expenditures for current operation under six (6) major categories. This procedure was consistent with budgetary practices utilized by Louisiana's public schools.
In Tables 10 and 11 were indicated comparisons of functions and expenditure items included in Furno’s Cost of Education Index and the State Index used in this study. Some of the major differences noted were:
General ControlBoth Indexes use three headings in classifying
expenditures under this category, and the items were comparable in content. The National Index referred to this category as administration, whereas this particular study, in keeping with the terminology used by local boards, utilized the title general control.
Instructional ServicesThe categories and classifications in these items
were comparable. Both indexes included six (6) classifications. There were some variations in the expenditures that were included in the classifications; however, these items were minor and of little significance.

Table 10
A Comparison of Functions and Expenditure ItemsIncluded in the National and State Cost
of Education Indexes2National Cost of Educational Index Louisiana Cost of Educational Index
Administration(1) Professional Salaries(2) Clerks and Secretaries(3) Other Expenditures
Sub Total
General Control(1) Professional Salaries(2) Clerks and Secretaries(3) Other Expenditures
Sub Total
Instruction(1} Classroom Teachers(2) Other Professionals(3) Clerks and Secretaries(4) Textbooks(5) Other Teaching Materials(6) Other Expenditures
Sub Total
Instructional Services(1) Classroom Teachers(2) Other Professionals(3) Clerks and Secretaries(4) Textbooks(5; Other Teaching Materials(6) Other Expenditures
Sub Total
2Ibid., p. 94

Table 10 (continued)
National Cost of Educational Index
Operation(1) Custodial Salaries(2) Heat(3) Utilities Other than Heat(4) Other Expenditures
Sub Total
Louisiana Cost of Educational Index
Operation of Plant(1) Custodial Salaries(2) All Utilities including heat or fuel(3) Other Expenditures
Sub Total
Maintenance(1) Maintenance Salaries(2) Other Expenditures
Maintenance of Plant(1) Maintenance Salaries(2) Repair and Upkeep of Buildings
including repair and replacement of equipment
(3) Other ExpendituresSub Total Sub Total
Health(1) Professional Salaries(2) Other Expenditures
Sub Total
Auxiliary Agencies(1) Transportation(2) School Lunch including the
National School Milk Program(3) Other Expenditures
Sub Total
H

Table 10 (continued)
National Cost of Educational Index Louisiana Cost of Educational Index
Fixed Charges Fixea Charges(1) Retirement Funds (1) Employee Benefits(2) Other Expenditures (2) Other Expenditures
Sub Total Sub TotalNet Current Expenditures Net Current Expenditures
?o

Table 11
Summary of Functions and Expenditure Items Includedin the National and State Cost of Education Indexes
3National Index State Index
Function Items Function Items
Administration 3 General Control 3Instruction 6 Instructional Services 6Operation 4 Operation of Plant 3Maintenance 2 Maintenance of Plant 3Health 2 Auxiliary Agencies 3Fixed Charges 2 Fixed Charges 2
Net Current Expenditures 19 Net Current Expenditures 20
^Ibid., p. 94.
Operation of PlantThe National Index included four items. This
study listed three items, the difference being that the National Index classified heat as a separate item apart from other utilities. However, in the State Index, heat was reported with all utilities.
Maintenance of PlantFurno, in his National Index, used two classifi
cations in this category. The State Index used three classifications. Repair and upkeep of buildings and grounds including the repair and replacement of equipment is a major expenditure for maintenance, hence, this item was reported in a separate category.
Auxiliary AgenciesIn the National Index, health services were reported
as a separate major category of expenditures. However, in Louisiana’s reporting procedures, expenditures for health services were listed under auxiliary agencies. Health services were not indicated as a major expenditure item in Louisiana’s local school systems, therefore, no effort was made to list this item as a separate category.
75Fixed Charges
Both Indexes used two items for classifying expenditures under this function* The items were similar with some minor variations. In the State Index study, the term employee benefits included a broader concept than retirement funds as used in the National Index. In Louisiana, the employer’s contribution to retirement programs, social security, workmen's compensation and insurance premiums were included in this category. In Furno's Index, this item was not as comprehensive in that it was limited to include employees' retirement programs.
It was noted that Furno did not include transportation as an item of expenditure in his Cost of Education Index. In Louisiana, all local school systems provide transportation, and this item represents a large per cent of expenditures made by school boards.
Louisiana's highly centralized system of funding education caused some items to be included in the State Index that were excluded in the National Index; however, these differences have been discussed.
Finally, it was noted from data presented in Table 11 that Furno's Index included a total of nineteen items, whereas in the State Index a total of twenty items was included.

IV. THE DEVELOPMENT OF THE FORMULA USED IN COMPUTING COMPARABLE EXPENDITURE
PER-PUPIL YEAR DATA
For the purpose of this study it was necessary to develop an appropriate expenditure data formula in order to develop and establish accurate comparisons and valid trends in terms of the various average daily membership groups of school systems.
One of the basic calculations that needed to be made was concerned with determining the net expenditures per-pupil year. In order to arrive at this basic figure, two factors were basic. They were: expenditures forcurrent operation in terms of each average daily membership group and the average daily membership in public schools in each average daily membership group. In order to arrive at the expenditure per-pupil year, the following formula was utilized:
Expenditures for Current OperationAverage Daily Membership

77In this formula, the following terms applied:
EPPY referred to expenditure per-pupil year.ECO referred to expenditure for current
operation.ADM referred to average daily membership.
This formula was applied to the six (6) basic average daily membership groups used in the study.
V. SUMMARY
In Chapter III was presented a detailed analysis of procedures used in this study. The Chapter has been divided into four (4) specific sections. In the first section a determination of the classification of school districts according to average daily membership is made. Justification for use of six (6) average daily membership groups was indicated.
In Section 2, a detailed presentation was made concerning the development of the Cost of Education Index used in this study. Steps used in arriving at the final index have been discussed.
In Section 3, a comparison of the National and State Cost of Education Indexes has been made. Variations between the two indexes have been indicated. In addition, the items in each index has been compared.
In Section 4, the items used in the development of the formula used in the study were discussed.

CHAPTER IV
PRESENTATION AND ANALYSIS OF DATA IN TERMS OF SPECIFIC AVERAGE DAILY MEMBERSHIP GROUPS
OF LOCAL SCHOOL SYSTEMS
The purpose of Chapter IV was to present and analyze data compiled in the study. The presentation of these data was made in terms of the average daily membership groups identified in the study and the Cost of Education Index developed for the purpose of determining trends and comparisons of data. There are six different categories of school systems organized and used in the study, and data were presented for the years 1961-62,1966-67, 1967-63, 1963-69 and 1969-70.
I. AVERAGE DAILY MEMBERSHIP GROUP I
School systems with an average daily membership of 75,000 or more were included in ADMG-I. For each year in the study only one school system was included in this category.
In Table 12, trends on a per-pupil year basis for school systems included in ADMG-I for the years included in the study were indicated. Tabulations have been made
73
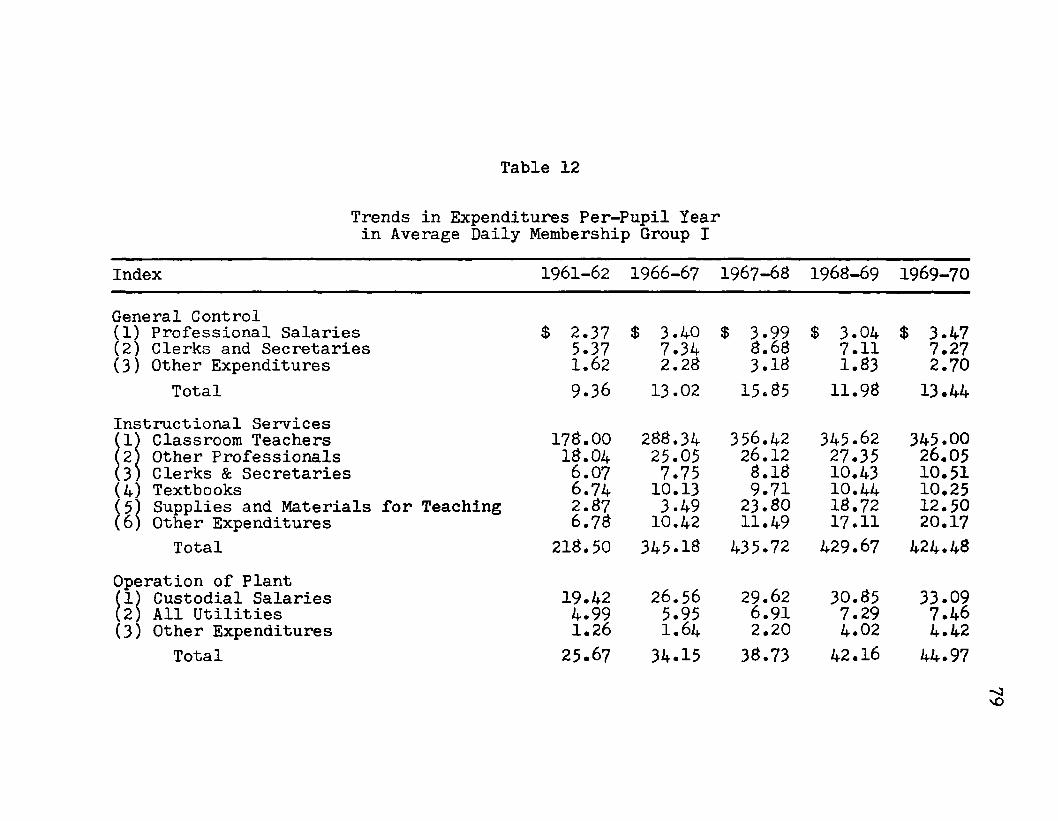
Table 12
Trends in Expenditures Per-Pupil Year in Average Daily Membership Group I
Index 1961-62 1966-67 1967-68 1968-69 1969-70
General Control(1) Professional Salaries(2) Clerks and Secretaries(3) Other Expenditures
$ 2.37 5.37 1.62
$ 3.40 7.34 2.28
$ 3.99 8.68 3.18
$ 3.04 7.11 1.83
$ 3.47 7.27 2.70
Total 9.36 13.02 15.85 11.98 13.44Instructional Services (1} Classroom Teachers(2) Other Professionals(3) Clerks & Secretaries(4) Textbooks(5) Supplies and Materials for Teaching(6) Other Expenditures
178.0018.046.076.742.876.78
288.3425.057.7510.133.4910.42
356.4226.128.189.7123.8011.49
345.6227.3510.4310.44 18.72 17.11
345.0026.0510.5110.2512.5020.17
Total 218.50 345.18 435.72 429.67 424.48Operation of Plant(1) Custodial Salaries(2) All Utilities(3) Other Expenditures
19.424.991.26
26.565.951.64
29.626.912.20
30.857.294.02
33.097.464.42
Total 25.67 34.15 38.73 42.16 44.97

Table 12 (continued)
Index 1961-62 1966-67 1967-68 1968-69 1969-70
Maintenance of Plant(1) Maintenance Salaries $ 12.41 $ 14*46 $ 15.00 $ 15.87 $ 15.29(2) Repair and Upkeep of Buildings &
Grounds and Repair and Replacementof Equipment 5.55 3.37 9.98 9.72 8.27(3) Other Expenditures 0.00 21.54 .36 .39 .32
Total 17.96 44.37 25.34 25.98 23.33Auxiliary Services(1) Transportation 5.39 6.93 7.22 5.37 6.41(2) School Lunch including National
School Milk Program 26.71 49.61 38.32 40.94 45.34(3) Other Expenditures 1.71 1.67 2.08 2.15 2.12Total 33.31 53.21 47.62 48.46 53.87
Fixed Charges(1) Employee Benefits 20.02 35.60 37.05 37.59 37.77(2) Other Expenditures 3.13 4.05 4.63 4.26 6.04
Total 23.15 39.65 41.68 41.85 43.81Grand Total $323.45 $535.03 $604.94 $600.10 $604.45
co.o

81according to each major function listed in the Cost ofEducation Index.
General ControlExpenditures for general control were classified
in terms of three specific items. These are: professionalsalaries, clerks and secretaries, and other expenditures.
An analysis of data indicated that expenditures for clerks and secretaries were greater than expenditures for the two remaining items. The largest amount expended per-pupil was in 1967-68 when the sum of $15.85 was reported for general control. The lowest amount was indicated in 1961-62 when an amount of $9.36 per-pupil was reported.In 1969-70, expenditures for general control on a per-pupil basis increased to $13.44. It was noted that the pattern reported was inconsistent for the 1967-68 school year.
Instructional ServicesExpenditures for instructional services were classi
fied in terms of the following items: classroom teachers,other professionals, clerks and secretaries, textbooks, supplies and materials for teaching and other expenditures.
A review of data presented in Table 12 indicated that per-pupil expenditures for salaries of classroom teachers represented the highest cost item for instructional services. The amount reported for this item ranged from a

32minimum of $173,00 in 1961-62 to a maximum of $356.42 in1967-63, The amounts reported in 1963-69 and 1969-70 for this item were slightly below the 1967-63 figure. Variations in the training and experience of personnel probably accounted for this slight difference inasmuch as no major salary schedule increase was implemented during this period.
Expenditures for salaries of other professionals ranged from a high of $27.35 per-pupil in 1963-69 to a low of $13.04 per-pupil in 1961-62. The amount reported for salaries of clerks and secretaries serving in public schools increased steadily for the period of the study. The amount for this item increased from $6.07 per-pupil in 1961-62 to $10.51 in 1969-70. Comparable increases were noted in the three remaining items included in instructional services as follows: textbooks from $6.74per-pupil in 1961-62 to $10.25 per-pupil in 1969-70; supplies and materials for teaching from $2.37 per-pupil in 1961-62 to $12.50 per-pupil in 1969-70; and other expenditures from $6.73 per-pupil in 1961-62 to $20.17 per-pupil in 1969-70.
Over-all, expenditures for instructional services on a per-pupil basis increased from $213.50 in 1961-62 to $435.72 in 1967-63. The amounts reported for 1963-69 and 1969-70 were slightly less than the 1967-63 figure.

$3Operation of Plant
Expenditures for operation of the plant were classified in terms of three items: namely, custodialsalaries, all utilities, and other expenditures.
An analysis of data presented in Table 12 indicated that expenditures for the item concerned with salaries of custodial personnel was the largest reported for operation of plant. Expenditures on a per-pupil basis indicated for this item increased from a low of $19.42 in 1961-62 to a high of $33.09 in 1969-70. The increase was consistent and substantial for each year reported. Meanwhile, expenditures per-pupil for all utilities, while increasing each year, were not as sizeable as the increases reported on a per-pupil basis for custodial salaries. The per-pupil expenditure for all utilities ranged from a low of $4.99 in 1961-62 to a high of $7.46 in 1969-70. Expenditures for other items identified with operation of the plant likewise increased; however, the increase was not extensive.
The composite expenditure per-pupil for operation of the plant increased from $25.67 in 1961-62 to $44*96 per-pupil in 1969-70.
Maintenance of PlantExpenditures for maintenance of the plant were
grouped into three specific items. They were: salaries

35Auxiliary Services
Expenditures for auxiliary services have been classified in terras of three major items. These include transportation of students, school lunch including the national school milk program, and other expenditures.
The combined expenditure total for school lunch including the national school milk program was by far the largest expenditure item associated with auxiliary services provided by local school systems. Per-pupil expenditures for this item increased substantially from a low of $26.71 in 1961-62 to a high of $45.34 in 1969-70. Expenditures per-pupil for transportation, while increasing, have not multiplied at as great a rate as did school lunch including the national school milk program. Per-pupil expenditures for school transportation increased from $5.39 in 1961-62 to $6.41 in 1969-70. The school system included in ADMG-I has not operated an extensive school transportation program. Per-pupil expenditures for other items associated with auxiliary services were small and increased slightly in the period 1961-62 to 1969-70.
Over-all per-pupil expenditures for auxiliary services increased from $33.31 in 1961-62 to $53.21 in 1966-67. A decrease from this amount in 1966-67 was reported for 1967-68; however, by 1969-70 the per-pupil expenditure increased to $53.37.

86
Fixed ChargesExpenditures for fixed charges have been classi
fied into two items: namely, employee benefits and otherexpenditures.
The per-pupil expenditure for employee benefits was the largest item indicated in fixed charges. Per- pupil expenditures for this item increased from $20.02 in 1961-62 to $37.77 in 1969-70. Very slight increases were noted in terms of per-pupil expenditures for the remaining three years. Per-pupil expenditures for other expenditures identified with fixed charges increased from $3.13 in 1961-62 to $6.04 in 1969-70.
The composite per-pupil expenditure for fixed charges increased from $23.15 in 1961-62 to $43.31 in 1969-70.
Total Per-Pupil ExpendituresIn Table 12 composite per-pupil expenditures for
school systems reported in ADMG-I for the years 1961-62, 1966-67, 1967-68, 1968-69, and 1969-70 were reported. An analysis of these data revealed that the over-all per-pupil expenditures ranged from a minimum of $328.45 in 1961-62 to a maximum of $604.94 in 1967-68. However, it was noted that the over-all per-pupil expenditure figures for 1968-69 and 1969-70 were comparable to the 1967-68 figure in that the difference was not significant.

II. AVERAGE DAILY MEMBERSHIP GROUP II37
School systems with an average daily membership of 35f000 or more and less than 75,000 were included in ADMG-II. For two years of this study, 1961-62 and 1966-67, three school systems were included in this category, while four school systems were included in the remaining three years.
In Table 13 trends in expenditures per-pupil year for school systems included in ADMG-II for the years included in the study were presented. Tabulations were presented in terms of each major function in the Cost of Education Index.
General ControlExpenditures for general control were classified
in terms of three specific items. These items were: professional salaries, clerks and secretaries, and other expenditures.
An analysis of data indicated higher per-pupil expenditures for salaries of clerks and secretaries than for the two remaining items. All items indicated a consistent increase annually with one exception. A decrease was reported in other expenditures in 1969-70. Expenditures for this item decreased from $6.03 per-pupil in I96&-69 to $5.0$ per-pupil in 1969-70. The lowest amount for general

Table 13
Trends in Expenditures Per-Pupil Year in Average Daily Membership Group II
Index 1961-62 1966-67 1967-63 1963-69 1969-70
General Control(1) Professional Salaries(2) Clerks and Secretaries(3) Other Expenditures
TotalInstructional Services (1) Classroom Teachers (2J Other Professionals(3) Clerks & Secretaries(4) Textbooks(5) Supplies and Materials for Teaching(6) Other Expenditures
TotalOperation of Plant(1) Custodial Salaries(2) All Utilities(3) Other Expenditures
Total
2.351.413.32
$ 3.42 4.22 5.52
$ 3.35 4.365.79
$ 4-29 6.02 6.03$ 4.96
6.25 5.03
7.53 13.16 14.50 16.34 16.29
191.1613.103.796.572.974.31
273.0321.156.223.319.153.21
302.42 23.35 6.3 3 7.71 9.59 9.34
319.7323.606.763.5011.2311.63
333.5325.707.303.637.9415.10
227.40 331.07 353.79 331.55 393.70
10.706.321.16
14.337.431.71
16.379.112.14
17.3210.502.94
19.3611.322.93
13.63 23.97 27.62 30.76 33.61axax

Table 13 (continued)
Index 1961-62 1966-67 1967-68 1968-69 1969-70
Maintenance of Plant(1) Maintenance Salaries $ 5.19 $ 6.40 $ 7.80 $ 7.77 $ 8.41(2) Repair and Upkeep of Buildings &
Grounds and Repair and Replacementof Equipment 4.31 12.22 8.04 8.04 9.49
(3) Other Expenditures 0.17 0.10 0.17 0.19 0.12Total 9.67 18.72 16.01 16.00 18.02
Auxiliary Services(1) Transportation 16.12 22.29 21.81 22.70 24.30(2) School Lunch including National
School Milk Program 40.87 48.90 50.73 52.90 53.83(3) Other Expenditures 0.97 4.12 2.70 2.87 3.36
Total 57.96 75.31 75.24 78.47 81.49Fixed Charges(1) Employee Benefits 21.18 31.39 33.67 29.76 45.70(2) Other Expenditures 1.46 4.73 4.94 4.65 6.85
Total 22.64 36.12 38.61 34.41 52.55Grand Total $343.93 $498.35 $530.77 $557.53 $600.66
axvO

90control was $7*5& per-pupil reported in 1961-62, and the highest amount of $16.34 was reported in 1963-69. There was a slight decrease on a per-pupil basis for 1969-70, when an expenditure of $16.29 was reported.
Instructional ServicesExpenditures for instructional services were
classified according to the following items: classroomteachers, other professionals, clerks and secretaries, textbooks, supplies and materials for teaching, and other expenditures.
A review of data presented in Table 13 indicated that per-pupil expenditures for salaries of classroom teachers represented the highest cost item in instructional services. The amount reported for this item ranged from a minimum of $191.16 in 1961-62 to a maximum of $333.53 in 1969-70. There was a small consistent increase reported each year for the period from 1966-67 through 1969-70.
Expenditures for salaries of other professionals ranged from a low of $13.10 per-pupil in 1961-62 to a high of $25.70 per-pupil in 1969-70. The amount reported for salaries of clerks and secretaries serving in public schools increased steadily for the period of the study.The increase for this item ranged from $3.79 per-pupil in 1961-62 to $7.30 per-pupil in 1969-70. There was a

91comparable increase in per-pupil expenditures for textbooks in which cost figures ranged from a low of $6.57 in 1961-62 to a high of $3.63 in 1969-70. The reported expenditures for supplies and materials ranged from a minimum of $2.97 per-pupil in 1961-62 to a maximum of $11.23 per-pupil in 1963-69 and decreased to $7.94 per-pupil in 1969-70. Data reported for all expenditures indicated an increase from a low of $4.31 per-pupil in 1961-62 to a high of $15.10 per-pupil in 1969-70.
The total expenditures for instructional services on a per-pupil basis increased annually from $227.40 in 1961-62 to $393.70 in 1969-70.
Operation of PlantExpenditures for operation of the plant were
classified in terms of three items: namely, custodialsalaries, all utilities, and other expenditures.
An analysis of data presented in Table 13 indicated that the item concerned with expenditures for custodial salaries was the largest factor reported for operation of the plant. Expenditures on a per-pupil basis for this item ranged from a low of $10.70 in 1961-62 to a high of $19.36 in 1969-70. The expenditures for all utilities increased on a per-pupil basis from a low in 1961-62 of $6.32 to a high of $11.32 in 1969-70. A comparable increase was
92indicated for other expenditures which ranged from a low of $1.16 in 1961 to a high of $2.93 in 1969-70.
The composite expenditure per-pupil for operation of the plant increased consistently from $1#.6# in 1961-62 to $33.61 in 1969-70.
Maintenance of PlantExpenditures for maintenance of the plant were
grouped into three specific items. They were: salariesof maintenance personnel, repair and upkeep of buildings and grounds including the repair and replacement of equipment, and other expenditures.
An analysis of data indicated that the item including salaries of maintenance personnel was the most significant reported for maintenance of the plant. Per- pupil expenditures for this item increased from $5.19 in 1961-62 to $$.41 in 1969-70. The expenditure on a per-pupil basis for repair and upkeep of buildings and grounds including the repair and replacement of equipment was $4-31 in 1961-62, but this figure increased to $12.22 in 1966-67. This high cost for 1966-67 reflected losses to buildings and equipment during the hurricane season. The expenditure in 1967-6# was $#.04 per-pupil and increased to $9.49 per- pupil in 1969-70. Other expenditures on a per-pupil basis varied each year from a low of $0.10 in 1966-67 to a high

93of $0.19 in 1963-69. These expenditures per-pupil were so low, however, that the variations were insignificant.
The over-all per-pupil expenditures for maintenance of the plant increased from $9.67 in 1961-62 to $18.72 in 1966-67, due to the cost of repairing hurricane damage.From 1967-68 through the remainder of the period under study, the expenditures for this group stabilized between $16.00 and $18.02 per-pupil.
Auxiliary ServicesExpenditures for auxiliary services have been
classified in terms of three major items. These included transportation of students, school lunch and national school milk program, and other expenditures.
The combined total for school lunch including the national school milk program was by far the largest expenditure item associated with auxiliary services. Per-pupil expenditures for this item increased substantially from a low of $57.96 in 1961-62 to a high of $81.49 in 1969-70. Expenditures for transportation, while much lower on a per- pupil basis, increased from $16.12 in 1961-62 to $24.30 in 1969-70.
Over-all per-pupil expenditures for auxiliary services increased from $57.96 in 1961-62 to $81.49 in 1969-70. It was noted, however, that there was a small annual increase
94per-pupil for this group during the last four years of this study.
Fixed ChargesExpenditures for fixed charges have been classi
fied into two items: namely, employee benefits and otherexpenditures.
The largest item under fixed charges was employee benefits. Per-pupil expenditures for this item increased from $21.1$ in 1961-62 to $45*70 in 1969-70. Data reflected a decrease from $33.67 per-pupil in 1967-6$ to $29.76 per- pupil in 1969-70. There was a marked increase in 1969-70 to $45.70 per-pupil.
The composite per-pupil expenditure for fixed charges increased from $22.64 in 1961-62 to $52.55 in 1969-70.
Total Per-Pupil ExpendituresIn Table 13» composite per-pupil expenditures for
school systems included in ADMG-II for the years 1961-62,1966-67, 1967-6$, 196$-69, and 1969-70 were indicated. An analysis of these data revealed that the over-all expenditures per-pupil ranged from $343*93 in 1961-62 to $600.66 in 1969-70. It was noted that there was an increase in excess of $100.00 per-pupil during the last four years of

95the study. This over-all increase was the result of moderate but consistent annual increases in each classification included in the study.
III. AVERAGE DAILY MEMBERSHIP GROUP III
School systems with an average daily membership of 20,000 or more but less than 35,000 were included in ADMG III. The number of school systems in this category varied annually for the years included in this study. Two school systems constituted this group in 1961-62 and four systems were represented in 1966-67. In 1967-63, a decrease of one school system was noted. In 1963-69 four school systems are reported in this category. In 1969-70 the number of school systems remained at four.
In Table 14, trends per-pupil year for school systems included in ADMG III for the years included in this study were reported. Tabulations have been made in terms of each major function in the Cost of Education Index.
General ControlExpenditures for general control were classified
in three specific items. These items were: professionalsalaries, clerks and secretaries, and other expenditures.
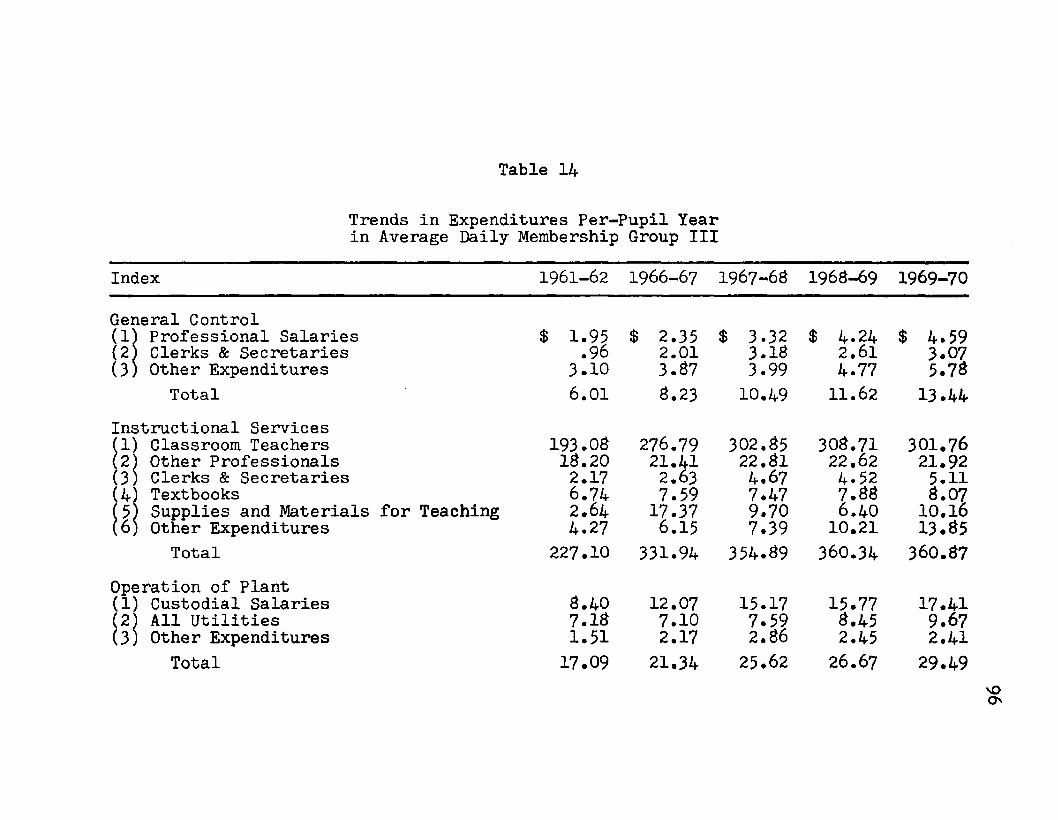
Table 14
Trends in Expenditures Per-Pupil Year in Average Daily Membership Group III
Index 1961-62 1966-67 1967-6S 196S-69 1969-70General Control(1) Professional Salaries(2) Clerks & Secretaries(3) Other Expenditures
$ 1.95 .96 3.10
$ 2.35 2.01 3.S7
$ 3.32 3.1S 3.99
$ 4.24 2.61 4.77
$ 4.59 3.07 5.78Total 6.01 S.23 10.49 11.62 13.44
Instructional Services(1) Classroom Teachers(2) Other Professionals(3) Clerks & Secretaries(4) Textbooks(5) Supplies and Materials for Teaching(6) Other Expenditures
193.0S IS.20 2.17 6.74 2.64 4.27
276.7921.412.637.5917.376.15
302.S5 22. Si 4.67 7.47 9.70 7.39
30S.71 22.62 4.52 7.8S6.4010.21
301.7621.925.11s .07 10.16 13.65
Total 227.10 331.94 354.S9 360.34 360.S7Operation of Plant(1) Custodial Salaries(2) All Utilities(3) Other Expenditures
S.40 7.1S 1.51
12.077.102.17
15.177.592.S615.775.452.45
17.419.672.41
Total 17.09 21.34 25.62 26.67 29.49

Table 14 (continued)
Index
Maintenance of Plant(1) Maintenance Salaries(2) Repair and Upkeep of Buildings &
Grounds and Repair and Replacement of Equipment
(3) Other ExpendituresTotal
Auxiliary Services(1) Transportation(2) School Lunch including National
School Milk Program(3) Other Expenditures
TotalFixed Charges(1) Employee Benefits(2) Other Expenditures
TotalGrand Total
1961-62 1966-67 1967-6S 196S-69 1969-70
$ 4.12 $ 3.S6 $ 1.99 $ 2.77 $ 3.Si
9.260.34
10.260.4S 10.6S
0.179.360.19
s.500.57
13.72 14.60 12. S4 12.32 12. SS
20. S3 27.95 36.54 36.25 34.4740.9S1.75
4S.764.4S4S.264.70 50.20
3.7160.403.57
63.56 SI. 19 S9.50 90.16 9S.44
21.644.55
31.303.52 31.235.13 32.756.6534.50 S.96
26.19 34. S2 36.36 39.40 43.46$353.67 $492.12 $529.70 $540.51 $55S.5S

98An analysis of data revealed that other expendi
tures on a per-pupil basis exceeded the expenditures for each of the remaining items. Expenditures for general control reported on a per-pupil basis ranged from a low of $6.01 in 1961-62 to a high of $13.44 in 1969-70. A consistent annual increase was indicated in expenditures for this classification.
Instructional ServicesExpenditures for instructional services were
classified in terms of the following items: classroomteachers, other professionals, clerks and secretaries, textbooks, supplies and materials for teaching, and other expenditures.
A review of data in Table 14 indicated that per-pupil expenditures for salaries of classroom teachers represented the highest cost item for instructional services. The amount per-pupil for this item ranged from a minimum of $193.08 in 1961-62 to a high of $308.71 in 1968-69, and decreased to $301.76 in 1969-70.
Expenditures for salaries of other professionals on a per-pupil basis ranged from a low of $18.20 in 1961-62 to a high of $22.81 in 1967-68. There were slight but insignificant decreases in this item for the remaining two years of the study. The amount reported for salaries of

99clerks and secretaries increased steadily, and ranged from a low of $2.17 per-pupil in 1961-62 to a high of $5.11 per-pupil in 1969-70. A consistent increase was indicated for textbooks, which increased from $6.74 in 1961-62 to $8.07 in 1969-70. Per-pupil expenditures for supplies and materials for teaching varied significantly each year of the study. Other expenditures on a per-pupil basis increased annually from $4.27 in 1961-62 to $13.85 in 1969-70.
The over-all expenditures for instructional services on a per-pupil basis increased from $227.10 in 1961-62 to $360.87 in 1969-70. It was noted that the costs for this classification were almost identical for the last two years covered by the study.
Operation of PlantExpenditures for operation of the plant were classi
fied in terms of three items: namely, custodial salaries,all utilities, and other expenditures.
An analysis of data presented in Table 14 indicated that the item concerned with expenditures for salaries of custodial personnel was the largest factor reported for operation of plant. Expenditures on a per-pupil basis for this item increased from $8.40 in 1961-62 to $17.41 in 1969-70. The increase was consistent and substantial each

100year except in 1963-69. Expenditures per-pupil for all utilities increased, but the increase was not as substantial. The per-pupil expenditures for this item were $7.13 in 1961-62, $7.10 in 1966-67, and $9.67 in 1969-70. On a per-pupil basis, other expenditures increased from $1.51 in 1961-62 to $2.36 in 1967-63, and decreased to $2.41 in 1969-70. These variations were not extensive.
The composite expenditure per-pupil for operation of the plant increased from $17.09 in 1961-62 to $29.49 in 1969-70.
Maintenance of PlantExpenditures for maintenance of the plant were
grouped into three specific items. They were: salariesof maintenance personnel, repair and upkeep of buildings and grounds including the repair and replacement of equipment, and other expenditures.
An analysis of data indicated that the item which covered the repair and upkeep of buildings and grounds including the repair and replacement of equipment was the most significant item reported under maintenance of the plant for Group III. The per-pupil expenditures for this item increased from $9.26 in 1961-62 to $10.63 in 1967-63, and then decreased to $3.50 in 1969-70. The variation from year to year was not extensive. Per-pupil expenditures for custodial salaries indicated a reverse trend, decreasing
101from $4.12 in 1961-62 to $1.99 in 1967-68, and increasing to $3*81 in 1969-70. Other expenditures on a per-pupil basis varied each year, and ranged from a low of $0.17 in1967-68 to a high of $0.57 in 1969-70. These amounts were small and the variations were insignificant.
The over-all per-pupil expenditures for this classification increased from $13.72 in 1961-62 to $14.60 in 1966-67, and then stabilized between $12.32 and $12.88 for the remaining three years covered by the study.
Auxiliary ServicesExpenditures for auxiliary services have been
classified in terms of three major items. These items were: transportation of students, school lunch includingthe national school milk program, and other expenditures.
The combined total for the school lunch including the national school milk program was by far the largest expenditure item associated with auxiliary services provided by local school systems. Per-pupil expenditures for this item increased substantially from a low of $40.98 in 1961-62 to a high of $60.40 in 1969-70. Expenditures per- pupil for transportation increased from $20.83 in 1961-62 to $36.25 in 1967-68, and decreased slightly to $34.47 in 1969-70. Other expenditures remained small in this classification on a per-pupil basis, having increased from $1.75

102in 1961-62 to $4.70 in 1967-68, and having decreased to $3.57 in 1969-70.
The over-all per-pupil expenditures for auxiliary services increased consistently and substantially, ranging from a low of $63.56 in 1961-62 to a high of $98.44 in 1969-70.
Fixed ChargesExpenditures for fixed charges have been classified
into two items: namely, employee benefits and other expenditures.
The per-pupil expenditure for employee benefits was the largest item indicated in fixed charges. This item increased from $21.64 per-pupil in 1961-62 to $34.50 per-pupil in 1969-70, with slight variations for the last four years of the study. Other expenditures on a per-pupil basis in this classification decreased from $4.55 in 1961-62 to $3.52 in 1966-67, and increased each year to $8.96 in 1969-70.
The composite per-pupil expenditure for fixed charges increased from $26.19 in 1961-62 to $43*46 in 1969-70.
Total Per-Pupil ExpendituresIn Table 14, the composite per-pupil expenditures
for school systems reported in ADMG III for the years

1031961-62, 1966-67, 1967-63, 1963-69, and 1969-70 were reported. An analysis of these data revealed that the over-all per-pupil expenditure ranged from a minimum of $353.67 in 1961-62 to a maximum of $553.53 in 1969-70.It was noted that a moderate, consistent increase was maintained throughout the period covered by the study.
IV. AVERAGE DAILY MEMBERSHIP GROUP IV
School systems with an average daily membership of 10,000 or more but less than 20,000 are included in ADMG-IV. In 1961-62 ten school systems were reported in this category. For the remaining four years of this study, twelve systems were indicated in this category except in 1963-69 when the number dropped to eleven.
In Table 15» trends per-pupil year for school systems included in ADMG-IV for the years included in this study were revealed. Tabulations were indicated in terms of each major function in the Cost of Education Index.
General ControlExpenditures for general control are classified in
terms of three specific items. These items are: professionalsalaries, clerks and secretaries, and other expenditures.
An analysis of data indicated other expenditures under general control were greater than the two remaining items,

Table 15
Trends in Expenditures Per-Pupil Year in Average Daily Membership Group IV
Index 1961-62 1966-67 1967-68 1968-69 1969-70
General Control(1) Professional Salaries(2) Clerks & Secretaries(3) Other Expenditures
$ 2.29 1.42 3.37
$ 3.59 2.05 5.24
$ 4.33 2.45 5.72
$ 4.38 2.72 6.47
$ 5.15 3.71 8.69
Total 7.08 10.88 12.50 13.57 17.55Instructional Services(1) Classroom Teachers(2) Other Professionals(3) Clerks & Secretaries(4) Textbooks(5) Supplies and Materials for Teaching(6) Other Expenditures
192.3319.471.236.712.484.85
263.71 23.93 2.61 7.46 IO.46 5.31
287.5325.913.237.14
12.357.35
301.4726.673.377.72
15.9510.27
322.5626.984.338.0610.7315.65
Total 227.07 313.98 343.51 365.45 388.31Operation of Plant(1) Custodial Salaries(2) All Utilities(3) Other Expenditures
8.605.231.40
12.067.572.04
13.948.992.43
14.139.462.6015.8910.083.04
Total 15.23 21.67 25.36 26.19 29.01

Table 15 (continued)
Index 1961-62 1966-67 1967-68 1968-69 1969-70
Maintenance of Plant(1) Maintenance Salaries(2) Repair and Upkeep of Buildings &
Grounds and Repair and Replacement$ 2.47 $ 4.32 $ 4.79 $ 5.01 $ 5.13
of Equipment 5.16 7.66 7.71 9.29 11.39(3) Other Expenditures 0.08 0.13 0.11 0.24 0.55Total 7.71 12.11 12.61 14.54 17.07
Auxiliary Services(1) Transportation(2) School Lunch including National 28.75 34.09 35.93 37.22 41.64
School Milk Program 36.41 45.96 49.29 49.92 50.00(3) Other Expenditures 0.95 4.47 2.99 2.90 2.47
Total 66.11 84.52 88.21 90.04 94.11Fixed Charges(1) Employee Benefits 21.59 28.86 28.20 30.95 35.68(2) Other Expenditures 3.36 5.66 6.38 6.90 6.46
Total 24.95 34.52 34.56 37.65 42.14Grand Total $348.15 $477.68 $516.77 $547.64 $588.19

106with each item indicating a consistent annual increase. Per-pupil expenditures for general control ranged from a low of $7.06 in 1961-62 to a high of $17*55 in 1969-70.
Instructional ServicesExpenditures for instructional services are classi
fied in terms of the following items: classroom teachers,other professionals, clerks and secretaries, textbooks, supplies and materials for teaching, and other expenditures.
A review of data presented in Table 15 indicated that per-pupil expenditures for salaries of classroom teachers represented the highest cost item for instructional services. The amounts reported for this item ranged from a minimum of $192.33 in 1961-62 to a maximum of $322.56 in 1969-70, with a consistent increase each year.
Expenditures for salaries of other professionals on a per-pupil basis ranged from a low of $19.47 in 1961-62 to a high of $26.96 in 1969-70. The per-pupil amount reported for clerks and secretaries increased each year, and ranged from $1.23 in 1961-62 to $4.33 in 1969-70. Data indicated a smaller increase per-pupil for textbooks, having increased from $6.71 in 1961-62 to $6.06 in 1969-70. Per-pupil expenditures for supplies and materials for teaching fluctuated, having increased from $2.46 in 1961-62 to $15.95 in 1966-69, and having decreased to $10.73 in

1071969-70. Other expenditures on a per-pupil basis indicated a high rate of increase, from $4.85 in 1961-62 to $15.65 in 1969-70.
The over-all expenditures for instructional services on a per-pupil basis increased consistently, rising from $227.07 in 1961-62 to $383.31 in 1969-70.
Operation of PlantExpenditures for operation of the plant were
classified in terms of three items: namely, custodialsalaries, all utilities, and other expenditures.
An analysis of data presented in Table 15 indicated that expenditures for salaries of custodial personnel constituted the largest item reported for operation of the plant. Expenditures on a per-pupil basis for this item indicated a low of $8.60 in 1961-62 and increased to a high of $15.89 in 1969-70. Data reported for the other two items in this classification also revealed a consistent increase on a per-pupil basis. Expenditures for all utilities increased from a low of $5.23 in 1961-62 to a high of $10.08 in 1969-70, while other expenditures increased from $1.40 in 1961-62 to $3.04 in 1969-70. It should be noted that per-pupil expenditures for this last item were not extensive.

108The composite expenditure per-pupil for operation
of the plant increased from $15.23 in 1961-62 to $29.01 in 1969-70.
Maintenance of PlantExpenditures for maintenance of the plant were
grouped into three specific items. They were: salariesof maintenance personnel, repair and upkeep of buildings and grounds including the repair and replacement of equipment, and other expenditures.
An analysis of data indicated that the most significant item reported for this classification was repair and upkeep of buildings and grounds including the repair and replacement of equipment. The per-pupil expenditures for this item more than doubled during the period of the study, having increased from $5.16 in 1961-62 to $11.39 in 1969-70. Per-pupil expenditures for maintenance salaries increased consistently, from a low of $2.47 in 1961-62 to a high of $5.13 in 1969-70. The remaining item, other expenditures, indicated an increase from $0.08 in 1961-62 to $0.55 in 1969-70 on a per-pupil basis.
The over-all per-pupil expenditures for maintenance of plant increased from $7*71 in 1961-62 to $17.07 in 1969-70, indicating a consistent rise during the last three years of the study.

109Auxiliary Services
Expenditures for auxiliary services have been classified in terms of three major items. These include transportation of students, school lunch including the national school milk program, and other expenditures.
The combined school lunch and national school milk program figure was the largest expenditure item associated with auxiliary services. Per-pupil expenditures for this item increased from $36.41 in 1961-62 to $50.00 in 1969-70. It was noted, however, that the variation for the last three years of the study was less than $1.00 per-pupil. Expenditures on a per-pupil basis for transportation increased from a low $26.75 in 1961-62 to a high of $41.64 in 1969-70, with the increase during the last four years being moderate but consistent. Other expenditures per-pupil increased from $0.95 in 1961-62 to $2.47 in 1969-70.
Over-all per-pupil expenditures for auxiliary services indicated a gradual, consistent increase from $66.11 in 1961-62 to $94.11 in 1969-70.
Fixed ChargesExpenditures for fixed charges have been classified
into two items: namely, employee benefits and other expenditures.

110The largest expenditure by far reported in this
classification was employee benefits. The per-pupil expenditure ranged from $21.59 in 1961-62 to $35.63 in 1969-70. The reported amount for 1966-67 was slightly higher than the succeeding year, but the difference was not significant. Other expenditures on a per-pupil basis increased from $3.36 in 1961-62 to $6.90 in 1963-69, and decreased to $6.46 for the last year of the study.
The composite per-pupil expenditure for fixed charges ranged from a low of $24.95 in 1961-62 to a high of $42.14 in 1969-70.
Total Per-Pupil ExpendituresIn Table 15, the composite per-pupil expenditures
for school systems reported in ADMG-IV for the years 1961-62, 1966-67, 1967-63, 1963-69, and 1969-70 were reflected. An analysis of these data revealed that the over-all per-pupil expenditure in this group rose from a low of $34#.15 in 1961-62 to a high of $533.19 in 1969-70, indicating a substantial and consistent increase during each year of the study.
V. AVERAGE DAILY MEMBERSHIP GROUP V
School systems with an average daily membership of 5,000 or more but less than 10,000 were included in ADMG-V.

IllThere were more school systems in this group than any other group of this study. A total of twenty-seven (27) school systems was reported in this category in 1961-62.In 1966-67 and 1969-70 there were twenty-four (24) systems in ADMG-V, and in 1967-6# there were twenty-five (25). In1968-69 the total number of systems in this category was twenty-six (26).
In Table 16, trends per-pupil year for school systems included in ADMG-V for the years included in this study were presented. Tabulations were made in terms of each major function in the Cost of Education Index.
General ControlExpenditures for general control were classified
in terms of three specific items. These items are: professional salaries, clerks and secretaries, and other expenditures.
An analysis of data again indicated that the item identified as other expenditures under general control was greater than either of the two remaining items, with each item showing a consistent annual increase. Composite per-pupil expenditures for general control increased from $8.67 in 1961-62 to $19.05 in 1969-70.

Table 16
Trends in Expenditures Per-Pupil Year in Average Daily Membership Group V
Index
General Control(1) Professional Salaries2) Clerks & Secretaries3) Other Expenditures
TotalInstructional Services(1) Classroom Teachers(2) Other Professionals(3) Clerks & Secretaries(4) Textbooks(5) Supplies and Materials for Teaching(6) Other Expenditures
TotalOperation of Plant(1) Custodial Salaries(2) All Utilities(3) Other Expenditures
Total
1961-62 1966-67 1967-68 1968-69 1969-70
$ 3.06 $ 4.01 $ 5.36 $ 6.22 $ 7.011.554.06
2.216.35
2.396.812.927.87
3.408.64
8.67 12.57 14.56 17.01 19.05
199.8221.880.866.671.984.65
276.9626.642.187.159.965.46
306.4227.832.366.92
12.536.21
314.5028.942.837.6315.559.09
335.1430.533.357.88
15.4114.65
235.86 328.35 362.27 378.54 406.96
8.975.911.73
11.537.512.56
12.848.322.84
13.469.093.86
16.0010.144.34
16.61 21.60 24.00 26.41 30.48

Table 16 (continued)
Index 1961-62 1966-67 1967-63 1963-69 1969-70
Maintenance of Plant(1} Maintenance Salaries (2) Repair and Upkeep of Buildings &
Grounds and Repair and Replacement$ 1.92 $ 2.19 $ 2.43 $ 2.65 $ 3.34
of Equipment 6.94 12.42 12.43 12.51 14.29(3) Other Expenditures 0.04 0.25 0.32 0.92 0.73Total S.90 14.36 15.23 16.03 13.41
Auxiliary Services(1) Transportation(2) School Lunch including National
36.42 47.02 49.33 51.33 54.77School Milk Program 34.#7 43.71 45.27 50.03 53.96
(3) Other Expenditures 1.40 3.29 2.30 4.73 3.45Total 72.69 94.02 97.45 106.19 112.13
Fixed Charges(1) Employee Benefits 22.13 29.24 30.23 29.96 40.56(2) Other Expenditures 3.49 5.27 6.21 6.30 6.46
Total 25.62 34.51 36.44 36.76 47.02Grand Total $363.35 $505.91 $550.00 $530.99 $634.10

Instructional ServicesExpenditures for instructional services were
classified in terms of the following items: classroomteachers, other professionals, clerks and secretaries, textbooks, supplies and materials for teaching, and other expenditures.
An analysis of data presented in Table 16 indicated that per-pupil expenditures for salaries of classroom teachers represented by far the highest cost item for instructional services. The amount reported for this item ranged from a low of $199.32 in 1961-62 to a high of $335.14 in 1969-70. It was noted that the increase each year was substantial and consistent.
Expenditures per-pupil for salaries of other professionals increased from $21.33 in 1961-62 to $30.53 in 1969-70. Data reported for all other items in this classification indicated a small but consistent increase during each year covered by the study, with two minor exceptions. The per-pupil expenditure for textbooks was slightly higher in 1966-67 than during the succeeding year, and the amount reported for supplies and materials for teaching indicated a slight decrease in the last year of the study. It was noted, however, that these variations were not significant.

115The composite expenditures for instructional
services on a per-pupil basis increased moderately and consistently during each year covered by the study, ranging from a low of $235.36 in 1961-62 to a high of $406.96 in 1969-70.
Operation of PlantExpenditures for operation of the plant were
classified in terms of three items: namely, custodialsalaries, all utilities, and other expenditures.
An analysis of data presented in Table 16 indicated that salaries of custodial personnel constituted the largest item reported in this classification, and ranged, on a per-pupil basis, from a minimum of $8.97 in 1961-62 to a maximum of $16.00 in 1969-70. Data for all other items under operation of the plant indicated a small but consistent increase annually.
The composite expenditure per-pupil for operation of the plant increased from a low of $l6.6l in 1961-62 to a high of $30.48 in 1969-70.
Maintenance of PlantExpenditures for maintenance of the plant were
grouped into three specific items. They were: salariesof maintenance personnel, repair and upkeep of buildings

116and grounds including the repair and replacement of equipment, and other expenditures.
An analysis of data indicated that the most significant item reported in this classification was repair and upkeep of buildings and grounds including the repair and replacement of equipment. Per-pupil expenditures for this item ranged from $6.94 in 1961-62 to $14.29 in 1969-70 which indicated that the cost became stable during the last four years of the study. The annual variation was insignificant. Per-pupil expenditures for maintenance salaries ranged from a minimum of $1.92 in 1961-62 to a maximum of $3.34 in 1969-70. Other expenditures on a per-pupil basis were negligible, gradually increasing from a low of $0.04 in 1961-62 to a high of $0.78 in 1969-70.
The over-all expenditures per-pupil for maintenance of the plant rose from $8.90 in 1961-62 to $18.41 in 1969-70. Data for the last four years of the study indicated that costs for this classification stabilized between $14.50 and $18.50 per-pupil.
Auxiliary ServicesExpenditures for auxiliary services have been
classified in terms of three major items. These include transportation of students, school lunch including the national school milk program, and other expenditures.

117Data reported for this classification indicated
that the highest per-pupil expenditure was reported for transportation, which was different from the previous groups studied. The costs for this item ranged from a minimum of $36.42 in 1961-62 to a maximum of $54.77 in 1969-70. Expenditures per-pupil for the combined school lunch and the national school milk program were slightly lower but indicated a comparable increase, rising from $34.87 in 1961-62 to $53.96 in 1969-70. Data reported for other expenditures on a per-pupil basis revealed a variation each year, increasing from a low of $1.40 in 1961-62 to a high of $4.78 in 1963-69. A decrease from the previous year was indicated in 1967-68 and again in 1969-70, but the amount of the decrease was not significant.
The over-all per-pupil expenditures for auxiliary services increased from $72.69 in 1961-62 to a high of $112.18 in 1969-70. A moderate, consistent increase was noted for each year of the study.
Fixed ChargesExpenditures for fixed charges have been classified
into two items: namely, employee benefits and other expenditures.
The per-pupil expenditure for employee benefits was by far the largest item reported in this classification,

113and ranged from a low of $22.13 in 1961-62 to $40.56 in 1969-70. It was noted that a slight decrease of $0.27 per-pupil was indicated for 1963-69, but this amount was not significant. Other expenditures per-pupil increased from $3.49 in 1961-62 to $6.30 in 1969-70, and decreased slightly to $6.46 in 1969-70.
The composite per-pupil expenditures for fixed charges increased from a minimum of $25.62 in 1961-62 to a maximum of $47.02 in 1969-70.
Total Per-Pupil ExpendituresIn Table 16 the composite per-pupil expenditures
for school systems reported in ADMG-V for the years 1961-62, 1966-67, 1967-63, 1963-69, and 1969-70 were indicated. An analysis of these data revealed that the over-all expenditure per-pupil for this group increased substantially and consistently, ranging from a low of $363.35 in 1961-62 to a high of $634.10 in 1969-70.
VI. AVERAGE DAILY MEMBERSHIP GROUP VI
School systems with an average daily membership of less than 5,000 are included in this category. The number of systems in ADMG-VI varied from a high of twenty-four (24) in 1961-62 to a low of twenty (20) in 1963-69. In1966-67 a total of twenty-three (23) school systems was

119included, while in 1967-66 a total of twenty-one (21) school systems was indicated. In 1969-70 twenty-two (22) systems were reported.
In Table 17, trends per-pupil year for school systems in ADMG-VI for the years included in this study were revealed. Tabulations have been made in terms of each major function included in the Cost of Education Index.
General ControlExpenditures for general control were classified
in terms of three specific items. These items were: professional salaries, clerks and secretaries, and other expenditures.
An analysis of data reported indicated that two items in this classification experienced almost identical expenditures and rates of increase. Per-pupil expenditures for professional salaries ranged from $4.69 in 1961-62 to $11.63 in 1969-70, while other expenditures increased from $5.36 in 1961-62 to $11.99 in 1969-70. The expenditures per-pupil for clerks and secretaries were small in comparison to the other items, rising from a low of $1.43 in 1961-62 to a high of $3.24 in 1969-70.
The composite per-pupil expenditures for general control ranged from a minimum of $11.46 in 1961-62 to a high of $27.06 in 1969-70. It was noted that the increase

Table 17
Trends in Expenditures Per-Pupil Year in Average Daily Membership Group VI
Index 1961-62 1966-67 1967-63 196$-69 1969-70
General Control(1) Professional Salaries(2) Clerks & Secretaries(3) Other Expenditures
$ 4.69 1.43 5.36
$ 6.62 2.07 7.62
$ $.54 2.22 $.59
$ 9.74 2.51 9.2$
$ 11.$3 3.24 11.99
Total 11.4S 16.31 19.35 21.53 27.06Instructional Services(1) Classroom Teachers(2) Other Professionals(3) Clerks & Secretaries(4) Textbooks(5) Supplies and Materials for Teaching(6) Other Expenditures
210.30 25.93 0.34 6. $41.535.45
27S.79 30.62 1.41 7.31 12.00 5.34
300.95 33.04 1.70 6.$7 9. S3 $.51
310.2734.65l.$67.23
10.0311.06
327.12 36.67 2.37 $.13 7.$3 15.62
Total 250.39 335.47 360.90 375.10 397.74Operation of Plant (1) Custodial Salaries (2} All Utilities (3J Other Expenditures
S.96 6.30 1.4S
12.94 S.57 2.46
13.459.642.93
14.249.663.51
13.9711.444.07
Total 16.74 23.97 26.02 27.41 29.4$

Table 17 (continued)
Index 1961-62 1966-67 1967-68 1968-69 1969-70
Maintenance of Plant(1) Maintenance Salaries $ 1.74 $ 2.06 $ 2.38 $ 2.55 $ 3.07(2) Repair and Upkeep of Buildings &
Grounds and Repair and Replacementof Equipment 7.14 9.99 10.10 9.75 8.55(3) Other Expenditures .03 .04 .05 .19 .58
Total S.91 12.09 12.53 12.49 12.20Auxiliary Services(1) Transportation 46.13 57.96 61.54 66.1$ 73.53(2) School Lunch including National
School Milk Program 34.58 43.74 44.73 49.17 53.93(3) Other Expenditures 1.50 3.53 3.62 3.94 3.38Total $2.21 105.23 109.89 119.29 130.84
Fixed Charges(1) Employee Benefits 23.97 30.71 31.46 34.17 35.73(2) Other Expenditures 3.39 10.66 10.71 6.77 8.53
Total 27.36 41.37 42.17 40.94 44.26Grand Total $397.09 $534.44 $570.86 $596.76 $641.58

122in the composite costs, as well as the costs for each item in the classification, was small but consistent for each year covered by the study.
Instructional ServicesExpenses for instructional services were classified
in terms of the following items: classroom teachers, otherprofessionals, clerks and secretaries, textbooks, supplies and materials for teaching, and other expenditures.
A review of data presented in Table 17 indicated that per-pupil expenditures were higher for salaries of classroom teachers than any other item under instructional services. The amount reported for this item increased from a low of $210.30 in 1961-62 to a high of $327.12 in 1969-70. The variation each year was moderate and consistent.
Expenditures for salaries of other professionals ranged from a low of $25.93 per-pupil in 1961-62 to a high of $36.67 per-pupil in 1969-70. Salaries of clerks and secretaries on a per-pupil basis increased from $0.34 in 1961-62 to $2.37 in 1969-70. The amount reported for textbooks ranged from $6.34 per-pupil in 1961-62 to $3.13 per-pupil in 1969-70. A small decrease was noted for this item in 1967-63, but the amount was not significant.
Per-pupil expenditures for supplies and materials for teaching indicate a rather wide variation for each year

123covered by the study, rising from a minimum of $1.53 in 1961-62 to a maximum of $12.00 in 1967-6$, and decreasing again to $7.$3 in^1969-70. Other expenditures on a per- pupil basis increased progressively from a low of $5.45 in 1961-62 to a high of $15.62 in 1969-70.
The over-all per-pupil expenditures for instructional services indicated a sizeable, consistent increase each year, and amounts ranged from a low of $250.39 in 1961-62 to a high of $397.74 in 1969-70.
Operation of PlantExpenditures for operation of the plant were
classified in terms of three items: namely, custodialsalaries, all utilities, and other expenditures.
An analysis of data presented in Table 17 indicated that expenditures for custodial salaries constituted the largest item reported for operation of the plant. Per-pupil expenditures for these salaries increased from a minimum of $$.96 in 1961-62 to a high of $14.24 in 1963-69, then decreased to $13.97 in 1969-70. This decrease in the final year of the study was not significant. Expenditures per- pupil for the two remaining items in this classification increased slightly but consistently during each year as follows: all utilities ranged from a low of $6.30 in1961—62 to a high of $11.44 in 1969—70, and other expenditures increased from $1.4$ in 1961-62 to $4.07 in 1969-70.

124The composite expenditures per-pupil for operation
of the plant indicated a small but consistent increase, ranging from $16.74 in 1961-62 to $29.4# in 1969-70.
Maintenance of PlantExpenditures for maintenance of the plant were
grouped into three specific items. They were: salariesof maintenance personnel, repair and upkeep of buildings and grounds including the repair and replacement of equipment, and other expenditures.
An analysis of data indicated that the most significant item in this classification was repair and upkeep of buildings and grounds including the repair and replacement of equipment. Per-pupil expenditures for this item increased from $7.14 in 1961-62 to $10.10 in 1967-63, anddecreased to $3.55 in 1969-70. It was noted that thisannual variation was not significant. Small but consistent increases on a per-pupil basis were indicated for the other two items in this classification, and maintenance salaries ranged from $1.74 in 1961-62 to $3.07 in 1969-70, and other expenditures rose from $0.03 in 1961-62 to $0.5$ in 1969-70.
The over-all per-pupil expenditures for maintenance of the plant increased from $3.91 in 1961-62 to $12.53 in1967-63, and decreased slightly to $12.20 in 1969-70. Itwas noted, however, that the variation during each of the
last four years covered by the study was less than $0.50 per-pupil.
Auxiliary ServicesExpenditures for auxiliary services have been
classified in terms of three major items. These include transportation of students, school lunch including the national school milk program, and other expenditures.
Data reported for this classification indicated that the highest per-pupil expenditure was for transportation of students, ranging from a minimum of $46.13 in 1961-62 to a maximum of $73.53 in 1969-70. A comparable increase was indicated for the school lunch program including the national school milk program, rising from $34.5# in 1961-62 to $53*93 in 1969-70. Other expenditures on a per-pupil basis increased from $1.50 in 1961-62 to $3.94 in 1968-69, and decreased slightly to $3*33 in 1969-70.
Over-all per-pupil expenditures for auxiliary services increased from $82.21 in 1961-62 to $130.84 in 1969-70, which represented a moderate, consistent increase annually.

126Fixed Charges
Expenditures for fixed charges have been classified into two items: namely, employee benefits and otherexpenditures.
Per-pupil expenditure for employee benefits was the largest item included in fixed charges. Data revealed a very small annual increase for these benefits, as expenditures ranged from $23.97 in 1961-62 to $35.73 in 1969-70. A marked variation was indicated for other expenditures. On a per-pupil basis, these expenditures increased from $3.39 in 1961-62 to $10.71 in 1967-6$, decreased to $6.77 in 196$-69, and increased to $$.53 in1969-70.
The composite expenditures on a per-pupil basis for fixed charges increased slightly each year, and ranged from a low of $27.36 in 1961-62 to a high of $44.26 in 1969-70.
Total Per-Pupil ExpendituresIn Table 17, the composite per-pupil expenditures
for school systems reported in ADMG-VI for the years 1961-62, 1966-67, 1967-6$, 196$-69, and 1969-70 were indicated. An analysis of these data revealed a substantial and consistent increase during each year covered by the study, and ranged from a minimum of $397.09 in 1961-62 to $641.5$ in 1969-70.

VII. SUMMARY127
In Tables 12 - 17, tabulations have been made in terms of each specific average daily membership group for the years included in the study. Specifically, trends in expenditures per-pupil year in each average daily membership group have been computed for the following years: 1961-62, 1966-67, 1967-68, 1968-69, and 1969-70.
Data have been computed and trends noted for each of the twenty (20) items presented under the six (6) major functions associated with expenditures for current operation.
A detailed analysis of each table was presented in Chapter IV.

CHAPTER V
COMPARISON OF PER-PUPIL EXPENDITURES FOR VARYING SIZES OF SCHOOL SYSTEMS FOR THE YEARS 1961-62, 1966-67, and 1969-70
Another significant comparison, which this study has defined as a basic purpose, was concerned with per- pupil expenditures for varying sizes of school systems in Louisiana, In Tables 1$ to 20 tabulations have been determined in order to permit the necessary comparisons for the years 1961-62, 1966-67, and 1969-70, An analysis of data was made in terms of each of these years,
I. 1961-62 SCHOOL YEAR
In Table 16, are data concerned with a distribution of per-pupil expenditures in terms of varying sizes of school systems in Louisiana in 1961-62,
General ControlThree specific expenditure items are associated
with the function of general control. These items were professional salaries, salaries of clerks and secretaries, and other expenditures. The per-pupil expenditures for professional salaries ranged from a minimum of $1,95 for
126

Table 16
Distribution of Expenditures Per-Pupil Yearin Terms of Varying Sizes of School Systems
in 1961-62
Index Average Daily Membership Groups1 2 3 4 5 6 Total
General Control(1) Professional Salaries $ 2.37 $ 2.35 $ 1.95 $ 2.29 $ 3.06 $ 4.69 $ 2.61(2; Clerks and Secretaries 5.37 1.41 .96 1.42 1.55 1.43 1.94(3) Other Expenditures 1.62 3.62 3.10 3.37 4.06 5.36 3.65
Total 9.36 7.56 6.01 7.06 6.67 11.46 6.40Instructional Services(1) Classroom Teachers 176.00 191.16 193.06 192.33 199.62 210.30 194.64(2} Other Professionals 16.04 16.10 16.20 19.47 21.66 25.93 20.42(3) Clerks and Secretaries 6.07 3.79 2.17 1.23 .66 .34 2.21(4) Textbooks 6.74 6.57 6.74 6.71 6.67 6.64 6.69(5) Supplies and Materials
for Teaching 2.67 2.97 2.64 2.46 1.96 1.53 2.36(6) Other Expenditures 6.7 6 4.61 4.27 4.65 4.65 5.45 5.06
Total 216.50 227.40 227.10 227.07 235.66 250.39 231.42Operation of Plant(1) Custodial Salaries 19.42 10.70 6.40 6.60 6.97 6.96 10.56(2) All Utilities 4.99 6.62 7.16 5.23 5.91 6.30 5.97(3) Other Expenditures 1.26 1.16 1.51 1.40 1.73 1.46 1.44
Total 25.67 16.66 17.09 15.23 16.61 16.74 17.97

Table 13 (continued)
Index Average Daily Membership Groups 2 3 4 5 6 Total
Maintenance of Plant(1) Maintenance Salaries(2) Repair and Upkeep of
Buildings & Grounds and Repair and Replacement of Equipment Other Expenditures(3)
TotalAuxiliary Services(1) Transportation(2) School Lunch & National
School Milk Program(3) Other Expenditures
TotalFixed Charges(1) Employee Benefits(2) Other Expenditures
TotalGrand Total
$ 12.41 $ 5.19 $ 4.12 $ 2.47 $ 1.92 $ 1.74 $ 4.17
5.55.00 4.31.17
9.26.34
5.16.03 6.94
.047.14.03
6.03.09
17.96 9.67 13.72 7.71 3.90 3.91 10.34
5.39 16.12 20.33 23.75 36.42 46.13 27.0126.711.71
40.37.97
40.931.75
36.41.95
34.371.40
34.531.50
35.671.31
33.31 57.96 63.56 66.11 72.69 32.21 63.99
20.023.13
21.131.46
21.644.55
21.593.36
22.133.49
23.973.39
21.763.03
23.15 22.64 26.19 24.95 25.62 27.36 24.34$323.45 $343.93 $353.67 $343.15 $363.35 $397.09 $356.96

131school systems in ADMG-III (20,000 - 34,999) to a maximum of $4*69 in ADMG-VI (less than 5,000). The average for the six average daily membership groups was $2.£l. Per- pupil expenditures for salaries of clerks and secretaries ranged from a high of $5.34 in ADMG-I (75,000 or more) to a low of .96 in ADMG-III (20,000 - 34,999). The composite for the six classifications of school systems was $1.94.The third item, other expenditures for general control on a per-pupil basis, was lowest in ADMG-1 (75,000 or more) while this item was highest in ADMG-VI (less than 5,000). This item appeared to increase as the size of the school system decreased. An exception to this observation was noted in ADMG-III (20,000 - 34,999).
When all items concerned with general control were combined, the total per-pupil expenditures ranged from a low of $6.01 in ADMG-III (20,000 - 34,999) to a high of $11.4# in ADMG-VI (less than 5,000). Based upon these analyses, it appears that the optimum size for school systems in Louisiana in terms of per-pupil expenditures for general control is ADMG-III (20,000 - 34,999 students in average daily membership).
Instructional ServicesInstructional services consisted of such expenditure
items as salaries of classroom teachers, salaries of other

132professionals, salaries of clerks and secretaries serving in schools, textbooks, supplies and materials for teaching, and other expenditures. The most significant item in this category is concerned with salaries of classroom teachers. The State figure for this item was $194*64 while the smallest amount of $178.00 was indicated on ADMG-I (75,000 or more). The largest per-pupil expenditure for salaries of classroom teachers was determined to be in ADMG-VI (less than 5,000) where $210.30 was reported. Supplies and materials for teaching accounted for the least amount of funds expended on a per-pupil basis. The larger systems, notably ADMG-I (75,000 or more) and ADMG-II (35,000 - 74,999), spent more on a per-pupil basis for this item than did the smaller average daily membership groups included in the study. Approximately $3.00 was expended on a per-pupil basis for this category in the larger systems while the smaller systems expended approximately one-half of that amount.
Per-pupil expenditures for salaries of other professionals increased considerably as the size of the school system decreased. The amounts expended ranged from a minimum of $18.04 per-pupil in ADMG-I (75,000 or more) to a maximum of $25.93 per-pupil in ADMG-VI (less than 5,000).

133Another significant item, salaries of clerks and
secretaries serving in schools, ranged from a high of $6.07 on a per-pupil basis in ADMG-I (75>000 or more) to a low of $0.34 per-pupil in ADMG-VI (less than 5>000).The amounts expended for textbooks on a per-pupil basis were consistent, ranging from $6.67 to $6.87. The sizes of the school systems appeared to have little influence upon this item. Other expenditures, when determined on a per-pupil basis, fluctuated; however, sizes of school systems appeared to be an insignificant factor in the determination of specific amounts.
The total amount expended per-pupil for instructional services was lowest in ADMG-I (75,000 or more) with $218.50 allocated. Meanwhile, the per-pupil amount was highest in ADMG-VI, with funds totaling $250.39 being expended.The average for the six average daily membership groups was $231.42.
Operation of PlantItems included in the operation of the plant were
custodial salaries, expenditures for all utilities, and other expenditures. An analysis of data revealed that expenditures for custodial salaries were highest in ADMG-I (75>000 or more) and became significantly smaller in terms of the six classifications of school systems.

134The range in the per-pupil expenditures for this item was from a high of $19.42 per-pupil, as indicated in ADMG-I (75,000 or more), to a low of $3.96 per-pupil in ADMG-VI (less than 5,000). The average for the six average daily membership groups was $10.56 per-pupil. Per-pupil expenditures varied in terms of size of school system; however, there was no consistent pattern defined in terms of available data. The per-pupil expenditures for this item were highest in ADMG-III (20,000 - 34,999) at $7.13 and lowest in ADMG-VI (75>000 or more) at $4.99. The average for the six groups was $5.97. Per-pupil expenditures were limited and were quite consistent for all average daily membership groups for other expenditures affiliated with operation of the plant.
Consideration of composite data for each average daily membership group revealed that per-pupil expenditures for operation of the plant were highest in ADMG-I (75>000 or more) at $25.67 and lowest in ADMG-IV (10,000 - 19,999) at $15.23. The amount reported for ADMG-II (35,000 -74.999) was $13.63, while the amount for ADMG-III (20,000 -34.999) was $17.09. In addition, the amount indicated for ADMG-V (5,000 - 9,999) was $16.61 whereas the amount reported for ADMG-VI (less than 5,000) was $16.74. The composite for all local school systems was $17.97 per-pupil.

Maintenance of PlantThree items were included in the broad function
concerned with maintenance of plant. These items were salaries of maintenance personnel, repair and upkeep of buildings and grounds including the repair and replacement of equipment, and other expenditures.
Review of data concerned with expenditures for each item in this function indicated that salaries of maintenance personnel were a significant expenditure item. It was noted that per-pupil expenditures for this item ranged from a high of $12.41 in ADMG-I (75,000 or more) to a low of $1.74 per-pupil in ADMG-IV (less than5,000). In addition, the per-pupil amounts determined for each average daily membership group decreased significantly as the sizes of the school systems decreased in average daily membership. The State figure was $4.17 per-pupil. Meanwhile, per-pupil expenditures for repair and upkeep of buildings and grounds including the repair and replacement of equipment varied in terms of sizes of school systems. However, there was a tendency for the per-pupil expenditure for this item to increase as the system became smaller. It was noted, though, that the highest per-pupil expenditure was indicated in ADMG-III (20,000 - 34,999) as being $9.26 while the lowest amount reported was $4.31 in ADMG-II (35,000 - 74,999). The

136amount reported for all school systems was $6.OS per- pupil. Other expenditures were insignificant in that the per-pupil amounts were as low as $0.00 and only as high as $0.34 per-pupil. The over-all amount indicated for all systems was $0.09 per-pupil.
Total amounts reported for maintenance of the plant for each of the six average daily membership groups ranged from a high of $17.96 per-pupil in ADMG-I (75,000 or more) to a low of $7*71 per-pupil in ADMG-IV (10,000 - 19,999). The State average was $10.34. No clearly defined pattern emerged from data revealed in this function.
Auxiliary ServicesTwo major items are included in expenditures for
auxiliary services. These items include expenditures for transportation of pupils and the school lunch program accompanied by the implementation of the national school milk program. A third item embraced all other expenditures for auxiliary services. An analysis of data concerned with expenditures for auxiliary services revealed that there was a direct relationship between sizes of school systems and per-pupil expenditures for pupil transportation. The per-pupil expenditures for this item ranged from a minimum of $5.39 in ADMG-I (75,000 or more)

137to a maximum of $46.13 in ADMG-VI (less than 5,000). As the sizes of school systems decreased, the amounts expended per-pupil for transportation increased significantly. The State figure was $27.01 per-pupil.
Meanwhile, per-pupil expenditures for school lunch including the national school milk program varied with no particular pattern evident in terms of varying sizes of school systems. The lowest per-pupil expenditure was noted as being $26.71 in ADMG-I (75,000 or more) while the highest per-pupil expenditures were recorded in ADMG-III (20,000 - 34,999) with $40.9$ expended and in ADMG-II (35,000 - 74,999) with $40.37 expended. Thereafter, the per-pupil expenditures decreased as the sizes of the school systems decreased. The State average was $35.67 per-pupil.
Expenditures for other auxiliary services were varied and small with the maximum per-pupil amounts indicated as being $1.75 in ADMG-III (20,000 - 34,999) and the minimum amount reported as being $0.95 per-pupil in ADMG-IV (10,000 - 19,999). Only $1.31 was expended on a per-pupil basis at the State level.
When the over-all expenditure per-pupil was examined for total expenditures for auxiliary services, the level of expenditure increased significantly as the sizes of the school systems decreased. The influence of

13 dschool transportation expenditures was evident. The minimum amount reported on a per-pupil basis was $33*dl in ADMG-I (75,000 or more) while the maximum amount was $32.21 in ADMG-VI (less than 5,000). The composite per-pupil expenditure for all local school systems in the State was $63.99.
Fixed ChargesOnly two expenditure items were included in the
Cost of Education Index for fixed charges. They were employee benefits and other expenditures, with the former item being the most significant and dominant factor.While variations in per-pupil expenditures for employee benefits were slight in terms of varying sizes of school systems, there was evidence of a slight increase as the sizes of school systems decreased. The range of per- pupil expenditures included a minimum of $20.02 in ADMG-I (75,000 or more) to a maximum of $23.97 in ADMG-VI (less than 5,000). The composite figure for the State was $21.76 per-pupil.
The other expenditure item included in fixed charges varied from a low of $1.46 per-pupil in ADMG-II (35,000 - 74,999) to a high of $4.55 in ADMG-III (20,000 - 34,999). There was little variation in the per-pupil expenditures reported for this item in ADMG-I

139(75,000 or more), ADMG-IV (10,000 - 19,999), ADMG-V (5,000 - 9,999), and ADMG-IV (less than 5,000). The amount determined for all basic school administrative units for this item was $3*08 per-pupil.
Likewise, variations did exist in terms of total per-pupil expenditures for fixed charges. ADMG-I (75,000 or more) reported a per-pupil expenditure of $23.15 whereas ADMG-II (35,000 - 74,999) dropped to $22.64. However, ADMG-III (20,000 - 34,999) increased to $26.19, but ADMG-IV (10,000 - 19,999) decreased to $24.93. Thereafter, slight increases were noted as the size of the school systems decreased. The maximum per-pupil expenditure was $27.36 in ADMG-VI (less than5,000). The State figure was $24.&4 per-pupil.
Total for Per-Pupil ExpendituresComposite per-pupil expenditures are based upon
twenty highly selected items grouped in terms of the following basic functions: general control, instructionalservices, operation of the plant, maintenance of the plant, auxiliary services, and fixed charges.
The minimum per-pupil expenditure was indicated in ADMG-I (75,000 or more) as being $328.45. The per-pupil amounts reported in ADMG-II (35,000 - 74,999) and ADMG-III (20,000 - 34,999) increased to $343.93 and $353.67,
140respectively. However, the per-pupil amount reported in ADMG-IV (10,000 - 19>999) decreased to $34$.15* Thereafter, the expenditure per-pupil increased significantly to $363.35 in ADMG-V (5,000 - 9,999) and $397.09 in ADMG-VI (less than 5,000). The composite figure indicated for all school systems was $356.96 per-pupil.
II. 1966-67 SCHOOL YEAR
In Table 19, was presented a distribution of per-pupil expenditures in terms of varying sizes of school systems in Louisiana in 1966-67.
General ControlAs indicated previously, the Cost of Education
Index developed and utilized in this study included three items in general control. These items were reported as being salaries of professional personnel, salaries of clerks and secretaries, and other expenditures for items related to general control.
Per-pupil expenditures for professional salaries were inconsistent for varying sizes of school systems.The minimum amount reported on a per-pupil basis was $2.35 in ADMG-III (20,000 - 34,999) whereas the maximum amount was reported as being $6.62 in ADMG-VI (less than5,000). Per-pupil expenditures in ADMG-I (75,000 or

Table 19
Distribution of Expenditures Per-Pupil Yearin Terms of Varying Sizes of School Systems
in 1966-67
Index Average Daily Membership Groups1 2 3 4 5 6 Total
General Control(1) Professional Salaries $ 3.40 $ 3.42 $ 2.35 $ 3.59 $ 4.01 $ 6.62 $ 3.79(2) Clerks and Secretaries 7.34 4.22 2.01 2.05 2.21 2.07 3.22(3) Other Expenditures 2.28 5.52 3.87 5.24 6.35 7.62 5.24
Total 13.02 13.16 8.23 10.88 12.57 16.31 12.25Instructional Services(1) Classroom Teachers 288.34 278.03 276.79 263.71 276.96 278.79 276.05(2} Other Professionals 25.05 21.15 21.41 23.93 26.64 30.62 24.50(3) Clerks and Secretaries 7.75 6.22 2.63 2.61 2.18 1.41 3.80(4) Textbooks 10.13 8.31 7.59 7.46 7.15 7.31 7.92(5) Supplies and Materials
for Teaching 3.49 9.15 17.37 10.46 9.96 12.00 10.21(6) Other Expenditures 10.42 8.21 6.15 5.81 5.46 5.34 6.82
Total 345.18 331.07 331.94 313.98 328.35 335.47 329.30Operation of Plant(1) Custodial Salaries 26.56 14.83 12.07 12.06 11.53 12.94 14.51(2) All Utilities 5.95 7.43 7.10 7.57 7.51 8.57 7.37(3; Other Expenditures 1.64 1.71 2.17 2.04 2.56 2.46 2.09
Total 34.15 23.97 21.34 21.67 21.60 23.97 23.97

Table 19 (continued)
Index Average Daily Membership Groups 2 3 4 5 6 Total
Maintenance of Plant(1) Maintenance Salaries(2) Repair and Upkeep of
Buildings & Grounds and Repair and Replacement of Equipment
(3) Other ExpendituresTotal
Auxiliary Services(1) Transportation
School Lunch & National School Milk Program Other Expenditures
Total
(al(3)
Fixed Charges(1) Employee Benefits(2) Other Expenditures
TotalGrand Total
$ 14.46 $ 6.40 $ 3.36 $ 4.32 $ 2.19 $ 2.06 $ 5.31
S.37 21.54
12.22.1010.26
• 437.66.13
12.42.25
9.99.04
10.372.99
44.37 13.72 14.60 12.11 14.36 12.09 13.67
6.93 22.29 27.95 34.09 47.02 57.96 32.7349.611.67
43.904.12
43.764*43
45.964.47
43.713.29
43.743.53
46.673.67
53.21 75.31 31.19 34.52 94.02 105.23 83.07
35.604.05
31.394.73
31.303.52
23.365.66 29.245.27
30.7110.66 30.855.44
39.65 36.12 34.32 34.52 34.51 41.37 36.29$535.03 $493.35 $492.12 $477.63 $505.91 $534.44 $503.55
-p-ro
143more) and ADMG-II (35,000 - 74>999) were comparable at $3,40 and $3.42, respectively. The composite figure for all school systems was $3.79.
Salaries of clerks and secretaries, when determined on a per-pupil basis, tended to decrease as the sizes of the school systems decreased. The per-pupil amount reported in ADMG-I (75,000 or more) was.highest at $7.34. This item decreased to $4.22 per-pupil in ADMG-II (35,000 - 74,999). A review of the remaining average daily membership groups indicated that per-pupil expenditures for salaries and groups were comparable, with the range being a high of $2.21 in ADMG-V (5,000 -9,999) to a low of $2.01 in ADMG-III (20,000 - 34,999).The amount reported for ADMG-VI (less than 5,000) was $2.07 per-pupil while the amount reported on a per-pupil basis in ADMG-IV (10,000 - 19,999) was $2.05. The average for the composite grouping was $3.22 per-pupil.
Per-pupil expenditures for other items associated with general control tended to increase as the sizes of school systems decreased. The minimum amount reported was $2.2$ per-pupil in ADMG-I (75,000 or more) whereas the maximum amount was $7.62 per-pupil in ADMG-VI (less than 5,000). The exception to this tendency was registered in ADMG-III (20,000 - 34,999) when a decrease to $3.87 per-pupil was noted as compared with $5.52 per-pupil in

144ADMG-II (35,000 - 74,999) and $5,24 per-pupil in ADMG-IV (10,000 - 19,999).
When all items concerned with general control were combined, the lowest per-pupil expenditure was noted as being $8.23 in ADMG-III (20,000 - 34,999) whereas the highest per-pupil expenditure was determined as being $16.31 in ADMG-IV (less than 5,000). By comparison, the next highest per-pupil expenditures were revealed to be $13.02 and $13.16 in ADMG-I (75,000 or more) and ADMG-II (35,000 - 74,999), respectively. The composite amount for all school systems was $12.25 per-pupil.
Instructional ServicesSix expenditure items were included in instructional
services. Included were the following: salaries of classroom teachers, salaries of other personnel, salaries of clerks and secretaries, textbooks, supplies and materials for teaching, and other expenditures for instructional services.
As usual, salaries of classroom teachers far exceeded all other items when determined on a per-pupil basis. Per-pupil expenditures for this item did not vary widely. The minimum amount reported on a per-pupil basis was noted as being $263.71 in ADMG-IV (10,000 - 19,999) while the maximum per-pupil expenditure was $2$$.34 in

145ADMG-I (75,000 or more). The remaining average daily membership groups were clustered from $276.00 and $279*00 per-pupil. Four average daily membership groups were within these limits. The average for all school systems was $276.05 per-pupil.
Salaries of other professional personnel represented a significant item in each of the average daily membership groups included in the study. Two average daily membership groups, namely, ADMG-II (35,000 - 74,999) and ADMG-III (20,000 - 34,999), were approximately equal with per-pupil expenditures for this item being $21.15 and $21.41, respectively. These amounts were the minimums reported. ADMG-I (75,000 or more) reported a per-pupil expenditure of $25.05. The maximum amount indicated was $30.62 in ADMG-VI (less than5,000). The average for all school systems was $24.50 per-pupil.
Per-pupil expenditures for salaries of clerks and secretaries tended to decrease as the sizes of the school systems decreased. There was a significant difference between the maximum amount of $7.75 per-pupil expended in ADMG-I (75,000 or more) and $1.41 per-pupil spent in ADMG-VI (less than 5,000). The average for all school districts was $3.60 per-pupil.
Per-pupil expenditures for textbooks tended to experience reductions as the sizes of school systems

146decreased. An amount of $10.13 per-pupil was expended in ADMG-I whereas $7.31 was expended on a per-pupil basis in ADMG-VI (less than 5,000). However, the smallest amount was expended on ADMG-V (5,000 - 9,999) when $7.15 was reported on a per-pupil basis. The composite amount indicated for the State was $7.92 per-pupil.
An analysis of data concerned with per-pupil expenditures for supplies and materials for teaching indicated that a maximum amount of $17.37 was expended on a per-pupil basis by school systems in ADMG-III (20,000 - 34,999). This group was followed by ADMG-VI, which expended $12.00 on a per-pupil basis, and ADMG-IV (10,000 - 19,999), which expended $10.46 per-pupil. By comparison, ADMG-I (75,000 or more) spent the least amount of the six groups for supplies and materials for teaching. Only $3.49 per-pupil was determined for this group. The State figure was $10.21 per-pupil.
Other expenditures associated with instructional services tended to decrease as the sizes of the school systems decreased. The range varied from a maximum of $10.42 per-pupil in ADMG-I (75,000 or more) to a minimum of $5.34 per-pupil in ADMG-VI (less than 5,000). The total figure for all school systems was $6.82.
Over—all, there was little difference in the final computations in per-pupil expenditures for

147instructional services in terms of the six average daily membership groups included in the study. The maximum amount reported was $345,13 per-pupil in ADMG-I (75,000 or more) whereas the minimum amount was determined as being $313.93 per-pupil in ADMG-IV (10,000 - 19,999).The remaining average daily membership groups were clustered between $323.00 and $334.00 per-pupil. The average for all school systems was $329,30 per-pupil.
Operation of PlantExpenditures for custodial salaries, utilities,
and other expenditures affiliated with operation of the plant were included in this function.
An analysis of per-pupil expenditures for salaries of custodial personnel revealed that the highest amount reported was $26,56 in ADMG-I (75,000 or more). After this amount, a decrease was noted in each successive average daily membership group until a low of $11,53 per-pupil was noted in ADMG-II (5,000 - 9,999), However, the per-pupil amount expended by ADMG-VI (less than5,000) increased to $12,94 per-pupil. The average for all school systems for this item was $14.51 per-pupil.
Per-pupil expenditures for all utilities tended to increase as the sizes of the school systems decreased. However, no wide variations existed in terms of this
143item* The highest amount reported on a per-pupil basis was $3*57 in ADMG-VI (less than 5,000) whereas the lowest amount was indicated as $5.95 per-pupil in ADMG-I (75,000 or more).
Items included in other expenditures for operation of the plant did not represent a major item when determined on a per-pupil basis* The higher average daily membership groups tended to have the lowest per-pupil amounts while the lowest average daily membership groups tended to have the highest per-pupil expenditures* The State average was $2*09 per-pupil.
When all items were considered in terms of the operation of the plant, the range for per-pupil expenditure data varied from a maximum of $34.15 in ADMG-I (75,000 or more) to a minimum of $21.34 in ADMG-III (20,000 - 34,999)* The lower average daily membership groups increased from a minimum of $21.34 per-pupil to a maximum of $23.97 per-pupil in ADMG-VI (less than5,000). However, this amount was not as high as the amount reported in ADMG-I (75,000 or more). The average for all items for the six average daily membership groups was $23.97 per-pupil.
Maintenance of PlantSalaries of maintenance personnel, repair and
upkeep of buildings and grounds including the repair

149and replacement of equipment, and items reported as other expenditures comprise the Cost of Education Index factors identified with maintenance of the plant,
Per-pupil expenditures for salaries of maintenance personnel decreased significantly as the sizes of the school systems increased. The range includes a maximum of $14*46 per-pupil in ADMG-I (75»000 or more) and a low of $2.06 per-pupil in ADMG-VI (less than5,000). The State average for this item was $5*31 per-pupil.
Meanwhile, per-pupil expenditures for repair and upkeep of buildings and grounds including the repair and replacement of equipment tended to be larger among the parish and city school systems in the middle average daily membership groups. The highest per-pupil expenditures were reported in ADMG-V (5,000 - 9,999) and ADMG-II (35,000 - 74,999) with the amounts of $12.42 and $12.22, respectively. The lowest amounts tended to be among the extremes in the sizes of the average daily membership groups, which included ADMG-I (75,000 or more) and ADMG-VI (less than 5,000). In these instances the amounts reported per-pupil were $C.&7 and $9*99, respectively. However, the lowest amount indicated was in ADMG-IV (10,000 - 19,999) with an amount per-pupil of $7.66. The composite for the State was $10.37 per-pupil.

150Per-pupil expenditures for other expenditure
items associated with maintenance of the plant were extremely out of proportion in terms of sizes of the school systems. The amount reported in ADMG-I (75,000 or more) was $21.54 per-pupil whereas the amounts indicated for the remaining five average daily membership groups ranged from $0„04 to $0.4# per-pupil. These wide contrasts were due primarily to expenditures resulting from hurricanes.
As expected, the latter item exerted a tremendous influence upon the total expenditures for maintenance of the plant determined for each average daily membership group. Obviously, the highest per-pupil amount was recorded as $44*^7 in ADMG-I (75,000 or more). All other average daily membership groups reported per-pupil expenditures of more than $12.00 but less than $19*00,The State average, despite the high amount in ADMG-I (75,000 or more), was $18.67 per-pupil.
Auxiliary AgenciesThree items were included in expenditures for
auxiliary services. They were: transportation ofpupils, school lunch program including the national school milk program, and other expenditures concerned with auxiliary services.

151Per-pupil expenditures for transportation of
pupils were highest in the average daily membership group with the fewest number of pupils on roll. Specifically, amounts ranged from a minimum of $6,93 per-pupil in ADMG-I (75,000 or more) to a maximum of $57*96 per-pupil in ADMG-VI (less than 5,000). Amounts expended per-pupil increased at a significant rate as the sizes of the school systems decreased. The average for the State was $32.73 per-pupil.
Meanwhile, per-pupil expenditures for school transportation and the national school milk program did not vary widely in terms of varying sizes of school systems. Per-pupil expenditures ranged from a high of $49.61 in ADMG-I (75,000 or more) to $43.71 in ADMG-V (5,000 - 9,999). However, the amount indicated in ADMG-VI (less than 5,000) was only three cents more than the amount indicated in ADMG-V (5,000 - 9,999). The average for all school districts was $46.67.
Finally, per-pupil expenditures for other items concerned with auxiliary services were small in certain average daily membership groups and substantial in other average daily membership groups. ADMG-III (20,000 -34,999) and ADMG-IV (10,000 - 19,999) reported the highest per-pupil expenditures with amounts of $4*4& and $4.47, respectively. In addition, ADMG-II (35,000 -

15274.999) reported a per-pupil expenditure of $4*12# Thereafter, amounts determined in ADMG-V (5,000 - 9,999) and ADMG-VI (less than 5,000) decreased to $3*29 and $3*53 per-pupil, respectively* The lowest amount was $1.67 per-pupil in ADMG-I (75,000 or more). The amount indicated for all school systems was $3*67 per-pupil.
Fixed ChargesThis function included expenditures for employee
benefits and miscellaneous items.Expenditures for employee benefits constituted
the major cost of all funds expended for fixed charges. There was no great disparity in the per-pupil amounts indicated for the various average daily membership groups. As a matter of record, the lowest amount per- pupil was indicated as being $2$.£6 in ADMG-IV (10,000 -19.999). The highest amount indicated was $35.60 per- pupil in ADMG-I (75,000 or more). There were insignificant differences among the remaining average daily membership groups. The State average was $30.85 per-pupil.
Generally, per-pupil expenditures for other items included in fixed charges tended to increase as the sizes of the school systems decreased. A review of data indicated that the amount of $10.66 per-pupil in ADMG-IV (less than 5,000) was more than twice as large as the

153per-pupil amount of $4*05 reported for ADMG-I (75,000 or more). The average for all school systems was $5.44.
In terms of all items included in fixed charges, the differences among the school groups were insignificant. The minimum amount of $34.52 per-pupil was reported in ADMG-IV (10,000 - 19,999) whereas the maximum amount was $41.37 per-pupil in ADMG-VI (less than 5,000). The over-all figure for the State was $36.29.
Total Per-Pupil ExpendituresComposite per-pupil expenditures, based upon a
number of highly selected items, were tabulated in terms of data for all major functions included in the current operation phase of budgets of local school boards.
The minimum amount expended per-pupil was $477.68 in ADMG-IV (10,000 - 19,999) whereas the maximum amount was $535.08 per-pupil in ADMG-I (75,000 or more).It was noted that the per-pupil expenditure in ADMG-VI (less than 5,000), the smallest grouping of school systems, was $534.44, an amount which compared favorably with the per-pupil expenditure indicated for the largest grouping of school systems. The two remaining larger parish school systems indicated lower per-pupil expenditures than did the smaller parish and city school
154systems. The former grouping, which was the larger systems, tended to be slightly below $500,00 per-pupil whereas the smaller systems tended to be slightly above the $500,00 per-pupil level. The State average for 1966-67 was $503,55 per-pupil.
III. 1969-70 SCHOOL YEAR
A distribution of per-pupil expenditures in terms of varying sizes of school systems in Louisiana in 1969-70 was presented in Table 20.
General ControlExpenditures associated with general control of
the local school system were grouped in terms of three specific items: namely, salaries of professional staffmembers, salaries of clerks and secretaries, and other expenditures.
In analyzing data presented in Table 20, it was noted that per-pupil expenditures for professional salaries appeared to increase at a significant rate as the sizes of the school systems decreased. The minimum per-pupil amounts were reported in ADMG-I (75,000 or more) and ADMG-III (20,000 - 34»999) whereas the largest per-pupil amounts were in ADMG-V (5,000 - 9,999) and ADMG-VI (less than 5,000). The minimum amount reported
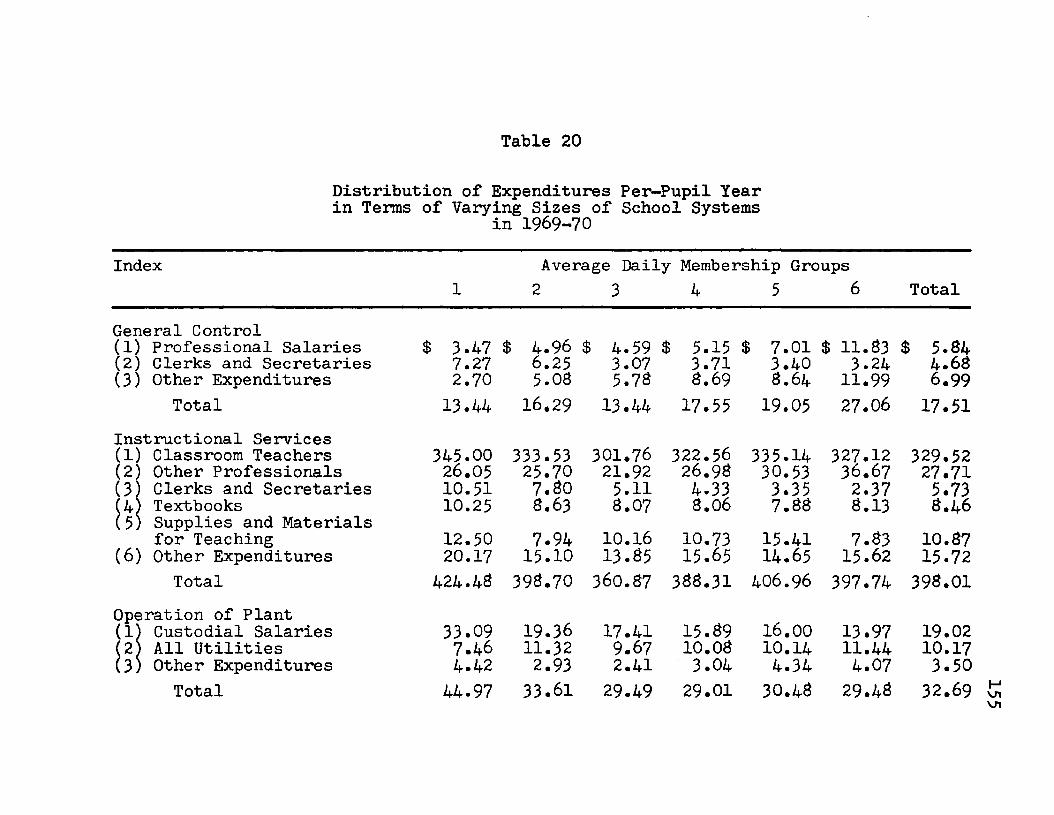
Table 20
Distribution of Expenditures Per-Pupil Yearin Terms of Varying Sizes of School Systems
in 1969-70
Index Average Daily Membership Groups1 2 3 4 5 6 Total
General Control(1) Professional Salaries $ 3.47 $ 4.96 $ 4.59 $ 5.15 $ 7.01 $ 11.83 $ 5.84(2) Clerks and Secretaries 7.27 6.25 3.07 3.71 3.40 3.24 4.63(3) Other Expenditures 2.70 5.03 5.73 3.69 8.64 11.99 6.99
Total 13.44 16.29 13.44 17.55 19.05 27.06 17.51Instructional Services(1) Classroom Teachers 345.00 333.53 301.76 322.56 335.14 327.12 329.52(2) Other Professionals 26.05 25.70 21.92 26.93 30.53 36.67 27.71(3) Clerks and Secretaries 10.51 7.30 5.11 4.33 3.35 2.37 5.73(4) Textbooks 10.25 3.63 3.07 3.06 7.88 8.13 8.46(5) Supplies and Materials
for Teaching 12.50 7.94 10.16 10.73 15.41 7.83 10.37(6) Other Expenditures 20.17 15.10 13.35 15.65 14.65 15.62 15.72Total 424.43 393.70 360.37 338.31 406.96 397.74 393.01
Operation of Plant(1) Custodial Salaries 33.09 19.36 17.41 15.89 16.00 13.97 19.02(2) All Utilities 7.46 11.32 9.67 10.08 10.14 11.44 10.17(3) Other Expenditures 4.42 2.93 2.41 3.04 4.34 4.07 3.50
Total 44.97 33.61 29.49 29.01 30.48 29.48 32.69

Table 20 (continued)
Index Average Daily Membership Groups1 2 3 4 5 6 Total
Maintenance of Plant(1) Maintenance Salaries(2) Repair and Upkeep of
Buildings & Grounds and Repair and Replacement of Equipment
(3) Other Expenditures
$ 15.29
8.27.32
$ S.41
9.49.12
$ 3.81
8.50.57
$ 5.13
11.39.55
$ 3.34
14.29.78
$ 3.07
8.55.58
$ 6.63
10.56.46
Total 23. SB 18.02 12.88 17.07 18.41 12.20 17.65Auxiliary Services(1) Transportation(2) School Lunch & National
School Milk Program(3) Other Expenditures
6 . U45.342.12
24.3053.833.36
34.4760.403.57
41.6450.002.47
54.7753.963.45
73.5353.933.38
37.5652.543.05
Total 53.87 81.49 98.44 94.11 112.18 130.84 93.15Fixed Charges(1) Employee Benefits(2) Other Expenditures 37.77
6.0445.706.85
34.508.96
35.686.46 40.566.46 35.738.53
39.506.93
Total 43.81 52.55 43.46 42.14 47.02 44.26 46.43Grand Total $604.45 $600.66 $558.58 $588.19 $634.10 $641.58 $605.44
VrtON
157was $3*47 per-pupil while the maximum amount expended per-pupil was $11.#3* The composite figure for the State was $5.34 per-pupil.
Meanwhile, per-pupil expenditures for salaries of clerks and secretaries appeared to decrease as the sizes of the school systems decreased. The lone exception to this fact occurred in ADMG-III (20,000 -34.999), where $3*07 per-pupil was expended. The maximum amount for this item was in ADMG-I (75,000 or more). The State average was $4.6# per-pupil.
Finally, per-pupil expenditures for other items affiliated with general control increased at a rapid rate as the sizes of the school systems decreased. The minimum per-pupil expenditure of $2.70 for this item was recorded in ADMG-I (75,000 or more) while the maximum per-pupil amount of $11.99 was recorded in ADMG-VI (less than 5,000). The composite figure for all school systems was $6.99 per-pupil.
Consideration of the three items comprising general control revealed that the range of per-pupil expenditures for this function varied from a low of $13.44 in ADMG-I (75,000 or more) and ADMG-III (20,000 -34.999) to a high of $27.06 in ADMG-VI (less than 5,000). The latter figure was considerably higher than the $19.05 per-pupil amount indicated in ADMG-V (5,000 - 9,999).

158The per-pupil amount expended by a composite of all local school systems was $17.51.
Instructional ServicesSix expenditure items were included in the
function concerned with instructional services. They were salaries of classroom teachers, salaries of other professional personnel, salaries of clerks and secretaries employed in schools, textbooks, supplies and materials for teaching and other expenditures.
Salaries of classroom teachers constituted the major item in terms of per-pupil expenditures. Amounts varied in comparison with sizes of the school systems.No definite pattern was indicated. The highest and lowest per-pupil expenditures for this item were determined in extremely large school systems. For example, the highest per-pupil amount was in ADMG-I (75,000 or more) while the lowest amount was located in ADMG-III (20,000 - 34,999). Generally, smaller school systems reported substantial amounts for per-pupil expenditures for salaries of classroom teachers. Actually, the State total was $329.52 per-pupil.
Per-pupil expenditures for salaries of other professional personnel represented the second largest item in instructional services. It appeared as though

159the least amount expended was in ADMG-III (20,000 -34,999) when $21.92 per-pupil was indicated. Thereafter, the amounts indicated tended to increase at both ends of the grouping of school systems. Per-pupil expenditures increased to $26.05 in ADMG-I (75,000 or more) and to $36.67 in ADMG-VI (less than 5,000). The figure for the State was $27*71 per-pupil.
There appeared to be a direct relationship between per-pupil expenditure for salaries of clerks and secretaries and sizes of the school system. The smaller school systems definitely spent less funds per- pupil for this item than did the larger school systems. The largest amount was expended in ADMG-I (75,000 or more) where $10.51 per-pupil was spent. Meanwhile, the smallest amount was spent in ADMG-VI (less than 5,000). The composite figure for the State was $5.73*
The per-pupil amounts expended for textbooks were comparable with no extreme variations indicated between the various groupings of the local school systems. Generally, the amounts were located between a minimum of approximately $8.00 per-pupil and a maximum of about $10.00 per-pupil. The State average was $8,46 per-pupil.
Wide variations were noted among the various school systems in terms of per-pupil expenditures for

160supplies and materials for teaching. ADMG-VI (less than5,000) reported a low per-pupil expenditure for this item of $7.83 while ADMG-V (35,000 - 74,999) reported a slight increase to $7.94 per-pupil. Some of the higher amounts per-pupil were expended in ADMG-IV (10,000 -19,999) when $15.65 was reported and in ADMG-VI (less than 5,000) when a per-pupil expenditure of $15.62 was indicated.
Total per-pupil expenditures for instructional services were fairly comparable. The maximum amount was reported as being $424.48 per-pupil in ADMG-I (75,000 or more) whereas a minimum amount of $360.$7 per-pupil was noted in ADMG-III (20,000 - 34,999).Several of the average daily membership groups reported that an amount of approximately $400.00 per-pupil was expended for instructional services. Likewise, the State average was approximately $400.00 per-pupil.
Operation of PlantSalaries of custodial personnel, expenditures
for all utilities, and other expenditures comprised items associated with operation of the school plant.
The most significant item in this group was salaries of custodial personnel. Per-pupil expenditures for this service more than doubled per-pupil expenditures

161for the combined total of the remaining two items. Generally, per-pupil expenditures for salaries of custodial personnel were higher in the larger school systems. Comparisons revealed that an amount of $33*09 per-pupil was spent in ADMG-I (75,000 or more) whereas only $13*97 per-pupil was spent in ADMG-I (less than5,000), Approximately $19,00 per-pupil was spent as an average by all school systems.
When per-pupil expenditures for utilities were examined, it was noted that the smaller amounts were spent in larger school systems while greater amounts were spent on a per-pupil basis in smaller school systems. The maximum amount indicated was $11.44 per- pupil in ADMG-VI (less than 5>000) while the minimum amount per-pupil was revealed as $7*46 in ADMG-I (75,000 or more). In comparison, the average for all school systems was $10,17 per-pupil.
Variations for other expenditures for operation of the plant were insignificant. Little difference was noted between the maximum and minimum amounts reported by the various average daily membership groups.
Final amounts indicated for the various school system groups varied from a per-pupil high of $44*96 in ADMG-I (75,000 or more) to a low of $29.01 per-pupil in ADMG-IV (10,000 - 19,999). ADMG-VI (less than 5,000) and

162ADMG-III (20,000 - 34,999) reported per-pupil amounts which were only a few cents above the low figure reported. ADMG-V (5,000 - 9,999) and ADMG-II (35,000 - 74,999) indicated amounts that were considerably lower than the high of $44.97 per-pupil expended in ADMG-I (75,000 or more) but somewhat above the per-pupil amounts indicated for the remaining average daily membership groups. The average for the State for this function was $32.69 per-pupil.
Maintenance of PlantSalaries of maintenance personnel, and expendi
tures for repair and upkeep of buildings and grounds including the repair and replacement of equipment represented two significant items concerned with maintenance of the plant. A third item, other expenditures, was used in the Cost of Education Index; however, amounts indicated for this category were negligible, being considerably less than $1.00 for each of the different school system groups.
Meanwhile, salaries of maintenance personnel tended to be larger in the urban school systems. A high of $15.29 per-pupil was noted in ADMG-I (75,000 or more). Thereafter, the per-pupil amounts decreased notably as the school systems became smaller. A low of
163$3.07 per-pupil was reported in ADMG-VI (less than 5,000); however, small amounts representing $3.34 and $3.31 per- pupil were reported in ADMG-V (5,000 - 9,999) and ADMG-III (20,000 - 34,999). The composite for all school systems was $6.63 per-pupil.
Significant data were noted in items of per-pupil expenditures for repair and upkeep of buildings and grounds including the repair and replacement of equipment, The lowest amounts indicated were the per-pupil expenditures of $3.27, $3.50, and $3,55 in ADMG-I (75,000 or more), ADMG-III (20,000 - 34,999) and ADMG-VI (less than 5,000), respectively. The highest amounts reported were $11,39 and $11.29 per-pupil in ADMG-IV (10,000 - 19,999) and ADMG-V (5,000 - 9,999).The average for the total number of school systems was $10.56.
When the sum of all three items associated with maintenance of the plant was determined, wide variations were noted in terms of the various sizes of the school systems. The lowest per-pupil amount was indicated in ADMG-VI (less than 5,000) when an amount of $12.20 per- pupil was indicated. ADMG-III (20,000 - 34,999) reported a low of $12.33 per-pupil. After these amounts, increases occurred until approximate figures which ranged between $17.00 and $13.00 were noted in ADMG-IV (10,000 - 19,999),

164ADMG-II (35,000 - 74,999), and ADMG-V (5,000 - 9,999).A maximum amount of $23.33 per-pupil was noted in ADMG-I (75,000 or more). The State average was $17.65 per- pupil.
Auxiliary ServicesExpenditures for transportation of pupils and
school lunch including the national school milk program were major items affiliated with auxiliary services. Miscellaneous items were grouped under other expenditures.
There was overwhelming evidence that per-pupil expenditures for pupil transportation increased at a tremendous rate in highly rural areas. The increases became progressively higher as the school systems moved from highly urban to highly rural. ADMG-I (75,000 or more) expended only $6.41 per-pupil for transportation of pupils while ADMG-VI (less than 5,000) expended $73.53 per-pupil for the operation of this program.
Meanwhile, expenditures per-pupil for operation of the school lunch program including the national school milk program were sizeable, although variations among school systems were not extreme. The smallest and largest amounts per-pupil were expended by larger school systems, being $45.34 in ADMG-I (75,000 or more) and $60.40 in ADMG-III (20,000 - 34,999). Three groupings of

165school systems, ADMG-II (35,000 - 74,999), ADMG-V (5,000 -9,999), and ADMG-VI (less than 5,000) reported the following per-pupil amounts for this item: $53*63, $53*96, and$53*93, respectively. ADMG-IV (10,000 - 19,999) reported an amount of $50.00 per-pupil. The State average was $52.54 per-pupil.
Other expenditures per-pupil were considerably less than the per-pupil amounts indicated for the two previous items. The various parish groupings reported between $2.00 or $3*50 for this category. No definite pattern was noted. The State figure was $3.05 per-pupil.
Over-all per-pupil expenditures for all items associated with auxiliary services were considerably higher in smaller school systems. The influence exerted by the amounts determined per-pupil for operation of a pupil transportation program was primarily responsible.The range varied from a minimum of $53*67 per-pupil in ADMG-I (75,000 or more) to a maximum of $130.64 per- pupil in ADMG-VI (less than 5,000). Another group which reported an amount in excess of $100.00 for this category was ADMG-V (5,000 - 9,999) when an amount of $112.1$ per-pupil was reported. The remaining school systems were credited with amounts varying between $$1.00 and $9$*00 per pupil. The State average for all school systems was $93*15*

166Fixed Charges
Two items were included in the Cost of Education Index under the function concerned with fixed charges. These items were employee benefits and other expenditures.
Per-pupil expenditures for employee benefits relating to retirement, social security, insurance and workmen’s compensation were major in terms of over-all expenditures. The amounts reported on a per-pupil basis varied from a low of $34.50 per-pupil in ADMG-III(20,000 - 34,999) to a high of $45.70 per-pupil inADMG-II (35»000 - 74,999). Other low amounts of $35.6#and $35.73 per-pupil were reported in ADMG-IV (10,000 -19,999) and ADMG-VI (less than 5,000), respectively. ADMG-V (5,000 - 9,999) reported a per-pupil amount of $40.56 whereas ADMG-I (75,000 or more) reported a per- pupil figure of $37.77. An average of $39.50 per-pupil was computed for the State.
Amounts varied between a low of $6.04 per-pupil reported in ADMG-I (75,000 or more) and a high of $8.96 per-pupil indicated in ADMG-III (20,000 - 34,999) for other items involved with fixed charges.
Over-all amounts for all items concerned with fixed charges were considerably uniform. Four of the parish school system groups indicated amounts of

167approximately $43*00 per-pupil. Another group, ADMG-V (5,000 - 9,999), reported a somewhat higher figure at $47*02 while an amount which totaled $52,55 per-pupil was reported in ADMG-II (35,000 - 74,999). The State average was $46,43 per-pupil.
Total Per-Pupil ExpendituresPer-pupil expenditures for current operation were
indicated in Table 20. These data represent a composite of per-pupil expenditures for general control, instructional services, operation of the plant, maintenance of the plant, auxiliary services and fixed charges.
The range varied between a minimum of $556.58 per-pupil in ADMG-III (20,000 - 34,999) to a maximum of $641.58 in ADMG-VI (less than 5,000). Generally, the amounts reported per-pupil tended to rise at each end of the school system distribution; these amounts increased as the school systems became larger and smaller. For example, the amount indicated in ADMG-I (75,000 or more) was $604*45 per-pupil while the amount reported for ADMG-II (35,000 - 74,999) was in excess of $600.66 per- pupil, The same observation was noted in ADMG-V (5,000 - 9,999), which reported a per-pupil expenditure of $634.10. The average for all systems and all items in the Cost of Education Index was $605.44 per-pupil.

IV. SUMMARY16$
In Tables 1$ - 20, tabulations were made in order to facilitate appropriate comparisons on a per- pupil basis for varying sizes of school systems for the periods 1961-62, 1966-67, and 1969-70.
A detailed analysis for each of the three years was made in terms of each of the six (6) basic functions included in expenditures for current operations. Comparisons and significant variations and exceptions were noted.

CHAPTER VI
SUMMARY AND CONCLUSIONS
The purpose of this study was to analyze data concerned with the cost of elementary and secondary public education in Louisiana in terms of varying sizes of school systems. Cost data were determined for the 1961-62, 1966-67, 1967-68, 1968-69, and 1969-70 school sessions. Furthermore, a Cost of Education Index, applicable to local school systems in Louisiana, was devised in order to permit accurate comparisons and to develop valid trends.
I. SUMMARY
Since financing public education at the elementary and secondary school levels continued to be a major concern, it became imperative for local school systems to conduct a more systematic approach to budget preparation and cost analysis.
Research pertaining to the development and use of appropriate Cost of Education Indices was limited. Some of the initial studies in this area were commenced in
169

1#93« However, it was not until the decades included in the period 1920 - 1950 that considerable research was conducted specifically in the development and use of valid indices. Since this period and more notably in the I960's, a real concerted effort has been directed toward the determination of useful and reliable criteria for application by local school personnel in budget preparation and analysis. Specifically, the publication School Management, at the suggestion and under the guidance of Dr, Orlando F, Furno proceeded to undertake the mammoth task and underwrite the great costs involved in conducting appropriate research in terms of a series of pilot Cost of Education Index studies. After a lengthy period of research involving hundreds of school districts in the United States, the organization and content of the National Cost of Education Index was finalized by Furno, This Index was used by numerous school districts in the United States.
In Louisiana, no Cost of Education Index has been developed nor have comparisons been made of cost data of local school boards in terms of varying sizes of school districts. However, detailed itemization of expenditures for current operation by local school districts in Louisiana was presented in the annual reports of the State Department of Education. Expenditure

171data in these annual reports were included in terms of six basic functions related to current operation.These were: general control, instructional services,operation of the plant, maintenance of the plant, auxiliary services, and fixed charges. Detailed items were grouped under each major function, Per-pupil expenditure data were computed by utilizing cumulative expenditures for current operation and public school average daily membership.
For purposes of this study it was deemed advisable to:
(1) Utilize average daily membership data rather than actual enrollment figures.
(2) Develop a classification for school systems in terms of average daily membership rather than utilize the classification used in the National Study.
(3) Develop a Cost of Education Index which was more applicable to Louisiana’s local school systems rather than apply the National Cost of Education Index.
(4) Develop an appropriate formula concerned with expenditures per-pupil year in order to facilitate the determination of accurate comparisons and trends.

172From a consideration of the data presented, the
following summaries were considered pertinent;1, As developed for use in this study, the
term— expenditures for current operation, was based upon six major functions. They were: general control,instructional services, operation of the plant, maintenance of the plant, auxiliary services, and fixed charges. These functions were used by the Louisiana State Department of Education in the preparation of publications and the United States Office of Education in their publication concerned with school statistics for the various states. After considerable organization and consolidation of specific expenditure items, a total of twenty (20) was included in the Cost of Education Index used in this study.
These items in terms of each major expenditure function included the following;
General Control(1) Professional salaries(2) Clerks and secretaries(3) Other expendituresInstructional Services(1) Classroom teachers(2; Other professionals(3) Clerks and secretaries(4) Textbooks(5) Other teaching materials(6) Other expenditures

173Operation of Plant(1) Custodial salaries(2) All utilities including heat or fuel(3) Other expendituresMaintenance of Plant(1) Maintenance salaries(2) Repair and upkeep of buildings including
repair and replacement of equipment(3) Other expendituresAuxiliary Agencies(1) Transportation(2) School lunch including the National
School Milk Program(3) Other expendituresFixed Charges(1) Employee benefits(2) Other expendituresNet Current Expenditures
The final selection of these items, as factors to use in the preparation of the Index, was made to facilitate accurate comparisons and develop comparable trends. Furthermore, certain items excluded from the National Index appeared as major expenditure items for all local school systems in the State, In addition, the centralization of authority for administration and finance was extremely high. This condition resulted in limited variations in the number of significant items upon which comparisons and trends can be developed,
2. The major differences, which existed between the National Cost of Education Index and the State Index, were as follows:

174a. The National Cost of Education Index
stipulated heat as a separate item concerned with operation of the school plant; whereas, the Louisiana Index includes heat with expenditures for other utilities. Therefore, the term all utilities was used in this study.
b. The National Cost of Education Index utilized two items in computing per-pupil expenditures for maintenance of the plant. In the Louisiana Cost of Education Index, expenditures for maintenance of the plant were classified in terms of three items, with the addition being expenditures for repair and upkeep of buildings and grounds including the repair and replacement of equipment.
c. In the National Cost of Education Index, health services was listed as a separate and major category; whereas, in Louisiana, this program was reported as another auxiliary service performed by local school boards.
d. In addition, the program concerned with transportation of pupils was excluded from the itemization of functions and items specified for current operation in the National Cost of Education Index. However, in the Louisiana Cost of Education Index, pupil transportation was treated as an item included in auxiliary services.
175e. Finally, the term employee benefits
included a far broader concept in the Louisiana Cost of Education Index than the term retirement funds used in the National Index. In Louisiana, employer's contribution to retirement programs, social security, workmen's compensation, and insurance premiums were included; whereas, in the National Index the limitation excluded all but retirement programs,
3* From an analysis of the tabulations in this study, the following general and specific summaries concerned with per-pupil expenditures in each average daily membership group were apparent:
ADMG-IPer-pupil expenditures for school systems included
in ADMG-I increased from $32$*45 in 1961-62 to $535*08 in1966-67. The expenditure per-pupil further increased to $604*45 in 1969-70. The total increase in per-pupil expenditures was $276.00 for the period included in this study.
Significant observations concerned with specific functions and items in the Index as applied to ADMG-I were:
General control. Per-pupil expenditures increased from a low of $9.36 in 1961-62 to a high of $15*85 in

1761967-63, This amount decreased to $11,93 per-pupil in 1963-69 and increased to $13.44 per-pupil in 1969-70. Per-pupil expenditures for salaries of clerks and secretaries represented the most expensive item in this function.
Instructional services. Per-pupil expenditures increased from a minimum of $218.50 in 1961-62 to a high of $435.72 in 1967-68. It was noted that decreases in this function were registered for each year following1967-68. As expected, per-pupil expenditures for salaries of classroom teachers constituted the most significant item in this function. Other significant items were salaries of other professional personnel, salaries of clerks and secretaries, textbooks, and supplies and materials for teaching. Generally, sizeable increases were noted in each of these items for the years included in the study.
Operation of plant. Increases were noted in per-pupil expenditures for this function; namely, from a minimum of $25,67 in 1961-62 to a maximum of $44*97 in 1969-70. The most significant item in this function was per-pupil expenditures for salaries of custodial personnel. Per-pupil expenditures for all utilities did not sustain major increases.

177Maintenance of plant. Per-pupil expenditures
for this function increased from $17*96 in 1961-62 to $44*37 ln 1966-67* The significant increase was attributed to expenditures made in terms of repairs for damages sustained during the hurricane season. After1966-671 per-pupil expenditures for this function became more stable* Per-pupil expenditures for salaries of maintenance personnel represented the most significant item in this function.
Auxiliary services. Per-pupil expenditures for this function represented the second most important function in terms of amounts expended. Increases were generated in each year in the study; however, a high of $53.21 expended per-pupil was achieved in 1966-67.Slight decreases were noted for the following two years; however, this amount increased to $53.37 per-pupil in 1969-70. The most significant item identified in this function was concerned with per-pupil expenditures for the school lunch program including the national school milk program. Per-pupil expenditures for transportation of pupils, while representing a sizeable part of the Index, was not a dominant item.

178Fixed charges, Per-pupil expenditures for this
function increased from a low of $23.15 in 1961-62 to a high of $43.81 in 1969-70. Amounts expended on a per- pupil basis in 1967-68, 1968-69, and 1969-70 were comparable with insignificant differences noted. Per- pupil expenditures for employee benefits represented the largest expenditure item associated with this function.
ADMG-IIThe per-pupil expenditures for school systems
included in ADMG-II increased progressively from $343.93 in 1961-62 to $600.66 which represented an increase of $256.73 per-pupil during the period covered by this study.
Significant observations concerning specific functions and items in the Index as applied to ADMG-II were:
General control. Per-pupil expenditures increased from a low of $7.58 in 1961-62 to a high of $16.34 in 1968-69, and decreased slightly to $16.29 in 1969-70. It was noted that very little variation existed between the three items covered in this classification.

179Instructional services. Expenditures per-pupil
increased moderately and consistently, from a minimum of $227.40 in 1961-62 to a maximum of $393.70 in 1969-70. The most significant item in this function was salaries of classroom teachers. Comparable increases were noted for salaries of other professionals and other expenditures, with each indicating a small annual increase. Only a slight variation was indicated in the three remaining items in this classification, particularly during the last four years of the study.
Operation of plant. Increases were noted in per-pupil expenditures for this function, rising from a low of $18.68 in 1961-62 to a high of $33.61 in 1969-70. The most significant item in this function was salaries of custodial personnel. Per-pupil expenditures for all utilities indicated a consistent climb.
Maintenance of plant. Per-pupil expenditures for this function increased from $9.67 in 1961-62 to $18.72 in 1966-67. A decrease was indicated for the next two years, with an increase to $18.02 revealed for the final year of the study. The extra costs sustained during the hurricane season were revealed in amounts reported for 1966-67. Otherwise, very little variation was indicated for the items in this function.

180Auxiliary services. Per-pupil expenditures for
auxiliary services represented the second most important function in terms of amounts expended. These expenditures increased from $57*96 in 1961-62 to $75*31 in 1966-67*They remained constant for 1967-68, and increased slightly during the final two years of the study. The most significant item in this function was the school lunch program including the national school milk program. Per-pupil expenditures for transportation of pupils were becoming more dominant in this function.
Fixed charges. Per-pupil expenditures for fixed charges increased from a low of $22.64 in 1961-62 to a high of $52.55 in 1969-70. Amounts expended on a per- pupil basis in 1966-67, 1967-68, and 1968-69 were comparable; however, a more significant increase was noted for the last year of the study. The most important item in this function was expenditures for employee benefits.
ADMG-IIIPer-Pupil expenditures for school systems included
in ADMG-III increased consistently from $353*67 in 1961-62 to $558.58 in 1969-70. This represented an increase of $204.91 per-pupil for the period included in this study.

181Significant observations concerned with specific
functions and items in the Index as applied to ADMG-III were:
General control, Per-pupil expenditures increased from $6.01 in 1961-62 to $13.44 in 1969-70. Expenditures for all items in this function were stable.
Instructional services. Per-pupil expenditures for this function increased each year from a low of $227.10 in 1961-62 to a high of $360.87 in 1969-70. The most significant item, by far, was concerned with expenditures for salaries of classroom teachers. It was noted that per-pupil expenditures for this item decreased from $308.71 in 1968-69 to $301.76 in 1969-70.
Other significant items in this function were salaries of other professionals, supplies and materials for teaching, and other expenditures. Stable costs, with insignificant variations, were recorded for these items with one exception; namely, expenditures for supplies and materials for teaching which indicated a sharp rise in 1966-67, reaching an amount of $17.37 per-pupil.
Operation of plant. Increases were noted in per- pupil expenditures for this function, increasing from a

low of $17.09 in 1961-62 to a high of $29.49 in 1969-70. The most significant item in this function was salaries of custodial personnel. All utilities constituted the only other significant item in this function, with very little variation being indicated during the period covered by the study.
Maintenance of plant. Per-pupil expenditures for this function increased from $13.72 in 1961-62 to $14.60 in 1966-67, and dropped to $12.84 in 1967-6$.The amounts reported for the remaining two years were comparable to the amount indicated in 1967-6$. Expenditures for repair and upkeep of buildings and grounds including repair and replacement of equipment constituted the most significant item.
Auxiliary services. Expenditures on a per-pupil basis for auxiliary services represented the second most important function in terms of amounts expended. These expenditures increased progressively from $63,56 in 1961-62 to $9$.44 in 1969-70. The most significant item in this function was the school lunch program including the national school milk program. It was noted that per-pupil expenditures for transportation stabilized during the last three years of the study but were significantly higher than the previous two groups.

133Fixed charges. Per-pupil expenditures for this
function ranged from a minimum of $26.19 in 1961-62 to a maximum of $43.46 in 1969-70. Amounts expended on a per-pupil basis in 1967-63, 1963-69, and 1969-70 were comparable, with insignificant differences noted. Expenditures for employee benefits represented the most significant item in this function.
ADMG-IVPer-pupil expenditures for school systems included
in ADMG-IV increased significantly during each year of the study, rising from a minimum of $343.15 in 1961-62 to a maximum of $533.19 in 1969-70. This increase amounted to $240.04 per-pupil.
Significant observations concerning specific functions and items in the Index as applied to ADMG-IV were:
General control. An annual increase was noted in per-pupil expenditures, rising from $7.03 in 1961-62 to $17.55 in 1969-70. Other expenditures on a per-pupil basis constituted the most significant item in this function. Very small but consistent increases were indicated for the two remaining items included in this classification.

184Instructional services. Per-pupil expenditures
for instructional services increased moderately during each year covered by the study, rising from a low of $227*07 in 1961-62 to a high of $388.31 in 1969-70. As expected, expenditures for salaries of classroom teachers constituted the most significant item in this function. Other significant items were salaries of other professionals, supplies and materials for teaching, and other expenditures. Generally, there was little variation in per-pupil amounts expended for other items from year to year.
Operation of plant. Per-pupil expenditures for this function, as well as each separate item, indicated a very small but consistent increase annually. Over-all per-pupil expenditures increased from a low of $15*23 in 1961-62 to a high of $29.01 in 1969-70. The most significant item in this function was salaries of custodial personnel.
Maintenance of plant. Expenditures on a per-pupil basis for this function increased from $7*71 in 1961-62 to $17.07 in 1969-70. The most significant item was repair and upkeep of buildings and grounds including repair and replacement of equipment. Per-pupil expenditures for the other items in this function were

135small in amount, and the annual variations were insignificant.
Auxiliary services. Per-pupil expenditures for this function represented the second most important function in terms of amounts expended. Increases were generated in each year of the study, rising from $66.11 in 1961-62 to $94*11 in 1969-70. The most significant item identified with this classification was the school lunch program including the national school milk program, followed closely by per-pupil expenditures for pupil transportation. Per-pupil amounts for other expenditures increased from $0.95 in 1961-62 to $4*47 in 1966-67, and decreased and stabilized during the last three years of the study.
Fixed charges. Per-pupil expenditures for this function increased from a low of $24*95 in 1961-62 to a high of $42.14 in 1969-70. Amounts expended in 1966-67,1967-6$, 196$-69, and 1969-70 were comparable with insignificant differences noted. Per-pupil expenditures for employee benefits represented the largest item in this function.

186ADMG-V
Per-pupil expenditures for school systems included in ADMG-V increased substantially and consistently during the period of the study, rising from $363.35 in 1961-62 to $634.10 in 1969-70. The amount of increase was $265.75 per-pupil during the period of this study.
Significant observations concerning specific functions and items in the Index as applied to ADMG-V were:
General control. Per-pupil expenditures increased from a low of $8.67 in 1961-62 to a high of $19*05 in 1969-70. It was noted that a very small but consistent increase was indicated for each item included in this function during each year covered by the study.
Instructional services. Expenditures on a per- pupil basis for this function increased each year, rising from $235.86 in 1961-62 to $406.96 in 1969-70. Expenditures for salaries of classroom teachers constituted the most significant item in this function. Other significant items were salaries of other professionals, supplies and materials for teaching, and other expenditures, with minor increases being noted. Per-pupil variations for the remaining items were not significant.

187Operation of plant. Increases were noted in
per-pupil expenditures for this function. The minimum amount reported was $16.61 in 1961-62 while the maximum amount was $30.48 in 1969-70. The most significant item in this function was salaries of custodial personnel. Per-pupil expenditures for all utilities and other expenditures indicated an increase each year but the variations were insignificant.
Maintenance of plant. Per-pupil expenditures for this function were very stable in ADMG-V, ranging from $8.90 in 1961-62 to $18.41 in 1969-70 but showing little variation during the last four years. The three items included in this function showed an insignificant increase for the period of the study. The most significant item was repair and upkeep of buildings and grounds including repair and replacement of equipment.
Auxiliary services. Expenditures per-pupil for auxiliary services represented the second most important function in terms of amounts expended. These expenditures increased annually from a low of $72.69 in 1961-62 to a high of $112.18 in 1969-70. Unlike the four previous groups studied, the most significant item in this function was transportation. It was almost paralleled in trend and amount by the per-pupil expenditures reported for the

school lunch including the national school milk program. Other expenditures per-pupil indicated a slight variation however, the amounts were not significant.
Fixed charges. Expenditures on a per-pupil basis for this function increased from a minimum of $25.62 in 1961-62 to a high of $47.02 in 1969-70.Amounts expended in 1966-67, 1967-6$, and 1963-69 were comparable, but a significant increase was noted for 1969-70, Per-pupil expenditures for employee benefits represented the largest expenditure item associated with this function.
ADMG-VIPer-pupil expenditures for school systems
included in ADMG-VI increased from $397.09 in 1961-62 to $641.5& in 1969-70. This represented an increase of $244.49 per-pupil for the period included in this study.
Significant observations concerning specific functions and items in the Index as applied to ADMG-VI were:
General control. Per-pupil expenditures for this function increased annually from $11.4# in 1961-62 to $27.06 in 1969-70. Almost identical trends and expenditure amounts were noted for professional salaries

189and other expenditures. The variation in salaries of clerks and secretaries was insignificant.
Instructional services. Expenditures per-pupil for instructional services increased moderately during each year of the period covered by the study, increasing from a minimum of $250,39 in 1961-62 to a maximum of $397*74 in 1969-70, The most significant item in this function was salaries of classroom teachers. Other significant items were salaries of other professionals and other expenditures. It was noted that variations were indicated in expenditures for supplies and materials for teaching for each year, but the amounts were not substantial.
Operation of plant. Minor increases were noted in per-pupil expenditures for operation of the plant, rising from $16,74 in 1961-62 to $29,48 in 1969-70, The annual increase was small for the last four years covered by the study. Comparable increases were indicated for custodial salaries and all utilities.
Maintenance of plant, Per-pupil expenditures for this function increased from $8,91 in 1961-62 to $12,53 in 1967-68, remained almost static for one year, and decreased slightly to $12,20 in 1969-70, The most

190significant item in this function was repair and upkeep of buildings and grounds including the repair and replacement of equipment. The trend for this item was similar to that of the function as a whole. Expenditures per-pupil for salaries of maintenance personnel indicated a small but consistent increase.
Auxiliary services. Per-pupil expenditures for auxiliary services increased a nominal amount during each year covered by the study, rising from $82.21 in 1961-62 to $130.84 in 1969-70. This represented the second most important item in terms of amounts expended. The most significant item was transportation, with the only other significant item being the school lunch program including national school milk program. Similar trends and variations were indicated for these two items.
Fixed charges. Per-pupil expenditures for fixed charges increased from $27.36 in 1961-62 to $44.26 in 1969-70. A decrease was noted in 1968-69 but the amount was not substantial. Expenditures for employee benefits constituted the most significant item, and a small but consistent increase was noted. Other expenditures on a per-pupil basis fluctuated, but the variations in amounts during the last four years covered by the study were not significant.

1914. As a result of the analysis of data concerned
with a comparison of per-pupil expenditures in terms of varying sizes of school systems for 1961-62, 1966-67 , and 1969-70, the following summaries were warranted:
1961-62 School YearPer-pupil expenditures for current operation
ranged from a high of $397.09 in ADMG-VI to a low of $32$.45 in ADMG-I. Steady increases were noted in per- pupil expenditures, as the sizes of the school systems decreased. The State figure was $356.96 per-pupil.
Specific summary statements concerned with each expenditure function in the Index follow:
General control. Per-pupil expenditures for this function ranged from a minimum of $6.01 in ADMG-III (20,000 - 34,999) to a maximum of $11.48 in ADMG-VI (less than 5,000). The item, salaries of professional personnel, was larger on a per-pupil basis in smaller school systems and therefore, more significant, while per-pupil expenditures for salaries of clerks and secretaries were higher in the larger school systems. The optimum size school system in terms of per-pupil expenditures for general control appeared to be systems with 20,000 to 34,999 students.

192Instructional services. Per-pupil expenditures
for instructional services were highest in ADMG-VI (less than 5,000) and lowest in ADMG-I (75,000 or more). There appeared to be a tendency on the part of smaller school systems to spend more money on a per-pupil basis than the larger systems. The item concerned with salaries of classroom teachers was the most significant item in this function. Per-pupil expenditures for salaries of other professional personnel appeared to increase as the sizes of the school systems decreased. Per-pupil expenditures for such items as textbooks and supplies and materials for teaching were reasonably comparable regardless of the average daily membership. Meanwhile, larger school systems spent far more funds for salaries of clerks and secretaries serving in individual schools than did smaller school systems.
Operation of plant. Per-pupil expenditures for this function ranged from a low of $15.23 in ADMG-IV (10,000 - 19,999) to $25.67 in ADMG-I (75,000 or more). Per-pupil expenditures for custodial salaries were higher in the two largest average daily membership groups; however, there was no significant difference in the four remaining average daily membership groups. Per-pupil expenditures for utilities were less in

193ADMG-I (75,000 or more) and highest in ADMG-III (20,000 -34.999)• The differences in other expenditures were not significant. The optimum size in this function appeared to be ADMG-IV (10,000 - 19,999).
Maintenance of plant. Per-pupil expenditures in this category varied from a low of $7.71 in ADMG-IV (10,000 - 19,999), to a high of $17.96 in ADMG-I (75,000 or more). The smaller school systems had a tendency to spend less for this function than the larger school system. The item concerned with maintenance salaries was the largest item in this function for all categories, and was significantly larger in ADMG-I (75,000 or more). The optimum size of school district in this function appeared to be ADMG-IV (10,000 -19.999).
Auxiliary services. Per-pupil expenditures for this function ranged from a high in ADMG-VI (5,000 or less), of $S2.21 per-pupil to a low of $33.81 per-pupil in ADMG-I (75,000 or more). The amount of expenditures per-pupil increased as the size of the system decreased. This was also true with the item concerned with transportation, which was the largest item in this category. The school lunch program was the second largest item in this

194category, and per-pupil expenditures were lowest in ADMG-I (75,000 or more).
Fixed charges. Per-pupil expenditures for fixed charges varied slightly from group to group. The lowest per-pupil expenditure for this function was $22.64 in ADMG-II (35,000 - 74,999) while the highest per-pupil cost was $27.36 in ADMG-VI (less than 5,000). Employee benefits constituted the largest expenditure item in all average daily membership groups and had a tendency to increase as the size of the system decreased. The optimum size in this function was ADMG-II (35,000 - 74,999).
1966-67 School YearPer-pupil expenditures for current operations
ranged from a high of $535.03 in ADMG-I (75,000 or more) to a low of $477.63 in ADMG-IV (10,000 - 19,999). There was no clearly defined trend in expenditures per-pupil, but the four largest average daily membership groups decreased in expenditures as the size of the system decreased. The State average for per-pupil expenditures was $503.55.
General control. Per-pupil expenditures for this function ranged from a minimum of $3.23 in ADMG-III

195(20,000 - 34,999) to a maximum of $16.31 in ADMG-VI (less than 5,000). The item, other expenditures, was the most significant item in this function for all average daily membership groups except in ADMG-I (75,000 or more) in which the item concerned with clerks' and secretaries' salaries was larger. The optimum size school system in this category appeared to be school systems with 20,000 to 34,999 students.
Instructional services. Per-pupil expenditures for instructional services were highest in ADMG-I (75,000 or more) and lowest in ADMG-IV (10,000 - 19,999). There appeared to be no apparent trend in per-pupil expenditures in this function for the varying sizes of school districts. The item, salaries for classroom teachers, was the most dominant factor in this category. Except for ADMG-I (75,000 or more), there was a tendency for expenditures per-pupil in the other expenditure item to increase as the size of the school system decreased. Per-pupil expenditures for textbooks, supplies and materials for teaching, and other expenditures were comparable, with the exception of ADMG-I (75,000 or more). The larger school systems spent more for salaries of clerks and secretaries than did the smaller school systems.

196Operation of plant. The smallest per-pupil
expenditure was $21.34 in ADMG-III (20,000 - 34>999)> and the largest per-pupil expenditure was $34*15 in ADMG-I (75,000 or more). Per-pupil expenditures for custodial salaries were significantly higher in ADMG-I (75>000 or more), but expenditures for this item were comparable in the other average daily membership groups. There appeared to be a significant trend or comparison in the other items in this function.
Maintenance of plant. Per-pupil expenditures for this function were significantly higher in ADMG-I (75>000 or more) than in the other groupings of school systems. Expenditures ranged from a maximum of $44*67 in ADMG-I to a minimum of $12.09 in ADMG-VI (less than5,000). Maintenance salaries and other expenditures were significantly higher in ADMG-I than in the other school systems. There was a tendency for expenditures per-pupil to decrease for maintenance salaries as the sizes of the average daily membership groups decreased. There was no apparent trend in the remaining items.
Auxiliary services. Per-pupil expenditure for this function increased as the sizes of the average daily membership groups decreased. The expenditure per-pupil of $56.21 was lower in ADMG-I (75>000 or more) and was

197higher in ADMG-VI (less than 5,000) in the amount of $105*23. Generally, the school lunch program had a tendency to decrease in per-pupil expenditures as the sizes of the average daily membership groups decreased. Transportation showed a definite increase in per- pupil expenditures as the sizes of the average daily membership groups decreased* With the exception of ADMG-I, the comparison of per-pupil expenditures for other expenditures did not show significant differences between average daily membership groups.
Fixed charges. Per-pupil expenditures for this function varied from $41.37 in ADMG-VI (less than 5,000) to $34.51 in ADMG-V. The item concerned with employee benefits was the largest item in this category; however, a significant trend was not apparent. Per-pupil expenditures for other expenditures were significantly higher in ADMG-VI (less than 5,000).
1969-70 School YearPer-pupil expenditures for current operation
ranged from a maximum of $641.93 in ADMG-VI (less than5,000) to a minimum of $553.53 in ADMG-III (20,000 -34,999). There was no definitive trend indicated on a per-pupil expenditures basis for the various sizes of

198
average daily membership groups* The State average for per-pupil expenditures was $605*44*
General control. Per-pupil expenditures for this function varied from a low of $13*44 in ADMG-I (75fOOO or more) and ADMG-III (20,000 - 34»999) to a high of $27*06 in ADMG-VI (less than 5,000). Professional salaries had a tendency to increase as the sizes of the school systems decreased, while the salaries of clerks and secretaries had a tendency to decrease as the sizes of the school systems decreased.
Instructional services. Expenditures for this category varied from $424*4$ per-pupil in ADMG-I (75»000 or more) to $360.$7 per-pupil in ADMG-III (20,000 -34,999). The item concerned with classroom teachers' salaries was the most significant item in this function. The optimum size for other expenditures appeared to be ADMG-III (20,000 - 34,999). Salaries of clerks and secretaries decreased as the sizes of the school systems decreased; this was also true with expenditures for textbooks, with the exception of ADMG-VI (less than5,000). Per-pupil expenditures for other professionals, supplies and materials for teaching, and other expenditures were comparable.

199Operation of plant* Per-pupil expenditures in
this category ranged from a low of $29*01 in ADMG-IV (10,000 - 19,999) to a high of $44.97 in ADMG-I (75,000 or more). Custodial salaries constituted the most significant item in this category. Other than for school systems in ADMG-V (5,000 - 9,999), there was a trend for expenditures to increase as the sizes of the systems decreased.
Maintenance of plant. Per-pupil expenditures for this function were highest for ADMG-I (75,000 or more) in the amount of $23.33 while the lowest was $12.20 in ADMG-VI (less than 5,000). Maintenance salaries were significantly higher in ADMG-I (75,000 or more) than in the other average daily membership groups, and other expenditures were lower in ADMG-II (35,000 - 74,999).
Auxiliary services. Expenditures in this function were lowest in ADMG-I (75,000 or more), with $53•67 per- pupil, and highest for ADMG-VI (less than 5,000), with $130.34 per-pupil. Per-pupil expenditures for transportation increased as the sizes of the school systems decreased and was the most significant item, for this function, in the smaller systems. The school lunch program including the national school milk program was the dominant item for this function in the larger school systems.

200Fixed charges. Per-pupil expenditures for fixed
charges ranged from $42.14 in ADMG-IV (10,000 - 19,999) to $52.55 in ADMG-II (35,000 - 74,999). The largest item of per-pupil expenditure was employee benefits. No apparent trend was noted.
5. The data contained in this study revealed certain trends in per-pupil expenditures on a state-wide basis.
The per-pupil cost of education increased from $356.96 in l?6l-62 to $503.55 in 1966-67. There was a further increase to $605.44 in 1969-70. The total increase in per-pupil expenditures increased $243.4$ for the period included in this study.
Some observations concerning specific functions and items in the Index as applied to the State were:
General control. Per-pupil expenditures increased from $$.40 in 1961-62 to $17.51 in 1969-70. Other expenditures was the most significant item in this category and had registered the largest increase.
Instructional services. This function increased from $231.42 per-pupil in 1961-62 to $329.20 per-pupil in 1966-67 and to $393.01 per-pupil in 1969-70. This item, as in the various average daily membership groups, was the largest single function in the Index and increased

201the largest amount, $266.59 per-pupil. The item concerned with classroom teacher salaries was the most significant item in this function; however, the salaries of other professionals was also a significant item.
Operation of plant. Per-pupil expenditures for this function, while small, increased significantly for the period included in this study. In 1961-62 the per- pupil expenditures were $17.97 and increased to $32.69 in 1969-70. The largest item in this function was custodial salaries, which constituted over half of the total per-pupil expenditures.
Maintenance of plant. This function was the smallest in over-all amount in terms of per-pupil expenditures. The amount of expenditures per-pupil increased from $10.34 in 1961-62 to $13.67 in 1966-67. There was a decrease to $17.65 in 1969-70. The next increase per-pupil was $7*31 for the years included in this study. Repair and upkeep of buildings and grounds including the repair and replacement of equipment was the most significant item in this classification.
Auxiliary services. Per-pupil expenditures for this function increased from $63.99 per-pupil in 1961-62 to $33.07 per-pupil in 1966-67. There was a further increase to $93.15 per-pupil in 1969-70. The school

202lunch program including the national school milk program was the largest item in this function. Transportation, even though significant, did not increase as rapidly as the school lunch-national school milk program figure.
Fixed charges. Per-pupil expenditures for this function increased from a low of $24.&4 in 1961-62 to a high of $46.43 in 1969-70. The item concerned with employee benefits was the largest item in this function.
II. CONCLUSIONS
From data presented in this study, the following conclusions were reached:
1. The per-pupil cost of education increased significantly from 1961-62 to 1969-70.
2. The optimum size school district for general control expenditures was determined to be systems that had an enrollment of 20,000 to 34»999. Expenditures for general control were higher in the smaller school districts than in the larger school districts, and this function increased more in the smaller school districts than in the larger school districts.
3. The largest expenditure per-pupil was for instructional services and primarily classroom teachers* salaries. Classroom teacher salaries have increased

203considerably in the past ten years, but have increased even more in the larger school systems than in the smaller school systems,
4, Per-pupil expenditures for operation of the plant were higher in the larger school districts than in the smaller school districts, and generally, these expenditures increased at a more rapid rate in the larger school districts,
5, Per-pupil expenditures for maintenance of the plant increased for all school systems from 1961-62 to 1966-67; however, per-pupil expenditures for this function decreased in the larger school systems and increased in the smaller school systems in the period 1966-67 to 1969-70, The largest school system included in the study spent more for this function than did the remaining school systems,
6, Per-pupil expenditures for auxiliary services increased as the sizes of the school systems decreased, and the over-all per-pupil cost increased from 1961-62to 1969-70, This function represented the second largest per-pupil cost figure in the over-all Index,
7, Per-pupil expenditures for fixed charges were comparable for the various school systems and increased from 1961-62 to 1969-70, Employee benefits represented an extremely significant item in this function.

204d. Over-all per-pupil expenditures on a State
wide basis increased from 1961-62 to 1969-70. However, one exception was noted in terms of the six basic functions. Maintenance of the plant decreased from 1966-67 to 1969-70.

BIBLIOGRAPHY
A. BOOKS
Garvue, Robert J. Modern Public School Finance*London: The Macmillian Company, 19t>9*
Gauerke, Warren, and Jack Childress (eds.). The Theory and Practice of School Finance. Chicago: RandMoNally and Company, 19t>7«
Knezevich, Stephen J. Administration of Public School Education, Harper and Row, New York, 19&9,
Thomas, J. Alan The Productive School: A SystemsAnalysis to Educational Administration, New York: John Wiley and Sons, 1971.
B. PUBLICATIONS OF THE GOVERNMENT AND OTHER ORGANIZATIONS
State Department of Education of Louisiana, Handbook for School Administrators, Bulletin No,Revised, Baton Rouge: State Department of Education, 1966,
State Department of Education of Louisiana, Suggestions to Assist Parish and City School Superintendents in the Preparation of the Part II Annual Statistical1 Report for the 1969 Fiscal Year, Baton Rouge:State Department of Public Education. 1969*
State Department of Education of Louisiana. One Hundred Thirteenth Annual Report for the Session 19bl-b^> Part II Financial ana Statistical Report, Bulletin No. 99^7 Baton Rouge: Shelby M, Jackson, State Superintendent of Public Education, 1962.
205

206State Department of Education of Louisiana. One Hundred
“ .......... ” ~ ’’ i Session lyt>6-67,of Public Education, 19&7.
State Department of Education of Louisiana. One Hundred Nineteenth Annual Report for the Session l9t>7-fa#» Bulletin No. 1141. Baton Rouge: State Department of Education, 19&9.
State Department of Education of Louisiana. One Hundred Twentieth Annual Report for the Session 1^58-b9» Bulletin No. llbO, Baton Rouge: State Departmentof'Tuhl ic Education, 1969.
State Department of Education of Louisiana. One Hundred Twenty-First Annual Report for the Session l9fc>9-70, Bullet in No. 1188. Baton Rouge: State Department of Public Education, 1970.
United States Department of Health, Education andWelfare, Office of Education. Property Accounting for Local and State School Systems, Bulletin 19597 No. 22. Washington: United States GovernmentPrinting Office, 1966.
United States Department of Health, Education, andWelfare, Office of Education. Financial Accounting for Local and State School Systems, Standard Receipt and Expenditure Accounts, Bulletin 1957» No. 4. Washington: United States Government PrintingOffice, 1966.
United States Department of Health, Education, andWelfare, Office of Education. Staff Accounting for Local and State School Systems, Bulletin l9t>5>Mo. 18. Washington: United Suates Government Printing Office, 1966.
United States Department of Health, Education, andWelfare, Office of Education. Pupil Accounting for Local and State School Systems, Bulletin 1961,No. 39. Washington: United States Government Printing Office, 1965.
State Department

207United States Department of Health, Education, and
Welfare, Office of Education, The Common Core of State Educational Information, bulletin 1953. TToT 8, Washington: United States Government PrintingOffice, I960.
United States Department of Health, Education, and Welfare, Office of Education. Principles of Public School Accounting, State Educational Records and Reports Series: Handbook 1I U .Washington: United States Government PrintingOffice, 1967.
West's Louisiana Statutes Annotated, Revised Statutes, Volyupe Sections lfc»:l to 1? :7t>0. St. Paul:West's Publishing Company, 19&3*
C. PERIODICALS
Doherty, James, "Cost of Education Index," School Management, XI:1, January, 1967*
Fumo, Orlando F., "Cost of Education Index," School Management, VI:1, January, 1962.
D. UNPUBLISHED MATERIAL
School Management Magazine. Personal Correspondencebetween Paul Cuneo, Editor, and the writer, March S,1971.
Summary of Reports of Parish and City School Systems of Louisiana, Louisiana State Department of Education, 196S.
United States Department of Health, Education andWelfare, Office of Education. Third Draft Standard Terminology for Instruction in Local and State School Systems, An Analysis of Instructional Content, Resources, and Processes, State Educational Records and Reports Series: Handbook VI (PreliminarylEditionJ for Selected Distribution, 1969.
APPENDIX
208
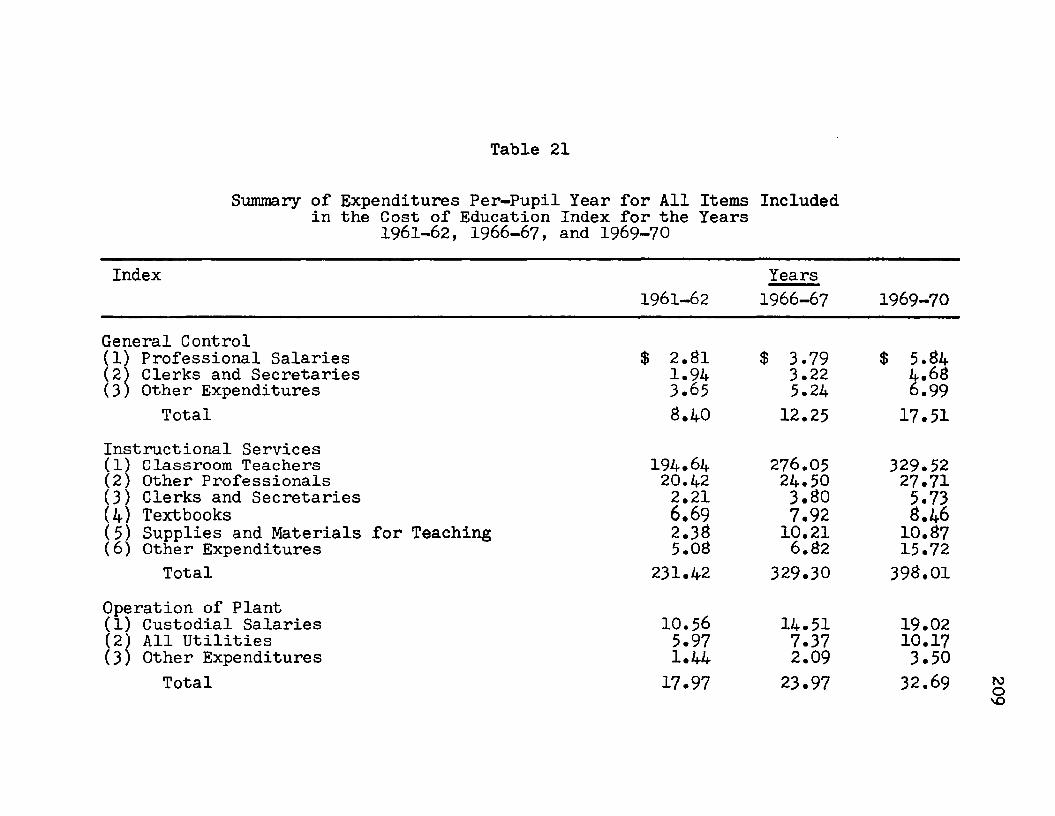
Table 21
Summary of Expenditures Per-Pupil Year for All Items Included in the Cost of Education Index for the Years
1961-62, 1966-67, and 1969-70Index
1961-62Years1966-67 1969-70
General Control(1) Professional Salaries $ 2.Si $ 3.79 $ 5.84(2) Clerks and Secretaries 1.94 3.22 4.68(3) Other Expenditures 3.65 5.24 6.99
Total 8.40 12.25 17.51Instructional Services(1) Classroom Teachers 194.64 276.05 329.52(2) Other Professionals 20.42 24.50 27.71(3) Clerks and Secretaries 2.21 3.SO 5.73(4) Textbooks 6.69 7.92 8.46(5) Supplies and Materials for Teaching 2.38 10.21 10.87(6) Other Expenditures 5.08 6.82 15.72
Total 231.42 329.30 398.01Operation of Plant(1) Custodial Salaries 10.56 14.51 19.02(2) All Utilities 5.97 7.37 10.17(3) Other Expenditures 1.44 2.09 3.50
Total 17.97 23.97 32.69 209

Table 21 (continued)
Index1961-62
Years1966-67 1969-70
Maintenance of Plant(1) Maintenance Salaries $ 4.17 $ 5.31 $ 6.63(2) Repair and Upkeep of Buildings & Grounds
Including Repair and Replacement of Equipment 6.OB 10.37 10.56(3) Other Expenditures .09 2.99 .46
Total 10.34 IB. 67 17.65Auxiliary Services(1) Transportation 27.01 32.73 37.56(2) School Lunch Including the National
School Milk Program 35.67 46.67 52.54(3) Other Expenditures 1.31 3.67 3.05Total 63.99 B3.07 93.15
Fixed Charges(1) Employee Benefits 21.76 30.85 39.50(2) Other Expenditures 3.OB 5.44 6.93
Total 24. B4 36.29 46.43Grand Total $356.96 $503.55 $605.44
210

Table 22
Distribution of Parish and City School Systems of Louisianain Terms of Average Daily Membership in 1961-62
Group 1— 75,000 or More1. OrleansGroup 2-35,000-74,9991. Caddo2. East Baton Rouge3. Jefferson
Sub TotalGroup 3— 20,000-34,9991. Calcasieu2. Rapides
Sub TotalGroup 4— 10,000-19,9991. Bossier2. Iberia3 • Lafayette4. Lafourche5. Ouachita6. St. Landry
ADM92,436.3
51,190.043.172.537.408.6136,771.1
27,800.122.919.850.719.9
14.006.5 12,014.8 16,615.3 13,166.9 15,132.219.949.5
Group 4 (continued)7. St. Mary8. Tangipahoa9. Terrebonne
10. WebsterSub Total
Group 5— 5,000-9,9991. Acadia2. Allen3. Ascension4. Avoyelles5. Beauregard6. Concordia7. DeSoto8. Evangeline9. Franklin
10. Iberville11. Jefferson Davis12. Lincoln13. Livingston14. Morehouse
ADM11,649.214.733.1 15,109.410.229.2142,606.1
9.829.85.247.1 6,667.48.327.1 5,364.05.985.26.937.68.002.87.533.2 7,483.97.317.26.108.67.633.2 9,479.8

Table 22 (continued)
Group 5 (continued) ADM Group 6 (continued) ADM15. Natchitoches 8,480.4 11. LaSalle 3,371.816. Plaquemines 5,413.3 12. Madison 4,559.017. Pointe Coupee 5,717.0 13. Red River 2,756.818. Richland 7,110.2 14. Sabine 4,624.819. St. Bernard 7,848.5 15. St. Helena 2,797.320. St. Charles 5,169.6 16. St• James 4,869.421. St. Martin 6,544.2 17. St. John 4,225.522. St. Tammany 9,282.6 18. Tensas 3,642.623. Vermilion 8,036.6 19. Union 4,770.324. Vernon 5,202.8 20. West Baton Rouge 3,834.725. Washington 5,924.6 21. West Carroll 4,074.926. City of Bogalusa 6,250.6 22. West Feliciana 2,761.027. City of Monroe 9,717.7 23. Winn 3,884.5
Sub Total 192,615.0 24. City of Lake Charles 4,867.4Sub Total 91,214.9Group 6— Less than 5>000
1. Assumption 4,401.4 Grand Total 706,413.32. Bienville 4,390.53. Caldwell 2,351.04. Cameron 1,543.25. Catahoula 3,246.46. Claiborne 4,296.77. East Carroll 4,160.08. East Feliciana 4,010.79. Grant 3,651.110. Jackson 4,123.9

Table 23
Distribution of Parish and City School Systems of Louisianain Terms of Average Daily Membership in 1966-67
Group 1— 75,000 or More 1, OrleansGroup 2-35,000-74,9991. Caddo2. East Baton Rouge3. Jefferson
Sub TotalGroup 3— 20,000-34,9991. Calcasieu2. Lafayette 3• Rapides4. St. Landry
Sub TotalGroup 4— 10,000-19,9991. Acadia2. Bossier3. Iberia
ADM106,044.7
57,574.053,946.450,166.7
166,637.1
31,121.123,142.325,904.622,133.5
102,306.5
11,562.016,501.914,100.3
Group 4 (continued)4. Lafourche5. Ouachita6. St. Bernard7. St. Mary3. St. Tammany9. Tangipahoa10. Terrebonne11. Webster12. City of Monroe
Sub TotalGroup 5— 5,000-9,9991. Allen2. Ascension3. Avoyelles4. Beauregard5. Concordia6. DeSoto7. Evangeline
Franklin
ADM15,013.917.236.010.723.014.643.214.439.016.650.3 13,376.710.544.3 10,332.2
170,733.3
5.566.33.502.1 3,340.7 6,039.56.777.26.659.43.923.4 7,419.1
HV*J

Table 23 (continued)
Group 5 (continued) ADM9. Iberville 8,166.9
10. Jefferson Davis 7,633.711. Lincoln 6,431.912. Livingston 8,896.413. Morehouse 9,637.314. Natchitoches 3,841.915. Pointe Coupee 6,151.816. Richland 6,861.617. St. Charles 7,209.3IS. St. James 5,406.219. St. John 5,362.320. St. Martin 7,877.221. Vermilion 9,132.922. Vernon 7,632.423. Washington 6,338.624. City of Bogalusa 6,248.5
Sub Total 176,606.6Group 6— Less than 5,0001. Assumption 4,897.42. Bienville 4,217.83. Caldwell 2,307.04. Cameron 1,770.25. Catahoula 3,515.86. Claiborne 4,375.3
Group 6 (continued) ADM7. East Carroll 4,174.58. East Feliciana 4,186.99. Grant 3,574.110. Jackson 4,052.411. LaSalle 3,417.912. Madison 4,887.213. Plaquemines 3,855.414. Red River 2,641.215. Sabine 4,523.516. St. Helena 2,921.117. Tensas 3,367.118. Union 4,814.919. West Baton Rouge 4,567.020. West Carroll 3,768.921. West Feliciana 2,698.722. Winn 3,987.923. City of Lake Charles 4,992.9
Sub Total 87,515.1Grand Total 809,948.8

Table 24Distribution of Parish and City School Systems of Louisiana
in Terms of Average Daily Membership in 1967-63
Group 1— 75,000 or More 1. OrleansGroup 2-35,000-74,9991. Caddo2. Calcasieu3. East Baton Rouge4. Jefferson
Sub TotalGroup 3-20,000-34,9991. Lafayette2. Rapides3. St. Landry
Sub TotalGroup 4— 10,000-19,9991. Acadia2. Bossier3. Iberia4• Lafourche
ADM107,204.0
59.430.737.543.061.211.155.032.7
213,272.5
24.356.426.360.422.057.573,274.3
11,230.417,351.314,499.215,373.7
Group 4 (continued)5. Ouachita6. St. Bernard7. St. Mary3. St. Tammany9. Tangipahoa10. Terrebonne11. Webster12. City of Monroe
Sub TotalGroup 5-5,000-9,9991. Allen2. Ascension3. Assumption4. Avoyelles5. Beauregard6. Concordia7. DeSoto3. Evangeline9. Franklin10. Iberville
ADM17.409.611.202.713.547.215.379.316.673.719.344.411.104.5 11,021.0
174,642.0
5.665.53.993.65.039.29.232.36.093.3 6,390.16.541.93.352.37.305.93.237.7

Table 24 (continued)
Group 5 (continued) ADM Group 6 (continued) ADM11. Jefferson Davis 7,713.3 7. East Feliciana 4,225.512. Lincoln 6,766.2 6. Grant 3,554.213. Livingston 9,247.6 9. Jackson 3,904.614. Morehouse 9,476.5 10. LaSalle 3,333.215. Natchitoches 9,293.5 11. Madison 4,400.716. Pointe Coupee 6,095.7 12. Plaquemines 4,190.517. Richland 6,671.6 13. Red River 2,610.1IS. St. Charles 7,576.1 14. Sabine 4,507.119. St. James 5,242.9 15. St. Helena 2,970.920. St. John 5,790.4 16. Tensas 3,316.921. St. Martin 6,090.4 17. Union 4,796.622. Vermilion 9,394.6 10. West Baton Rouge 4,710.923. Vernon 7,952.5 19. West Carroll 3,730.024. Washington 6,151.9 20. West Feliciana 2,631.325. City of Bogalusa 6,105.1 21. Winn 3,960.5
Sub Total 164,560.6 Sub Total 77,601.1Group 6— Less than 5,000 Grand Total 030,654.71. Bienville 4,479.02. Caldwell 2,297.93. Cameron 1,660.94. Catahoula 3,609.95. Claiborne 4,412.16. East Carroll 4,066.1

Table 25
Distribution of Parish and City School Systems of Louisianain Terms of Average Daily Membership in 1968-69
Group 1— '75,000 or More 1. OrleansGroup 2-35,000-74,9991. Caddo2. East Baton Rouge3. Jefferson4. Calcasieu
Sub TotalGroup 3-20,000-34,9991. Lafayette 2* Rapides3. St. Landry4. Terrebonne
Sub TotalGroup 4-10,000-19,9991. Acadia2. Bossier3. Iberia
ADM 108,6S2.9
59.953.3 63,467.159.349.3 33,633.5
221,453.2
26,S3 5.623.521.6 22,460.520.235.793,103.4
11.557.013.167.0 14,376,3
Group 4 (continued)4. Lafourche5. Ouachita6. St. Bernard7. St. Mary8. St. Tammany9. Tangipahoa10. Webster11. City of Monroe
Sub TotalGroup 5— 5,000-9,99*1. Allen2. Ascension3. Assumption4. Avoyelles5. Beauregard6. Concordia7. DeSoto8. Evangeline9. Franklin
10. Iberville
AIM17.203.317.765.9 11,796.615.776.015.836.9 17,089.210.414.011.049.4
161,537.1
5.813.19.415.55.214.79.328.36.430.56.789.76.302.2 8,894.17.329.38.447.6

Table 25 (continued)
Group 5 (continued) ADM Group 6 (continued) AIM11. Jefferson Davis 7,967.9 6. East Carroll 4,036.612. Lincoln 6,831.8 7. East Feliciana 4,292.313. Livingston 9,663.8 8. Grant 3,817.514. Morehouse 9,308.8 9. Jackson 3,884.515. Natchitoches 9,279.5 10. LaSalle 3,295.216. Plaquemines 5,080.9 11. Madison 4,480.617. Pointe Coupee 5,992.9 12. Red River 2,491.018. Richland 6,735.3 13. Sabine 4,505.719. St. Charles 8,019.0 14. St. Helena 3,047.420. St. James 5,212.3 15. Tensas 3,251.521. St. John 6,522.7 16. Union 4,954.422. St. Martin 8,609.5 17. West Baton Rouge 4,794.323. Vermilion 9.728.8 18. West Carroll 3,752.524. Vernon 8,083.9 19. West Feliciana 2,456.825. Washington 5,932.4 20. Winn 3,897.626. City of Bogalusa 5,946.8 Sub Total 74,034.1Sub Total 192,881.3
Grand Total 856,692.0Group 6— -Less than 5,0001. Bienville 4,546.82. Caldwell 2,478.83. Cameron 1,975.44. Catahoula 3,575.55. Claiborne 4,499.7

Table 26
Distribution of Parish and City School Systems of Louisianain Terns of Average Daily Membership in 1969-70
Group 1— 75,000 or More 1. OrleansGroup 2— 35,000-74,9991. Caddo2. Calcasieu3. East Baton Rouge4. Jefferson
Sub TotalGroup 3— 20,000-34,9991, Lafayette2.3.
Rapides Terrebonne
Sub TotalGroup 4— 10,000-19,9991, Acadia2. Bossier 3• Iberia
k m
109,173,1
57.354.2 39,197.665.057.260.212.2
221,621.4
27.769.6 28,160.920.439.776,410.4
11,465.7 18,614.6 14,444*6
Group 4 (continued)4. Lafourche5. Ouachita6. St. Bernard7. St. Landry8. St. Mary9 • St. Tammany
10. Tangipahoa11. Webster12. City of Monroe
Sub TotalGroup 5-5,000-9,9991. Allen2. Ascension3. Assumption4. Avoyelles5• Beauregard6. Concordia7. DeSoto8. Evangeline9. Franklin
ADM18,546.617.541.613.193.819.728.915.400.715.694.514.799.810.347.5 10,640.1180,438.4
5.874.38.350.3 5,400.89.664.06.557.3 6,659.6 5,820.55.932.07.198.0

Table 26
Group 5 (continued)10. Iberville11. Jefferson Davis12. Lincoln13. Livingston14. Morehouse15. Natchitoches16. Richland17. St. Charles18. St. James19. St. John20. St. Martin21. Vermilion22. Vernon23. Washington24. City of Bogalusa
Sub TotalGroup 6— 5>000 or Less1. Bienville2. Caldwell 3* Cameron 4* Catahoula
ADM3,241.77,761.56.636.49.393.53.933.33.693.36.412.33.139.95.161.36.235.93.647.99.714.23.454.35.165.4 5,357.3
174,971.5
4,452.52,473.82.210.43.521.4
(continued)
Group 6 (continued) ACM5. Claiborne 4,525.36. East Carroll 3,304.47. East Feliciana 4,053.78. Grant 3,855.89. Jackson 3,726.910. LaSalle 3,323.511. Madison 3,924.912. Plaquemines 4,624.713. Pointe Coupee 4,111.214. Red River 2,489.015. Sabine 4,470.916. St. Helena 2,910.217. Tensas 3,138.618. Union 4,748.619. West Baton Rouge 2,310.420. West Carroll 3,696.221. West Feliciana 2,353.122. Winn 3,967.1
Sub Total 78,697.6Grand Total 841,512.4
220

Table 27
Comparison of Expenditures for General Control, Professional Salaries
Year Item Group 1 Group 2 Group 3 Group 4
1961-62 Expenditure Per Year Per Day
$219,493.152.37.013
$320,950.452.35.013
$93,731.421.95.011
$326,140.302.29.013
1966-67 Expenditure Per Year Per Day
360,005.133.40.019
569,147.323.42.019
240,703.392.35.013
612,357.793.59.020
1967-63 Expenditure Per Year Per Day
427,690.133.99.022
319,295.273.35.021
243,377.753.32.013
756,215.314.33.024
1963-69 Expenditure Per Year Per Day
330,666.223.04.017
949,963.444.29.024
415,799.334.24.024
707,306.904.33.024
1969-70 Expenditure Per Year Per Day
378,823.053.47.019
1,101,265.124.96.023
350,344.234.59.026
928,506.345.15.029

Table 27 (continued)
Year Item Group 5 Group 6 Total
1961-62 Expenditure Per Year Per Day
$5&9,079.48 3.06 .017
$423,079.254.69.026
$1,982,524.052.81.0161966-67 Expenditure
Per Year Per Day
703,393.544.01.022
579,437.896.62.037
3,070,050.063.79.021
1967-63 Expenditure Per Year Per Day
933,696.355.36.030
663,395.608.54.047
3,898,670.964.69.026
1963-69 Expenditure Per Year Per Day
1,200,072.156.22.035
720,729.059.74.054
4,325,042.595.05.023
1969-70 Expenditure Per Year Per Day
1,226,225.327.01.039
931,112.0211.83.066
4,916,776.035.84.032
222

Table 28
Comparison of Expenditures for General Clerks and Secretaries
Control,
Year Item Group 1 Group 2 Group 3 Group 4
1961-62 Expenditure Per Year Per Day
$496,323.085.37.030
$193,431.801.41.008
$48,741.53.96.005
$203,568.331.42.0081966-67 Expenditure Per Year
Per Day778,545.47
7.34 .041
703,369.594.22.023
206,138.212.01.011
350,892.612.05.011
1967-68 Expenditure Per Year Per Day
931,021.218.68.0481,035,225.83 4.86
.027232,761.053.18
.018428,004.10
2.45.014
1968-69 Expenditure Per Year Per Day
772,454.527.11.040
1,333,158.846.02.033
256,199.802.61.015
438,753.222.72.015
1969-70 Expenditure Per Year Per Day
793,412.297.27.040
1,386,718.316.25.035
234,263.243.07.017
670,085.053.71.021
10fOVjJ

Table 28 (continued)
Year Item Group 5 Group 6 Total
1961-62 Expenditure Per Year Per Day
$298,112.05 1.55.009
$129,935.101.43.003
$1,370,111.891.94.011
1966-67 Expenditure Per Year Per Day
339,957.112.21.012131,253.33
2.07.0122,260,161.373.22.018
1967-68 Expenditure Per Year Per Day
440,450.952.39.013
172,545.302.22.012
3,240,008.943.90.022
1968-69 Expenditure Per Year Per Day
561,818.452.92.016
185,369.612.51.014
3,548,254.444.14.023
1969-70 Expenditure Per Year Per Day
594,332.373.40.019
255,260.563.24.018
3,934,571.824.68.026

Table 29
Comparison of Expenditures for General Control, Other Expenditures
Year Item Group 1 Group 2 Group 3 Group 4
1961-62 Expenditure Per Year Per Day
$149,811.911.62.009
$521,810.263.82.021
$157,277.573.10.017
$480,475.383.37.019
1966-67 Expenditure Per Year Per Day
241,981.832.28.013
920,811.635.52.031
395,548.853.87.022
894,182.595.24.029
1967-63 Expenditure Per Year Per Day
340,868.713.18.0181,235,109.36
5.79.032292,395.41
3.99.022998,486.12
5.72.0321968-69 Expenditure
Per Year Per Day
199,423.591.83.010
1,334,439.756.03.034
468,353.844.77.027
1,045,905.576.47.036
1969-70 Expenditure Per Year Per Day
295,439.162.70.015
1,126,331.915.08.028
441,474.165.78.032
1,567,602.818.69.048
1010VJ1

Table 29 (continued)
Year Item Group 5 Group 6 Total
1961-62 Expenditure Per Year Per Day
$783,477.104.06.023
$488,880.945.36.030$2,581,733.16
3.65.0201966-67 Expenditure
Per Year Per Day
1,121,532.646.35.035
666,955.827.62.0424,241,013.36
5.24.029
1967-68 Expenditure Per Year Per Day
1,258,389.836.81.038
667,324.048.59.048
4,792,573.475.77.032
1968-69 Expenditure Per Year Per Day
1,518,571.857.87.044
687,567.07 9.2 8 .052
5,255,261.676.13.034
1969-70 Expenditure Per Year Per Day
1,511,766.868.64.048
943,522.8211.99
.0675,886,137.72
6.99.039
10roOx

Table 30
Comparison of Expenditures for General Control,Total
Year Item Group 1 Group 2 Group 3 Group 4
1961-62 Expenditure Per Year Per Day
$865,628.149.36.052
$1,036,192.517.58.042
$304,800.526.01.033
$1,010,184.017.08.039
1966-67 Expenditure Per Year Per Day
1,330,532.4313.02.072
2,193,328.5413.16.073
842,395.45 8.23 .046
1,857,432.9910.88.060
1967-68 Expenditure Per Year Per Day
1,699,580.1015.85.088
3,089,630.4614.50
.081768,534.21
10.49.0582.182,706.0312.50
.0691968-69 Expenditure
Per Year Per Day
1,302,544.3311.98.067
3,617,567.0316.34
.0911,140,353.4711.62
.0652,192,465.69
13.57.075
1969-70 Expenditure Per Year Per Day
1,467,674.5013.44
.0753,614,315.34
16.29.091
1,026,581.6313.44
.0753,166,194.20
17.55.098
10N>

Table 30 (continued)
Year Item Group 5 Group 6 Total
1961-62 Expenditure Per Year Per Day
$1,670,663.633.67.04S
$1,046,395.29 11.43 .064
$5,934,369.103.40.047
1966-67 Expenditure Per Year Per Day
2,219,333.29 12.57 .070
1,427,652.0916.31.091
9,921,224.7912.25.0681967-63 Expenditure
Per Year Per Day
2,637,537.1314.56.031
1,503,265.4419.35.108
11,931,253.3714.36.080
1963-69 Expenditure Per Year Per Day
3,230,462.4517.01.095
1,594,165.7321.53.120
13,128,553.7015.32
.0851969-70 Expenditure
Per Year Per Day
3,332,324.5519.05.106
2,129,395.4027.06.150
14,737,435.6217.51
.097
1010CO.

Table 31
Comparison of Expenditures for Instructional Services, Classroom Teachers' Salaries
Year Item Group 1 Group 2 Group 3 Group 4
1961-62 Expenditure Per Year Per Day
$16,463,353.6317s.00 .939
$26,144,418.96191.161.06$9,793,061.60
193.081.07
$27,427,344.27192.33
1.071966-67 Expenditure
Per Year Per Day
30,576,719.72233.341.60
46,344,856.27278.03
1.5423,317,802.08
276.791.54
45,038,945.65263.71
1.471967-63 Expenditure
Per Year Per Day
38,209,356.94356.421.98
64,497,502.06302.42
1.6322,191,236.19
302.351.63
50,214,420.93287.531.60
1963-69 Expenditure Per Year Per Day
37,562,370.00345.621.92
70,305,636.02319.731.78
30,235,150.33303.71
1.7248,698,038.63
301.471.67
1969-70 Expenditure Per Year Per Day
37,664,639.91345.001.92
73,984,456.47333.53
1.8523,057,364.48
301.761.63
58,202,928.94322.561.79
229

Table 31 (continued)
Year Item Group 5 Group 6 Total
1961-62 Expenditure Per Year Per Day
$38,437,326.49199.821.11
$19,182,527.52210.301.17
$137,493,532.47194.641.03
1966-67 Expenditure Per Year Per Day
48,913,121.14276.961.54
24,393,038.00278.79
1.55223,539,432.86
276.051.54
1967-63 Expenditure Per Year Per Day
56,560,140.31306.421.7023,378,434.57
300.951.67
255,051,091.00307.05
1.711968-69 Expenditure
Per Year Per Day
60,661,537.98314.50
1.7522,970,719.19
310.271.72270,984,002.15
316.311.76
1969-70 Expenditure Per Year Per Day
58,640,364.78335.141.86
25,743,447.86327.121.82
277,293,202.44329.521.83
fOvoo

Table 32
Comparison of Expenditures for Instructional Services,Salaries of Other Professionals
Year Item Group 1 Group 2 Group 3 Group 4
1961-62 Expenditure Per Year Per Day
$1,663,211.1313.04.100
$2,475,034.7213.10
.101$923,220.9313.20.101
$2,777,470.2419.47.103
1966-67 Expenditure Per Year Per Day
2,656,073.3325.05
.1393,525,630.40
21.15.117
2,190,310.0221.41
.1194,036,146.17
23.93.133
1967-63 Expenditure Per Year Per Day
2,799,333.1026.12.145
4,973,919.7123.35.130
1,671,271.7722.31.127
4,524,374.6225.91
.1441963-69 Expenditure
Per Year Per Day
2,971,959.3927.35.152
5,226,422.1623.60
.1312,219,049.9422.62.126
4,303,556.2526.67.143
1969-70 Expenditure Per Year Per Day
2,344,045.2726.05
.1455,701,143.34
25.70.143
1,675,239.1921.92.1224,367,347.2426.93.150
roVjJ

Table 32 (continued)
Year Item Group 5 Group 6 Total
1961-62 Expenditure Per Year Per Day
$4,213,742.5021.88
.122$2,364,386.41
25.93.144
$14,422,565.9320.42
.1131966-67 Expenditure
Per Year Per Day
4,704,354#3226.64.143
2,680,246.8330.62.17019,843,311.07
24.50.136
1967-63 Expenditure Per Year Per Day
5,137,021.0627.33
.1552,566,841.68
33.04.184
21,678,311.9426.10.145
1963-69 Expenditure Per Year Per Day
5,530,775.4328.94.161
2,565,204.1734.65
.19322,871,967.3426.70
.1481969-70 Expenditure
Per Year Per Day
5,341,354.1430.53
.1752,885,807.04
36.67.204
23,315,991.7227.71
.154
toto

Table 33
Comparison of Expenditures for Instructional Services, Clerks and Secretaries' Salaries
Year Item Group 1 Group 2 Group 3 Group 4
1961-62 Expenditure Per Year Per Day
$561,661.99 6.07 .03 4
$513,445.643.79.021
$109,3$4.43 2.17 .012
$176,048.781.23.007
1966-67 Expenditure Per Year Per Day
322,030.037.75.043
1,036,946.636.22.035
269,341.602.63.015
446,366.24 2.61 .015
1967-63 Expenditure Per Year Per Day
377,333.143.13.045
1,361,099.396.33.035
342,032.994.67.026
564,106.583.23.018
1963-69 Expenditure Per Year Per Day
1,133,332.2510.43
.0571,496,761.306.76
.033443,123.344.52
.025554,551.42
3.37.019
1969-70 Expenditure Per Year Per Day
1,147,247.4910.51.053
1,731,127.427.30.043
390,083.645.11.028
780,933.854.33.024
JO

Table 34
Comparison of Expenditures for Instructional Services,Textbooks
Year Item Group 1 Group 2 Group 3 Group 4
1961-62 Expenditure Per Year Per Day
$623,171.436.74.037
$399,055.976.57.037
$341,837.506.74.037
$956,337.936.71.037
1966-67 Expenditure Per Year Per Day
1,074,657.6610.13
.0571,334,460.15
3.31.046776,730.35
7.59.0421,274,314.89
7.46.042
1967-63 Expenditure Per Year Per Day
1,040,746.009.71.054
1,645,114.967.71.043
547,204.567.47.042
1,246,746.407.14.040
1963-69 Expenditure Per Year Per Day
1,134,717.6610.44.053
1,332,401.308.50.047
772,699.967.88.044
1,247,549.367.72.043
1969-70 Expenditure Per Year Per Day
1,119,462.2410.25
.0571,913,331.56
8.63.048
616,987.208.07.045
1,454,542.488.06.045
10VjJvn

Table 34 (continued)
Year Item Group 5 Group 6 Total
1961-62 Expenditure Per Year Per Day
$1,284,041.706.67.037
$624,432.066.84.033
$4,728,876.596.69.037
1966-67 Expenditure Per Year Per Day
1,263,500,707.15.040
639,994.447.31.041
6,413,658.197.92.044
1967-68 Expenditure Per Year Per Day
1,277,227.766.92.038533,566.00
6.87.0386,290,605.68
7.57.0421968-69 Expenditure
Per Year Per Day
1,471,300.247.63.042
535,086.807.23.040
7,043,755.328.22.0461969-70 Expenditure
Per Year Per Day
1,379,239.047.38.044
639,525.648.13.045
7,123,088.168.46.047

Table 35
Comparison of Expenditures for Instructional Services, Supplies and Materials for Teaching
Year Item Group 1 Group 2 Group 3 Group 4
1961-62 Expenditure Per Year Per Day
$264,933.842.87.016
$406,777.752.97.017
$134,052.332.64.015
$353,190.352.48.014
1966-67 Expenditure Per Year Per Day
369,645.863.49.019
1,525,757.399.15.051
1,776,734.7217.37
.0971,735,668.1910.46.058
1967-68 Expenditure Per Year Per Day
2,552,155.5523.80.1322,045,308.53
9.59.053
711,270.539.70.054
2,157,927.5212.35
.0691968-69 Expenditure
Per Year Per Day
2,035,642.7418.72.104
2,497,130.0011.28.063
628,301.076.40.036
2,577,180.2115.95
.0891969-70 Expenditure
Per Year Per Day
1,364,329.9712.50.069
1,760,724.$1 7.94 • 044
776,453.9010.16.056
1,936,155.1710.73.060

Table 35 (continued)
Year Item Group 5 Group 6 Total
1961-62 Expenditure Per Year Per Day
$382,388.551.98.011$139,212.14
1.53.009
$1,680,554.962.38.013
1966-67 Expenditure Per Year Per Day
1,758,944.009.96.055
1,049,557.7312.00.067
8,266,307.8910.21.057
1967-68 Expenditure Per Year Per Day
2,312,739.0412.53.070
763,682.039.83.055
10,543,083.2012.69
.0711968-69 Expenditure
Per Year Per Day
2,999,686.5515.55.086
742,308.2910.03.056
11,480,248.8613.40
.0741969-70 Expenditure
Per Year Per Day
2,695,456.7315.41.086
616,048.117.83.044
9,149,168.6910.87.060
rov*>oa

Table 36
Comparison of Expenditures for Instructional Services,Other Expenditures
Year Item Group 1 Group 2 Group 3 Group 4
1961-62 Expenditure Per Year Per Day
$626,883.796.78.038$658,219.66
4.81.027
$216,880.184.27.024
$691,474.84-.4.85.027
1966-67 Expenditure Per Year Per Day
1,105,279.9810.42.058
1,367,733.038.21.046
628,538.566.15.034
993,150.985.81.032
1967-68 Expenditure Per Year Per Day
1,231,976.5011.49.064
1,993,154.359.34.052
541,441.887.39.041
1,284,178.697.35.041
1968-69 Expenditure Per Year Per Day
1,859,780.9217.11
.0952,586,470.0411.68
.0651,001,780.80
10.21.057
1,657,141.4310.27
.0571969-70 Expenditure
Per Year Per Day
2,201,935.3820.17.112
3,348,180.6215.10.084
1,058,182.6913.85
.0772,824,050.18
15.65.087
239

Table 36 (continued)
Year Item Group 5 Group 6 Total
1961-62 Expenditure Per Year Per Day
$#96,267.364.65.026
$497,098.945.45.030
$3,586,824.775.08.028
1966-67 Expenditure Per Year Per Day
964,045.805.46.030
466,899.015.34.030
5,525,647.366.82.038
1967-6# Expenditure Per Year Per Day
1,145,416.506.21.035
660,768.978.51.047
6,856,936.898.25.046
196#-69 Expenditure Per Year Per Day
1,754,074.109.09.051
819,109.4611.06.0619,678,356.75
11.31.0631969-70 Expenditure
Per Year Per Day
2,564,103.2114.65.081
1,229,263.3715.62.087
13,225,715.4515.72
.087
240

Table 37
Comparison of Expenditures for Instructional Services,Total
Year Item Group 1 Group 2 Group 3 Group 4
1961-62 Expenditure Per Year Per Day
$20,208,215.31218.501.21
$31,101,952.70227.401.26
$11,518,936.97227.101.26$32,381,866.41
227.071.261966-67 Expenditure
Per Year Per Day
36,604,406.58345.18
1.9255,185,433.87
331.071.84
33,959,457.33331.94
1.3453,624,592.12
313.981.74
1967-68 Expenditure Per Year Per Day
46,711,456.23435.722.42
76,521,099.00358.79
1.9926,004,457.92
354.891.97
59,991,754.74343.51
1.911968-69 Expenditure
Per Year Per Day
46,698,302.96429.67
2.3984,494,870.82
381.552.1235,350,105.94
360.342.0059,033,017.30
365.452.03
1969-70 Expenditure Per Year Per Day
46,341,660.26424.482.36
88,438,969.72398.702.22
27,574,366.10360.872.00
70,066,457.86388.312.16

Table 37 (continued)
Year Item Group 5 Group 6 Total
1961-62 Expenditure Per Year Per Day
$45,429,600,47235,361.31
$22,839,576.12250.39
1.39$163,480,148.48
231.421.29
1966-67 Expenditure Per Year Per Day
57,938,573.10328.351.82
29,358,491.27335.471.86
266,720,954.27329.301.83
1967-68 Expenditure Per Year Per Day
66,868,471.00362.272.01
28,035,069.91360.902.01304,132,308.80
366.132.03
1968-69 Expenditure Per Year Per Day
73,013,786.90378.542.10
27,770,374.94375.102.08326,360,458.86
380.962.121969-70 Expenditure
Per Year Per Day
71,207,124.78406.962.26
31,301,209.67397.742.21
334,929,788.39398.012.21
*o-F-W

Table 38
Comparison of Expenditures for Operation of Plant,Custodial Salaries
Year Item Group 1 Group 2 Group 3 Group 4
1961-62 Expenditure Per Year Per Day
$1,795,964.5819.42
.103$1,463,354.6610.70
.059$425,742.198.40
.047$1,226,436.708.60.048
1966-67 Expenditure Per Year Per Day
2,816,383.6426.56.1482,471,970.04
14.83.0821,234,590.81
12.07.067
2,059,854.3912.06.067
1967-68 Expenditure Per Year Per Day
3,175,505.1529.62.165
3,490,341.0416.37
.0911,111,732.68
15.17.084
2,434,517.2813.94
.0771968-69 Expenditure
Per Year Per Day
3,352,148.4130.85
.1713,836,579.14
17.32.096
1,547,308.2815.77.088
2,281,756.0614.13
.0791969-70 Expenditure
Per Year Per Day
3,612,413.5933.09
.1844,294,427.3119.36.108
1,330,271.1317.41
.0972,867,051.22
15.89.088
l\3■£-VjJ

Table 33 (continued)
Year Item Group 5 Group 6 Total
1961-62 Expenditure Per Year Per Day
$1,723,317.633.97.050
$817,621.733.96.050
$7,457,937.5410.56.059
1966-67 Expenditure Per Year Per Day
2,035,333.9911.53.064
1,132,419.6912.94.072
11,751,107.5614.51.081
1967-63 Expenditure Per Year Per Day
2,369,275.0512.34
.0711,044,963.46
13.45 .075
13,626,334.6616.40
.0911963-69 Expenditure
Per Year Per Day
2,596,373.0113.46
.0751,054,195.92
14.24.079
14,668,865.8217.12
.0951969-70 Expenditure
Per Year Per Day
2,799,666.5916.00.089
1,099,536.8513.97.073
16,003,416.6919.02
.106
*1*1Z

Table 39
Comparison of Expenditures for Operation of Plant, All Utilities Including Heat and Fuel
Year Item Group 1 Group 2 Group 3 Group 4
1961-62 Expenditure Per Year Per Day
$461,053.634.99.023
$932,434.436.32.033
$364,335.677.13.040
$745,942.195.23.029
1966-67 Expenditure Per Year Per Day
631,417.575.95.033
1,237,945.417.43.041
727,036.637.10.039
1,293,513.107.57.042
1967-63 Expenditure Per Year Per Day
740,977.216.91.033
1,942,974.539.11.051
555,737.627.59.042
1,569,322.933.99.050
1963-69 Expenditure Per Year Per Day
792,333.547.29.041
2,325,972.2010.50
.053329,230.64
3.45.047
1,523,041.559.46.053
1969-70 Expenditure Per Year Per Day
313j963.45 7.46 .041
2,510,313.3211.32
.063733,947.43
9.67.054
1,319,663.9710.03.056
fO■F-v /i

Table 39 (continued)
Year Item Group 5 Group 6 Total
1961-62 Expenditure Per Year Per Day
$1,138,203.575.91.033
$574,204.396.30.035
$4,216,178.985.97.033
1966-67 Expenditure Per Year Per Day
1,325,683.007.51.042
750,041.888.57.048
5,965,637.597.37.041
1967-68 Expenditure Per Year Per Day
1,536,359.738.32.046748,684.70
9.64.054
7,094,606.778.54.047
1968-69 Expenditure Per Year Per Day
1,752,982.099.09.051
714,731.369.66.054
7,943,346.389.28.052
1969-70 Expenditure Per Year Per Day
1,774,200.4310.14.056
900,170.0111.44
.0648,557,768.61
10.17.057
10•p-CTv

Table 40
Comparison of Expenditures for Operation of Plant,Other Expenditures
Year Item Group 1 Group 2 Group 3 Group 4
1961-62 Expenditure Per Year Per Day
$116,833.511.26.007
$158,750.271.16.006$76,372.87
1.51.008$199,442.01
1.40.0081966-67 Expenditure
Per Year Per Day
174,084.14I.64.009
285,523.191.71.010
222,035.032.17.012
347,148.172.04.011
1967-68 Expenditure Per Year Per Day
235,202.022.20.012456,884.68
2.14.012209,448.772.86
.016424,476.59
2.43.014
1968-69 Expenditure Per Year Per Day
437,206.314.02.022
649,354.552.94.016
240,197.462.45.014
420,880.702.60.014
1969-70 Expenditure Per Year Per Day
432,308.004.42.025
651,178.222.93.016
184,311.872.41.013
548,476.833.04.017
L*tZ

Table 40 (continued)
Year Item Group 5 Group 6 Total
1961-62 Expenditure Per Year Per Day
$333,244.581.73.010
$134,843.371.48.008$1,019,486.61
1.44.0081966-67 Expenditure
Per Year Per Day
453,165.022.56.014
215,118.322.46.014
1,697,073.872.09.012
1967-68 Expenditure Per Year Per Day
525,085.532.84.016
227,252.222.93.016
2,078,349.812.50.014
1968-69 Expenditure Per Year Per Day
744,740.833.86.021
259,957.383.51.020
2,752,337.233.21.Old
1969-70 Expenditure Per Year Per Day
759,981.474.34.024
320,322.094.07.023
2,946,578.483.50.019
ro■p-o»

Table 41
Comparison of Expenditures for Operation of Plant,Total
Year Item Group 1 Group 2 Group 3 Group 4
1961-62 Expenditure Per Year Per Day
$2,373,^56.7725.67
.143$2,554,539.4118.68
.104$866,450.73
17.09.095
$2,171,820.9015.23
.0851966-67 Expenditure
Per Year Per Day
3,621,335.3534.15.190
3,995,433.6423.97
.1332,183,662.47
21.34.119
3,700,515.6621.67.120
1967-63 Expenditure Per Year Per Day
4,151,634.3333.73
.2155,390,200.2527.62
.1531,876,969.07
25.62.142
4,428,816.8525.36.141
1963-69 Expenditure Per Year Per Day
4,531,693.2642.16
.2346,811,905.39
30.76.171
2,616,736.3826.67.148
4,230,678.3126.19.146
1969-70 Expenditure Per Year Per Day
4,903,685.0444.97.250
7,456,423.3533.61.137
2,253,530.4329.49
.1645,235,197.02
29.01.161
ro•F-vO

Table 41 (continued)
Year Item Group 5 Group 6 Total
1961-62 Expenditure Per Year Per Day
$3,200,265.7^ 16.61 .092
$1,526,669.5416.74
.093$12,693,603.13
17.97.0101966-67 Expenditure
Per Year Per Day
3,614,737.0121.60.1202,097,579.69
23.97.133
19,413,619.0223.97
.1331967-66 Expenditure
Per Year Per Day
4,430,720.3124.00.133
2,020,900.3626.02
.14522,799,291.24
27.44.1521966-69 Expenditure
Per Year Per Day
5,094,600.9326.41
.1472,026,664.66
27.41.152
25,364,549.4329.61.165
1969-70 Expenditure Per Year Per Day
5,333,646.4930.46
.1692,320,076.9529.46
.16427,507,763.76
32.69.162
250

Table 42
Comparison of Expenditures for Maintenance of Plant,Maintenance Salaries
Year Item Group 1 Group 2 Group 3 Group 4
1961-62 Expenditure Per Year Per Day
$1,147,614.6312.41
.069$710,044.65
5.19.029
$208,789.814.12.023
$352,006.922.47.014
1966-67 Expenditure Per Year Per Day
1,533,731.0814.46.080
1,066,901.916.40.036
394,356.463.86.021
737,714.434.32.024
1967-68 Expenditure Per Year Per Day
1,608,541.0115.00.083
1,662,497.677.80.043
145,743.131.99.011
837,108.184.79.027
1968-69 Expenditure Per Year Per Day
1,724,208.1315.87
.0881,721,602.90
7.77.043
271,223.882.77.015
809,772.045.01.0281969-70 Expenditure
Per Year Per Day
1,669,570.8515.29
.0851,865,519.05
8.41.047
290,834.973.81.021924,824.04
5.13.029
251

Table 43
Comparison of Expenditures for Maintenance of Plant, Repair and Upkeep of Buildings and Grounds Including
the Repair and Replacement of Equipment
Year Item Group 1 Group 2 Group 3 Group 4
1961-62 Expenditure Per Year Per Day
$513,416.215.55.031
$539,494.444.31.024
$469,424.669.26.051
$735,952.855.16.029
1966-67 Expenditure Per Year Per Day
940,596.033.37.049
2,036,774.9212.22
.0631,049,333.1910.26
.0571,307,857.587.66
.0431967-63 Expenditure
Per Year Per Day
1,070,305.259.93.055
1,715,239.473.04.045
732,573.6710.63.059
1,346,109.307.71.043
1963-69 Expenditure Per Year Per Day
1,056,419.049.72.054
1,730,071.063.04.045
913,301.639.36.052
1,500,489.629.29.052
1969-70 Expenditure Per Year Per Day
903,324.233.27.046
2,105,364.479.49.053
649,392.078.50.047
2,054,715.0311.39.063
10\jiV a >

Table 43 (continued)
Year Item Group 5 Group 6 Total
1961-62 Expenditure Per Year Per Day
$1,337,209.7S 6.94 .039
$650,931.967.14.040
$4,296,429.906.08.034
1966-67 Expenditure Per Year Per Day
2,193,305.9012.42
.069874,347.26
9.99.0568,402,269.86
10.37.0581967-68 Expenditure
Per Year Per Day
2,303,302.4812.48.069
784,178.0610.10.056
8,001,708.239.63.054
1968-69 Expenditure Per Year Per Day
2,412,683.8612.51.070
721,347.979.75.054
8,389,313.189.79.054
1969-70 Expenditure Per Year Per Day
2,499,824.0714.29
.079672,800.27
8.55.0488,885,420.1410.56
.059

Table 44
Comparison of Expenditures for Maintenance of Plant,Other Expenditures
Year Item Group 1 Group 2 Group 3 Group 4
1961-62 Expenditure Per Year Per Day
$119.040.00.000
$22,797.170.17.001
$17,420.650.34.002
$11,355.720.08.0001966-67 Expenditure
Per Year Per Day
2,284,679.0221.54.120
16,268.630.10.00149,470.61
0.48.003
22,343.930.13.001
1967-68 Expenditure Per Year Per Day
38,093.77 0.36 .002
37,706.990.17.001
12,329.870.17.001
18,874.380.11.0011968-69 Expenditure
Per Year Per Day
42,253.080.39.002
42,093.950.19.001
18,589.820.19.001
38,525.320.24.001
1969-70 Expenditure Per Year Per Day
34,174.46 0.32 .00225,895.140.12.001
43,888.310.57.003
100,033.750.55.003
255

Table 44 (continued)
Year Item Group 5 Group 6 Total
1961-62 Expenditure Per Year Per Day
$6,336.820.04.000
$2,959.430.03.00
$61,488.830.09.001
1966-67 Expenditure Per Year Per Day
45,260.690.25.001
3,751.420.04.000
2,421,774.302.99.017
1967-68 Expenditure Per Year Per Day
57,673.410.32.0024,251.92
0.05.001168,940.340.20.001
1963-69 Expenditure Per Year Per Day
177,568.140.92.005
14,086.020.19.001
333,116.330.39.002
1969-70 Expenditure Per Year Per Day
136,586.58 0.73 • 004
45,701.450.58.003
386,279.69O.46.003
roVJ,o

Table 45
Comparison of Expenditures for Maintenance of Plant,Total
Year Item Group 1 Group 2 Group 3 Group 4
1961-62 Expenditure Per Year Per Day
$1,661,149.3317.96
.010$1,322,336.26
9.67.054
$695,635.1213.72
.076$1,099,315.49
7.71.043
1966-67 Expenditure Per Year Per Day
4,759,006.1344.37
.2493,119,945.46
13.72.104
1,493,215.2614.60
.0312,067,915.9412.11
.0671967-63 Expenditure
Per Year Per Day
2,716,945.0325.34
.1413,415,444.1316.01
.039940,646.67
12.84.071
2,202,091.8612.61.070
1963-69 Expenditure Per Year Per Day
2,322,330.2525.93.144
3,543,767.9116.00.039
1,208,115.3312.32.0682,343,736.98
14.54.0811969-70 Expenditure
Per Year Per Day
2,607,069.5423.33.133
3,996,773.6613.02.100
984,115.3512.88.0723,079,572.82
17.07.095
N>VJ1

Table 45 (continued)
Year Item Group 5 Group 6 Total
1961-62 Expenditure Per Year Per Day
$1,714,312.673.90.049
$812,685.098.91.050
$7,305,434.5110.34
.0571966-67 Expenditure
Per Year Per Day
2,624,350.4s14.36
.0331,057,901.09
12.09.067
15,122,834.3618.67
.1041967-68 Expenditure
Per Year Per Day
2,313,321.7115.23.085
973,559.7312.53.070
13,067,509.1315.73
.087196S-69 Expenditure
Per Year Per Day
3,101,775.3416.0$.089
924,245.5812.49
.06913,949,571.3916.28
.0901969-70 Expenditure
Per Year Per Day
3,220,368.1718.41.102
960,185.2212.20.068
14,848,089.7617.65.098
toVJlCO.
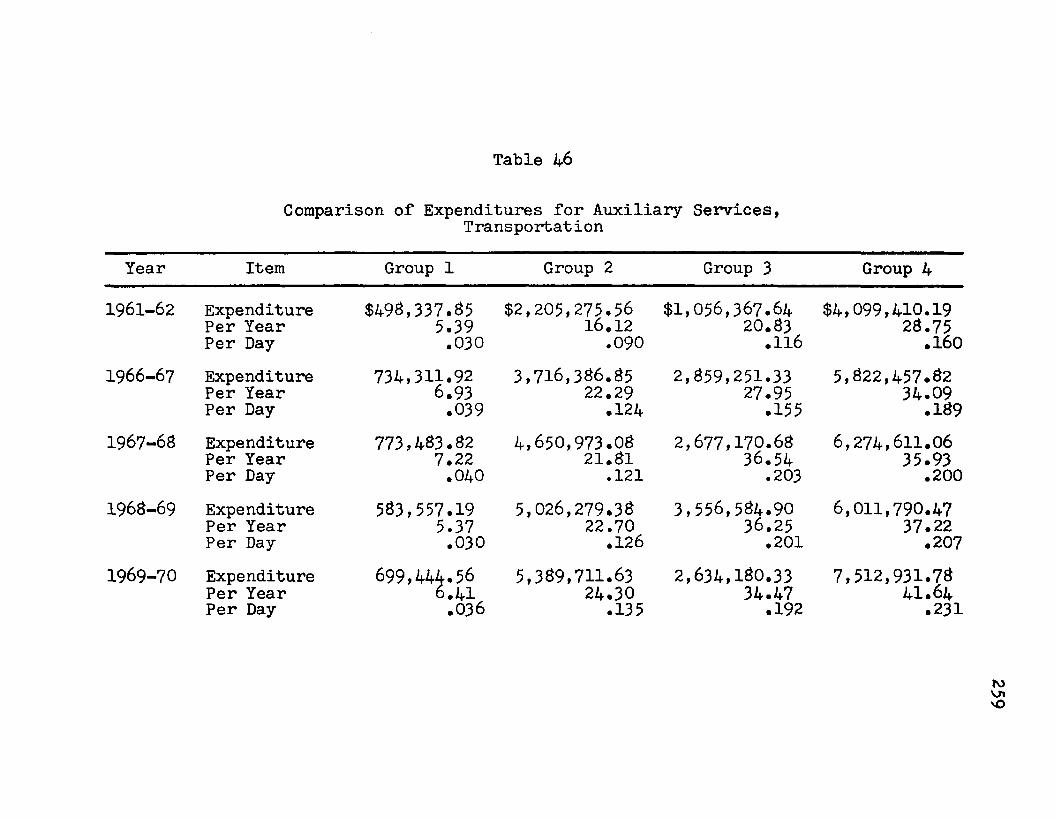
Table 46
Comparison of Expenditures for Auxiliary Services,Transportat ion
Year Item Group 1 Group 2 Group 3 Group 4
1961-62 Expenditure Per Year Per Day
$498,337.855.39.030
$2,205,275.5616.12.090
$1,056,367.6420.83.116
$4,099,410.1926.75.160
1966-67 Expenditure Per Year Per Day
734,311.926.93.039
3,716,366.8522.29
.1242,859,251.33
27.95.155
5,622,457.6234.09
.1691967-68 Expenditure
Per Year Per Day
773,463.827.22.0404,650,973.0821.81.121
2,677,170.6836.54
.2036,274,611.06
35.93.2001968-69 Expenditure
Per Year Per Day
583,557.195.37.030
5,026,279.3822.70.1263,556,564.90
36.25.2016,011,790.4737.22
.2071969-70 Expenditure
Per Year Per Day699,444.56
6.41.0365,369,711.63
24.30.135
2,634,160.3334.47.192
7,512,931.7641.64
.231
259

Table 46 (continued)Year Item Group 5 Group 6 Total
1961-62 Expenditure Per Year Per Day
$7,015,653.2136.42.202
$4,207,660.9446.13.256
$19,082,710.3927.01.150
1966-67 Expenditure Per Year Per Day
3,304,057.34 47.02 .2615,072,131.SO
57.96 .322
26,508,597.5632.73.182
1967-63 Expenditure Per Year Per Day
9,114,411.3449.3S.274
4,7S0,562.46 61.54 .342
28,271,212.4434.03
.1391963-69 Expenditure
Per Year Per Day
9,900,229.7351.33
.2354,399,694.36
66.18.368
29,973,136.5334.99
.1941969-70 Expenditure
Per Year Per Day
9,533,009.3S 54.77
.3045,736,721.56
73.53.409
31,605,999.2437.56
.209
?oO'o

Table 47
Comparison of Expenditures for Auxiliary Services, School Lunch Including the National
School Milk Program
Year Item Group 1 Group 2 Group 3 Group 4
1961-62 Expenditure $2,470,259.15 $5,589,889.76 $2,078,519.45 $5,191,995.27Per Year 26.71 40.87 40.98 36.41Per Day .143 .227 .228 .2021966-67 Expenditure 5,260,930.03 8,151,063.49 4,988,596.41 7,349,219.46
Per Year 49.61 43.90 48.76 45.96Per Day .276 .272 .271 .2551967-63 Expenditure 4,108,370.05 10,820,062.71 3,536,033.59 3,607,918.66
Per Year 38.32 50.73 48.26 49.29Per Day .213 .282 .268 .2741963-69 Expenditure 4,450,046.29 11,714,474.01 4,924,988.24 8,063,392.64Per Year 40.94 52.90 50.20 49.92
Per Day .227 .294 .279 .2771969-70 Expenditure 4,949,875.60 11,940,128.15 4,615,243.07 9,023,260.63Per Year 45.34 53.33 60.40 50.00
Per Day .252 .299 .336 .27 8
toON

Table 47 (continued)
Year Item Group 5 Group 6 Total
1961-62 Expenditure Per Year Per Day
$6,716,301.4434.67
.194$3,153,936.46
34.56.192$25,200,901.55
35.67.1961966-67 Expenditure
Per Year Per Day
7,719,261.7443.71
.2433,627,726.90
43.74.243
37,796,620.0346.67
.2591967-66 Expenditure
Per Year Per Day
6,356,060.2945.27.252
3,474,661.9044.73
.24936,903,127.20
46.63.2601966-69 Expenditure
Per Year Per Day
9,656,346.0450.06.2763,640,562.62
49.17.273
42,451,609.6449.55
.2751969-70 Expenditure
Per Year Per Day
9,441,950.0753.96.300
4,243,907.6953.93.300
44,214,365.2152.54.292
Onto

Table 43
Comparison of Expenditures for Auxiliary Services,Other Expenditures
Year Item Group 1 Group 2 Group 3 Group 4
1961-62 Expenditure Per Year Per Day
$158,690.321.71.010
$132,102.210.97.005
$88,899.071.75.001
$136,474.610.95.005
1966-67 Expenditure Per Year Per Day
177,125.621.67.009
687,074.314.12.023
453,201.234.43.025
763,935.404.47.025
1967-68 Expenditure Per Year Per Day
222,837.872.08.012576,702.942.70
.015344,725.274.70.026
523,272.432.99.017
1968-69 Expenditure Per Year Per Day
233,169.762.15.012
637,761.532.87.016
363,793.273.71.021
469,265.132.90.016
1969-70 Expenditure Per Year Per Day
231,333.082.12.012
745,999.773.36.019
272,261.113.57.020
444,995.382.47.014
roON

Table 43 (continued)
Year Item Group 5 Group 6 Total
1961-62 Expenditure Per Year Per Day
$269,742.281.40.008
$137,431.361.50.008
$923,340.351.31.007
1966-67 Expenditure Per Year Per Day581,679.29
3.29.018309,182.27
3.53.0202,977,243.62
3.67.0201967-68 Expenditure
Per Year Per Day
517,592.892.80.016
281,506.743.62.020
2,466,638.142.97.017
1968-69 Expenditure Per Year Per Day
922,525.284.78.027
291,411.023.94.022
2,917,926.093.41.019
1969-70 Expenditure Per Year Per Day
604,197.653.45.019
266,253.533.33.019
2,565,046.023.05.017
toON■p-

Table 49
Comparison of Expenditures for Auxiliary Services,Total
Year Item Group 1 Group 2 Group 3 Group 4
1961-62 Expenditure $3,127,287.32 $7,927,267.53 $3,223,766.16 $9,427,680.07Per Year 33.^1 57.96 63.56 66.11Per Day .188 .322 .353 .367
1966-67 Expenditure 6,172,367.57 12,554,525.15 8,306,046.97 14,435,662.68Per Year 56.21 75.31 61.19 84.52Per Day .323 .416 .451 .470
1967-63 Expenditure 5,104,691.74 16,047,736.73 6,557,929.54 15,405,802.15Per Year 47.62 75.24 69.50 88.21Per Day .265 .416 .497 .490
1968-69 Expenditure 5,266,773.24 17,376,514.97 8,845,366.41 14,544,448.29Per Year 48.46 76.47 90.16 90.04Per Day .269 .436 .501 .5001969-70 Expenditure 5,880,658.24 16,075,839.55 7,521,684.51 16,981,188.29
Per Year 53.67 61.49 98.44 94.11Per Day .299 .453 .547 .523
too\vn

Table 49 (continued)
Year Item Group 5 Group 6 Total
1961-62 Expenditure Per Year Per Day
$14,001,701.9372.69
.404$7,499,029.2662.21
.457$45,206,952.29
63.99.3561966-67 Expenditure
Per Year Per Day
16,605,016.6794.02.522
9,209,042.97105.23
.56567,262,666.21
63.07.4621967-66 Expenditure
Per Year Per Day
17,966,064.5297.45
.5416,536,731.10
109.69.61169,640,977.76
63.63.466196S-69 Expenditure
Per Year Per Day
20,461,101.05106.19
.5906,631,666.50
119.29.663
75,347,672.4667.95
.4691969-70 Expenditure
Per Year Per Day
19,629,157.10112.16.623
10,296,662.76130.64
.72776,365,410.47
93.15.516
o\os

Table 50
Comparison of Expenditures for Fixed Charges, Employee Benefits
Year Item Group 1 Group 2 Group 3 Group 4
1961-62 Expenditure Per Year Per Day
$1,351,520.9520.02.111
$2,397,437.9221.18.118$1,097,502.92
21.64.120$3,079,104.65
21.59.1201966-67 Expenditure
Per Year Per Day
3,775,125.6035.60
.19^5,231,381.66
31.39.174
3,201,730.1531.30.174
4,929,735.2728.86.160
1967-6a Expenditure Per Year Per Day
3,971,796.3737.05.206
7,181,037.8533.67
.1872,288,252.99
31.23.174
4,925,478.4423.20.157
1963-69 Expenditure Per Year Per Day
4,035,257.6337.59
.2096,590,707.73
29.76.165
3,212,983.8732.75.182
4,999,592.6030.95.172
1969-70 Expenditure Per Year Per Day
4,123,344.1237.77.210
10,138,067.9845.70
.2542,635,882.22
34.50.1926,437,900.00
35.63.198
roo3
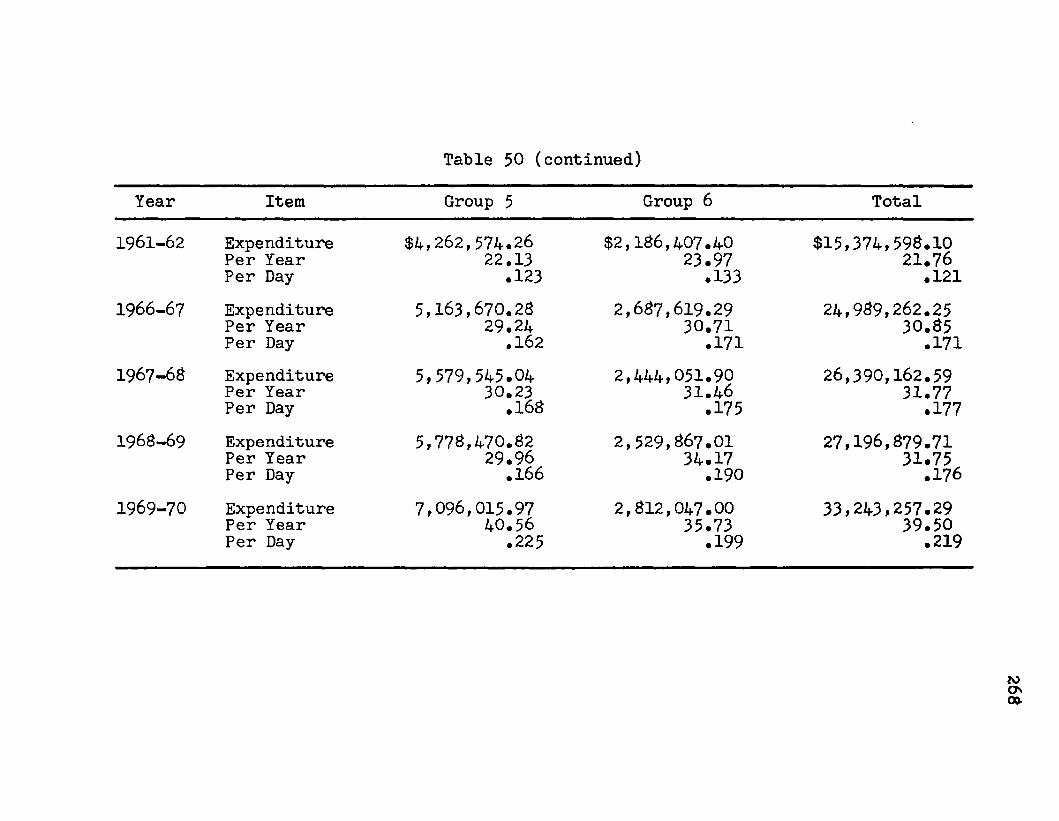
Table 50 (continued)
Year Item Group 5 Group 6 Total
1961-62 Expenditure Per Year Per Day
$4,262,574.2622.13
.123$2,186,407.40
23.97.133
$15,374,598.1021.76.121
1966-67 Expenditure Per Year Per Day
5,163,670.2829.24.162
2,687,619.2930.71
.17124,989,262.25
30.85.171
1967-68 Expenditure Per Year Per Day
5,579,545.0430.23.168
2,444,051.9031.46
.17526,390,162.59
31.77.177
1968-69 Expenditure Per Year Per Day
5,778,470.8229.96.166
2,529,867.0134.17.190
27,196,879.7131.75.176
1969-70 Expenditure Per Year Per Day
7,096,015.9740.56.225
2,812,047.0035.73
.19933,243,257.2939.50
.219
ONCO.

Table 51
Comparison of Expenditures for Fixed Charges,Other Expenditures
Year Item Group 1 Group 2 Group 3 Group 4
1961-62 Expenditure Per Year Per Day
$239,611.293.13.017
$199,643.001.46.003
$230,963.814.55.025
$478,124.893.36.019
1966-67 Expenditure Per Year Per Day
429,272.574.05.023
733,350.324.73.026
360,913.163.52.020
965,868.285.66.031
1967-63 Expenditure Per Year Per Day
496,113.354.63.026
1,053,764.154*94.027
375,862.125.13.029
1,112,958.026.38.035
1963-69 Expenditure Per Year Per Day
463,191.374.26.024
1,029,930.364.65.026
651,825.586.65.037
1,115,183.176.90.038
1969-70 Expenditure Per Year Per Day
659,333.926.04.034
1,518,311.586.85.038
684,562.043.96.050
1,164,846.096.46.036
N>OvO

Table 52
Comparison of Expenditures for Fixed Charges,Total
Year Item Group 1 Group 2 Group 3 Group 4
1961-62 Expenditure Per Year Per Day
$2,141,132.2423.15
.129$3,097,130.92
22.64.126$1,328,456.73
26.19.146$3,557,229.54
24.95.139
1966-67 Expenditure Per Year Per Day
4,204,398.1739.65.220
6,020,232.4836.12.2013,562,643.3134.82
.1935,895,603.5534.52
.1921967-68 Expenditure Per Year
Per Day4,467,914.7241.68.232
8,234,802.0038.61.215
2,664,115.1136.36.2026,038,436.46
34.58.192
1968-69 Expenditure Per Year Per Day
4,548,449.5041.85
.2337,620,638.64
34.41.191
3,864,809.4539.40.219
6,114,775.7737.85.2101969-70 Expenditure
Per Year Per Day
4,783,228.0443.81.243
11,656,879.5652.55.292
3,320,444.2643.46
.2417,602,746.09
42.14.234

Table 52 (continued)
Year Item Group 5 - Group 6 Total
1961-62 Expenditure Per Year Per Day
$4,933,882.2825.62.142$2,495,355.6727.36
.152$17,553,187.3$
24.84.1381966-67 Expenditure
Per Year Per Day
6,094,611.3434.51.192
3,621,096.3841.37.230
29,398,585.2336.29.202
1967-68 Expenditure Per Year Per Day
6,725,835.7636.44.202
3,275,640.4042.17
.23431,406,744.4537.81.210
1968-69 Expenditure Per Year Per Day
7,090,652.7136.76.204
3,031,164.0040.94
.22732,270,490.07
37.67.209
1969-70 Expenditure Per Year Per Day
8,227,159.0347.02.261
3,433,166.6944.26.246
39,073,623.6746.43.258
ZLZ

Table 53
Comparison of Expenditures for Current Operation,Total
Year Item Group 1 Group 2 Group 3 Group 4
1961-62 Expenditure Per Year Per Day
$30,377,270.16323.45
1.32$47,039,419.33
343.931.91
$17,933,066.23353.67
1.96$49,64S,296.42
34S.15 1.93
1966-67 Expenditure Per Year Per Day
56,742,596.23535.032.97
33,063,904.14493.35
2.7750,347,422.79492.12
2.7331,531,722.94477.63
2.651967-63 Expenditure
Per Year Per Day
64,352,272.20604.943.36
113,193,914.57530.77
2.9533,312,652.52
529.702.94
90,249,603.09516.77
2.371963-69 Expenditure
Per Year Per Day
65,220,643.54600.103.33
123,467,265.26557.533.10
53,025,536.93540.513.00
33,464,172.34547.643.04
1969-70 Expenditure Per Year Per Day
65,933,975.62604.45
3.36133,239,206.63
600.663.34
42,630,722.23553.5S3.10
106,131,356.23538.193.27

Table 53 (continued)
Year Item Group 5 Group 6 Total
1961-62 Expenditure Per Year Per Day
$70,950,431.76368.35
2.05$36,220,210.99
397.092.21$252,173,694.89
356.961.98
1966-67 Expenditure Per Year Per Day
89,347,674.09505.912.81
46,771,763.69534.442.97
407,860,083.88503.552.80
1967-68 Expenditure Per Year Per Day
101,519,470.43550.003.0644,345,166.96
570.863.17
452,978,084.77545.303.03
1968-69 Expenditure Per Year Per Day
112,062,379.38580.993.23
44,180,503.41596.763.32
486,421,500.91567.793.15
1969-70 Expenditure Per Year Per Day
110,950,482.12634.10
3.5250,491,418.71641.58
3.56509,482,161.69
605.443.36
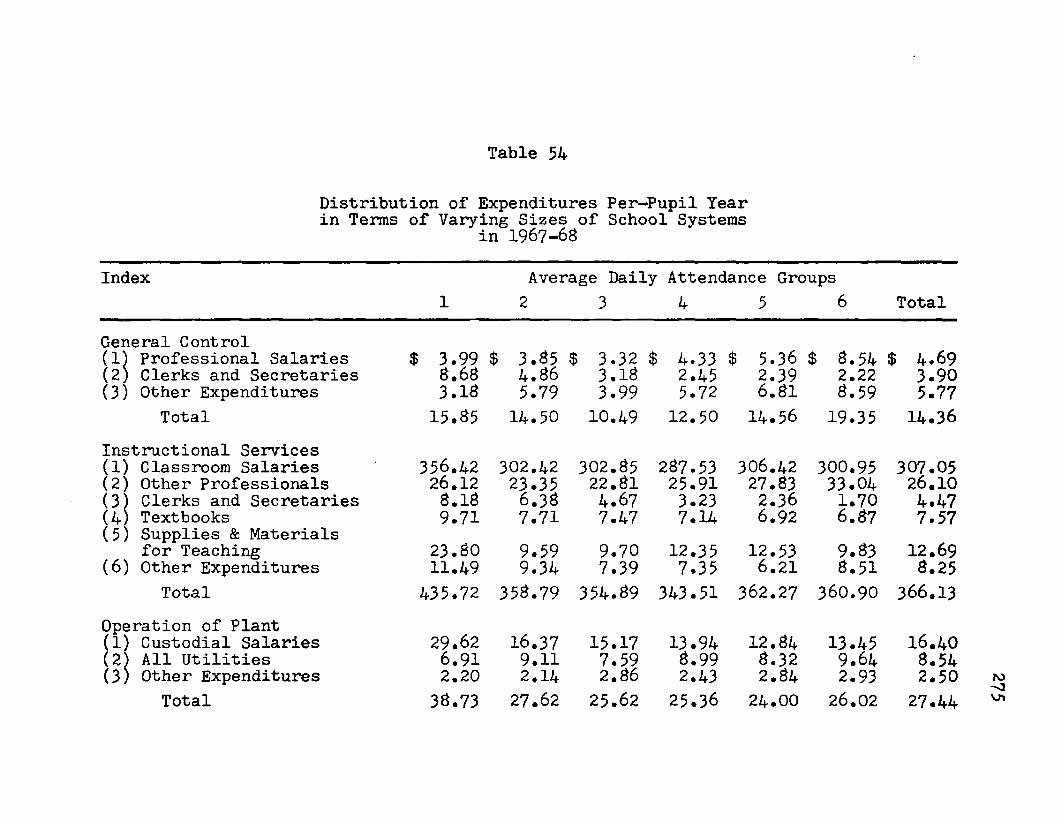
Table 54
Distribution of Expenditures Per-Pupil Yearin Terms of Varying Sizes of School Systemsin 1967-68
Index Average Daily Attendance Groups1 2 3 4 5 6 Total
General Control(1} Professional Salaries $ 3.99 $ 3.85 $ 3.32 $ 4.33 $ 5.36 $ 8.54 $ 4.69(2) Clerks and Secretaries 8.68 4.86 3.18 2.45 2.39 2.22 3.90(3) Other Expenditures 3.18 5.79 3.99 5.72 6.81 8.59 5.77
Total 15.85 14.50 10.49 12.50 14.56 19.35 14.36Instructional Services(1) Classroom Salaries 356.42 302.42 302.85 287.53 306.42 300.95 307.05(2) Other Professionals 26.12 23.35 22.81 25.91 27.83 33.04 26.10(3) Clerks and Secretaries 8.18 6.38 4.67 3.23 2.36 1.70 4.47(4) Textbooks 9.71 7.71 7.47 7.14 6.92 6.87 7.57(5) Supplies & Materials
for Teaching 23.80 9.59 9.70 12.35 12.53 9.83 12.69(6) Other Expenditures 11.49 9.34 7.39 7.35 6.21 8.51 8.25Total 435.72 358.79 354.89 343.51 362.27 360.90 366.13
Operation of Plant(1) Custodial Salaries 29.62 16.37 15.17 13.94 12.84 13.45 16.40(2) All Utilities 6.91 9.11 7.59 8.99 8.32 9.64 8.54(3; Other Expenditures 2.20 2.14 2.86 2.43 2.84 2.93 2.50
Total 38.73 27.62 25.62 25.36 24.00 26.02 27.44ro-oVJ"I

Table 54 (continued)
Index Average Daily Attendance Groups1 2 3 4 5 6 Total
Maintenance of PlantMaintenance Salaries $ 15.00 $ 7.&0 $ 1.99 $ 4.79 $ 2.4$ $ 2.3$ $ 5.90
(2)
(3)
Repair and Upkeep of Buildings & Grounds and Repair and Replacement of Equipment 9.9$ $.04 10.6$ 7.71 12.4$ 10.10 9.63Other Expenditures .36 .17 .17 .11 .32 .05 .20
Total 25.34 16.01 12. $4 12.61 15.2$ 12.53 15.73Auxiliary Services (1) Transportation 7.22 21.$1 36.54 35.93 49.3$ 61.54 34.03(2) School Lunch and National
School Milk Program 3$.32 50.73 4$. 26 49.29 45.27 44.73 46. $3(3) Other Expenditures 2.0$ 2.70 4.70 2.99 2. $0 3.62 2.97
Total 47.62 75.24 $9.50 $8.21 97.45 109.$9 $3. $3Fixed Charges(1) Employee Benefits 37.05 33.67 31.23 2$.20 30.23 31.46 31.77(2) Other Expenditures 4.63 4.94 5.13 6.3$ 6.21 10.71 6.04
Total 41.6$ 3$.61 36.36 34.5 $ 36.44 42.17 37. $1Grand Total $604.94 $530.77 $529.70 $516.77 $550.00 $570.$6 $545.30
roO N

Table 55
Distribution of Expenditures Per-Pupil Yearin Terms of Varying Sizes of School Systems
in 1968-69
Index Average Daily Attendance Groups1 2 3 4 5 6 Total
General Control(1) Professional Salaries $ 3.04 $ 4.29 $ 4.24 $ 4.38 $ 6.22 $ 9.74 $ 5.05(2) Clerks and Secretaries 7.11 6.02 2.61 2.72 2.92 2.51 4.14(3) Other Expenditures 1.83 6.03 4.77 6.47 7.87 9.2 8 6.13
Total 11.98 16.34 11.62 13.57 17.01 21.53 15.32Instructional Services(1) Classroom Salaries 345.62 319.73 308.71 301.47 314.50 310.27 316.31(2) Other Professionals 27.35 23.60 22.62 26.67 28.94 34.65 26.70(3) Clerks and Secretaries 10.43 6.76 4.52 3.37 2.83 1.86 5.02(4; Textbooks 10.44 8.50 7.88 7.72 7.63 7.23 8.22(5) Supplies & Materials
for Teaching 18.72 11.28 6.40 15.95 15.55 10.03 13.40(6) Other Expenditures 17.11 11.68 10.21 10.27 9.09 11.06 11.31
Total 429.67 381.55 360.34 365.45 378.54 375.10 380.96Operation of Plant(1) Custodial Salaries 30.85 17.32 15.77 14.13 13.46 14.24 17.12(2) All Utilities 7.29 10.50 8.45 9.46 9.09 9.66 9.28(3) Other Expenditures 4.02 2.94 2.45 2.60 3.86 3.51 3.21
Total 42.16 30.76 26.67 26.19 26.41 27.41 29.61
277
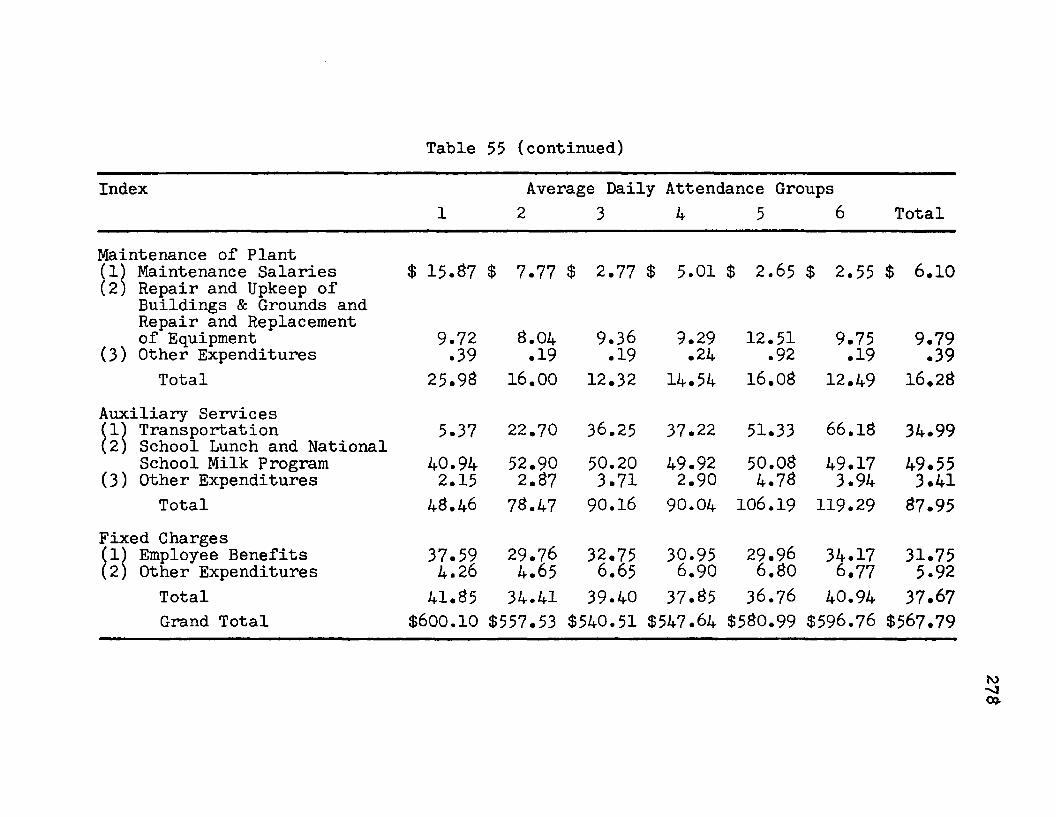
Table 55 (continued)
Index Average Daily Attendance Groups1 2 3 4 5 6 Total
Maintenance of Plant(2)
Maintenance Salaries Repair and Upkeep of Buildings & Grounds and Repair and Replacement
$ 15.^7 $ 7.77 $ 2.77 $ 5.01 $ 2.65 $ 2.55 $ 6.10
(3)of Equipment 9.72 8.04 9.36 9.29 12.51 9.75 9.79Other Expenditures .39 .19 .19 .24 .92 .19 .39
Total Auxiliary Services
25.98 16.00 12.32 14.54 16.08 12.49 16.2S
(1)(2)TransportationSchool Lunch and National 5.37 22.70 36.25 37.22 51.33 66.1S 34.99
(3)School Milk Program 40.94 52.90 50.20 49.92 50.08 49.17 49.55Other Expenditures 2.15 2.87 3.71 2.90 4.78 3.94 3.41
Total Fixed Charges
48.46 78.47 90.16 90.04 106.19 119.29 87.95
(1) Employee Benefits 37.59 29.76 32.75 30.95 29.96 34.17 31.75(2) Other Expenditures 4.26 4.65 6.65 6.90 6. SO 6.77 5.92
Total 41.85 34.41 39.40 37.85 36.76 40.94 37.67Grand Total $600.10 $557.53 $540.51 $547.64 $580.99 $596.76 $567.79
to-vjoa

VITA
James George Bailey, Jr., was born on September 25, 1923» at Crew Lake, Louisiana, in Richland Parish, the son of Jimmy George Bailey and Augusta Garrett Bailey*
He was educated in the public elementary and secondary schools of Louisiana* After graduating from Ouachita Parish High School, he attended Louisiana State Normal College, Natchitoches, Louisiana, where he received a Bachelor of Science degree in 1947. He attended Graduate School at Louisiana State University and received a Master of Music Education degree in 194$*
He taught in the Franklinton Elementary and Franklinton High Schools in Franklinton, Louisiana from 1943 to I960. He served as Principal of Franklinton High School from I960 to 1966. In 1966 he was appointed Superintendent of Washington Parish Schools, a position he currently holds.
He served in the United States Army Air Corps from 1943 to 1946, and the Air Force Reserve until 1955* From 1955 to the present, he was a member of the Louisiana National Guard.
279

280He is married to Audrey Adcock Bailey* They are
the parents of Kenneth Bailey, Beverly Bailey, and James G* Bailey, III.

EXAMINATION AND THESIS REPORT
Candidate: James G. B a iley , Jr.
Major Field: Education
Title of Thesis: An A nalysis o f Public School Expenditures In Louisiana On A Per-Pupil Basis
Approved:
Major Professor and Chairman
of the Graduate School
EXAMINING COMMITTEE:
\
Date of Examination:
July 31, 1972