Embed Size (px)
Citation preview
8/7/2019 An Analysis of Teaching Behaviours of Preschool Student
http://slidepdf.com/reader/full/an-analysis-of-teaching-behaviours-of-preschool-student 1/6
Pertanika J. Soc. Sci. & Hum. 3(2): 113-1 18 (1995) ISS : 0 I 28-7702© Universiti Pertanian Malaysia Press
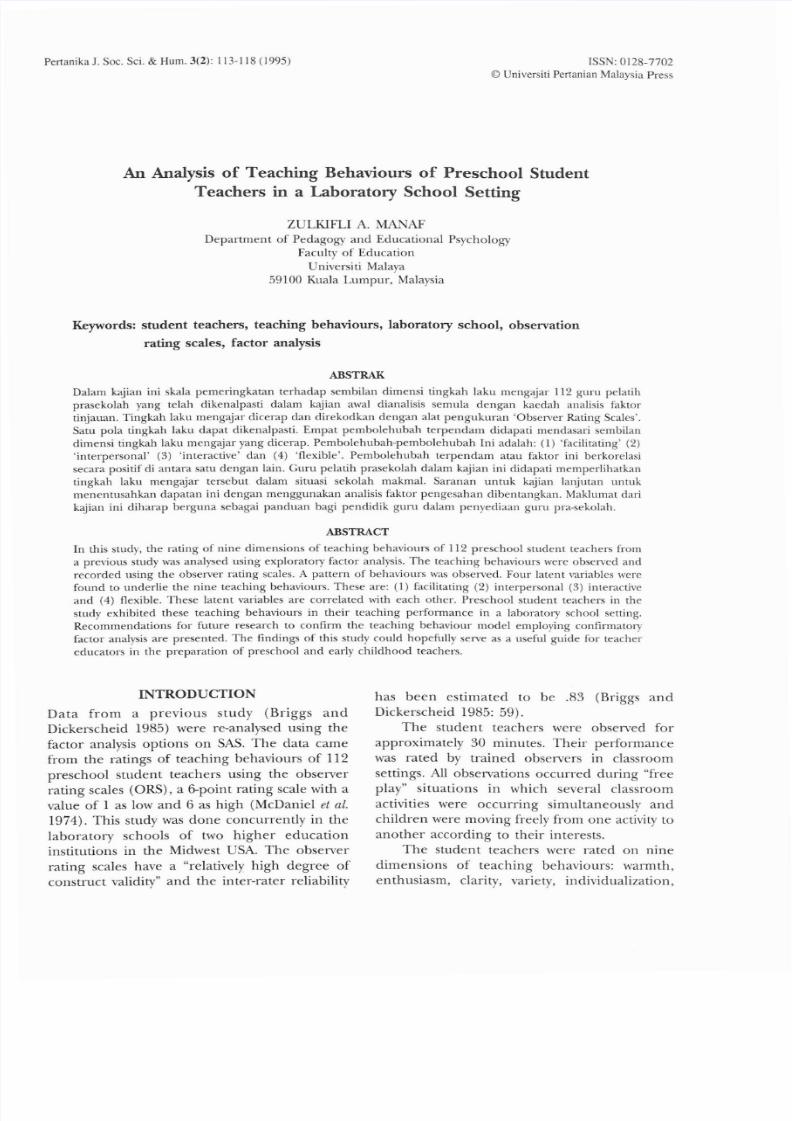
An Analysis of Teaching Behaviours of Preschool StudentTeachers in a Laboratory School Set ting
ZULKIFLI A. MANAFDepar tment of Pedagogy an d Educational Psychology
Faculty of EducationUniversiti Malaya
59100 Kuala Lumpur, Malaysia
Keywords: student teachers , teaching behaviours, laboratory school , observation
rating scales, factor analysis
ABSTRAK
Dalam kajian ini skala pemeringkatan terhadap sembilan dimensi tingkah laku mengajar 112 guru pelatihpraseko lah yang telah d ikenalpast i dalam kajian awal dianalisis semula dengan kaedah anaJisis faktortinjauan. Tingkah laku mengajar d icerap dan di rekodkan dengan alat pengukuran 'Observer Rating Scales'.Satu pola t ingkah laku dapat dikenalpasti. Empat pembolehubah terpendam didapati mendasari sembilandimensi tingkah laku mengajar yang dicerap. Pembolehubah-pembolehubah Ini adalah: (1) 'facilitating' (2)' interpersonal' (3) ' interact ive' da n (4) 'flexible' . Pembolehubah terpendam a tau fak tor ini berkorelas isecara positif di antara satu dengan lain. Curu peJatih prasekolah dalam kajian ini didapati memperlihatkant ingkah laku m en ga ja r t ers eb ut d al am situasi sekolah makmal. Saranan untuk kaj ian lanjutan untukmenentusahkan dapatan ini dengan menggunakan analisis faktor pengesahan dibentangkan. Maklumat darikajian ini diharap berguna sebagai panduan bagi pendidik guru dalam penyediaan guru pra-sekolah.
ABSTRACT
In this study, th e rating of nine dimensions of teaching behaviours of 112 preschool student teachers froma previous study was analysed using exploratory factor analysis. Th e teaching behaviours were observed an drecorded using th e observer rating scales. A pattern of behaviours was observed. Four latent variables werefound to u nd er li e t he n in e t ea ch in g behaviours. These are: (1) facilitating (2) interpersonal (3) interactivean d (4) flexible. T he se l at en t variables are cor re lated with each other. Preschool s tudent teachers in th estudy exhibited these teaching behaviours in thei r teaching performance in a laboratory school setting.Recommendations for future research to confirm th e teaching behaviour model employing confirmatoryfactor analysis are presen ted . Th e findings of this study could hopeful ly serve as a useful guide for teachereducators in the prepara t ion of preschool an d early childhood teachers.
INTRODUCTIONData from a p re vi ou s s tu dy (Briggs andDickerscheid 1985) were re-analysed using th efactor analysis options on SAS. Th e d ata c am efrom th e ratings of teaching behaviours of 112preschool student teachers using th e observerrating scales (ORS) , a 6-point rating sca le with avalue of 1 as low and 6 as high (McDaniel et al.
1974). This study was done concurrently in th elaboratory schools of two higher educationinstitutions in th e Midwest USA. Th e observerrating scales have a "relatively high degree ofconstruct validity" an d th e inter-rater reliability
ha s been estimated to be .83 (Briggs andDickerscheid 1985: 59) .
The student teachers were observed fo rapproximately 30 minutes . Their performancewas rated by trained obs ervers in class ro omsettings. All observations occurred during "freeplay" s it ua ti ons in w hic h s ev er al classroomact ivit ies were occurring simultaneously andchildren were moving freely from on e activity toanother according to their interests.
The student teachers were rat ed on ninedimensions of teaching behaviours: warmth,enthusiasm, clarity, variety, individualization,
8/7/2019 An Analysis of Teaching Behaviours of Preschool Student
http://slidepdf.com/reader/full/an-analysis-of-teaching-behaviours-of-preschool-student 2/6
Zulkifli A. Manaf
feedback, cognitive demand, freedom, and ontask activity.
Definitions of t he n ine behaviour dimensions(Briggs and Dickerscheid 1985) ar e as follows:1. Warmth - the extent to which th e teacher is
relaxed and comfortable; th e degree towhich th e t eacher maintains positiveinterpersonal relationships with children.
2. Enthusiasm - th e enthusiasm or interest levelexpressed by the teacher an d children duringnursery school activities.
3. Clarity - th e clarity of communication,instructions and expectations conv eyed tothe chi ldren.
4. Var iety - th e extent to which th e teacheruses a var iety of materials an d activities.
5. Individualization - th e degree t o whi ch th eteacher provides children with differentlevels of work suited to their particular needs,
interests, an d abilities, and th e amount ofindividual assistance provided.
6. Feedback - t he e xt en t of communication toth e children of information about th eadequacy, acceptability, completeness orcorrectness of his or her response.
7. Cognitive Demand - th e level of intellectualactivity the teacher expects from thechildren.
8. Freedom - t he d eg re e to w hich th e teacherprovides arrangements which facilitateindependence an d individual freedom.
9. On-task Activity - th e amount of child activitydirected toward the accomplishment ofinstructional objectives.The inter - relationship between the nine
teaching behaviours of t he p re school teacherswas determined and th e inference of thefindings was made to th e popu lation o fpreschool teachers from which th e sample was
drawn. As mentioned earlier, this study wasbased on secondary data: it was not intendedto relate th e findings to th e original article.Though factor analysis was used in th e originalstudy, different s ta ti st ical sof tware was used.Furthermore, only two factors were extractedin th e original study. The only material thatwas uti l ized f rom th e Briggs an d Dickerscheid(1985) study was the p ub lish ed co rr elatio nmatrix of th e ratings on th e nine teachingbehaviours of t he p re sc ho ol student teachers.
The emphasis of this paper is no t only th einterpretations of th e data; equal importance isp laced on creating awareness among readers of
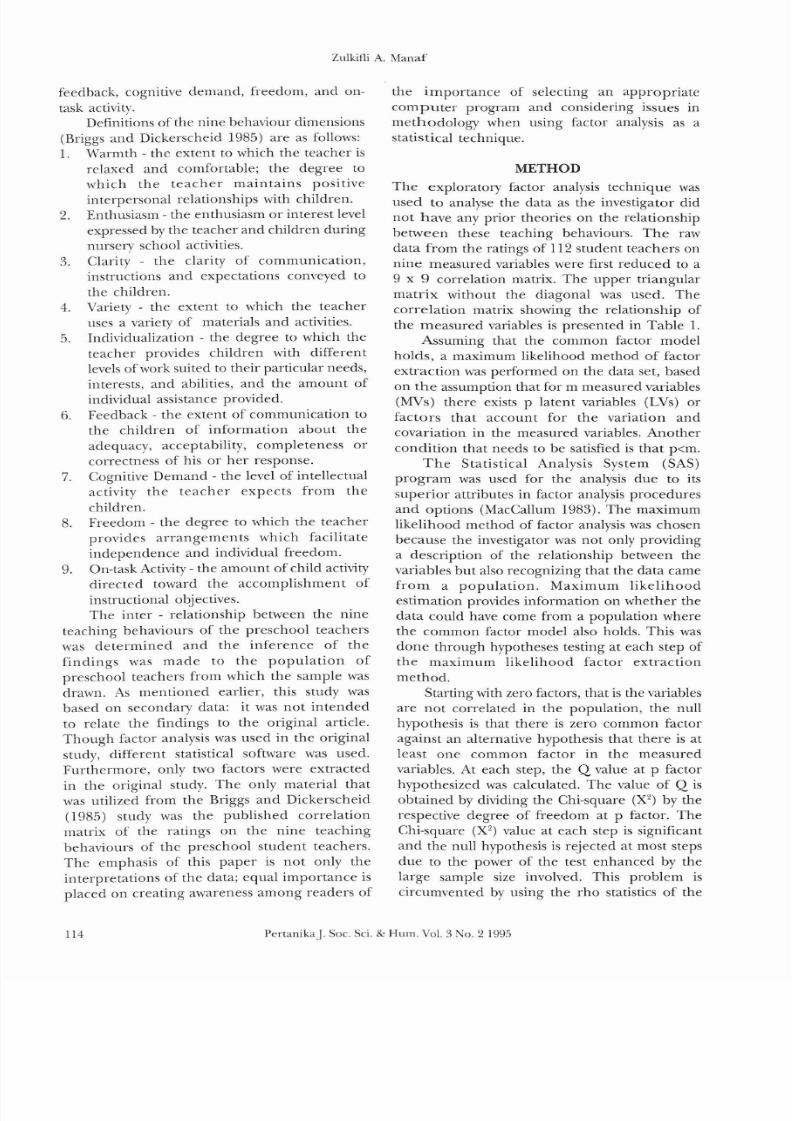
th e importance of selecting an appropriatecomputer program an d considering issues inmethodology when using factor analysis as astatistical technique.
METHODThe exploratory factor analysis technique wasused to analyse th e d at a as the investigator didn ot have an y prior theories on the relat ionshipbetween these teaching behaviours. The rawd at a f ro m th e ratings of 112 student teachers on
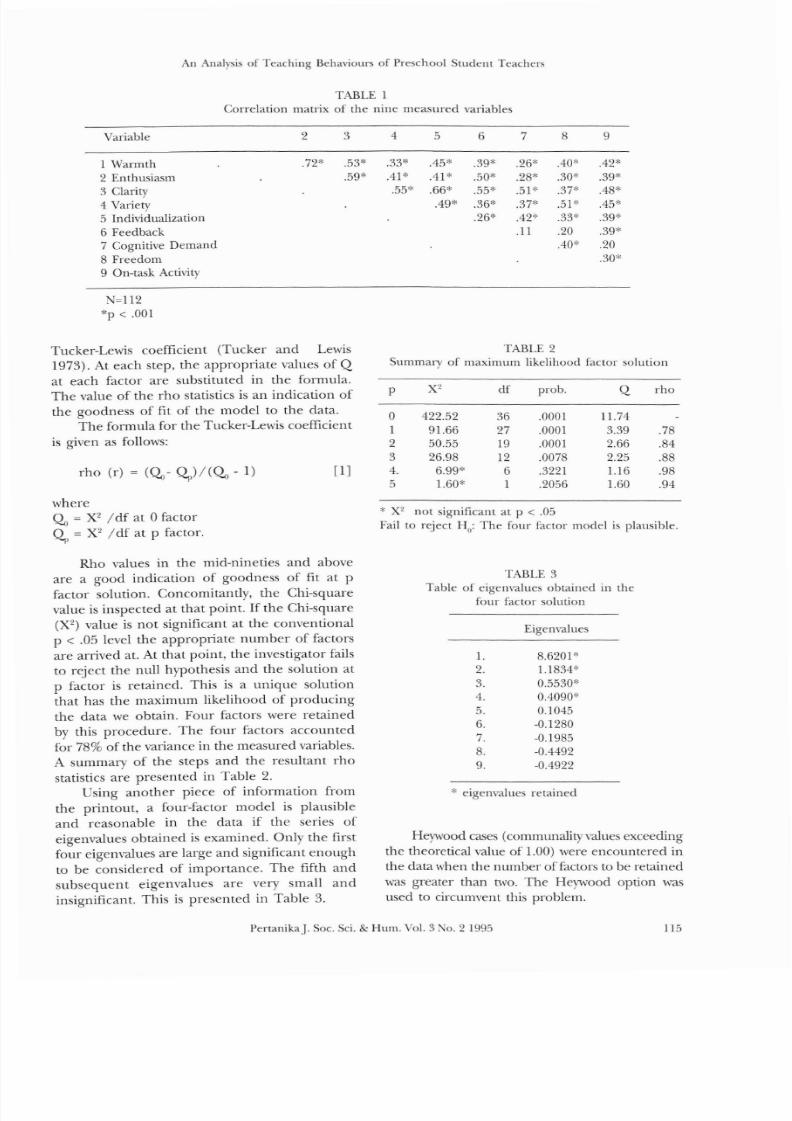
nine measured variables were first reduced to a9 x 9 correlation matrix. T he u pp er triangularmatrix without th e diagonal was used. Thecorrelation matrix showing th e relationship ofth e measured variables is presented in Table 1.
Assum ing that the common factor modelholds, a maximum likelihood method of factorextraction was performed on th e data set, basedon the assumption that fo r m measured variables(MVs) there exists p latent variables (LVs) orfactors that account for the variation andc ova ri ati on i n th e m ea su re d variables. Anothercond i ti on tha t needs to be satisfied is that p<m.
T he Statistical Ana lysi s Sys tem (SAS)program was used for th e analysis due to itssuperior attributes in factor analysis proceduresand options (MacCallum 1983). The max imumlikelihood method of factor analysis was chosenbecause th e investigator was not only providinga description of th e relationship be tw ee n th evariables but also recognizing that t he d at a ca mef rom a popula t ion. Maximum l ikelihoodestimation provides information on whether thedata could have come from a populat ion whereth e common factor model also holds. This wasdone through hypotheses testing at each s tep ofthe m ax im um l ik el ih oo d factor extractionmethod.
Starting with zero factors, that is the variablesar e no t correlated in t he p op ul ati on , t he nullhypothesis is that there is zero common factoragainst an alternative hypothesis that there is atleast one common factor in the measuredvariables . At each s tep, the Q value at p factorhypothesized was calculated. The value of Q isobtained by dividing th e Chi-square (X 2 ) by th erespective degree of freedom at p factor. TheChi-square (X 2
) value a t ea ch step is significantan d th e null hypothesis is re jec ted a t most steps
due to the power of th e test enhanced by th elarge sample size involved. This problem iscircumvented by using th e rh o statistics of th e
114 PertanikaJ. Soc. Sci. & Hum. Vol. 3 No.2 1995
8/7/2019 An Analysis of Teaching Behaviours of Preschool Student
http://slidepdf.com/reader/full/an-analysis-of-teaching-behaviours-of-preschool-student 3/6
An Analysis of Teaching Behaviours of Preschool Student Teachers
TABLE 1Correlation matrix of the nine measured variables
2 3 4 5 6 7 8 9
.72* .53* .33* .45* .39* .26* .40* .42*.59* .41 * .41* .50* .28* .30* .39*
.55* .66* .55* .51* .37* .48*.49* .36* .37* .51* .45*
.26* .42* .33* .39*.11 .20 .39*
.40* .20.30*
1 Warmth2 En th usiasm3 Clarity4 Variety5 Individualization6 Feedback7 Cognitive Demand8 Freedom9 On-task Activity
Variable
N=1l2*p < .001
Tucker-Ley,,js coefficient (Tucker and Lewis1973). At each step, th e appropriate values of Qat each factor are subst itu ted in th e formula.The value of th e rh o statistics is an indication oft he g oo dn es s of fit of th e m od el to th e data.
The formula fo r th e Tucker-LeMs coefficient
is given as follows:
rh o (I') = ( ~ - ~ ) / ( ~- 1)
where~ = X2 I d f at
afactor
~ = X2 I df at p fac to r.
[1 ]
TABLE 2Summary of maximum likelihood factor solution
p X 2 df prob. Q rho
0 422.52 36 .0001 11.741 91.66 27 .0001 3.39 .782 50.55 19 .0001 2.66 .843 26.98 12 .0078 2.25 .884. 6.99* 6 .3221 1.16 .985 1.60* 1 .2056 1.60 .94
* X2 not signif icant at p < .05
Fail to reject H o: The four factor model is plausible.
Rh o values in th e mid-nineties and above
ar e a good indication of goodness of fit at pfactor solut ion. Concomitan tly, th e Chi-squarevalue is inspected at tha t po in t. If th e Chi-square
(X 2 ) value is not significant at the conventionalp < .05 level th e appropriate number of factors
ar e arrived at. At that p oi nt , t he investigator failsto r ej ec t th e null hypothesis and th e solution atp factor is retained. This is a unique solution
that has t he m ax im um likelihood of producingthe data we obtain. Four factors were retainedby this procedure. The four factors accountedfo r 78% of th e variance in the measured variables.A summary of th e steps and t he r es ul ta nt rh ostatistics ar e presented in Table 2.
Using another piece of information from
th e printout, a four-factor model is plausiblean d reasonable in the data if th e series ofeigenvalues obtained is e xa mi ne d. O nl y t he firstfour eigenvalues ar e large and significant enough
to be considered of importance. The fifth andsubsequent eigenvalues are very small andinsignificant. This is presented in Table 3.
TABLE 3Table of eigenvalues obtained in the
four factor solution
Eigenvalues
1. 8.6201*2. 1.1834*3. 0.5530"
4. 0.4090*5. 0.10456. -0.12807. -0.19858. -0.44929. -0.4922
* eigenvalues retained
Heywood cases (communalityvalues exceeding
th e theoretical value of 1.00) were encountered in
th e data when the number of factors to be retained
was greater than two. Th e Heywood option wasused to circumvent this problem.
PertanikaJ. Soc. Sci. & Hum. Vol. 3 No.2 1995 115
8/7/2019 An Analysis of Teaching Behaviours of Preschool Student
http://slidepdf.com/reader/full/an-analysis-of-teaching-behaviours-of-preschool-student 4/6
Zulkifli A. Manaf
Using th e procedure of r ot at io n, t he factormatrix F is rotated in space to achieve a conditiontermed as s imple s t ruc ture (Rummel 1970), withth e objective of achieving simple structure whichwill enhance interpretability. The rotated factor
pattern is presented in Table 4 .In deciding on the kind of rotation to be
performed on the fac tor mat rix, th e Promaxrotation option on th e SAS factor analysispackage was employed first. This is an obl iqu erotation method which allows th e investigator tocorrelate th e factors with each other, if they ar eindeed correlated. Low correlations, e.g. in th elow twenties and below, c ou ld b e r eg ar de d as asign of o rthogona li ty i n the factors. Should thishappen, th e investigator should continue analysis
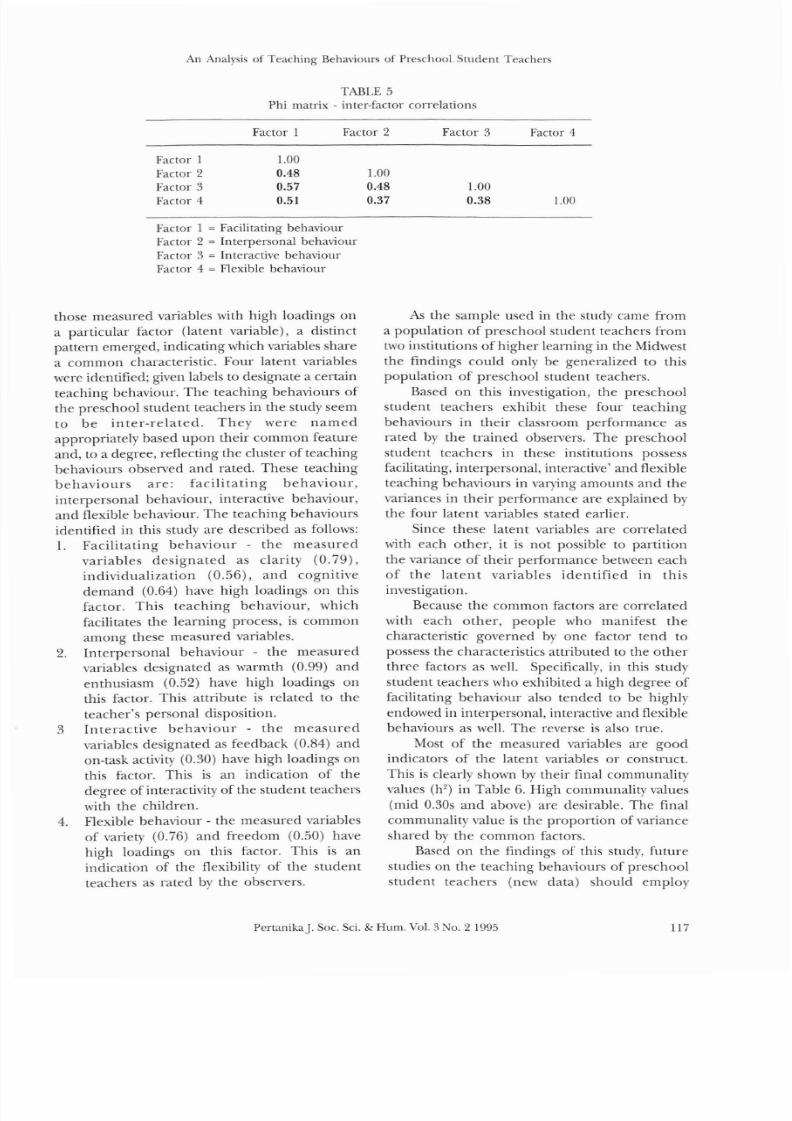
using th e Varimax (orthogonal ) ro ta t ion option .In this data th e P hi ma tri x i nd ic at ed that th efour factors were intercorrelated. Th e Phi matrix
is presented in Table 5.The correlations vary from 0.38 to 0.57
(Table 5 ). T hi s clearly indicates th at t he factorsar e correlated with each other, implying thatpeople wh o ar e high on Factor 1 ar e likely to behigh on th e other three factors. Using orthogonalrotation method of analysis without consideringif th e factors are correlated is imposing unrealistican d unnecessary restrictions on th e factors tryingto be uncovered . This may lead to difficulty anderroneous interpretat ions of th e results.
T h e f actor matrix was rotated using th eHarris-Kaiser class of rotations with the HK powerse t to zero to check if th e factors exhibitedindependent clusters; such clusters were notfound. The Promax rotat ion, however, seems to
provide a cleaner simple structure with betterinterpretability.
FINDINGS AND DISCUSSION
The four factors retained accounted fo r 78% ofth e variances in th e measured variables. What isleft unaccounted for is t he por ti on con tr ibut edby the unique variances associated with eachunique factor and measurement error. Teachingbehaviour is very complex. I t is no t a unitaryattribute that can be observed an d singled ou t
from a single observation of a t eaching episodeof any individual teacher. Different teachersexhibit different teaching behaviours dependingon th e kind of subjects taught, th e level of th estudents, the teacher 's personality and situation.Furthermore, what th e behaviours of the teachersis the product of t he i nt eract io n b et ween th eteacher presage variables an d th e environment,that is t he t each er education cur ri cu lum tha t
they have been exposed to. The ratings givenwere based on the rate rs ' perceptions of what
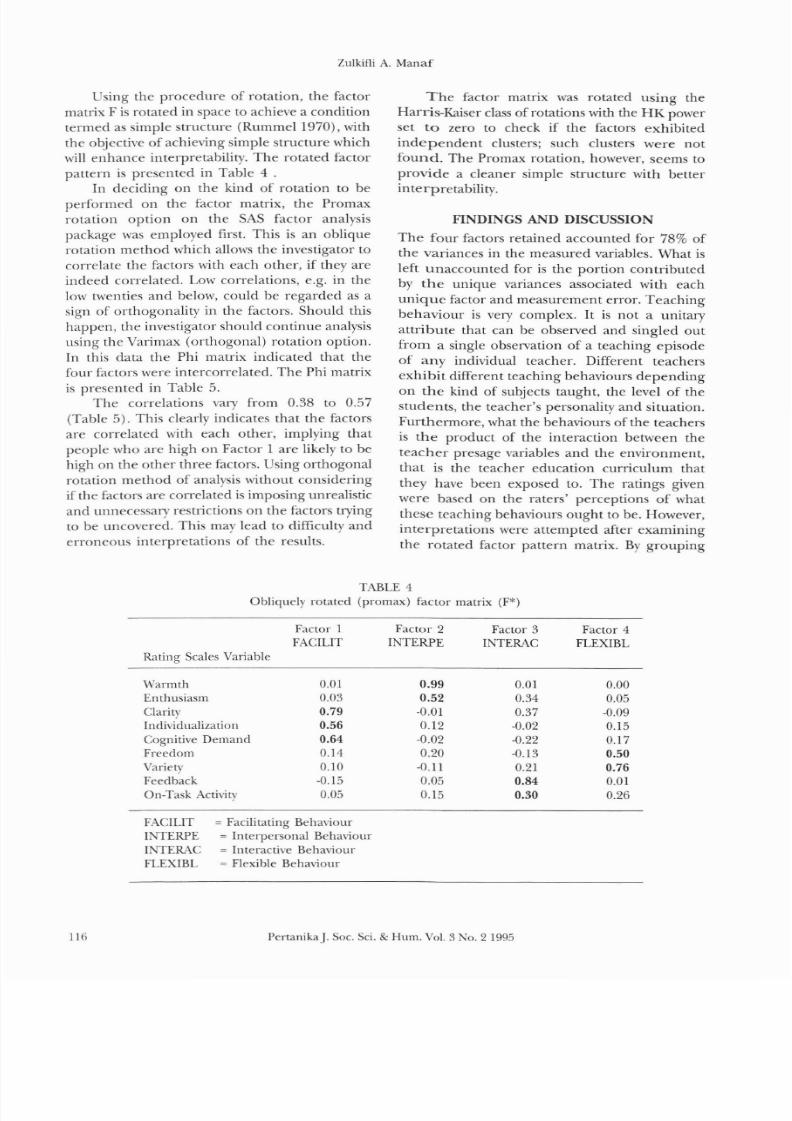
these teaching behaviours ought to be. However,interpretations were attempted after examiningt he r ot at ed factor pattern matrix. By grouping
116
TABLE 4Obliquely rotated (promax) factor matrix (F*)
Factor 1 Factor 2 Factor 3 Factor 4FACILIT INTERPE INTERAC FLEXIBL
Rating Scales Variable
Warmth 0.01 0.99 0.01 0.00Enthusiasm 0.03 0.52 0.34 0.05Clarity 0.79 -0.01 0.37 -0.09Individualization 0.56 0.12 -0.02 0.15Cognitive Demand 0.64 -0.02 -0.22 0.17Freedom 0.14 0.20 -0.13 0.50Variety 0.10 -0.11 0.21 0.76Feedback -0.15 0.05 0.84 0.01On-Task Activity 0.05 0.15 0.30 0.26
FACILIT = Facilitating BehaviourINTERPE = Interpersonal BehaviourINTERAC = Interactive Behaviour
FLEXIBL = Flexible Behaviour
PertanikaJ. Soc. Sci. & Hum. Vol. 3 No.2 1995
8/7/2019 An Analysis of Teaching Behaviours of Preschool Student
http://slidepdf.com/reader/full/an-analysis-of-teaching-behaviours-of-preschool-student 5/6
An Analysis of Teaching Behaviours of Preschool. Student Teachers
TABLE 5Ph i matrix - inter-factor correlations
Factor 1 Factor 2
Factor 1 1.00
Factor 2 0.48 1.00Factor 3 0.57 0.48Factor 4 0.51 0.37
Factor 3
1.000.38
Factor 4
1.00
Factor 1 = Facilitating behaviourFactor 2 = Interpersonal behaviourFactor 3 = Interactive behaviourFactor 4 = Flexible behaviour
those measured variables with high loadings ona p ar ti cu la r f ac to r ( la te nt var iable) , a distinct
pattern emerged, indicating which variables sharea common characteristic. F ou r l at en t variableswere ident if ied; given labels to designate a certainteaching behaviour. The teaching behaviours ofth e preschool student t eachers in th e study seemto be inter- re la ted . They were namedappropriately based upon their common featureand, to a degree, reflecting th e cluster of teachingbehaviours observed and rated. These teachingbehaviours are: f ac il it at in g b eh av io ur ,interpersonal behaviour, interactive behaviour,and flexible behaviour. The teaching behavioursidentified in this study ar e described as follows:1. Facilitating behaviour - the measured
variables designated as c la ri ty ( 0. 79 ),individualization (0.56), and cognitivedemand (0.64) have high loadings on thisfactor. Th is t ea ch in g b eh av io ur , whichfacilitates th e learning process, is commonamong these measured variables.
2. Interpersonal behaviour - the m ea suredvariables designated as warmth (0.99) andenthusiasm (0.52) have high loadings on
this factor. This attribute is related to th eteacher's personal disposition.
3 Interactive behaviour - the measuredvariables designated as feedback (0.84) an don-task activity (0.30) have high loadings onthi s fac tor. This is an indication of th edegree of interactivity of th e student teachers
with th e children.4. Flexible behaviour - t he measu red variables
of variety (0.76) an d freedom (0.50) havehigh loadings on th is factor. This is an
indication of th e flexibility of th e studentteachers as rated by th e observers.
As t he s am pl e used in the study came froma population of preschool student teachers from
two institutions of higher learning in the Midwestth e findings could only be generalized to thispopulation of preschool student teachers.
Based on this investigation, th e preschoolstudent teachers exhibit these fo ur t ea ch in gbehaviours in their classroom performance asrated by th e trained observers. The preschoolstudent teachers in these ins ti tu tions possessfacilitating, interpersonal, interactive' and flexibleteaching behaviours in varying amounts and th evariances in their performance are expla ined byth e four latent variables stated earlier.
Since t he se l at en t variables a re cor re la tedwith each other, it is no t possible to partitionth e variance of their performance between eachof th e la tent variables identif ied in thisinvestigation.
Because th e common factors are corre la tedwith each other, people who manifest th echaracteristic governed by on e factor tend topossess the characteristics attributed to the otherthree factors as well. Specifical ly, in this studystudent teachers who exhibited a high degree of
facilitating behaviour also tended to be highlyendowed in interpersonal, interactive an d flexiblebehaviours as well. The reverse is also true.
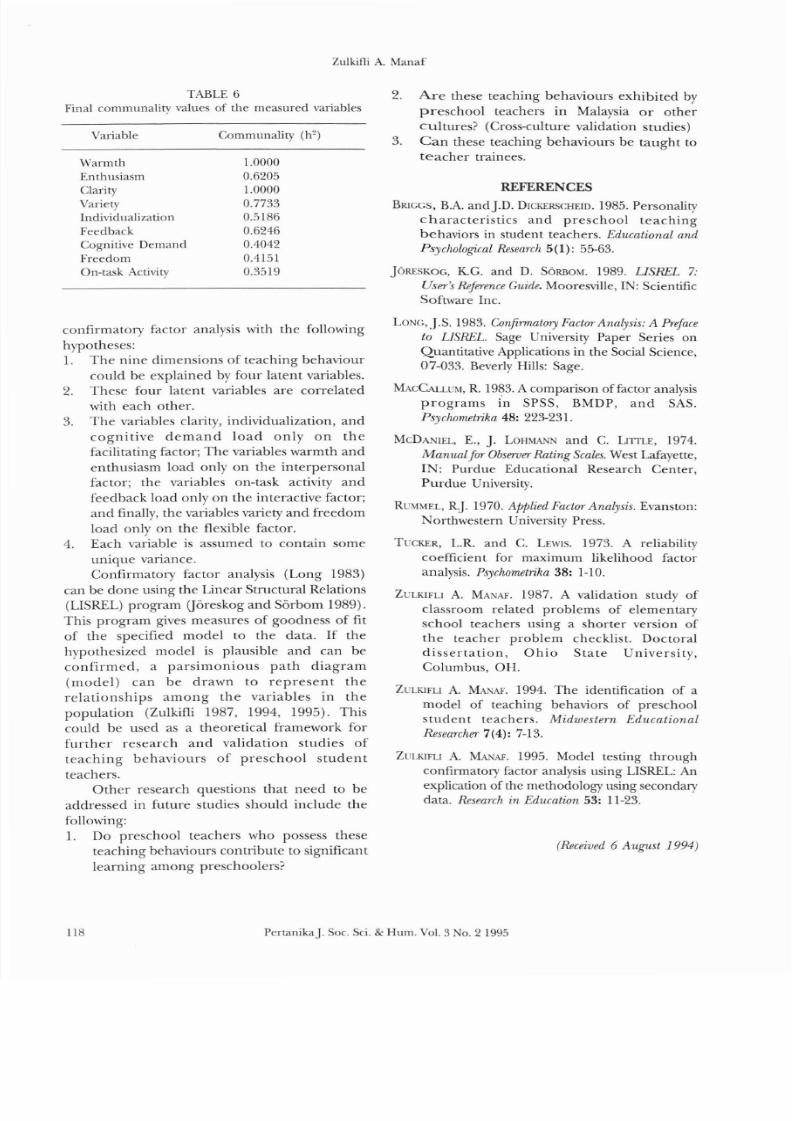
Most of th e measured variables ar e goodindicators of t he l at en t variables or construct.This is clearly shown by their final communalityvalues (h 2 ) in Table 6. High communality values(mid 0.30s and above) ar e desirable. Th e finalcommunality value is the proport ion of varianceshared by t he c om mo n factors.
Based on th e findings of this study, future
studies on th e teaching behaviours of preschoolstudent teachers (new data) should employ
PertanikaJ. Soc. Sci. & Hum. Vol. 3 No.2 1995 117
8/7/2019 An Analysis of Teaching Behaviours of Preschool Student
http://slidepdf.com/reader/full/an-analysis-of-teaching-behaviours-of-preschool-student 6/6
Zulkifli A. Manaf
TABLE 6Final communality values of the measured variables
Variable
WarmthEnthusiasmClarityValietyIndividualizationFeedbackCognitive DemandFreedomOn-task Activity
Communality (h 2 )
1.00000.62051.00000.77330.51860.62460.40420.41510.3519
2. A re these teach ing behaviours exhibited bypreschool teachers in Malaysia o r othercultures? (Cross-culture val idat ion studies)
3. C a n these teach ing behaviours be taught tot e ache r trainees.
REFERENCES
BRIGGS, B A an d J.D. DICKERSCHEID. 1985. Personalityc ha ra ct er is ti cs a nd preschool teachingbehaviors in student teachers. Educational an d
Psychological Research 5(1): 55-63.
JORESKOG, K.G. an d D. SORBOM. 1989. LISREL 7:
User's Reference Guide. Mooresville, IN: ScientificSoftware Inc.
confirmatory factor analysis with the following
hypotheses:1. The nine dimensions of t each ing behaviour
could b e e xp la in ed by four latent variables.2. These four latent variables ar e correlated
with each other.3. The variables clarity, individualization, an d
cogni t ive d e m a n d load only on thefacilitating factor; The variables warmth an de nt hu s ia sm l oa d only o n t he i nt er pe rs on alfactor; th e v ar ia bl es o n- ta sk activity andfeedback load only on th e interactive factor;
and finally, th e variables variety an d freedom
load only on th e flexible factor.
4. Each variable is assumed to contain some
unique variance.Confi rmatory factor analysis (Long 1983)
ca n be done using the Linear Structural Relations
(LISREL) program (Joreskog an d Sorbom 1989).
This program gives measures of goodness of fi tof the specified model to the data. I f thehypothesized model is plausible and ca n beconf i rmed, a pars imonious pa th diagram(m odel) can be draw n to r ep re sen t the
re la t ionships am ong the variables in thepopulation (Zulkifli 1987, 1994, 1995). This
could be used as a theoret ica l f ramework fo rfur ther research and v al id at io n s tu di es ofteaching behaviours of preschool s tuden tteachers.
Other research ques t ions that need to be
a dd re ss ed i n future studies should include th e
following:1. D o p re sc ho ol te ach er s wh o possess these
teaching behaviours contribute to signif icant
learning among preschoolers?
LONG, l.S. 1983. Confirmatory Factor Analysis: A Prefaceto L IS REL . Sage University Paper Series onQuantitative Applications in th e Social Science,07-033. Beverly Hills: Sage.
MACCALLUM, R. 1983. A comparison of factor analysisprog rams iOn SPSS, BMDP, and SAS.Psychometrika 48: 223-231.
McDANIEL, E., J. LOHMAN and C. LIlTLE, 1974.Manual for Observer Rating Scales. West Lafayette,IN : Purdue Educa tiona l Research Center,Purdue University.
RUMMEL, RJ . 1970. Applied Factor Analysis. Evanston:
Northwestern University Press.
TUCKER, L.R. an d C. LEWIS. 1973. A reliabilitycoefficient for maximum likelihood factoranalysis. Psychometrika 38: 1-10.
ZULlUFLI A. MANAF. 1987. A validation study ofc la ss ro om r el at ed problems of elementaryschool t ea ch er s u si ng a shorter version ofth e t ea ch er p ro bl em checklist. Doctorald isse rta tion , O hio Sta te Universi ty,C ol um b us , O H.
ZULKIFLI A. MANAF. 1994. The identification of amodel of teaching behaviors of preschoolstuden t teachers. Midwestern EducationalResearcher 7(4): 7-13.
ZULKIFLI A. MANAF. 1995. Model t es ting throughconfirmatory factor analysis using LISREL: An
explication of the methodology using secondarydata. Research in Education 53: 11-23.
(Received 6 Augus t 1994)
118 PertanikaJ. Soc. Sci. & Hum. Vol. 3 0.21995