Embed Size (px)
Citation preview

An Analysis of Trends in Vulnerabilities of the NVD Database
Matthew Eltze
Abstract
The NVD is the U.S. government repository of standards-based vulnerability management data represented using the Security Content Automation Protocol (SCAP). This data enables automation of vulnerability management, security measurement, and compliance. The NVD includes databases of security checklist references, security-related software flaws, misconfigurations, product names, and impact metrics.
This paper seeks to analyze trends in these vulnerabilities and how they have changed over time. By analyzing trends in vulnerabilities, we hope to better understand how to prepare for future vulnerabilities.
Keywords
CVSS, CVSSv2, NVD, CWE, CVE, Vulnerability, Security Trends
1.) Introduction
As we as an industry become increasingly web-focused security becomes a greater requirement as more critical applications become exposed to web traffic. For this reason, it’s important for us to understand how the changes of the industry impact the development of security.
We examined the trends of what vulnerabilities are becoming more severe and how the landscape of security flaws is changing. With knowledge of these trends we can better prepare ourselves for future vulnerabilities.
2.) Related Works
The other paper, resources used.
The NVD database [4] is a repository of security vulnerabilities run by the United States government. It contains a series of CVEs (Common Vulnerabilities and Exposures) that have been scored via the CVSS scoring guidelines. The CVE system [2] gives ids to specific vulnerabilities. These may be software flaws, misconfigurations, and other potentially vulnerable systems. They are maintained within the MITRE CVE dictionary. [4] The earliest entries in the database predate 2002, however are categorized as belong to the year 2002 in the dataset. For this reason, we have selected 2002 as the first year to analyze in our dataset.
The CVSS scoring guideline [5] is a free and open standard for accessing vulnerabilities. It allows for the scoring of CVEs. They examine the scope of the vulnerability, the ease of exploitation and potential for damage and score them in each category. Due to its flexible design it can be used to grade vulnerabilities across many platforms both hardware and software based. CVSSv2 was chosen due to its backwards compatibility with earlier years in the NVD database.

While the guidelines are managed by Forum of Incident Response and Security Teams (FIRST) [6]
the scores are created by product vendors, vulnerability bulletin analysts, and other security professionals who are more familiar with a specific vulnerability.
This paper builds off the paper Analyzing Trends in Vulnerability Classes across CVSS Metrics from Anshu Tripathi and Umesh Kumar Singh. [7] In this paper we extend their work on the common vulnerability trends using CVSS metrics up to 2017 and utilize the newer CVSSv2 metric. We then build off of this new data to examine the most severe CWE categories in recent years.
3.) Common Trends
Before we analyzed more specific trends, we felt it would be useful to show the trends in the NVD database across its entire life. By utilizing the CVSSv2 metric we are able to get a year-by-year look at the average scoring by year. We began with 2002, the earliest year presented in the database up to 2017. The current year, 2018, was ignored due to the year not having been complete as well as the high percentage of CVEs yet to be scored.
Fig 1. Average CVSSV2 Score by Year
As we see in Fig 1, the score of a CVE generated by a function based on how impactful and exploitable the vulnerability is. The average vulnerability score has remained largely consistent over time. The error bars of the graph represent the standard deviation of this metric. The standard deviation is also largely consistent over time.
Fig 2. Average CVSSV2 Severity by Year

Severity level provides a qualitative ranking for the CVSSv2 scores. Low is 0.0-3.9, Medium is 4.0-6.9, and High is 7.0-10.0. [5] We can see that the share of vulnerabilities classified as Medium has increased over time. The share of Low severity CVEs decrease through the 2004 to 2008 but rebounded and has been fairly stable at around 10% of CVEs. On average we’ve seen a decrease in the portion of vulnerabilities that are severe, and an increase in medium severity vulnerabilities in their place.
Fig 3. Average CVSSV2 Source Vector by Year
Vector is a metric that shows how the Vulnerability can be exploited. Local-based attacks are the least severe attacks, in which the attacker must already have access to the machine, either physically or via a local shell account. Adjacent Network exploits allow for attacks via broadcast or collision domain. An example of this would be via Bluetooth or local ethernet. Network based attacks do not require the attacker to have access to anything locally. Vulnerabilities in this class as “remotely-exploitable” and therefore the most severe. [1]
The proportion of attack Vectors has largely stayed the same since 2006, apart from adjacent network exploits which have grown. There is an outlier in 2014 which can be attributed to a large number of a specific exploit in mobile applications with improper cryptography (CWE-310). In specific Android applications which didn’t verify X.509 certificates from SSL servers, which allows man-in-the-middle attacks.
Fig 4. Average CVSSV2 Access Complexity by Year

Access complexity is a measure of how easy it is to exploit the vulnerability. To be a High complexity exploit there must be specialized conditions in place already. For example, the attack must already have elevated privileges, or the attacked system have an uncommon configuration. Medium complexity exploits include things such as phishing which require the user to fall for the exploit. Some information about the system is required or some setup, and therefore isn’t a general exploit. Low complexity exploits are general exploits or require minimal information about the system. [1]
The number of low complexities exploits consistently decreased until 2007, where all three categories have stayed largely consistent.
Fig 5. Average CVSSV2 Authentication Vector by Year
Authentication vector is a measure of how many times the attacker is required to input credentials before making the attack. This metric doesn’t gauge the strength of the authentication, just the number of times it is required. [1]
There has been a growth in single authentication attacks. We were unable to identify the cause of this growth.
Fig 6. Average CVSSV2 Confidentiality Impact by Year
Confidentiality Impact measures how much data is disclosed to the attackers. [1] There is considerable variability in this metric throughout the years. There was a downward trend in partial confidentiality exploits until 2014 where it rebounded. This is in part due to the same outlier found in the access vector. However, we see a similar growth in 2017.

Fig 6. Average CVSSV2 Integrity Impact by Year
Integrity Impact is a measure of how much of the exploited machine’s data is potentially subject to having been modified or damage. A complete system integrity loss would have the potentiality that all the files on the machine are subject to having been modified. A partial system integrity loss either means the attacker has no control over what is modified, but can make some modification, or the scope of what can be modified isn’t complete. [1]
Fig 7. Average CVSSV2 Availability Impact by Year
Availability Impact is a measure of how accessible the system under attack is during/after the attack. A partial score means that the system is accessible but has reduced performance or interruptions. A complete score means that full denial of service has occurred, and the system is unavailable. [1]
4.) Trends of the Most Severe Vulnerabilities
We wanted to examine the trends in the more severe CVE’s and see how trends have changed in the most dangerous vulnerabilities. For this reason, we selected the CWE’s that have the highest occurrence rate of high severity CVE’s. 4 CWE’s have been selected.
We examined the data starting in 2011, as CWE categorization wasn’t as well supported in years prior to this making proper prediction difficult.

CWE-20 Improper Input Validation is a class that generally defines improper handling of user input and is closely associated with injection vulnerabilities. CWE-89 Improper Neutralization of Special Elements used in SQL commands. CWE-119 Improper Restriction of Operations within the Bounds of a Memory Buffer. CWE-264 Permissions, Privileges, and Access Controls. By their nature these CWE classes are high severity due to their ability to allow for remote code execution allowing outside users.
Fig 8. Average CVSSV2 Average Severity by Year
The average score of the selected CWE’s remained largely consistent with the exception of CWE-264 (Permissions, Privileges, and Access Controls) which has become more severe over time. The implication is that these CWEs are frequently severe and damaging when they occur.
4a.) Trends in CWE-20, Improper Input Validation
Fig 9. Percent Severity of CWE-20 by Year

We saw very little change in the how severe improper inputs were. Because of how general this category is, and the level of severity is more variable amongst exploits in this category. Being the least severe of the examined CWEs, but the most frequent in occurrence rate roughly about 60% of CVEs within this category were classed as being of medium severity.
Fig 10. Complexity of CWE-20 by Year
As shown by figure xii we’re seeing a growth in low complexity exploits. This may suggest that our input validation has become more lax over the recent years.
Fig 11. Authentication of CWE-20 by Year
We’re seeing more vulnerabilities requiring authentication before they can be executed. While this is positive progress, the vast majority of exploits for improper input validation still require no authentication.

Fig 12. Confidentiality of CWE-20 by Year
In a positive trend we are seeing fewer vulnerabilities that significant data exposure due to improper validation.
Fig 13. Data Integrity of CWE-20 by Year
Fewer improper input validation attacks are resulting in a loss of data integrity.
4b.) Trends in CWE-89, Improper Neutralization of Special Elements used in SQL commands

Fig 14. Percent Severity of CWE-89 by Year
SQL injection shows to be becoming less severe. While SQL injections are always at least of medium severity based on their nature.
Fig 15. Authentication of CWE-89 by Year
We’re seeing a large increase in SQL injections that require authentication before exploit. This suggests that while we’re sanitizing our input from anonymous users better, we aren’t doing the same for authenticated users.
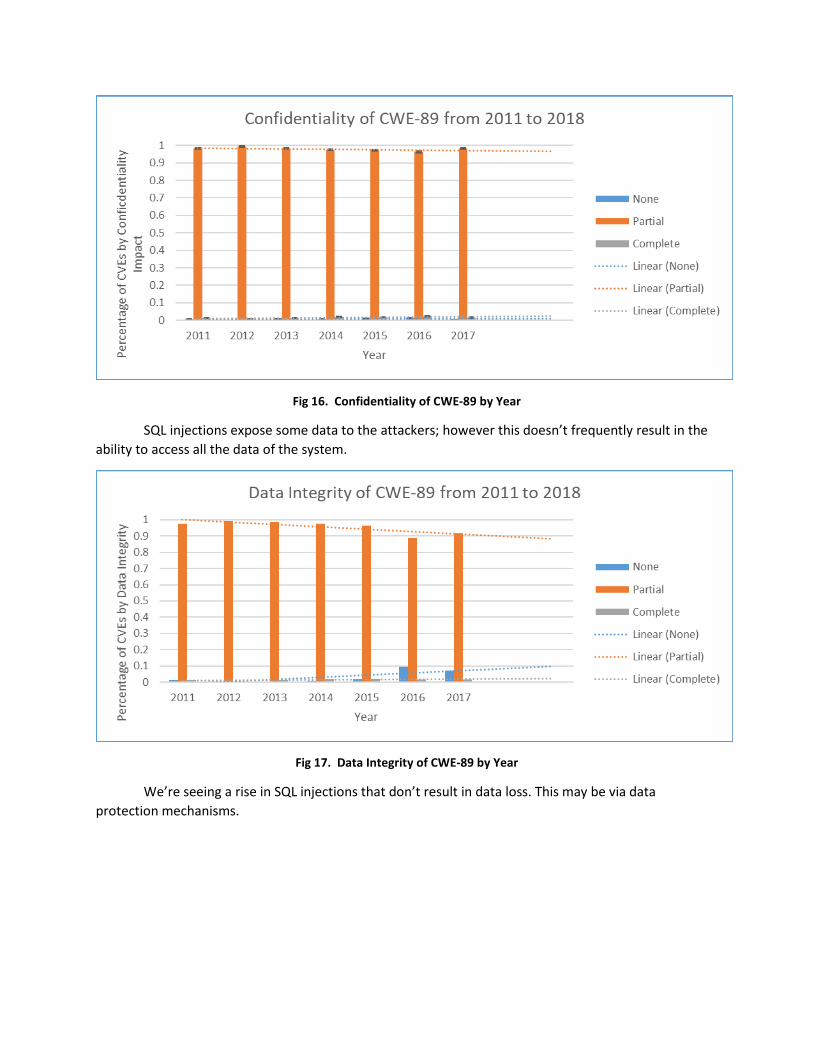
Fig 16. Confidentiality of CWE-89 by Year
SQL injections expose some data to the attackers; however this doesn’t frequently result in the ability to access all the data of the system.
Fig 17. Data Integrity of CWE-89 by Year
We’re seeing a rise in SQL injections that don’t result in data loss. This may be via data protection mechanisms.

Fig 18. Availability of CWE-89 by Year
SQL injection attacks have the potential to disrupt services through such methods as a fork bomb or the destruction of important tables.
4c.) Trends in CWE-119, Improper Restriction of Operations within the Bounds of a Memory Buffer
Fig 19. Percent Severity of CWE-119 by Year
Improper Restriction of Operations within the Bounds of a Memory Buffer tells a similar story to SQL injection. On average, the exploits using these techniques have become less severe.
Fig 20. Confidentiality Impact of CWE-119 by Year
One of the goals of memory-buffer attacks is that it gives you access to the memory of the system. In a positive trend fewer of these attacks are exposing the whole of the system. This may be due to memory bounds that are more strict but still exploitable as well as changes in architecture.
Fig 21. Data Integrity of CWE-119 by Year
Fewer memory-buffer exploits are resulting in total data loss. For memory-buffer exploits the data confidentiality and data integrity are nearly 1:1 correlated. Exploits that allow access to data also can cause the alteration or destruction of that data.

Fig 22. Availability of CWE-119 by Year
4d.) Trends in CWE-264, Permissions, Privileges, and Access Controls
Fig 23. Percent Severity of CWE-264 by Year
Permissions, Privileges, and Access Controls are an interesting CWE to examine because on average CVEs that use this class of exploits are becoming more severe. As we grow into a more web focused environment proper access control becomes a more frequent issue. More tools that we use daily have some form of authentication.

Fig 24. Vector of CWE-264 by Year
We’re seeing a rise in locally-based Permissions, Privileges, and Access Control Vulnerabilities. The raw number of network vulnerabilities has stayed largely constant. This may suggest that there has been less focus on securing locally hosted programs.
Fig 25. Authentication of CWE-264 by Year
The authentication requirements for CVEs in CWE-264 are an interesting category to consider. Vulnerabilities in this category that require authentication before exploitation might include attacks such as bad permission settings or elevation without proper permissions. This category has seen a slight decrease in attacks requiring you to be authenticated however the change isn’t significant.

Fig 26. Data Confidentiality of CWE-264 by Year
Fig 27. Data Integrity of CWE-264 by Year
As with memory-buffer exploits there is a very strong correlation between data integrity and data confidentiality. Data accessible at a certain level of authentication is often also alterable by that same level of user.
Conclusion From early 2000s to 2012 we have gotten we’ve gotten better at securing our computers and networks. In our more internet focused world, more attacks are network-based exploits. On average attacks need to be more complex than in the past to be successful, we haven’t made significant

improvement since the 2010s. This may be due to more exploits requiring authentication before exploitation. While we’ve been seeing positive trends in most of the CWE’s that we observed, Improper Authentication is more dangerous than ever. More of these exploits are resulting in larger damages to system data. Further research could examine more CWE’s. There is also potential to investigate specific vendors and trends within CVE’s specific to that vendor. Another potential target would be to take CVE’s with similar profiles and attempt to intelligently classify them by CWE. Works Cited [1] https://www.first.org/cvss/v2 guide A Complete Guide to the Common Vulnerability Scoring System Version 2.0, Peter Mell, Karen Scarfone, Sasha Romanosky [2] https://cve.mitre.org/about/cve_and_nvd_relationship.html CVE and NVD Relationship CVE and
NVD Are Two Separate Programs
[3] https://www.owasp.org/index.php/Buffer_Overflow
[4] https://nvd.nist.gov/general National Vulnerability Database, General Information
[5] https://nvd.nist.gov/vuln-metrics/cvss National Vulnerability Database, Vulnerability Metrics
[6] https://www.first.org/cvss/ Common Vulnerability Scoring System SIG
[7] http://citeseerx.ist.psu.edu/viewdoc/download?doi=10.1.1.461.6295&rep=rep1&type=pdf Analyzing Trends in Vulnerability Classes across CVSS Metrics, Anshu Tripathi, Umesh Kumar Singh
Appendix.
All graphs for CWE-20, Improper Input Validation

All graphs for CWE-89, SQL Injection

All graphs for CWE-119, Improper Restriction of Operations within the Bounds of a Memory Buffer

All graphs CWE-264, Permissions, Privileges, and Access Controls

![High-performance milling cutter NX-NVD - FRAISA SA milling cutter NX-NVD [ 2 ] The NX-NVD high-performance milling cutter with patented double groove ... 20 4 120 0.110 30.0 8.0 1910](https://img.pdfslide.net/doc/110x75/5aab05447f8b9aa06a8b6ee0/high-performance-milling-cutter-nx-nvd-fraisa-sa-milling-cutter-nx-nvd-2-the.jpg)