Embed Size (px)
Citation preview
Dottorato di ricerca In Dipartimento di Scienze Economiche Scuola di dottorato in Science and Management of Climate Change 23° ciclo (A.A. 2007-2011) ECONOMIC ASSESSMENT OF CLIMATE CHAGNE IMPACTS ON BIODIVERSITY, ECOSYSTEM SERVICES AND HUMAN WELL-BEING An Application to European Forest Ecosystems
SETTORI SCIENTIFICO-DISCIPLINARI DI AFFERENZA: SECS-P/05 ECONOMETRIA SECS-P/06 ECONOMIA APPLICATA Tesi di dottorato di Hongyu Ding, matricola n.955424 Direttore della Scuola di dottorato Tutori del dottorando Prof. Carlo Giupponi Prof. Carlo Carraro Dr. Paulo A.L.D. Nunes
Copyright @ Department of Economics, Ca’Foscari University of Venice Venice – Italy, 2011
Suggested citation: Ding, H. (2011) Economic Assessment of Climate Change Impacts on Biodiversity, Ecosystem Services and Human Wellbeing: An Application to European Forest Ecosystems, Doctoral dissertation submitted in January 2011 to the Department of Economics, Ca’Foscari University of Venice, Italy

PhD Dissertation
Economic Assessment of Climate Change Impacts on Biodiversity, Ecosystem Services and Human
Wellbeing
An Application to European Forest Ecosystems by
Hongyu Ding
‐January 2011‐
Department of Economics, Ca’Foscari University of Venice, Italy


This work is dedicated to my beloved parents
(仅以此论文献给我挚爱的父亲母亲)
For every Creature of unfallen Nature, call it by what name you Will,
has its Form, and Power, and State, and Place in Nature,
for no other End, but to open and enjoy,
to manifest and rejoice in some Share of the Love, and Happiness, and Goodness of the Deity, as springing forth in the boundless Height
and Depth of Nature.
‘The Spirit of Love’ - William Law (1754)


Economic Assessment of Climate Change Impacts on Biodiversity, Ecosystem Services and Human Well-being
i
ACKNOWLEDGEMENTS
I am indebted to my two supervisors Carlo Carraro and Paulo A.L.D. Nunes, whose guidance and support over the past three years has made this PhD dissertation possible. Especially, I would like to thank Professor Carraro for providing me with an excellent opportunity to work at the Fondazione Eni Enrico Mattei, one of the top research institutes in Europe, where I have gained extensive experience in research and international collaboration. I owe a thousand thanks to Paulo, a great supervisor and most enthusiastic team leader at work, who has shaped my way of thinking in many issues, not only economics. I am grateful for his constant provision of resourceful inspiration, promptness, patience and the trust he has placed in me.
I owe many thanks to my research team at FEEM. It was true honor and pleasure to work with a host of excellent researchers including Aline Chiabai, Silvia Silvestri and Andrea Ghermandi, who have all contributed to shaping the ideas presented in this manuscript. I am grateful for their endless encouragement and generosity in sharing knowledge over the past years working together. Also, I would like to thank Anna Alberini for hosting me in the Department of Agricultural and Resource Economics at the University of Maryland for two months, which has been an essential period for strengthening my knowledge in econometrics.
I want to express my special thanks to the European Investment Bank and DG Environment at the European Commission. Without their financial support, this research would not have been possible. I am also very grateful to Anil Markandya, Peter Carter, Matt Rayment, Stephen White, Aude Neuville, Alexandra Vakrou as well as many other participants at the past EAERE and BIOECON conferences and workshops, where this work has been presented.
Particular merit is given to all my former and present colleague‐friends at FEEM Venice for the amazing atmosphere at work, the warmest Italian hospitality, and their constant willingness to help. In particular, I want to thank Lorenza Campagnolo for being my free postman, Italian interpreter and letting me access to her collection of economic textbooks. I want also to thank Angela Falconer, who has generously offered her language support during the last weeks of writing. I would also like to thank our excellent supporting crew at FEEM Venice for their kindness and responsiveness: Francesca, Federica, two Martina’s, Alessandra, Monica and Soraya. Special thank goes to our technician Carlo for his super computer skills that had saved my computer from several virus attacks.
I am thankful for the great support of our two PhD Secretariats, Agnese and Marni in the economic department, and for their patience and help especially when I was lost in a file of Italian documents.
I want also to thank all my friends in China, Italy, the rest of Europe, and all over the world. Too many names to be mentioned, I want to thank them for being always there for me, lighting up my world, warming my heart, comforting and supporting me in many ways. With their support, I have been able to gather the courage to see my research work through from beginning to end, to walk down a long road on a journey into the future and the way forward.
Last, but not least, I want to thank my parents for their great love for me, for giving me always the best they can, for shaping me into a steel‐willed person, and for teaching me to love and appreciate life.
Helen Ding 18 January 2011, in Venice

An Application to European Forest Ecosystems
ii
Economic Assessment of Climate Change Impacts on Biodiversity, Ecosystem Services and Human Well-being
iii
SUMMARY
This doctoral dissertation is inspired by the major environmental and socio‐economic challenges
faced by biologists, climate scientists, economists and policymakers today, and is dedicated to the
state‐of‐the‐art literature in the cross‐cutting research area where biodiversity economics and
climate economics blend. In particular, this work is conducted by (1) developing a holistic, well‐
accepted approach that explores the mapping of complex links between climate change,
biodiversity, ecosystem services and human welfare in numerical terms; (2) further extending the
state‐of‐the‐art methodologies so as to monetize the climate change induced impacts on
biodiversity, ecosystem services and human wellbeing; and, (3) promoting and discussing the
incorporation of the valuation results into the support of policy making, including ecosystem‐
based climate change mitigation policies as well as ecosystem‐based welfare re‐distributional
policies. Finally, this dissertation demonstrates that the implementations of social and
environmental policies are not always conflicting, but rather supplementary to each other.
An Application to European Forest Ecosystems
iv
SOMMARIO (IN ITALIAN) Questa dissertazione trae ispirazione dalle grandi sfide ambientali e socio‐economiche che biologi,
scienziati climatici e decisori oggi devono affrontare, e si focalizza sullo stato dell'arte di quell’area
di ricerca, dove economia della biodiversità ed economia del clima si fondono. In particolare,
questo lavoro si propone di (1) sviluppare un approccio olistico che esplora empiricamente la
complessa rete d’inter‐relazioni tra cambiamenti climatici, biodiversità, servizi dell’ecosistema e
benessere umano; (2) estendere le metodologie, comunemente utilizzate in letteratura, in modo
da monetizzare gli impatti generati dai cambiamenti climatici su biodiversità, servizi dell’
ecosistema e benessere umano; (3) promuovere e discutere l’introduzione della valutazione
ambientale come supporto per le decisioni, per esempio includendo delle politiche di mitigazione
dei cambiamenti climatici oppure redistributive del benessere tutte incentrate sull’ecosistema. In
conclusione il lavoro dimostra come la realizzazione di politiche ambientali non sia sempre in
contrasto con le politiche sociali, ma piuttosto possa essere fonte di sinergie.
Economic Assessment of Climate Change Impacts on Biodiversity, Ecosystem Services and Human Well-being
v
TABLE OF CONTENTS
ACKNOWLEDGEMENTS.......................................................................................................................................... I SUMMARY ............................................................................................................................................................. III SOMMARIO (IN ITALIAN) ...................................................................................................................................... IV CHAPTER 1 INTRODUCTION .................................................................................................................................1 1.1 Motivation .................................................................................................................................................................... 1 1.2 Research Framework............................................................................................................................................... 3 1.3 Objectives and Outline of the Study .................................................................................................................. 6
CHAPTER 2 VALUING THE CLIMATE CHANGE IMPACTS ON EUROPEAN FOREST ECOSYSTEMS INTO THE FUTURE................................................................................................................................................................ 10 2.1 Introduction...............................................................................................................................................................11 2.2 Climate Change Impacts and European Forest Ecosystems .................................................................13 2.3 Projecting the Future Changes of Forest Ecosystem Goods and Services due to Climate Change .................................................................................................................................................................................17 2.4 Economic Valuation of European Forest Ecosystems in the Context of Climate Change.........22 2.5 Conclusions ................................................................................................................................................................37
CHAPTER 3 WHEN MICRO- AND MACRO-ECONOMICS MEET TOGETHER TO REVEAL THE TRUE VALUE OF CLIMATE CHANGE IMPACT, CONFLICTS OR COMPLEMENT? ........................................................................ 44 3.1 Introduction...............................................................................................................................................................45 3.2 A Review of Economic Valuation Approaches to Value Climate Change Impacts on Nature .47 3.3 Developing a Partial‐general Equilibrium Perspective Using ICES Model .....................................52 3.4 Lessons Learned from Micro‐and Macro‐ Economic Valuation Approaches to Estimate the Value of Ecosystem Services and the Respective Policy Implications .....................................................58 3.5 Conclusions ................................................................................................................................................................60
CHAPTER 4 MODELING THE LINKS BETWEEN BIODIVERSITY, ECOSYSTEM SERVICES AND HUMAN WELL-BEING IN THE CONTEXT OF CLIMATE CHANGE: RESULTS OF AN ECONOMETRIC EXERCISE TO THE EUROPEAN FORESTS ........................................................................................................................................ 63 4.1 Introduction...............................................................................................................................................................64 4.2 The Future Pattern of Biodiversity in the Context of Climate Change .............................................66 4.3 The Construction of Simple Composite Biodiversity Indicator...........................................................70 4.4 The Econometric Model........................................................................................................................................76 4.5 Concluding Remarks and Further Research ................................................................................................85
CHAPTER 5 THE SOCIAL DIMENSION OF BIODIVERSITY POLICY IN THE EUROPEAN UNION: VALUING BIODIVERSITY BENEFITS TO VULNERABLE GROUPS .................................................................................... 89 5.1 Introduction...............................................................................................................................................................90 5.2 Methodology..............................................................................................................................................................92 5.3 Data................................................................................................................................................................................95 5.4 Spatial Analysis of the Dependency of Human Livelihoods on Benefits of Biodiversity and Ecosystem Services in Europe................................................................................................................................103 5.5 Conclusions and Policy Recommendations for the EU.........................................................................113
CHAPTER 6 CONCLUSIONS .............................................................................................................................119 6.1 Research Conclusions.........................................................................................................................................119 6.2 Policy Implications ..............................................................................................................................................127

An Application to European Forest Ecosystems
vi
6.3 Limitations and Future Research ..................................................................................................................130 BIBLIOGRAPHY..................................................................................................................................................133 ACRONYM ..........................................................................................................................................................140 APPENDIX ..........................................................................................................................................................141 CURRICULUM VITAE .........................................................................................................................................165
Economic Assessment of Climate Change Impacts on Biodiversity, Ecosystem Services and Human Well-being
1
CHAPTER 1 INTRODUCTION
1.1 Motivation
The publication of The Economics of Climate Change: the Stern Review in 2006 (Stern, 2006) has
inspired an unprecedented outpouring of high quality economics articles on climate change ever
since (Heal, 2008). Neoclassical economic theories have been extensively applied in the
estimation of the costs of climate change to our economy and have led to a stably growing number
of Integrated Assessment Models1 (IAMs), which integrate the economic aspects of climate change
with the science and dynamics of the climate system. In particular, by incorporating a climate
change damage function, the IAMs are able to translate a given set of physical, environmental and
social impacts into monetary units such as percentage of GDP, at different scales and over time
(Bosetti, et al. 2009). These results are fundamental to the understanding of trade‐offs between
avoided impacts and the costs of reducing greenhouse gas (GHG) emissions. However, the current
literature has shown, by far, very little effort in the economic valuation of climate change impacts
on natural capital and ecosystem services (Tol, 2005; Heal, 2008). In a recent meta‐review of
climate economic studies (Heal, 2008), Geoffrey Heal commented that “we need to better
understand how climate change affects natural capital – the natural environment and ecosystem
comprising it – and how this in turn affects human welfare” Today, our research on the impact of
climate change on natural capital remains crude within IAMs. In this context, additional research
efforts need to be allocated in the development of economic models more disaggregated than
those IAMs, which have been used to date, bringing along with it the natural capital/ecosystem
services into the analysis (Heal, 2008).
Despite these modeling shortcomings, the role of biodiversity in underpinning ecosystem and
supporting human wellbeing has long been a topic of interest in research and public policy. From
the 1992 United Nations Conference on Environment and Development in Rio de Janeiro, to the
recent major international initiatives, including the 2005 Millennium Ecosystem Assessment (MA)
1 Among the many IAMs that have become available in the literature, the most representative can be considered to be the DICE/RICE (Nordhaus and Boyer, 2000 for an exhaustive review), the Mendelshon model (Mendelshon et al., 1998), Fund (Tol, 2002, 2002a), PAGE (Hope, 2003) and MERGE (Manne et al., 1995; Manne and Richels, 2004) models. A first review of these models appeared in Third Assessment Report (IPCC, 2001), which mostly describes the results from Mendelshon, Tol and Nordhaus. Warren (2006) provides an updated review of the FUND, DICE/RICE, MERGE and PAGE models.

An Application to European Forest Ecosystems
2
promoted by the United Nations’ Convention on Biological Diversity (CBD) and the 2008
Economics of Ecosystems and Biodiversity study (TEEB) initiated by the European Commission,
the global community has successfully triggered a range of awareness campaigns that promote
the understanding of the economic consequences of biodiversity loss and ecosystem degradation
to our socio‐economic system across the globe. This concept is related to the United Nations’
Millennium Development Goals and explores the potential of utilizing natural conservation as an
economical substitute to the climate change mitigation technologies (e.g. Reducing Emission from
Deforestation and forest degradation in Developing countries ‐ REDD). Most recently, the
successes of the two COP meetings held in 2010 (i.e. the UNFCCC‐COP16 climate meeting in
Cancun and the CBD‐COP10 biodiversity meeting in Nagoya) have reaffirmed the crucial
importance of biodiversity conservation, realizing its multiple benefits in terms of reducing the
atmospheric concentration of GHGs as well as the long‐term sustainability of human welfare. Both
conferences have reiterated (1) the recognition of biodiversity and ecosystem services value, a
feature of all human societies and communities; (2) the role of economic valuation in
demonstrating the value of biodiversity and ecosystem services to support decision making; and,
(3) the importance of introducing mechanisms that capture and incorporate the values of
ecosystems into decision making.
Against this background, this present doctoral dissertation aims to contribute to this challenging
research area by addressing economic valuation of biodiversity and ecosystem services in the
context of global change, especially climate change. In particular, this work is conducted by (1)
building on a holistic, well‐accepted approach that explores the mapping of the complex links
between climate change, biodiversity, ecosystem services and human welfare in numerical terms;
(2) extending the state‐of‐the‐art methodologies so as to monetize the climate change induced
impacts on biodiversity, ecosystem services and human wellbeing; and, (3) promoting and
discussing the incorporation of the valuations results into policy decision‐making, including
ecosystem‐based climate change mitigation policies (such as REDD) as well as ecosystem‐based
welfare re‐distributional policies such as payments for ecosystem services (PES). As we will
demonstrate, the implementations of social and environmental policies are not always conflicting,
but rather complementary to each other. For instance, the policies that promote natural
conservation and ecosystem protection may also contribute to GHG mitigation and offer food and
job opportunities to the local communities through various ecosystem services provided.

Economic Assessment of Climate Change Impacts on Biodiversity, Ecosystem Services and Human Well-being
3
1.2 Research Framework
(1) Understanding climate change impacts on biodiversity, ecosystem services and human
wellbeing
The impact of climate change is multidimensional and involves interactions among three systems:
the climate system, the ecological system and the socioeconomic system. Figure 1 below shows how
these systems interact with each other through four key components: biodiversity, ecosystem
services, GHG emissions and human wellbeing. Among all others, biodiversity plays a fundamental
role in conjoining the three systems together. For this reason, we shall start our illustration from
the ecological system that biodiversity underpins.
Figure 1. Graphic illustration of interactions between climate change, biodiversity, ecosystem services and human wellbeing
The ecological system
Biodiversity by definition encompasses the variety of life on earth from genes to species, through
to the broad scale of ecosystems across time and space. It is important in terms of determining the
health of ecosystem, ensuring the stability and productivity of ecosystems, as well as

An Application to European Forest Ecosystems
4
underpinning the supply of an array of ecosystem services that contribute directly and indirectly
to human wellbeing. In this regard, the term "biodiversity" is used largely as an assumed
foundation for ecosystem processes, rather than simply the number of species on a species list.
Moreover, biodiversity also interacts with the global climate system in two opposite dimensions.
On the one hand, GHGs accumulated in the atmosphere will increase the Earth’s surface
temperature, which will very likely shift the distribution of species, change composition of
ecosystem, and thus influence the overall supply of ecosystem goods and service, including the
carbon regulation service. On the other hand, biodiversity and its underpinning ecosystems
provide regulating services that sequester CO2 emissions concentrated in the atmosphere and so
regulate the climate system, preventing continual global warming. Therefore, climate change
combined with biodiversity loss may consequently weaken the capacity of ecosystems to mitigate
CO2 concentration in the atmosphere.
The climate system
The global climate system is connected with both the human socio‐economic system and the
biological system through the change of chemical composition of the atmosphere. There is new
and stronger evidence that most of the warming over the last 50 years is attributable to human
activities, such as coal and oil based energy generation, cultivation, deforestation and other land
use changes that have greatly induced increases in atmospheric concentrations of carbon dioxide,
methane, and nitrous oxide (IPCC, 2007). In return, human beings have experienced and will
continue to suffer from the consequences of climatic variations through the changes of
environment, degradation of biodiversity and ecosystems, more severe droughts, outbreaks of
human disease, as well as the reduction of agricultural and meat production. The natural
regulation of the global climate system, to a greater or less extent, relies on various types of
ecosystems on earth, including the oceans, ice sheets (cryosphere), living organisms (biosphere)
and soils, sediments and rocks (geosphere). In particular, trees and plants in forest ecosystems
have the ability to reduce the atmospheric concentration of CO2 through the photosynthesis
process, significantly weakening the Earth's natural greenhouse effect, and reducing the Earth's
surface temperature.
The socioeconomic system
Mounting population, changing diets, urbanization, land‐use changes and climate change are the
major social‐economic pressures on biodiversity, causing species to vanish at an alarming rate all
over the world. This in turn can significantly affect the stability of ecosystem functioning and their
Economic Assessment of Climate Change Impacts on Biodiversity, Ecosystem Services and Human Well-being
5
capacity to retain the provision of ecosystem services to humans. Today, more than ever, there is
worldwide concern about the relevance of biodiversity to environmental quality and its impact on
human welfare. The worldwide decay in environmental quality and the gradual depletion of
natural resources, sometimes referred to as the ‘new scarcity’, has prompted intense scientific
attention in both the natural and social sciences. In addition, as personal incomes rise and leisure
time becomes more freely available in the developed world, concern for more immediate human
needs is accompanied by interest in nature preservation and conservation for future generations.
Consequently, the ‘new scarcity’ has spatial and temporal horizons that extend far beyond the
current level of thinking and acting.
(2) Understanding the welfare impacts of climate change induced biodiversity loss
As previously mentioned, biological diversity represents the natural wealth of the Earth, and
provides an important basis for life and prosperity for the whole of mankind, through the
provision of "ecosystem services" at different levels, ranging from local biodiversity benefits of
harvest potential and tourism revenues to the global benefits such as carbon sequestration and
genetic information. Thus, human wellbeing, to a certain extent, is dependent upon biodiversity
and its underpinning ecosystem goods and services and the welfare impact of biodiversity loss
and ecosystem degradation is not restricted to local populations but exists also at national,
regional and international levels.
From a welfare economics standpoint, biodiversity degradation and the reduction of the
underpinning Ecosystem Goods and Services (EGS) constitute a typical example of a public good,
whose value is not properly encapsulated in the prices of commodities sold in the market place.
Therefore, it requires a governmental structure that assures their use and conservation is
effectively regulated. In this regard, studies that recognize, demonstrate and eventually capture
the biodiversity benefits have a crucial role to play in supporting policy making, in terms of
identifying policy priorities, evaluating trade‐offs of different policy targets, designing cost‐
effective policy instruments, so that economic incentives can be created and stimulated to
preserve biodiversity and to retain the multiple associated benefits. In order to illustrate the
interactions and interdependence among the economic, socio‐cultural, and ecological factors, we
adopt a well‐known Millennium Ecosystem Assessment (MA) framework that begins with
analyzing a set of major socio‐economic and environmental drivers, in particular climate change,
that are responsible for the changes in biodiversity and ecosystem, influence their provision of
supporting, provisioning, regulating and cultural services, which are ultimately linked to human
An Application to European Forest Ecosystems
6
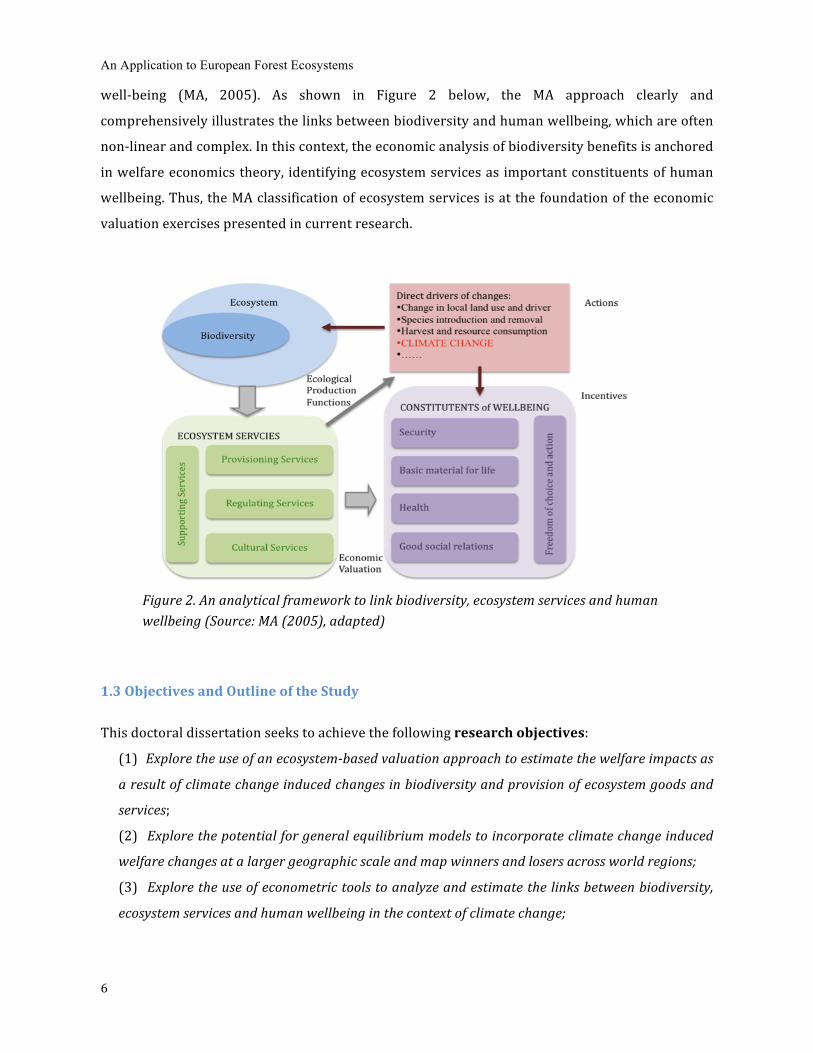
well‐being (MA, 2005). As shown in Figure 2 below, the MA approach clearly and
comprehensively illustrates the links between biodiversity and human wellbeing, which are often
non‐linear and complex. In this context, the economic analysis of biodiversity benefits is anchored
in welfare economics theory, identifying ecosystem services as important constituents of human
wellbeing. Thus, the MA classification of ecosystem services is at the foundation of the economic
valuation exercises presented in current research.
Figure 2. An analytical framework to link biodiversity, ecosystem services and human wellbeing (Source: MA (2005), adapted)
1.3 Objectives and Outline of the Study
This doctoral dissertation seeks to achieve the following research objectives:
(1) Explore the use of an ecosystembased valuation approach to estimate the welfare impacts as
a result of climate change induced changes in biodiversity and provision of ecosystem goods and
services;
(2) Explore the potential for general equilibrium models to incorporate climate change induced
welfare changes at a larger geographic scale and map winners and losers across world regions;
(3) Explore the use of econometric tools to analyze and estimate the links between biodiversity,
ecosystem services and human wellbeing in the context of climate change;

Economic Assessment of Climate Change Impacts on Biodiversity, Ecosystem Services and Human Well-being
7
(4) Explore the use of GIS mapping tools in terms of spatial analysis of the social dimension of
biodiversity policy and its application to the design of more efficient and costeffective policies for
biodiversity conservation and poverty alleviation.
The sequence of the dissertation follows the objectives set out above. The four objectives are
researched in the form of four individual peer‐reviewed papers, in which key research questions
are addressed, making use of different methodologies as appropriate. Results will be reported and
discussed in the end of each chapter. The structure of the doctoral dissertation is organized as
follows.
Chapter 2 begins with a comprehensive economic valuation of climate change impacts on the
forest ecosystem services of Europe. This valuation exercise stems from micro‐economic theory
and builds upon the MA conceptual framework, considering biodiversity as the underpinning of
ecosystems and ecosystem services, which in turn contribute to human wellbeing. The proposed
economic valuation analysis follows a three‐step approach. The first step is the determination of
the role of biodiversity in the creation of relevant ecosystem services. The second step is the
calculation of the reduced quantity and quality of these ecosystem services resulting in losses to
human welfare under alternative climate scenarios. The third step is the (monetary) valuation of
those losses. These steps are at the core of micro‐economic analysis of regional climate change
impacts, exploring the use of both market and non‐market valuation techniques. For this reason,
we label this integrated valuation method as a hybrid valuation model. In addition, spatial issues
related to climate change are considered in the valuation process by classifying forest biomes in
terms of geo‐climatic regions. Thus, our valuation results reaffirm that climate change affects
forest ecosystem and their functioning differently across geo‐climatic regions. This effect is
associated with certain degrees of welfare impacts that are unevenly distributed across Europe.
Finally, we show that climate change impacts vary also depending on the type of ecosystem
services under consideration.
Chapter 3 moves the focus of this research towards the exploration of the potential to
incorporate micro‐ and macro‐ economic analysis in the estimation of the socio‐economic impacts
of climate change‐induced changes in biodiversity and ecosystems. Biodiversity and ecosystem
services are interpreted as important components of the world economic system, where markets
interacting through exchanges of inputs, goods and services respond to changes in relative prices
induced by climate shocks, explicitly describing market‐driven or autonomous social‐economic

An Application to European Forest Ecosystems
8
adaptation. Therefore, by developing a partial‐general equilibrium valuation framework, we are
able to incorporate ecosystem services into a macro economic mechanism, where the world
economy is assessed by a set of computable general equilibrium (CGE) models. Within this
framework, changes in carbon sequestration provided by European forests are incorporated into
a CGE model through a global warming approach, which allows us to take into account the climate
change impacts on forest carbon sequestration services and to re‐compute a temperature
equivalent induced by the higher release of CO2 emissions in the atmosphere resulting from
climate change. On the basis of this new information, we then re‐estimate all of the climate change
impacts considered using the CGE model and recalculate new macro‐regional GDP effects. The
differences between climate change impacts on GDP considering the original and the new carbon
sequestration levels are used as an approximation of the general equilibrium value of the changes
in the European forest carbon sequestration service. This innovative approach allows us to
explore the scaling‐up potential of regional climate change impacts on biodiversity and ecosystem
services and to identify the winners and losers of climate change impacts at a larger geographic
scale.
Chapter 4 conducts an empirical investigation on the complex relationship between biodiversity
and the values of ecosystem goods and services that are supported by biodiversity and ecosystem
functioning, aiming to produce an econometric quantification of the magnitudes involved.
Furthermore, we operate this study in the context of global climate change. Climate change, here
interpreted as increase in temperature, is one of the major drivers today that alter the pattern of
biodiversity distribution, affect ecosystem functioning and change the flows of ecosystem goods
and services provided by a healthy ecosystem. Therefore, it is an essential first step to construct
suitable biodiversity metrics for the purpose of our research. The biodiversity indicator is
constructed by exploring the use of the concept of Natural Capital Index (NCI) that contains
information regarding the quantitative and qualitative changes of ecosystems driven by various
direct and indirect socio‐economic factors, including global warming. Furthermore, information
regarding biodiversity changes expressed by the biodiversity indicator is integrated into the
econometric specification so as to capture the marginal impacts of changes in biodiversity on the
value of ecosystem goods and services due to climate change. The results of this study will
contribute to a better understanding of the marginal impact of global warming in different regions
of the world, and recognize the synergies of biodiversity conservation strategies and climate
policies, which allows for more efficient allocation of resources among groups of people.
Economic Assessment of Climate Change Impacts on Biodiversity, Ecosystem Services and Human Well-being
9
Chapter 5 explores the use of spatial mapping tools, including Geographic Information Systems
(GIS) to explore the social dimension of biodiversity policy, so as to identify and analyze the
strength of the linkage between biodiversity and human livelihoods in different geographic
locations. Our analysis is focused on Europe, where biodiversity and ecosystem benefits have
been well studied for many ecosystems and will concentrate in particular on forest, coastal and
wetland ecosystems both at country level and downscaled to a higher geographical resolution. In
particular, we focus on European rural areas with a high density of agricultural land‐use and
investigate the dependencies between the socio‐economic, biodiversity and ecosystem value
indicators in the selected rural regions across different income groups. Moreover, social
vulnerability indicators are also identified and mapped in a spatial gradient so as to investigate
the role of biodiversity in the definition of social vulnerability contours maps in particular for
rural communities living in remote regions. The results of this study are expected to provide
important insights for EU policymakers to design potential policy instruments that can on the one
hand promote biodiversity conservation and prevent natural resources from degradation, and on
the other hand contribute to social stability and human livelihoods.
Chapter 6 draws general conclusions from this research, outlines some policy recommendations
and discusses the directions for future research.

An Application to European Forest Ecosystems
10
CHAPTER 2 VALUING THE CLIMATE CHANGE IMPACTS ON EUROPEAN FOREST ECOSYSTEMS INTO THE FUTURE Ding, H., Silvestri, S., Chiabai, A., P.A.L.D.Nunes (under review) ‘Valuing the climate change Impacts on European Forest Ecosystems into the Future’, submitted to Journal of Ecological Economics
Abstract This paper presents one of the first attempts to value climate change impacts on human welfare through assessing altered forest ecosystems and their capability of delivering ecosystem services to humans, The well‐known MA approach is anchored in the valuation exercise, which allows the comprehensive quantification of ecosystem services provided by forest ecosystems and forms the solid ground for economic valuation practice from a microeconomic perspective. This study focuses on a European scale and potential welfare impacts caused by changing climate are assessed across latitudes in Europe and reported in terms of four future storylines developed by the Intergovernmental Panel on Climate Change (IPCC) for each country under consideration. Our results show that climate change induced welfare impacts vary across latitudes depending on the nature of the forest ecosystem services and the storyline where we stand. The economic magnitudes of climate change impact on forest ecosystems may contribute to a better understanding of the potential welfare losses across different regions and to identification of winners and losers as a result of future climate change. This will have important policy implications to reallocate resources among Europe countries to cope with the continuous climate change.
Keywords: European forest assessment, ecosystem goods and services (EGS), climate change impact, IPCC scenarios JEL: Q23, Q51, Q54, Q57
Note: An earlier version of this manuscript has been presented in 2009 EAERE conference, held in Amsterdam, the Netherlands and has been included in the Conference Proceedings.
Economic Assessment of Climate Change Impacts on Biodiversity, Ecosystem Services and Human Well-being
11
2.1 Introduction
Evidence has shown that rapid climate change has significantly affected natural environment in
terms of accelerating the loss of biodiversity and the degradation of ecosystem’s health over the
last 50 years and the impacts will intensify in the future (MA, 2005; IPCC, 2007a). This led to an
increasing literature in identifying, quantifying and mapping biophysical impacts caused by
climate change, which is however not always followed by an assessment of the welfare losses
involved. In a recent literature survey, Tol (2008) showed an exponential increase in the number
of papers published in international peer reviewed journals on the topic of climate change,
jumping from 1,714 papers in 1995 to 11,652 papers in 2008. Among all the reviewed climate
literature, only a very small proportion has centred within the economics literature (about 33
papers in 1995 and 218 papers in 2008), most of which have focused on market‐related impacts
of climate change (Tol, 2005). The use of a monetary metric to express economic impacts of
climate change on biodiversity and ecosystems performance is often missing due to a lack of
recorded market information (Pearce et al., 1996; Tol 2005). In addition, despite our advanced
knowledge of climate change impacts, there is still uncertainty issue around the projection of
these impacts into the future and the quantification of them in monetary terms. Under this
background, the present paper represents one of the first attempts in the literature to fill this gap
by undertaking an empirical application of economic valuation techniques to estimate the
economic impacts of climate change on ecosystem services at an European scale. These results
anchored in the expertise from both the fields of natural sciences and economics can play a crucial
role in enabling policy options moving forward against global warming.
The assessment of the welfare impacts of climate change for the European forests is approached
within the DPSIR framework (OECD, 1999), which captures the causal relationship between
climate change, biodiversity, forest ecosystems and human well‐being – see Figure 1.
The figure implies that climate is an integral part of ecosystems and organisms have adapted to
their regional climate over time. Climate change is already having an impact on ecosystem and
biodiversity in various world regions, in particular on the high‐altitude and high‐latitude
ecosystems (IPCC, 2002). Projections suggest if global mean temperatures exceed 2‐3 °C within
this century, climate change will become a progressively more significant threat to ecosystem
through changing species distribution, population sizes, the timing of reproduction or migration
events as well as through increasing the frequency of pest and disease outbreaks (IPCC, 2007b;
CBD, 2010; MA, 2005). Since human societies depend on ecosystems for the natural, cultural,
spiritual, recreational and aesthetic resources they provide, climate change induced ecosystem
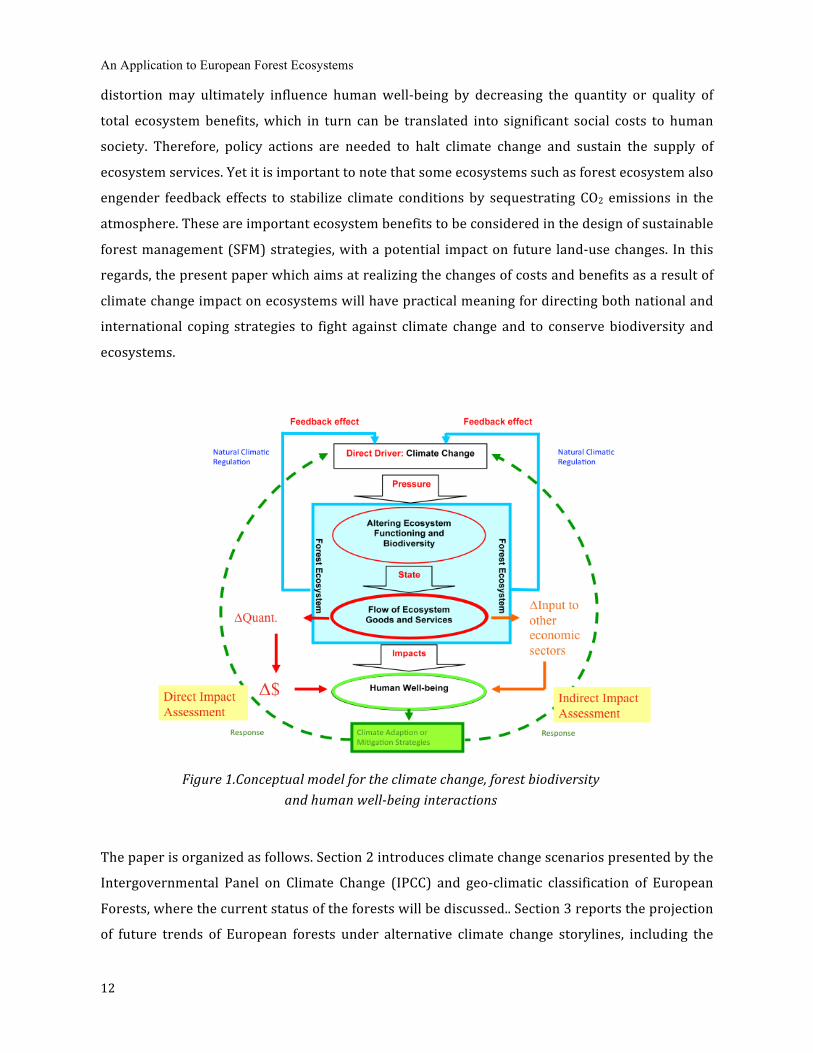
An Application to European Forest Ecosystems
12
distortion may ultimately influence human well‐being by decreasing the quantity or quality of
total ecosystem benefits, which in turn can be translated into significant social costs to human
society. Therefore, policy actions are needed to halt climate change and sustain the supply of
ecosystem services. Yet it is important to note that some ecosystems such as forest ecosystem also
engender feedback effects to stabilize climate conditions by sequestrating CO2 emissions in the
atmosphere. These are important ecosystem benefits to be considered in the design of sustainable
forest management (SFM) strategies, with a potential impact on future land‐use changes. In this
regards, the present paper which aims at realizing the changes of costs and benefits as a result of
climate change impact on ecosystems will have practical meaning for directing both national and
international coping strategies to fight against climate change and to conserve biodiversity and
ecosystems.
Figure 1.Conceptual model for the climate change, forest biodiversity and human wellbeing interactions
The paper is organized as follows. Section 2 introduces climate change scenarios presented by the
Intergovernmental Panel on Climate Change (IPCC) and geo‐climatic classification of European
Forests, where the current status of the forests will be discussed.. Section 3 reports the projection
of future trends of European forests under alternative climate change storylines, including the
Economic Assessment of Climate Change Impacts on Biodiversity, Ecosystem Services and Human Well-being
13
changes in forest area and quantity of a variety of ecosystem services under consideration. Section
4 develops an integrated‐hybrid economic valuation approach that is applied to assess, in
monetary terms, the welfare changes involved in alternative future scenarios. Section 5 concludes
with the main findings and sheds lights on the policy implications of this study.
2.2 Climate Change Impacts and European Forest Ecosystems
2.2.1 Key Assumptions of Climate Change Scenarios
Over the last 30 years, the world has experienced significant temperature increases, particularly
in the northern high latitudes (IPCC, 2001). Scientists participated in IPCC predict that the average
temperature in Europe will increase from 2.1 to 4.4°C by 2050 varying across latitudes, but with
the strongest consistent increase in the higher latitudes. In addition, model simulations also
suggest a decrease in precipitations in the south of Europe, particularly in summer, but an
increase in precipitation over much of northern Europe (Schöter et al., 2005). In order to quantify
the magnitude of the climate change impacts on forest ecosystems, both quantitative and
qualitative data are needed to describe the current state of ecosystems in terms of providing
various ecosystem goods and services (EGS) and to project the future changes of EGS in the
context of climate change. Before, however it is necessary to identify the possible range of climate
change by developing future scenarios. Scenarios include a description of the current situation as
well as of the series of events that lead from the current to the future state. The development of
scenarios requires a consistent and coherent set of assumptions on the phenomena and processes
analysed, their determining factors and expected future development. In this study, we built
future climate change scenarios by 2050 based on the four storylines reported by the IPCC Special
Report (2000) on Emission Scenarios, namely A1FI, A2, B1 and B2 storylines. These are
correspondent to different states of the world, all anchored in a coherent, integrated global
circulation model (GCM) (including the Hadley Centre Couplet Model Version 3 (HadCM3) coupled
atmosphere‐ocean GCM as described by Gordon et al. (2000)) with socio‐economic storylines, so
as to bring together population growth, land use, CO2 concentration, temperature, and
precipitation (Nakicenovic and Swart 2000; Schöter et al. 2004; Schöter et al. 2005) – see Table 1.

An Application to European Forest Ecosystems
14
Table 1. The specifications of the four IPCC storylines
Climatic model ‐ HadCM3 Indicator (Scenarios by 2050)
Storyline A1FI Global economic
Storyline A2 Local economic
Storyline B1 Global environmental
Storyline B2 Local environmental
Population (106) 376 419 376 398 CO2 concentration (ppm)
779 709 518 567
Δ Temperature (°C) 4,4 2,8 3,1 2,1 Δ Precipitation Europe (%)
‐0,5 0,5 4,8 2,7
Socio‐economic dimensions
High savings and high rate of
investments and innovation
Uneven economic growth, high per capita income
High investment in resource efficiency
Human welfare, equality, and
environmental protection
(Source: adapted from Schröter et al., 2005; IPCC, 2001)
According to the IPCC specifications, A1FI, A2, B1 and B2 storylines are distinguished in terms of
four future development paths, i.e. ‘global economic’ oriented, ‘regional economic’ oriented,
‘global environmental’ oriented, and ‘regional environmental’ oriented, respectively. The two
economic oriented scenarios (A1FI and A2) focus on ‘material consumption’, although A1
scenarios also consider different combinations of fuel, including the A1FI fossil intensive scenario.
While the two environmental oriented scenarios (B1 and B2) mainly concentrate on the concepts
of ‘sustainability, equity and environment’. It is important to point out that, amongst others, the
A2 storyline and scenario family describes a very heterogeneous world which is characterized by
high population growth, regional oriented economic development, and fragmented and slow per
capita economic growth and technology, following the current socio‐economic development
pattern. For this reason, A2 is frequently used by the European Commission as the baseline
scenario, which allows us to run a comparative analysis of three other scenarios against the
baseline. We focus, in particular, on the comparison of A2 vs. A1, assessing the changes towards a
more economically focused world. Alternatively, we may also consider A2 vs. B1 and B2, assessing
the changes towards a more sustainably orientated world.
Economic Assessment of Climate Change Impacts on Biodiversity, Ecosystem Services and Human Well-being
15
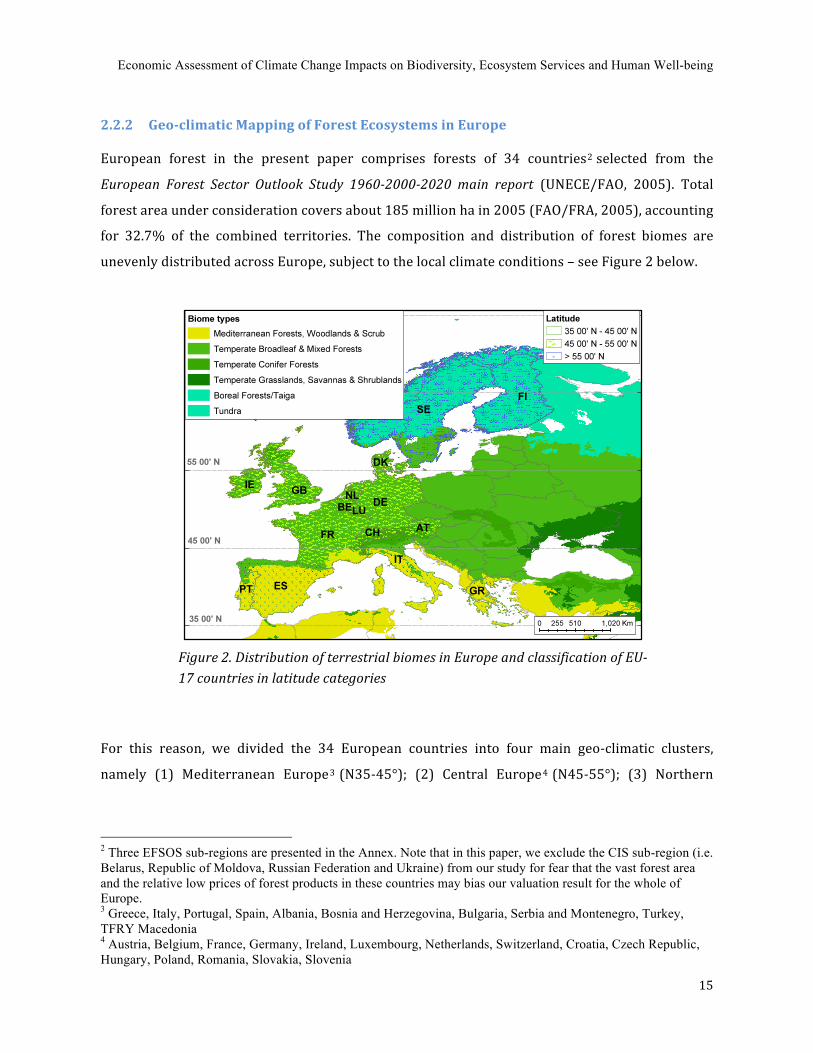
2.2.2 Geoclimatic Mapping of Forest Ecosystems in Europe
European forest in the present paper comprises forests of 34 countries2 selected from the
European Forest Sector Outlook Study 196020002020 main report (UNECE/FAO, 2005). Total
forest area under consideration covers about 185 million ha in 2005 (FAO/FRA, 2005), accounting
for 32.7% of the combined territories. The composition and distribution of forest biomes are
unevenly distributed across Europe, subject to the local climate conditions – see Figure 2 below.
Figure 2. Distribution of terrestrial biomes in Europe and classification of EU17 countries in latitude categories
For this reason, we divided the 34 European countries into four main geo‐climatic clusters,
namely (1) Mediterranean Europe3 (N35‐45°); (2) Central Europe4 (N45‐55°); (3) Northern
2 Three EFSOS sub-regions are presented in the Annex. Note that in this paper, we exclude the CIS sub-region (i.e. Belarus, Republic of Moldova, Russian Federation and Ukraine) from our study for fear that the vast forest area and the relative low prices of forest products in these countries may bias our valuation result for the whole of Europe. 3 Greece, Italy, Portugal, Spain, Albania, Bosnia and Herzegovina, Bulgaria, Serbia and Montenegro, Turkey, TFRY Macedonia 4 Austria, Belgium, France, Germany, Ireland, Luxembourg, Netherlands, Switzerland, Croatia, Czech Republic, Hungary, Poland, Romania, Slovakia, Slovenia
An Application to European Forest Ecosystems
16
Europe5 (N55‐65°), and (4) Scandinavian Europe6 (N65‐71°), corresponding to predominated
forest biomes of the region, respectively. Forests in the Mediterranean Europe count for 30% of
the total forest cover in Europe, predominated by coniferous and broadleaved evergreen forests
(appeared as Mediterranean forest in the paper). The Central and Northern Europe are home to
most of the temperate forests, and the total forests areas of the two regions take up 35% and 19%
of the forest coverage in Europe, respectively. Finally, forests in the Scandinavian Europe are
mainly boreal, accounting for the remaining 16% of European forests. The proposed geo‐climatic
classification of forest ecosystems will enable a comprehensive understanding of the dynamics of
different forests in European countries and allows for sensibility analysis of different tree species
in response to climate change. The reasons are the following.
First, latitude specific climate conditions can lead to species diversity and dynamics of forest
ecosystems varying considerably across Europe, as reflected in the numbers and composition of
tree species. Changing climate will therefore have significant biological and economic impacts at
regional scales. The Ministerial Conference on the Protection of Forests in Europe (MCPFE)
reported that in Europe about 70% of the forests are currently dominated by mixed forests
consisting of two or several tree species and the rest 30% are dominated by one tree species
alone, mainly by conifers (MCPFE, 2007). Despite the large existence of uncertainties about future
climate conditions, climate change will likely shift forest ecosystem distribution across much of
Europe causing changes in the composition of forest tree species and result in significant socio‐
economic effects by influencing e.g. long‐term forest productivity and scenic and spiritual value of
natural forests in many European countries, where forest ecosystems are important natural
resources to sustain local and national economic development.
Second, the sensibilities of tree species in response to changes of temperature are considered by
studying the specific forest types located in different geo‐climatic regions. For instance, in the
Mediterranean region, most forests consist of sclerophyllous and some deciduous species that
have adapted to summer soil water deficit. Temperature changes may allow for an expansion of
some thermophilous tree species (e.g. quercus pyrenaica) when water availability is sufficient
(IPCC, 2001). Similarly, Garcia‐Gonzalo et al. (2007) found that in Scandinavian Europe, the
growth of boreal forests is currently limited by a short growing season, low summer temperature
and short supply of nitrogen, whereas, the changing climate can increase forest productivity and
also carbon stock in the forest ecosystem. This is because an increase in temperature can prolong
5 Denmark, United Kingdom, Estonia, Latvia, Lithuania 6 Finland, Iceland, Norway, Sweden
Economic Assessment of Climate Change Impacts on Biodiversity, Ecosystem Services and Human Well-being
17
the growing season, enhance decomposition of soil organic matter, and thus, increase the supply
of nitrogen. In turn, these changes may have positive impacts on forest growth, timber yield and
the accumulation of carbon in the boreal forests at higher latitudes (Melillo et al. 1993; Lloyd and
Taylor 1994; Giardian and Ryan 2000; Jarvis and Linder 2000; Luo et al. 2001; Strömgren 2001).
To summarize, classifying countries and their respective forest biomes by geo‐climatic regions has
two main advantages. First, the proposed geo‐climatic classification will allow us to examine the
degree of sensitivity of different forest biomes of each region in response to climate change, as
reflected in rising temperature and precipitation rate. Second, forest biomes in one geo‐climatic
region share similar ecological characteristics, e.g. the composition of tree species, which
determines the type of, as well as the quantity and quality of the ecosystem services provided.
Therefore, one may expect forest ecosystem services contribute differently to the local livelihoods
across geo‐climatic regions. This information will be of particular importance in terms of testing
the potential of scaling‐up total economic values (TEV) of forest ecosystems located in the same
geo‐climatic region. Furthermore, by comparing the regional TEV of forest ecosystem, our study
therefore can shed light on the identification of winners and losers (e.g. countries or regions) of
the climate change impacts in Europe and help improving the efficiency of current policy
mechanisms by reallocating resources among different groups of people.
2.3 Projecting the Future Changes of Forest Ecosystem Goods and Services due to Climate
Change
2.3.1 Classification of Forest Ecosystem Goods and Services (EGS)
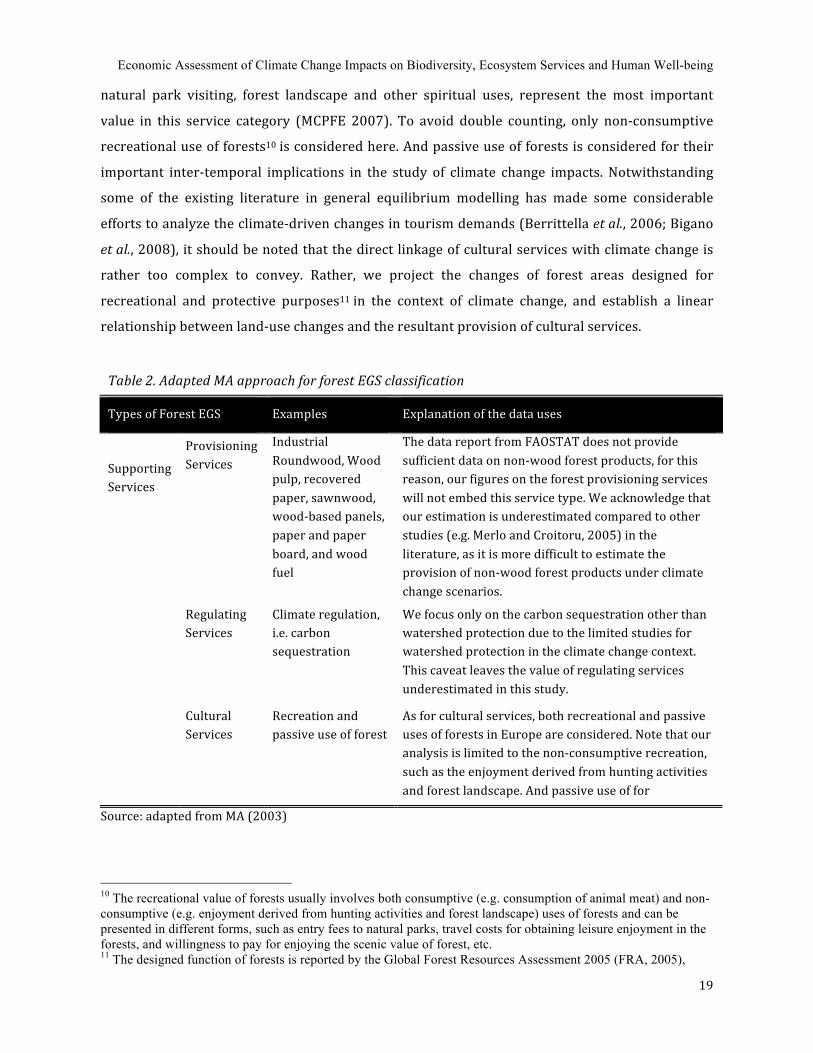
Forest EGS are classified following a MA approach (MA, 2003), which provides a practical,
tractable, and sufficiently flexible classification for categorizing the various types of EGS, including
provisioning, regulating, cultural and supporting services. The MA classification with examples of
forest EGS is presented in Table 2. In this paper, all observed biophysical data for all EGS7 are
extracted from the FAOSTAT‐Forestry database for a reference year 2005 at country level and
then summed up on a geo‐climatic region scale. Moreover, the quantification of regulating and
cultural services is assumed linearly related to the extent of forest area.
7 The data report from FAOSTAT does not provide sufficient data on non-wood forest products, for this reason, our figures on the forest provisioning services will not embed this provisioning service. We acknowledge that our estimation is underestimated compared to other studies (e.g. Merlo and Croitoru, 2005) in the literature, as it is more difficult to estimate the provision of non-wood forest products under climate change secenarios.
An Application to European Forest Ecosystems
18
Provisioning Services
Forest provisioning services are classified into two main categories: wood forest products8
(WFPs) and non‐wood forest products9 (NWFPs), as suggested by the Food and Agriculture
Organization (FAO) of the United Nations (FAO 1999). WFPs refer to seven product categories (as
identified in FAOSTAT) representing different industrial sectors: industrial roundwood, wood
pulp, recovered paper, sawnwood, wood‐based panels, paper and paper board, and wood fuel.
NWFPs are broadly defined as “all goods of biological origin, as well as services, derived from
forest or any land under similar use, and exclude wood in all its forms (FAO, 1999)”. However,
NWFPs are excluded from the present valuation exercise for two reasons: (1) Reliable data on
NWFPs are difficult to obtain as they are not properly documented and only a few countries
systematically monitor production and trade of their most important NWFP. (2) It is very difficult
to project the quantitative changes of EGS under future climate scenarios as their productivity are
largely affected by the local/national forestry management practices rather than climate change
induced reduction of productivity. Thus our estimation of the provisioning value of European
forests is lower than those of other studies (e.g. Merlo and Croitoru, 2005).
Regulating Services
As far as regulating services are concerned, two types of ecosystem services provided by
European forests are of particular importance: (1) climate regulation (i.e. carbon sequestration)
and (2) water and erosion regulation (i.e. watershed protection). It is important to note that this
paper focuses on the carbon service alone for two reasons. The first is due to lack of data at a
European scale. The second is because the literature that studies the role of forest ecosystems in
mitigating climate change has been mainly focused on carbon storage function of forests more
than on the watershed protection function. We are aware that excluding the watershed benefits
will lead to a lower value estimate of the regulating services provided by forests, thus further
studies are needed to advance our knowledge on watershed protection function in forests and
their respective values in the context of climate change.
Cultural Services
In Europe, forests provide important cultural services that consist of both recreational and
passive use of forests to many countries. In particular, recreational services, including hunting,
8 WFPs include industrial wood, wood fuel, small woods and other manufactured wood products. 9 NWFPs including food and food additives (e.g. fruits, nuts, mushrooms, herbs), fibres (raw material for utensils and construction), resins, plant and animal products used as medicinal or cosmetics, can be gathered from the wild or produced in forest plantations.
Economic Assessment of Climate Change Impacts on Biodiversity, Ecosystem Services and Human Well-being
19
natural park visiting, forest landscape and other spiritual uses, represent the most important
value in this service category (MCPFE 2007). To avoid double counting, only non‐consumptive
recreational use of forests10 is considered here. And passive use of forests is considered for their
important inter‐temporal implications in the study of climate change impacts. Notwithstanding
some of the existing literature in general equilibrium modelling has made some considerable
efforts to analyze the climate‐driven changes in tourism demands (Berrittella et al., 2006; Bigano
et al., 2008), it should be noted that the direct linkage of cultural services with climate change is
rather too complex to convey. Rather, we project the changes of forest areas designed for
recreational and protective purposes11 in the context of climate change, and establish a linear
relationship between land‐use changes and the resultant provision of cultural services.
Table 2. Adapted MA approach for forest EGS classification
Types of Forest EGS Examples Explanation of the data uses
Provisioning Services
Industrial Roundwood, Wood pulp, recovered paper, sawnwood, wood‐based panels, paper and paper board, and wood fuel
The data report from FAOSTAT does not provide sufficient data on non‐wood forest products, for this reason, our figures on the forest provisioning services will not embed this service type. We acknowledge that our estimation is underestimated compared to other studies (e.g. Merlo and Croitoru, 2005) in the literature, as it is more difficult to estimate the provision of non‐wood forest products under climate change scenarios.
Regulating Services
Climate regulation, i.e. carbon sequestration
We focus only on the carbon sequestration other than watershed protection due to the limited studies for watershed protection in the climate change context. This caveat leaves the value of regulating services underestimated in this study.
Supporting Services
Cultural Services
Recreation and passive use of forest
As for cultural services, both recreational and passive uses of forests in Europe are considered. Note that our analysis is limited to the non‐consumptive recreation, such as the enjoyment derived from hunting activities and forest landscape. And passive use of for
Source: adapted from MA (2003)
10 The recreational value of forests usually involves both consumptive (e.g. consumption of animal meat) and non-consumptive (e.g. enjoyment derived from hunting activities and forest landscape) uses of forests and can be presented in different forms, such as entry fees to natural parks, travel costs for obtaining leisure enjoyment in the forests, and willingness to pay for enjoying the scenic value of forest, etc. 11 The designed function of forests is reported by the Global Forest Resources Assessment 2005 (FRA, 2005),
An Application to European Forest Ecosystems
20
Supporting Services
With respect to the supporting services, indicators for measuring the respective forest ecosystem
changes in response to climate change are not well developed and thus, quantity data to measure
them are not readily available (MA, 2005). For this reason, we will not tackle this service category
directly. It is, however, important to realize that the value of supporting services is embedded in
the value of other three MA ecosystem services, in terms of sustaining the healthy ecosystem
functioning and the capability of delivering ecosystem services to human society.
All relevant biophysical data, including forest area and quantity of breakdown ecosystem services
are collected year 2005, a baseline year since when we built projections of ecosystem goods and
services provided by forest ecosystem in any future climate change scenarios.
2.3.2 Projecting the Biophysical Flows of EGS under Future IPCC Storylines
In order to project the quantitative changes of forest areas and wood products due to climate
change, we adopted the simulation results derived from the Advanced Terrestrial Ecosystem
Analysis and Modelling (ATEAM) project. This project, which was funded by the 5th Framework
Programme of the European Commission with a specific emphasis on assessing the vulnerability
of human sectors relying on ecosystem services with respect to global change (Schröter D. et al.
2004), delivers projections in forest areas, wood products and carbon sequestration by forests
across the four IPCC storylines for the EU‐17. In this project, we extend the projections to the
other remaining European countries under consideration exploring the use IMAGE 2.2 (IMAGE
2001). As in ATEAM and the IPCC scenarios, these projection are anchored to the year 2050 and
refer to forest areas, wood products and forest carbon sequestration services. These will be
discussed in detail in following paragraphs.
Forest areas
Our computation shows that the impacts of climate change on forest land‐use vary significantly
across latitudes. In the A1FI and A2 scenarios, forest areas decrease, on average, by about 21%
and 9% by the year 2050, respectively ‐ see Table A1a in Appendix for more details. The A1FI
scenario shows the largest impact due to the no‐migration assumption and most severe climate
change, with Δ temperature (C°) equal to 4.4 degrees (Thuiller et al., 2005). Both B1 and B2
scenarios present an increase in forest areas, of about 6% for the former and 10% for the latter.
The higher increase rate of forest areas in the B2 scenario highlights major change due to the
afforestation hypothesis which is also associated with the higher levels of precipitation in this
Economic Assessment of Climate Change Impacts on Biodiversity, Ecosystem Services and Human Well-being
21
same scenario (Schöter et al., 2005). In particular, Mediterranean Europe is facing a general,
negative forest growth in scenario A1FI and A2, but a significant expansion in scenario B1 and B2.
Central‐Northern and Northern Europe regions present negative growth only in the A1FI
scenario, in correspondence with the more severe climatic conditions. In addition, the A2 shows
that for the Scandinavian Europe there is a reduction of the forest area. Finally, we have also
looked into forest areas specifically designated for recreational use(recreational areas) and for
conservation use (wilderness areas), which corresponds to 7.8% and 10.2%, respectively of the
forest total area – see Table A1b in Appendix for more details. As we shall see, this data will be of
crucial relevance when computing the economic value of cultural services, including recreation
and passive use values provided by forest ecosystems.
Wood forest products
As previously mentioned, we consider the assessment of the climate impact on the bio‐physical
levels of production of the wood forest products under consideration – see Tables A2a to A2g in
Appendix for detailed projection results. Given different socio‐economic and climatic assumptions
for the IPCC storylines (as listed in Table 4), the projection of the quantitative changes of wood
forest products varies across different IPCC scenarios over the next 50 years. Putting all these
tables together, it is easy to find that the impacts of climate change are unevenly distributed
across European forests, depending on the regions where the forests are located, the types of
forest products, as well as the scenarios in which either socio‐economic or environmental policy is
the focus.
All in all, our results do show some significant trends of climate change impacts on the classified
regions. For instance, the productivity of most of the wood products in Mediterranean and
Scandinavian Europe will be negatively affected by climate change, but the magnitudes of the
impacts are subject to the assumptions of climate policies. However, by comparing the
quantitative assessment results among the four scenarios, there might be a policy option which
can mitigate the climate change impact through forest ecosystems in these two regions under the
B‐type scenarios. For some of the forest products, we may observe some slightly positive impacts
of climate change in Mediterranean Europe. Moreover, with respect to the countries located in
both Central and Northern Europe, whether climate change brings positive or negative impacts to
the region is even more ambiguous to predict. Generally speaking, the production of most of the
forest products will be increased in A2 and B2 scenarios as a result of the joint effects of both
climate change and socio‐economic changes in the future. In other words, climatic influence may,
An Application to European Forest Ecosystems
22
in part, affect the natural growth rate of forests in those two regions, but the existence of policies
may also play an important role in terms of their influence on the land use pattern.
Carbon Storage
The carbon cycle connects forests to climate change as total carbon stored in forests has a very
important role in determining the climate stabilization paths. As a matter of fact, the quantity of
carbon stocked in tree biomass corresponds to approximately 77% of the carbon contained in the
global vegetation, while forest soil stores 42% of the global 1m top soil carbon (Bolin et al., 2000).
Forests exchange large quantities of carbon in photosynthesis and respiration, they contribute to
the global carbon cycle becoming a source of carbon when they are disturbed, and sink when
recovering and regrowing after disturbances. In turn, climate change may also influence the forest
ecosystems’ capacity of storing carbon dioxide in the future. Against this background, we
construct projections for carbon sequestration in forests for all the European countries across the
four IPCC storylines – see Table A3 in Appendix for more details. Our findings show that the
average carbon stock tends to increase in all scenarios, but the respective magnitudes are
different. For instance, in the A1FI scenario, which represents a world orientated towards ‘global
economic’ growth, but with the highest CO2 concentration and temperature, the total carbon
sequestrated by forests appeared to be the lowest compared to other three scenarios. This result
is consistent with the findings reported by Schröter et al. (2005), who highlighted that for most
ecosystem services the A1FI produces the strongest negative impacts. On the other hand, B‐type
storylines, which are sustainable development oriented, contribute to an increase in forest areas
and consequently, to a large quantity of carbon stock. These figures will be at the basis for the
economic valuation exercise that is proposed and discussed in detail in the following section.
2.4 Economic Valuation of European Forest Ecosystems in the Context of Climate Change
2.4.1 A Hybrid Economic Valuation Approach
Following our hybrid economic valuation model framework – presented in Figure 3 below,
different economic valuation methods are exercised in the capture of the values of the three types
of ecosystem services under consideration.

Economic Assessment of Climate Change Impacts on Biodiversity, Ecosystem Services and Human Well-being
23
Figure 3: An hybrid economic valuation methodology
First of all, for the provisioning services provided by European forests, we can infer that the
economic values are the direct use values obtained from trading wood forest products in the
market. Therefore, market prices are used to value this ecosystem service, and this information is
derived from FAO database12 on forests. Secondly, in order to evaluate the welfare changes
associated with the carbon regulation, we shall use the avoided damage cost methods that were
undertaken by the recent EC funded project, CASES13 to estimate the marginal damage cost of per
additional unit of CO2 emission. Economic theory tells us that the optimal emission level is
determined by the intersection of the marginal damage cost of emissions and the marginal benefit
from damage mitigation (or marginal abatement costs). Thus the crossing point corresponds to
the unit value of carbon sequestration, which gives rise to the optimal policy to incentivize the
necessary abatement in the achievement of the global carbon stabilization goal, and can be used to
calculate the total economic value of carbon stored in forests. Finally, with respect to the cultural
services, meta‐analyses and value transfer methods are jointly used. These two methods are
12 http://faostat.fao.org/site/381/default.aspx 13 CASES stands for “Cost Assessment of Sustainable Energy Systems” for EU countries and the selected non-EU countries, including Turkey, Brazil, India and China. The study aimed at providing a comprehensive and dynamic assessment of the full costs of electricity generation based on the state-of-the art methodologies, taking into account both geographical and temporal extend of the impacts and social economic impacts, such as health and safety, economic production and consumption, recreation, and environmental and natural assets caused by climate change.

An Application to European Forest Ecosystems
24
anchored in non‐market valuation methodologies and rely on the existing databases14 of non‐
market valuation studies for forests in Europe. All values are estimated under four IPCC scenarios
in 2050 and expressed in 2005 US$. However, the specific nature and availability of data as well as
the different valuation procedures embraced for each of the ecosystems services under
consideration will merit a separate discussion.
2.4.2 The Economic Value of Wood Forest Products (WFPs)
In the present study, the methodological approach builds up on a two‐step estimation process: (i)
computation of annual price of WFPs (ii) projections of total values of WFPs to year 2050 under
different IPCC scenarios. Finally, projected future value of WFPs will be compared across different
future scenarios to estimate the welfare changes due to moving from one scenario to another.
Figure 4. Value of provisioning service in 2005
The first step consists of calculating the total value of all forest products for each country, taking
into account export values and export quantities for year 2005, available at country level from
14 The popular databases for non-market valuation study include: Environmental Valuation Reference Inventory (EVRI), Envalue, and the Ecosystem Services Database.

Economic Assessment of Climate Change Impacts on Biodiversity, Ecosystem Services and Human Well-being
25
FAOSTAT. In the absence of data about consistent prices of WFPs among all countries, we assume
that total domestic production of a country’s WFPs will be totally exported to abroad
consumption. This assumption thus simplifies the question and allows us to estimate
approximately market price of each WFP that a country can get from international trade by
dividing total export value of the product by the quantity exported. Our results show that Sweden,
Norway, Germany and France are the most important WFPs producers in Europe, where the
highest value of provisioning services are registered – see Figure 4.
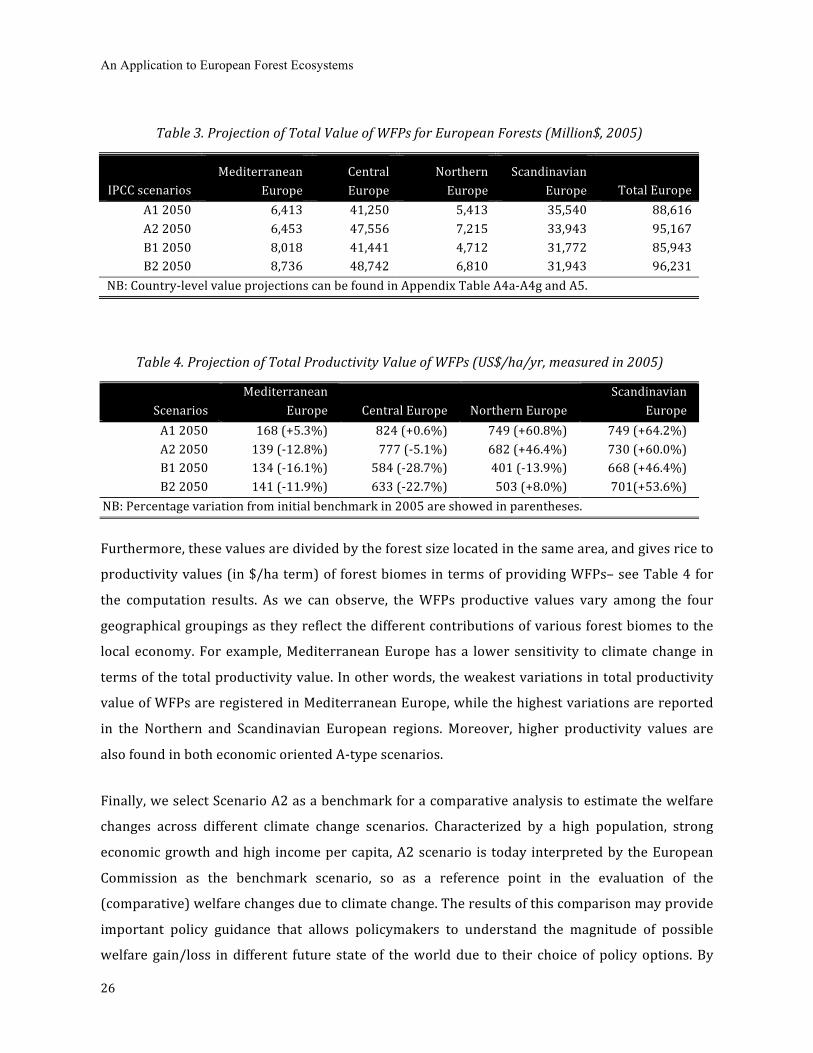
The second step is then to project the total value of WFPs to 2050. Based on the result of a
literature survey15 and observed historical data16, we assume that that real prices of wood
products will remain stable in the next 50 years, while allowing different prices to exist across
countries (Clark, 2001; Hoover and Preston, 2006; Bolt et al. 2002). Thus, the projection of total
value of each type of WFPs depends only on the total quantity produced by a country under
different future scenarios. The computation is expressed by Equation (1).
with S= A1FI, A2, B1 and B2 storylines (1)
where TV is the total value of WFPs (i type of WFP) in Country n under IPCC scenario S.
Furthermore, by aggregating the total values of WFPs at the scale of geo‐climatic groupings.
Finally, by summing‐up values over all of the WFPs commodities and countries located at each
geo‐climatic region, we can get a regional total value of WFPs for both reference year 2005 and
future scenarios by 2050. Results are presented in Table 3.
15 Clark (2001) offers a theoretical analysis and an empirical examination of wood prices, based on aggregated global wood market data over the last three decades. Hoover and Preston (2006) analyze trends of Indiana (USA) forest products prices using statistical data from 1957 to 2005. Although different in the spatial scale of the analyses, both papers lead to a similar conclusion: there is no evidence of increase in real prices for wood in the long term. This means that that no global wood shortage is predicted, a result that can be explained by the technological development leading to an increase in resource productivity (less wood required in the production process and enhanced wood supply). 16 The World Bank time series data providing estimates of the average prices for total produced round wood (Bolt et al. 2002), according to which the trend in real prices remained relatively constant in the 30-years period 1971-2006. The forest net rents of world countries are taken from World Bank database, available online at: http://tahoe-is-walking-on.blogspot.com/2010/01/world-banks-ans-adjusted-net-saving.html.
An Application to European Forest Ecosystems
26
Table 3. Projection of Total Value of WFPs for European Forests (Million$, 2005)
IPCC scenarios Mediterranean
Europe Central Europe
Northern Europe
Scandinavian Europe Total Europe
A1 2050 6,413 41,250 5,413 35,540 88,616 A2 2050 6,453 47,556 7,215 33,943 95,167 B1 2050 8,018 41,441 4,712 31,772 85,943 B2 2050 8,736 48,742 6,810 31,943 96,231
NB: Country‐level value projections can be found in Appendix Table A4a‐A4g and A5.
Table 4. Projection of Total Productivity Value of WFPs (US$/ha/yr, measured in 2005)
Scenarios
Mediterranean Europe Central Europe Northern Europe
Scandinavian Europe
A1 2050 168 (+5.3%) 824 (+0.6%) 749 (+60.8%) 749 (+64.2%) A2 2050 139 (‐12.8%) 777 (‐5.1%) 682 (+46.4%) 730 (+60.0%) B1 2050 134 (‐16.1%) 584 (‐28.7%) 401 (‐13.9%) 668 (+46.4%) B2 2050 141 (‐11.9%) 633 (‐22.7%) 503 (+8.0%) 701(+53.6%)
NB: Percentage variation from initial benchmark in 2005 are showed in parentheses.
Furthermore, these values are divided by the forest size located in the same area, and gives rice to
productivity values (in $/ha term) of forest biomes in terms of providing WFPs– see Table 4 for
the computation results. As we can observe, the WFPs productive values vary among the four
geographical groupings as they reflect the different contributions of various forest biomes to the
local economy. For example, Mediterranean Europe has a lower sensitivity to climate change in
terms of the total productivity value. In other words, the weakest variations in total productivity
value of WFPs are registered in Mediterranean Europe, while the highest variations are reported
in the Northern and Scandinavian European regions. Moreover, higher productivity values are
also found in both economic oriented A‐type scenarios.
Finally, we select Scenario A2 as a benchmark for a comparative analysis to estimate the welfare
changes across different climate change scenarios. Characterized by a high population, strong
economic growth and high income per capita, A2 scenario is today interpreted by the European
Commission as the benchmark scenario, so as a reference point in the evaluation of the
(comparative) welfare changes due to climate change. The results of this comparison may provide
important policy guidance that allows policymakers to understand the magnitude of possible
welfare gain/loss in different future state of the world due to their choice of policy options. By
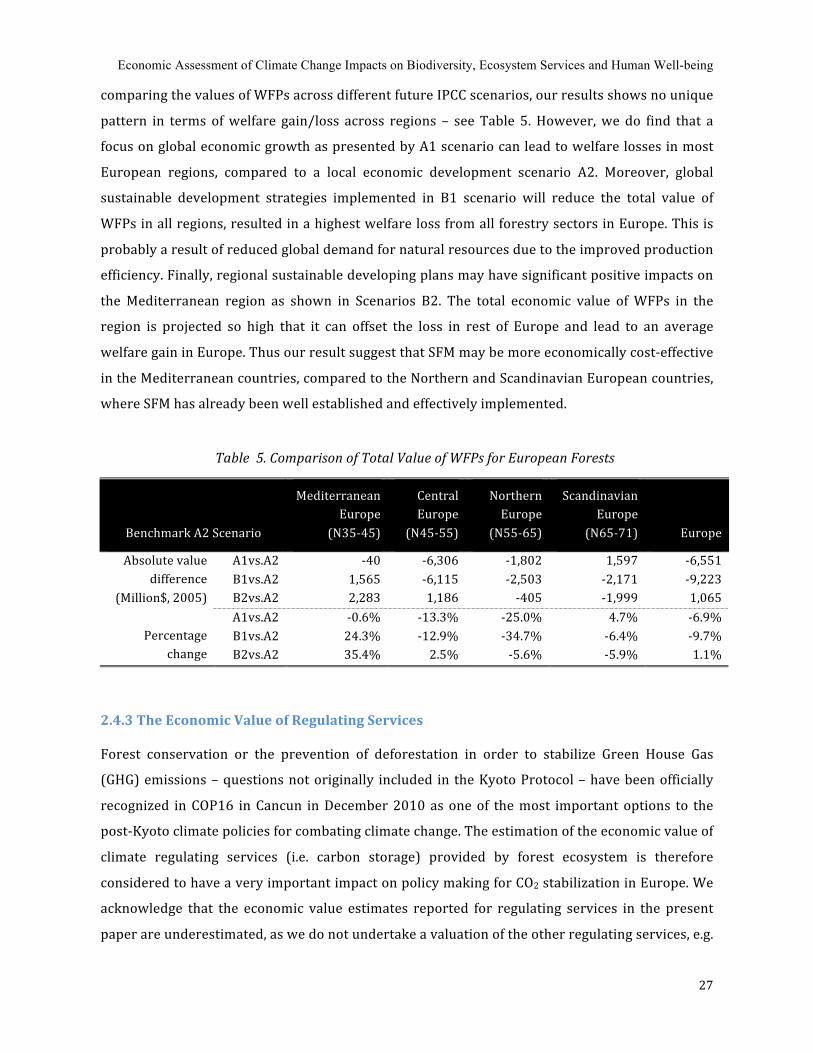
Economic Assessment of Climate Change Impacts on Biodiversity, Ecosystem Services and Human Well-being
27
comparing the values of WFPs across different future IPCC scenarios, our results shows no unique
pattern in terms of welfare gain/loss across regions – see Table 5. However, we do find that a
focus on global economic growth as presented by A1 scenario can lead to welfare losses in most
European regions, compared to a local economic development scenario A2. Moreover, global
sustainable development strategies implemented in B1 scenario will reduce the total value of
WFPs in all regions, resulted in a highest welfare loss from all forestry sectors in Europe. This is
probably a result of reduced global demand for natural resources due to the improved production
efficiency. Finally, regional sustainable developing plans may have significant positive impacts on
the Mediterranean region as shown in Scenarios B2. The total economic value of WFPs in the
region is projected so high that it can offset the loss in rest of Europe and lead to an average
welfare gain in Europe. Thus our result suggest that SFM may be more economically cost‐effective
in the Mediterranean countries, compared to the Northern and Scandinavian European countries,
where SFM has already been well established and effectively implemented.
Table 5. Comparison of Total Value of WFPs for European Forests
Benchmark A2 Scenario
Mediterranean Europe
(N35‐45)
Central Europe
(N45‐55)
Northern Europe
(N55‐65)
Scandinavian Europe
(N65‐71) Europe
A1vs.A2 ‐40 ‐6,306 ‐1,802 1,597 ‐6,551 B1vs.A2 1,565 ‐6,115 ‐2,503 ‐2,171 ‐9,223
Absolute value difference
(Million$, 2005) B2vs.A2 2,283 1,186 ‐405 ‐1,999 1,065 A1vs.A2 ‐0.6% ‐13.3% ‐25.0% 4.7% ‐6.9% B1vs.A2 24.3% ‐12.9% ‐34.7% ‐6.4% ‐9.7% Percentage
change B2vs.A2 35.4% 2.5% ‐5.6% ‐5.9% 1.1%
2.4.3 The Economic Value of Regulating Services
Forest conservation or the prevention of deforestation in order to stabilize Green House Gas
(GHG) emissions – questions not originally included in the Kyoto Protocol – have been officially
recognized in COP16 in Cancun in December 2010 as one of the most important options to the
post‐Kyoto climate policies for combating climate change. The estimation of the economic value of
climate regulating services (i.e. carbon storage) provided by forest ecosystem is therefore
considered to have a very important impact on policy making for CO2 stabilization in Europe. We
acknowledge that the economic value estimates reported for regulating services in the present
paper are underestimated, as we do not undertake a valuation of the other regulating services, e.g.
An Application to European Forest Ecosystems
28
watershed protection and soil nutrient cycling, due to the limited knowledge about how to
quantify those services in physical terms, both with respect to climate change impacts as well as
in terms of a projection of the respective future changes. As previously shown that the carbon
stocks in forests are projected to increase on average in Europe under all 4 IPCC storylines in the
next 50 years, we may therefore expect to obtain some benefits from forest regulating services.
However, the magnitudes of those benefits may vary across different forest biomes.
The methodological framework for the valuation of the regulating services consists of two steps:
we first compute the marginal value of carbon storage in forests (2005US$/tC), which are then
used to estimate the total economic values that can be obtained in different geo‐climate regions
under the IPCC scenarios.
First of all, the marginal value of carbon storage refers to the benefits from avoided damages17
caused by incremental CO2 or CO2‐equivalent GHG emissions in the atmosphere due to the carbon
sequestration functions of forest ecosystem. In the present paper, we build our analysis upon an
existing project, “Cost Assessment for Sustainable Energy Systems” ‐ CASES18, a worldwide study
funded by the EU.
One of the main features of CASES is that it is built upon the Integrated Assessment Models
(IAMs), which by definition combine the dynamics of global economic growth with the dynamics
of geophysical climate dynamics, to estimate the cost of GHG emissions under different energy
evolution paths in 2020, 2030 and 2050. The existing literature on IAM has been intensively
reviewed under the project and various available estimates in the recent years were taken into
account in its final value estimates. Among all others, the value of social costs of carbon estimated
by the UK’s Department for Environment, Food and Rural Affairs (DEFRA 2005) was adopted, for
it reflects the policy context in which the values are used, and it combines the results of a number
of IAM’s in a transparent matter. As a consequence, the CASES project was able to obtain three
levels of estimates of marginal damage costs, i.e. lower, upper and central estimates 19 ,
17 The avoided damage costs assessment method has been widely used in the literature (see Cline, 1992; Nordhaus, 1993a,b; Merlo&Croitoru, 2005; CASES, 2008) to calculate indirectly the benefits from carbon sequestrated in forests, but it is important to note that the concept is different from the market price of carbon (obtained via emission trading scheme) and the marginal abatement cost (involves the costs of technological R&D for facilitating the emission abatement), although under certain restrictive assumptions the three measures would be broadly equal, at the margin (DEFRA, 2007). 18 CASES, Project No.518294 SES6, (2006-2008). Project official website: http://www.feem-Project.net/cases/ 19 The values are based on full Monte Carlo runs of the FUND and PAGE models, in which all parameters varied to reflect the uncertainty surrounding the central parameter values in both models. The lower and upper bounds are the 5% and 95% probability values of the PAGE model, while the central guidance value is based on the average of the mean values of the FUND and PAGE models. A declining discount rates is use as suggested by the UK
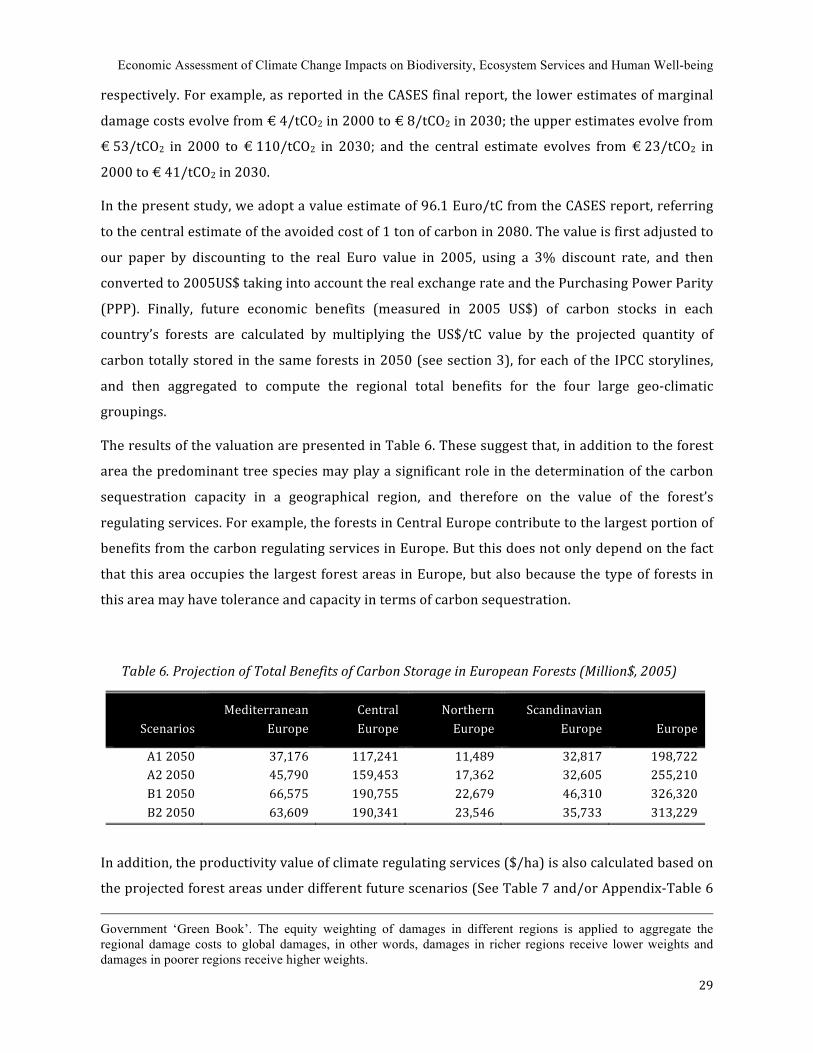
Economic Assessment of Climate Change Impacts on Biodiversity, Ecosystem Services and Human Well-being
29
respectively. For example, as reported in the CASES final report, the lower estimates of marginal
damage costs evolve from € 4/tCO2 in 2000 to € 8/tCO2 in 2030; the upper estimates evolve from
€ 53/tCO2 in 2000 to € 110/tCO2 in 2030; and the central estimate evolves from € 23/tCO2 in
2000 to € 41/tCO2 in 2030.
In the present study, we adopt a value estimate of 96.1 Euro/tC from the CASES report, referring
to the central estimate of the avoided cost of 1 ton of carbon in 2080. The value is first adjusted to
our paper by discounting to the real Euro value in 2005, using a 3% discount rate, and then
converted to 2005US$ taking into account the real exchange rate and the Purchasing Power Parity
(PPP). Finally, future economic benefits (measured in 2005 US$) of carbon stocks in each
country’s forests are calculated by multiplying the US$/tC value by the projected quantity of
carbon totally stored in the same forests in 2050 (see section 3), for each of the IPCC storylines,
and then aggregated to compute the regional total benefits for the four large geo‐climatic
groupings.
The results of the valuation are presented in Table 6. These suggest that, in addition to the forest
area the predominant tree species may play a significant role in the determination of the carbon
sequestration capacity in a geographical region, and therefore on the value of the forest’s
regulating services. For example, the forests in Central Europe contribute to the largest portion of
benefits from the carbon regulating services in Europe. But this does not only depend on the fact
that this area occupies the largest forest areas in Europe, but also because the type of forests in
this area may have tolerance and capacity in terms of carbon sequestration.
Table 6. Projection of Total Benefits of Carbon Storage in European Forests (Million$, 2005)
Scenarios Mediterranean
Europe Central Europe
Northern Europe
Scandinavian Europe Europe
A1 2050 37,176 117,241 11,489 32,817 198,722 A2 2050 45,790 159,453 17,362 32,605 255,210 B1 2050 66,575 190,755 22,679 46,310 326,320 B2 2050 63,609 190,341 23,546 35,733 313,229
In addition, the productivity value of climate regulating services ($/ha) is also calculated based on
the projected forest areas under different future scenarios (See Table 7 and/or Appendix‐Table 6
Government ‘Green Book’. The equity weighting of damages in different regions is applied to aggregate the regional damage costs to global damages, in other words, damages in richer regions receive lower weights and damages in poorer regions receive higher weights.
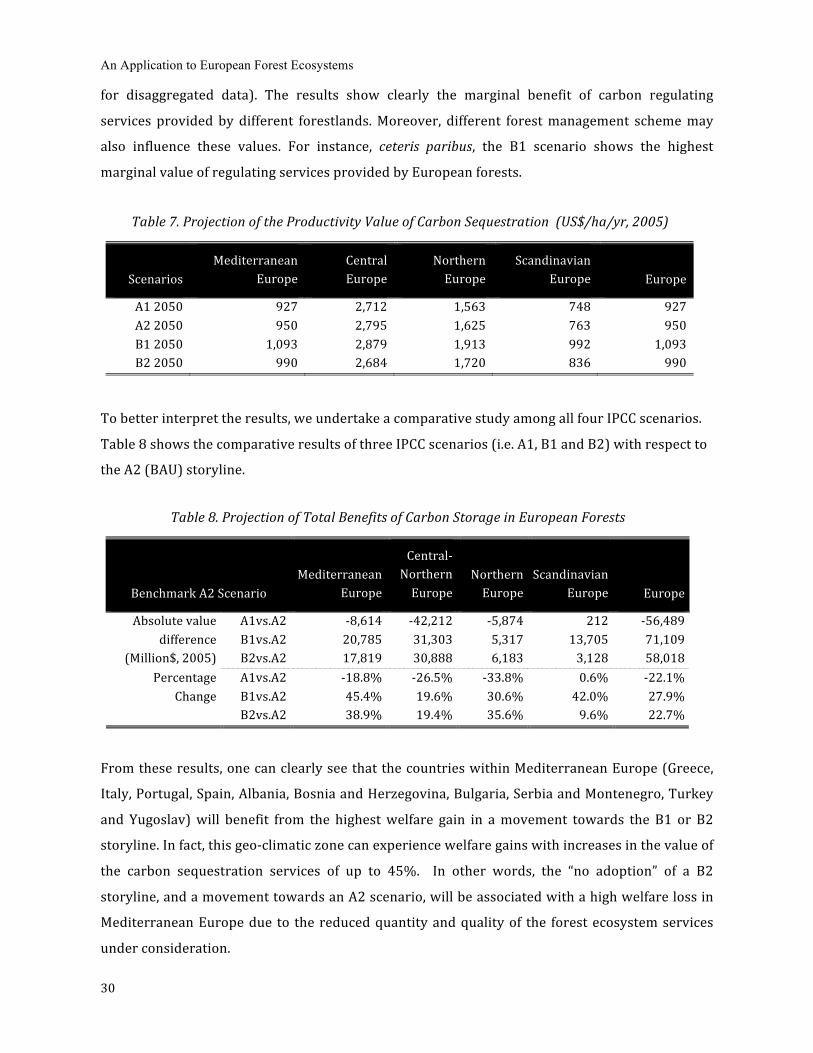
An Application to European Forest Ecosystems
30
for disaggregated data). The results show clearly the marginal benefit of carbon regulating
services provided by different forestlands. Moreover, different forest management scheme may
also influence these values. For instance, ceteris paribus, the B1 scenario shows the highest
marginal value of regulating services provided by European forests.
Table 7. Projection of the Productivity Value of Carbon Sequestration (US$/ha/yr, 2005)
Scenarios Mediterranean
Europe Central Europe
Northern Europe
Scandinavian Europe Europe
A1 2050 927 2,712 1,563 748 927 A2 2050 950 2,795 1,625 763 950 B1 2050 1,093 2,879 1,913 992 1,093 B2 2050 990 2,684 1,720 836 990
To better interpret the results, we undertake a comparative study among all four IPCC scenarios.
Table 8 shows the comparative results of three IPCC scenarios (i.e. A1, B1 and B2) with respect to
the A2 (BAU) storyline.
Table 8. Projection of Total Benefits of Carbon Storage in European Forests
Benchmark A2 Scenario Mediterranean
Europe
Central‐Northern Europe
Northern Europe
Scandinavian Europe Europe
A1vs.A2 ‐8,614 ‐42,212 ‐5,874 212 ‐56,489 B1vs.A2 20,785 31,303 5,317 13,705 71,109
Absolute value difference
(Million$, 2005) B2vs.A2 17,819 30,888 6,183 3,128 58,018 A1vs.A2 ‐18.8% ‐26.5% ‐33.8% 0.6% ‐22.1% B1vs.A2 45.4% 19.6% 30.6% 42.0% 27.9%
Percentage Change
B2vs.A2 38.9% 19.4% 35.6% 9.6% 22.7%
From these results, one can clearly see that the countries within Mediterranean Europe (Greece,
Italy, Portugal, Spain, Albania, Bosnia and Herzegovina, Bulgaria, Serbia and Montenegro, Turkey
and Yugoslav) will benefit from the highest welfare gain in a movement towards the B1 or B2
storyline. In fact, this geo‐climatic zone can experience welfare gains with increases in the value of
the carbon sequestration services of up to 45%. In other words, the “no adoption” of a B2
storyline, and a movement towards an A2 scenario, will be associated with a high welfare loss in
Mediterranean Europe due to the reduced quantity and quality of the forest ecosystem services
under consideration.

Economic Assessment of Climate Change Impacts on Biodiversity, Ecosystem Services and Human Well-being
31
Alternatively, moving from an A2 towards an A1 scenario will always involve a welfare loss for
Mediterranean Europe. In short, for Mediterranean Europe the ‘A’ scenarios will always be
associated with reduced quantity and quality of forest ecosystem services and the resultant
lowering of human welfare levels. On the other hand, storyline B1 is ranked as the most preferred
scenario for this geo‐climatic area. The region of Scandinavian Europe (including Finland, Norway
and Sweden) presents mixed results. Firstly, moving from an A2 towards an A1 scenario will not
involve any welfare loss; on the contrary small welfare gains can be registered. Furthermore, in a
movement towards a B type scenario, Scandinavian Europe will also experience significant
welfare gains in the provision of carbon sequestration services. The respective welfare gains are,
however, much lower when compared to Mediterranean Europe, ceteris paribus. If we consider
Mediterranean and Scandinavian Europe as two ‘corner situations’ in terms of the respective
welfare change magnitudes, we can observe that Central Europe and Northern Europe each
present an intermediate state of affairs. In any case, it is important to note that a movement from
an A2 to an A1 scenario will be always associated with high welfare losses in regulating services,
with the highest losses registered among the Northern Europe countries (Denmark, United
Kingdom, Estonia, Latvia and Lithuania). Finally, both Central Europe and Northern Europe show
a similar profile in terms of carbon sequestration values: any B type scenario is characterized by a
welfare gain, results that are in accordance with what is also registered in Mediterranean and
Scandinavian Europe.
2.4.4 The Economic Value of Cultural Services
The cultural services provided by forest ecosystems consist of two components in our analysis:
recreational use (e.g. nature‐based tourism in forests) and passive use (e.g. existence and bequest
value of forests and biodiversity). Not being traded in regular markets, the values of recreational
and passive use of forests are usually measured as willingness to pay (WTP) figures using non‐
market valuation approaches (namely: travel cost method, contingent valuation and choice
experiments). According to previous literature reviews on cultural values, an expected utility
specification can be used to describe how individuals are willing to trade income for increases or
decreases in forest cultural services, under the assumption that the estimated marginal value of
the service decrease with an increase in the area size of the forest site, and increases with an
increase of the income level of the country where the forest is located (e.g. Hammitt, 2000;
Markandya et al., 2008; Chiabai et al. forthcoming ) The driving force of changes in future forest
areas is considered to be climate change in this paper, therefore, the expressed WTP estimate for
An Application to European Forest Ecosystems
32
trading‐off the forest resources also reflects the fact that the individual’s preference to enjoy a
certain kind of culture service may shift from one forest to another driven by the change in future
climate conditions.
Due to the large scale of our study, it is impossible to conduct new original studies for all 34
countries under consideration. Therefore, a meta‐analysis based value transfer method is used to
estimate the cultural value of forests situated in each geo‐climatic region. Future changes of these
values driven by climate change are projected according to the change in forest areas, in GDP and
population under different IPCC storylines. The change in demand for recreation in forests, driven
by climate change is not considered in the present analysis due to the lack of information and
relevant studies in the literature. This leaves us with a focus on the valuation of the2005$/ha
average WTP estimates (expressed in 2005$/ha) for obtaining cultural services (either
recreational use or passive use) from forests in each geo‐climatic region.
For each region, we assume that one major forest biome can be identified as a representative
forest type which survives the local climate. The main advantage of this type of assumption is that
we can select a few original non‐market valuation studies that have been conducted in any one
country located in the same geo‐climate region to undertake the value transfer within the same
region.
The meta‐analysis enables us to explain the variance of the available WTPs (Willingness‐To‐Pay)
as a function of a few statistically significant explanatory variables20. In particular, the main
explanatory factors for forest recreation and passive use are the forest size designated to
recreation or to biodiversity conservation (S), and the income level of the study area (I, measured
as PPPGDP), according to the following model:
(2)
where is the marginal value of a given forest site designated to recreation or conservation of
biodiversity,
20 A similar approach is used by the authors in another recent research project (COPI) concerning a worldwide valuation of forest ecosystems in the context of policy inaction rather than climate change (see Markandya et al. 2008 for more details).
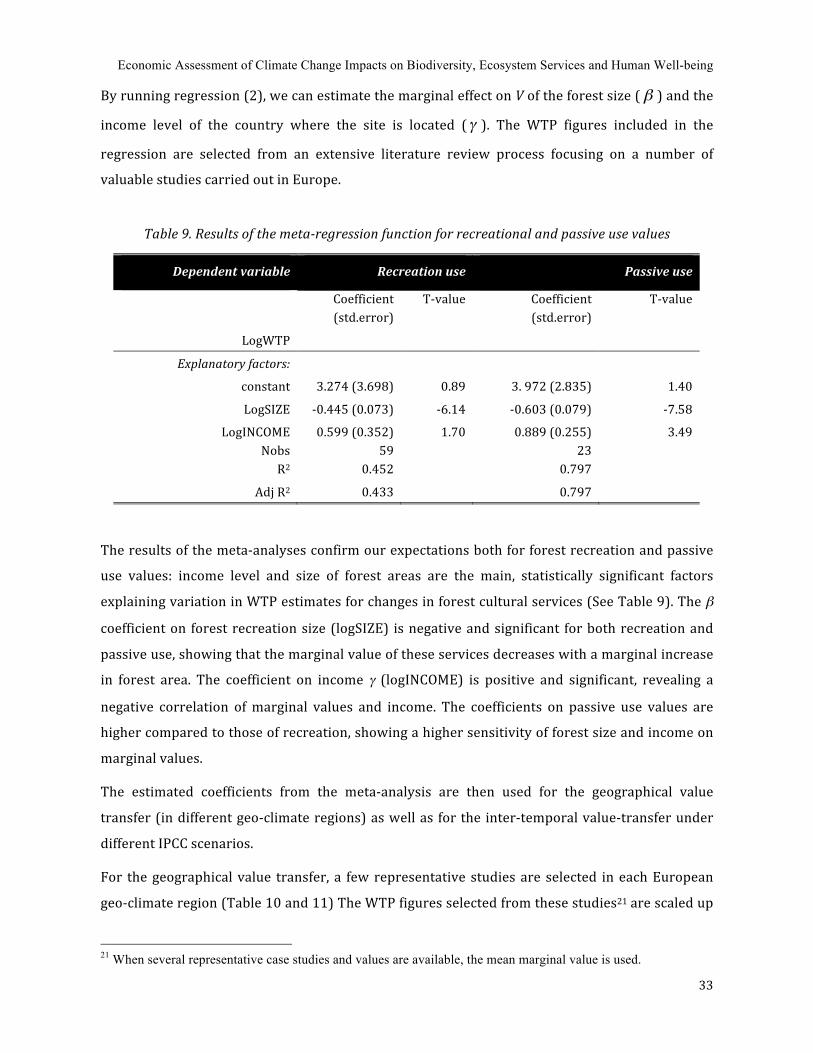
Economic Assessment of Climate Change Impacts on Biodiversity, Ecosystem Services and Human Well-being
33
By running regression (2), we can estimate the marginal effect on V of the forest size ( ) and the
income level of the country where the site is located ( ). The WTP figures included in the
regression are selected from an extensive literature review process focusing on a number of
valuable studies carried out in Europe.
Table 9. Results of the metaregression function for recreational and passive use values
Dependent variable Recreation use Passive use
Coefficient (std.error)
T‐value Coefficient (std.error)
T‐value
LogWTP
Explanatory factors:
constant 3.274 (3.698) 0.89 3. 972 (2.835) 1.40
LogSIZE ‐0.445 (0.073) ‐6.14 ‐0.603 (0.079) ‐7.58
LogINCOME 0.599 (0.352) 1.70 0.889 (0.255) 3.49 Nobs 59 23 R2 0.452 0.797
Adj R2 0.433 0.797
The results of the meta‐analyses confirm our expectations both for forest recreation and passive
use values: income level and size of forest areas are the main, statistically significant factors
explaining variation in WTP estimates for changes in forest cultural services (See Table 9). The β
coefficient on forest recreation size (logSIZE) is negative and significant for both recreation and
passive use, showing that the marginal value of these services decreases with a marginal increase
in forest area. The coefficient on income γ (logINCOME) is positive and significant, revealing a
negative correlation of marginal values and income. The coefficients on passive use values are
higher compared to those of recreation, showing a higher sensitivity of forest size and income on
marginal values.
The estimated coefficients from the meta‐analysis are then used for the geographical value
transfer (in different geo‐climate regions) as well as for the inter‐temporal value‐transfer under
different IPCC scenarios.
For the geographical value transfer, a few representative studies are selected in each European
geo‐climate region (Table 10 and 11) The WTP figures selected from these studies21 are scaled up
21 When several representative case studies and values are available, the mean marginal value is used.
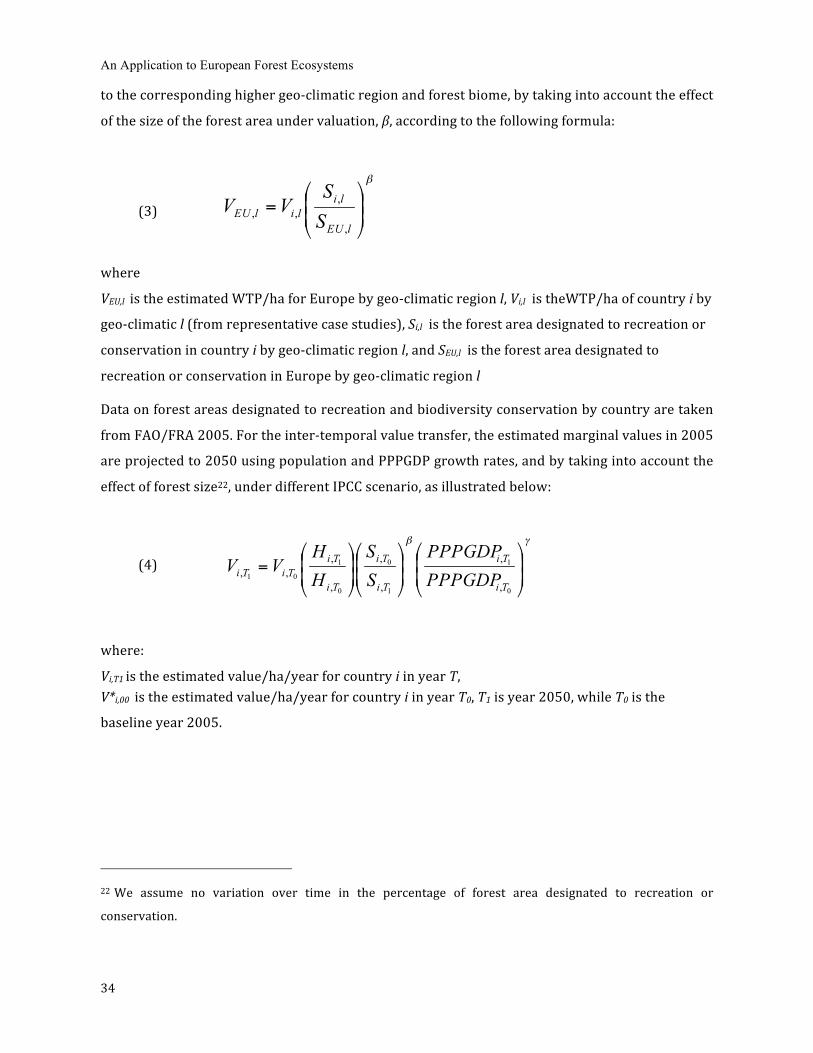
An Application to European Forest Ecosystems
34
to the corresponding higher geo‐climatic region and forest biome, by taking into account the effect
of the size of the forest area under valuation, β, according to the following formula:
(3) where
VEU,l is the estimated WTP/ha for Europe by geo‐climatic region l, Vi,l is theWTP/ha of country i by
geo‐climatic l (from representative case studies), Si,l is the forest area designated to recreation or
conservation in country i by geo‐climatic region l, and SEU,l is the forest area designated to
recreation or conservation in Europe by geo‐climatic region l
Data on forest areas designated to recreation and biodiversity conservation by country are taken
from FAO/FRA 2005. For the inter‐temporal value transfer, the estimated marginal values in 2005
are projected to 2050 using population and PPPGDP growth rates, and by taking into account the
effect of forest size22, under different IPCC scenario, as illustrated below:
(4)
where:
Vi,T1 is the estimated value/ha/year for country i in year T, V*i,00 is the estimated value/ha/year for country i in year T0, T1 is year 2050, while T0 is the
baseline year 2005.
22 We assume no variation over time in the percentage of forest area designated to recreation or
conservation.

Economic Assessment of Climate Change Impacts on Biodiversity, Ecosystem Services and Human Well-being
35
Table 10. Selected studies on recreational use for geographical valuetransfer
Country Reference study Forest biome Geoclimatic region
United Kingdom
Scarpa, R., S. M. Chilton, W. G. Hutchinson, J. Buongiorno (2000)
Temperate broadleaf and mixed forests
Northern Europe
The Netherlands
Scarpa, R., S. M. Chilton, W. G. Hutchinson, J. Buongiorno (2000)
Temperate broadleaf and mixed forests
Central‐Northern Europe
Finland Bostedt, G. and L. Mattsson (2005) Boreal Scandinavian Europe
Italy Bellu, L. G. and Cistulli V. (1994) Mediterranean and Temperate Broadleaf
Mediterranean Europe
Table 11. Selected studies on passive use for geographical valuetransfer
Country Reference study Forest biome Geoclimatic region
United Kingdom
Garrod, G.D. and Willis, K. G. (1997)
Hanley, N., Willis, K, Powe, N, Anderson, M. (2002)
ERM Report to UK Forestry Commission (1996)
Temperate Northern and central‐northern Europe
Finland Kniivila, M., Ovaskainen, V. and Saastamoinen, O. (2002)
Siikamaki, Juha (2007)
Boreal Scandinavian Europe
Spain Mogas, J., Riera, P. and Bennett, J. (2006) Mediterranean Mediterranean Europe
Finally, by multiplying the WTP estimates V($/ha) for recreational or passive use of forests with
the sizes of forest area S that have been designated for recreation or conservation following the
different climate change scenarios (See Appendix‐Table 10 for the computation results), we can
obtain the total recreational or passive use value for each region under each IPCC storyline. For
each individual IPCC storyline, the total cultural value of a geo‐climatic region is the sum of the
respective recreational and passive use value of the forests.
Final results on cultural services show that marginal values may widely differ according to the
latitude (or geo‐climatic region) where the forest is located (see Table 12 and 13) For recreational
values, the highest estimates can be seen in Northern Europe followed by Central‐Northern

An Application to European Forest Ecosystems
36
Europe, probably due to the facilities provided for forest recreation in these countries. The lowest
values are registered in the Scandinavian countries. For passive use values, instead, the highest
estimates are registered in the Mediterranean countries, which have a higher potential for
biodiversity and ecosystem conservation. With regards to the projected total cultural economic
values, Mediterranean Europe appears to have the highest values, followed by Central and
Scandinavian Europe (see Table 14) Within the same geo‐climatic region, climate change might
have a different impact on the cultural services provided in the local economy. By comparing the
different IPCC scenarios, we can see that total values are generally higher for B1 and B2 scenarios
which are environmentally oriented than for the economically oriented scenarios (A1 and A2).
Table 12. Projections of marginal recreational values of European forests (US$/ha/yr, 2005).
Scenarios
Mediterranean
Europe CentralNorthern
Europe Northern Europe
Scandinavian Europe
Initial 2000 1.06‐3.06 0.43‐2.61 1.88‐7.10 0.16‐1.05 A1 2050 1.25‐7.87 1.07‐8.15 4.17‐99.92 0.23‐0.53 A2 2050 1.26‐7.91 0.68‐5.17 4.03‐96.55 0.23‐0.54 B1 2050 1.20‐9.24 0.81‐8.08 3.97‐124.34 0.27‐0.73 B2 2050 1.03‐6.77 0.65‐4.83 2.97‐62.55 0.22‐0.44
Table 13. Projections of marginal passive use values of European forests (US$/ha/yr, 2005).
Scenarios Mediterranean
Europe Northern and Central
Northern Europe Scandinavian Europe
Initial 2000 356‐615 123‐182 123‐255 A1 2050 898‐1,552 361‐534 219‐454 A2 2050 902‐1,558 344‐509 220‐457 B1 2050 748‐1,292 342‐506 262‐543 B2 2050 678‐1,171 230‐340 203‐421
Table 14. Projection of Cultural Values of European Forest Ecosystem (Million$, 2005)
Scenarios Mediterranean
Europe Central Europe Northern Europe
Scandinavian Europe Europe
A1 2050 3,988 2,123 305 1,204 7,620 A2 2050 4,850 2,475 425 1,185 8,936 B1 2050 9,006 4,270 818 2,993 17,088 B2 2050 8,457 3,108 608 2,223 14,396

Economic Assessment of Climate Change Impacts on Biodiversity, Ecosystem Services and Human Well-being
37
Finally, we compare the total values of forest cultural services among the different IPCC scenarios,
using scenario A2 as a benchmark for the analysis (Table 15). This scenario is characterized by the
largest population and the highest GDP per capita. By comparing the remaining scenarios with the
benchmark, we can capture the costs associated with a change from one scenario to another, and
from environmentally oriented scenarios towards economically oriented scenarios.
Table 15. Comparison of Total Value of Cultural Values for European Forests
Benchmark A2 Scenario
Mediterranean Europe
(N35‐45)
Central Europe
(N45‐55)
Northern Europe
(N55‐65)
Scandinavian Europe
(N65‐71) Europe A1vs.A2 ‐862 ‐352 ‐121 18 ‐1,317 B1vs.A2 4,156 1,795 393 1,808 8,152
Absolute value difference
(Million$, 2005) B2vs.A2 3,607 633 182 1,038 5,460
A1vs.A2 ‐17.8% ‐14.2% ‐28.3% 1.5% ‐14.7% B1vs.A2 85.7% 72.5% 92.3% 152.5% 91.2%
Change in % B2vs.A2 74.4% 25.6% 42.9% 87.5% 61.1%
Our comparative analysis of IPCC scenarios shows results which are consistent with our previous
findings. For instance, as far as biodiversity and ecosystem conservation are concerned, the A1
scenario is worse off when comparing it to the A2 scenarios, a conflicting result compared to those
obtained for the provisioning service. This could be due to the harvesting of the forest resources
for WFPs production which may result in a reduction of forests available for other uses, such as
recreational or educational uses. On the contrary, in all B‐type scenarios climate change has
positive impacts on the social economy as the management efforts in sustainable development
and environmental production may halt or compensate the negative impacts of climate change.
This finding, therefore, suggests that moving from the B‐type scenarios to an A2 scenario will
involve costs of policy inaction, as the economic oriented policy may reduce the welfare gain from
forest cultural services, such as the enjoyment of natural environment and the knowledge of the
existence of biodiversity in the forests.
2.5 Conclusions
This paper reports on an original economic valuation of climate change impacts on forest
ecosystem goods and services, and biodiversity. On the one hand, we provide a comprehensive
classification and mapping of the different European countries according to their contribution in
the supply of forest goods and services. The proposed analysis is anchored to the well‐known
An Application to European Forest Ecosystems
38
classification proposed by the MA Approach. On the other hand, we investigate the role of each
country in detail, providing forest provisioning services, regulating services and cultural services.
In order to value the climate change impacts, we first identified four different climate scenarios,
which we refer to as the A1FI, A2, B1 and B2 scenarios, corresponding to the four IPCC storylines,
and evaluated here to the year 2050. Secondly, we proceed with the analysis and evaluation of
climate change impacts on the total forest area (for each country), as well as, on the provisioning
quantities (in bio‐physical terms) across all forest goods and services under consideration. The
projections of future trends of forest areas and the provision of wood forest products in 2050, in
terms of four IPCC storylines, were constructed using global climate models, including HadCM3,
and simulating the response of the global climate system to increase greenhouse gas
concentrations. Moreover, considerable impacts of differentiated latitudes on the variability of
forest EGS were taken into account by carefully regrouping the 34 selected countries located in
different latitude intervals. As a consequence, it not only enabled us to identify the respective
forest productivity related to predominant forest types situated in each latitude interval, but also
to assess and compare the sensitivity of the differentiated forest types in response to climate
change impacts. Both of these aspects have been considered when projecting the future trends of
forest area and forest product flows by 2050, in terms of the four IPCC storylines – see Table A7 in
the Appendix for a summary of the results. Finally, we applied various economic valuation
methods (including market and non‐market valuation methods, primary and value transfers
methods) to estimate the values of the three MA service categories involved, i.e. the provisioning
services, regulating services and cultural services provided by European forests.
Figure 5 ‐ 7 summarize the economic valuation results from three different types of ecosystem
goods and services provided by forest ecosystems in Europe across four IPCC scenarios. As
shown, B scenarios are associated with the highest levels of provision in all of the ecosystem
services under consideration, i.e. wood products, carbon sequestration and cultural services. First,
as regards provisioning services, we can see that the total value of WFPs ranges between 41.2 and
47.5 billion dollars for Central Europe to 5.4 and 7.2 billion dollars in the Northern Europe,
respectively in the A1 and A2 scenarios. For this service, Mediterranean Europe provides a
relatively weak role in provision with values ranging from 6.4 billion dollars in the A1 scenario to
8.7 billion dollars in B2. Moreover, as far as the carbon sequestration services are concerned, we
can see that the stock of carbon stored in the European regions varies from 37.2 to 45.8 billion
dollars in the Mediterranean countries, respectively, in both the A1 and A2 scenarios and to 63.6
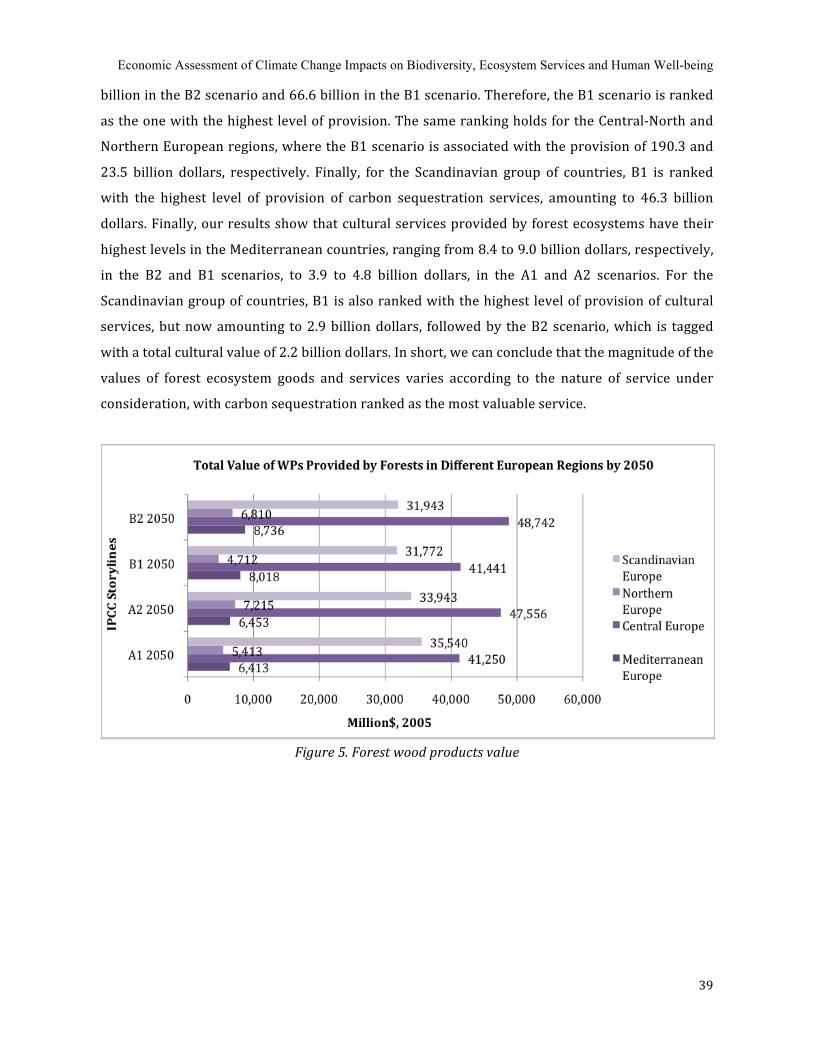
Economic Assessment of Climate Change Impacts on Biodiversity, Ecosystem Services and Human Well-being
39
billion in the B2 scenario and 66.6 billion in the B1 scenario. Therefore, the B1 scenario is ranked
as the one with the highest level of provision. The same ranking holds for the Central‐North and
Northern European regions, where the B1 scenario is associated with the provision of 190.3 and
23.5 billion dollars, respectively. Finally, for the Scandinavian group of countries, B1 is ranked
with the highest level of provision of carbon sequestration services, amounting to 46.3 billion
dollars. Finally, our results show that cultural services provided by forest ecosystems have their
highest levels in the Mediterranean countries, ranging from 8.4 to 9.0 billion dollars, respectively,
in the B2 and B1 scenarios, to 3.9 to 4.8 billion dollars, in the A1 and A2 scenarios. For the
Scandinavian group of countries, B1 is also ranked with the highest level of provision of cultural
services, but now amounting to 2.9 billion dollars, followed by the B2 scenario, which is tagged
with a total cultural value of 2.2 billion dollars. In short, we can conclude that the magnitude of the
values of forest ecosystem goods and services varies according to the nature of service under
consideration, with carbon sequestration ranked as the most valuable service.
Figure 5. Forest wood products value
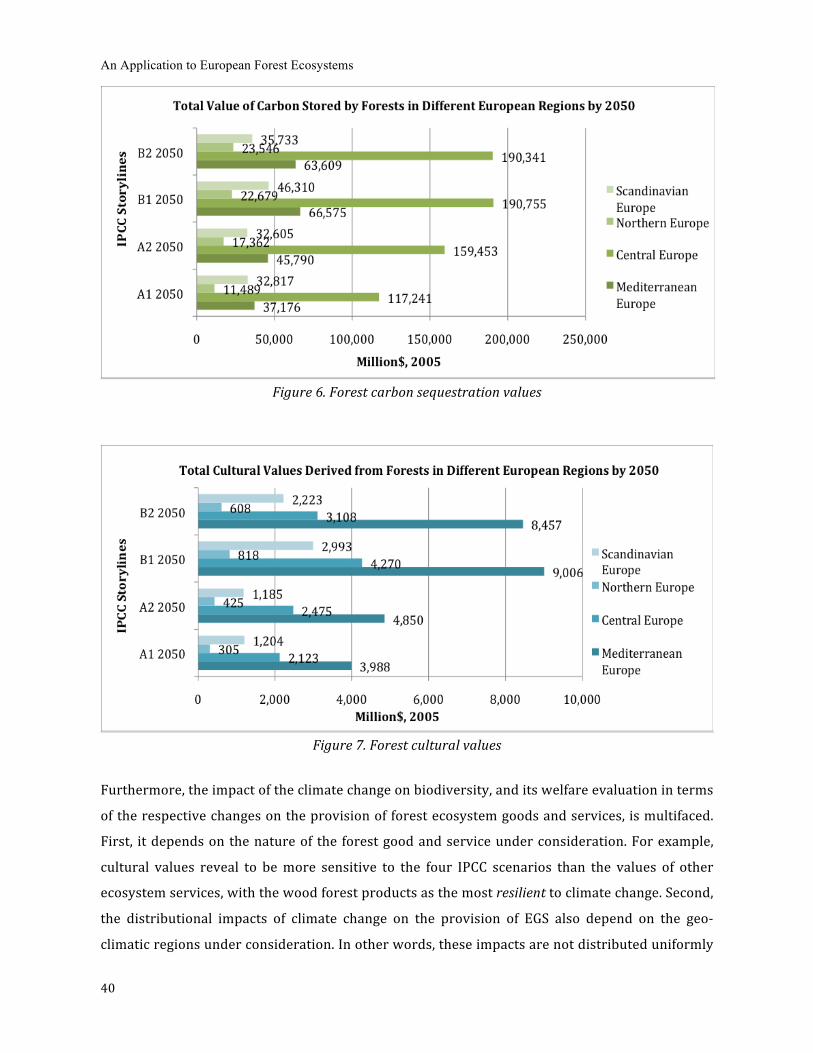
An Application to European Forest Ecosystems
40
Figure 6. Forest carbon sequestration values
Figure 7. Forest cultural values
Furthermore, the impact of the climate change on biodiversity, and its welfare evaluation in terms
of the respective changes on the provision of forest ecosystem goods and services, is multifaced.
First, it depends on the nature of the forest good and service under consideration. For example,
cultural values reveal to be more sensitive to the four IPCC scenarios than the values of other
ecosystem services, with the wood forest products as the most resilient to climate change. Second,
the distributional impacts of climate change on the provision of EGS also depend on the geo‐
climatic regions under consideration. In other words, these impacts are not distributed uniformly
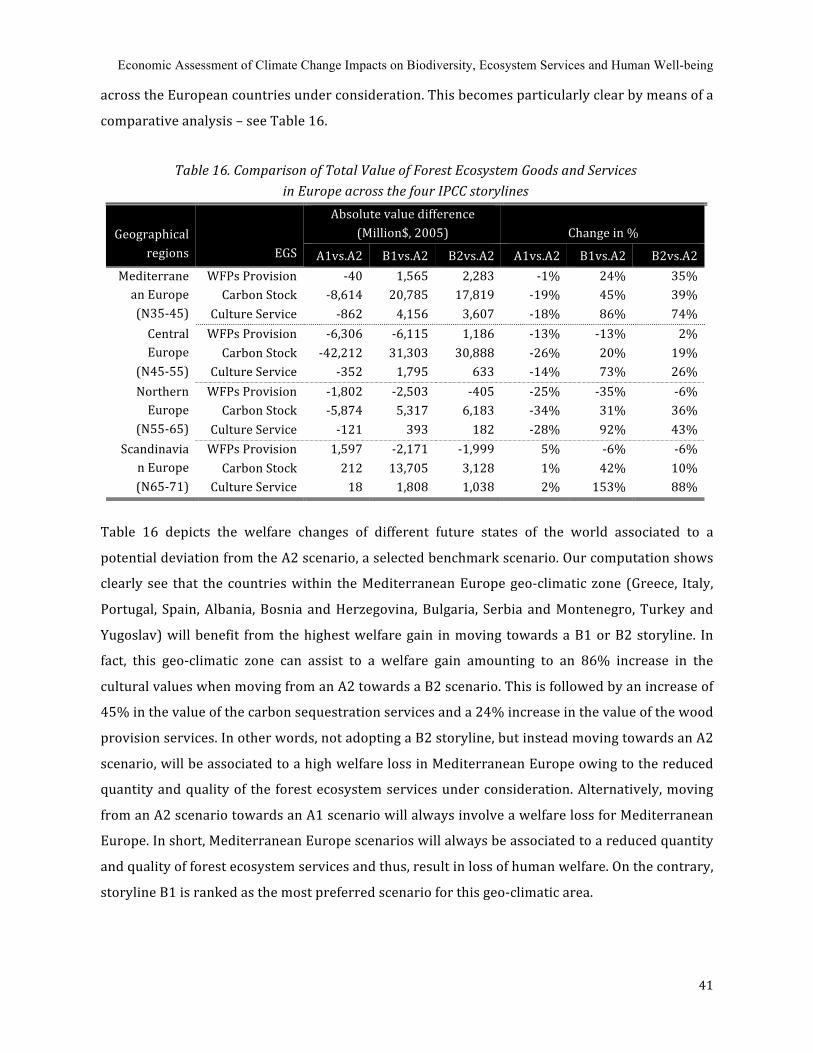
Economic Assessment of Climate Change Impacts on Biodiversity, Ecosystem Services and Human Well-being
41
across the European countries under consideration. This becomes particularly clear by means of a
comparative analysis – see Table 16.
Table 16. Comparison of Total Value of Forest Ecosystem Goods and Services in Europe across the four IPCC storylines
Absolute value difference (Million$, 2005) Change in % Geographical
regions EGS A1vs.A2 B1vs.A2 B2vs.A2 A1vs.A2 B1vs.A2 B2vs.A2 WFPs Provision ‐40 1,565 2,283 ‐1% 24% 35% Carbon Stock ‐8,614 20,785 17,819 ‐19% 45% 39%
Mediterranean Europe (N35‐45) Culture Service ‐862 4,156 3,607 ‐18% 86% 74%
WFPs Provision ‐6,306 ‐6,115 1,186 ‐13% ‐13% 2% Carbon Stock ‐42,212 31,303 30,888 ‐26% 20% 19%
Central Europe
(N45‐55) Culture Service ‐352 1,795 633 ‐14% 73% 26% WFPs Provision ‐1,802 ‐2,503 ‐405 ‐25% ‐35% ‐6% Carbon Stock ‐5,874 5,317 6,183 ‐34% 31% 36%
Northern Europe
(N55‐65) Culture Service ‐121 393 182 ‐28% 92% 43% WFPs Provision 1,597 ‐2,171 ‐1,999 5% ‐6% ‐6% Carbon Stock 212 13,705 3,128 1% 42% 10%
Scandinavian Europe (N65‐71) Culture Service 18 1,808 1,038 2% 153% 88%
Table 16 depicts the welfare changes of different future states of the world associated to a
potential deviation from the A2 scenario, a selected benchmark scenario. Our computation shows
clearly see that the countries within the Mediterranean Europe geo‐climatic zone (Greece, Italy,
Portugal, Spain, Albania, Bosnia and Herzegovina, Bulgaria, Serbia and Montenegro, Turkey and
Yugoslav) will benefit from the highest welfare gain in moving towards a B1 or B2 storyline. In
fact, this geo‐climatic zone can assist to a welfare gain amounting to an 86% increase in the
cultural values when moving from an A2 towards a B2 scenario. This is followed by an increase of
45% in the value of the carbon sequestration services and a 24% increase in the value of the wood
provision services. In other words, not adopting a B2 storyline, but instead moving towards an A2
scenario, will be associated to a high welfare loss in Mediterranean Europe owing to the reduced
quantity and quality of the forest ecosystem services under consideration. Alternatively, moving
from an A2 scenario towards an A1 scenario will always involve a welfare loss for Mediterranean
Europe. In short, Mediterranean Europe scenarios will always be associated to a reduced quantity
and quality of forest ecosystem services and thus, result in loss of human welfare. On the contrary,
storyline B1 is ranked as the most preferred scenario for this geo‐climatic area.

An Application to European Forest Ecosystems
42
Scandinavian Europe (including Finland, Norway and Sweden), however, presents mixed results.
First, moving from an A2 towards an A1 will not involve any welfare loss, on the contrary, small
welfare gains can be registered even if not statistically significant from zero. Furthermore, the
adoption of any B type scenario will always be associated to a welfare loss when considering the
provision of wood products. Finally, Scandinavian Europe will also present significant welfare
gains in the provision of the cultural and carbon sequestration services when moving towards any
B type scenario. The respective welfare gains are, however, much lower when compared to the
Mediterranean Europe, ceteris paribus.
Having the Mediterranean and the Scandinavian Europe as the two ‘corner situations’, we can
observe that Central and Northern European regions present an intermediate state of affairs. In
any case, it is important to remark that moving from an A2 towards an A1 scenario will be always
associated to high welfare losses in all of the three services under consideration, having the
highest losses registered among the Northern European countries (Denmark, United Kingdom,
Estonia, Latvia and Lithuania). Unlike the Mediterranean and Scandinavian regions, the B type
scenario for Central Europe present mixed results on climate change, where welfare loss is mainly
caused by a change in the provision of WFPs. On the contrary, for Northern Europe these
scenarios always provide lower values on WFPs, when compared to A2, which is a comparable
situation to the Scandinavian region. Finally, both Central and Northern European regions show a
similar profile for carbon sequestration and cultural values: any B type scenario is characterized
by a welfare gain from the perspective of these two ecosystem services, a welfare impact, which is
in accordance to that are registered in the Mediterranean and Scandinavian Europe.
Notwithstanding the uncertainties related to climate change, our assessment of the climate
change impacts has shown some interesting results that are potentially useful for policy
implications. There is obviously a need for optimal forest management strategies in Europe to
cope with climatic shocks on the regional ecosystems and to promote the sustainable use of forest
resources for satisfying long‐term human demand. However, the design and implementation of
these policies should respect the specific local environmental, economic and political context of
each country. In other words, there are no silver bullet policies that can be applied to the European
context as a whole. This refers to a bottom‐up management approach to effectively manage forest
resources at country level. On the other hand, by comparing the welfare gains/losses of climate
change impact occurred in different geo‐climatic regions, the EU will be able to evaluate the cost‐
efficient policy alternatives across all of the member countries. Therefore, the countries that
suffer the most losses from climate change may be compensated through other supplementary

Economic Assessment of Climate Change Impacts on Biodiversity, Ecosystem Services and Human Well-being
43
policy package imposed by the EU. This infers a top‐down approach to improve the overall
efficiency of resource management in Europe.
In conclusion and to the best of our knowledge, the current paper represents the first systematic
attempt to estimate human well‐being losses with respect to changes in biodiversity and forest
ecosystem services which are directly driven by climate change. However, we acknowledge the
complexity in mapping, modeling and estimating the relationships between climate change,
biodiversity, ecosystem functioning, ecosystems services and human welfare. Against this
background, we subscribe to the ongoing 'Potsdam Initiative'23 for biodiversity, also suggesting
that it is imperative to continue further with a global study so as to have a better understanding of
the linkages between biodiversity and human well being, especially in the context of global
change.
23 At the meeting of the environment ministers of the G8 countries and the five major newly industrializing countries that took place in Potsdam in March 2007, the German government proposed a study on 'The economic significance of the global loss of biological diversity' as part of the so-called 'Potsdam Initiative' for biodiversity. The following was agreed at Potsdam: 'In a global study we will initiate the process of analysing the global economic benefit of biological diversity, the costs of the loss of biodiversity and the failure to take protective measures versus the costs of effective conservation.'
An Application to European Forest Ecosystems
44
CHAPTER 3 WHEN MICRO- AND MACRO-ECONOMICS MEET TOGETHER TO REVEAL THE TRUE VALUE OF CLIMATE CHANGE IMPACT, CONFLICTS OR COMPLEMENT?
Ding, H., Nunes, P.A.L.D., Bosello, F., and R. Parrado (under preparation) ‘When Micro‐ and Macro‐Economics Meet together to Reveal the True Value of Climate Change Impact, Conflicts or Complement?’, under preparation for submission to Journal of Environmental Economics and Management
Abstract
This paper explores the potential to incorporate micro‐ and macro‐ economic analysis in the estimation of the socio‐economic impacts of climate change‐induced changes in biodiversity and ecosystems. Biodiversity and ecosystem services are interpreted as important components of the world economic system. In this study, we tries to incorporate ecosystem services into a macro economic mechanism, where the world economy is assessed by a set of computable general equilibrium (CGE) models. Within this framework, changes in carbon sequestration provided by European forests are incorporated into a CGE model through a global warming approach, which allows the consideration of climate change impacts on forest carbon sequestration services and to re‐compute a temperature equivalent induced by the higher release of CO2 emissions in the atmosphere resulting from climate change. On the basis of this new information, we then re‐estimate all of the climate change impacts considered using the CGE model and recalculate new macro‐regional GDP effects. The differences between climate change impacts on GDP considering the original and the new carbon sequestration levels are used as an approximation of the general equilibrium value of the changes in the European forest carbon sequestration service. This innovative approach allows us to explore the scaling‐up potential of regional climate change impacts on biodiversity and ecosystem services and to identify the winners and losers of climate change impacts at a larger geographic scale.
Keywords: biodiversity and ecosystem services, climate change, Partial‐General Equilibrium model
JEL: Q51, Q54, Q57
‐‐‐‐
Note: An earlier version of this manuscript has been presented in the 2010 WCERE conference, held in Montreal, Canada and has been included in the Conference Proceedings.
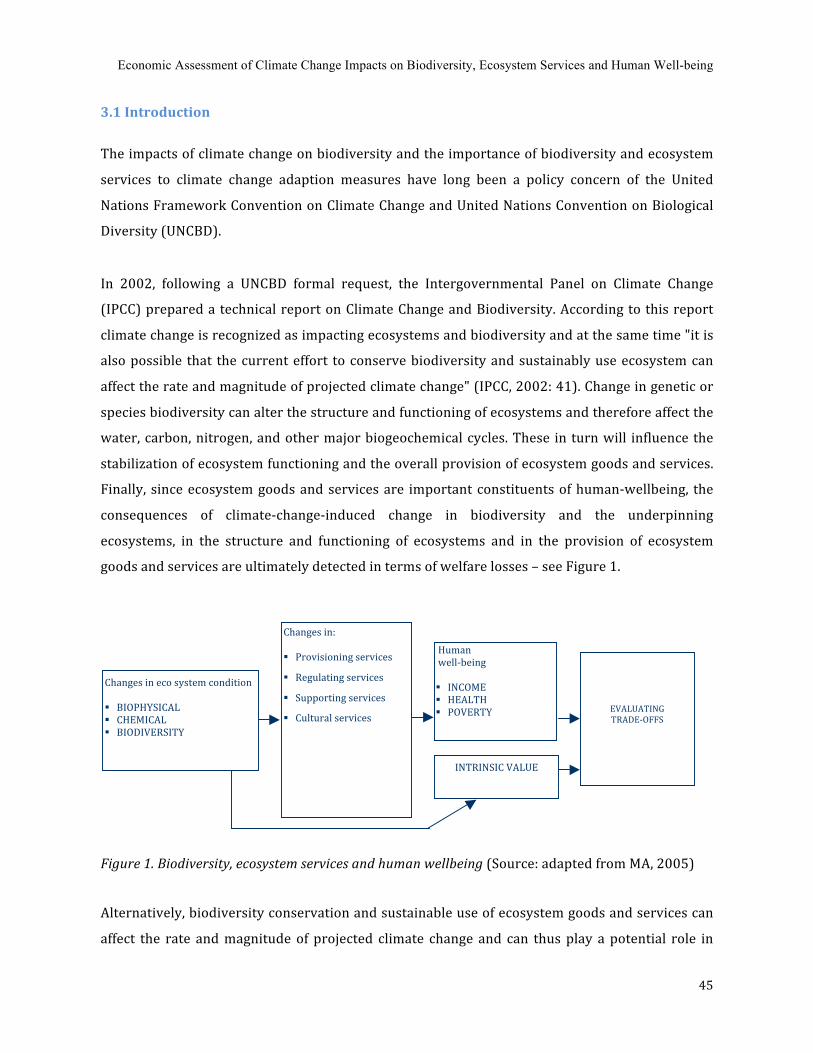
Economic Assessment of Climate Change Impacts on Biodiversity, Ecosystem Services and Human Well-being
45
3.1 Introduction
The impacts of climate change on biodiversity and the importance of biodiversity and ecosystem
services to climate change adaption measures have long been a policy concern of the United
Nations Framework Convention on Climate Change and United Nations Convention on Biological
Diversity (UNCBD).
In 2002, following a UNCBD formal request, the Intergovernmental Panel on Climate Change
(IPCC) prepared a technical report on Climate Change and Biodiversity. According to this report
climate change is recognized as impacting ecosystems and biodiversity and at the same time "it is
also possible that the current effort to conserve biodiversity and sustainably use ecosystem can
affect the rate and magnitude of projected climate change" (IPCC, 2002: 41). Change in genetic or
species biodiversity can alter the structure and functioning of ecosystems and therefore affect the
water, carbon, nitrogen, and other major biogeochemical cycles. These in turn will influence the
stabilization of ecosystem functioning and the overall provision of ecosystem goods and services.
Finally, since ecosystem goods and services are important constituents of human‐wellbeing, the
consequences of climate‐change‐induced change in biodiversity and the underpinning
ecosystems, in the structure and functioning of ecosystems and in the provision of ecosystem
goods and services are ultimately detected in terms of welfare losses – see Figure 1.
Figure 1. Biodiversity, ecosystem services and human wellbeing (Source: adapted from MA, 2005)
Alternatively, biodiversity conservation and sustainable use of ecosystem goods and services can
affect the rate and magnitude of projected climate change and can thus play a potential role in
Changes in eco system condition BIOPHYSICAL CHEMICAL BIODIVERSITY
Changes in: Provisioning services
Regulating services
Supporting services
Cultural services
Human well‐being INCOME HEALTH POVERTY INTRINSIC VALUE
EVALUATING TRADE‐OFFS

An Application to European Forest Ecosystems
46
adaption policies, including land‐use based options. Therefore the economic value estimation
results of climate‐change‐caused impacts on biodiversity and ecosystem services are important to
shed light on the significance of this policy mechanism within any post‐Kyoto climate
negotiations.
In this context, we propose to contribute to the ongoing study of the relationship between
biodiversity, ecosystem services and human well‐being. In addition, this investigation is
performed within a context of global change, and in particular global climate change, exploring the
associated implications of the results of this study for policy design. In particular, this paper will
address a number of policy challenges, such as what are the welfare losses induced by climate
change impacts on European biodiversity and ecosystem services? How does the re‐distributional
map of the losses looks like? Do countries face similar welfare impacts of climate change? Are the
welfare impacts similar across different types of ecosystems? Are the welfare impacts similar
across different ecosystem services? Finally, what are the welfare benefits of integrating
biodiversity and ecosystem services benefits into a more comprehensive future climate policy
regime? To answer these questions, we will explore innovative approaches that go beyond the
conventional economic modeling approaches and try to incorporate the dynamics of climate
change induced ecosystem changes into the analysis of global economic system. The resulting
value estimates may contribute to policymaking that improves the cost‐effectiveness of emission
control, taking into account natural process of ecosystems that regulates climate system and
sequestrate CO2 emissions.
The paper is organized as follows. Section 2 reviews the state‐of‐the‐art economic valuation
techniques and models for valuing ecosystem services and for estimating the costs of climate
change. The pros and cons of two main streams of economic analysis, i.e. micro‐ and macro‐
economic approaches will also be discussed. Section 3 develops an innovative approach that is
labeled as partial‐general equilibrium to re‐estimate the costs of climate change impact on
regional ecosystems. This new approach will be applied to the European forest ecosystem under
climate change scenario. Results are also presented and discussed. Section 4 discusses the lessons
learned from both micro‐and macro‐ economic valuation approaches to estimate the value of
ecosystem services as well as their policy implications. Section 5 concludes the main results of the
research.
Economic Assessment of Climate Change Impacts on Biodiversity, Ecosystem Services and Human Well-being
47
3.2 A Review of Economic Valuation Approaches to Value Climate Change Impacts on
Nature
Economic valuation is rooted in the micro‐economic theory, where values are measured based on
individual preferences and choices. People express their preferences through the choices and
tradeoffs that they make, given certain constraints, such as those on income or available time.
Value is therefore revealed in decisions about how individuals or society collectively choose to
allocate their resources. Therefore, economic valuation of ecosystem services has important
policy implications when limited resources are available to be allocated among a set of
conservation or resource management plans. Decisions need to be made based on the tradeoffs of
various benefits, including both marketed and non‐marketed ones, provided by ecosystem under
different resource use options or management strategies.
Economists measure the value of ecosystem services to people by estimating the amount people
who are willing to pay to preserve or enhance the services. However, this is not always
straightforward. In particular for many ecosystem services that are not traded in the market,
people do not purchase them directly, and thus face difficulties to express their willingness to pay
for those services under conservation. For this reason, various economic valuation techniques are
needed to capture both market and non‐market value aspects of ecosystem services. In Table 1
below, we summarize the standard ecosystem valuation techniques that are mostly used in the
literature.
In the case of climate change, it has already affected many ecosystems as well as their functioning
and capacity to provide goods and services to humans. Thus the socio‐economic valuation of those
impacts is anchored in the assessment of changes in the productivity of the economic sectors
under concern and/or in the measurement of maximum amount individuals who are willing to
pay for avoiding the reduction of ecosystem services caused by continuous increase in
temperature and precipitation rates – see Figure 1. The estimated economic benefits of
biodiversity and ecosystems should reflect the welfare changes of the individuals being directly
affected by changes in biodiversity and ecosystems, or the average welfare change of the
individuals in a considered population (Nunes et al. 2003).
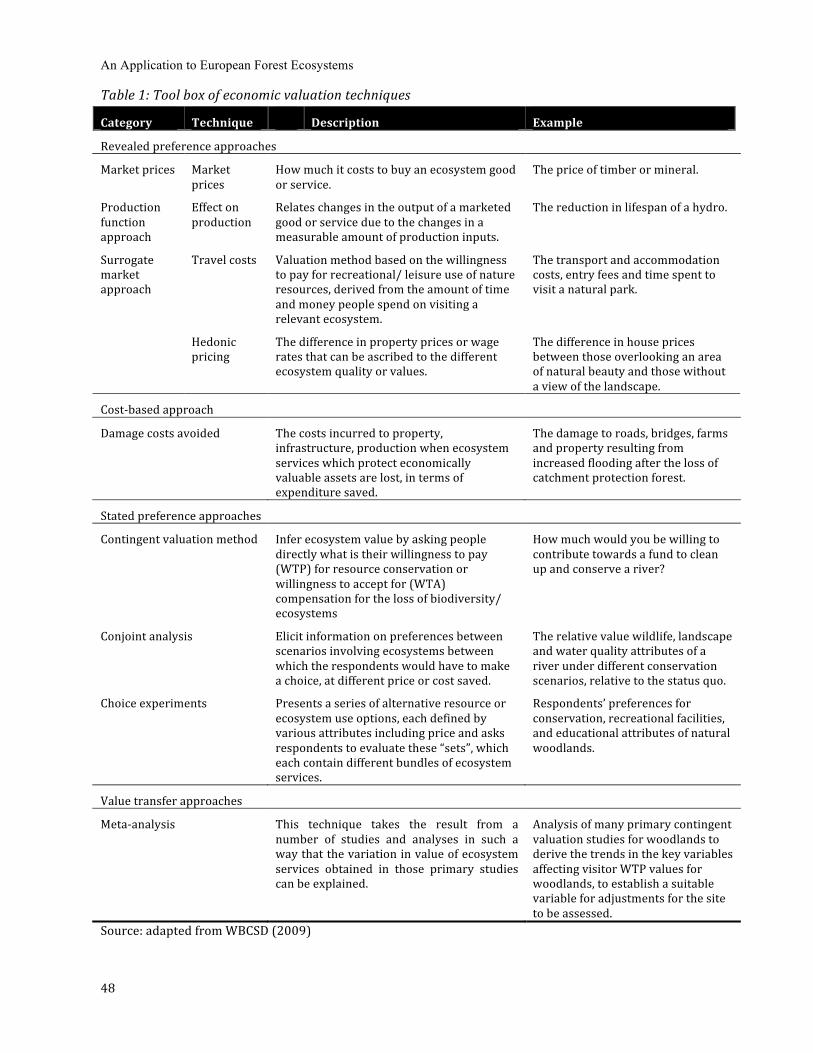
An Application to European Forest Ecosystems
48
Table 1: Tool box of economic valuation techniques
Category Technique Description Example
Revealed preference approaches
Market prices Market prices
How much it costs to buy an ecosystem good or service.
The price of timber or mineral.
Production function approach
Effect on production
Relates changes in the output of a marketed good or service due to the changes in a measurable amount of production inputs.
The reduction in lifespan of a hydro.
Travel costs Valuation method based on the willingness to pay for recreational/ leisure use of nature resources, derived from the amount of time and money people spend on visiting a relevant ecosystem.
The transport and accommodation costs, entry fees and time spent to visit a natural park.
Surrogate market approach
Hedonic pricing
The difference in property prices or wage rates that can be ascribed to the different ecosystem quality or values.
The difference in house prices between those overlooking an area of natural beauty and those without a view of the landscape.
Cost‐based approach
Damage costs avoided The costs incurred to property, infrastructure, production when ecosystem services which protect economically valuable assets are lost, in terms of expenditure saved.
The damage to roads, bridges, farms and property resulting from increased flooding after the loss of catchment protection forest.
Stated preference approaches
Contingent valuation method Infer ecosystem value by asking people directly what is their willingness to pay (WTP) for resource conservation or willingness to accept for (WTA) compensation for the loss of biodiversity/ ecosystems
How much would you be willing to contribute towards a fund to clean up and conserve a river?
Conjoint analysis Elicit information on preferences between scenarios involving ecosystems between which the respondents would have to make a choice, at different price or cost saved.
The relative value wildlife, landscape and water quality attributes of a river under different conservation scenarios, relative to the status quo.
Choice experiments Presents a series of alternative resource or ecosystem use options, each defined by various attributes including price and asks respondents to evaluate these “sets”, which each contain different bundles of ecosystem services.
Respondents’ preferences for conservation, recreational facilities, and educational attributes of natural woodlands.
Value transfer approaches
Meta‐analysis This technique takes the result from a number of studies and analyses in such a way that the variation in value of ecosystem services obtained in those primary studies can be explained.
Analysis of many primary contingent valuation studies for woodlands to derive the trends in the key variables affecting visitor WTP values for woodlands, to establish a suitable variable for adjustments for the site to be assessed.
Source: adapted from WBCSD (2009)
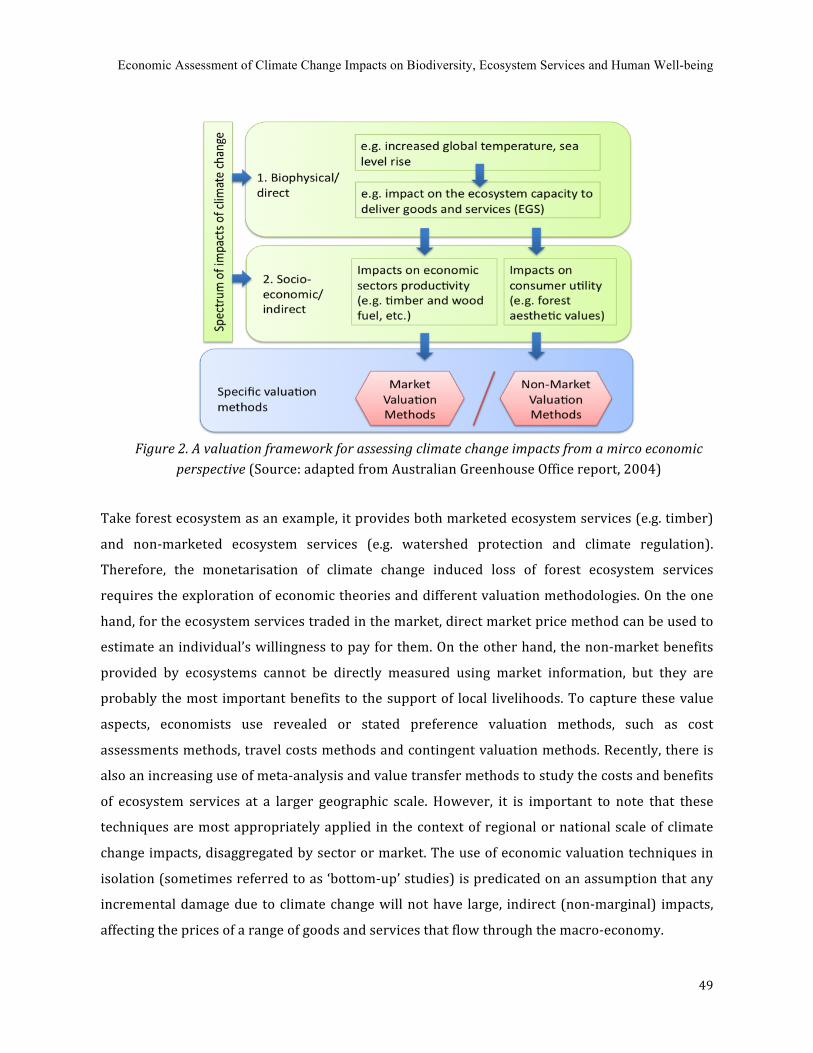
Economic Assessment of Climate Change Impacts on Biodiversity, Ecosystem Services and Human Well-being
49
Figure 2. A valuation framework for assessing climate change impacts from a mirco economic
perspective (Source: adapted from Australian Greenhouse Office report, 2004)
Take forest ecosystem as an example, it provides both marketed ecosystem services (e.g. timber)
and non‐marketed ecosystem services (e.g. watershed protection and climate regulation).
Therefore, the monetarisation of climate change induced loss of forest ecosystem services
requires the exploration of economic theories and different valuation methodologies. On the one
hand, for the ecosystem services traded in the market, direct market price method can be used to
estimate an individual’s willingness to pay for them. On the other hand, the non‐market benefits
provided by ecosystems cannot be directly measured using market information, but they are
probably the most important benefits to the support of local livelihoods. To capture these value
aspects, economists use revealed or stated preference valuation methods, such as cost
assessments methods, travel costs methods and contingent valuation methods. Recently, there is
also an increasing use of meta‐analysis and value transfer methods to study the costs and benefits
of ecosystem services at a larger geographic scale. However, it is important to note that these
techniques are most appropriately applied in the context of regional or national scale of climate
change impacts, disaggregated by sector or market. The use of economic valuation techniques in
isolation (sometimes referred to as ‘bottom‐up’ studies) is predicated on an assumption that any
incremental damage due to climate change will not have large, indirect (non‐marginal) impacts,
affecting the prices of a range of goods and services that flow through the macro‐economy.

An Application to European Forest Ecosystems
50
Nevertheless, the impacts of climate change is rather a global phenomena that affects all types of
ecosystems and the values and services they provide to people, and the spatial distribution of
these effects has shown a heterogeneous pattern across the globe. Models suggest that global net
primary production (NPP) has already increased in response to changes in temperature and
precipitation during the 20th century (Del Grosso et al 2008). Regional modeling also projects
increases in NPP for some regions (Olesen et al. 2007), for example 35‐45 per cent for northern
European ecosystems, as a result of longer growing seasons and higher CO2 concentrations.
However, where water balance is more important, as in southern Europe, NPP is projected to
decline or to increase only slightly relative to present day conditions. This thus involves winners
and losers at different geographical scales. In this context, a comprehensive valuation of costs and
benefits of climate change will be critical to the design of financial mechanism allowing the losers
at different regional or national scales to be compensated.
A most recent study dealing with the monetization of distributional climate change impacts is provided
by Ding et al. (2010), who have proposed a three-step approach to value the changes in ecosystem
goods and services provided by European forest ecosystems in the context of climate change. The first
step is the determination of the role of biodiversity in creating relevant ecosystem services. The second
step is the calculation of the reduced quantity and quality of these ecosystem services resulting in loss of
human welfare under alternative climate scenarios, which contains the four A1, A2, B1 and B2
scenarios proposed by the IPCC. The third step is the (monetary) valuation of that loss – see Figure 2.
The methodology is anchored in a micro-economic valuation approach.
Their results have shown that among all values provided by forest ecosystem services, cultural
values reveal a greater sensitivity to climate change. On the contrary, provisioning services are
observed to be more resilient to climate change. Estimation results show that climate‐change‐
caused impacts on biodiversity and ecosystem services present significant spatial distributional
patterns. Taking the B2 scenario as an example, and 2050 as the year of analysis, Central
European countries are ranked the highest in the provision of forest provisioning services (about
48.7 billion$, measured in 2005 USD and corrected for PPP) and carbon sequestration services
(about 190.3 billion$) but are ranked second in terms of cultural services provision (about 3.1
billion$). Conversely, Mediterranean Europe demonstrates exactly the opposite welfare pattern,
registering the highest cultural value, about 8.4 billion$. The Scandinavian geo‐climatic area is the
second largest contributor to forest provisioning services in Europe (accounting for 31.9 billion$).
Here carbon sequestration services amount to 35.7 billion$ and cultural services 2.2 billion$. In
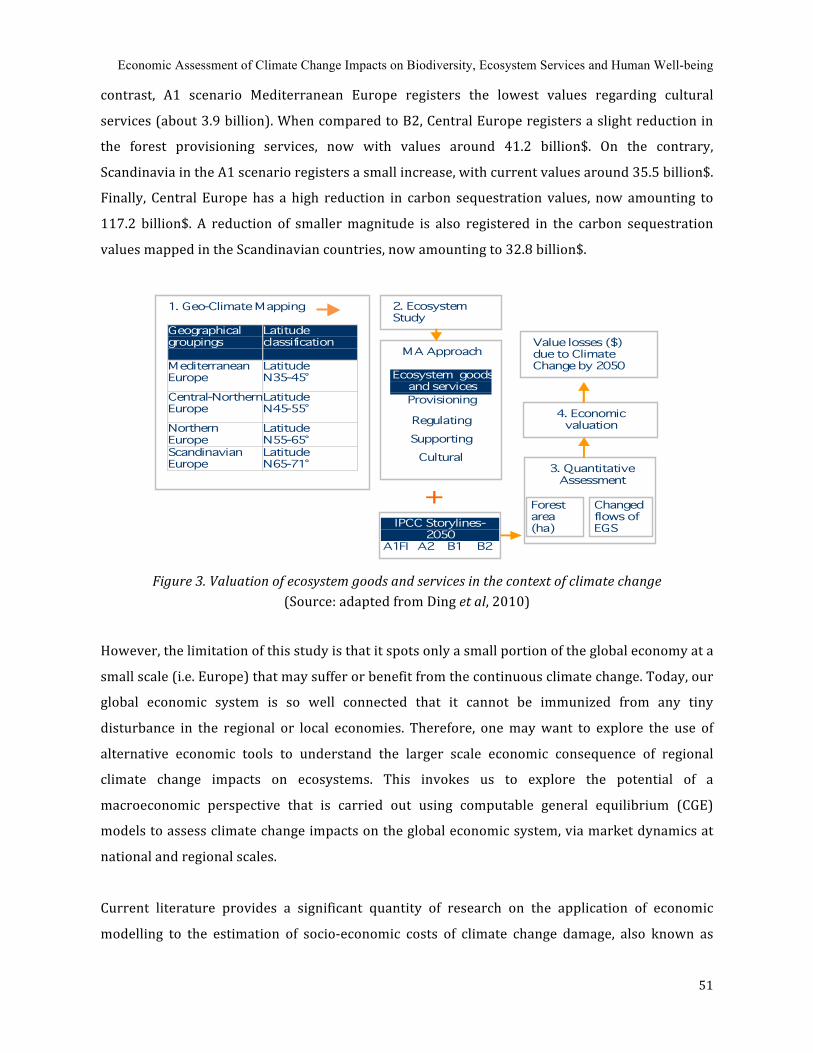
Economic Assessment of Climate Change Impacts on Biodiversity, Ecosystem Services and Human Well-being
51
contrast, A1 scenario Mediterranean Europe registers the lowest values regarding cultural
services (about 3.9 billion). When compared to B2, Central Europe registers a slight reduction in
the forest provisioning services, now with values around 41.2 billion$. On the contrary,
Scandinavia in the A1 scenario registers a small increase, with current values around 35.5 billion$.
Finally, Central Europe has a high reduction in carbon sequestration values, now amounting to
117.2 billion$. A reduction of smaller magnitude is also registered in the carbon sequestration
values mapped in the Scandinavian countries, now amounting to 32.8 billion$.
Figure 3. Valuation of ecosystem goods and services in the context of climate change
(Source: adapted from Ding et al, 2010)
However, the limitation of this study is that it spots only a small portion of the global economy at a
small scale (i.e. Europe) that may suffer or benefit from the continuous climate change. Today, our
global economic system is so well connected that it cannot be immunized from any tiny
disturbance in the regional or local economies. Therefore, one may want to explore the use of
alternative economic tools to understand the larger scale economic consequence of regional
climate change impacts on ecosystems. This invokes us to explore the potential of a
macroeconomic perspective that is carried out using computable general equilibrium (CGE)
models to assess climate change impacts on the global economic system, via market dynamics at
national and regional scales.
Current literature provides a significant quantity of research on the application of economic
modelling to the estimation of socio‐economic costs of climate change damage, also known as

An Application to European Forest Ecosystems
52
Integrated Assessment Models – IAMs, developed primarily for the purpose of assessing policy
options for climate change control, by definition combining the socio‐economic aspects of global
economic growth with the scientific aspects of geophysical climate dynamics. Well‐known IAMs in
the literature include MERGE, IMAGE, FUND, and DICE, with a focus on global estimates of carbon
stocks. These models are characterised by significant differences that can all affect these final
estimates including levels of modelling detail, in their respective capacities to deal with climate‐
economic‐atmospheric complexity and the economic modelling strategy, in their capacities to deal
with uncertainty and in their abilities to incorporate economic responses.
Despite significant scientific investigation, the economics of climate change is still not well
understood due to the high uncertainties of climate change impacts in the long run (Kelly and
Kolstad, 1999). More ambitious and controversial approaches of cost‐benefit analysis require
additional information about the monetized value of climate impacts, which is necessary to
calculate the “optimal” policy, or to determine whether a particular policy is “worthwhile”
(Ackerman and Finlayson, 2005). In addition, most of these impact studies take a static approach
(Tol, 2002a; Watson et al., 1996; Pearce et al., 1996; Tol et al., 2000), whereas climate change is
rather a long‐term dynamic process, involving the complexity of interface between physical and
economic dynamics, such as the increasing CO2 concentration, the growing world population and
economy, and the evolving technologies and institutions (Tol, 2002b). More precisely, the
consequences of climate instability and rapid large‐scale shifts in global climate may interfere in
the economic production function in many sectors (e.g. forestry, and tourism), whereas the socio‐
economic development is always the embedded driving force behind climate change. To date,
economists have been putting more effects on moving the state of the art IAMs towards a dynamic
approach (e.g. Tol, 2002b). In particular, to the best of our knowledge, none of the existing IAM
model has ever incorporated the dynamics of ecosystem changes under climate change impacts
into the projections of economic system. Thus, the rest of the paper will focus on exploring an
alternative modelling approach, namely partial‐general equilibrium model approach that brings
together the two different economics domains by integrating ecosystem‐based impact assessment
into the study of climate system dynamics as well as the regular cost‐benefit analysis of climate
change impacts, with particular attention to the regulating services of ecosystems.
3.3 Developing a Partialgeneral Equilibrium Perspective Using ICES Model

Economic Assessment of Climate Change Impacts on Biodiversity, Ecosystem Services and Human Well-being
53
The proposed partial‐general equilibrium model encompasses two steps: First, the magnitude of
climate change impacts on forest productivity and carbons sequestration is isolated and estimated
in an integrate‐hybrid valuation model. Second, the information provided by the integrate‐hybrid
valuation model is used to revise the original forest productivities in a CGE model, where land
productivity enters as an exogenous variable and its level is decided by the user and calibrated in
the model so as to mirror current conditions as closely as possible. At that stage we are then able
to use the CGE model to re‐compute the new equilibrium caused by biodiversity productivity
shocks.
The methodology and results of step 1 are reported in Chapter 2. Therefore, in this chapter, we
will focus on step2, demonstrating how to develop the partial‐general equilibrium model. In this
study, the economic implications of climate change are determined by using a multi‐country
world CGE model: ICES. Based on the Global Trade Analysis Project (GTAP) database version 6
and core model (Hertel, 1996), ICES develops a recursive‐dynamic growth engine where a
sequence of static equilibria are linked by the process of capital accumulation driven by
endogenous investment decisions. The specification of the supply side of the model follows
Burniaux and Truong (2002), with extended details in the description of energy production. The
model runs for the period between 2001 and 2050 on a yearly basis.
It is an essential first step to build a benchmark for the study period, during which investment
choices and resulting capital stocks are determined endogenously in the model, whereas other
key economic variables in the calibration dataset of the model are exogenously updated, allowing
us to identify a hypothetical general equilibrium state in the future (This methodology is
described in Dixon and Rimmer, (2002)). In particular, changes in the national endowments of
population/labour, land, natural resources, as well as variations in factor‐specific and multi‐factor
productivity are projected by justifying these variables on the supply side. In this study,
estimations of future changes of the production endowments were taken from various databases.
For example, the future regional labour stocks were taken from UNDP (2008); whereas estimates
of land endowments and agricultural land productivity were derived from the IMAGE model
version 2.2 (IMAGE, 2001). As for the natural resources stock variables, a rather specific
methodology was adopted. We choose to apply exogenous prices of the natural resources in the
model so that computer will endogenously generate the optimal amount of natural stocks being
used in the production over time. For instance, the prices of specific natural resources, such as oil,
coal and gas have been set to mimic what was forecasted by EIA (2009). Finally, by changing the

An Application to European Forest Ecosystems
54
calibration values for these variables, the CGE model was able to simulate a general equilibrium
state for the future world economy, referring to a benchmark where no economic impacts of
climate change have taken place, whereas the counterfactual scenarios consider the effects
generated by one or more impact factors. For the purpose of comparison between different
possible future development paths, the social economic scenario A2 of the IPCC is chosen as a
reference future state of climate change.
3.3.1 A new approach to evaluate the costs to the EU Economic System due to climate
change impacts on forest ecosystem
To assess the general equilibrium implications of climate change impacts on ecosystems services,
each of these services is first translated into a marketable item and then into changes in the
appropriate economic variables that act as inputs into or constitute outputs from the CGE model.
For instance, climate‐change induced changes in forest ecosystem provisioning services are
modelled as changes in the productivity of the natural resource inputs used by the European
timber industries. Whereas the general equilibrium assessment of changes in European forests’
carbon sequestration services follows a different path. Changes in forest based carbon
sequestration alter the GHG’s balance between land sinks and the atmosphere, thereby causing a
temperature change that can be defined over a period of time. Taking this into consideration, we
use a global warming approach, which to the best of our knowledge has never been performed
under a CGE modelling framework. This exercise consists of the formulation of a scenario where
the carbon sequestration services from European forests are affected by climate change, thereby
producing a different CO2 concentration level in the atmosphere and a corresponding variation in
temperature. That change in temperature in its turn impacts the economy at various levels that
can then be assessed through the use of the ICES model. Accordingly, we first compute a
temperature equivalent induced by the higher release of CO2 emissions in the atmosphere
resulting from climate change. On the basis of this new information, we then re‐estimate all of the
climate change impacts considered using the ICE model and recalculate new macro‐regional GDP
effects. The differences between climate‐change impacts on GDP considering the original and the
new carbon sequestration levels are used as an approximation of the general equilibrium value of
the changes in EU forest carbon sequestration service.
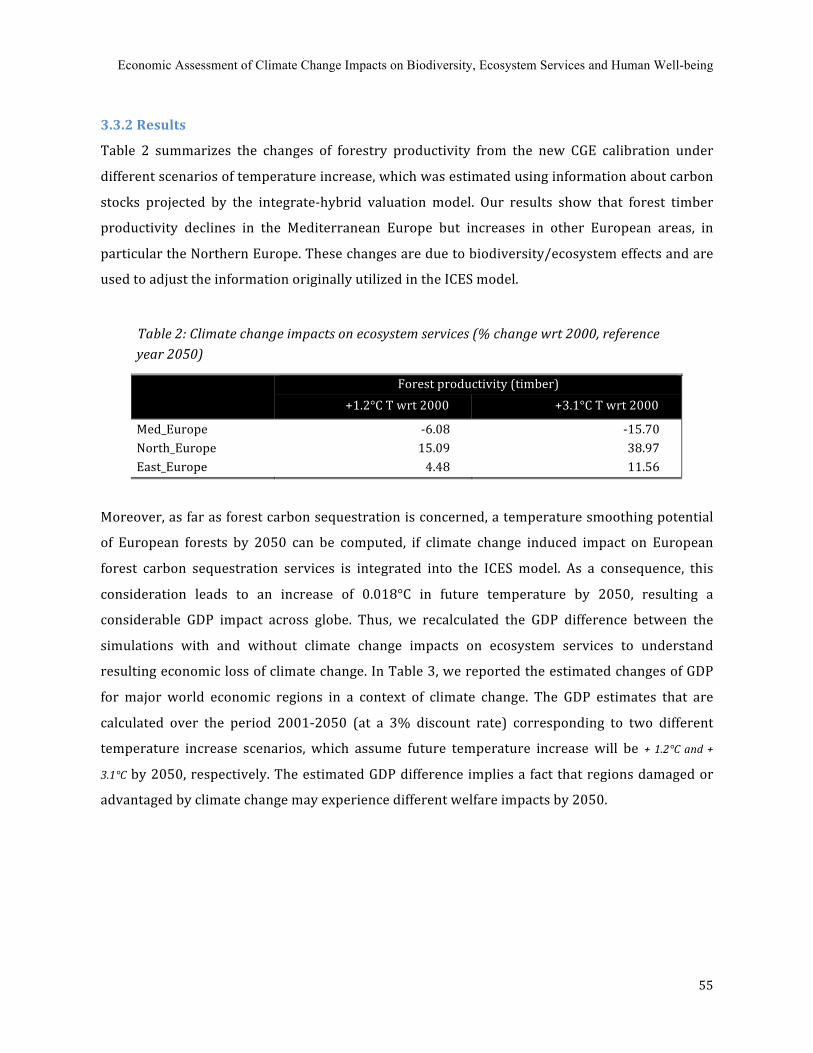
Economic Assessment of Climate Change Impacts on Biodiversity, Ecosystem Services and Human Well-being
55
3.3.2 Results
Table 2 summarizes the changes of forestry productivity from the new CGE calibration under
different scenarios of temperature increase, which was estimated using information about carbon
stocks projected by the integrate‐hybrid valuation model. Our results show that forest timber
productivity declines in the Mediterranean Europe but increases in other European areas, in
particular the Northern Europe. These changes are due to biodiversity/ecosystem effects and are
used to adjust the information originally utilized in the ICES model.
Table 2: Climate change impacts on ecosystem services (% change wrt 2000, reference year 2050)
Forest productivity (timber)
+1.2°C T wrt 2000 +3.1°C T wrt 2000
Med_Europe ‐6.08 ‐15.70 North_Europe 15.09 38.97 East_Europe 4.48 11.56
Moreover, as far as forest carbon sequestration is concerned, a temperature smoothing potential
of European forests by 2050 can be computed, if climate change induced impact on European
forest carbon sequestration services is integrated into the ICES model. As a consequence, this
consideration leads to an increase of 0.018°C in future temperature by 2050, resulting a
considerable GDP impact across globe. Thus, we recalculated the GDP difference between the
simulations with and without climate change impacts on ecosystem services to understand
resulting economic loss of climate change. In Table 3, we reported the estimated changes of GDP
for major world economic regions in a context of climate change. The GDP estimates that are
calculated over the period 2001‐2050 (at a 3% discount rate) corresponding to two different
temperature increase scenarios, which assume future temperature increase will be + 1.2°C and +
3.1°C by 2050, respectively. The estimated GDP difference implies a fact that regions damaged or
advantaged by climate change may experience different welfare impacts by 2050.
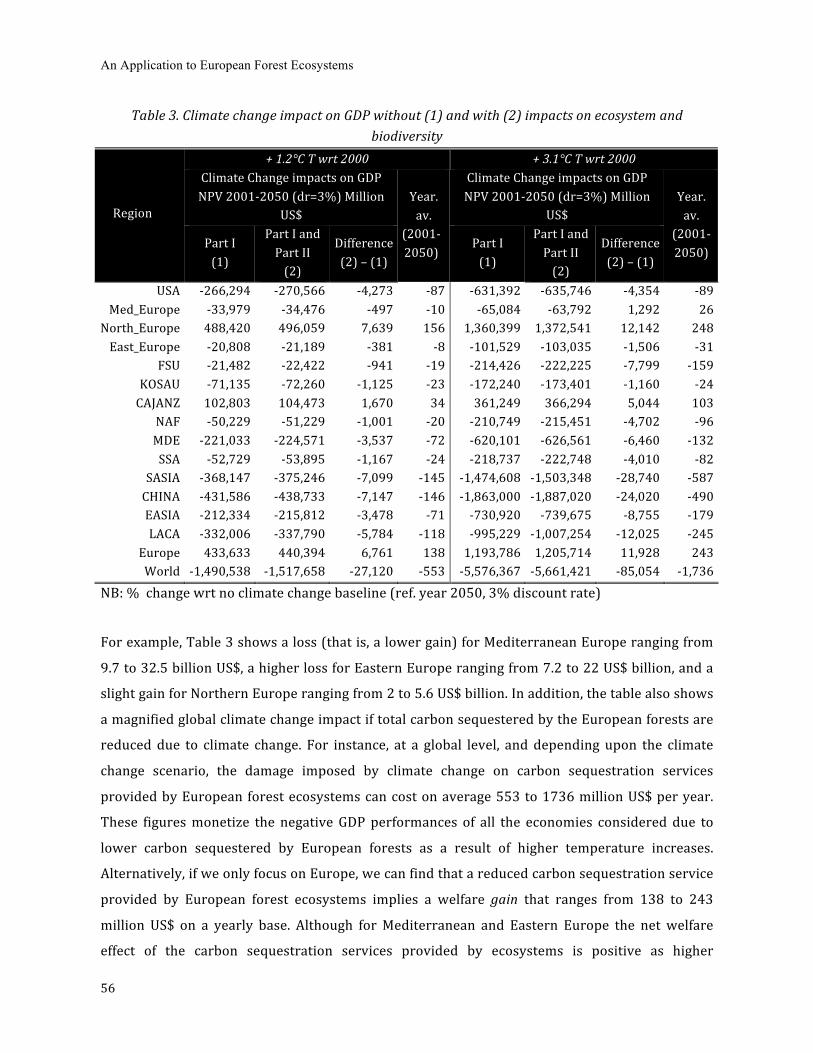
An Application to European Forest Ecosystems
56
Table 3. Climate change impact on GDP without (1) and with (2) impacts on ecosystem and
biodiversity
+ 1.2°C T wrt 2000 + 3.1°C T wrt 2000 Climate Change impacts on GDP NPV 2001‐2050 (dr=3%) Million
US$
Climate Change impacts on GDP NPV 2001‐2050 (dr=3%) Million
US$ Region
Part I (1)
Part I and Part II (2)
Difference (2) – (1)
Year. av.
(2001‐2050)
Part I (1)
Part I and Part II (2)
Difference (2) – (1)
Year. av.
(2001‐ 2050)
USA ‐266,294 ‐270,566 ‐4,273 ‐87 ‐631,392 ‐635,746 ‐4,354 ‐89 Med_Europe ‐33,979 ‐34,476 ‐497 ‐10 ‐65,084 ‐63,792 1,292 26
North_Europe 488,420 496,059 7,639 156 1,360,399 1,372,541 12,142 248 East_Europe ‐20,808 ‐21,189 ‐381 ‐8 ‐101,529 ‐103,035 ‐1,506 ‐31
FSU ‐21,482 ‐22,422 ‐941 ‐19 ‐214,426 ‐222,225 ‐7,799 ‐159 KOSAU ‐71,135 ‐72,260 ‐1,125 ‐23 ‐172,240 ‐173,401 ‐1,160 ‐24 CAJANZ 102,803 104,473 1,670 34 361,249 366,294 5,044 103
NAF ‐50,229 ‐51,229 ‐1,001 ‐20 ‐210,749 ‐215,451 ‐4,702 ‐96 MDE ‐221,033 ‐224,571 ‐3,537 ‐72 ‐620,101 ‐626,561 ‐6,460 ‐132 SSA ‐52,729 ‐53,895 ‐1,167 ‐24 ‐218,737 ‐222,748 ‐4,010 ‐82
SASIA ‐368,147 ‐375,246 ‐7,099 ‐145 ‐1,474,608 ‐1,503,348 ‐28,740 ‐587 CHINA ‐431,586 ‐438,733 ‐7,147 ‐146 ‐1,863,000 ‐1,887,020 ‐24,020 ‐490 EASIA ‐212,334 ‐215,812 ‐3,478 ‐71 ‐730,920 ‐739,675 ‐8,755 ‐179 LACA ‐332,006 ‐337,790 ‐5,784 ‐118 ‐995,229 ‐1,007,254 ‐12,025 ‐245
Europe 433,633 440,394 6,761 138 1,193,786 1,205,714 11,928 243 World ‐1,490,538 ‐1,517,658 ‐27,120 ‐553 ‐5,576,367 ‐5,661,421 ‐85,054 ‐1,736
NB: % change wrt no climate change baseline (ref. year 2050, 3% discount rate)
For example, Table 3 shows a loss (that is, a lower gain) for Mediterranean Europe ranging from
9.7 to 32.5 billion US$, a higher loss for Eastern Europe ranging from 7.2 to 22 US$ billion, and a
slight gain for Northern Europe ranging from 2 to 5.6 US$ billion. In addition, the table also shows
a magnified global climate change impact if total carbon sequestered by the European forests are
reduced due to climate change. For instance, at a global level, and depending upon the climate
change scenario, the damage imposed by climate change on carbon sequestration services
provided by European forest ecosystems can cost on average 553 to 1736 million US$ per year.
These figures monetize the negative GDP performances of all the economies considered due to
lower carbon sequestered by European forests as a result of higher temperature increases.
Alternatively, if we only focus on Europe, we can find that a reduced carbon sequestration service
provided by European forest ecosystems implies a welfare gain that ranges from 138 to 243
million US$ on a yearly base. Although for Mediterranean and Eastern Europe the net welfare
effect of the carbon sequestration services provided by ecosystems is positive as higher

Economic Assessment of Climate Change Impacts on Biodiversity, Ecosystem Services and Human Well-being
57
temperature are “bad” for them, it is negative for Northern Europe which ultimately gains from
climate change. To better understand the climate change induced ecosystem impacts on future
GDP in Europe, we extracted the GDP estimates and re‐organize them in Table4 below.
Table 4. Contribution of carbon sequestration services from European ecosystems to global climate change regulation (in billion US$, at 3% discount rate)
Region Model CGE (1)
CGE & BES (2)
(2) – (1)
Year average (20012050)
Med Europe
‐34 ‐65
‐34 ‐64
‐0.5 +1.3
‐0.01 +0.03
North Europe +488
+1,360 +496
+1,373 +7.6
+12.1 +0.16
+0.25
East Europe ‐21
‐102 ‐21
‐103 ‐0.4
‐1.5 ‐0.01
‐0.03
World ‐1,491
‐5,576 ‐1,518
‐5,661 ‐27.1
‐85.1 ‐0.55
‐1.74
In Table 4, the first column shows the valuation results from the CGE model. The second column
shows the estimation results of the CGE with the biodiversity and ecosystem services, BES – see
CGE & BES model. The third column depicts the differences. All magnitudes are measured in terms
of projected changes in GDP with respect to no climate change baseline for the reference year
2050. There are two value estimates per region, for a mean temperature increase of 1.2 and 3.1
degrees Celsius, respectively. In general, our results show that over the fifty‐year period the NPV
for the Mediterranean Europe now ranges from, ‐34 to ‐65 billion US$, depending on the two
temperature scenarios under consideration. Therefore, when compared to the original welfare
computations, this implies a higher loss for Mediterranean Europe ranging up to 0.5 billion US$. In
other words, climate‐change‐caused impacts on biodiversity and ecosystem services cause an
additional welfare loss to Mediterranean Europe. A similar welfare pattern is registered in the
East Europe. Note, however, that the North Europe region has a welfare gain due to climate
change, whose magnitude is reinforced when BES is embedded. In fact, this is responsible for an
additional welfare gain that ranges between +7.6 and +12.1 billion US$, depending on the
temperature scenario. Finally, at a global level, and depending upon the climate change scenario,
our model result suggests that the damage imposed by climate change on carbon sequestration
services provided by European forests ranges from 27.1 to 85.1 billion US$. This loss is equivalent
to an annual rent that ranges between 0.56 and 1.74 billion US$ over a period of fifty years.
An Application to European Forest Ecosystems
58
3.4 Lessons Learned from Microand Macro Economic Valuation Approaches to Estimate the Value of Ecosystem Services and the Respective Policy Implications
The economic valuation of the impacts caused by climate change on biodiversity and ecosystem
services are multifaceted. Previous findings obtained using an integrate‐hybrid economic
valuation approach (by Ding et al., 2010 – Chapter 2) reveal significant welfare impacts, however
the respective dimension and distribution effects vary significantly across geo‐climatic regions in
Europe, and the magnitudes of the impact depends on the underlying IPCC storyline and the type
of ecosystem services under consideration. In most of the cases, changes involved signal the
presence of winners and losers, or different magnitudes of welfare loss. This aspect, i.e. the
unbalanced distribution of climate‐change‐caused impacts on biodiversity and ecosystem services
across Europe, signals the relevance of the issues of redistribution when approaching an efficient,
broadly accepted international negotiation on carbon reduction. In conclusion, the advantage of a
micro‐economic assessment of the climate change impacts on ecosystem services can contribute
directly to estimating economic loss from the reduced ecosystem services and productivity and to
identifying the winners and losers at regional level. This information is of particular importance in
the design of cost‐effective and efficient environmental policies that reallocate resources among
regions and stakeholders to achieve the United Nations’ millennium development goals (MDGs) as
well as the international target of GHGs reduction. At the same time, we should also recognize the
limitation of such direct impact assessment for achieving the long‐term sustainable development
goals, as climate change is not only affecting ecosystem functioning and productivity locally, but
the regional ecosystem disturbance may have far‐reaching socio‐economic consequences in the
far distant future, through international trade and interactions between all the economies in the
globe.
The partial‐equilibrium model approach on the other hand can be complementary to the hybrid
model approach, by incorporating regional climate change induced ecosystem impacts into the
picture of world economy. As demonstrated in this paper, we can recalculate the changes of global
economy under future climate change scenario by incorporating forest carbon sequestration
service into the ICES model. Despite the fact that our model development is still at an early stage,
i.e. taking into account only one type of ecosystem (forest) and one ecosystem service (carbon
regulating services), our new findings are promising. First of all, our model results suggest that
European forests have a potential to smooth temperatures as low as 0.018°C in 2050.
Furthermore, we use this information to recalibrate the ICES model so as to re‐compute the new
equilibrium caused by biodiversity and carbon sequestration services.
Economic Assessment of Climate Change Impacts on Biodiversity, Ecosystem Services and Human Well-being
59
Similar to the results of the hybrid evaluation model, the GDP value estimates from the partial‐
general equilibrium model show that there is no single welfare change pattern. In particular, for
Mediterranean Europe the introduction of the Biodiversity and Ecosystems sector, modeled here
in terms of the European forest sequestration services, does not imply significant additional
welfare changes, when compared to the original CGE estimates. In fact, the magnitude of the
welfare losses caused by climate change is approximately the same across the two model
specifications under consideration. On the contrary, at a global level the damage imposed by
climate change on biodiversity and carbon sequestration services provided by European forests
ranges up to 85.1 billion US$. In other words, the key message delivered by this analysis is that the
economic assessment of climate‐change‐cause impacts on biodiversity and ecosystem services
highlights a substantive welfare loss. It is also true, that this is signal the tip of the iceberg: the
analysis is here focused at biodiversity anchored at a single ecosystem type, forest, and a single
ecosystem service produced by forests, carbon sequestration.
Taking into account (1) the forty four European countries and (2) the sequestration services from
forests alone, climate‐change‐cause impacts on biodiversity and ecosystem services are
responsible for welfare loss amounting to 85 billion USD$. If we also add (3) the biodiversity
productivity effects on the agricultural sectors, (4) freshwater and coastal ecosystems this figures
rises up to 145 ‐ 170 billion USD$ (this is demonstrated in Bosello et al. 2009). If we consider the
World Bank’s global ranking with respect to GDP per capita, this amount corresponds to the
aggregated GDP of the 22 poorest countries, which constitute 13% of the totality of world
countries. These results lead to the main conclusion that autonomous adaptation cannot be
invoked as the solution to climate change, but needs to be addressed with proper mitigation and
planned adaptation strategies.
Furthermore, autonomous adaptation cannot reverse the adverse distributive implications of
climate change. In other words, the present estimation results confirm that (1) climate change
brings along significant welfare impacts, (2) biodiversity and ecosystem services play an
important role in the determination of the final welfare magnitudes, and (3) not all European
countries will have identical impacts, some countries will lose more than others, and some
countries will gain, depending on their geographical location, the existing markets and profile
with respect to biodiversity indicators and land use patterns. For these same reasons, it is
important to use these results in the design of any climate‐mitigation, or adaptation, policies.
Note, however, that one also needs to remember that the success of these negotiations will depend inter alia on key issues such as:
An Application to European Forest Ecosystems
60
a. Uncertainty. Despite the evidence of climate change impacts, high uncertainty is associated
with both distributional effects and the magnitude of these impacts. Therefore, a range of
value estimates is preferred to a point estimate of the possible damage costs of climate
change. The observed uneven distribution of climate change impacts represented a first
impediment when scaling up the regional impacts across different geographic regions.
b. Intra‐generation equity and vulnerability. Climate change is a global phenomenon, the impacts
however tend to be more regional or site‐specific in the area where the population is most
vulnerable to climate change and usually exposed to extreme poverty. However, the existing
micro‐economic valuation approaches are mostly designed in favor of the relatively rich
regions where willingness‐to‐pay for autonomous adaption measures such as ecosystem and
biodiversity protection for climate is affordable. Therefore, the main difficulties of
environmental economics were the scaling up of the damage costs across different
populations and the efficient distribution of the benefits of global collective climate policies.
c. Inter‐generation equity. The equal rights of future generations to enjoy a stable climate are
subject to the choice of discount rate in the literature of environmental economics. It has been
widely accepted that the current severe climate change is mainly caused by anthropogenic
activities over the past century, but the question of how much of our limited resources we
should invest to preserve the environment and stabilize the climate for future generations to
come is still open.
All these aspects constitute important areas of debate among leading economists (Stern, 2006;
Nordhaus, 2007, Weizman, 2007, and Tol, 2006) but in any case do not deny the significant, and
additional, welfare impacts derived from bringing ecosystem services into the assessment of
overall climate change impacts.
3.5 Conclusions
This paper explored the potential to incorporate micro‐ and macro‐ economic analysis in the
estimation of the socio‐economic impacts of climate change‐induced changes in biodiversity and
ecosystems. Biodiversity and ecosystem services were interpreted as important components of
the world economic system. In this study, we tried to incorporate ecosystem services into a macro
economic mechanism, where the world economy was assessed by a set of computable general
equilibrium (CGE) models. Within this framework, changes in carbon sequestration provided by
European forests were incorporated into a CGE model through a global warming approach, which
allowed the consideration of climate change impacts on forest carbon sequestration services and
Economic Assessment of Climate Change Impacts on Biodiversity, Ecosystem Services and Human Well-being
61
to re‐compute a temperature equivalent induced by the higher release of CO2 emissions in the
atmosphere resulting from climate change. On the basis of this new information, we then re‐
estimated all of the climate change impacts considered using the CGE model and recalculated new
macro‐regional GDP effects. The differences between climate change impacts on GDP considering
the original and the new carbon sequestration levels were used as an approximation of the
general equilibrium value of the changes in the European forest carbon sequestration service.
This innovative approach allowed us to explore the scaling‐up potential of regional climate change
impacts on biodiversity and ecosystem services and to identify the winners and losers of climate
change impacts at a larger geographic scale.
In summary, the present estimation GDP value estimates confirm that (1) climate change brought
along significant welfare impacts, (2) biodiversity and ecosystem services played an important
role in the determination of the final welfare magnitudes, and (3) not all European countries
would have identical impacts, some countries might lose more than others, and some countries
might gain, depending on their geographical location, the existing markets and profile with
respect to biodiversity indicators and land use patterns. Therefore understanding the magnitudes
of welfare impacts is important for results in the design of any climate‐mitigation, or adaptation,
policies.
However, it is important to note that our study only signals the tip of the iceberg, for the present
analysis only focused on biodiversity anchored in a single ecosystem type, i.e. forest ecosystem,
and considered only a single ecosystem service produced by forests, carbon sequestration. If
taking into account (1) the 34 European countries and (2) the sequestration services from forests
alone, climate‐change‐cause impacts on biodiversity and ecosystem services are responsible for
welfare loss amounting to 85 billion USD$. If we consider the World Bank’s global ranking with
respect to GDP per capita, this amount corresponds to the aggregated GDP of the 22 poorest
countries, which constitute 13% of the totality of world countries. Nonetheless, if we also add (3)
the biodiversity productivity effects on the agricultural sectors, (4) freshwater and coastal
ecosystems, the total loss in GDP terms will be much higher. These results lead to the main
conclusion that autonomous adaptation cannot be invoked as the solution to climate change, but
needs to be addressed with proper mitigation and planned adaptation strategies.
Moreover, we should also recognize the dynamic aspect of ecosystem changes in response to
direct and indirect socio‐economic drivers, Today, Europe, along with many other countries,
experiences the growing pressures from population growth, changing diets, urbanization, and
climate change, which are causing continuous ecosystem degradation and biodiversity decline. In
An Application to European Forest Ecosystems
62
return, the changes in biodiversity and ecosystem cannot directly affect only our economic
system, but also the capacity of natural ecosystems to mitigate and adapt to further climate
change. These are externalities have already been impacting the conventional economic systems.
Therefore, fully assessing the costs of these externalities, in particular the costs of losing
biodiversity are important for the design of effective policy instruments to correct the failed
market signals and to fully incorporate the costs of climate change into the economic mechanism.
This way will enable us to prevent from further resource degradation and fight against climate
change.
Finally, one should also note that the reorganization of the value of ecosystems and biodiversity is
no longer "exclusive" to the academic and research arena, but has already been highlighted in
current policy agendas. For example, at the recent meeting of environment ministers of the G8
countries and the five major newly industrializing countries in Potsdam in March 2007, the
German government proposed a study on "The economic significance of the global loss of
biodiversity" as part of the so‐called "Potsdam Initiative" for biodiversity, with an aim of
"initiating the process of analyzing the global economic benefit of biological diversity, the costs of
the loss of biodiversity and the failure to take protective measures versus the costs of effective
conservation". This proposal was endorsed by G8+5 leaders at the Heiligendamm Summit on 6‐8
June 2007 and has led to one of the most important international research collaboration on "The
Economics of Ecosystems & Biodiversity (TEEB)". On the other hand, as climate change will
continue, they will have significant impacts on many aspects of biological diversity: including
ecosystems, species, genetic diversity within species, and the ecological interactions, which in
turn will significantly influence the long‐term stability of the natural world as well as many
benefits and services that humans depend upon (IPCC, 2007). The considerable socio‐economic
and ecological impacts related to climate change induced ecosystem impact have led to an
increasing number of recent research attempting to advance our understanding of intercourse
between climate change and biodiversity. However, future efforts are need to translate ecological
impacts into economic values, which are the basis for any today’s decision making.
Economic Assessment of Climate Change Impacts on Biodiversity, Ecosystem Services and Human Well-being
63
CHAPTER 4 MODELING THE LINKS BETWEEN BIODIVERSITY, ECOSYSTEM SERVICES AND HUMAN WELL-BEING IN THE CONTEXT OF CLIMATE CHANGE: RESULTS OF AN ECONOMETRIC EXERCISE TO THE EUROPEAN FORESTS
Ding, H. and P.A.L.D. Nunes (under preparation) “Modeling the Links between Biodiversity, Ecosystem Services and Human Well‐being in the Context of Climate Change: Results of an Econometric Exercise to the European Forests”, under preparation for submission to Journal of Ecological Economics.
Abstract
The paper conducts an empirical investigation on the complex relationship between biodiversity and the values of ecosystem goods and services that are supported by biodiversity and ecosystem functioning, aiming to produce an econometric quantification of the magnitudes involved. Furthermore, we operate this study at a in the context of global climate change, which is considered one of the major drivers today that alter the pattern of biodiversity distribution, affect the ecosystem functioning and change the flows of ecosystem goods and services to be provided by a healthy ecosystem. In the paper, we first built a composite biodiversity indicator on the concept of Natural Capital Index so as to integrate information regarding the quantitative and qualitative changes of ecosystems driven by warming climate conditions. Furthermore, the composite indicator is integrated into the econometric specification so as to capture the marginal impacts of changes in biodiversity on the value of ecosystem goods and services due to climate change. The econometric problem is solved in a structural simultaneous system using three‐stage‐least‐squares (3SLS) to analyze climate change impacts on forest ecosystems and the respective ecosystem service values across 17 European countries.
Keywords: 3SLS, composite biodiversity indicator, European forest ecosystem services, climate
change impact
JEL: Q23, Q51, Q57
Note: An earlier version of this paper has been presented in the 2010 BIOECON conference in Venice and the Belpasso International summer school, held in BelpassoItaly, 2010. Comments haven incorporated into this revision, which has been submitted to the 2011 EAERE conference in Roma, Italy
An Application to European Forest Ecosystems
64
4.1 Introduction
Current model projections have consistently indicated that biodiversity would continue to decline
over the 21st century, under different socioeconomic scenarios with trajectories of key indirect
drivers of ecological changes, such as human population growth and greenhouse gas emissions
(GHG) (Pereira et al., 2010; Leadley, et al. 2010). This in turn will impose threats to the benefits of
future humanity and result in a change in our production and consumption patterns in the long
run (Martens et al., 2003), as biodiversity underpins a variety of ecosystem services that are vital
to human well‐being.
Biodiversity by definition encompasses the variety of life on earth from genes to species, through
to the broad scale of ecosystems across time and space. It is important in terms of determining the
health of ecosystem, ensuring the stability and productivity of ecosystem, as well as contributing
directly or indirectly to human wellbeing. In this regard, the term "biodiversity" is used largely as
an assumed foundation for ecosystem processes, rather than simply the changing number of
species on a species list. The relationship between biodiversity and ecosystem functioning or
primary productivity has been of long‐standing interest to ecologists (Kinzig et al., 2001; Loreau
et al., 2001, 2002; Cameron, 2002). Over the past years, the subject has been researched in various
ways: via experimental filed research, the formulation of mechanistic theories, and quantitative
field observation, most of which have led to a common conclusion that a large variety of species
has a positive influence on the productivity and stability of ecosystems, as greater biodiversity can
cope with various circumstances in a given habitat and thus lead to the more efficient use of
available natural resources (Martens et al, 2003; Loreau et al, 2001). Nonetheless, quantifying the
link between biodiversity and ecosystem services remains a major scientific challenge to date
(Pereira et al., 2010), because there does not exist a general ecological relationship between
ecosystem function and diversity owing to species‐specific effects and important tropic links
(Paine, 2002; Willims et al., 2002). Certainly, biodiversity loss will negatively affect ecosystem
functioning by changing the composition and distribution of species (Giller and O’Donovan, 2002;
Schmid et al., 2000; Bloger, 2001; Loreau et al., 2001), which may have far‐reaching
socioeconomic consequences in the future, through the provision of ecosystem services to human
society (Martens et al, 2003). Thus how to explicitly quantify the effect of biodiversity loss on
human welfare has become a great challenge to the economists today.
In fact, the economics literature has shown many attempts to both conceptualize and value
biodiversity, exploring the use of stated‐ and revealed‐ preference valuation methods, both of
which intend to estimate the marginal impact of biodiversity loss on utility (Kontoleon et al.,
Economic Assessment of Climate Change Impacts on Biodiversity, Ecosystem Services and Human Well-being
65
2007). These methods have been largely used to estimate the nonmarket values of biodiversity.
On the other hand, biodiversity also have considerable market value through the supply of
important inputs for economic production. Thus, the total value of biodiversity or ecosystems
should encompass an array of ecosystems goods and services (EGS), including provisioning,
cultural, regulating and supporting services, upon which human livelihoods depend (MEA, 2005;
Chiabai et al, forthcoming; Ding et al, 2010). However, numerical analysis of the links between
biodiversity and human well‐being remains crude in the literature due to the complex non‐linear
relationship between biodiversity and ecosystem functioning and services. In this regards, only
two studies have attracted our particular attention, both of which exploring the use of different
biodiversity indicators, i.e. species richness and threatened flora and fauna indexes in modeling
the effect of biodiversity loss in the value of ecosystem services or ecosystem productivity. The
first refers to a recent study conducted by Costanza et al. (2007), who numerically demonstrated a
positive relationship between species richness and net primary production (NPP) for the US.,
followed by Ojea et al. (2009), who employed the use of meta‐analysis that has greatly extended
their investigation from regional forest ecosystem valuation studies to a global scale. Nonetheless,
our knowledge about the role of biodiversity in ecosystem functioning is very limited, using an
individual biodiversity indicator might be able to explain partly (not sufficiently enough) the
impacts of biodiversity loss on the value of ecosystem services and thus human welfare, but
meanwhile it may also lose a lot of other important information as most of the biodiversity
indicators deal with only one biodiversity attribute or a specific policy target. Therefore, the
creditability of the estimates from the previous studies for aiding policymaking might be
questionable.
For this reason, the present paper aims at contributing to bringing this gap by constructing a
composite biodiversity indicator which integrates information about species changes (e.g. change
in the abundance or distribution of populations), and ecosystem changes (e.g. change in extent of
particular biomes) in a climate change context. Furthermore, we will run an econometric model to
test whether the constructed composite biodiversity indicator is sensitive to a set of factors
causing global changes, including the growth of population and economy, the land‐use changes,
and the rising earth’s temperature. In particular, we are interested in testing whether global
warming will have a substantial impact on the changes in biodiversity and ecosystem services,
which will consequently influence the ecosystem benefits that human can receive in the future
(interpreted as welfare changes to human beings), holding all other conditions constant. Data
availability with regards to both biological species and economic values of the ecosystem services
led our analysis focus on the forest ecosystems in Europe.
An Application to European Forest Ecosystems
66
The organization of the article is as follows. Section 2 discusses the key assumptions of four
different climate change scenarios and the respective impacts on the future patterns of
biodiversity in Europe. Data regarding projections of socio‐economic, ecologic and climatic
conditions under future scenarios are also presented. Section 3 focuses on constructing a new
composite biodiversity indicator for the study of climate change impact. Section 4 employs the use
of three stages least squares (3SLS) model for testing the new composite biodiversity indicator
and shows some preliminary results. Section 5 concludes.
4.2 The Future Pattern of Biodiversity in the Context of Climate Change 4.2.1 Climate scenarios for projecting the future trends of biodiversity Scenarios do not predict the future, but rather paint pictures of possible futures and explore the
various outcomes that might result if certain basic assumptions are changed. In order to explore
the possible future biodiversity patterns in Europe, the scenarios used are based on the recent
efforts of the IPCC (IPCC, 2000), which explore the global and regional dynamics that may result
from changes at a political, economic, demographic, technological and social level. The distinction
between classes of scenarios was broadly structured by defining them ex ante along two
dimensions. The first dimension relates to the extent both of economic convergence and of social
and cultural interactions across regions; the second has to do with the balance between economic
objectives and environmental and equality objectives. This process therefore led to the creation of
four scenarios families, namely A1, A2, B1 and B2 storylines, each of which contains a number of
specific scenarios (IPCC, 2000). Hereafter, we call them IPCC scenarios throughout the paper.
Table 1. below summarizes the political, economic, demographic, technological and social
assumptions made in each of the IPCC scenarios and analyzes their potential impacts on the future
patterns of global biodiversity.
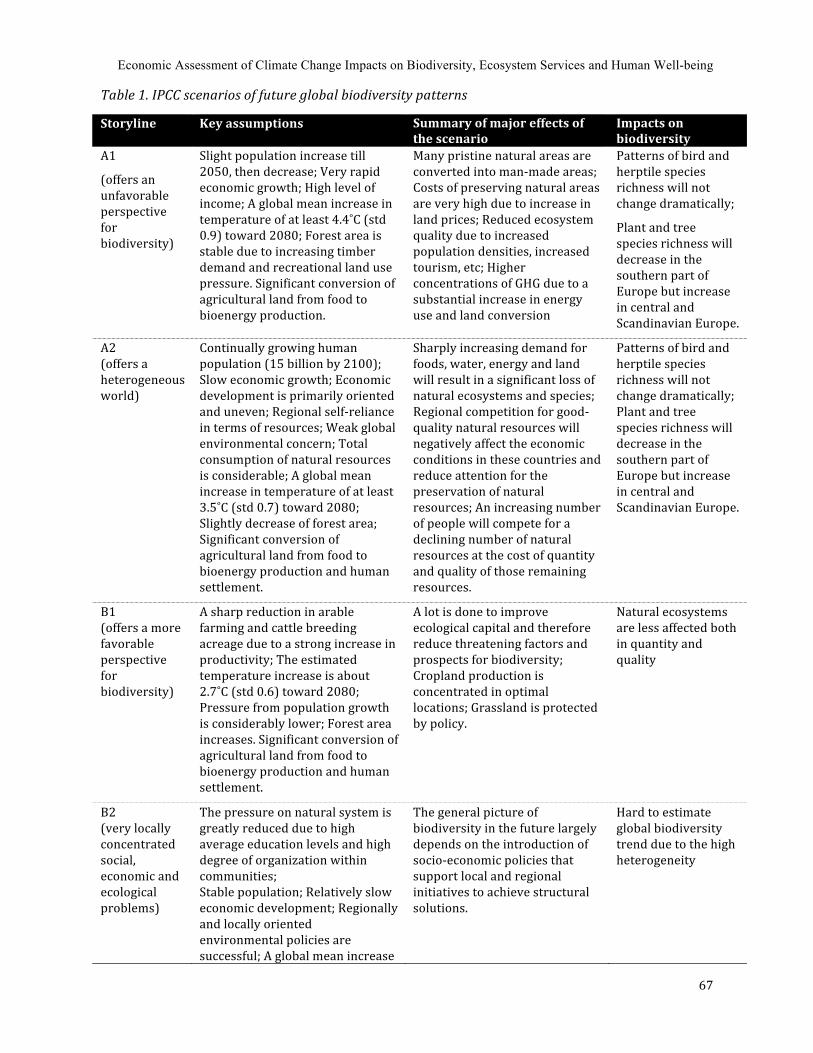
Economic Assessment of Climate Change Impacts on Biodiversity, Ecosystem Services and Human Well-being
67
Table 1. IPCC scenarios of future global biodiversity patterns
Storyline Key assumptions Summary of major effects of the scenario
Impacts on biodiversity
A1
(offers an unfavorable perspective for biodiversity)
Slight population increase till 2050, then decrease; Very rapid economic growth; High level of income; A global mean increase in temperature of at least 4.4˚C (std 0.9) toward 2080; Forest area is stable due to increasing timber demand and recreational land use pressure. Significant conversion of agricultural land from food to bioenergy production.
Many pristine natural areas are converted into man‐made areas; Costs of preserving natural areas are very high due to increase in land prices; Reduced ecosystem quality due to increased population densities, increased tourism, etc; Higher concentrations of GHG due to a substantial increase in energy use and land conversion
Patterns of bird and herptile species richness will not change dramatically;
Plant and tree species richness will decrease in the southern part of Europe but increase in central and Scandinavian Europe.
A2 (offers a heterogeneous world)
Continually growing human population (15 billion by 2100); Slow economic growth; Economic development is primarily oriented and uneven; Regional self‐reliance in terms of resources; Weak global environmental concern; Total consumption of natural resources is considerable; A global mean increase in temperature of at least 3.5˚C (std 0.7) toward 2080; Slightly decrease of forest area; Significant conversion of agricultural land from food to bioenergy production and human settlement.
Sharply increasing demand for foods, water, energy and land will result in a significant loss of natural ecosystems and species; Regional competition for good‐quality natural resources will negatively affect the economic conditions in these countries and reduce attention for the preservation of natural resources; An increasing number of people will compete for a declining number of natural resources at the cost of quantity and quality of those remaining resources.
Patterns of bird and herptile species richness will not change dramatically; Plant and tree species richness will decrease in the southern part of Europe but increase in central and Scandinavian Europe.
B1 (offers a more favorable perspective for biodiversity)
A sharp reduction in arable farming and cattle breeding acreage due to a strong increase in productivity; The estimated temperature increase is about 2.7˚C (std 0.6) toward 2080; Pressure from population growth is considerably lower; Forest area increases. Significant conversion of agricultural land from food to bioenergy production and human settlement.
A lot is done to improve ecological capital and therefore reduce threatening factors and prospects for biodiversity; Cropland production is concentrated in optimal locations; Grassland is protected by policy.
Natural ecosystems are less affected both in quantity and quality
B2 (very locally concentrated social, economic and ecological problems)
The pressure on natural system is greatly reduced due to high average education levels and high degree of organization within communities; Stable population; Relatively slow economic development; Regionally and locally oriented environmental policies are successful; A global mean increase
The general picture of biodiversity in the future largely depends on the introduction of socio‐economic policies that support local and regional initiatives to achieve structural solutions.
Hard to estimate global biodiversity trend due to the high heterogeneity
An Application to European Forest Ecosystems
68
in temperature of at least 2.0˚C (std 0.7) toward 2080; Land‐use changes from food to bioenergy production or forestry.
Source: adapted from Martens et al. (2003) and ATEAM model assumptions
Scenario A1 and A2 represent the degree of economic convergence and of social and cultural
interactions across regions, but are distinguished in terms of the scale of socio‐economic
interactions. Scenarios A1 focuses on a global perspective, in which biodiversity will receive extra
pressure from the expected high growth rates in global economy and world population. In this
scenario, many pristine natural areas will be converted to man‐made areas to meet the increasing
consumption demand. Thus land prices will be driven up as well as costs of preserving natural
habitats, which may directly affect biodiversity quantity. Moreover, increased energy use and land
conversion will contribute to higher concentrations of greenhouse gases (GHG) in the atmosphere
and reduce biodiversity quality. This scenario also considers different combinations of fuel,
referring to scenario A1F1 in the IPCC report. Scenario A2 represents a heterogeneous world
differentiated into a series of consolidated economic regions characterized by low economic,
social, and cultural interactions, uneven economic growth and large income gap between
industrialized and developing countries. Under this scenario, a continually growing population
will lead to a sharp increase in demand for foods, water, energy and land and result in significant
loss of natural ecosystems and species. Moreover, low technological improvement in production
will increase the pressure from pollution, which will affect the quality of biodiversity. Finally, the
fragmentation of local infrastructures also implies conflicts between scarce resources and
increasing number of people, as the latter will have to compete for a declining number of natural
resources at the costs of quality and quantity of whose remaining resources.
On the contrary, the B‐type scenarios depict a world, where economic objectives and
environmental and equity objectives are more balanced. From a global sustainability perspective,
Scenario B1 shows that environmental and social consciousness can be combined in a more
sustainable development manner, offering a more favorable perspective for biodiversity than the
A‐type scenarios. Moreover, technological development is expected to shift towards renewable
energy and higher productivity and consequently reduce the pressure on natural ecosystems from
decreased pollution and land conversion. Finally, biodiversity will also benefit from lower
pressure of global population growth and improved ecological capital. Similarly to scenario B1,
the B2 scenario is environmentally oriented with a focus on both environmental and social
sustainability, but locally oriented. In this scenario, average education level and degrees of
Economic Assessment of Climate Change Impacts on Biodiversity, Ecosystem Services and Human Well-being
69
organization within communities are high and energy and material efficiency can be achieved. All
these social and technological achievements can reduce the pressure on natural ecosystem.
However, it is difficult to predict a global trend of biodiversity due to the large regional difference,
including socio‐economic policies that support land and regional initiatives.
4.2.2 Data: projections under the IPCC Storylines
Under different IPCC storylines, projections have been developed to describe possible outcomes of
different political, economic, demographic, technological and social assumptions for the future
development. These include the projected trends of GDP, population, incremental temperature,
ecosystem productivity, distribution of species and so on, subject to the changes in a set of key
assumptions on which the IPCC storylines are based (see Table 1). In this study, we explore the
use of climatic, socio‐economic and ecological projections to investigate the pressure on
biodiversity and to quantify the consequent quality and quantity changes of terrestrial
biodiversity following four future development paths. As for the scale of the study, only 17
European countries are taken into account due to the limited data availability regarding number
of biological species projected under climate change scenarios. In addition, empirical evidence has
shown that the impacts of changing climate conditions are highly spatially heterogeneous, as
organisms, populations and ecological communities do not respond to approximated average of
global warming (Walther et al., 2002). To account for regional climate differences, we further
divide the 17 European countries into 3 geo‐climatic clusters, namely Mediterranean Europe
(Greece, Italy, Portugal, Spain), Central North Europe (Austria, Belgium, France, Germany, Ireland,
Luxembourg, Netherlands, Switzerland, United Kingdom), and Scandinavian Europe (Denmark,
Finland, Norway, Sweden), where similar climatic patterns and taxa might be identified.
The data used are independently published by a number of IPCC data distribution centers across
the world for 2050, downscaled at country level. The demographic and economic trends
represented by the future per capita GDP, population density are projected and distributed by the
Center for International Earth Science Information Network (CIESIN, 2002) at Columbia
University. The annual mean temperature was projected by the Tyndall Centre in the UK
(www.tyndall.ac.uk), which combined the use of Global Circulation Models/SRES (including
CGCM2, CSIRO2, HadCM3 and PCM) to estimate the possible increase of temperature in degrees
Celsius for each country under different IPCC scenarios. The biophysical changes of biodiversity
comprises the quantitative change measured in terms of changes in the area of forest habitat, and
the qualitative change indicated by changes in the number of terrestrial species (including plant,
tree, bird and herptile). The future trends of these changes under IPCC scenarios are projected in
An Application to European Forest Ecosystems
70
the frame of the Advanced Terrestrial Ecosystem Analysis and Modelling (ATEAM) project
(Schroeter, et al. 2004). In particular, species richness under current and future conditions are
projected taking into account total 383 bird species, 108 reptile and amphibian species, 1350
plant species and 125 tree species appeared in the EU. To keep the consistency across a large
range of data sources, we derive all data from projections that represent a combination with the
HadCM3 model.
Our knowledge about to what extent biodiversity can respond to climate change is limited and the
quantification of associated economic gains or losses to human welfare cannot be straightforward
but through valuing biophysical changes of ecosystem services under future climate conditions. In
this study, values of ecosystem goods and services provided by the European forests are taken
from Ding et al. 2010, who provided detailed projections of ecosystem values following four
future IPCC storylines vis‐à‐vis to the baseline year of 2000. The valuation exercises were
conducted separately for three types of ecosystem services defined in Millennium Ecosystem
Assessment, i.e. provisioning, regulating and cultural services (MEA, 2005). More specifically,
forest provisioning services contain the benefits derived from the production of timber and other
wood forest products, regulating services provides non‐monetary benefits from CO2
sequestration in the forest, and cultural services provides humans with direct incomes from the
related tourism industries and non‐monetary benefits from the enjoyment of existing forests. The
market or non‐market nature of different values of ecosystem services determined the use of
various valuation methods and also indicated different degrees of biodiversity dependence. To
capture the specific marginal effect of biodiversity on each ecosystem service, we keep the three
types of values separately rather than using a summed total ecosystem value. All values were first
projected to 2050 and then adjusted to 2005 US$24.
4.3 The Construction of Simple Composite Biodiversity Indicator The greatest challenge that scientists are facing today is to develop appropriate biodiversity
metrics so as to measure and monitor the different dimensions of biodiversity and to predict the
future trends of biodiversity and ecosystems. Moreover, these biodiversity measures should also
be able to compass essential biological information, incorporate socioeconomic impacts, as well as
guide policy interventions towards more effective biodiversity management. To this extent, the
existing biodiversity data will be useful for developing quantitative scenarios of the future
trajectories of biodiversity (Pereira et al., 2010). From a methodological perspective, there is a
24 For valuation details and results, readers are recommended to refer to Ding et al (2010).
Economic Assessment of Climate Change Impacts on Biodiversity, Ecosystem Services and Human Well-being
71
general need of creating a workable “calculus” of biodiversity that allows not just global
summation, but also estimation of the more localized marginal gains and losses from global
changes induced by socioeconomic development and land use changes in different places (Faith,
2005). These measures are therefore compatible with trade‐offs and synergies in regional
planning.
4.3.1 Why composite indicator?
Biodiversity indicators are developed for various purposes. By far, a long list of biodiversity
measures has been developed to reflect a range of attributes and issues of concern. At global level,
there are roughly 40 potential measures being developed for the Convention on Biological
Diversity (CBD) and about 26 indicators being considered in the Streaming Biodiversity Indicators
in Europe 2010 process (Mace and Baillie, 2007). Nevertheless, for the purpose of public and
business decisions and as an effective communication tool to broader audience, a single, simple or
composite biodiversity measure might be more influential, just like the use of Gross Domestic
Production (GDP) in economic analysis and the Dow Jones indicator in stock market (Mace and
Baillie, 2007; Balmford, et al. 2005). There are now a number of composite indicators have been
developed. For example, the Natural Capital Index (NCI) is constructed as a weighted sum of the
product of the extent of each ecosystem (relative to a baseline) with the condition of the
ecosystem, where the condition is measured as the population size of a group of indicator species
relative to a baseline (ten Brink, 2000). A similar indicator is the Biodiversity Intactness Index
(BII) recently developed by Scholes and Biggs (2005), which also takes into account different
ecosystems being weighted by their species richness and population size being estimated for each
land‐use class in each ecosystem. Apparently, the latter requires more detailed information of
species under each type of land‐use. Given the limited data availability, we therefore propose to
adopt the NCI approach to construct a similar composite indicator for analyzing climate change
impacts on the biodiversity and ecosystem services in Europe.
NCI framework considers biodiversity as a natural resource containing all species with their
abundance, distribution, and natural fluctuations. Human direct and indirect interference may
affect ecosystem size (through land conversion) and exert pressures on ecosystem quality (such
as over‐exploitation and fragmentations). As a result, both decreased ecosystem quantity and
quality will lead to the loss of biodiversity. In this context, the development of NCI framework
aims at providing a quantitative and meaningful picture of the state of and trends in biodiversity
to support policymakers in a similar way as GDP, employment and Price Index do in economics.
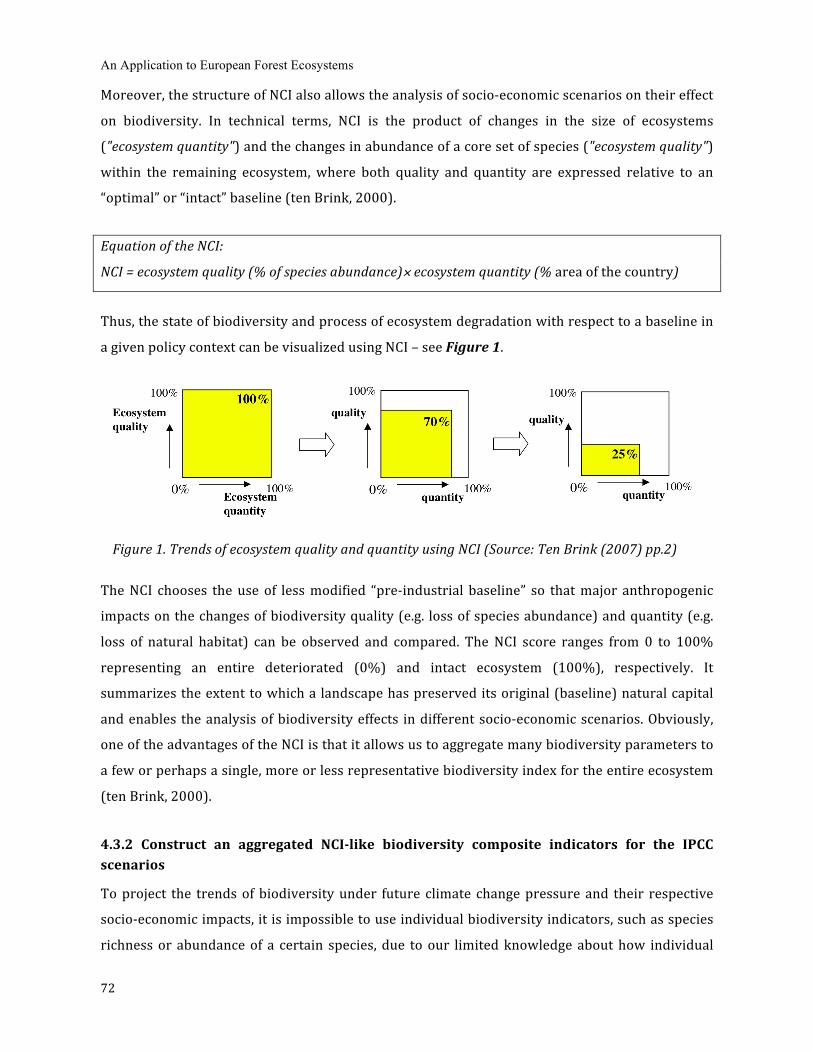
An Application to European Forest Ecosystems
72
Moreover, the structure of NCI also allows the analysis of socio‐economic scenarios on their effect
on biodiversity. In technical terms, NCI is the product of changes in the size of ecosystems
("ecosystem quantity") and the changes in abundance of a core set of species ("ecosystem quality")
within the remaining ecosystem, where both quality and quantity are expressed relative to an
“optimal” or “intact” baseline (ten Brink, 2000).
Equation of the NCI:
NCI = ecosystem quality (% of species abundance)× ecosystem quantity (% area of the country)
Thus, the state of biodiversity and process of ecosystem degradation with respect to a baseline in
a given policy context can be visualized using NCI – see Figure 1.
Figure 1. Trends of ecosystem quality and quantity using NCI (Source: Ten Brink (2007) pp.2)
The NCI chooses the use of less modified “pre‐industrial baseline” so that major anthropogenic
impacts on the changes of biodiversity quality (e.g. loss of species abundance) and quantity (e.g.
loss of natural habitat) can be observed and compared. The NCI score ranges from 0 to 100%
representing an entire deteriorated (0%) and intact ecosystem (100%), respectively. It
summarizes the extent to which a landscape has preserved its original (baseline) natural capital
and enables the analysis of biodiversity effects in different socio‐economic scenarios. Obviously,
one of the advantages of the NCI is that it allows us to aggregate many biodiversity parameters to
a few or perhaps a single, more or less representative biodiversity index for the entire ecosystem
(ten Brink, 2000).
4.3.2 Construct an aggregated NCIlike biodiversity composite indicators for the IPCC scenarios
To project the trends of biodiversity under future climate change pressure and their respective
socio‐economic impacts, it is impossible to use individual biodiversity indicators, such as species
richness or abundance of a certain species, due to our limited knowledge about how individual
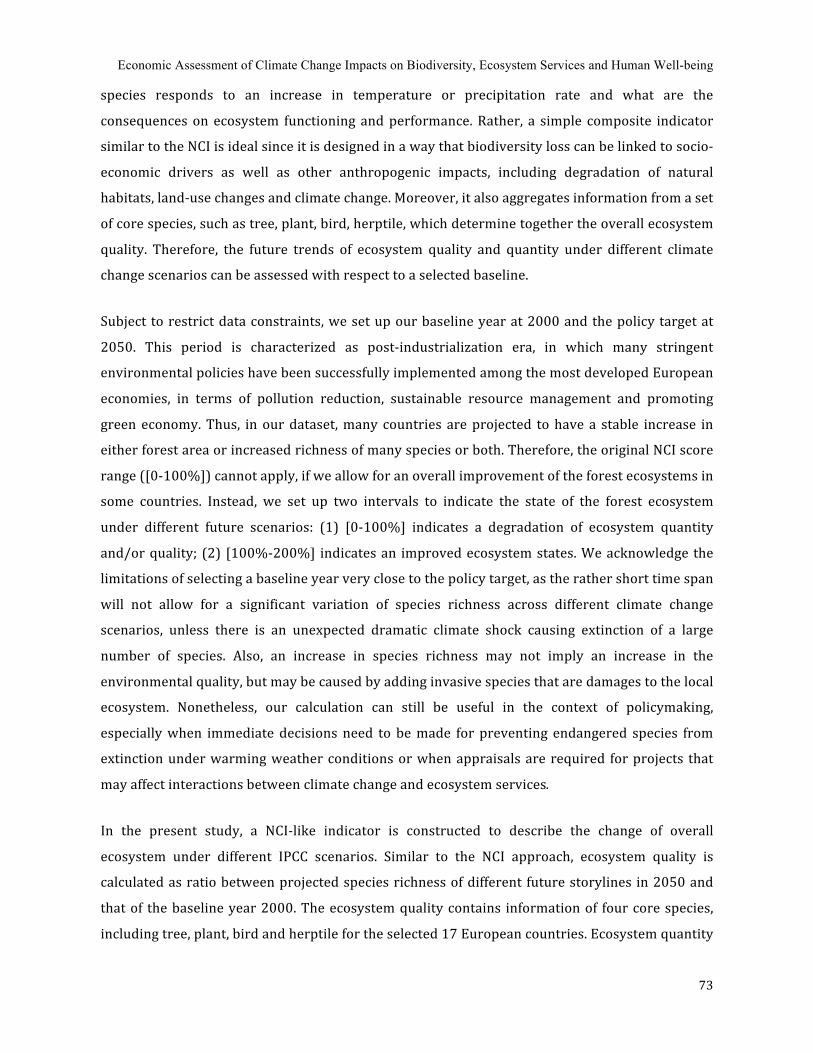
Economic Assessment of Climate Change Impacts on Biodiversity, Ecosystem Services and Human Well-being
73
species responds to an increase in temperature or precipitation rate and what are the
consequences on ecosystem functioning and performance. Rather, a simple composite indicator
similar to the NCI is ideal since it is designed in a way that biodiversity loss can be linked to socio‐
economic drivers as well as other anthropogenic impacts, including degradation of natural
habitats, land‐use changes and climate change. Moreover, it also aggregates information from a set
of core species, such as tree, plant, bird, herptile, which determine together the overall ecosystem
quality. Therefore, the future trends of ecosystem quality and quantity under different climate
change scenarios can be assessed with respect to a selected baseline.
Subject to restrict data constraints, we set up our baseline year at 2000 and the policy target at
2050. This period is characterized as post‐industrialization era, in which many stringent
environmental policies have been successfully implemented among the most developed European
economies, in terms of pollution reduction, sustainable resource management and promoting
green economy. Thus, in our dataset, many countries are projected to have a stable increase in
either forest area or increased richness of many species or both. Therefore, the original NCI score
range ([0‐100%]) cannot apply, if we allow for an overall improvement of the forest ecosystems in
some countries. Instead, we set up two intervals to indicate the state of the forest ecosystem
under different future scenarios: (1) [0‐100%] indicates a degradation of ecosystem quantity
and/or quality; (2) [100%‐200%] indicates an improved ecosystem states. We acknowledge the
limitations of selecting a baseline year very close to the policy target, as the rather short time span
will not allow for a significant variation of species richness across different climate change
scenarios, unless there is an unexpected dramatic climate shock causing extinction of a large
number of species. Also, an increase in species richness may not imply an increase in the
environmental quality, but may be caused by adding invasive species that are damages to the local
ecosystem. Nonetheless, our calculation can still be useful in the context of policymaking,
especially when immediate decisions need to be made for preventing endangered species from
extinction under warming weather conditions or when appraisals are required for projects that
may affect interactions between climate change and ecosystem services.
In the present study, a NCI‐like indicator is constructed to describe the change of overall
ecosystem under different IPCC scenarios. Similar to the NCI approach, ecosystem quality is
calculated as ratio between projected species richness of different future storylines in 2050 and
that of the baseline year 2000. The ecosystem quality contains information of four core species,
including tree, plant, bird and herptile for the selected 17 European countries. Ecosystem quantity
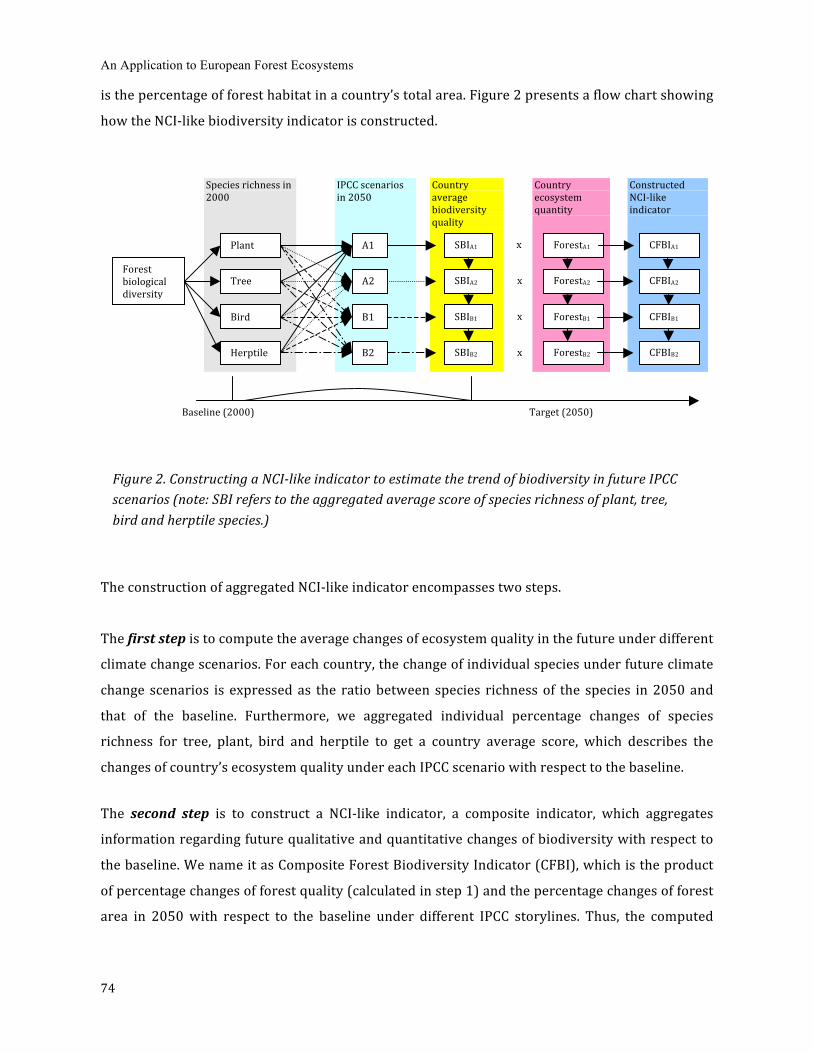
An Application to European Forest Ecosystems
74
is the percentage of forest habitat in a country’s total area. Figure 2 presents a flow chart showing
how the NCI‐like biodiversity indicator is constructed.
Figure 2. Constructing a NCIlike indicator to estimate the trend of biodiversity in future IPCC scenarios (note: SBI refers to the aggregated average score of species richness of plant, tree, bird and herptile species.)
The construction of aggregated NCI‐like indicator encompasses two steps.
The first step is to compute the average changes of ecosystem quality in the future under different
climate change scenarios. For each country, the change of individual species under future climate
change scenarios is expressed as the ratio between species richness of the species in 2050 and
that of the baseline. Furthermore, we aggregated individual percentage changes of species
richness for tree, plant, bird and herptile to get a country average score, which describes the
changes of country’s ecosystem quality under each IPCC scenario with respect to the baseline.
The second step is to construct a NCI‐like indicator, a composite indicator, which aggregates
information regarding future qualitative and quantitative changes of biodiversity with respect to
the baseline. We name it as Composite Forest Biodiversity Indicator (CFBI), which is the product
of percentage changes of forest quality (calculated in step 1) and the percentage changes of forest
area in 2050 with respect to the baseline under different IPCC storylines. Thus, the computed
Country average biodiversity quality
IPCC scenarios in 2050
Forest biological diversity
Species richness in 2000
Plant
Tree
Bird
Herptile
A1
A2
B1
B2
Baseline (2000)
Target (2050)
SBIA1
SBIA2
SBIB2
SBIB1
Country ecosystem quantity
ForestA1
ForestA2
ForestB2
ForestB1
x
x
x
x
Constructed NCI‐like indicator
CFBIA1
CFBIA2
CFBIB2
CFBIB1

Economic Assessment of Climate Change Impacts on Biodiversity, Ecosystem Services and Human Well-being
75
CFBI score also reflects the direct impacts of land‐use changes on biodiversity. In particular, the
expansion of forest area in many parts of Europe may have a positive impact on the CFBI score.
The calculated CFBI scores for the EU‐17 under four different IPCC scenarios are presented in Figure 3 below.
Figure 3. Computed CFBI score for the EU17 under four IPCC storylines.
As we have mentioned above, the CFBI score ranges between two intervals: [0‐100%] and [100%‐
200%]. If the CFBI falls between [0, 100%], it illustrates that a country’s forest ecosystem has
deteriorated under climate change scenarios because of the reduction of forest area as a result of
land use competition for economic development, and/or because of the decreased quality of
biodiversity in the country, or because of a combination of the both causes. If the CFBI score falls
between [100%‐200%], it shows on average an overall improved forest ecosystem. However, the
reason of such improvement is not straightforward. It may not be necessarily caused by the
increase in species richness of the selected four species in the next decades, but may be due to the
extended ecosystem coverage as a result of some effective environmental policy regimes of the
country, such as increased forest area due to reforestation activities. Moreover, it is also
important to note that a CFBI score greater than 100% does not necessarily mean the local species
are not under threats, rather it indicates an overall improvement of the ecosystems due to
compensation between different aspects of biodiversity. Thus, to better interpret the CFBI score,
we need to look closely at the national/regional forest management policies and their
effectiveness.
An Application to European Forest Ecosystems
76
In Figure 3, the CFBI score shows that if moving towards the economic oriented development
paths, as represented by the A1 and A2 scenarios, we will most likely observe a worsen status of
forest ecosystem across Europe owing to increased pressures from economic development,
population growth, severer increase of average temperature and land‐use conversion. Among all
others, the warmer region, i.e. Mediterranean Europe suffers the most loss of biodiversity
quantity and quality in both scenarios compared to the colder regions. On the contrary, the
environmental oriented development paths, as represented by B1 and B2 scenarios, show a
significant improvement in the forest status in most of the European countries, except Greece,
Portugal, Spain, Finland, Norway and Sweden. This implies that the adoption of sustainable forest
management practices in Europe is successful in general. However, given the relatively high
reference level of forest management in the Scandinavian countries in the baseline year, we will
not foresee significant improvement in forest quantity and quality over the next 40 years,
independent from the future standpoints. Whereas in the Mediterranean countries, although the
resources management in practice are considered less efficient than those of Northern European
countries, we can still observe a general improvement of the forest status owing to the sustainable
management of natural resources, slowing down population growth, improving sectoral
productivities and energy efficiency, and reducing land conversion.
4.4 The Econometric Model 4.4.1 The hypotheses and model specification It is assumed that climate change disturbance through biodiversity and ecosystem functioning
will impose an impact, most probably a negative one, on human welfare, the objective of our
model is therefore to explicitly assess this complex interaction and then estimate the marginal
effects of climate change induced biodiversity loss on the value of ecosystem services. This
assumption implies a number of hypotheses that we would like to test using the econometric
model:
(1) Climate change, here expressed as increase in temperature, will alter the pattern of biodiversity
distribution and species richness presented in a geographical region, which is measured by the
composite forest biodiversity indicator (CFBI). In particular, we want to test whether increases in
temperature will have effects over the biodiversity indicators that are ecosystem service specific and
spatially different.
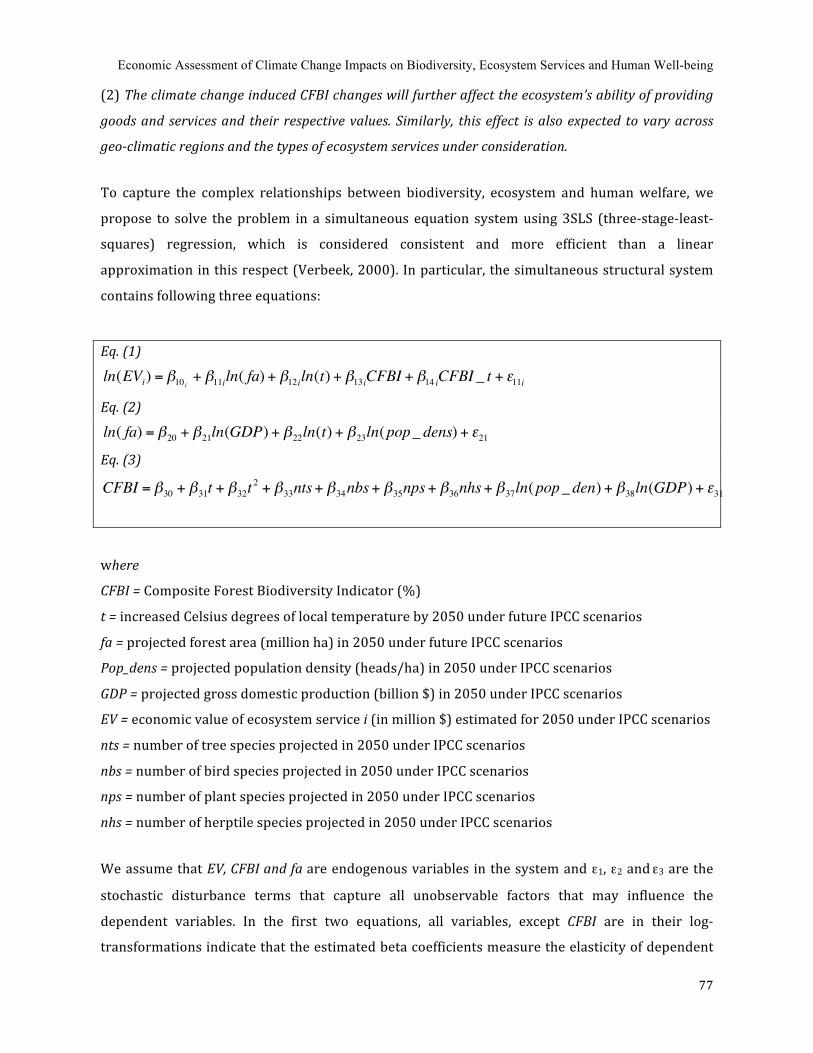
Economic Assessment of Climate Change Impacts on Biodiversity, Ecosystem Services and Human Well-being
77
(2) The climate change induced CFBI changes will further affect the ecosystem’s ability of providing
goods and services and their respective values. Similarly, this effect is also expected to vary across
geoclimatic regions and the types of ecosystem services under consideration.
To capture the complex relationships between biodiversity, ecosystem and human welfare, we
propose to solve the problem in a simultaneous equation system using 3SLS (three‐stage‐least‐
squares) regression, which is considered consistent and more efficient than a linear
approximation in this respect (Verbeek, 2000). In particular, the simultaneous structural system
contains following three equations:
Eq. (1)
€
ln(EVi) = β10 i + β11iln( fa) + β12iln(t) + β13iCFBI + β14 iCFBI _ t + ε11i
Eq. (2)
€
ln( fa) = β20 + β21ln(GDP) + β22ln(t) + β23ln(pop_ dens) + ε21
Eq. (3)
€
CFBI = β30 + β31t + β32t2 + β33nts+ β34nbs+ β35nps+ β36nhs+ β37ln(pop_ den) + β38ln(GDP) + ε31
where
CFBI = Composite Forest Biodiversity Indicator (%)
t = increased Celsius degrees of local temperature by 2050 under future IPCC scenarios
fa = projected forest area (million ha) in 2050 under future IPCC scenarios
Pop_dens = projected population density (heads/ha) in 2050 under IPCC scenarios
GDP = projected gross domestic production (billion $) in 2050 under IPCC scenarios
EV = economic value of ecosystem service i (in million $) estimated for 2050 under IPCC scenarios
nts = number of tree species projected in 2050 under IPCC scenarios
nbs = number of bird species projected in 2050 under IPCC scenarios
nps = number of plant species projected in 2050 under IPCC scenarios
nhs = number of herptile species projected in 2050 under IPCC scenarios
We assume that EV, CFBI and fa are endogenous variables in the system and ε1, ε2 and ε3 are the
stochastic disturbance terms that capture all unobservable factors that may influence the
dependent variables. In the first two equations, all variables, except CFBI are in their log‐
transformations indicate that the estimated beta coefficients measure the elasticity of dependent
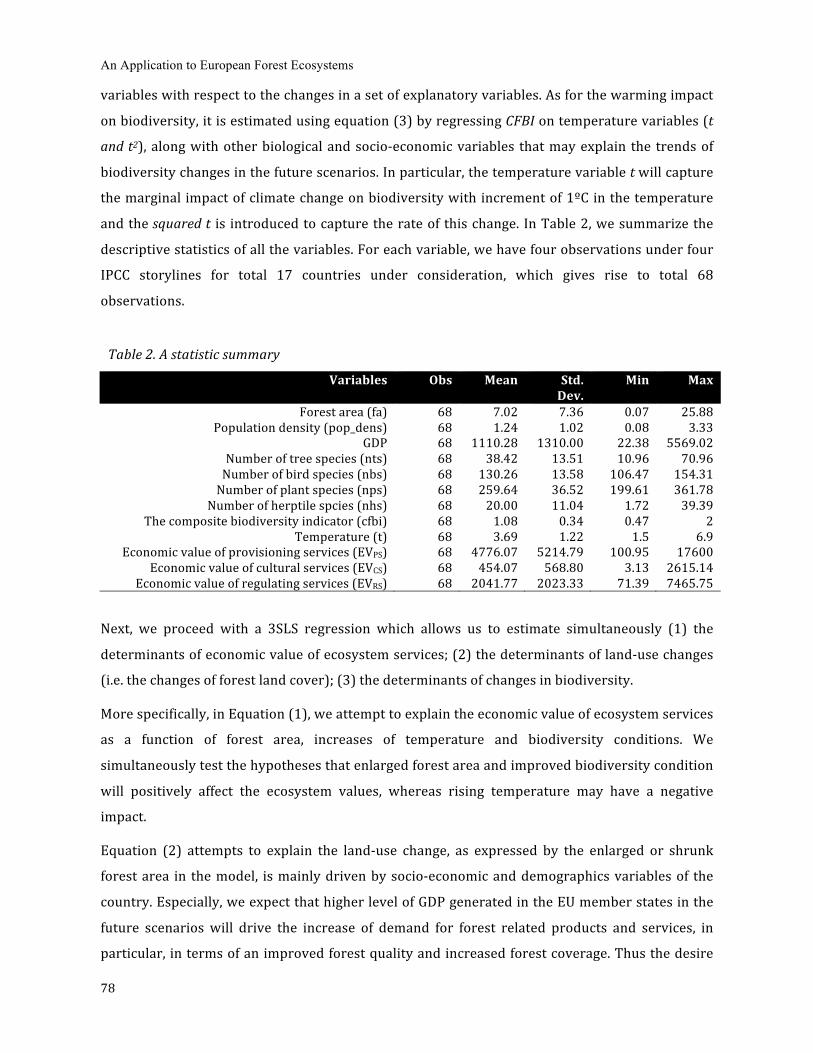
An Application to European Forest Ecosystems
78
variables with respect to the changes in a set of explanatory variables. As for the warming impact
on biodiversity, it is estimated using equation (3) by regressing CFBI on temperature variables (t
and t2), along with other biological and socio‐economic variables that may explain the trends of
biodiversity changes in the future scenarios. In particular, the temperature variable t will capture
the marginal impact of climate change on biodiversity with increment of 1ºC in the temperature
and the squared t is introduced to capture the rate of this change. In Table 2, we summarize the
descriptive statistics of all the variables. For each variable, we have four observations under four
IPCC storylines for total 17 countries under consideration, which gives rise to total 68
observations.
Table 2. A statistic summary
Variables Obs Mean Std. Dev.
Min Max
Forest area (fa) 68 7.02 7.36 0.07 25.88 Population density (pop_dens) 68 1.24 1.02 0.08 3.33
GDP 68 1110.28 1310.00 22.38 5569.02 Number of tree species (nts) 68 38.42 13.51 10.96 70.96 Number of bird species (nbs) 68 130.26 13.58 106.47 154.31 Number of plant species (nps) 68 259.64 36.52 199.61 361.78
Number of herptile spcies (nhs) 68 20.00 11.04 1.72 39.39 The composite biodiversity indicator (cfbi) 68 1.08 0.34 0.47 2
Temperature (t) 68 3.69 1.22 1.5 6.9 Economic value of provisioning services (EVPS) 68 4776.07 5214.79 100.95 17600
Economic value of cultural services (EVCS) 68 454.07 568.80 3.13 2615.14 Economic value of regulating services (EVRS) 68 2041.77 2023.33 71.39 7465.75
Next, we proceed with a 3SLS regression which allows us to estimate simultaneously (1) the
determinants of economic value of ecosystem services; (2) the determinants of land‐use changes
(i.e. the changes of forest land cover); (3) the determinants of changes in biodiversity.
More specifically, in Equation (1), we attempt to explain the economic value of ecosystem services
as a function of forest area, increases of temperature and biodiversity conditions. We
simultaneously test the hypotheses that enlarged forest area and improved biodiversity condition
will positively affect the ecosystem values, whereas rising temperature may have a negative
impact.
Equation (2) attempts to explain the land‐use change, as expressed by the enlarged or shrunk
forest area in the model, is mainly driven by socio‐economic and demographics variables of the
country. Especially, we expect that higher level of GDP generated in the EU member states in the
future scenarios will drive the increase of demand for forest related products and services, in
particular, in terms of an improved forest quality and increased forest coverage. Thus the desire
Economic Assessment of Climate Change Impacts on Biodiversity, Ecosystem Services and Human Well-being
79
for a better natural environment will trigger the reinforcement of sustainable management
policies to conserve natural habitats and forest biodiversity. On the contrary, the mounting
populations projected in future scenarios will increase the pressure on the natural area by
converting natural forests to agricultural land or human settlement. In the meanwhile, we also
assume that temperature may have a role in affecting the forest natural regeneration process, but
direction of its impact on forest area is ambiguous.
Finally, Equation (3) attempts to test statistically whether the RHS variables, such as rising
temperature, changes of species richness in a set of key species, and changes of socio‐economic
and demographic conditions under different climate change scenarios can influence the
dependent variable CFBI, which measures the general improvement or degradation of
biodiversity quality and quantity corresponding to each of the projected future states. Especially,
we are interested in whether warmer conditions will negatively affect forest biodiversity across
regions, as well as the ecosystem’s ability of providing ecosystem goods and services and their
respective values. Moreover, high population density and continual economic growth are
expected to impose high pressure on biodiversity through intensive conversion of land from
natural forests to other land‐uses and therefore negatively affect biodiversity quality and
quantity.
4.4.2 3SLS results
Given the baseline model specification above, we first run 3SLS regression in a global condition, in
which all data are pooled together without considering the different spatial effects of climate
change. Later, we will modify the baseline model in order to capture the specific impact of climate
change on each of the three geo‐climatic regions, i.e. Mediterranean Europe, Central Europe and
Scandinavian Europe. However, due to the nature of ecosystem values varies depending on the
types of ecosystem services under consideration, we shall treat the three types of values
differently.
(1) Estimating the global effects using the baseline model
Table 3 below reports the 3SLS results of the baseline model. The goodness of the linear
approximation in the structural simultaneous system was assessed based on the coefficients of
determination (R2). For almost all equations, the estimated R2 (>0.5) with P>0.0000 suggest the
goodness of fit of the performed regression. Independent from the type of ecosystem service, most
of all estimated beta coefficients carry the expected sign.
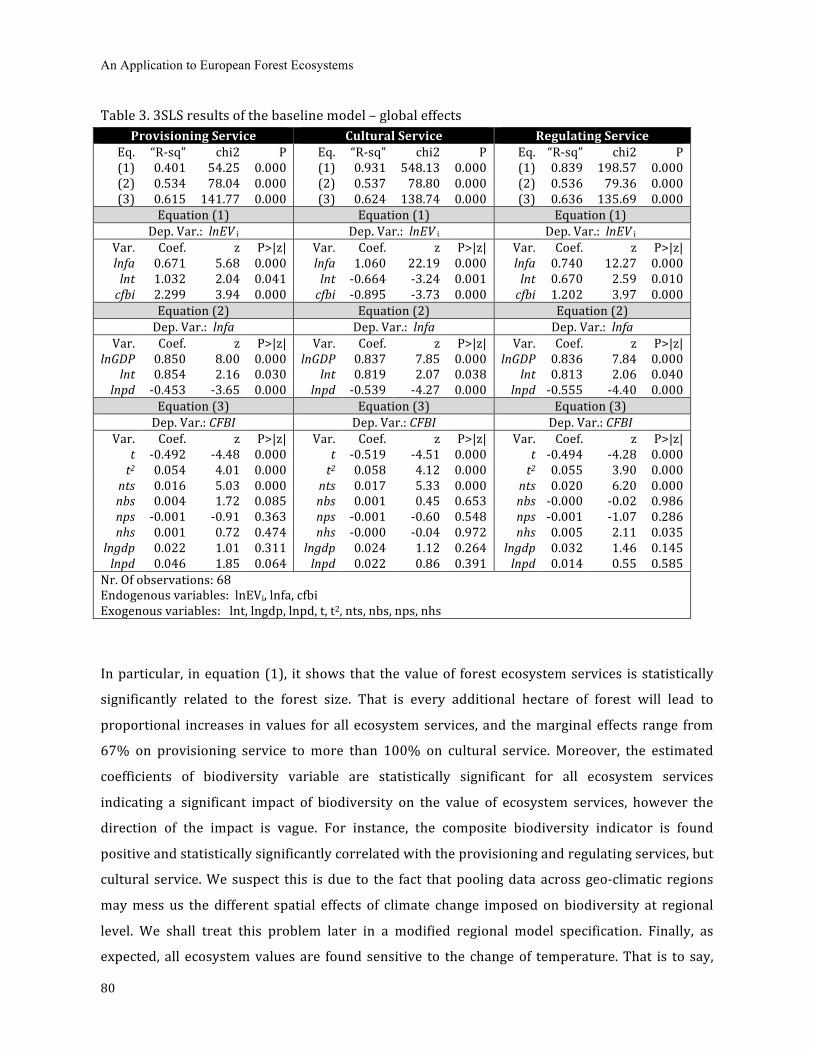
An Application to European Forest Ecosystems
80
Table 3. 3SLS results of the baseline model – global effects
Provisioning Service Cultural Service Regulating Service Eq. “R‐sq” chi2 P Eq. “R‐sq” chi2 P Eq. “R‐sq” chi2 P (1) 0.401 54.25 0.000 (1) 0.931 548.13 0.000 (1) 0.839 198.57 0.000 (2) 0.534 78.04 0.000 (2) 0.537 78.80 0.000 (2) 0.536 79.36 0.000 (3) 0.615 141.77 0.000 (3) 0.624 138.74 0.000 (3) 0.636 135.69 0.000
Equation (1) Equation (1) Equation (1) Dep. Var.: lnEV i Dep. Var.: lnEV i Dep. Var.: lnEV i
Var. Coef. z P>|z| Var. Coef. z P>|z| Var. Coef. z P>|z| lnfa 0.671 5.68 0.000 lnfa 1.060 22.19 0.000 lnfa 0.740 12.27 0.000 lnt 1.032 2.04 0.041 lnt ‐0.664 ‐3.24 0.001 lnt 0.670 2.59 0.010 cfbi 2.299 3.94 0.000 cfbi ‐0.895 ‐3.73 0.000 cfbi 1.202 3.97 0.000
Equation (2) Equation (2) Equation (2) Dep. Var.: lnfa Dep. Var.: lnfa Dep. Var.: lnfa
Var. Coef. z P>|z| Var. Coef. z P>|z| Var. Coef. z P>|z| lnGDP 0.850 8.00 0.000 lnGDP 0.837 7.85 0.000 lnGDP 0.836 7.84 0.000
lnt 0.854 2.16 0.030 lnt 0.819 2.07 0.038 lnt 0.813 2.06 0.040 lnpd ‐0.453 ‐3.65 0.000 lnpd ‐0.539 ‐4.27 0.000 lnpd ‐0.555 ‐4.40 0.000
Equation (3) Equation (3) Equation (3) Dep. Var.: CFBI Dep. Var.: CFBI Dep. Var.: CFBI
Var. Coef. z P>|z| Var. Coef. z P>|z| Var. Coef. z P>|z| t ‐0.492 ‐4.48 0.000 t ‐0.519 ‐4.51 0.000 t ‐0.494 ‐4.28 0.000 t2 0.054 4.01 0.000 t2 0.058 4.12 0.000 t2 0.055 3.90 0.000 nts 0.016 5.03 0.000 nts 0.017 5.33 0.000 nts 0.020 6.20 0.000 nbs 0.004 1.72 0.085 nbs 0.001 0.45 0.653 nbs ‐0.000 ‐0.02 0.986 nps ‐0.001 ‐0.91 0.363 nps ‐0.001 ‐0.60 0.548 nps ‐0.001 ‐1.07 0.286 nhs 0.001 0.72 0.474 nhs ‐0.000 ‐0.04 0.972 nhs 0.005 2.11 0.035
lngdp 0.022 1.01 0.311 lngdp 0.024 1.12 0.264 lngdp 0.032 1.46 0.145 lnpd 0.046 1.85 0.064 lnpd 0.022 0.86 0.391 lnpd 0.014 0.55 0.585
Nr. Of observations: 68 Endogenous variables: lnEVi, lnfa, cfbi Exogenous variables: lnt, lngdp, lnpd, t, t2, nts, nbs, nps, nhs
In particular, in equation (1), it shows that the value of forest ecosystem services is statistically
significantly related to the forest size. That is every additional hectare of forest will lead to
proportional increases in values for all ecosystem services, and the marginal effects range from
67% on provisioning service to more than 100% on cultural service. Moreover, the estimated
coefficients of biodiversity variable are statistically significant for all ecosystem services
indicating a significant impact of biodiversity on the value of ecosystem services, however the
direction of the impact is vague. For instance, the composite biodiversity indicator is found
positive and statistically significantly correlated with the provisioning and regulating services, but
cultural service. We suspect this is due to the fact that pooling data across geo‐climatic regions
may mess us the different spatial effects of climate change imposed on biodiversity at regional
level. We shall treat this problem later in a modified regional model specification. Finally, as
expected, all ecosystem values are found sensitive to the change of temperature. That is to say,
Economic Assessment of Climate Change Impacts on Biodiversity, Ecosystem Services and Human Well-being
81
every 1ºC increase in temperature will contribute proportionally to the changes of the value of
ecosystem services. In particular, the impact of rising temperature is positive on the value of
provisioning and regulating services may be corresponding to the scientific discovery that the
changing climate can increase forest productivity and also carbon stock in the boreal forest
ecosystem in Scandinavian Europe at least in the short run (Garcia‐Gonzalo et al., 2007).
Nevertheless, the warming condition will negatively decrease the cultural value provided by
European forests as a whole due to the diminishing cultural value generated in Mediterranean
forests, where higher recreational values are usually found, as these forests will suffer from
warming temperature and lower precipitation rate.
Furthermore, Equation (2) shows that all selected explanatory variables are statistically
significantly related to land‐use changes. The estimated coefficients of each variable are found
similar across all ecosystem services, suggesting the robustness of our results. Our results suggest
that increases in GDP and rising temperature contribute proportionally to the extension of forest
areas. As argued previously, our desire for a better natural environment is increased along with
our growing wealth, whereas the positive impact of climate change on forest area may imply the
effectiveness of sustainable forest management practices that promote deforestation activities
and encourage the enlarged plantations in most of the EU‐17 countries. Finally, the negative
coefficients of population density under all ecosystem services indicate the mounting population
in the future state will impose greater pressure on forest land and may lead to the conversion of
protected forest area to other land uses such as human settlement.
Finally, in Equation (3), we detect clearly a negative impact of rising temperature on the
composite biodiversity indicator at increasing rate. In other words, our finding suggests that
forest biodiversity is already suffering from the warm temperature in Europe and the continual
changes in temperature will worsen the situation. Moreover, the beta coefficients of temperature
variables are found consistent across ecosystem services, suggesting the robustness of our results.
In addition, the increase of every additional tree species, among other things, contributes
proportionally to 1% increase in the score of the composite biodiversity indicator. In contrast, the
richness of other species is not statistically correlated with forest biodiversity indicator, so as the
two socio‐economic variables (GDP and population density).
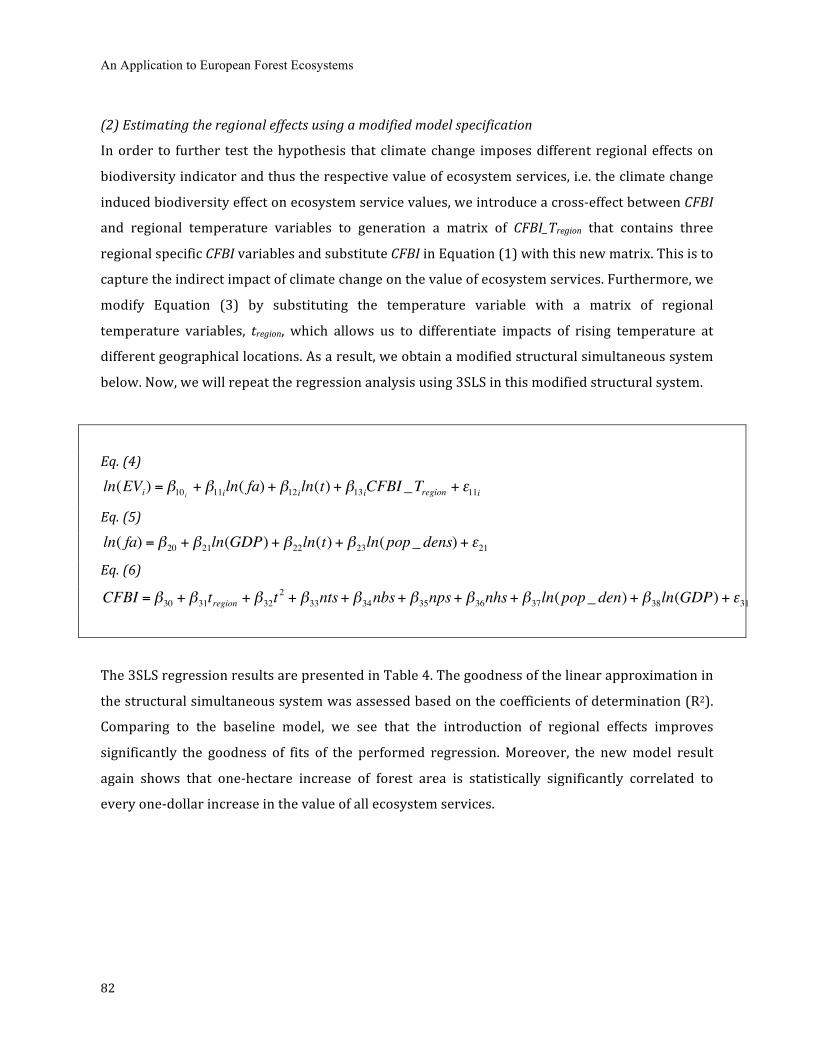
An Application to European Forest Ecosystems
82
(2) Estimating the regional effects using a modified model specification
In order to further test the hypothesis that climate change imposes different regional effects on
biodiversity indicator and thus the respective value of ecosystem services, i.e. the climate change
induced biodiversity effect on ecosystem service values, we introduce a cross‐effect between CFBI
and regional temperature variables to generation a matrix of CFBI_Tregion that contains three
regional specific CFBI variables and substitute CFBI in Equation (1) with this new matrix. This is to
capture the indirect impact of climate change on the value of ecosystem services. Furthermore, we
modify Equation (3) by substituting the temperature variable with a matrix of regional
temperature variables, tregion, which allows us to differentiate impacts of rising temperature at
different geographical locations. As a result, we obtain a modified structural simultaneous system
below. Now, we will repeat the regression analysis using 3SLS in this modified structural system.
Eq. (4)
€
ln(EVi) = β10 i + β11iln( fa) + β12iln(t) + β13iCFBI _Tregion + ε11i
Eq. (5)
€
ln( fa) = β20 + β21ln(GDP) + β22ln(t) + β23ln(pop_ dens) + ε21
Eq. (6)
€
CFBI = β30 + β31tregion + β32t2 + β33nts+ β34nbs+ β35nps+ β36nhs+ β37ln(pop_ den) + β38ln(GDP) + ε31
The 3SLS regression results are presented in Table 4. The goodness of the linear approximation in
the structural simultaneous system was assessed based on the coefficients of determination (R2).
Comparing to the baseline model, we see that the introduction of regional effects improves
significantly the goodness of fits of the performed regression. Moreover, the new model result
again shows that one‐hectare increase of forest area is statistically significantly correlated to
every one‐dollar increase in the value of all ecosystem services.
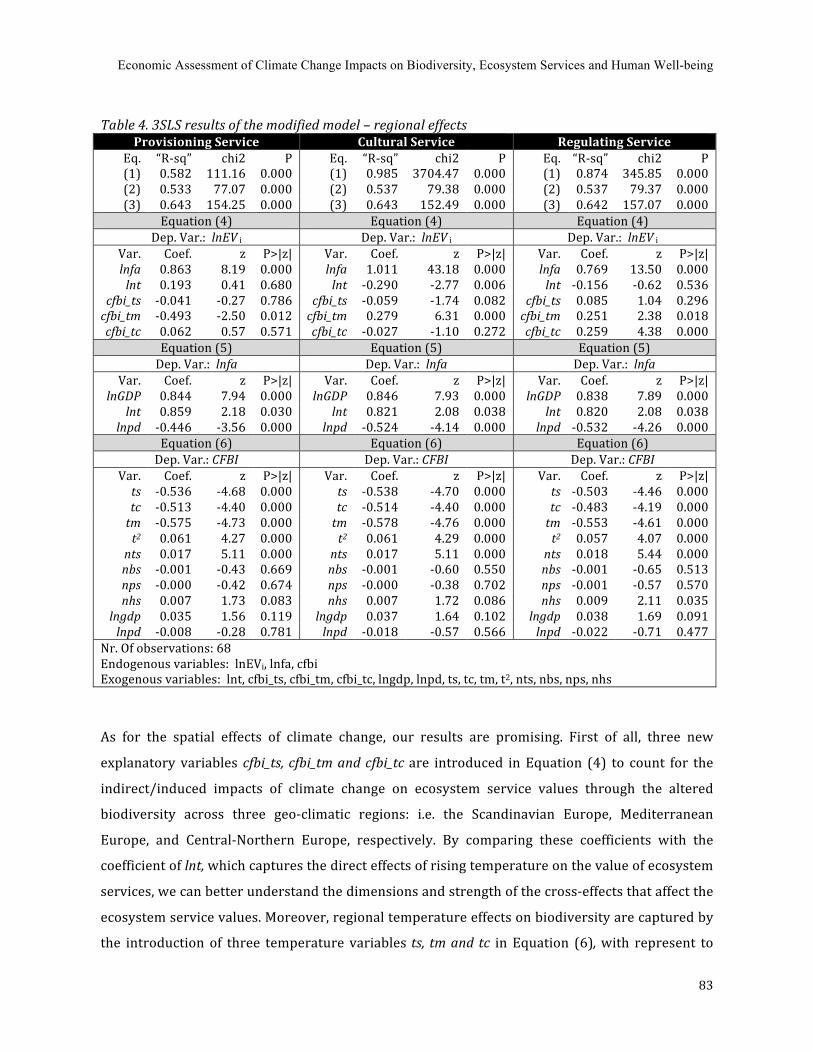
Economic Assessment of Climate Change Impacts on Biodiversity, Ecosystem Services and Human Well-being
83
Table 4. 3SLS results of the modified model – regional effects
Provisioning Service Cultural Service Regulating Service Eq. “R‐sq” chi2 P Eq. “R‐sq” chi2 P Eq. “R‐sq” chi2 P (1) 0.582 111.16 0.000 (1) 0.985 3704.47 0.000 (1) 0.874 345.85 0.000 (2) 0.533 77.07 0.000 (2) 0.537 79.38 0.000 (2) 0.537 79.37 0.000 (3) 0.643 154.25 0.000 (3) 0.643 152.49 0.000 (3) 0.642 157.07 0.000
Equation (4) Equation (4) Equation (4) Dep. Var.: lnEV i Dep. Var.: lnEV i Dep. Var.: lnEV i
Var. Coef. z P>|z| Var. Coef. z P>|z| Var. Coef. z P>|z| lnfa 0.863 8.19 0.000 lnfa 1.011 43.18 0.000 lnfa 0.769 13.50 0.000 lnt 0.193 0.41 0.680 lnt ‐0.290 ‐2.77 0.006 lnt ‐0.156 ‐0.62 0.536
cfbi_ts ‐0.041 ‐0.27 0.786 cfbi_ts ‐0.059 ‐1.74 0.082 cfbi_ts 0.085 1.04 0.296 cfbi_tm ‐0.493 ‐2.50 0.012 cfbi_tm 0.279 6.31 0.000 cfbi_tm 0.251 2.38 0.018 cfbi_tc 0.062 0.57 0.571 cfbi_tc ‐0.027 ‐1.10 0.272 cfbi_tc 0.259 4.38 0.000
Equation (5) Equation (5) Equation (5) Dep. Var.: lnfa Dep. Var.: lnfa Dep. Var.: lnfa
Var. Coef. z P>|z| Var. Coef. z P>|z| Var. Coef. z P>|z| lnGDP 0.844 7.94 0.000 lnGDP 0.846 7.93 0.000 lnGDP 0.838 7.89 0.000
lnt 0.859 2.18 0.030 lnt 0.821 2.08 0.038 lnt 0.820 2.08 0.038 lnpd ‐0.446 ‐3.56 0.000 lnpd ‐0.524 ‐4.14 0.000 lnpd ‐0.532 ‐4.26 0.000
Equation (6) Equation (6) Equation (6) Dep. Var.: CFBI Dep. Var.: CFBI Dep. Var.: CFBI
Var. Coef. z P>|z| Var. Coef. z P>|z| Var. Coef. z P>|z| ts ‐0.536 ‐4.68 0.000 ts ‐0.538 ‐4.70 0.000 ts ‐0.503 ‐4.46 0.000 tc ‐0.513 ‐4.40 0.000 tc ‐0.514 ‐4.40 0.000 tc ‐0.483 ‐4.19 0.000 tm ‐0.575 ‐4.73 0.000 tm ‐0.578 ‐4.76 0.000 tm ‐0.553 ‐4.61 0.000 t2 0.061 4.27 0.000 t2 0.061 4.29 0.000 t2 0.057 4.07 0.000 nts 0.017 5.11 0.000 nts 0.017 5.11 0.000 nts 0.018 5.44 0.000 nbs ‐0.001 ‐0.43 0.669 nbs ‐0.001 ‐0.60 0.550 nbs ‐0.001 ‐0.65 0.513 nps ‐0.000 ‐0.42 0.674 nps ‐0.000 ‐0.38 0.702 nps ‐0.001 ‐0.57 0.570 nhs 0.007 1.73 0.083 nhs 0.007 1.72 0.086 nhs 0.009 2.11 0.035
lngdp 0.035 1.56 0.119 lngdp 0.037 1.64 0.102 lngdp 0.038 1.69 0.091 lnpd ‐0.008 ‐0.28 0.781 lnpd ‐0.018 ‐0.57 0.566 lnpd ‐0.022 ‐0.71 0.477
Nr. Of observations: 68 Endogenous variables: lnEVi, lnfa, cfbi Exogenous variables: lnt, cfbi_ts, cfbi_tm, cfbi_tc, lngdp, lnpd, ts, tc, tm, t2, nts, nbs, nps, nhs
As for the spatial effects of climate change, our results are promising. First of all, three new
explanatory variables cfbi_ts, cfbi_tm and cfbi_tc are introduced in Equation (4) to count for the
indirect/induced impacts of climate change on ecosystem service values through the altered
biodiversity across three geo‐climatic regions: i.e. the Scandinavian Europe, Mediterranean
Europe, and Central‐Northern Europe, respectively. By comparing these coefficients with the
coefficient of lnt, which captures the direct effects of rising temperature on the value of ecosystem
services, we can better understand the dimensions and strength of the cross‐effects that affect the
ecosystem service values. Moreover, regional temperature effects on biodiversity are captured by
the introduction of three temperature variables ts, tm and tc in Equation (6), with represent to
An Application to European Forest Ecosystems
84
temperature changes in the Scandinavian Europe, Mediterranean Europe, and Central‐Northern
Europe, respectively. These results are particularly useful for interpreting the cross‐effects of
biodiversity and temperature in Equation (4) and understanding the climate change induced
biodiversity effect on the overall value of ecosystem services. In general, our results show that
changing climate will accelerate biodiversity loss across all three geo‐climatic regions (see the
results of equation (6)), and these changes may impose even further impacts on the values of all
ecosystem services provided by different forest ecosystems (see the results of equation (4)), but
the directions and magnitudes of these impacts are mixed, depending on the nature of the
ecosystem services under consideration. All in all, we can observe two opposite cross‐effects of
biodiversity and temperature on the value of ecosystem service values.
On the one hand, our results reveal that biodiversity and temperature are "complimentary"
factors affecting the supply of EGS in a given geo‐climatic region, and therefore for this region the
climate change induced biodiversity loss may increase the overall negative impacts. This is
particularly clear in the case of provisioning services provided by Mediterranean forests. Our
results suggest that the negative impacts of climate change on biodiversity will go against the
positive direct climate change impact on the Mediterranean forests, and generate a net negative
impact on total value of provisioning services in the future. More specifically, biodiversity loss
caused by increment of 1ºC in the temperature is responsible for at least 49% in every one‐dollar
reduction of the value of forest provisioning service in the Mediterranean forests. This finding is
consistent with some of the previous studies. For instance, Linder et al. (2008) has found that
climate change may reduces the forestry productivity in the Mediterranean region in the future, as
warming will be greatest over western and southern Europe in summer, substantially affect the
precipitation rate and increase the risk of extreme weather events, such as prolonged drought,
storms and floods in the area. Moreover, in a different geographical context, Costanza et al. (2007)
also found a strong positive relationship between biodiversity and ecosystem productivity in
higher temperature regimes in the United States. However, the cross‐effects of biodiversity and
temperature are not statistically significant for the remaining two geo‐climatic regions. To better
understand the underlying reasons of this result, further investigation is needed.
On the other hand, biodiversity and temperature can also serve as "substitute" factors that
determine some of ecosystem service values under consideration. This is to say, the climate
change induced biodiversity impacts on EGS may attenuate/decrease the negative direct climate
change impact in some regions, where biodiversity plays a key role in mitigating the those
Economic Assessment of Climate Change Impacts on Biodiversity, Ecosystem Services and Human Well-being
85
negative impacts of climate change. For instance, this is clear for the cultural services provided by
the Mediterranean forests, in which the reduction of 1ºC in the temperature is responsible for half
of every 1% improvement of biodiversity indicator score. The latter will consequently contribute
to nearly 28% of every additional one‐dollar value generated in the cultural services provided by
Mediterranean forests. Similar result is found also for the regulating services in the region, where
biodiversity richness is expected to have a significant role in determining the respective values. In
conclusion, our result suggests that although climate change may have directly negative impacts
on the value of ecosystem services, it is possible to mitigate these negative impacts by better
managing biodiversity and natural resources. In many cases, the benefits derived from
biodiversity can be large enough to compensate the loss of ecosystem productivities and values as
a result of climate change.
4.5 Concluding Remarks and Further Research
This paper attempted to model the relationships between climate change, biodiversity and the
value of ecosystem services with a specific emphasis on the climate change included biodiversity
effects in European forests. The research begun with the construction of a composite biodiversity
indicator that integrated quantitative and qualitative changes of biodiversity projected under
different future climate scenarios. This indicator incorporated in‐depth socio‐economic reasons of
biodiversity changes, along with climate change impacts was expected to be a simple but
comprehensive biodiversity measure to analyze the climate change induced biodiversity effects
and the resulting socio‐economic impacts. In the present study, we tried to make the best use of
existing data released by a large number of IPCC data distribution centers, regarding the projected
trends of population growth, economic development, future species richness and increase in local
temperature under different future climate scenarios. Values of ecosystem services were derived
from a most recent assessment study on the climate change impacts on forest ecosystems in
Europe (Ding et al. 2010). Furthermore, the paper explored the use of 3SLS regression to
simultaneously estimate (1) the determinants of economic value of ecosystem services; (2) the
determinants of land‐use changes (i.e. the changes of forest‐land cover); (3) the determinants of
changes in biodiversity. The investigation was conducted first in a baseline model, where a global
effect of climate change was considered, followed by regressing a modified model, in which the
regional effects of climate change impacts were counted for.
To the best of our knowledge, the present paper represents one of the first attempts in the
literature to formally model and test the relationship between climate change induced

An Application to European Forest Ecosystems
86
biodiversity loss and the consequent welfare impacts. Despite the data limitation, our preliminary
results from a 3SLS regression are promising, confirmed the hypothesis that has been laid out
earlier. The consistency of beta coefficients for the same variable across different ecosystem
services suggests the robustness of the results.
In summary, the results of the present research suggest that a composite biodiversity indicator,
integrating information about changes in species and habitats, can serve as a better option than
the individual biodiversity indicators for measuring and predicting the trends of biodiversity
changes in response to a set of climate and socio‐economic drivers in different future climate
change scenarios. For instance, in the present study, the average score of future biodiversity
status (reflecting either improvement or degradation of biodiversity) is derived from the
projected future trends of four different species, i.e. tree, plant, bird and herptile as well as the
changes in forest habitats under different future climate scenarios, therefore the composite
biodiversity indicator indicates an overall improvement or degradation of the forest ecosystems
in each of the 17 EU member states in a climate change context. In this context, we are more
confident to use this indicator to describe and measure the health of forest ecosystems under
different climate conditions and to analyze the respective changes in its capacity of delivering
ecosystem goods and services. Moreover, the structure of the composite biodiversity indicator is
so simple that it can be easily used for communicating with policymakers and the broader
audience.
Moreover, our results from the 3SLS regression suggest that rising temperature negatively affects
biodiversity and ecosystem conditioning at an accelerating rate across geo‐climatic regions in the
future. In addition, we also found a strong relationship between temperature and the value of
ecosystem services, but the direction of this relationship depends on the type of ecosystem
services under consideration. That is to say, every 1ºC increase in temperature will contribute
proportionally to the changes of the value of ecosystem services. Independent from the
consideration of spatial effects of climate change, rising temperature is found positively impacting
the value of provisioning and regulating services, but negatively related to the cultural services.
This result is consistent with some earlier scientific findings (Garcia‐Gonzalo et al. 2007), which
state that forests in the cold geo‐climatic zones, such as the Scandinavian European countries, may
benefit from higher temperature in the short run due to the increased forest productivity and
carbon stocks in the boreal forests. However, if we take into account the climate change induced
Economic Assessment of Climate Change Impacts on Biodiversity, Ecosystem Services and Human Well-being
87
biodiversity effects, the direct impact of rising temperature on the value of ecosystem services
becomes less clear as a result of interactions between biodiversity and temperature.
In particular, the spatial effect of climate change induced biodiversity changes is captured, by
introducing a cross‐effect between biodiversity and temperature in the model. All in all, our
results show that biodiversity and temperature can perform together as either “complimentary”
or “substitute” factors to affect the supply as well as the value of certain types of ecosystem goods
and services. In the case of provisioning services provided by Mediterranean forests, we find a
clear “complementary” effect between biodiversity and temperature. Our results suggest that the
negative impacts of climate change on biodiversity will go against the positive direct climate
change impact on the Mediterranean forests, and thus generate a net negative impact on total
value of provisioning services in the future. More specifically, biodiversity loss caused by
increment of 1ºC in the temperature is responsible for at least 49% in every one‐dollar reduction
of the value of forest provisioning service in the Mediterranean forests. This finding is consistent
with some of the previous studies. For instance, Linder et al. (2008) has found that climate change
may reduces the forestry productivity in the Mediterranean region in the future, as warming will
be greatest over western and southern Europe in summer, substantially affect the precipitation
rate and increase the risk of extreme weather events, such as prolonged drought, storms and
floods in the area. In addition, a similar positive relationship between biodiversity and ecosystem
productivity in higher temperature regimes is also found in the US (Costanza et al. 2007).
Whereas the substitute effect between biodiversity and temperature refers that climate change
induced biodiversity effects on EGS may attenuate/decrease the negative direct climate change
impact in some regions, where biodiversity plays a key role in mitigating the those negative
impacts of climate change. For instance, this is clear for the cultural services provided by the
Mediterranean forests, in which the reduction of 1ºC in the temperature is responsible for half of
every 1% improvement of biodiversity indicator score. The latter will consequently contribute to
nearly 28% of every additional one‐dollar value generated in the cultural services provided by
Mediterranean forests. Similar result is found also for the regulating services in the region, where
biodiversity richness is expected to have a significant role in determining the respective values.
This result may imply some important synergies of the climate and biodiversity policies. In other
words, although climate change may have directly negative impacts on the value of ecosystem
services, it is possible to mitigate these negative impacts by better managing biodiversity and
natural resources. In many cases, the benefits derived from biodiversity can be large enough to
compensate the loss of ecosystem productivities and values as a result of climate change.
An Application to European Forest Ecosystems
88
However, we are also aware of the limitations in the current study. For instance, the construction
of composite biodiversity indicator in this paper is subject to a significant lack of data that covers
time‐span long enough to describe the evolution of species from the past to the future under
different climate change scenarios. As a consequence, we may observe an increase of species
richness as well as forest habitats in many countries under the climate change scenarios by 2050
with respect to a baseline year of 2000, owing to the significant efforts of the EU‐17 in moving
towards more sustainable forest management practice. Thus, it is difficult for us to interpret, to
what extent, the projected trends of changes in species richness is a result of the climate change
impacts or a combination of different factors. Obviously, there is a need of incorporating more
information about species richness from the far distant past into our current database, as a large
time‐span will enable us to rule out many other socio‐economic factors other than the direct
impact of climate change that affect biodiversity and ecosystem functioning. Finally, a richer
historical data can also improve the overall performance of the econometric model and help us to
better understand the cross‐effects between biodiversity and temperature as well as the pattern
in which they affect the ecosystem service values.
Economic Assessment of Climate Change Impacts on Biodiversity, Ecosystem Services and Human Well-being
89
CHAPTER 5 THE SOCIAL DIMENSION OF BIODIVERSITY POLICY IN THE EUROPEAN UNION: VALUING BIODIVERSITY BENEFITS TO VULNERABLE GROUPS Ding, H., Ghermandi, A. and P.A.L.D. Nunes (under preparation) ‘The Social Dimension of Biodiversity Policy in the European Union: Valuing Biodiversity Benefits to Vulnerable Groups), under preparation for submission to Journal of Environmental Science & Policy
Abstract This paper explores the use of spatial mapping tools, including Geographic Information Systems (GIS) to explore the social dimension of biodiversity policy, so as to identify and analyze the strength of the linkage between biodiversity and human livelihoods in different geographic locations. Our analysis is focused on Europe, where biodiversity and ecosystem benefits have been well studied for many ecosystems and will concentrate in particular on forest, coastal and wetland ecosystems both at country level and downscaled to a higher geographical resolution. In particular, we focus on European rural areas with a high density of agricultural land‐use and investigate the dependencies between the socio‐economic, biodiversity and ecosystem value indicators in the selected rural regions across different income groups. Moreover, social vulnerability indicators are also identified and mapped in a spatial gradient so as to investigate the role of biodiversity in the definition of social vulnerability contours maps in particular for rural communities living in remote regions. The results of this study provides important insights for EU policymakers to design potential policy instruments that can on the one hand promote biodiversity conservation and prevent natural resources from degradation, and on the other hand contribute to social stability and human livelihoods. Keywords: biodiversity policy, biodiversity benefit, vulnerable groups, European Union, spatial analysis JEL: Q56, Q57, Q58
Note: This paper has been submitted to the 2011 EAERE conference in Roma, Italy
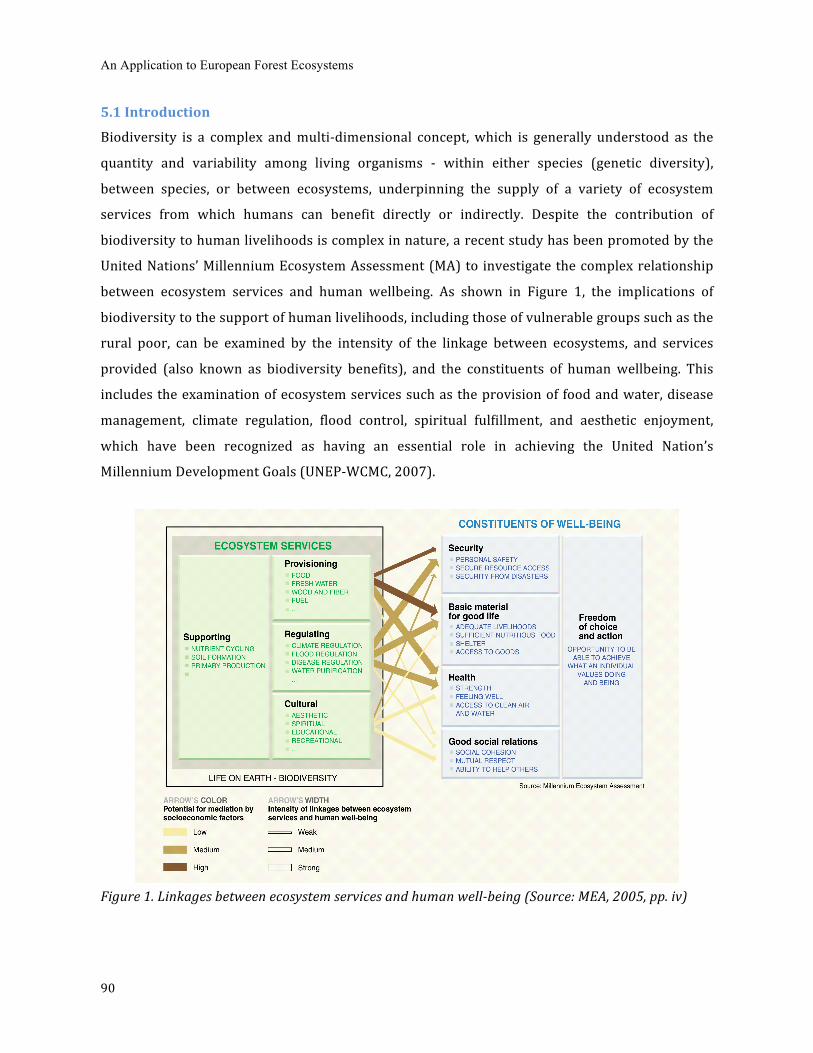
An Application to European Forest Ecosystems
90
5.1 Introduction
Biodiversity is a complex and multi‐dimensional concept, which is generally understood as the
quantity and variability among living organisms ‐ within either species (genetic diversity),
between species, or between ecosystems, underpinning the supply of a variety of ecosystem
services from which humans can benefit directly or indirectly. Despite the contribution of
biodiversity to human livelihoods is complex in nature, a recent study has been promoted by the
United Nations’ Millennium Ecosystem Assessment (MA) to investigate the complex relationship
between ecosystem services and human wellbeing. As shown in Figure 1, the implications of
biodiversity to the support of human livelihoods, including those of vulnerable groups such as the
rural poor, can be examined by the intensity of the linkage between ecosystems, and services
provided (also known as biodiversity benefits), and the constituents of human wellbeing. This
includes the examination of ecosystem services such as the provision of food and water, disease
management, climate regulation, flood control, spiritual fulfillment, and aesthetic enjoyment,
which have been recognized as having an essential role in achieving the United Nation’s
Millennium Development Goals (UNEP‐WCMC, 2007).
Figure 1. Linkages between ecosystem services and human wellbeing (Source: MEA, 2005, pp. iv)
Economic Assessment of Climate Change Impacts on Biodiversity, Ecosystem Services and Human Well-being
91
Ecosystem services are important to different economic sectors. Primary sector activities such as
agriculture, forestry, fisheries and hunting depend on a wide range of provisioning, regulating and
supporting services which together shape the natural capital on which these sectors depend and
determine sector inputs, processes and outputs. A variety of manufacturing activities depend on
ecosystem services for the delivery of raw material inputs. Service sectors such as tourism,
education and the media rely on the cultural services delivered by ecosystems. All sectors are
dependent on ecosystem services indirectly in maintaining the health of the workforce, the living
and working environment, and for providing protection from natural hazards.
Given that biodiversity underpins the provision of a variety of ecosystem goods and services,
policies targeting at biodiversity conservation may have important implications to livelihoods
enhancement and poverty alleviation. The synergies of biodiversity benefits and human
livelihoods may vary in particular between developed and developing countries. For instance, a
recent EC report (Nunes et al. 2010) has shown that in the developing world, a large proportion
of employment is dependent on biodiversity and the ecosystem services it provides. By contrast,
in developed regions such as the EU, the provisioning role of biodiversity and ecosystems is now
responsible for only a small proportion of livelihoods. Direct employment in nature conservation
is significant and growing and so is the employment in nature‐based tourism and recreation
(Nunes et al. 2010). The extent to which biodiversity conservation can benefit human livelihoods
is an important question confronted by policymakers, who need to evaluate the trade‐offs
between biodiversity benefits and opportunity costs of conservation activities and to maximize
the social benefits of biodiversity policies. The answer, however, requires an in‐depth
understanding of the social dimension of biodiversity policy, by analyzing the ways in which
human livelihoods depend on biodiversity and ecosystem services and by examining the level of
the respective dependency.
With this perspective in mind, the present paper will explore the use of spatial mapping tools,
such as Geographic Information Systems (GIS) method to explore the social dimension of
biodiversity policy, so as to identify and analyze the strength of the linkage between biodiversity
and human livelihoods at different geographic locations. Our analysis will focus on a European
scale, where biodiversity and ecosystem benefits have been well studied for many ecosystems and
will concentrate in particular on forest, coastal and wetland ecosystems both at country level and
downscaled to a higher geographical resolution (See Ding et al 2010, Ghermandi et al 2009a&b).
Moreover, the data on socio‐economic and biodiversity conditions of the countries under

An Application to European Forest Ecosystems
92
consideration are also well documented in the literature. These three types of information will be
mapped in a spatial gradient. The results of this study are expected to provide important insights
for the EU policymakers to design potential policy instruments that can on the one hand promote
biodiversity conservation and prevent natural resources from degradation, and on the other hand
contribute to social stability and human livelihoods (e.g. increased number of jobs in the
protected area and/or ecosystem‐related economic activities).
The reminder of the paper is structured as follows. In Section 2, a conceptual model is used to
present the methodological framework developed for mapping and analyzing the linkages of
biodiversity and human livelihoods. Section 3 defines the core socio‐economic and biological
indicators and introduces data to be used in the spatial analysis. Section 4 investigates the links
between a country’s or region’s economy, its biodiversity richness and the provision of ecosystem
services. Section 5 concludes the main findings and provides with policy recommendations for the
EU.
5.2 Methodology
(1) A Conceptual Model for Mapping the Linkages of Biodiversity Benefits and Human Livelihoods
In the present paper, we shall embrace a conceptual model to evaluate the linkages of biodiversity
benefits and human livelihoods, which shed light on two distinct value transmission mechanisms.
The first captures the market value components of the biodiversity benefits on human livelihoods.
A second component encapsulates the non‐market dimensions – see Figure 2. Thus, human
wellbeing benefits from biodiversity and ecosystem services in terms of the directly increased
household revenues from resource related economic activities as well as the enhancement of
various non‐income benefits from the ecosystem services received.
First, with respect to income related livelihoods, ecosystem services are essential inputs for many
primary sectors in the economy, including forestry, agriculture, fishery, and tourism or direct
source of income/revenues to the local communities (consumers/firms) who are involved in
markets trading ecosystem services, such as food and wood fuel, among others. The strength of
this linkage can be estimated through a systematic economic sector analysis, and the results
reflect the degree of dependency of the local economies with respect to biodiversity and ecosystem
services, including their role in the creation of employment/income opportunities to the
communities. In this context, valuing the economic revenues that rural dwellers or poor local
communities can extract from the use of environmental resources enables us to assess their
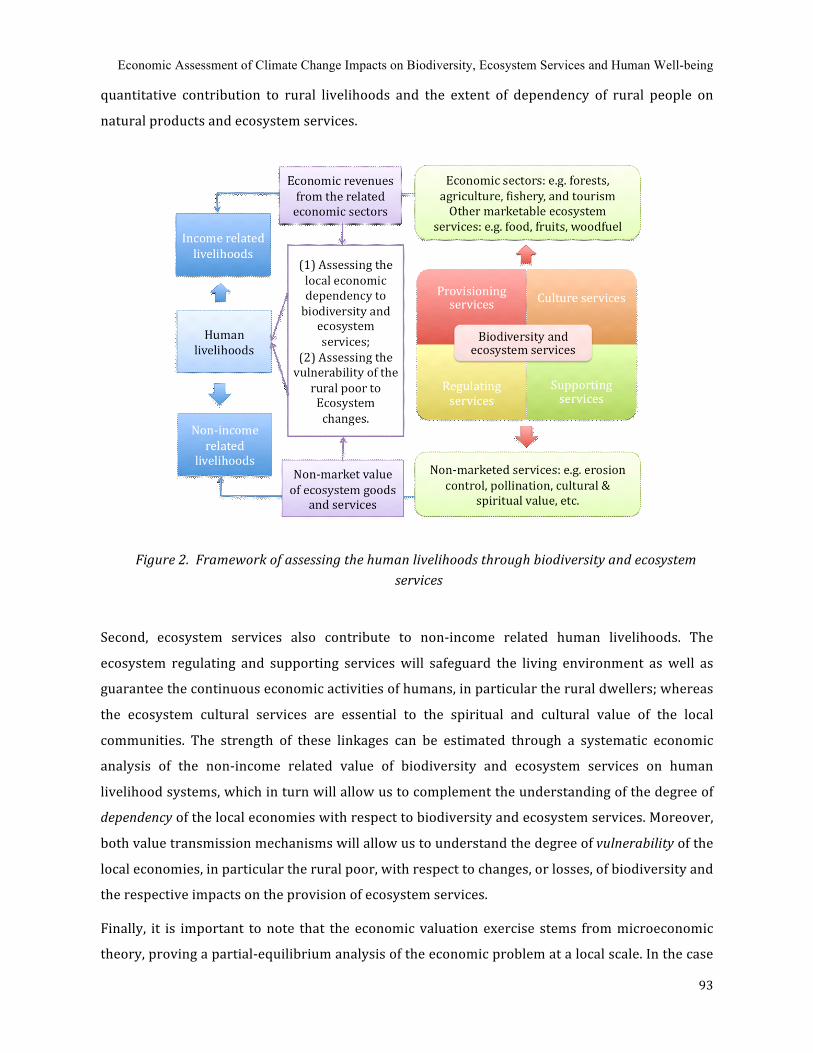
Economic Assessment of Climate Change Impacts on Biodiversity, Ecosystem Services and Human Well-being
93
quantitative contribution to rural livelihoods and the extent of dependency of rural people on
natural products and ecosystem services.
Figure 2. Framework of assessing the human livelihoods through biodiversity and ecosystem services
Second, ecosystem services also contribute to non‐income related human livelihoods. The
ecosystem regulating and supporting services will safeguard the living environment as well as
guarantee the continuous economic activities of humans, in particular the rural dwellers; whereas
the ecosystem cultural services are essential to the spiritual and cultural value of the local
communities. The strength of these linkages can be estimated through a systematic economic
analysis of the non‐income related value of biodiversity and ecosystem services on human
livelihood systems, which in turn will allow us to complement the understanding of the degree of
dependency of the local economies with respect to biodiversity and ecosystem services. Moreover,
both value transmission mechanisms will allow us to understand the degree of vulnerability of the
local economies, in particular the rural poor, with respect to changes, or losses, of biodiversity and
the respective impacts on the provision of ecosystem services.
Finally, it is important to note that the economic valuation exercise stems from microeconomic
theory, proving a partial‐equilibrium analysis of the economic problem at a local scale. In the case
An Application to European Forest Ecosystems
94
of quantifying the biodiversity benefits to the rural poor, we are particularly interested in the cash
or non‐cash income that local communities can obtain from the extractive use of natural resources
and how much can this contribute to rural livelihoods. This perspective indicates that the current
economic analysis focuses on the supply side of products, which are transformed into benefits to
the economy by either being used as resource endowments in production of the primary sectors
(e.g. timber production) or being provided to outsiders in the form of ecosystem‐based services
(e.g. recreation/tourism services). Although benefits of ecosystem services exist in different
forms, it is clear that both benefits can be traced directly/indirectly in the marketplace and lead to
the increase of cash income and the creation of new job opportunities to the local population.
Therefore, we interpret the estimated economic values of ecosystem services as the contribution
to the total income that supports the livelihoods of rural communities. The magnitude of the
ecosystem value can also reflect the poverty level of vulnerable groups in the rural areas.
(2) GIS Spatial Mapping of Biodiversity Benefits and Rural Vulnerable Groups
Empirical evidence has shown spatial coincidence between ecosystem services and strong
dependence of poor rural livelihoods on those services (Chomitz and Nelson, 2003; Müller et al.,
2006 and Dasgupta et al., 2005). Such strong dependence on natural resources makes the rural
poor very vulnerable to any changes in ecosystems and biodiversity. Natural resource
degradation and biodiversity loss can affect the poor by impairing household consumption
derived from natural products and the proportion of wealth generated in ecosystem‐related
production and employment. In this context, GIS maps can be a powerful tool for investigating the
spatial coherence of biodiversity and rural vulnerable groups, identifying conservation priorities
and the cost‐effective biodiversity policies that promote both biodiversity conservation and
poverty alleviation. In the analysis we strongly rely on Geographic Information Systems (GIS) to
integrate different spatial layers of information, which are targeted at capturing various levels of
socio‐economic characteristics of the population, biodiversity richness or economic value of
ecosystem services. In the context of GIS mapping, we focus in particular on those vulnerability‐
related indicators that allow us to look for in detail to the spatial disaggregation of the data. In the
following sections, the role of biodiversity and ecosystem services in supporting human well‐
being is discussed at different geographical scales and for different types of vulnerability in poor
economies, rural communities and remote communities.
Spatial mapping requires both data quality and quantity, therefore we only focus on the European
countries, where best information is available at country level, for describing (1) the socio‐
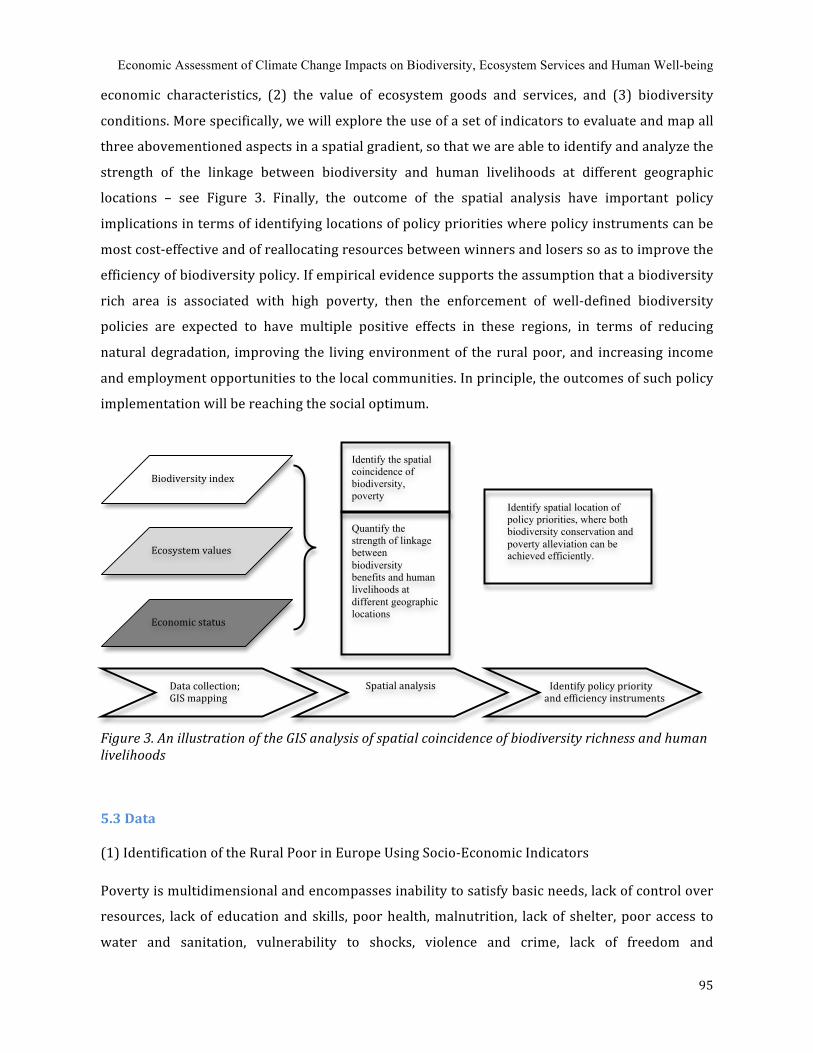
Economic Assessment of Climate Change Impacts on Biodiversity, Ecosystem Services and Human Well-being
95
economic characteristics, (2) the value of ecosystem goods and services, and (3) biodiversity
conditions. More specifically, we will explore the use of a set of indicators to evaluate and map all
three abovementioned aspects in a spatial gradient, so that we are able to identify and analyze the
strength of the linkage between biodiversity and human livelihoods at different geographic
locations – see Figure 3. Finally, the outcome of the spatial analysis have important policy
implications in terms of identifying locations of policy priorities where policy instruments can be
most cost‐effective and of reallocating resources between winners and losers so as to improve the
efficiency of biodiversity policy. If empirical evidence supports the assumption that a biodiversity
rich area is associated with high poverty, then the enforcement of well‐defined biodiversity
policies are expected to have multiple positive effects in these regions, in terms of reducing
natural degradation, improving the living environment of the rural poor, and increasing income
and employment opportunities to the local communities. In principle, the outcomes of such policy
implementation will be reaching the social optimum.
Figure 3. An illustration of the GIS analysis of spatial coincidence of biodiversity richness and human livelihoods 5.3 Data (1) Identification of the Rural Poor in Europe Using Socio‐Economic Indicators Poverty is multidimensional and encompasses inability to satisfy basic needs, lack of control over
resources, lack of education and skills, poor health, malnutrition, lack of shelter, poor access to
water and sanitation, vulnerability to shocks, violence and crime, lack of freedom and
Biodiversity index
Ecosystem values
Economic status
Identify spatial location of policy priorities, where both biodiversity conservation and poverty alleviation can be achieved efficiently.
Identify the spatial coincidence of biodiversity, poverty
Quantify the strength of linkage between biodiversity benefits and human livelihoods at different geographic locations
Data collection; GIS mapping
Spatial analysis Identify policy priority and efficiency instruments

An Application to European Forest Ecosystems
96
powerlessness. In most world areas, the poorest people of a country are often the indigenous
people or ethnic minorities who live in a remote location or on the marginal lands of rural areas,
relatively far from essential elements of the modern economies, such as big cities, large paved
roads and ports. Whereas in Europe, rural poverty is practically nonexistent in the European
Union (EU) and in Northern Europe, where 25‐40% of total population is rural. However, poverty
in Europe is on the rise due to the extension of new member states in Central and Eastern Europe.
For instance, in Romania and Bulgaria, almost 40 per cent of the poor people are the Roma
community, who are among the poorest people in Europe. More than eight out of ten in the
Republic of Moldova live below the two‐dollar‐a‐day poverty line, many of them in rural areas25.
In many rural areas of the new member states, poverty has increased as a result of privatization of
former collective and state farms after the collapse of the former communist system, leaving rural
workers unemployed and with few opportunities for alternative employment. In particular, lack
of local employment, distances from the markets of Western Europe, and scarcity of land and plot
fragmentation are key factors that determine the rural poverty in the region and result in a flow of
rural migration to urban areas in search of jobs and services (IFAD, 2002). Poverty is becoming
an important issue in Europe as it comes hand in hand with vulnerability, a measurement of the
societal resistance or resilience of rural communities to the loss of biodiversity and ecosystem
services, reflecting their inability of adapting to any shocks and damages (e.g. climate change,
floods and drought) to the natural resources on which their livelihoods depend. High vulnerability
arises in the poor rural communities whose livelihoods are directly extracted from the sale of
primary resources (farmers, fishermen and foresters) or reliant on the selling of their labour.
Moreover, vulnerability may also increase with respect to the increasing remoteness of
communities whose potential is limited in terms of their accessibility to markets in big
towns/cities, and additional source of income from off‐farm employment opportunities in the
nearby urban areas. In response, the EU has earmarked a significant part of its common budget
for development of the least advantaged rural areas within new member states in Eastern Europe.
To profile the rural poor in the European countries under consideration, four key socio‐economic
indicators, including GDP per capita (2007US$, PPP), agriculture added value over GDP,
unemployment rate (% of population aged 15 and over, 2007) and rural population (% of total,
2007) are chosen to measure the level of economic development in each country and the
25 http://www.ruralpovertyportal.org/web/guest/region/home/tags/europe
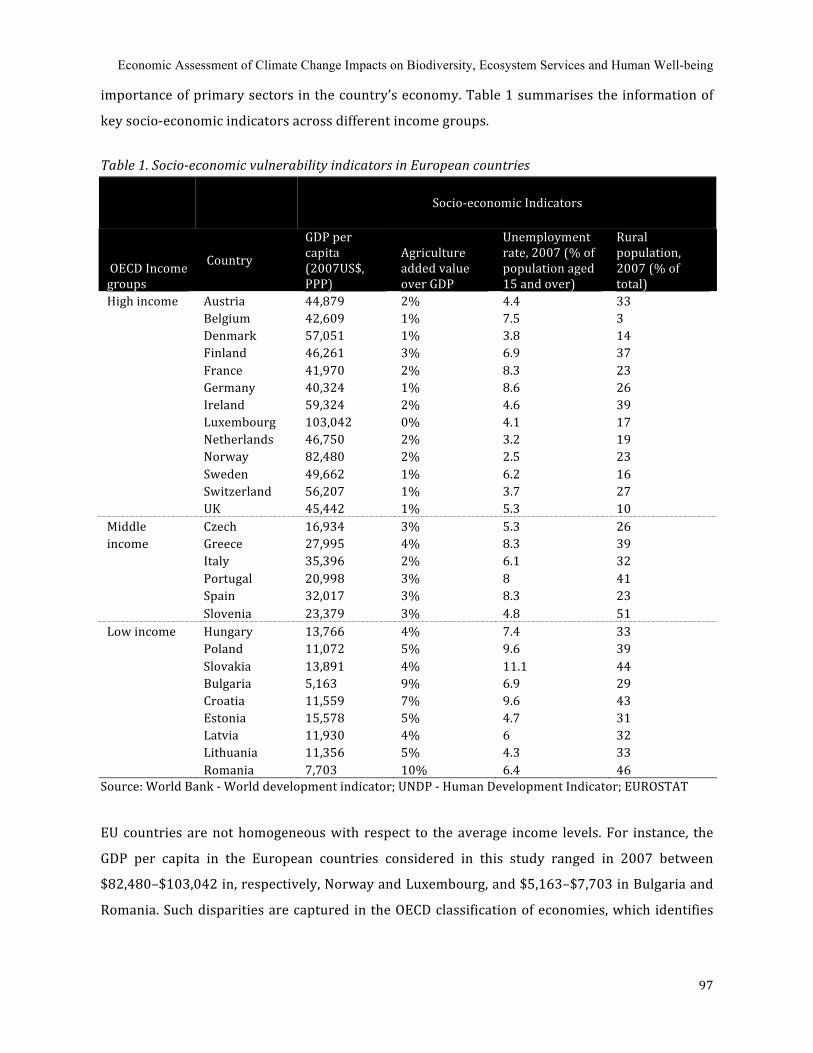
Economic Assessment of Climate Change Impacts on Biodiversity, Ecosystem Services and Human Well-being
97
importance of primary sectors in the country’s economy. Table 1 summarises the information of
key socio‐economic indicators across different income groups.
Table 1. Socioeconomic vulnerability indicators in European countries
Socio‐economic Indicators
OECD Income groups
Country
GDP per capita (2007US$, PPP)
Agriculture added value over GDP
Unemployment rate, 2007 (% of population aged 15 and over)
Rural population, 2007 (% of total)
High income Austria 44,879 2% 4.4 33 Belgium 42,609 1% 7.5 3 Denmark 57,051 1% 3.8 14 Finland 46,261 3% 6.9 37 France 41,970 2% 8.3 23 Germany 40,324 1% 8.6 26 Ireland 59,324 2% 4.6 39 Luxembourg 103,042 0% 4.1 17 Netherlands 46,750 2% 3.2 19 Norway 82,480 2% 2.5 23 Sweden 49,662 1% 6.2 16 Switzerland 56,207 1% 3.7 27 UK 45,442 1% 5.3 10 Middle Czech 16,934 3% 5.3 26 income Greece 27,995 4% 8.3 39 Italy 35,396 2% 6.1 32 Portugal 20,998 3% 8 41 Spain 32,017 3% 8.3 23 Slovenia 23,379 3% 4.8 51 Low income Hungary 13,766 4% 7.4 33 Poland 11,072 5% 9.6 39 Slovakia 13,891 4% 11.1 44 Bulgaria 5,163 9% 6.9 29 Croatia 11,559 7% 9.6 43 Estonia 15,578 5% 4.7 31 Latvia 11,930 4% 6 32 Lithuania 11,356 5% 4.3 33 Romania 7,703 10% 6.4 46 Source: World Bank ‐ World development indicator; UNDP ‐ Human Development Indicator; EUROSTAT
EU countries are not homogeneous with respect to the average income levels. For instance, the
GDP per capita in the European countries considered in this study ranged in 2007 between
$82,480–$103,042 in, respectively, Norway and Luxembourg, and $5,163–$7,703 in Bulgaria and
Romania. Such disparities are captured in the OECD classification of economies, which identifies
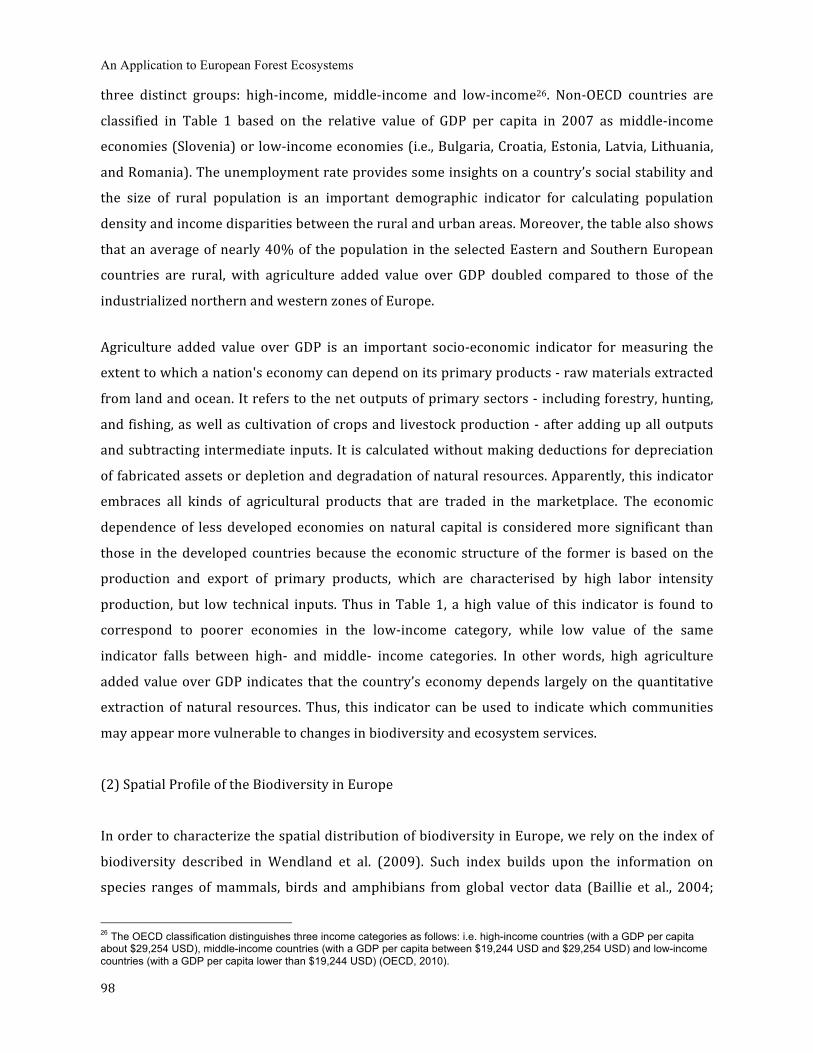
An Application to European Forest Ecosystems
98
three distinct groups: high‐income, middle‐income and low‐income26. Non‐OECD countries are
classified in Table 1 based on the relative value of GDP per capita in 2007 as middle‐income
economies (Slovenia) or low‐income economies (i.e., Bulgaria, Croatia, Estonia, Latvia, Lithuania,
and Romania). The unemployment rate provides some insights on a country’s social stability and
the size of rural population is an important demographic indicator for calculating population
density and income disparities between the rural and urban areas. Moreover, the table also shows
that an average of nearly 40% of the population in the selected Eastern and Southern European
countries are rural, with agriculture added value over GDP doubled compared to those of the
industrialized northern and western zones of Europe.
Agriculture added value over GDP is an important socio‐economic indicator for measuring the
extent to which a nation's economy can depend on its primary products ‐ raw materials extracted
from land and ocean. It refers to the net outputs of primary sectors ‐ including forestry, hunting,
and fishing, as well as cultivation of crops and livestock production ‐ after adding up all outputs
and subtracting intermediate inputs. It is calculated without making deductions for depreciation
of fabricated assets or depletion and degradation of natural resources. Apparently, this indicator
embraces all kinds of agricultural products that are traded in the marketplace. The economic
dependence of less developed economies on natural capital is considered more significant than
those in the developed countries because the economic structure of the former is based on the
production and export of primary products, which are characterised by high labor intensity
production, but low technical inputs. Thus in Table 1, a high value of this indicator is found to
correspond to poorer economies in the low‐income category, while low value of the same
indicator falls between high‐ and middle‐ income categories. In other words, high agriculture
added value over GDP indicates that the country’s economy depends largely on the quantitative
extraction of natural resources. Thus, this indicator can be used to indicate which communities
may appear more vulnerable to changes in biodiversity and ecosystem services.
(2) Spatial Profile of the Biodiversity in Europe
In order to characterize the spatial distribution of biodiversity in Europe, we rely on the index of
biodiversity described in Wendland et al. (2009). Such index builds upon the information on
species ranges of mammals, birds and amphibians from global vector data (Baillie et al., 2004;
26 The OECD classification distinguishes three income categories as follows: i.e. high-income countries (with a GDP per capita about $29,254 USD), middle-income countries (with a GDP per capita between $19,244 USD and $29,254 USD) and low-income countries (with a GDP per capita lower than $19,244 USD) (OECD, 2010).
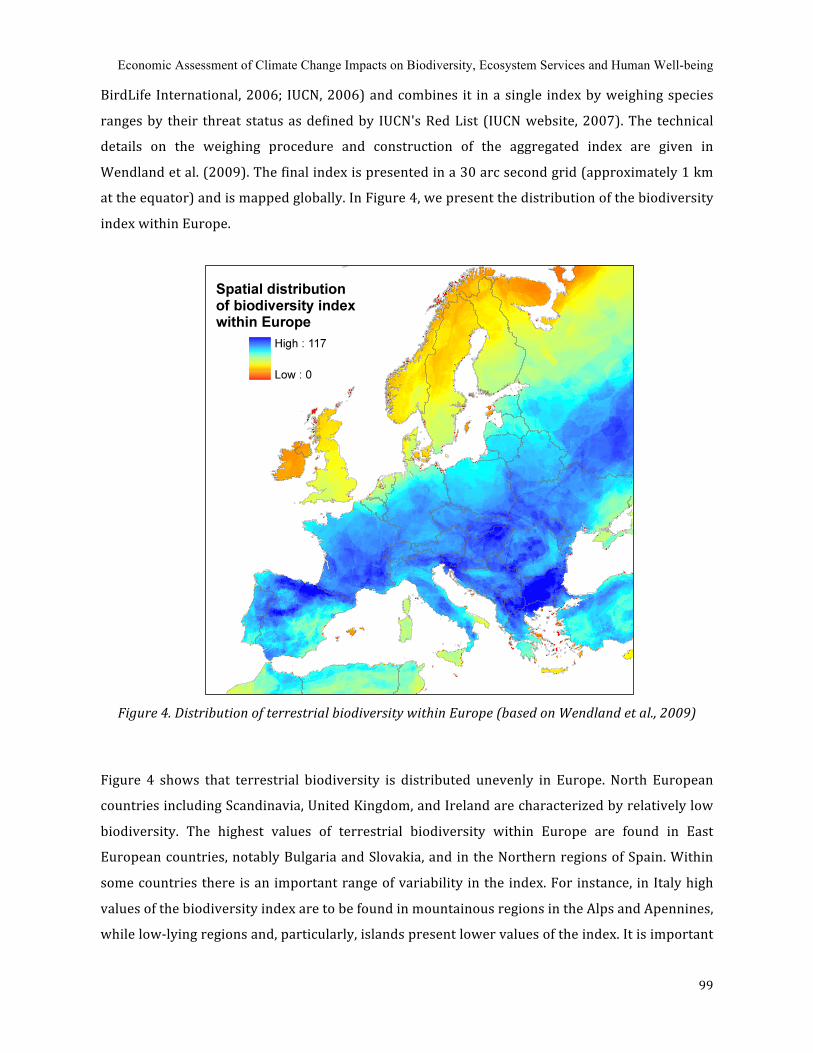
Economic Assessment of Climate Change Impacts on Biodiversity, Ecosystem Services and Human Well-being
99
BirdLife International, 2006; IUCN, 2006) and combines it in a single index by weighing species
ranges by their threat status as defined by IUCN's Red List (IUCN website, 2007). The technical
details on the weighing procedure and construction of the aggregated index are given in
Wendland et al. (2009). The final index is presented in a 30 arc second grid (approximately 1 km
at the equator) and is mapped globally. In Figure 4, we present the distribution of the biodiversity
index within Europe.
Figure 4. Distribution of terrestrial biodiversity within Europe (based on Wendland et al., 2009)
Figure 4 shows that terrestrial biodiversity is distributed unevenly in Europe. North European
countries including Scandinavia, United Kingdom, and Ireland are characterized by relatively low
biodiversity. The highest values of terrestrial biodiversity within Europe are found in East
European countries, notably Bulgaria and Slovakia, and in the Northern regions of Spain. Within
some countries there is an important range of variability in the index. For instance, in Italy high
values of the biodiversity index are to be found in mountainous regions in the Alps and Apennines,
while low‐lying regions and, particularly, islands present lower values of the index. It is important
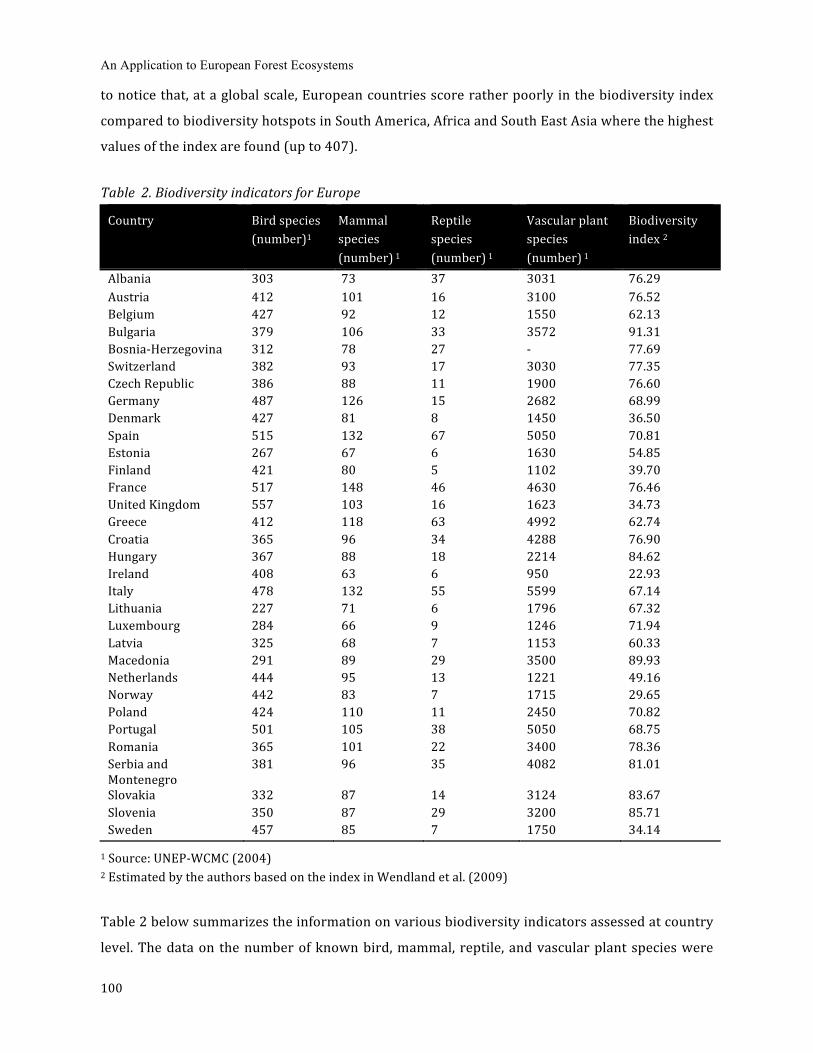
An Application to European Forest Ecosystems
100
to notice that, at a global scale, European countries score rather poorly in the biodiversity index
compared to biodiversity hotspots in South America, Africa and South East Asia where the highest
values of the index are found (up to 407).
Table 2. Biodiversity indicators for Europe
Country Bird species (number)1
Mammal species (number) 1
Reptile species (number) 1
Vascular plant species (number) 1
Biodiversity index 2
Albania 303 73 37 3031 76.29 Austria 412 101 16 3100 76.52 Belgium 427 92 12 1550 62.13 Bulgaria 379 106 33 3572 91.31 Bosnia‐Herzegovina 312 78 27 ‐ 77.69 Switzerland 382 93 17 3030 77.35 Czech Republic 386 88 11 1900 76.60 Germany 487 126 15 2682 68.99 Denmark 427 81 8 1450 36.50 Spain 515 132 67 5050 70.81 Estonia 267 67 6 1630 54.85 Finland 421 80 5 1102 39.70 France 517 148 46 4630 76.46 United Kingdom 557 103 16 1623 34.73 Greece 412 118 63 4992 62.74 Croatia 365 96 34 4288 76.90 Hungary 367 88 18 2214 84.62 Ireland 408 63 6 950 22.93 Italy 478 132 55 5599 67.14 Lithuania 227 71 6 1796 67.32 Luxembourg 284 66 9 1246 71.94 Latvia 325 68 7 1153 60.33 Macedonia 291 89 29 3500 89.93 Netherlands 444 95 13 1221 49.16 Norway 442 83 7 1715 29.65 Poland 424 110 11 2450 70.82 Portugal 501 105 38 5050 68.75 Romania 365 101 22 3400 78.36 Serbia and Montenegro
381 96 35 4082 81.01
Slovakia 332 87 14 3124 83.67 Slovenia 350 87 29 3200 85.71 Sweden 457 85 7 1750 34.14
1 Source: UNEP‐WCMC (2004) 2 Estimated by the authors based on the index in Wendland et al. (2009)
Table 2 below summarizes the information on various biodiversity indicators assessed at country
level. The data on the number of known bird, mammal, reptile, and vascular plant species were

Economic Assessment of Climate Change Impacts on Biodiversity, Ecosystem Services and Human Well-being
101
gathered from UNEP‐WCMC (UNEP, 2004) and are compared to the average score of the
biodiversity index by Wendland et al. (2009) for each European country. Overall, the highest
biodiversity in terms of number of species of birds, mammals, amphibians, and vascular plants is
found in France, Italy, and Spain. All three countries are characterized by a relatively high value in
the biodiversity index. It is reminded that the index is not constructed only based on the number
of species but also on their threat status as defined by IUCN's Red List. Despite the smaller range
of species, several Central and East European countries (e.g., Bulgaria, Macedonia, Slovenia) are
characterized by a higher score in the biodiversity index. On the lower side of the range, countries
such as Estonia, Ireland, Lithuania, Luxembourg and Latvia present the smallest range of animal
and plant species. Ireland also has the lowest values among the considered countries for what
concerns the biodiversity index. Notably, the United Kingdom is characterized by the largest
number of known bird species but shows a relatively low diversity in reptiles and vascular plants
and is characterized by a low value of the biodiversity index.
(3) Profile of Ecosystem Values in Europe This section reports economic values provided by a number of key ecosystems in Europe,
including forest ecosystems, marine/costal ecosystems and freshwater/wetland ecosystems. The
three ecosystems are valued in terms of three types of ecosystem service defined in the MEA
report (2005), including provisioning services, regulating services and cultural services. The
valuation exercise is conducted based on a hybrid economic valuation methodology (Ding et al.
2010), which combines the use of alternative valuation techniques, depending on the type of
ecosystem under consideration. In this study, data are taken from various sources. Bio‐physical
data regarding the land‐use changes and quantity of various forest products and carbon stocks are
taken from FAO (2005). Economic valuation databases (such as EVRI) are surveyed to select
original non‐market valuation studies for meta‐analysis and value transfer. The final numeric
valuation results are derived from a partial analysis, which considers only a subset of all
ecosystem types and services. The total value of forest ecosystem embraces provisioning,
regulating and cultural services (Ding et al. 2010). As for wetlands and freshwater ecosystems,
marine/ coastal ecosystems, valuation results are the results of two meta‐analyses. While the
values of wetlands and freshwater reflect the total economic value of these ecosystems, the value
of coastal areas is limited to their recreational value (Ghermandi et al. 2010a,b). Finally, in order
to illustrate the contribution of ecosystem benefits to the local economies, we calculated the
percentage of total value provided by each ecosystem type over a country’s GDP.
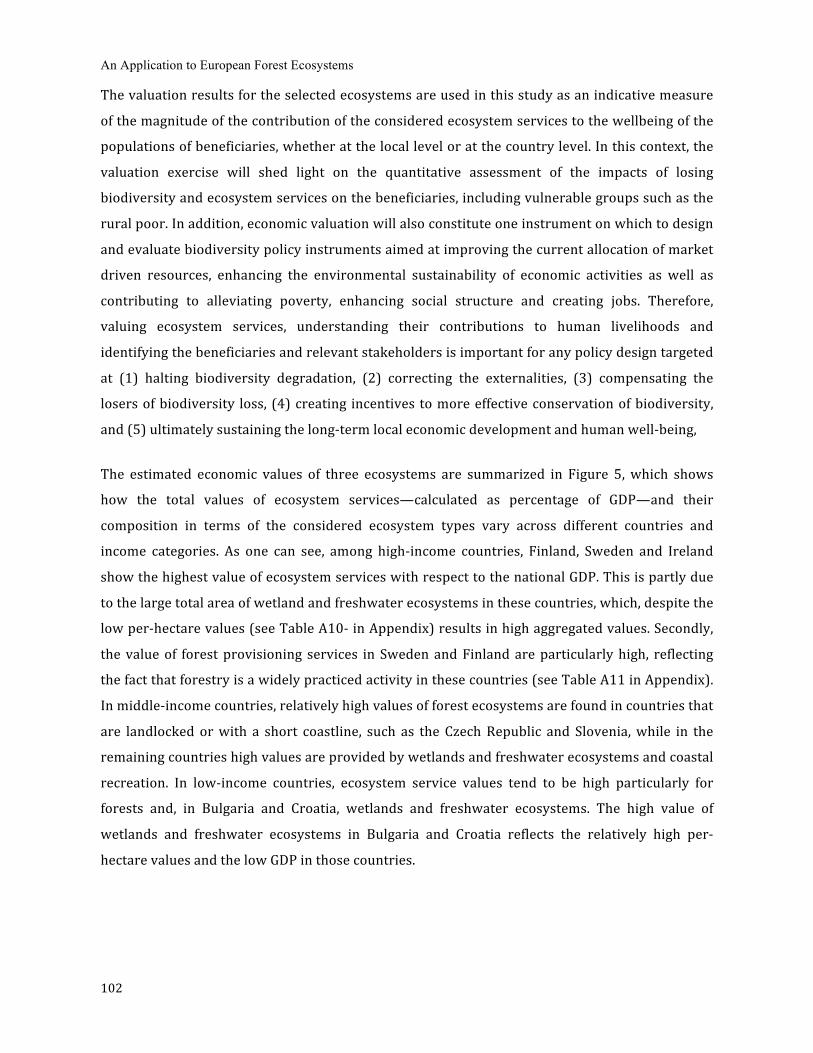
An Application to European Forest Ecosystems
102
The valuation results for the selected ecosystems are used in this study as an indicative measure
of the magnitude of the contribution of the considered ecosystem services to the wellbeing of the
populations of beneficiaries, whether at the local level or at the country level. In this context, the
valuation exercise will shed light on the quantitative assessment of the impacts of losing
biodiversity and ecosystem services on the beneficiaries, including vulnerable groups such as the
rural poor. In addition, economic valuation will also constitute one instrument on which to design
and evaluate biodiversity policy instruments aimed at improving the current allocation of market
driven resources, enhancing the environmental sustainability of economic activities as well as
contributing to alleviating poverty, enhancing social structure and creating jobs. Therefore,
valuing ecosystem services, understanding their contributions to human livelihoods and
identifying the beneficiaries and relevant stakeholders is important for any policy design targeted
at (1) halting biodiversity degradation, (2) correcting the externalities, (3) compensating the
losers of biodiversity loss, (4) creating incentives to more effective conservation of biodiversity,
and (5) ultimately sustaining the long‐term local economic development and human well‐being,
The estimated economic values of three ecosystems are summarized in Figure 5, which shows
how the total values of ecosystem services—calculated as percentage of GDP—and their
composition in terms of the considered ecosystem types vary across different countries and
income categories. As one can see, among high‐income countries, Finland, Sweden and Ireland
show the highest value of ecosystem services with respect to the national GDP. This is partly due
to the large total area of wetland and freshwater ecosystems in these countries, which, despite the
low per‐hectare values (see Table A10‐ in Appendix) results in high aggregated values. Secondly,
the value of forest provisioning services in Sweden and Finland are particularly high, reflecting
the fact that forestry is a widely practiced activity in these countries (see Table A11 in Appendix).
In middle‐income countries, relatively high values of forest ecosystems are found in countries that
are landlocked or with a short coastline, such as the Czech Republic and Slovenia, while in the
remaining countries high values are provided by wetlands and freshwater ecosystems and coastal
recreation. In low‐income countries, ecosystem service values tend to be high particularly for
forests and, in Bulgaria and Croatia, wetlands and freshwater ecosystems. The high value of
wetlands and freshwater ecosystems in Bulgaria and Croatia reflects the relatively high per‐
hectare values and the low GDP in those countries.
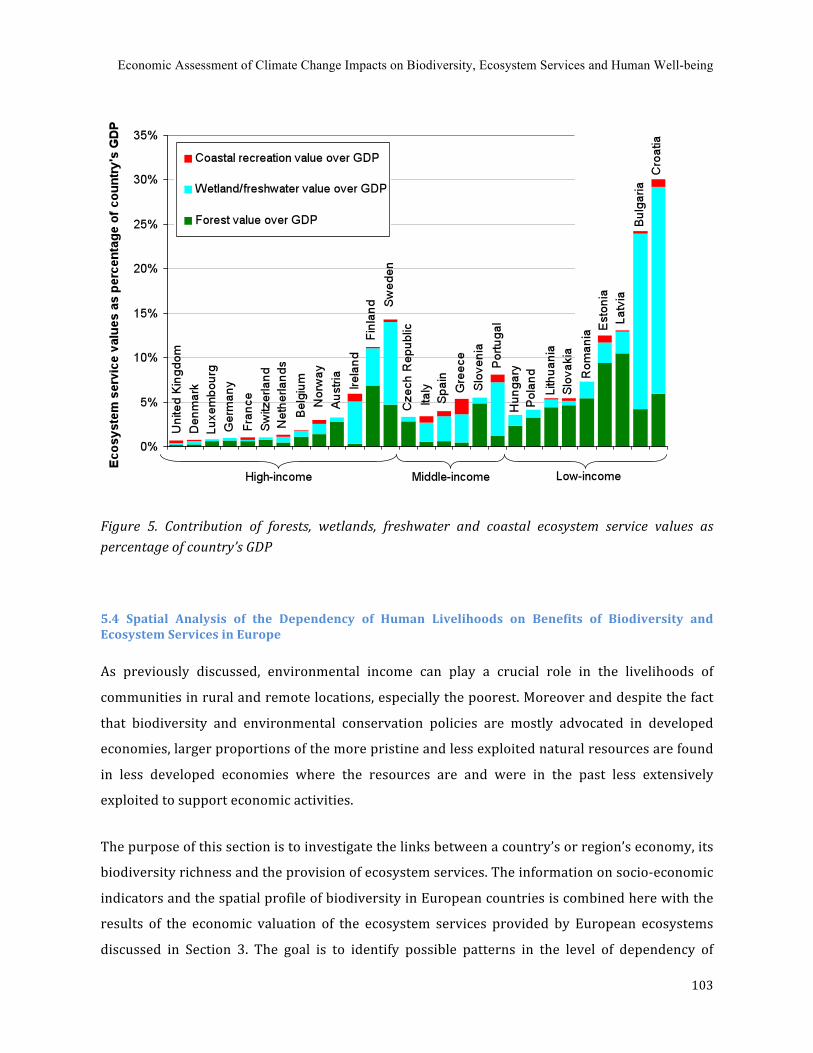
Economic Assessment of Climate Change Impacts on Biodiversity, Ecosystem Services and Human Well-being
103
Figure 5. Contribution of forests, wetlands, freshwater and coastal ecosystem service values as percentage of country’s GDP 5.4 Spatial Analysis of the Dependency of Human Livelihoods on Benefits of Biodiversity and Ecosystem Services in Europe As previously discussed, environmental income can play a crucial role in the livelihoods of
communities in rural and remote locations, especially the poorest. Moreover and despite the fact
that biodiversity and environmental conservation policies are mostly advocated in developed
economies, larger proportions of the more pristine and less exploited natural resources are found
in less developed economies where the resources are and were in the past less extensively
exploited to support economic activities.
The purpose of this section is to investigate the links between a country’s or region’s economy, its
biodiversity richness and the provision of ecosystem services. The information on socio‐economic
indicators and the spatial profile of biodiversity in European countries is combined here with the
results of the economic valuation of the ecosystem services provided by European ecosystems
discussed in Section 3. The goal is to identify possible patterns in the level of dependency of

An Application to European Forest Ecosystems
104
national and local economies on the benefits of biodiversity and ecosystem services across a range
of indicators, which are chosen to represent different degrees of economic development and
vulnerability. Otherwise stated, the objective of the investigation is to test whether poor and
vulnerable rural and remote communities are more strongly dependent on the provision of
ecosystem services.
(1) Income‐Related Vulnerability and the Link to Biodiversity Household income level can be interpreted as a measure of the risk to fall into poverty or deeper
poverty in the future as can be triggered by shocks at the community level or at the national and
international level. It can thus provide an indication of the vulnerability of communities to socio‐
economic or environmental changes at the local or larger scale.
The countries in the European Union are not homogeneous with respect to the average income
levels. In Figure 6 the average values of the selected socio‐economic, biodiversity and ecosystem
service value indicators across the three OECD income categories are presented. The socio‐
economic indicators chosen are the rural population as percentage of the total population, the
unemployment rate in 2007 and the added value of agriculture to the country’s GDP in 2007. The
ecosystem services indicator reflects the total economic value of forests, wetlands, freshwater
ecosystems and recreation in coastal areas as elicited in Section 3 over the total GDP of the
country. The biodiversity indicator is the country average of the terrestrial biodiversity indicator
discussed in Section 3.
The results in Figure 6 highlight the presence of a correlation between ecosystem services,
biodiversity and income‐related vulnerability in the selected European countries. Moving from
high‐income to low‐income countries one can note that the values of all socio‐economic indicators
increase towards higher vulnerability. The unemployment rate increases from 5.3% to 7.3%, the
percentage of rural population from 22% to 37% and the dependence of GDP from the
agricultural sector increases from 1.5% in high‐income countries to 5.9% in low‐income
countries. High income countries show, however, a lower value of the biodiversity index than low‐
income countries. The dependence of the latter economies from ecosystem services is, on the
other hand, higher. Ecosystem service values account for 11.8% of the GDP of low‐income
countries while only for 3.6% of high‐income economies.
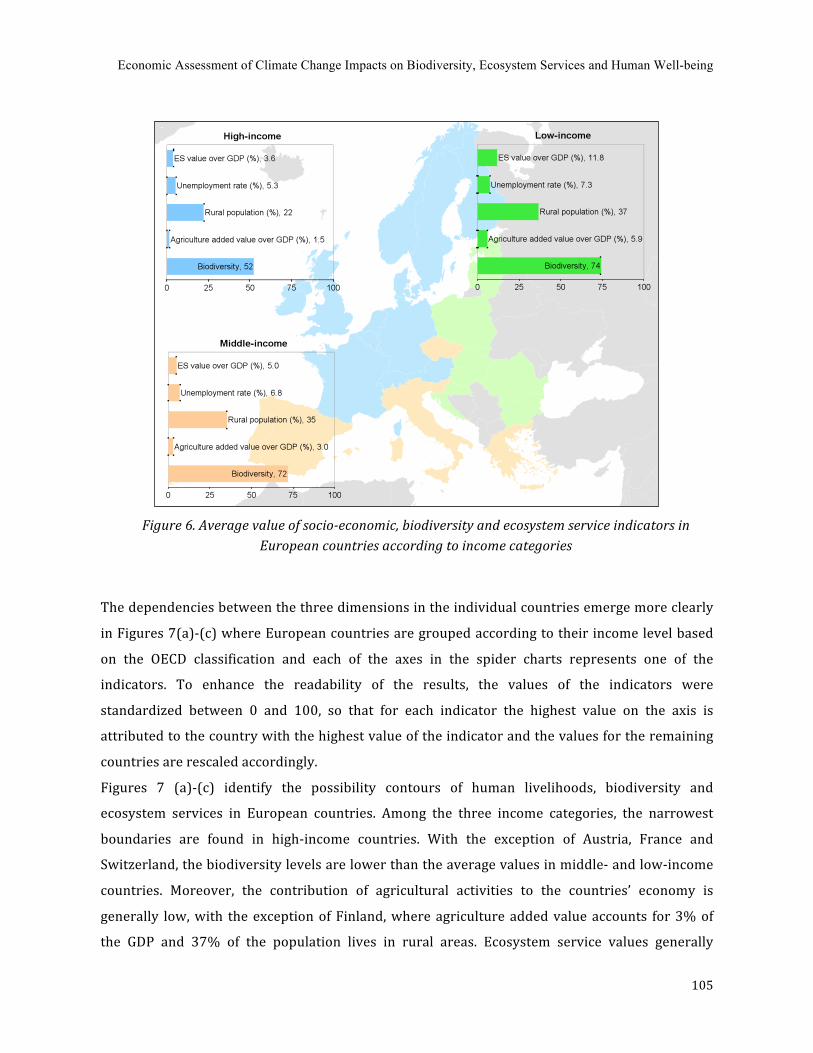
Economic Assessment of Climate Change Impacts on Biodiversity, Ecosystem Services and Human Well-being
105
Figure 6. Average value of socioeconomic, biodiversity and ecosystem service indicators in
European countries according to income categories The dependencies between the three dimensions in the individual countries emerge more clearly
in Figures 7(a)‐(c) where European countries are grouped according to their income level based
on the OECD classification and each of the axes in the spider charts represents one of the
indicators. To enhance the readability of the results, the values of the indicators were
standardized between 0 and 100, so that for each indicator the highest value on the axis is
attributed to the country with the highest value of the indicator and the values for the remaining
countries are rescaled accordingly.
Figures 7 (a)‐(c) identify the possibility contours of human livelihoods, biodiversity and
ecosystem services in European countries. Among the three income categories, the narrowest
boundaries are found in high‐income countries. With the exception of Austria, France and
Switzerland, the biodiversity levels are lower than the average values in middle‐ and low‐income
countries. Moreover, the contribution of agricultural activities to the countries’ economy is
generally low, with the exception of Finland, where agriculture added value accounts for 3% of
the GDP and 37% of the population lives in rural areas. Ecosystem service values generally
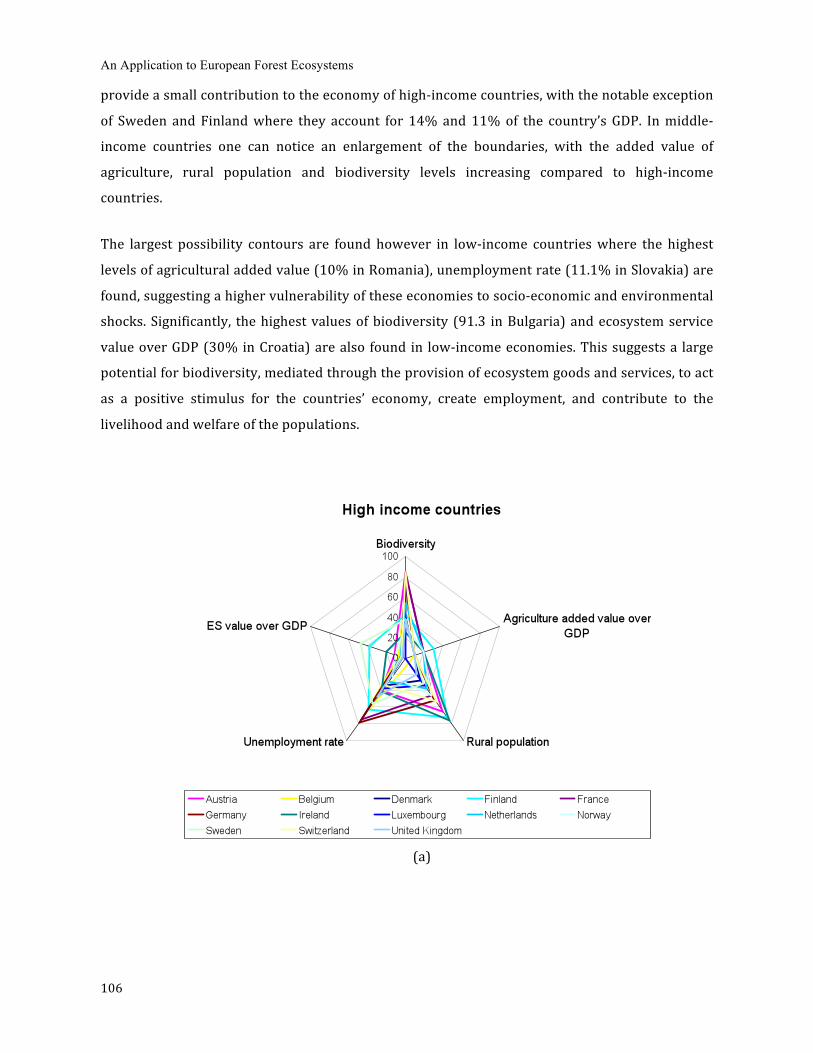
An Application to European Forest Ecosystems
106
provide a small contribution to the economy of high‐income countries, with the notable exception
of Sweden and Finland where they account for 14% and 11% of the country’s GDP. In middle‐
income countries one can notice an enlargement of the boundaries, with the added value of
agriculture, rural population and biodiversity levels increasing compared to high‐income
countries.
The largest possibility contours are found however in low‐income countries where the highest
levels of agricultural added value (10% in Romania), unemployment rate (11.1% in Slovakia) are
found, suggesting a higher vulnerability of these economies to socio‐economic and environmental
shocks. Significantly, the highest values of biodiversity (91.3 in Bulgaria) and ecosystem service
value over GDP (30% in Croatia) are also found in low‐income economies. This suggests a large
potential for biodiversity, mediated through the provision of ecosystem goods and services, to act
as a positive stimulus for the countries’ economy, create employment, and contribute to the
livelihood and welfare of the populations.
(a)
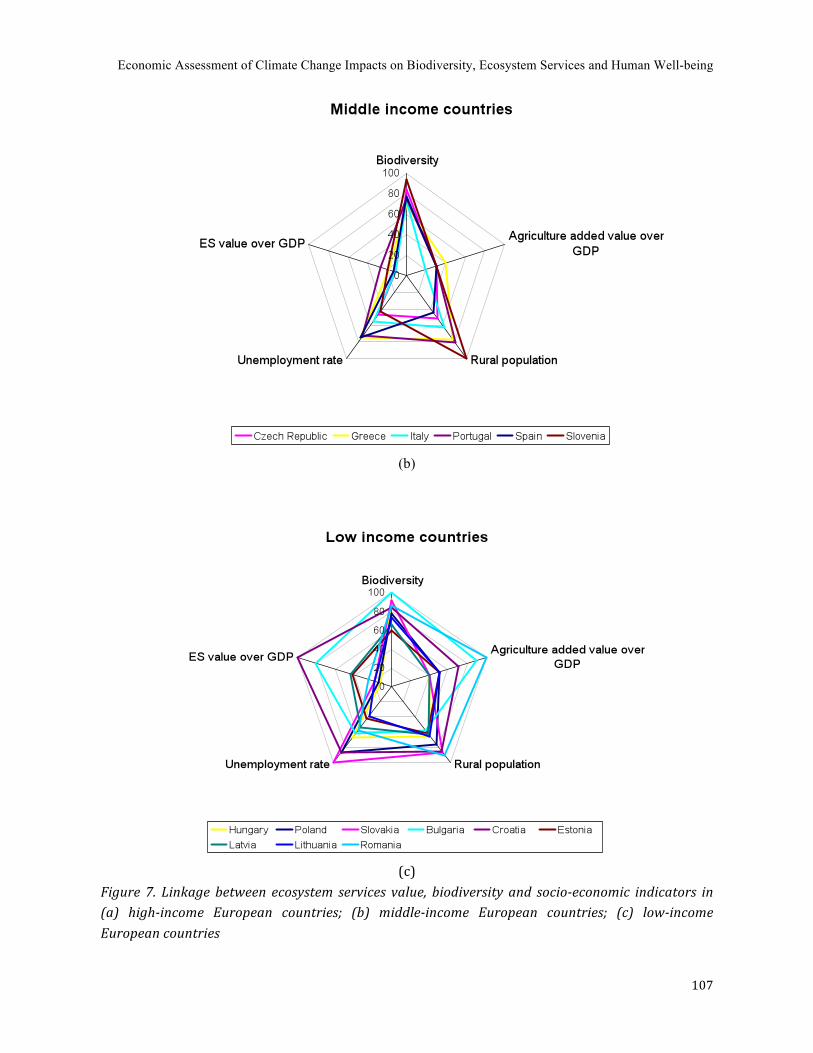
Economic Assessment of Climate Change Impacts on Biodiversity, Ecosystem Services and Human Well-being
107
(b)
(c)
Figure 7. Linkage between ecosystem services value, biodiversity and socioeconomic indicators in (a) highincome European countries; (b) middleincome European countries; (c) lowincome European countries
An Application to European Forest Ecosystems
108
(2) Vulnerable Rural Communities and Their Dependency on Biodiversity Because they are more highly dependent on the natural environment for the provision of food,
shelter, and income, rural poor communities are more vulnerable to environmental and socio‐
economic changes. Biodiversity loss and degradation in the provision of ecosystem services may
further aggravate the risk of social exclusion for such communities. Rural agricultural households
are particularly vulnerable, since their income may be expected to be more subject to variability
than, for instance, low‐income workers in urban areas. For this reason we focus in this section on
rural agricultural areas to investigate the link between the livelihood of the rural poor,
biodiversity and the provision of ecosystem services.
Among all NUTS2 regions in Europe, those with the highest density of agricultural land‐use were
selected, based on the land‐use patterns identified by the Corine land use map. For the calculation,
all the grid cells identified as “agricultural areas” in Corine were considered. These include arable
land (i.e., non‐irrigated, permanently irrigated and rice fields), permanent crops (i.e., vineyards,
olive groves, fruit trees and berry plantations), pastures, and heterogeneous agricultural areas
(i.e., annual crops associated with permanent crops, complex cultivation patterns, land principally
occupied by agriculture with significant areas of natural vegetation, and agro‐forestry areas).
Among regions with agricultural land‐use density of 70% or higher, the three NUTS2 regions with
the lowest and highest GDP per capita in 2007 – based on GDP per capita data referring to year
2007 from Eurostat – were selected in order to verify the existence of different patterns in their
dependence from biodiversity and ecosystem services. The three rural poor regions identified
with this procedure are: Del‐Alfold and Eszak‐Alfold in Hungary, and Lubelskie in Poland. In
addition, and for the sake of a running a comparative analysis, the three rural regions with highest
GDP per capita values among the regions with a strong agricultural land‐use density are also
selected. We refer to Southern and Eastern Ireland, Berkshire, Buckinghamshire and Oxfordshire
in the United Kingdom, and Groningen in the Netherlands. Table 3 summarizes the characteristics
of the selected NUTS2 regions, including the values of the socio‐economic, ecosystem service
value and biodiversity indicators.
The total value of ecosystem services in the selected NUTS2 regions was calculated multiplying
the average per‐hectare value in the country where the regions are located (as calculated in
Section 3) by the total area of respectively forests, wetlands and freshwater ecosystems. Coastal
recreation was not considered in this analysis since some of the regions are landlocked (Del‐

Economic Assessment of Climate Change Impacts on Biodiversity, Ecosystem Services and Human Well-being
109
Alfold, Eszak‐Alfold, Lubelskie, and Berkshire, Buckinghamshire and Oxfordshire) while the
remaining are not. The total area of forests and wetlands/freshwater ecosystems in each NUTS2
region was estimated based on the land‐use categories of Corine and with the procedure
previously described in Section 3. The value of the terrestrial biodiversity index in table 3 is the
average value in each of the considered NUTS2 regions.
Table 3. Indicators of socioeconomic condition, biodiversity richness and ecosystem services value in selected rural agricultural NUTS2 regions of Europe
NUTS2 region GDP per capita, 2005 (US$/person/year)
Employment in primary sector, 2006 (% of total employment)
Unemployment rate, 2007 (% of population aged 15 and over)
Biodiversity index
Forest ecosystem service value (% of GDP)
Wetlands/freshwater ecosystem service value (% of GDP)
Southern and Eastern (IE) 45,321 4.70 4.5 23.0 0.2 2.7 Berkshire, Buckinghamshire and Oxfordshire (UK) 43,269 1.19 4.0 40.4 0.1 0.0 Groningen (NL) 43,998 3.17 4.9 45.3 0.2 0.8 Lubelskie (PL) 9,773 35.86 9.5 77.1 4.2 0.8 Eszak‐Alfold (HU) 10,708 4.42 10.3 87.6 1.5 1.8 Del‐Alfold (HU) 11,388 9.38 10.8 82.8 1.7 1.9 The dependencies between the socio‐economic, biodiversity and ecosystem value indicators in
the selected rural regions are graphically visualized in Figure 8. Each of the axes in the spider
chart represents one of the indicators, with the values of the indicators standardized between 0
and 100.
Figure 8 shows that the contours of human livelihood, biodiversity and ecosystem service values
differ substantially between the two groups of regions, despite the fact that both groups represent
rural agricultural areas. In low‐income regions, both the employment in the primary sector as a
share of total employment and the overall unemployment rate are higher, suggesting that these
areas are particularly vulnerable to socio‐economic changes and environmental degradation. The
low employment rate in high‐income agricultural regions may be explained by the high level of
mechanization of agricultural practices in these areas. On the other hand, biodiversity levels are
substantially higher in low‐income regions and the value of forest ecosystem services is
particularly high when compared to the total GDP of these regions. This supports the hypothesis
that the economic structure of vulnerable rural regions of Europe – such as the selected low‐
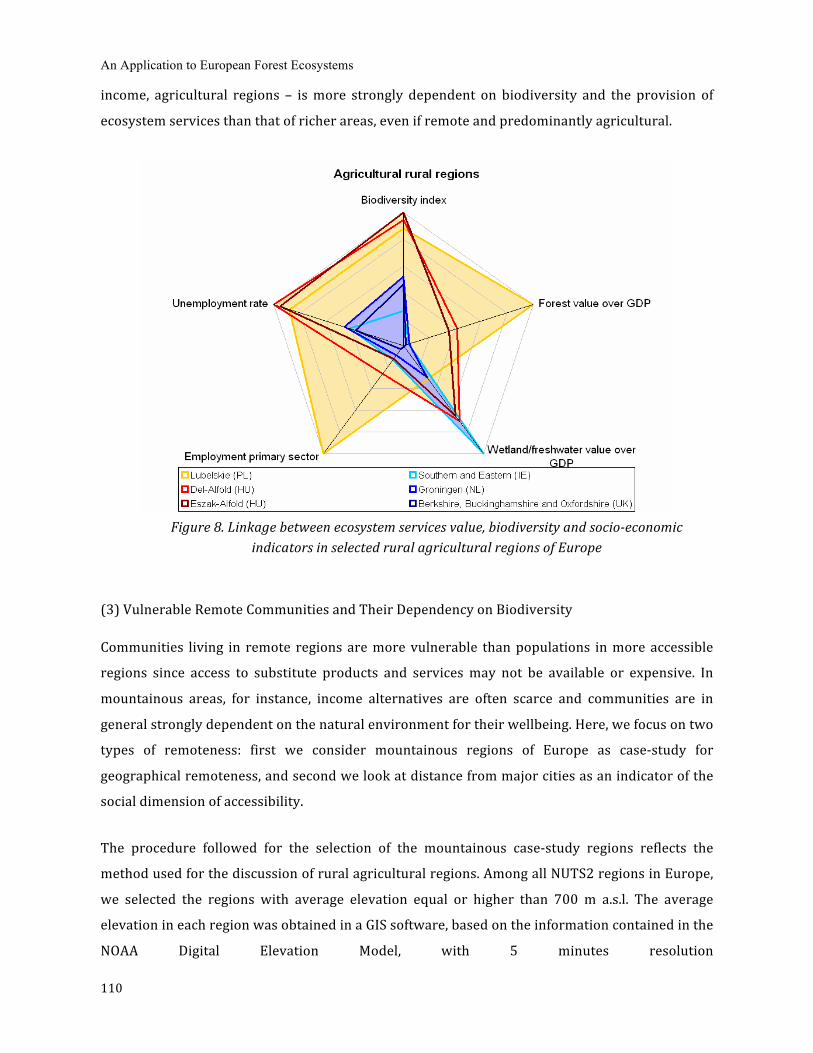
An Application to European Forest Ecosystems
110
income, agricultural regions – is more strongly dependent on biodiversity and the provision of
ecosystem services than that of richer areas, even if remote and predominantly agricultural.
Figure 8. Linkage between ecosystem services value, biodiversity and socioeconomic
indicators in selected rural agricultural regions of Europe (3) Vulnerable Remote Communities and Their Dependency on Biodiversity Communities living in remote regions are more vulnerable than populations in more accessible
regions since access to substitute products and services may not be available or expensive. In
mountainous areas, for instance, income alternatives are often scarce and communities are in
general strongly dependent on the natural environment for their wellbeing. Here, we focus on two
types of remoteness: first we consider mountainous regions of Europe as case‐study for
geographical remoteness, and second we look at distance from major cities as an indicator of the
social dimension of accessibility.
The procedure followed for the selection of the mountainous case‐study regions reflects the
method used for the discussion of rural agricultural regions. Among all NUTS2 regions in Europe,
we selected the regions with average elevation equal or higher than 700 m a.s.l. The average
elevation in each region was obtained in a GIS software, based on the information contained in the
NOAA Digital Elevation Model, with 5 minutes resolution
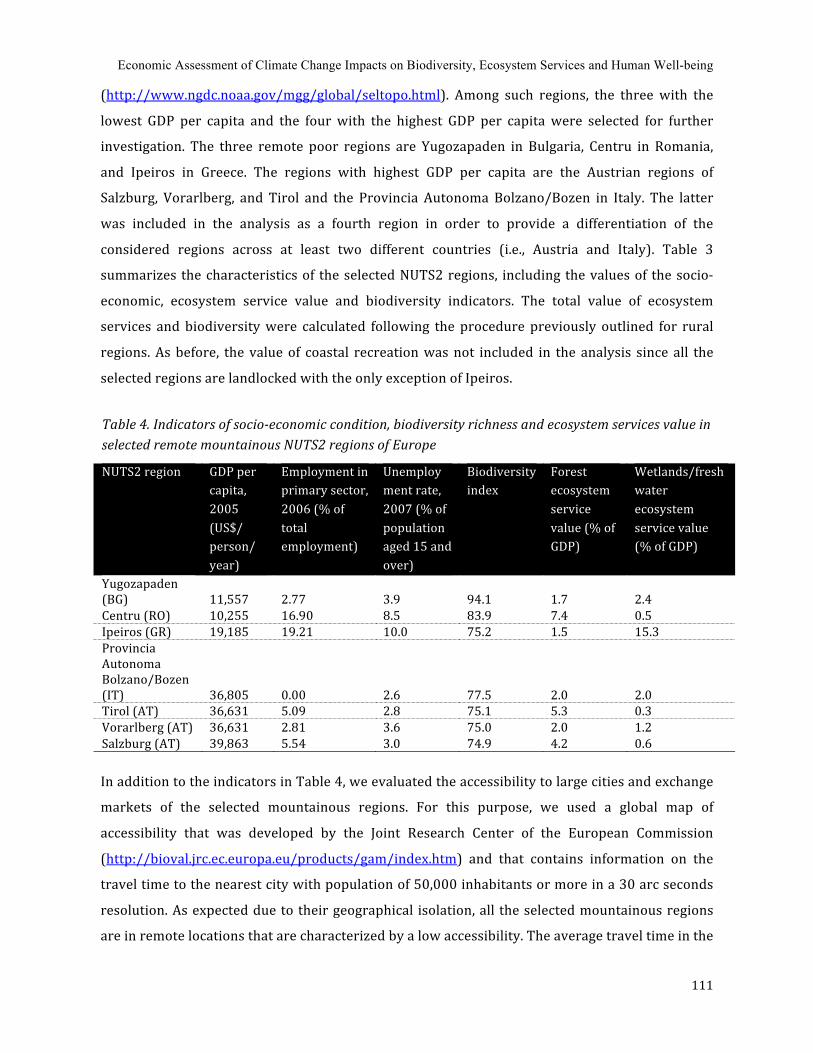
Economic Assessment of Climate Change Impacts on Biodiversity, Ecosystem Services and Human Well-being
111
(http://www.ngdc.noaa.gov/mgg/global/seltopo.html). Among such regions, the three with the
lowest GDP per capita and the four with the highest GDP per capita were selected for further
investigation. The three remote poor regions are Yugozapaden in Bulgaria, Centru in Romania,
and Ipeiros in Greece. The regions with highest GDP per capita are the Austrian regions of
Salzburg, Vorarlberg, and Tirol and the Provincia Autonoma Bolzano/Bozen in Italy. The latter
was included in the analysis as a fourth region in order to provide a differentiation of the
considered regions across at least two different countries (i.e., Austria and Italy). Table 3
summarizes the characteristics of the selected NUTS2 regions, including the values of the socio‐
economic, ecosystem service value and biodiversity indicators. The total value of ecosystem
services and biodiversity were calculated following the procedure previously outlined for rural
regions. As before, the value of coastal recreation was not included in the analysis since all the
selected regions are landlocked with the only exception of Ipeiros.
Table 4. Indicators of socioeconomic condition, biodiversity richness and ecosystem services value in selected remote mountainous NUTS2 regions of Europe
NUTS2 region GDP per capita, 2005 (US$/ person/ year)
Employment in primary sector, 2006 (% of total employment)
Unemployment rate, 2007 (% of population aged 15 and over)
Biodiversity index
Forest ecosystem service value (% of GDP)
Wetlands/freshwater ecosystem service value (% of GDP)
Yugozapaden (BG) 11,557 2.77 3.9 94.1 1.7 2.4 Centru (RO) 10,255 16.90 8.5 83.9 7.4 0.5 Ipeiros (GR) 19,185 19.21 10.0 75.2 1.5 15.3 Provincia Autonoma Bolzano/Bozen (IT) 36,805 0.00 2.6 77.5 2.0 2.0 Tirol (AT) 36,631 5.09 2.8 75.1 5.3 0.3 Vorarlberg (AT) 36,631 2.81 3.6 75.0 2.0 1.2 Salzburg (AT) 39,863 5.54 3.0 74.9 4.2 0.6 In addition to the indicators in Table 4, we evaluated the accessibility to large cities and exchange
markets of the selected mountainous regions. For this purpose, we used a global map of
accessibility that was developed by the Joint Research Center of the European Commission
(http://bioval.jrc.ec.europa.eu/products/gam/index.htm) and that contains information on the
travel time to the nearest city with population of 50,000 inhabitants or more in a 30 arc seconds
resolution. As expected due to their geographical isolation, all the selected mountainous regions
are in remote locations that are characterized by a low accessibility. The average travel time in the
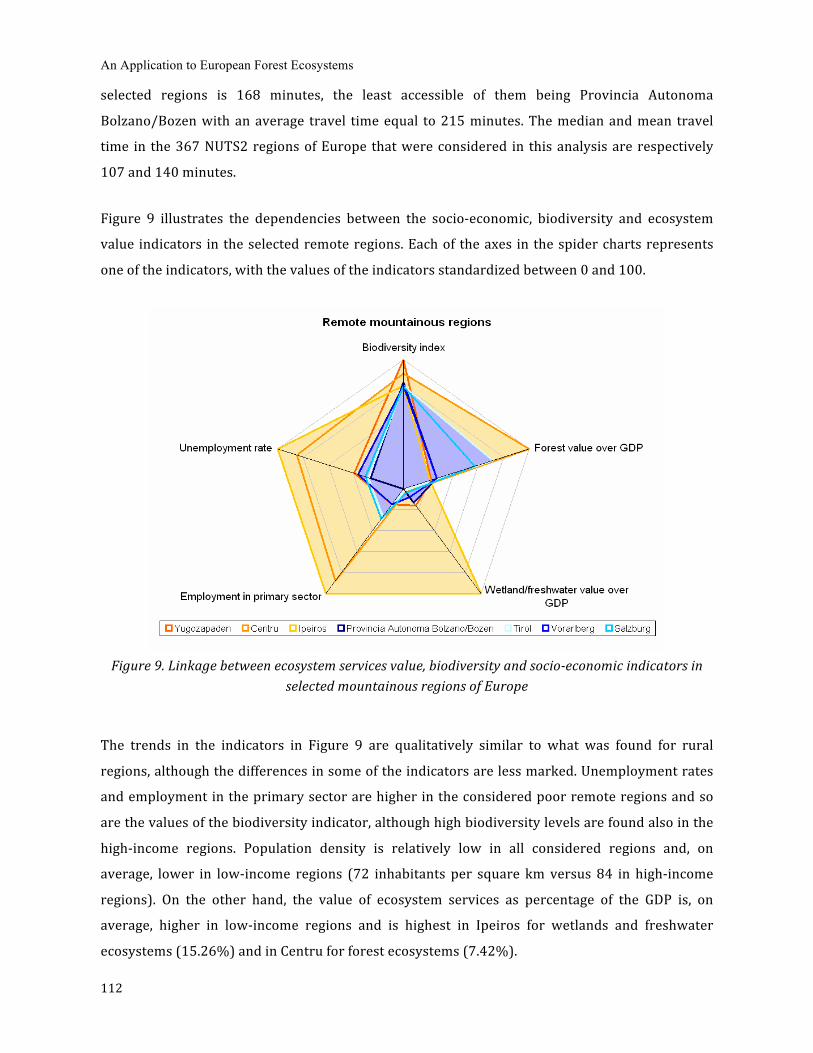
An Application to European Forest Ecosystems
112
selected regions is 168 minutes, the least accessible of them being Provincia Autonoma
Bolzano/Bozen with an average travel time equal to 215 minutes. The median and mean travel
time in the 367 NUTS2 regions of Europe that were considered in this analysis are respectively
107 and 140 minutes.
Figure 9 illustrates the dependencies between the socio‐economic, biodiversity and ecosystem
value indicators in the selected remote regions. Each of the axes in the spider charts represents
one of the indicators, with the values of the indicators standardized between 0 and 100.
Figure 9. Linkage between ecosystem services value, biodiversity and socioeconomic indicators in
selected mountainous regions of Europe The trends in the indicators in Figure 9 are qualitatively similar to what was found for rural
regions, although the differences in some of the indicators are less marked. Unemployment rates
and employment in the primary sector are higher in the considered poor remote regions and so
are the values of the biodiversity indicator, although high biodiversity levels are found also in the
high‐income regions. Population density is relatively low in all considered regions and, on
average, lower in low‐income regions (72 inhabitants per square km versus 84 in high‐income
regions). On the other hand, the value of ecosystem services as percentage of the GDP is, on
average, higher in low‐income regions and is highest in Ipeiros for wetlands and freshwater
ecosystems (15.26%) and in Centru for forest ecosystems (7.42%).
Economic Assessment of Climate Change Impacts on Biodiversity, Ecosystem Services and Human Well-being
113
In general, the results for remote mountainous regions support the previous findings for rural
areas in the sense that they confirm that poor communities are more reliant on ecosystem
services and biodiversity than less vulnerable ones. The comparison with rural regions, however,
highlights how remote mountainous regions are more homogeneous in terms of biodiversity
levels, population density and ecosystem service values.
5.5 Conclusions and Policy Recommendations for the EU
In this paper, we have shown that the correlation between biodiversity, ecosystem services and
the security of human livelihoods is complex and extremely varied across different economies. A
spatial mapping of selected indicators of biodiversity, ecosystem services and human livelihoods
demonstrates that large disparities exist in the degree of dependency on ecosystem services and,
subsequently, in the levels of vulnerability to changes in or losses of biodiversity and the
respective impacts in the provision of ecosystem services. There is also an imbalance for those
most affected by, yet least able to respond to, the loss of ecosystem goods and services as well as
the inequality in the global distribution of derived benefits. Notwithstanding the direction of
causalities, it is the poorer segments of society that are both assumed to be most vulnerable to,
and affected by, biodiversity degradation.
Our results show that the composition of the ecosystem service value for the selected European
countries, calculated as percentage of GDP, vary across different countries and, more importantly
vary among country‐income categories, including high‐income, medium‐income and low‐income
categories. Among high‐income countries, Finland and Sweden show the highest value of
ecosystem services with respect to the national GDP. This is partly due to the large total area of
wetland and freshwater ecosystems in these countries, which, despite the low per‐hectare values.
Secondly, the value of forest provisioning services in Sweden and Finland are particularly high,
reflecting the fact that forestry is a widely practiced activity in these countries. In middle‐income
countries, relatively high values of forest ecosystems are found in countries that are landlocked or
with a short coastline, such as the Czech Republic and Slovenia, while in the remaining countries
high values are provided by wetlands and freshwater ecosystems and coastal recreation. In low‐
income countries, ecosystem service values tend to be high particularly for forests and, in Bulgaria
and Croatia, wetlands and freshwater ecosystems. The high values of wetlands and freshwater
ecosystems in Bulgaria and Croatia reflects the relatively high per‐hectare values and the low GDP
in those countries.

An Application to European Forest Ecosystems
114
The paper also explored the relationship between ecosystem services, biodiversity and income‐
related vulnerability in more detail within Europe. First, we focus our analysis in rural agricultural
areas and investigate the link between the livelihood of the rural poor, biodiversity and the
provision of ecosystem services. In this context, we proposed to identify the possibility contours,
which we define as social vulnerability contours maps, that relate human livelihoods, biodiversity
richness and the level of ecosystem services. Among the three income categories, the narrowest
boundaries are found in high‐income countries. With the exception of Austria, France and
Switzerland, the biodiversity levels are lower than the average values in middle and low‐income
countries. Moreover, the contribution of agricultural activities to the countries’ economy is
generally low, with the exception of Finland, where agriculture added value accounts for 3% of
the GDP and 37% of the population lives in rural areas. In addition, ecosystem service values
generally provide a small contribution to the economy of high‐income countries, with the notable
exception of Sweden and Finland where they account for 14% and 11% of the country’s GDP. In
middle‐income countries one can notice an enlargement of the boundaries, with the added value
of agriculture, rural population and biodiversity levels increasing compared to high‐income
countries. On the contrary, the largest possibility contours are found however in low‐income
countries where the highest levels of agricultural added value (10% in Romania), unemployment
rate (11.1% in Slovakia) are found, suggesting a higher vulnerability of these economies to socio‐
economic and environmental shocks. Significantly, the highest values of biodiversity (91.3 in
Bulgaria) and ecosystem service value over GDP (30% in Croatia) are also found in low‐income
economies. This suggests a large potential for biodiversity, mediated through the provision of
ecosystem goods and services, to act as a positive stimulus for the countries’ economy, create
employment, and contribute to the livelihood and welfare of the populations.
Second, we focused our attention in a more explicit spatial scale and investigate the all NUTS2
regions in Europe with the highest density of agricultural land‐use. For the calculation, all the grid
cells identified as “agricultural areas” in Corine were considered, including arable land (i.e., non‐
irrigated, permanently irrigated and rice fields), permanent crops (i.e., vineyards, olive groves,
fruit trees and berry plantations), pastures, and heterogeneous agricultural areas (i.e., annual
crops associated with permanent crops, complex cultivation patterns, land principally occupied by
agriculture with significant areas of natural vegetation, and agro‐forestry areas). Among regions
with agricultural land‐use density of 70% or higher, the three NUTS2 regions with the lowest and
highest GDP per capita in 2007 were selected. The three rural poor regions identified are Del‐
Economic Assessment of Climate Change Impacts on Biodiversity, Ecosystem Services and Human Well-being
115
Alfold and Eszak‐Alfold in Hungary, and Lubelskie in Poland. In addition, and for the sake of a
running a comparative analysis, the three rural regions with highest GDP per capita values among
the regions with a strong agricultural land‐use density are also selected. We refer to Southern and
Eastern Ireland, Berkshire, Buckinghamshire and Oxfordshire in the United Kingdom, and
Groningen in the Netherlands. The dependencies between the socio‐economic, biodiversity and
ecosystem value indicators in the selected rural regions differ substantially between the two
groups of regions, despite the fact that both groups represent rural agricultural areas. In low‐
income regions, both the employment in the primary sector as a share of total employment and
the overall unemployment rate are higher, suggesting that these areas are particularly vulnerable
to socio‐economic changes and environmental degradation. The low employment rate in high‐
income agricultural regions may be explained by the high level of mechanization of agricultural
practices in these areas. On the other hand, biodiversity levels are substantially higher in low‐
income regions and the value of forest ecosystem services is particularly high when compared to
the total GDP of these regions. This supports the hypothesis that the economic structure of
vulnerable rural regions of Europe – such as the selected low‐income, agricultural regions – is
more strongly dependent on biodiversity and the provision of ecosystem services than that of
richer areas, even if remote and predominantly agricultural.
Finally, we also investigate the role of biodiversity in the definition of social vulnerability contours
maps by focusing our analysis in rural communities living in remote regions. Here, we focus on
two types of remoteness: first we consider mountainous regions of Europe, as case‐study for
geographical remoteness, and second we look at distance from major cities as an indicator of the
social dimension of accessibility. The results for remote mountainous regions support the
previous findings, and respective social vulnerability contours maps, for rural areas in the sense
that they confirm that poor communities are more reliant on ecosystem services and biodiversity
than less vulnerable ones. The comparison with rural regions, however, highlights how remote
mountainous regions are more homogeneous in terms of biodiversity levels, population density
and ecosystem service values. However, unemployment rates and employment in the primary
sector are higher in the considered poor remote regions and so are the values of the biodiversity
indicator, although high biodiversity levels are found also in the high‐income regions. Finally,
population density is also lower in all considered regions and lower, on average, among the low‐
income regions. Communities living in regions with higher distances from major cities were also
found to be more vulnerable than populations in more accessible regions. This is largely due to
their lack of access to or the prices and affordability of substitute products and services. Isolation
An Application to European Forest Ecosystems
116
additionally limits coping strategies to deal with a deterioration of environmental services.
Further, the location of rural households affects their potential to access markets or other sources
of income from off‐farm employment opportunities in neighboring urban areas.
Our finding confirms the earlier assumption that a biodiversity rich area is generally associated
with a higher dependence on biodiversity and the provision of ecosystem services, which suggests
that the local communities are more vulnerable to changing environment and losing biodiversity.
Based on our definition of vulnerability and the socio‐economic indicators used, people in low‐
income EU countries are more vulnerable than those in medium‐ and high‐income countries. The
following statistics are for the values of all of the socio‐economic indicators in firstly high and then
secondly low income countries: unemployment increased from 5.3 to 7.3%, rural percentage of
the population from 22 to 37% and dependence of GDP from the agricultural sector from 1.5 to
5.9%. Ecosystem services account for 11.8% of the GDP in low‐income countries in comparison
with 3.6% for high‐income countries. Specifically, the highest levels of agricultural added value
(10% in Romania), unemployment rate (11.1% in Slovakia), biodiversity value (91.3 in Bulgaria)
and ecosystem service value over GDP (30% in Croatia) were found in low‐income countries,
illustrating that the high levels of biodiversity could offer opportunities, if well managed, to
improve the situation. Communities living in remote regions were also found to be more
vulnerable than populations in more accessible regions. This is largely due to their lack of access
to or the prices and affordability of substitute products and services. Isolation additionally limits
coping strategies to deal with a deterioration of environmental services. Further, the location of
rural households affects their potential to access markets or other sources of income from off‐
farm employment opportunities in neighboring urban areas.
Therefore, the complex linkages and trade‐offs between biodiversity, ecosystem services,
employment and the impacts on vulnerable groups do not allow for one single simple policy
approach (no silver bullet!) to improve conditions both for nature and people. Moreover, the
social aspects of biodiversity are not addressed by a specific policy, but rather constitute cross‐
cutting issues that affect a wide range of policies on different scales. Many other studies have
shown that the protection of biodiversity and ecosystems cannot be restricted to nature
protection policies only, but instead have to be mainstreamed across different policies and
sectors. By expanding the scope to include the even more complex interactions between
biodiversity and the enhancement of jobs and of livelihoods in vulnerable areas, the range of
relevant policies becomes even larger.
Economic Assessment of Climate Change Impacts on Biodiversity, Ecosystem Services and Human Well-being
117
Recent debate in the European Commission placed increased emphasis on the importance of
green infrastructure for multi benefits to the economy27. Green infrastructure can be defined as
the distribution of natural capital that benefits society through the provision of ecosystem
services (TEEB, 2010), which may take the form of climate regulation, water purification, and
space for recreation. Green infrastructure is likely to become a key component of the delivery of
the new biodiversity target for 2020, and could play a decisive role in integrating biodiversity into
other policies such as agriculture, forestry, water, transport and regional and cohesion policy28, as
it demonstrates the contribution that biodiversity can make to these policy areas. The debate has
important implications for biodiversity as the provision of the services relies on the ecosystems
being in good condition requiring intervention to ensure they are of an appropriate size, condition
and not impacted by fragmentation.
In addition, EU regional policy aims to reduce the gaps in well‐being between regions and ensure
coherent and fair economic development within the EU. The policy is financed through structural
funds and the cohesion fund and constitutes 35% of the EU budget for the spending period 2007‐
2013 (€348 billion) 29 . The funds finance a variety of measures, including transportation
infrastructure, urban regeneration and rural development. While activities can cause significant
deterioration of biodiversity through the fragmentation of landscapes and habitats (Kettunen et
al, 2007), the funds provide important funding opportunities for biodiversity conservation such as
the development of infrastructure linked to biodiversity and investments in Natura 2000. Projects
must, however, demonstrate a contribution to the broader sustainable socio‐economic
development of the region in which they are based. Indeed, the prevention of environmental risks
is one of the priorities of structural funds, offering the possibility for funding actions to maintain
or restore the capacity of ecosystems to mitigate flooding, wild fires and drought risks (Kettunen
et al, 2009). In other cases, opportunities exist for the investment in facilities to promote nature‐
based tourism, with potential positive impacts on economic development of disadvantaged areas
and on biodiversity (see EEA, 2009).
Despite these opportunities, uptake of measures supporting biodiversity under structural and
cohesion funds have been limited. This can be partly attributed to the bureaucracy and
administration burden of accessing the funds (Torkler et al, 2008) and the lack of absorption 27‘EC workshop: towards a green infrastructure for Europe’, March 2009. Workshop proceedings are available at: http://www.green-infrastructure-europe.org/ 28 http://ec.europa.eu/environment/nature/info/pubs/docs/greeninfrastructure.pdf 29 http://europa.eu/scadplus/glossary/structural_cohesion_fund_en.htm
An Application to European Forest Ecosystems
118
capacity in recipient regions to utilise the funds (EEA, 2009). An additional issue is that the
decision on how the funds are to be spent is made entirely at Member State level, which means
that despite the opportunities that exist to fund biodiversity and social cohesion projects, there is
no means at the EU level to ensure this happens. Moving forward, DG REGIO is likely to align the
Cohesion fund more with the priorities of Europe 2020, which could have a negative impact for
biodiversity which does not feature in the strategy (McConville and Gantioler, 2010).
The next financing period (2013‐2019) still provides an opportunity to ensure that regional policy
has a positive impact on biodiversity and social cohesion but it will require changes to the current
financing process. This may include, as implemented in Austria, that structural funds should have
no net negative impact on the environment (EEA, 2009). In addition, there could be clear ear‐
marking a proportion of the funds for the financing of biodiversity within the funds and there may
be opportunities for increasing the Commission’s oversight of the national implementation of the
funds to ensure better allocation of financial support towards biodiversity. Ultimately, there will
have to be a stronger case made for the ecosystem service benefits provided by nature, the
protection of which may come from the mainstreaming of green infrastructure approaches to land
management.
Economic Assessment of Climate Change Impacts on Biodiversity, Ecosystem Services and Human Well-being
119
CHAPTER 6 CONCLUSIONS
The dissertation constituted four research papers that have been presented in chapter 2, chapter
3, chapter 4 and chapter 5, corresponding to the four objectives set out earlier in Chapter 1. This
final chapter draws together the main conclusions by providing a summary of the findings of each
chapter in Section 6.1. Section 6.2 discusses the policy implications of the findings. Section 6.3
points out the limitations of the present study and sets out some ideas for future research in this
area.
6.1 Research Conclusions Chapter 2: Valuing the Climate Change Impacts on European Forest Ecosystems into the Future.
[Methodology]
This paper reported an original economic valuation of climate change impacts on forest
ecosystem goods and services that biodiversity underpinned. On the one hand, we provided a
comprehensive classification and mapping of the different European countries according to their
contribution in the supply of forest goods and services. The proposed analysis was anchored in
the well‐known classification proposed by the MA approach. On the other hand, we investigated
the role of each country in detail, providing forest provisioning services, regulating services and
cultural services.
In order to value the climate change impacts, we first identified four different climate scenarios,
which are referred to the A1FI, A2, B1 and B2 scenarios, corresponding to the four IPCC
storylines, and evaluated here to the year 2050. Secondly, we proceeded with the analysis and
evaluation of climate change impacts on the total forest area (for each country), as well as, on the
provisioning quantities (in bio‐physical terms) across all forest goods and services under
consideration. The projections of future trends of forest areas and the provision of wood forest
products in 2050, in terms of four IPCC storylines, were derived from climate models, including
HadCM3, and simulating the response of the global climate system to increase greenhouse gas
concentrations. Moreover, considerable impacts of differentiated latitudes on the variability of
forest EGS were taken into account by carefully regrouping the 34 selected countries located in
different latitude intervals. As a consequence, it enabled us not only to identify the respective
forest productivity related to predominant forest types situated in each latitude interval, but also
An Application to European Forest Ecosystems
120
to assess and compare the sensitivity of the differentiated forest types in response to climate
change impacts. Both of these aspects have been considered when projecting the future trends of
forest area and forest product flows by 2050, in terms of the four IPCC storylines. Finally, we
applied various economic valuation methods (including market and non‐market valuation
methods, primary and value transfers methods) to estimate the values of the three MA service
categories involved, i.e. the provisioning services, regulating services and cultural services
provided by European forests.
[Results]
The obtained results suggest that the impact of the climate change on biodiversity, and its welfare
evaluation in terms of the respective changes on the provision of forest ecosystem goods and
services, is multifaced. First, it depends on the nature of the forest good and service under
consideration, with carbon sequestration ranked as the most valuable service. Moreover, cultural
values reveal to be more sensitive to the four IPCC scenarios than the values of other ecosystem
services, while the wood forest products as the most resilient to climate change. Second, the
distributional impacts of climate change on the provision of these goods and services also depend
on the geo‐climatic regions under consideration. In other words, these impacts are not distributed
uniformly across the European countries under consideration. Third, the choice of future
development path has an essential role in regulating future climate and determining the values of
various ecosystem goods and services. The B‐type scenarios (the most sustainable sound future
scenarios), in particular the B1 scenario, are found associated with the highest levels of provision
in all of the ecosystem services under consideration, i.e. wood products, carbon sequestration and
cultural services. For example, our results show that cultural services provided by forest
ecosystems have their highest levels in the Mediterranean countries, ranging from 8.4 to 9.0
billion dollars, respectively, in the B2 and B1 scenarios, to 3.9 to 4.8 billion dollars, in the A1 and
A2 scenarios.
Moreover, by conducting a comparative analysis of the future IPCC scenarios, we are able to
compare the welfare impacts resulted from different assumptions on a number of factors that
impose pressures on forest ecosystems, including economic growth, mounting population and
climate change. For example, the Mediterranean Europe can assist to a welfare gain amounting to
an 86% increase in the cultural values when moving from an A2 scenario (regional economic
scenario ‐ the baseline) towards a B2 scenario (regional sustainable scenario). This is followed by
an increase of 45% in the value of the carbon sequestration services and a 24% increase in the
value of the wood provision services. In other words, not adopting a B2 storyline, but instead
Economic Assessment of Climate Change Impacts on Biodiversity, Ecosystem Services and Human Well-being
121
moving towards an A2 scenario, will be associated to a high welfare loss in Mediterranean Europe
owing to the reduced quantity and quality of the forest ecosystem services under consideration.
Alternatively, moving from an A2 scenario towards an A1 (global economic scenario) scenario will
always involve a welfare loss for Mediterranean Europe. In short, Mediterranean Europe
scenarios will always be associated to a reduced quantity and quality of forest ecosystem services
and thus, result in loss of human welfare. On the contrary, storyline B1 (global sustainable
scenario) is ranked as the most preferred scenario for this geo‐climatic area.
All in all, the estimated economic magnitudes of climate change impact on forest ecosystems
contribute to a better understanding of the potential welfare losses across different regions and to
the identification of winners and losers as a result of future climate change. In addition, they can
also improve the existing numerical estimation of the total costs of climate change to human
society, by counting for not only the reduced productivity and revenues in relevant economic
sectors, but also the lost economic values due to biodiversity extinction and ecosystem
degradation. These therefore have very important policy implications to reallocate resources
among Europe countries to cope with the continuous climate change.
Chapter 3: When Micro and MacroEconomics Meet together to Reveal the True Value of Climate
Change Impact, Conflicts or Complement?
[Methodology]
This paper explored the potential to incorporate micro‐ and macro‐ economic analysis in the
estimation of the socio‐economic impacts of climate change‐induced changes in biodiversity and
ecosystems. Biodiversity and ecosystem services were interpreted as important components of
the world economic system. In this study, we tried to incorporate ecosystem services into a macro
economic mechanism, where the world economy was assessed by a set of computable general
equilibrium (CGE) models. Within this framework, changes in carbon sequestration provided by
European forests were incorporated into a CGE model through a global warming approach, which
allowed the consideration of climate change impacts on forest carbon sequestration services and
to re‐compute a temperature equivalent induced by the higher release of CO2 emissions in the
atmosphere resulting from climate change. On the basis of this new information, we then re‐
estimated all of the climate change impacts considered using the CGE model and recalculated new
macro‐regional GDP effects. The differences between climate change impacts on GDP considering
the original and the new carbon sequestration levels were used as an approximation of the
general equilibrium value of the changes in the European forest carbon sequestration service.
An Application to European Forest Ecosystems
122
This innovative approach allowed us to explore the scaling‐up potential of regional climate change
impacts on biodiversity and ecosystem services and to identify the winners and losers of climate
change impacts at a larger geographic scale.
[Results]
In summary, the present estimation GDP value estimates confirm that (1) climate change brought
along significant welfare impacts, (2) biodiversity and ecosystem services played an important
role in the determination of the final welfare magnitudes, and (3) not all European countries
would have identical impacts, some countries might lose more than others, and some countries
might gain, depending on their geographical location, the existing markets and profile with
respect to biodiversity indicators and land use patterns. Therefore understanding the magnitudes
of welfare impacts is important for results in the design of any climate‐mitigation, or adaptation,
policies.
However, it is important to note that our study only signals the tip of the iceberg, for the present
analysis only focused on biodiversity anchored in a single ecosystem type, i.e. forest ecosystem,
and considered only a single ecosystem service produced by forests, carbon sequestration. If
taking into account (1) the 34 European countries and (2) the sequestration services from forests
alone, climate‐change‐cause impacts on biodiversity and ecosystem services are responsible for
welfare loss amounting to 85 billion USD$. If we consider the World Bank’s global ranking with
respect to GDP per capita, this amount corresponds to the aggregated GDP of the 22 poorest
countries, which constitute 13% of the totality of world countries. Nonetheless, if we also add (3)
the biodiversity productivity effects on the agricultural sectors, (4) freshwater and coastal
ecosystems, the total loss in GDP terms will be much higher. These results lead to the main
conclusion that autonomous adaptation cannot be invoked as the solution to climate change, but
needs to be addressed with proper mitigation and planned adaptation strategies.
Moreover, we should also recognize the dynamic aspect of ecosystem changes in response to
direct and indirect socio‐economic drivers, Today, Europe, along with many other countries,
experiences the growing pressures from population growth, changing diets, urbanization, and
climate change, which are causing continuous ecosystem degradation and biodiversity decline. In
return, the changes in biodiversity and ecosystem cannot directly affect only our economic
system, but also the capacity of natural ecosystems to mitigate and adapt to further climate
change. These are externalities have already been impacting the conventional economic systems.
Therefore, fully assessing the costs of these externalities, in particular the costs of losing
biodiversity are important for the design of effective policy instruments to correct the failed
Economic Assessment of Climate Change Impacts on Biodiversity, Ecosystem Services and Human Well-being
123
market signals and to fully incorporate the costs of climate change into the economic mechanism.
This way will enable us to prevent from further resource degradation and fight against climate
change.
Chapter 4: Modelling the links between biodiversity, ecosystem services and human wellbeing in the
context of climate change: results of an econometric exercise to the European forests.
[Methodology]
This paper attempted to model the relationships between climate change, biodiversity and the
value of ecosystem services with a specific emphasis on the climate change included biodiversity
effects in European forests. The research began with the construction of a composite biodiversity
indicator that integrated quantitative and qualitative changes of biodiversity projected under
different future climate scenarios. This indicator incorporated in‐depth socio‐economic reasons of
biodiversity changes, along with climate change impacts was expected to be a simple but
comprehensive biodiversity measure to analyze the climate change induced biodiversity effects
and the resulting socio‐economic impacts. In the present study, we tried to make the best use of
existing data released by a large number of IPCC data distribution centers, regarding the projected
trends of population growth, economic development, future species richness and increase in local
temperature under different future climate scenarios. Values of ecosystem services were derived
from a most recent assessment study on the climate change impacts on forest ecosystems in
Europe (Ding et al. 2010). Furthermore, the paper explored the use of 3SLS regression to
simultaneously estimate (1) the determinants of economic value of ecosystem services; (2) the
determinants of land‐use changes (i.e. the changes of forest‐land cover); (3) the determinants of
changes in biodiversity. The investigation was conducted first in a baseline model, where a global
effect of climate change was considered, followed by regressing a modified model, in which the
regional effects of climate change impacts were counted for.
[Results]
In summary, the results of the present research suggest that a composite biodiversity indicator,
integrating information about changes in species and habitats, can serve as a better option than
the individual biodiversity indicators for measuring and predicting the trends of biodiversity
changes in response to a set of climate and socio‐economic drivers in different future climate
change scenarios. For instance, in the present study, the average score of future biodiversity
status (reflecting either improvement or degradation of biodiversity) is derived from the
An Application to European Forest Ecosystems
124
projected future trends of four different species, i.e. tree, plant, bird and herptile as well as the
changes in forest habitats under different future climate scenarios, therefore the composite
biodiversity indicator indicates an overall improvement or degradation of the forest ecosystems
in each of the 17 EU member states in a climate change context. In this context, we are more
confident to use this indicator to describe and measure the health of forest ecosystems under
different climate conditions and to analyze the respective changes in its capacity of delivering
ecosystem goods and services. Moreover, the structure of the composite biodiversity indicator is
so simple that it can be easily used for communicating with policymakers and the broader
audience.
Moreover, our results from the 3SLS regression suggest that rising temperature negatively affects
biodiversity and ecosystem conditioning at an accelerating rate across geo‐climatic regions in the
future. In addition, we also found a strong relationship between temperature and the value of
ecosystem services, but the direction of this relationship depends on the type of ecosystem
services under consideration. That is to say, every 1ºC increase in temperature will contribute
proportionally to the changes of the value of ecosystem services. Independent from the
consideration of spatial effects of climate change, rising temperature is found positively impacting
the value of provisioning and regulating services, but negatively related to the cultural services.
Furthermore, the spatial effect of climate change induced biodiversity changes is captured, by
introducing a cross‐effect between biodiversity and temperature in the model.
All in all, our results show that biodiversity and temperature can perform together as either
“complimentary” or “substitute” factors to affect the supply as well as the value of certain types of
ecosystem goods and services. For example, in the case of provisioning services provided by
Mediterranean forests, we find a clear “complementary” effect between biodiversity and
temperature. Our results suggest that the negative impacts of climate change on biodiversity will
go against the positive direct climate change impact on the Mediterranean forests, and thus
generate a net negative impact on total value of provisioning services in the future. More
specifically, biodiversity loss caused by increment of 1ºC in the temperature is responsible for at
least 49% in every one‐dollar reduction of the value of forest provisioning service in the
Mediterranean forests. Whereas the substitute effect between biodiversity and temperature refers
that climate change induced biodiversity effects on EGS may attenuate/decrease the negative
direct climate change impact in some regions, where biodiversity plays a key role in mitigating the
those negative impacts of climate change. For instance, this is clear for the cultural services
provided by the Mediterranean forests, in which the reduction of 1ºC in the temperature is
Economic Assessment of Climate Change Impacts on Biodiversity, Ecosystem Services and Human Well-being
125
responsible for half of every 1% improvement of biodiversity indicator score. The latter will
consequently contribute to nearly 28% of every additional one‐dollar value generated in the
cultural services provided by Mediterranean forests. Similar result is found also for the regulating
services in the region, where biodiversity richness is expected to have a significant role in
determining the respective values.
Chapter 5: The social dimension of biodiversity policy in the European Union: valuing the
biodiversity benefits to vulnerable groups
[Methodology]
This paper explored the use of spatial mapping tools, such as Geographic Information Systems
(GIS) to explore the social dimension of biodiversity policy, so as to identify and analyze the
strength of the linkage between biodiversity and human livelihoods at different geographic
locations. Our analysis focused on a European scale, where biodiversity and ecosystem benefits
have been well studied for many ecosystems and concentrates in particular on forest, coastal and
wetland ecosystems both at country level and downscaled to a higher geographical resolution.
Moreover, the data on socio‐economic and biodiversity conditions of the countries under
consideration were also well documented in the literature. These three types of information were
mapped in a spatial gradient. The results of this study could provide important insights for the EU
policymakers to design potential policy instruments that could on the one hand promote
biodiversity conservation and prevent natural resources from degradation, and on the other hand
contribute to social stability and human livelihoods (e.g. increased number of jobs in the
protected area and/or ecosystem‐related economic activities).
[Results]
The results of this paper show that the correlation between biodiversity, ecosystem services and
the security of human livelihoods is complex and extremely varied across different economies. A
spatial mapping of selected indicators of biodiversity, ecosystem services and human livelihoods
demonstrates that large disparities exist in the degree of dependency on ecosystem services and,
subsequently, in the levels of vulnerability to changes in or losses of biodiversity and the
respective impacts in the provision of ecosystem services. There is also an imbalance for those
most affected by, yet least able to respond to, the loss of ecosystem goods and services as well as
the inequality in the global distribution of derived benefits. Notwithstanding the direction of
causalities, it is the poorer segments of society that are both assumed to be most vulnerable to,
and affected by, biodiversity degradation.
An Application to European Forest Ecosystems
126
Our results also show that the compositions of the ecosystem service value for the selected
European countries, calculated as percentage of GDP, vary across different countries and, more
importantly vary among country‐income categories, including high‐income, medium‐income and
low‐income categories. Among high‐income countries, Finland and Sweden show the highest
value of ecosystem services with respect to the national GDP. In middle‐income countries,
relatively high values of forest ecosystems are found in countries that are landlocked or with a
short coastline, such as the Czech Republic and Slovenia, while in the remaining countries high
values are provided by wetlands and freshwater ecosystems and coastal recreation. In low‐
income countries, ecosystem service values tend to be high particularly for forests and, in Bulgaria
and Croatia, wetlands and freshwater ecosystems. The high values of wetlands and freshwater
ecosystems in Bulgaria and Croatia reflect the relatively high per‐hectare values and the low GDP
in those countries.
Furthermore, our analysis in rural agricultural areas suggests that among the three income
categories, the narrowest boundaries are found in high‐income countries. For example, the
contribution of agricultural activities as well as ecosystem services to the countries’ economy is
generally low in high‐income countries, with the exception of Finland and Sweden. In middle‐
income countries one can notice an enlargement of the boundaries, with the added value of
agriculture, rural population and biodiversity levels increasing compared to high‐income
countries. On the contrary, the highest values of biodiversity (91.3 in Bulgaria) and ecosystem
service value over GDP (30% in Croatia) are found in low‐income economies. This suggests a large
potential for biodiversity, mediated through the provision of ecosystem goods and services, to act
as a positive stimulus for the countries’ economy, create employment, and contribute to the
livelihood and welfare of the populations. Moreover, our results show that in low‐income regions,
both the employment in the primary sector as a share of total employment and the overall
unemployment rate are higher, along with substantially high biodiversity levels and higher share
of the value of forest ecosystem services in the total GDP of these regions. This supports the
hypothesis that the economic structure of vulnerable rural regions of Europe – such as the
selected low‐income, agricultural regions – is more strongly dependent on biodiversity and the
provision of ecosystem services than that of richer areas, even if remote and predominantly
agricultural. Finally, the results for remote mountainous regions support the previous findings
that poor communities are more reliant on ecosystem services and biodiversity than less
vulnerable ones. The comparison with rural regions, however, highlights how remote
mountainous regions are more homogeneous in terms of biodiversity levels, population density
and ecosystem service values.
Economic Assessment of Climate Change Impacts on Biodiversity, Ecosystem Services and Human Well-being
127
6.2 Policy Implications
This doctoral dissertation is inspired by the major environmental and socio‐economic challenges
faced by biologists, climate scientists, economists and policymakers today, and is dedicated to the
state‐of‐the‐art literature in the cross‐cutting research area where biodiversity economics and
climate economics blend. The present work constituted methodologies that were anchored in the
neoclassical macro‐ and micro‐ economic theory and explored the use of modern techniques to
seek solutions to the most challenging policy questions, such as how does climate change affect
human well‐being through biodiversity and ecosystem functioning? How does the spatial mapping
of climate change induced social‐economic consequences look like? How does economic valuation
of biodiversity and ecosystems support policymaking to mitigate climate change impacts globally
and to achieve sustainable development goals locally? And how to develop cost‐effective market
mechanisms to deal with the distributive and equity issues related to climate change impacts and
ecosystem services benefits? With these policy questions in mind, the methodologies developed in
this dissertation have gone beyond conventional economic valuation of natural
environment/capital. Every piece of work included in this dissertation was characterized, to
certain extent, by highly innovative features, including the integration of micro‐and macro‐
economic models, the spatial analysis of climate change impacts on biodiversity, ecosystem
services and human wellbeing, the creation of new biodiversity metrics to measure welfare
changes in a climate change context, and the use of geographic information system (GIS) for
visualizing the links between biodiversity benefits and human livelihoods.
From a practical perspective, we explore different angles of economic theory incorporated with
knowledge generated in other disciplines, such as climate science, biology, social and political
science, so as to better understand the dynamics and complexity of climate change impacts and to
translate these impacts from biophysical terms, measured by e.g. loss of ecosystem services into
monetary metrics that can be used for policy aiding. In particular, this work is conducted by (1)
developing a holistic, well‐accepted approach that explores the mapping of complex links between
climate change, biodiversity, ecosystem services and human welfare in numerical terms; (2)
further extending the state‐of‐the‐art methodologies so as to monetize the climate change induced
impacts on biodiversity, ecosystem services and human wellbeing; and, (3) promoting and
discussing the incorporation of the valuation results into the support of policy making, including
ecosystem‐based climate change mitigation policy instruments (such as the Reducing Emissions
from Deforestation and forest Degradation ‐ REDD initiatives) as well as ecosystem‐based welfare
re‐distributional policy instruments (such as the Payment for Ecosystem Services ‐ PES).
An Application to European Forest Ecosystems
128
Moreover, all the methodologies are applied to the European forest ecosystems, where we
demonstrate how to assess climate change impacts on forest ecosystems as well as the associated
welfare effects. In general, the conducted economic valuation of climate change impacts on a
variety of forest ecosystems and ecosystem services in total 34 European countries has revealed
the complex nature and non‐linearity of climate change impacts at different geographical scales,
across populations and in different future development paths. In addition, the integration of CGE
model with the hybrid economic valuation model provides some insights on the magnified global
effects of climate change impacts on the regional biodiversity and ecosystem services, and
demonstrates the important role of ecosystem services, such as forest carbon sequestration
services, in regulating climate and affecting global GDP. Furthermore, by employing an
econometric model, we find that relationships between climate change, biodiversity, ecosystem
services and human well‐being are unevenly distributed across geo‐climatic regions, and the
magnitudes of these impacts vary depending on the type of ecosystem services under
consideration. Finally, the study on social dimension of biodiversity policy explores the spatial
mapping of the coincidence of ecosystem services and human livelihoods and finds that there are
obvious synergies between socio‐economic policies (e.g. job creation) and biodiversity policies
(e.g. biodiversity conservation).
Notwithstanding the uncertainty issues related to climate change, our assessment of the climate
change impacts has shown some interesting results that are potentially useful for policy
implications.
First of all, there is obviously a need for optimal forest management strategies in Europe to cope
with climatic shocks on the regional ecosystems and to promote the sustainable use of forest
resources for satisfying long‐term human demand. However, the design and implementation of
these policies should respect the specific local environmental, economic and political context of
each country. In other words, there are no silver bullet policies that can be applied to the European
context as a whole. This refers to a bottom‐up management approach to effectively manage forest
resources at country level. On the other hand, by comparing the welfare gains/losses of climate
change impacts occurred in different geo‐climatic regions, the EU will be able to evaluate the cost‐
efficient policy alternatives across all of the member countries. Therefore, the countries that
suffer the most losses from climate change may be compensated through other supplementary
policy package imposed by the EU. This infers a top‐down approach to improve the overall
efficiency of resource management in Europe. Thus, the recognition of the economic values of
biodiversity and ecosystem services are essential in terms of identifying conservation priorities,
Economic Assessment of Climate Change Impacts on Biodiversity, Ecosystem Services and Human Well-being
129
allocating the limited resources for conservation, and guiding the cost‐effective and efficient
policymaking across regions.
Second, we should also recognize the dynamic aspect of ecosystem changes in response to direct
and indirect socio‐economic drivers, including climate change. Today Europe, along with many
other countries, experiences the growing pressures from population growth, changing diets,
urbanization, and climate change, which in turn are causing continuous ecosystem degradation
and biodiversity decline. In return, the changes in biodiversity and ecosystem can directly affect
not only our economic system, but also the capacity of natural ecosystems to mitigate and adapt to
further climate change. These are externalities have already been impacting the conventional
economic systems over the last decade. Therefore, fully assessing the costs of these externalities,
in particular the costs of losing biodiversity are important for the design of effective policy
instruments to correct the failed market signals and to fully incorporate the costs of climate
change into the economic mechanisms. This way will enable us to better understand the welfare
effect of climate change, to prevent from further resource degradation and to effectively fight
against climate change.
Third, our results show that biodiversity and temperature can perform together as either
“complimentary” or “substitute” factors to affect the supply as well as the value of certain types of
ecosystem goods and services (EGS). In the case of provisioning services provided by
Mediterranean forests, we find a clear “complementary” effect between biodiversity and
temperature. Our results suggest that the negative impacts of climate change on biodiversity can
go against the positive direct climate change impact on the Mediterranean forests, and thus
generate a net negative impact on total value of provisioning services in the future. Whereas the
“substitute” effect between biodiversity and temperature refers that climate change induced
biodiversity effects on EGS may attenuate/decrease the negative direct climate change impact in
some regions, where biodiversity plays a key role in mitigating the those negative impacts of
climate change. These results may imply some important synergies of the climate and biodiversity
policies. In other words, although climate change may have directly negative impacts on the value
of ecosystem services, it is possible to mitigate these negative impacts by better managing
biodiversity and natural resources. In many cases, the benefits derived from biodiversity can be
large enough to compensate the loss of ecosystem productivities and values as a result of climate
change.
Finally, results from studying the complex linkages and trade‐offs between biodiversity,
ecosystem services, employment and the impacts on vulnerable groups do not allow for one single

An Application to European Forest Ecosystems
130
simple policy approach (no silver bullet!) to improve conditions both for nature and people.
Moreover, the social aspects of biodiversity are not addressed by a specific policy, but rather
constitute cross‐cutting issues that affect a wide range of policies on different scales. Many other
studies have shown that the protection of biodiversity and ecosystems cannot be restricted to
nature protection policies only, but instead have to be mainstreamed across different policies and
sectors. By expanding the scope to include the even more complex interactions between
biodiversity and the enhancement of jobs and of livelihoods in vulnerable areas, the range of
relevant policies becomes even larger. For example in Europe, the European Commission has
placed increasing emphasis on the importance of green infrastructure for multi benefits to the
economy. While some activities can cause significant deterioration of biodiversity through the
fragmentation of landscapes and habitats (Kettunen et al, 2007), but at the same time, the new
policies also provide important funding opportunities for biodiversity conservation such as the
development of infrastructure linked to biodiversity and investments in Natura 2000. In other
cases, opportunities exist for the investment in facilities to promote nature‐based tourism, with
potential positive impacts on economic development of disadvantaged areas and on biodiversity
(see EEA, 2009). To conclude, valuing ecosystem services and comparing the benefit associated
with conservation of natural areas with the benefits from conservation can provide useful
information for setting priorities in a variety of contexts.
6.3 Limitations and Future Research
To the best of our knowledge, the present doctoral dissertation represents the first attempt to
systematically assess the loss of human welfare with respect to changes in biodiversity and forest
ecosystem services which are directly driven by climate change. However, we acknowledge the
complexity in mapping, modeling and estimating the relationships between climate change,
biodiversity, ecosystem functioning, ecosystems services and human well‐being. In fact, many
ecosystem services, such as the supporting services cannot be captured by any economic
valuation techniques, neither be projected for future scenarios. In particular, we recognize that
the value estimates reported for regulating services in the present paper are underestimated, as
we do not consider other regulating services, e.g. watershed protection and soil nutrient cycling,
due to the limited knowledge about how to quantify those services in physical terms and how to
project their changes with respect to future climate change. Against this background, we
subscribe to the ongoing 'Potsdam Initiative' for biodiversity, also suggesting that it is imperative
to continue further with a global study so as to have a better understanding of the linkages
between biodiversity and human well being, especially in the context of global change.
Economic Assessment of Climate Change Impacts on Biodiversity, Ecosystem Services and Human Well-being
131
As for the new partial‐general model perspective, it is possible to extend the analysis in several
dimensions. Firstly, the CGE world model is being fed only with EU micro‐economic valuation data
on ecosystems services. The main reason for this is that global circulation models are not widely
available in the assessment of worldwide climate change impacts on biodiversity and ecosystem
services. The consequence is that the current analysis is not able to disentangle additional and
potentially significant interactions triggered by climate‐change impacts on ecosystem services
occurring outside the EU30. Because part of the CGE modelling potential remains unexploited, the
next step is inevitably the design and assessment of a full general equilibrium model that
embraces worldwide climate‐change impacts on biodiversity and ecosystem services. Secondly,
from the point of view of technical design, the model faces significant limitations in the capture of
certain values of ecosystems services. For instance changes in forest timber production by hectare
do not necessarily translate into the same productivity change in commercial raw wood input for
timber industry. Similarly, changes in land productivity are not necessarily equal to changes in
cultivated land productivity as now considered. Input information is aggregated at a higher
geographical detail and is assumed to be uniform across sectors; this may hide relevant feedbacks.
Irreversibility and thresholds in ecosystem functioning are not considered. Therefore, further
work should be developed in order to explore with greater detail these different aspects of
valuation transmission mechanisms of ecosystem services. Thirdly, it is highly recommended that
the present analysis is extended beyond provisioning and regulating services to also consider
cultural values provided by ecosystem services. This will be a challenging exercise due to the
significant non‐market nature of these valuation benefits. For these reasons, these results,
contingent upon the available scientific information and considered within the global socio‐
economic context, can only be interpreted as the tip of the iceberg. These estimates should
therefore be considered at best a lower bound to an unknown value of ecosystem goods and
services.
Finally, when constructing the new biodiversity measure, i.e. the composite forest biodiversity
indicator, we are also aware of certain limitations. For instance, the construction of the composite
biodiversity indicator in this paper is subject to a significant lack of data that cover time‐span long
enough to describe the evolution of species from the past to the future under different climate
change scenarios. As a consequence, we may observe an increase of species richness as well as
forest habitats in many countries under the climate change scenarios by 2050 with respect to a
baseline year of 2000, owing to the significant efforts of the EU‐17 in moving towards more
30 For this reason, we label the present analysis as a partial-general equilibrium model, describing the potential general equilibrium effects of a set of regionally bound climate change impacts.

An Application to European Forest Ecosystems
132
sustainable forest management practice. Thus, it is difficult for us to interpret, to what extent, the
projected trends of changes in species richness is a result of the climate change impacts or a
combination of different factors. Obviously, there is a need of incorporating more information
about species richness from the far distant past into our current database, as a large time‐span
will enable us to rule out many other socio‐economic factors other than the direct impact of
climate change that affect biodiversity and ecosystem functioning. Finally, a richer historical data
can also improve the overall performance of the econometric model and help us to better
understand the cross‐effects between biodiversity and temperature as well as the pattern in
which they affect the ecosystem service values.

Economic Assessment of Climate Change Impacts on Biodiversity, Ecosystem Services and Human Well-being
133
BIBLIOGRAPHY Ackerman, F. and I. Finlayson (2005) “Monetized Impacts of Climate Change: Why are the Numbers So
Small?”, evidence submitted to the Stern Review, December 8, 2005 Baillie J.E.M., Hilton‐Taylor C. & Stuart S. (2004) 2004 IUCN Red List of Threatened Species: A global species
assessment. In, p. 217. IUCN, Gland, Switzerland and Cambridge, UK Balmford, A., Bennun, L., ten Brink, B., Cooper, D., Côté, I.M., Crane, P., Dobson, A., Dudley, N., Dutton, I.,
Green, R.E., Gregory, R.D., Harrison, J., Kennedy, E.T., Kremen, C., Leader‐Williams, N., Lovejoy, T.E., Mace, G., May, R., Mayaux, P., Morling, P., Phillips, J., Redford, K., Ricketts, T.H., Rodriguez, J.P., Sanjayan, M, Schei, P.J., van Jaarsveld, A.S., B.A.Walther (2005) “The Converntion on Biological Diversity’s 2010 Target”, Science vol 307: 212‐213
Baumgärtner S., Becker C., Faber, M., and R. Manstetten (2006) “Relative and Absolute Scarcity of Nature. Assessing the Roles of Economics and Ecology for Biodiversity Conservation”, Ecological Economics vol 59: 487‐498
Bellu, L. and Cistulli, V. 1997. Economic Valuation of Forest Recreation Facilities in the Liguria Region (Italy), Working paper GEC 97‐08, Centre for Social and Economic Research on the Global Environment, The Value of Forest Ecosystems University of East Anglia and University College London. Bennett, E and Robinson, J. 2000. Hunting ofWildlife in Tropical Forests, Biodiversity Series ‐ Impact Studies, Paper 76,Washington DC:World Bank.
Berrittella, M., Bigano, A., Roson, R., Tol, R.S.J., 2006. A general equilibrium analysis of climate change impacts on tourism, Tourism Management vol 25.
Bigano, A., Bosello, F., Roson, R., Tol, R.S.J., 2008. Economy‐wide impacts of climate change: a joint analysis for sea level rise and tourism. Mitigation and Adaptation Strategies for Global Change, Vol. 13, n. 8.
Bloger, T. (2001) “The Functional Value of Species Biodiversity: a Review”, Biology and Environment Proceedings of the Royal Irish Academy 101 B (3): 199‐224.
Bolin B., Sukumar R. et al., (2000_. Global perspective. Land use, land‐use change, and forestry. In: Watson, R. T. et al. (Eds.). A Special Report of the IPCC. Cambridge University Press, 23‐51.
Bolt, K., Matete, M. and M. Clemens. 2002. Manual for Calculating Adjusted Net Savings. Environment Department, World Bank
Bosello, F., Eboli, F. and R. Parrado (2009b) “Assessing climate change cost for the economy: valuation results from a GEM perspective” in Carraro, C., Bosello, F. and P.A.L.D. Nunes (Eds) Impacts of Climate Change and Biodiversity Effects, Final Report to the European Investment Bank, Luxembourg.
Bosello, F., Eboli, F., Parrado, R., Rosa, R., Ding, H. and P.A.L.D. Nunes (2009a) “Integration of climate change impacts on biodiversity into a general equilibrium valuation approach” in Carraro, C., Bosello, F. and P.A.L.D. Nunes (Eds) Impacts of Climate Change and Biodiversity Effects, Final Report to the European Investment Bank, Luxembourg.
Bosetti, et al. 2009. The Incentives to Participate in, and the Stability of, International Climate Coalitions: A Game-theoretic Analysis Using the WITCH Model. FEEM working paper no.325
Cameron, T. (2002) “2002: The year of the ‘Diversity‐Ecosystem Function’ debate”, TRENDS in Ecology & Evolution Vol. 17 (11): 495‐496
Carraro, C., Bosello, F. and P.A.L.D. Nunes (Eds) Impacts of Climate Change and Biodiversity Effects, Final Report, ix + 225 p., European Investment Bank, Luxembourg. 2009
CASES (2008) CASES Project No.518294 SES6, (2006‐2008). Project official website: http://www.feem‐Project.net/cases/
CBD, 2010. Biodiversity Scenarios: Projections of 21st century change in biodiversity and associated ecosystem services ‐A Technical Report for the Global Biodiversity Outlook 3. CBD Technical Series No. 50, Convention on Biological Diversity

An Application to European Forest Ecosystems
134
Chiabai, A. Travisi, C., Markandya, A., Ding, H. and P.A.L.D. Nunes (forthcoming) “Economic Assessment of Forest Ecosystem Services Losses: Cost of Policy Inaction”, Journal of Environmental and Resource Economics
Chomitz, K.M. and Nelson, A. 2003. The geographical poverty gradient in Nicaragua and its implications for rural development strategy. Paper prepared for the ‘Drivers of Rural Growth’ study. Unpublished manuscript. In Sunderlin et al. 2007. Poverty and forests: Multi‐country analysis of spatial association and proposed policy solutions, CIFOR Occasional Paper No.47
Christie M., Warren J., Hanley, N., Murphy, K., Wright, R., Hyde, T. and N. Lyons (2004) “Developing measures for valuing changes in biodiversity: Final report”, Report to DEFRA London.
Clark, J., 2001. The global wood market, prices and plantation investment: an examination drawing on the Australian experience. Environmental Conservation 28 (1): 53‐64
Cline, W.R., 1992. The Economics of Global Warming. Institute for International Economics, Washington, DC. Dasgupta, S., Deichmann, U., Meisner, C. and Wheelter, D.2005. where is the poverty environment nexus?:
evidence from Cambodia, Lao PDR, and Vietnam. World Development 33(4): 617‐638. DEFRA, 2005. The Social Cost of Carbon Review – Methodological Approaches for Using SCC Estimates in
Policy Assessment. AEA Technology Environment, London. DEFRA, 2007. The Social Cost of Carbon and The Shadow Price of Carbon: What They Are, and How to Use
Then in Economic Appraisal in the UK. Economics Group of the Department for Environment, Food and Rural Affairs, UK.
Del Grosso, S., Parton, W., Stohlgren, T., Zheng, D. L., Bachelet, D., Prince, S., Hibbard, K. and Olson, R. (2008) “Global potential net primary production predicted from vegetation class, precipitatin, and temperature”. Ecology, 89, 2117‐2126
Ding, H., Silvestri, S., Chiabai, A., and P.A.L.D. Nunes (2010) “A Hybrid Approach to the Valuation of Climate Change Effects on Ecosystem Services: Evidence from the European Forests”, FEEM working paper, No.2010.050
EASAC. 2005. A User’s Guide to Biodiversity Indicators, European Academies Science Advisory Council, ISBN 0854036121
EEA, 2007. Halting the Loss of Biodiversity by 2010: Proposal for a First Set of Indicators to Monitor Progress in Europe. EEA Technical Report No.11/2007
EEA. 2009. Territorial Cohesion: Analysis of Environmental Aspects of the EU Cohesion Policy in Selected Countries. Copenhagen.
Ehrlich, P.R. 1988. The Loss of Diversity: Causes and Consequence Biology, and the Future of Humanity. in Wilson, E.O. (ed.) Biodiversity, National Academy Press, Washington DC.
Ellenberg, H., 1986. Vegetation Mitteleuropas mit den Alpen. Ulmer, Stuttgart, Germany, 4th ed., 989 pp. ERM (Environmental Resources Management). 1996.Valuing Management for Biodiversity in British
Forests, Report to UK Forestry Commission. Faith, D.P. (2005) “Global Biodiversity Assessment: Integrating Global and Local Values and Human
Dimensions”, Global Environmental Change 15: 5‐8 FAO. 1999. State of the World’s Forests, 1999. Third edition. Food and Agriculture Organization of the
United Nations, Rome, 1999. http://www.fao.org/forestry/FO/SOFO/SOFO99/sofo99‐e.stm FAO. 2005. Non‐wood forest products: Use and outlook.
ftp://ftp.fao.org/docrep/fao/meeting/013/k2556e.pdf Accessed: 20/07/10. FAO/FRA2005, 2006. Global Forest Resources Assessment 2005: Progress towards sustainable forest
management. FAO Forestry Paper no.147, available on website: ftp://ftp.fao.org/docrep/fao/008/A0400E/A0400E00.pdf
Garcia‐Gonzalo J., Peltoa H., Gerendiain A. Z., Kellomäki S., 2007. Impacts of forest landscape structure and management on timber production and carbon stocks in the boreal forest ecosystem under changing climate, Forest Ecology and Management, 241: 243‐257.
Garrod, G.D. and Willis, K. G., 1997. The non‐use benefits of enhancing forest biodiversity: A contingent ranking study. Ecological Economics: 45‐61.
Economic Assessment of Climate Change Impacts on Biodiversity, Ecosystem Services and Human Well-being
135
Ghermandi, A. et al., 2008. The economic value of wetland conservation and creation: A meta‐analysis. Fondazione Eni Enrico Mattei Working Papers, 238.
Giardina, C.P., Ryan,M.G., 2000. Evidence that decomposition rates of organic carbon in mineral soil do not vary with temperature. Nature 404: 858‐861
Giller, P.S. and G. O’Donovan, 2002. Biodiversity and Ecosystem Function: Do Species Matter? Biology and Environment: Proceedings of the Royal Irish Academy 102B (3): 12
Gordon, C., Cooper, C., Senior, C.A., Banks, H., Gregory, J.M., Johns, T.C., Mitchell, J.F.B. and Wood, R.A., (2000): The simulation of SST, sea ice extents and ocean heat transports in a version of the Hadley Centre coupled model without flux adjustments. Climate Dynamics 16, 147‐168
Hammitt, J.K. 2000. Valuing mortality risk: theory and practice. Environmental Science and Technology 34: 1394–1400.
Hanley, N., Willis, K., Powe, N. and Anderson, M. 2002. Valuing the Benefits of Biodiversity in Forests, Report to the Forestry Commission, Centre for Research in Environmental Appraisal and Management (CREAM), University of Newcastle.
Heal, Geoffrey. 2008. Climate Economics: A Meta‐Review and Some Suggestions for Future Research. Review of Environmental Economics and Policy, pp.1‐19
Hoover, W.L. and G., Preston. 2006. 2006 Indiana Forest Products Price Report and Trend Analysis. Expert review: FNR‐177‐W, Purdue University, the USA.
Hope, C. 2003. The Marginal Impacts of CO, CH4 and SF6 Emissions, Judge Institute of Management Research Paper No. 2003/10, Cambridge, UK, University of Cambridge, Judge Institute of Management.
IFAD. 2002. Assessment of Rural Poverty: Central and Eastern Europe and the Newly Independent States, International Fund For Agricultural Development (IFAD), ISBN 92‐9072‐025‐5
IMAGE, 2001. Integrated Model to Assess the Global Environment. Netherlands Environmental Assessment Agency – RIVM, available at http://www.rivm.nl/image/
IPCC, 2000. Special Report on Emission Scenarios. Nebojsa Nakicenovic and Rob Swart (Eds.) Cambridge University Press, UK. pp 570
IPCC, 2001a. IPCC Special Reports on Climate Change: The Regional Impacts of Climate Change, Intergovernmental Panel on Climate Change.
IPCC, 2001b. Intergovernmental Panel on Climate Change, Climate Change 2001: The Scientific Basis. Cambridge University Press, Cambridge, UK, pp. 881
IPCC. 2001c, Climate Change 2001: Impacts, Adaptation and Vulnerability, Contribution of Working Group II to the Third Assessment Report of the Intergovernmental Panel on Climate Change, J.J. McCarthy, O.F. Canziani, N.A. Leary, D.J. Dokken and K.S. White, Eds., Cambridge University Press, Cambridge.
IPCC, 2002. Climate Change and Biodiversity: IPCC Technical Paper V, Intergovernmental Panel on Climate Change.
IPCC, 2007a. Climate Change 2007: The Physical Science Basis. Contribution of Working Group I to the Fourth Assessment Report of the Intergovernmental Panel on Climate Change [Solomon, S., D. Qin, M. Manning, Z. Chen, M. Marquis, K.B. Averyt, M.Tignor and H.L. Miller (eds.)]. Cambridge University Press, Cambridge, United Kingdom and New York, NY, USA.
IPCC, 2007b: Climate Change 2007: Impacts, Adaptation, and Vulnerability. Contribution of Working Group II to the Fourth Assessment Report of the Intergovernmental Panel on Climate Change [Parry, Martin L., Canziani, Osvaldo F., Palutikof, Jean P., van der Linden, Paul J., and Hanson, Clair E. (eds.)]. Cambridge University Press, Cambridge, United Kingdom, 1000 pp.
IPCC, 2007c. Climate Change 2007: Synthesis Report, Contribution of Working Groups I, II and III to the Fourth Assessment Report of the Intergovernmental Panel on Climate Change Core Writing Team, Pachauri, R.K. and Reisinger, A. (Eds.) IPCC, Geneva, Switzerland. pp 104
IUCN, 2005. Case studies in wetland valuation # 11, Feb. 2005. IUCN Water and Nature Initiative (WANI), Integrating Wetland Economic Values into River Basin Management.
Jarvis, P.G., Linder, S., 2000. Botany‐constraints to growth of boreal forests. Nature 405: 904‐905
An Application to European Forest Ecosystems
136
Karjalainen, T., Pussinen, A., Liski, J., Nabuurs, G.J., Eggers, T., Lapvetelainen, T., Kaipainen, T. (2003). Scenario analysis of the impacts of forest management and climate change on the European forest sector carbon budget. Forest Policy and Economics 5: 141‐155.
Kelly, D. L. and C. D. Kolstad (1999) “Integrated Assessment Models for Climate Change Control”, in Henk Flmer and Tom Tietenberg (eds), International Yearbook of Environmental and Resource Economics 1999/2000: A Survey of Current Issues (Cheltenham, UK‐Edward Elgar, 1999)
Kettunen, M, Terry, A., Tucker, G. and Jones A. 2007. Guidance on the maintenance of landscape features of major importance for wild flora and fauna ‐ Guidance on the implementation of Article 3 of the Birds Directive (79/409/EEC) and Article 10 of the Habitats Directive (92/43/EEC) Institute for European Environmental Policy (IEEP), Brussels, 114 pp. and Annexes.
Kettunen, M., Adelle, C., Baldock, D., Cooper, T., Farmer, M. Hart, K., Torkler, P. 2009. Biodiversity and the EU Budget – an IEEP briefing paper. Institute for European Environmental Policy, London / Brussels. 31 pp.
Kniivila, M., Ovaskainen, V. and Saastamoinen, O. 2002. Costs and benefits of forest conservation: regional and local comparisons in Eastern Finland, Journal of Forest Economics: 131‐150.
Kontoleon, A., Pascual, U. and T. Swanson, 2007. Introduction. In: A. Kontoleon, U. Pascual and T. Swanson, Editors, Biodiversity Economics: Principles, Methods and Applications, Cambridge University Press, Cambridge.
Leadley, P., Pereira, H.M., Alkemade, R., Fernandez‐Manjarrés, J.F., Proença, V., Scharlemann, J.P.W., Walpole, M.J., 2010. Biodiversity Scenarios: Projections of 21st century change in biodiversity and associated ecosystem services. Secretariat of the Convention on Biological Diversity, Montreal. Technical Series no. 50, 132 pages.
Lindner M. et al. 2008. Impacts of Climate Change on European Forests and Options for Adaptation, Report to the European Commission Directorate – General for Agricultural and Rural Development, contract nr. AGRI‐2007‐G4‐06, European Commission.
Lloyd, J., Taylor, J.A., 1994. On the temperature dependence of soil respiration. Funct.Ecol.8: 315‐323 Loreau, M., Naeem, S., Inchausti, P., Bengtsson, J., Grime, J.P., Hector, A., Hooper, D.U., Huston, M.A., Raffaelli,
D., Schmid, B., Tilman, D., and D.A. Wardle, 2001. Biodiversity and Ecosystem Functioning: Current Knowledge and Future Challenges, Science 294: 804‐808
Luo, Y.Q., Wan, S.Q., Hui, D.F., Wallance, L.L., 2001. Acclimatization of soil respiration to warming in a tall grass prairie. Nature 413: 622‐625
Mace, G. M. and J.E.M. Baillie, 2007. The 2010 Biodiversity Indicator: Challenges for Science and Policy. Conservation Biology, 21(6): 1406‐1413
Manne, A. and R. Richels, 2004. MERGE an Integrated Assessment Model for Global Climate Change, on‐line documentation on the MERGE model, available at: http://www.stanford.edu/group/MERGE/GERAD1.pdf
Manne, A., R. Mendelsohn and R. Richels, 1995. A Model for Evaluating Regional and Global Effects of Greenhouse Policies, Energy Policy, Vol. 23.
Markandya, A., Chiabai, A., Ding, H., Nunes P.A.L.D, Travisi, C., 2008. Economic Valuation of Forest Ecosystem Services: Methodology and Monetary Estimates, in “Cost of Policy Inaction” Final report for the European Commission, Brussels, Belgium.
Martens P., Rotmans J., and D. de Groot, 2003. Biodiversity: Luxury or Necessity? Global Environmental Change 13: 75‐81
McConville, A.J. and Gantioler, S., 2010. Financing Natura 2000. Stakeholder Conference, 15‐16th July, 2010. Deliverable to DG ENV, under the project: Costs and Socio‐Economic Benefits associated with the Natura 2000 Network. Final report to the European Commission, DG Environment on Contract ENV.B.2/SER/2008/0038. http://www.ecologic‐events.de/natura2000/documents/Natura2000Financingconference2010‐Proceedings_Final.pdf
MCPFE, 2007. State of Europe’s forests 2007: The MCPFE report on sustainable forest management in Europe, Ministerial Conference on the Protection of Forests in Europe, Liaison Unit Warsaw, Poland. ISBN: 83‐922396‐8‐7 or 978‐83‐922396‐8‐0
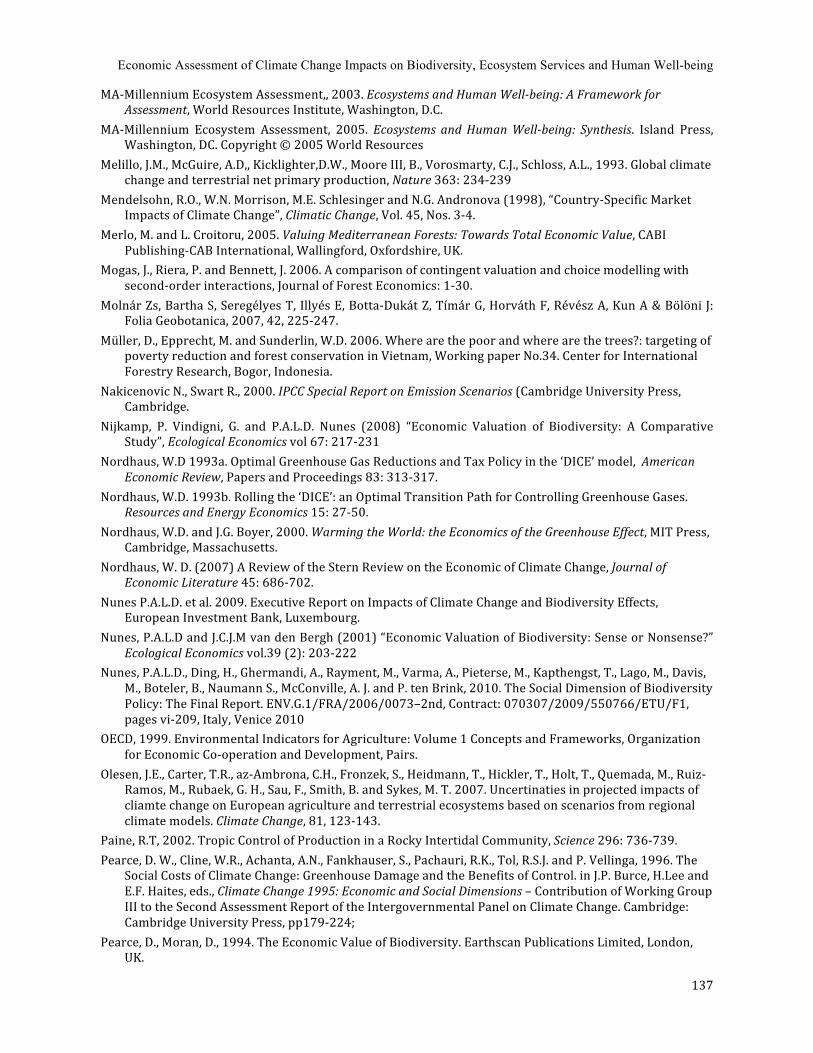
Economic Assessment of Climate Change Impacts on Biodiversity, Ecosystem Services and Human Well-being
137
MA‐Millennium Ecosystem Assessment,, 2003. Ecosystems and Human Wellbeing: A Framework for Assessment, World Resources Institute, Washington, D.C.
MA‐Millennium Ecosystem Assessment, 2005. Ecosystems and Human Wellbeing: Synthesis. Island Press, Washington, DC. Copyright © 2005 World Resources
Melillo, J.M., McGuire, A.D,, Kicklighter,D.W., Moore III, B., Vorosmarty, C.J., Schloss, A.L., 1993. Global climate change and terrestrial net primary production, Nature 363: 234‐239
Mendelsohn, R.O., W.N. Morrison, M.E. Schlesinger and N.G. Andronova (1998), “Country‐Specific Market Impacts of Climate Change”, Climatic Change, Vol. 45, Nos. 3‐4.
Merlo, M. and L. Croitoru, 2005. Valuing Mediterranean Forests: Towards Total Economic Value, CABI Publishing‐CAB International, Wallingford, Oxfordshire, UK.
Mogas, J., Riera, P. and Bennett, J. 2006. A comparison of contingent valuation and choice modelling with second‐order interactions, Journal of Forest Economics: 1‐30.
Molnár Zs, Bartha S, Seregélyes T, Illyés E, Botta‐Dukát Z, Tímár G, Horváth F, Révész A, Kun A & Bölöni J: Folia Geobotanica, 2007, 42, 225‐247.
Müller, D., Epprecht, M. and Sunderlin, W.D. 2006. Where are the poor and where are the trees?: targeting of poverty reduction and forest conservation in Vietnam, Working paper No.34. Center for International Forestry Research, Bogor, Indonesia.
Nakicenovic N., Swart R., 2000. IPCC Special Report on Emission Scenarios (Cambridge University Press, Cambridge.
Nijkamp, P. Vindigni, G. and P.A.L.D. Nunes (2008) “Economic Valuation of Biodiversity: A Comparative Study”, Ecological Economics vol 67: 217‐231
Nordhaus, W.D 1993a. Optimal Greenhouse Gas Reductions and Tax Policy in the ‘DICE’ model, American Economic Review, Papers and Proceedings 83: 313‐317.
Nordhaus, W.D. 1993b. Rolling the ‘DICE’: an Optimal Transition Path for Controlling Greenhouse Gases. Resources and Energy Economics 15: 27‐50.
Nordhaus, W.D. and J.G. Boyer, 2000. Warming the World: the Economics of the Greenhouse Effect, MIT Press, Cambridge, Massachusetts.
Nordhaus, W. D. (2007) A Review of the Stern Review on the Economic of Climate Change, Journal of Economic Literature 45: 686‐702.
Nunes P.A.L.D. et al. 2009. Executive Report on Impacts of Climate Change and Biodiversity Effects, European Investment Bank, Luxembourg.
Nunes, P.A.L.D and J.C.J.M van den Bergh (2001) “Economic Valuation of Biodiversity: Sense or Nonsense?” Ecological Economics vol.39 (2): 203‐222
Nunes, P.A.L.D., Ding, H., Ghermandi, A., Rayment, M., Varma, A., Pieterse, M., Kapthengst, T., Lago, M., Davis, M., Boteler, B., Naumann S., McConville, A. J. and P. ten Brink, 2010. The Social Dimension of Biodiversity Policy: The Final Report. ENV.G.1/FRA/2006/0073–2nd, Contract: 070307/2009/550766/ETU/F1, pages vi‐209, Italy, Venice 2010
OECD, 1999. Environmental Indicators for Agriculture: Volume 1 Concepts and Frameworks, Organization for Economic Co‐operation and Development, Pairs.
Olesen, J.E., Carter, T.R., az‐Ambrona, C.H., Fronzek, S., Heidmann, T., Hickler, T., Holt, T., Quemada, M., Ruiz‐Ramos, M., Rubaek, G. H., Sau, F., Smith, B. and Sykes, M. T. 2007. Uncertinaties in projected impacts of cliamte change on European agriculture and terrestrial ecosystems based on scenarios from regional climate models. Climate Change, 81, 123‐143.
Paine, R.T, 2002. Tropic Control of Production in a Rocky Intertidal Community, Science 296: 736‐739. Pearce, D. W., Cline, W.R., Achanta, A.N., Fankhauser, S., Pachauri, R.K., Tol, R.S.J. and P. Vellinga, 1996. The
Social Costs of Climate Change: Greenhouse Damage and the Benefits of Control. in J.P. Burce, H.Lee and E.F. Haites, eds., Climate Change 1995: Economic and Social Dimensions – Contribution of Working Group III to the Second Assessment Report of the Intergovernmental Panel on Climate Change. Cambridge: Cambridge University Press, pp179‐224;
Pearce, D., Moran, D., 1994. The Economic Value of Biodiversity. Earthscan Publications Limited, London, UK.
An Application to European Forest Ecosystems
138
Pearce, D.W., Cline, W.R., Achanta, A.N., Fankhauser, S., Pachauri, R.K., Tol, R.S.J., Vellinga, P., 1996. The social costs of climate change: greenhouse damage and the benefits of control. In Bruce, J.P., Lee, H., Haites, E.F.(Eds.), Climate Change 1995: Economic and Social Dimensions – Contribution of Working Group III to the Second Assessment Report of the Intergovernmental Panel on Climate Change. Cambridge University Press, Cambridge, pp. 179‐224.
Pereira, H.M., Leadley, P.W., Proença1, V., Alkemade,R., Scharlemann, J.P.W., Fernandez‐Manjarrés, J.F., Araújo, Miguel B., Balvanera, P., Biggs, R., Cheung, W.W.L., Chini, L., Cooper, H.D., Gilman, E.L., Guénette, S., Hurtt, G.C., Huntington, H.P., Mace, G.M., Oberdorff, T., Revenga, C., Rodrigues, P., Scholes, R.J., Sumaila, U.R. and M. Walpole, 2010. Scenarios for Global Biodiversity in the 21st Century, Science 330: 1496‐1501
Perrings, C.A., Maler, K.G.Folke, C., Holling, C.S. and B.O. Jansson, 1995. Biodiversity Conseravtion and Economic Development: The policy Problem. in Perrings et al. (eds.) Biodiversity Conservation: problems and policies, Kluwer Academic Publishers, the Netherlands.
POST. 2008. Biodiversity Indicator, Postnote, July 2008 Number 312, parliamentary Office of Science and Technology, UK.
Riou‐Nivert P., 2005. Les temps changent, la forêt doit s’adapter, Forêt‐entreprise, 162: 12. Scarpa, R.,. Chilton, S. M., Hutchinson W. G., Buongiorno, J. 2000. Valuing the recreational benefits from the
Creation of Natre Reserves in Irish forests, Ecological Economics. Sceretariate of the Convention on Biological Diversity (2009) “Connecting Biodiversity and Climate Change
Mitigation and Adaptation: Report of the Second Ad Hoc Technical Expert Groupo on Biodiversity and Climate Change” Montreal, Technical Series No.41, 126 pages.
Schmid, B., Joshi, J. and F. Schläpfer (2000) “Empirical Evidence for Biodiversity‐Functioning relationships”, in A.P.Kinzig, D. Tilman and S.W. Pacala (eds), Functional Consequences of Biodiversity: Experimental Progress and Theoretical Extensions, 120‐50. Monographs in Populaiton Biology 33. Princeton, NJ. Princetion University Press.
Schöter D. et al., 2004. ATEAM (Advanced Terrestrial Ecosystem Analyses and Modelling) final report (Potsdam Institute for Climate Impact Research, 2004).
Schöter D., Cramer W., Leemans R., Prentice I. C., Araùjo M. B., Arnell N. W., Bondeau A., Bugmann H., Carter T. R., Gracia C. A.,. de la Vega‐Leinert A. C, Erhard M., Ewert F., Glendining M., House J. I., Kankaanpää S., Klein R. J. T., Lavorel S., Lindner M., Metzger M. J., Meyer J., Mitchell T. D., Reginster I., Rounsevell M., Sabaté S., Sitch S., Smith B., Smith J., Smith P., Sykes M. T., Thonicke K., Thuiller W., Tuck G., Sönke Zaehle, Bärbel Z., 2005. Ecosystem Service Supply and Vulnerability to global change in Europe. Science, 310: 1333‐1337.
Siikamaki, J. 2007. Discrete choice survey experiments: A comparison using flexible methods, Journal of Environmental Economics and Management: 122‐139.
Stern N., Peters, S., Bakhshi, V. Bowen, A., Cameron, C., Catovsky, S., Crane, D., Cruickshank, S., Dietz, S., Edmondson, N., Garbett, S., Hamid, L., Hoffman, G., Ingram, D. Jones, B., Patmore, N., Radcliffe, H., Sathiyarajah,, R., Stock, M., Taylor, C., Vernon, T., Wanjie, H. and D. Zenghelis, Stern Review on the Economics of Climate Change, Cambridge University Press, Cambridge, UK, 2006.
Stern, Nicholas. 2006. The Economics of Climate Change: The Stern Review. London: H.M. Treasury
Strömgren, Monika. 2001. Soil‐surface CO2 flux and growth in a boreal Norway spruce stand. Doctoral diss. Dept. of Production Ecology, SLU. Acta Universitatis agriculturae Sueciae. Silvestria vol. 220.
TEEB. 2010. The Economics of Ecosystems and Biodiversity in National and International Policy Making. Earthscan, London.
Ten Brink ,B. 2000. “Biodiversity Indicators for the OECD Environmental Outlook and Strategy”, GLOBIO Report Series No. 25., RIVM, 2000. http://www.rivm.nl/bibliotheek/rapporten/402001014.pdf.
Thuiller W., Lavorel S., Araùjo M. B., Sykes M. T., Prentice I. C., 2005. Climate change threats to plant diversity in Europe. PNAS, vol. 102, n° 23: 8245‐8250.
Tol, R.S.J. 2002a.New Estimates of the Damage Costs of Climate Change: Part I. Benchmark Estimates, Environmental and Resource Economics 21 (1): 47‐ 73.
Tol, R.S.J. 2002b. New Estimates of the Damage Costs of Climate Change – Part II: Dynamic Estimates,
Economic Assessment of Climate Change Impacts on Biodiversity, Ecosystem Services and Human Well-being
139
Environmental and Resource Economics, Vol. 21(1): 135 – 160 Tol, Richard S.J. 2005. The Marginal Damage Costs of Carbon Dioxide Emissions: An Assessment of the
Uncertainties. Energy Policy (33): 2064‐2074
Tol, R.S.J. 2006 The Stern Review of the Economics of Climate Change: A Comment Mimeo, Economic and Social Research Institute, Hamburg, Vrije and Carnegie Mellon Universities.
Tol R.C.J. 2008. The Economic Impact of Climate Change. Papers WP255, Economic and Social Research Institute (ESRI).
Tol, R.S.J., Frankhauser, S., Richels, R.G. and J.B. Smith (2000) “How Much Damage Will Climate Change Do? Recent Estimates”, World Economics 1(4): 179‐206.
Torkler, P., Arroyo, A., Kettunen,. M. 2008. Linking Management and Financing of Natura 2000. Final report. 51 pp.
UNECE/FAO, 2005. European Forest Sector Outlook Study, 1960 – 2000 – 2020, Main report, United Nation Publications, pp. 265
UNEP‐WCMC, 2007. Biodiversity and poverty reduction: the importance of biodiversity for ecosystem services. www.unep‐wcmc.org
Verbeek, Marno, 2000. A guide to modern econometrics. John Wiley & Sons, Ltd, ISBN 0‐471‐89982‐8 Walther G., Post, E., Convey, P., Menzel, A., Parmesan, C., Beebee, T.J.C., Fromentin, J., Hoegh‐Guldbergy, O.,
and F. Bairlein, 2002. Ecological Responses to Recent Climate Change, Nature, vol 416: 389‐395 Warren, R. et al. 2006. Spotlighting Impacts Functions in Integrated Assessment Models, Tyndall Centre for
Climate Change Research Working Paper No. 91. Watson, R.T., Zinyowera, M.C. and R.H.Moss, eds. 1996. Climate Change 1995: Imacts, Adaptation, and
Mitigation of Climate Change – Scientific – Technical Analysis – Contribution of Working Group II to the Second Assessment Report of the Integovernmental Panel on Climate Change. Cambridge: Cambridge University Press.
Weizman, M.L. 2007. A Review of the Stern Review on the Economic of Climate Change, Journal of Economic Literature 45: 704‐724.
Wendland, K.J., Honzák, M., Portela, R., Vitale, B., Rubinoff, S. and Randrianarisoa, J. (2009), Targeting and implementing payments for ecosystem services: Opportunities for bundling biodiversity conservation with carbon and water services in Madagascar, Ecological Economics: doi:10.1016/j.ecolecon.2009.01.002.
Willims W.D. et al. (2002) “Response of the Mixed Prairie to Protection from Grazing”, J. Range Manage 55: 210‐216.
World Conservation Monitoring Centre of the United Nations Environment Programme (UNEP‐WCMC), 2004. Species Data (unpublished, September 2004).
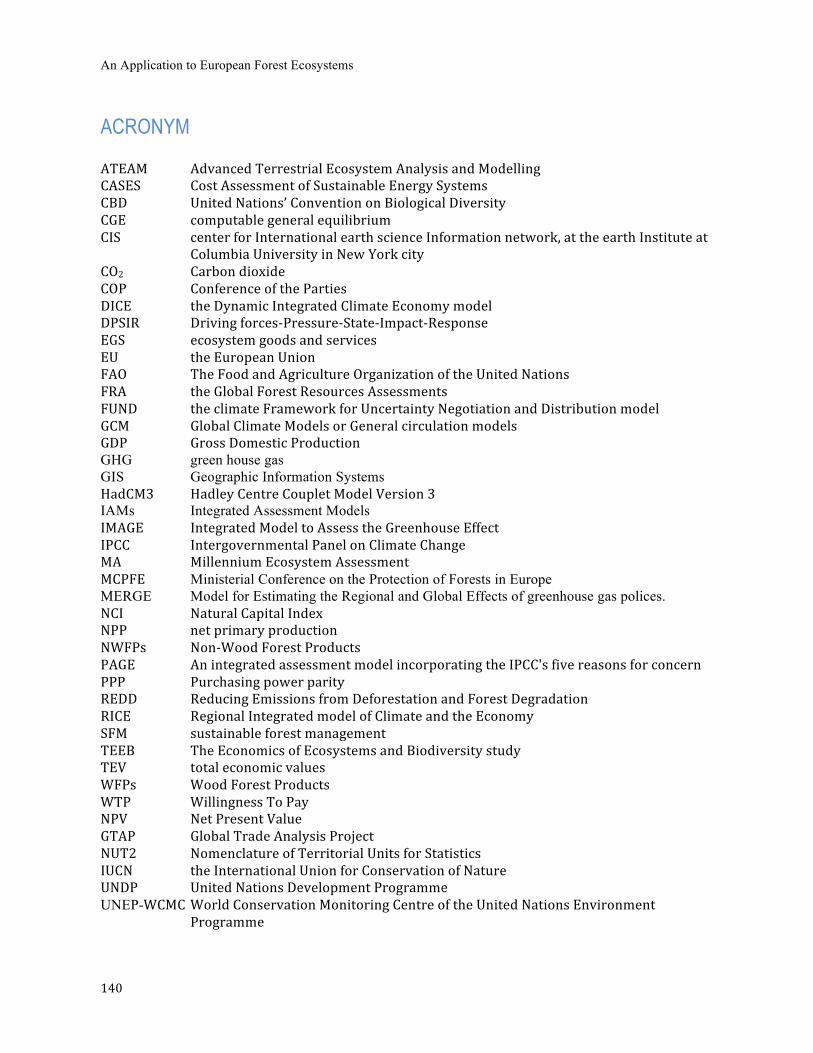
An Application to European Forest Ecosystems
140
ACRONYM ATEAM Advanced Terrestrial Ecosystem Analysis and Modelling CASES Cost Assessment of Sustainable Energy Systems CBD United Nations’ Convention on Biological Diversity CGE computable general equilibrium CIS center for International earth science Information network, at the earth Institute at
Columbia University in New York city CO2 Carbon dioxide COP Conference of the Parties DICE the Dynamic Integrated Climate Economy model DPSIR Driving forces‐Pressure‐State‐Impact‐Response EGS ecosystem goods and services EU the European Union FAO The Food and Agriculture Organization of the United Nations FRA the Global Forest Resources Assessments FUND the climate Framework for Uncertainty Negotiation and Distribution model GCM Global Climate Models or General circulation models GDP Gross Domestic Production GHG green house gas GIS Geographic Information Systems HadCM3 Hadley Centre Couplet Model Version 3 IAMs Integrated Assessment Models IMAGE Integrated Model to Assess the Greenhouse Effect IPCC Intergovernmental Panel on Climate Change MA Millennium Ecosystem Assessment MCPFE Ministerial Conference on the Protection of Forests in Europe MERGE Model for Estimating the Regional and Global Effects of greenhouse gas polices. NCI Natural Capital Index NPP net primary production NWFPs Non‐Wood Forest Products PAGE An integrated assessment model incorporating the IPCC's five reasons for concern PPP Purchasing power parity REDD Reducing Emissions from Deforestation and Forest Degradation RICE Regional Integrated model of Climate and the Economy SFM sustainable forest management TEEB The Economics of Ecosystems and Biodiversity study TEV total economic values WFPs Wood Forest Products WTP Willingness To Pay NPV Net Present Value GTAP Global Trade Analysis Project NUT2 Nomenclature of Territorial Units for Statistics IUCN the International Union for Conservation of Nature UNDP United Nations Development Programme UNEP-WCMC World Conservation Monitoring Centre of the United Nations Environment
Programme

Economic Assessment of Climate Change Impacts on Biodiversity, Ecosystem Services and Human Well-being
141
APPENDIX
Table A1a: Projection of European Forest Areas (Estimates in 1000 ha)
Latitude Country
2005a
2050 A1FI b
2050 A2b, c
2050 B1 b
2050 B2 b
Greece 3 ,752 2,292 2,360 3,762 3,598 Italy 9,979 8,346 8,253 11,677 11,893 Portugal 3,783 2,170 2,174 3,254 3,283 Spain 17,915 12,052 11,969 17,389 17,633 Albania 794 519 835 918 991 Bosnia and Herzegovina 2,185 1,476 2,372 2,609 2,817 Bulgaria 3,625 2,279 3,664 4,030 4,351 Serbia and Montenegro 2,694 1,789 2,876 3,163 3,415 Turkey 10,175 6,788 10,912 12,002 12,959 TFRY Macedonia 906 612 984 1,082 1,168
35 to 45
Regional Total 55,808 38,324 46,399 59,885 62,108 Austria 3,862 5,298 5,177 5,199 5,471 Belgium 667 526 545 698 842 France 15,554 15,094 16,056 20,080 21,926 Germany 11,076 10,049 10,075 12,696 14,033 Ireland 669 442 379 638 656 Luxembourg 87 80 78 103 94 Netherlands 365 151 421 333 413 Switzerland 1,221 1,985 1,913 2,113 2,121 Croatia 2,135 1,438 2,311 2,542 2,745 Czech Republic 2,648 1,781 2,863 3,149 3,400 Hungary 1,976 1,288 2,070 2,277 2,458 Poland 9,192 6,118 9,834 10,816 11,679 Romania 6,370 4,299 6,911 7,601 8,207 Slovakia 1,929 1,297 2,085 2,294 2,477 Slovenia 1,264 837 1,345 1,479 1,597
45 to 55
Regional Total 59,015 50,682 62,064 72,017 78,118 Denmark 500 414 677 434 839 UK 2,845 1,986 2,145 2,780 3,476 Estonia 2,284 1,515 2,435 2,678 2,892 Latvia 2,941 1,948 3,132 3,445 3,719 Lithuania 2,099 1,364 2,193 2,412 2,604
55 to 65
Regional Total 10,669 7,227 10,582 11,749 13,530 Finland 22,500 18,224 17,999 16,517 17,079 Iceland 46 30 29 28 28 Norway 9,387 6,478 6,277 5,141 5,761 Sweden 27,528 22,704 22,198 25,884 22,704
65 to 71
Regional Total 59,461 47,435 46,503 47,569 45,572 Notes: a data from FAO; b projections by ATEAM and CLIBIO on the basis of the Integrated Model to Assess the Global Environment (IMAGE), developed by Netherlands Environmental Assessment Agency; c interpreted by the European Commission as the baseline scenario, i.e. the scenario characterized by policy inaction.
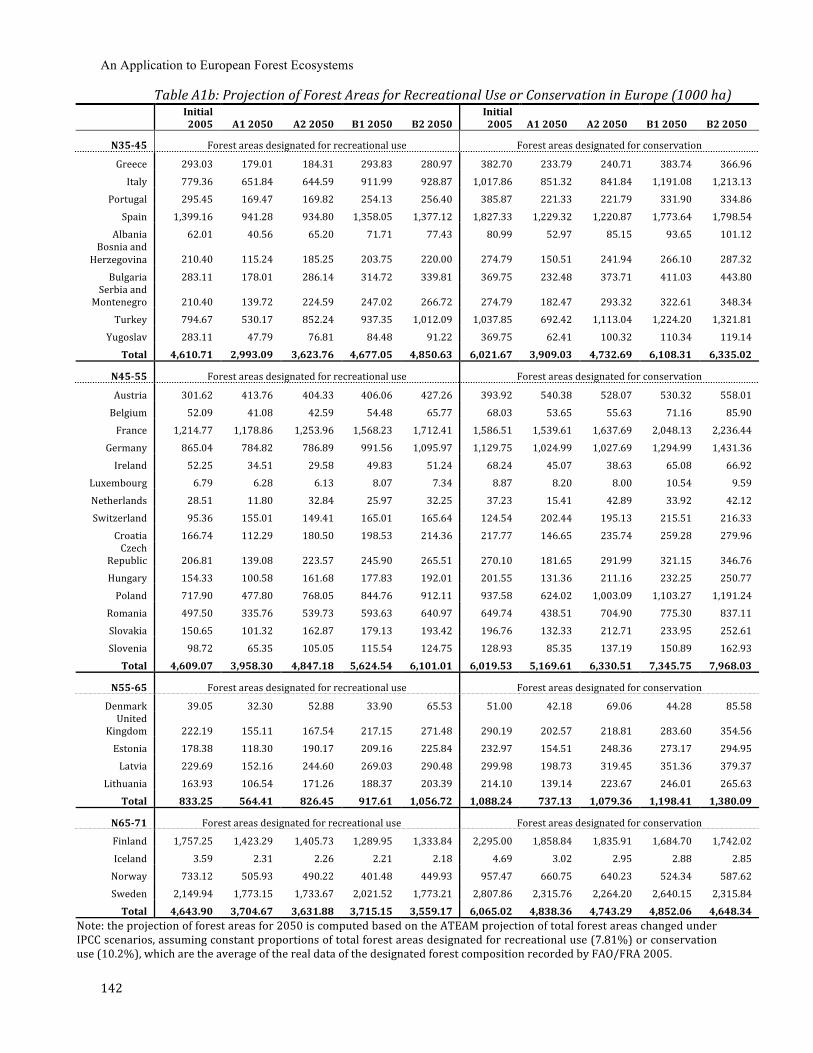
An Application to European Forest Ecosystems
142
Table A1b: Projection of Forest Areas for Recreational Use or Conservation in Europe (1000 ha)
Initial 2005 A1 2050 A2 2050 B1 2050 B2 2050
Initial 2005 A1 2050 A2 2050 B1 2050 B2 2050
N3545 Forest areas designated for recreational use Forest areas designated for conservation
Greece 293.03 179.01 184.31 293.83 280.97 382.70 233.79 240.71 383.74 366.96 Italy 779.36 651.84 644.59 911.99 928.87 1,017.86 851.32 841.84 1,191.08 1,213.13
Portugal 295.45 169.47 169.82 254.13 256.40 385.87 221.33 221.79 331.90 334.86 Spain 1,399.16 941.28 934.80 1,358.05 1,377.12 1,827.33 1,229.32 1,220.87 1,773.64 1,798.54
Albania 62.01 40.56 65.20 71.71 77.43 80.99 52.97 85.15 93.65 101.12 Bosnia and
Herzegovina 210.40 115.24 185.25 203.75 220.00 274.79 150.51 241.94 266.10 287.32
Bulgaria 283.11 178.01 286.14 314.72 339.81 369.75 232.48 373.71 411.03 443.80 Serbia and
Montenegro 210.40 139.72 224.59 247.02 266.72 274.79 182.47 293.32 322.61 348.34 Turkey 794.67 530.17 852.24 937.35 1,012.09 1,037.85 692.42 1,113.04 1,224.20 1,321.81
Yugoslav 283.11 47.79 76.81 84.48 91.22 369.75 62.41 100.32 110.34 119.14 Total 4,610.71 2,993.09 3,623.76 4,677.05 4,850.63 6,021.67 3,909.03 4,732.69 6,108.31 6,335.02
N4555 Forest areas designated for recreational use Forest areas designated for conservation
Austria 301.62 413.76 404.33 406.06 427.26 393.92 540.38 528.07 530.32 558.01 Belgium 52.09 41.08 42.59 54.48 65.77 68.03 53.65 55.63 71.16 85.90 France 1,214.77 1,178.86 1,253.96 1,568.23 1,712.41 1,586.51 1,539.61 1,637.69 2,048.13 2,236.44
Germany 865.04 784.82 786.89 991.56 1,095.97 1,129.75 1,024.99 1,027.69 1,294.99 1,431.36 Ireland 52.25 34.51 29.58 49.83 51.24 68.24 45.07 38.63 65.08 66.92
Luxembourg 6.79 6.28 6.13 8.07 7.34 8.87 8.20 8.00 10.54 9.59 Netherlands 28.51 11.80 32.84 25.97 32.25 37.23 15.41 42.89 33.92 42.12 Switzerland 95.36 155.01 149.41 165.01 165.64 124.54 202.44 195.13 215.51 216.33
Croatia 166.74 112.29 180.50 198.53 214.36 217.77 146.65 235.74 259.28 279.96 Czech
Republic 206.81 139.08 223.57 245.90 265.51 270.10 181.65 291.99 321.15 346.76 Hungary 154.33 100.58 161.68 177.83 192.01 201.55 131.36 211.16 232.25 250.77 Poland 717.90 477.80 768.05 844.76 912.11 937.58 624.02 1,003.09 1,103.27 1,191.24
Romania 497.50 335.76 539.73 593.63 640.97 649.74 438.51 704.90 775.30 837.11 Slovakia 150.65 101.32 162.87 179.13 193.42 196.76 132.33 212.71 233.95 252.61 Slovenia 98.72 65.35 105.05 115.54 124.75 128.93 85.35 137.19 150.89 162.93 Total 4,609.07 3,958.30 4,847.18 5,624.54 6,101.01 6,019.53 5,169.61 6,330.51 7,345.75 7,968.03
N5565 Forest areas designated for recreational use Forest areas designated for conservation
Denmark 39.05 32.30 52.88 33.90 65.53 51.00 42.18 69.06 44.28 85.58 United
Kingdom 222.19 155.11 167.54 217.15 271.48 290.19 202.57 218.81 283.60 354.56 Estonia 178.38 118.30 190.17 209.16 225.84 232.97 154.51 248.36 273.17 294.95 Latvia 229.69 152.16 244.60 269.03 290.48 299.98 198.73 319.45 351.36 379.37
Lithuania 163.93 106.54 171.26 188.37 203.39 214.10 139.14 223.67 246.01 265.63 Total 833.25 564.41 826.45 917.61 1,056.72 1,088.24 737.13 1,079.36 1,198.41 1,380.09
N6571 Forest areas designated for recreational use Forest areas designated for conservation
Finland 1,757.25 1,423.29 1,405.73 1,289.95 1,333.84 2,295.00 1,858.84 1,835.91 1,684.70 1,742.02 Iceland 3.59 2.31 2.26 2.21 2.18 4.69 3.02 2.95 2.88 2.85 Norway 733.12 505.93 490.22 401.48 449.93 957.47 660.75 640.23 524.34 587.62 Sweden 2,149.94 1,773.15 1,733.67 2,021.52 1,773.21 2,807.86 2,315.76 2,264.20 2,640.15 2,315.84 Total 4,643.90 3,704.67 3,631.88 3,715.15 3,559.17 6,065.02 4,838.36 4,743.29 4,852.06 4,648.34
Note: the projection of forest areas for 2050 is computed based on the ATEAM projection of total forest areas changed under IPCC scenarios, assuming constant proportions of total forest areas designated for recreational use (7.81%) or conservation use (10.2%), which are the average of the real data of the designated forest composition recorded by FAO/FRA 2005.
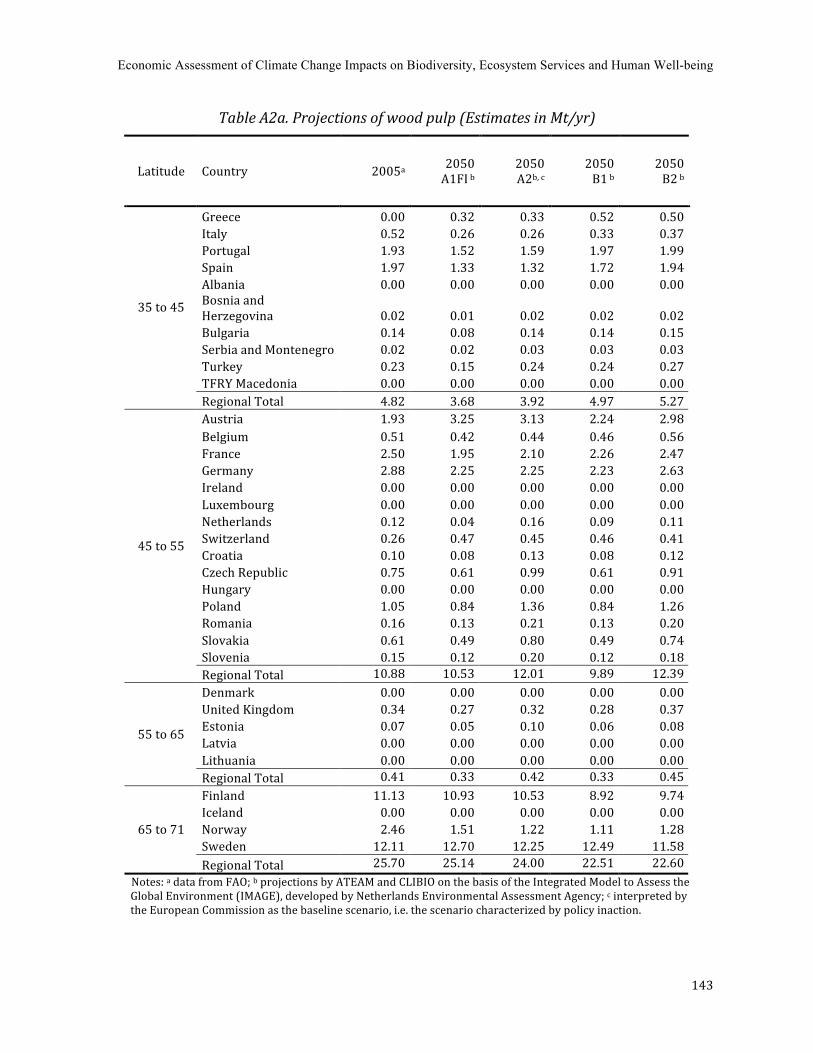
Economic Assessment of Climate Change Impacts on Biodiversity, Ecosystem Services and Human Well-being
143
Table A2a. Projections of wood pulp (Estimates in Mt/yr)
Latitude Country 2005a 2050 A1FI b
2050 A2b, c
2050 B1 b
2050 B2 b
Greece 0.00 0.32 0.33 0.52 0.50 Italy 0.52 0.26 0.26 0.33 0.37 Portugal 1.93 1.52 1.59 1.97 1.99 Spain 1.97 1.33 1.32 1.72 1.94 Albania 0.00 0.00 0.00 0.00 0.00 Bosnia and Herzegovina 0.02 0.01 0.02 0.02 0.02 Bulgaria 0.14 0.08 0.14 0.14 0.15 Serbia and Montenegro 0.02 0.02 0.03 0.03 0.03 Turkey 0.23 0.15 0.24 0.24 0.27 TFRY Macedonia 0.00 0.00 0.00 0.00 0.00
35 to 45
Regional Total 4.82 3.68 3.92 4.97 5.27 Austria 1.93 3.25 3.13 2.24 2.98 Belgium 0.51 0.42 0.44 0.46 0.56 France 2.50 1.95 2.10 2.26 2.47 Germany 2.88 2.25 2.25 2.23 2.63 Ireland 0.00 0.00 0.00 0.00 0.00 Luxembourg 0.00 0.00 0.00 0.00 0.00 Netherlands 0.12 0.04 0.16 0.09 0.11 Switzerland 0.26 0.47 0.45 0.46 0.41 Croatia 0.10 0.08 0.13 0.08 0.12 Czech Republic 0.75 0.61 0.99 0.61 0.91 Hungary 0.00 0.00 0.00 0.00 0.00 Poland 1.05 0.84 1.36 0.84 1.26 Romania 0.16 0.13 0.21 0.13 0.20 Slovakia 0.61 0.49 0.80 0.49 0.74 Slovenia 0.15 0.12 0.20 0.12 0.18
45 to 55
Regional Total 10.88 10.53 12.01 9.89 12.39 Denmark 0.00 0.00 0.00 0.00 0.00 United Kingdom 0.34 0.27 0.32 0.28 0.37 Estonia 0.07 0.05 0.10 0.06 0.08 Latvia 0.00 0.00 0.00 0.00 0.00 Lithuania 0.00 0.00 0.00 0.00 0.00
55 to 65
Regional Total 0.41 0.33 0.42 0.33 0.45 Finland 11.13 10.93 10.53 8.92 9.74 Iceland 0.00 0.00 0.00 0.00 0.00 Norway 2.46 1.51 1.22 1.11 1.28 Sweden 12.11 12.70 12.25 12.49 11.58
65 to 71
Regional Total 25.70 25.14 24.00 22.51 22.60 Notes: a data from FAO; b projections by ATEAM and CLIBIO on the basis of the Integrated Model to Assess the Global Environment (IMAGE), developed by Netherlands Environmental Assessment Agency; c interpreted by the European Commission as the baseline scenario, i.e. the scenario characterized by policy inaction.
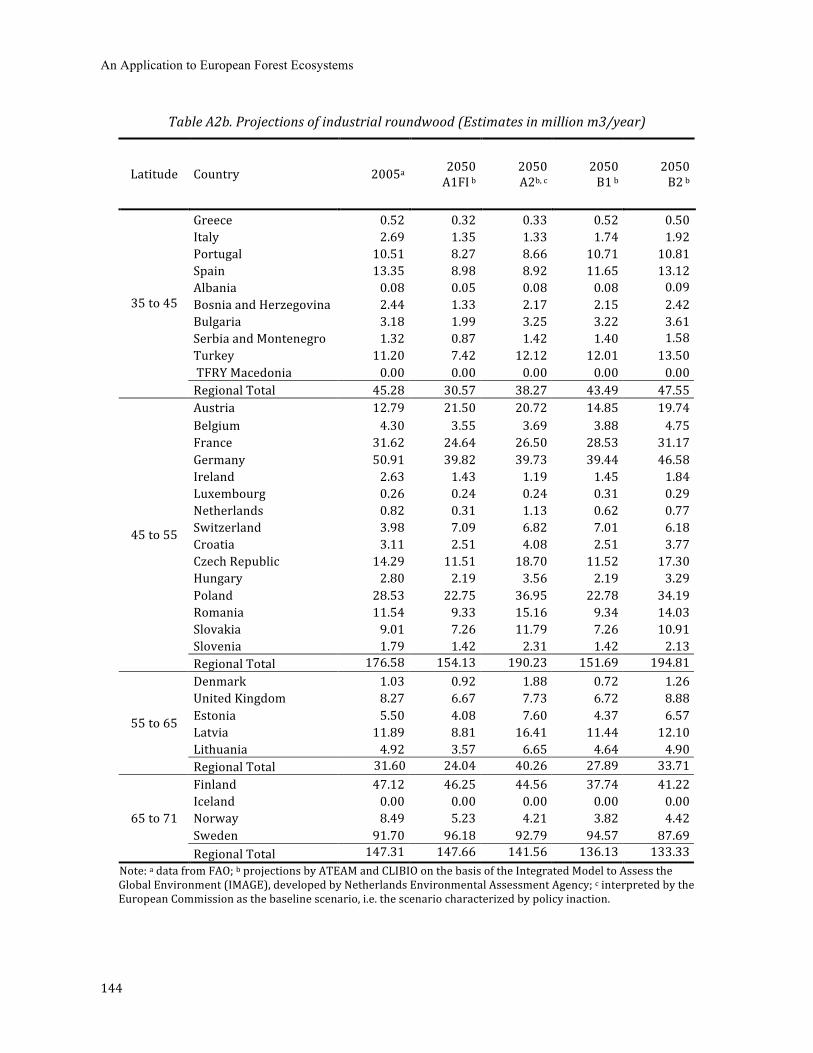
An Application to European Forest Ecosystems
144
Table A2b. Projections of industrial roundwood (Estimates in million m3/year)
Latitude Country 2005a 2050 A1FI b
2050 A2b, c
2050 B1 b
2050 B2 b
Greece 0.52 0.32 0.33 0.52 0.50 Italy 2.69 1.35 1.33 1.74 1.92 Portugal 10.51 8.27 8.66 10.71 10.81 Spain 13.35 8.98 8.92 11.65 13.12 Albania 0.08 0.05 0.08 0.08 0.09 Bosnia and Herzegovina 2.44 1.33 2.17 2.15 2.42 Bulgaria 3.18 1.99 3.25 3.22 3.61 Serbia and Montenegro 1.32 0.87 1.42 1.40 1.58 Turkey 11.20 7.42 12.12 12.01 13.50 TFRY Macedonia 0.00 0.00 0.00 0.00 0.00
35 to 45
Regional Total 45.28 30.57 38.27 43.49 47.55 Austria 12.79 21.50 20.72 14.85 19.74 Belgium 4.30 3.55 3.69 3.88 4.75 France 31.62 24.64 26.50 28.53 31.17 Germany 50.91 39.82 39.73 39.44 46.58 Ireland 2.63 1.43 1.19 1.45 1.84 Luxembourg 0.26 0.24 0.24 0.31 0.29 Netherlands 0.82 0.31 1.13 0.62 0.77 Switzerland 3.98 7.09 6.82 7.01 6.18 Croatia 3.11 2.51 4.08 2.51 3.77 Czech Republic 14.29 11.51 18.70 11.52 17.30 Hungary 2.80 2.19 3.56 2.19 3.29 Poland 28.53 22.75 36.95 22.78 34.19 Romania 11.54 9.33 15.16 9.34 14.03 Slovakia 9.01 7.26 11.79 7.26 10.91 Slovenia 1.79 1.42 2.31 1.42 2.13
45 to 55
Regional Total 176.58 154.13 190.23 151.69 194.81 Denmark 1.03 0.92 1.88 0.72 1.26 United Kingdom 8.27 6.67 7.73 6.72 8.88 Estonia 5.50 4.08 7.60 4.37 6.57 Latvia 11.89 8.81 16.41 11.44 12.10 Lithuania 4.92 3.57 6.65 4.64 4.90
55 to 65
Regional Total 31.60 24.04 40.26 27.89 33.71 Finland 47.12 46.25 44.56 37.74 41.22 Iceland 0.00 0.00 0.00 0.00 0.00 Norway 8.49 5.23 4.21 3.82 4.42 Sweden 91.70 96.18 92.79 94.57 87.69
65 to 71
Regional Total 147.31 147.66 141.56 136.13 133.33 Note: a data from FAO; b projections by ATEAM and CLIBIO on the basis of the Integrated Model to Assess the Global Environment (IMAGE), developed by Netherlands Environmental Assessment Agency; c interpreted by the European Commission as the baseline scenario, i.e. the scenario characterized by policy inaction.

Economic Assessment of Climate Change Impacts on Biodiversity, Ecosystem Services and Human Well-being
145
Table A2c. Projections of recovered paper (Estimates in Mt/yr)
Latitude Country 2005a 2050 A1FI b
2050 A2b, c
2050 B1 b
2050 B2 b
Greece 0.35 0.32 0.33 0.52 0.50 Italy 5.49 2.76 2.72 3.55 3.92 Portugal 0.60 0.47 0.49 0.61 0.61 Spain 4.32 2.91 2.89 3.77 4.25 Albania 0.00 0.00 0.00 0.00 0.00 Bosnia and Herzegovina 0.00 0.00 0.00 0.00 0.00 Bulgaria 0.08 0.05 0.08 0.08 0.09 Serbia and Montenegro 0.00 0.00 0.00 0.00 0.00 Turkey 1.02 0.00 0.00 0.00 0.00
35 to 45
TFRY Macedonia 0.00 0.67 1.10 1.09 1.22 Regional Total 11.85 7.18 7.61 9.62 10.60
Austria 1.42 7.18 7.61 9.62 10.60 Belgium 2.14 2.39 2.30 1.65 2.19 France 5.95 1.77 1.83 1.93 2.36 Germany 14.41 4.64 4.99 5.37 5.87 Ireland 0.44 11.27 11.25 11.17 13.19 Luxembourg 0.06 0.24 0.20 0.24 0.31 Netherlands 2.46 0.06 0.06 0.07 0.07 Switzerland 1.24 0.93 3.38 1.87 2.32 Croatia 0.00 2.42 2.36 1.46 2.04 Czech Republic 0.48 0.39 0.63 0.39 0.58 Hungary 0.37 0.29 0.47 0.29 0.43 Poland 1.20 0.96 1.55 0.96 1.44 Romania 0.30 0.24 0.39 0.24 0.36 Slovakia 0.21 0.17 0.28 0.17 0.26
45 to 55
Slovenia 0.00 0.00 0.00 0.00 0.00 Regional Total 30.69 25.76 29.68 25.80 31.42
Denmark 0.44 0.39 0.80 0.31 0.53 United Kingdom 7.76 6.25 7.25 6.30 8.33 Estonia 0.05 0.04 0.07 0.04 0.06 Latvia 0.06 0.04 0.08 0.06 0.06
55 to 65
Lithuania 0.08 0.06 0.11 0.07 0.08 Regional Total 8.38 6.78 8.31 6.78 9.06
Finland 0.60 0.59 0.57 0.48 0.52 Iceland 0.01 0.01 0.01 0.01 0.01 Norway 0.44 0.27 0.22 0.20 0.23
65 to 71
Sweden 1.57 1.64 1.59 1.62 1.50 Regional Total 2.62 2.51 2.38 2.30 2.26 Notes: a data from FAO; b projections by ATEAM and CLIBIO on the basis of the Integrated Model to Assess the Global Environment (IMAGE), developed by Netherlands Environmental Assessment Agency; c interpreted by the European Commission as the baseline scenario, i.e. the scenario characterized by policy inaction.
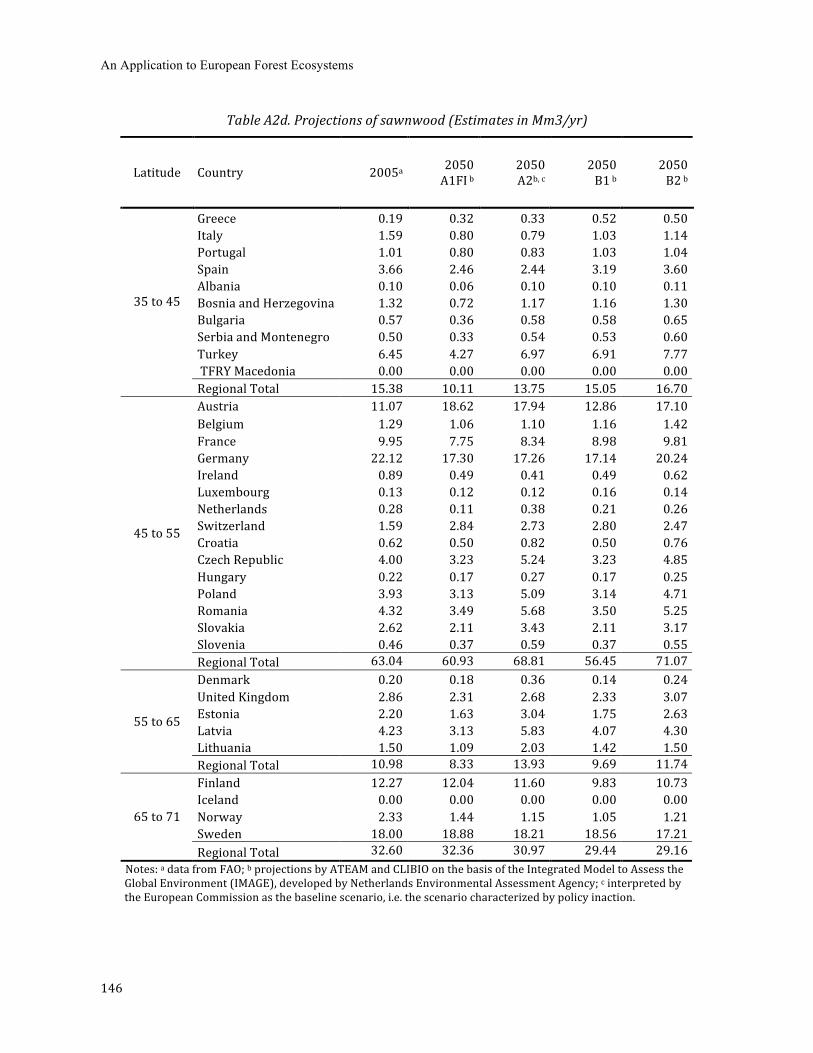
An Application to European Forest Ecosystems
146
Table A2d. Projections of sawnwood (Estimates in Mm3/yr)
Latitude Country 2005a 2050 A1FI b
2050 A2b, c
2050 B1 b
2050 B2 b
Greece 0.19 0.32 0.33 0.52 0.50 Italy 1.59 0.80 0.79 1.03 1.14 Portugal 1.01 0.80 0.83 1.03 1.04 Spain 3.66 2.46 2.44 3.19 3.60 Albania 0.10 0.06 0.10 0.10 0.11 Bosnia and Herzegovina 1.32 0.72 1.17 1.16 1.30 Bulgaria 0.57 0.36 0.58 0.58 0.65 Serbia and Montenegro 0.50 0.33 0.54 0.53 0.60 Turkey 6.45 4.27 6.97 6.91 7.77 TFRY Macedonia 0.00 0.00 0.00 0.00 0.00
35 to 45
Regional Total 15.38 10.11 13.75 15.05 16.70 Austria 11.07 18.62 17.94 12.86 17.10 Belgium 1.29 1.06 1.10 1.16 1.42 France 9.95 7.75 8.34 8.98 9.81 Germany 22.12 17.30 17.26 17.14 20.24 Ireland 0.89 0.49 0.41 0.49 0.62 Luxembourg 0.13 0.12 0.12 0.16 0.14 Netherlands 0.28 0.11 0.38 0.21 0.26 Switzerland 1.59 2.84 2.73 2.80 2.47 Croatia 0.62 0.50 0.82 0.50 0.76 Czech Republic 4.00 3.23 5.24 3.23 4.85 Hungary 0.22 0.17 0.27 0.17 0.25 Poland 3.93 3.13 5.09 3.14 4.71 Romania 4.32 3.49 5.68 3.50 5.25 Slovakia 2.62 2.11 3.43 2.11 3.17 Slovenia 0.46 0.37 0.59 0.37 0.55
45 to 55
Regional Total 63.04 60.93 68.81 56.45 71.07 Denmark 0.20 0.18 0.36 0.14 0.24 United Kingdom 2.86 2.31 2.68 2.33 3.07 Estonia 2.20 1.63 3.04 1.75 2.63 Latvia 4.23 3.13 5.83 4.07 4.30 Lithuania 1.50 1.09 2.03 1.42 1.50
55 to 65
Regional Total 10.98 8.33 13.93 9.69 11.74 Finland 12.27 12.04 11.60 9.83 10.73 Iceland 0.00 0.00 0.00 0.00 0.00 Norway 2.33 1.44 1.15 1.05 1.21 Sweden 18.00 18.88 18.21 18.56 17.21
65 to 71
Regional Total 32.60 32.36 30.97 29.44 29.16 Notes: a data from FAO; b projections by ATEAM and CLIBIO on the basis of the Integrated Model to Assess the Global Environment (IMAGE), developed by Netherlands Environmental Assessment Agency; c interpreted by the European Commission as the baseline scenario, i.e. the scenario characterized by policy inaction.
Economic Assessment of Climate Change Impacts on Biodiversity, Ecosystem Services and Human Well-being
147
Table A2e. Projections of woodbased panels (Estimates in Mm3/yr)
Latitude Country 2005a 2050 A1FI b
2050 A2b, c
2050 B1 b
2050 B2 b
Greece 0.87 0.32 0.33 0.52 0.50 Italy 5.61 2.82 2.79 3.63 4.01 Portugal 1.31 1.03 1.08 1.33 1.34 Spain 4.84 3.26 3.24 4.23 4.76 Albania 0.04 0.02 0.04 0.04 0.04 Bosnia and Herzegovina 0.00 0.00 0.00 0.00 0.00 Bulgaria 0.35 0.22 0.35 0.35 0.39 Serbia and Montenegro 0.07 0.05 0.08 0.07 0.08 Turkey 4.77 3.16 5.16 5.12 5.75 TFRY Macedonia 0.00 0.00 0.00 0.00 0.00
35 to 45
Regional Total 17.86 10.87 13.06 15.29 16.88 Austria 3.45 5.81 5.60 4.01 5.33 Belgium 2.80 2.32 2.40 2.53 3.10 France 6.40 4.99 5.36 5.77 6.31 Germany 16.98 13.28 13.25 13.15 15.54 Ireland 0.88 0.48 0.40 0.48 0.61 Luxembourg 0.45 0.42 0.41 0.53 0.49 Netherlands 0.01 0.00 0.02 0.01 0.01 Switzerland 0.97 1.72 1.65 1.70 1.50 Croatia 0.13 0.10 0.17 0.10 0.16 Czech Republic 1.49 1.20 1.95 1.20 1.81 Hungary 0.67 0.53 0.85 0.53 0.79 Poland 6.74 5.37 8.73 5.38 8.07 Romania 1.01 0.82 1.33 0.82 1.23 Slovakia 0.61 0.49 0.79 0.49 0.73 Slovenia 0.41 0.33 0.53 0.33 0.49
45 to 55
Regional Total 42.58 37.52 42.91 36.71 45.67 Denmark 0.35 0.31 0.63 0.24 0.42 United Kingdom 3.40 2.74 3.18 2.76 3.65 Estonia 0.41 0.30 0.57 0.33 0.49 Latvia 0.43 0.32 0.59 0.41 0.43 Lithuania 0.40 0.29 0.54 0.38 0.40
55 to 65
Regional Total 4.98 3.96 5.50 4.12 5.39 Finland 1.99 1.95 1.88 1.59 1.74 Iceland 0.00 0.00 0.00 0.00 0.00 Norway 0.58 0.36 0.29 0.26 0.30 Sweden 0.75 0.78 0.76 0.77 0.71
65 to 71
Regional Total 3.31 3.09 2.92 2.62 2.75 Notes: a data from FAO; b projections by ATEAM and CLIBIO on the basis of the Integrated Model to Assess the Global Environment (IMAGE), developed by Netherlands Environmental Assessment Agency; c interpreted by the European Commission as the baseline scenario, i.e. the scenario characterized by policy inaction.
An Application to European Forest Ecosystems
148
Table A2f. Projections of paper and paperboard (Estimates in Mt/yr)
Latitude Country 2005a 2050 A1FI b
2050 A2b, c
2050 B1 b
2050 B2 b
Greece 0.53 0.32 0.33 0.52 0.50 Italy 10.00 5.03 4.96 6.46 7.14 Portugal 1.58 1.24 1.30 1.61 1.62 Spain 5.70 3.83 3.81 4.97 5.60 Albania 0.00 0.00 0.00 0.00 0.00 Bosnia and Herzegovina 0.08 0.04 0.07 0.07 0.08 Bulgaria 0.33 0.20 0.33 0.33 0.37 Serbia and Montenegro 0.23 0.15 0.25 0.24 0.27 Turkey 1.15 0.76 1.25 1.24 1.39 TFRY Macedonia 0.00 0.00 0.00 0.00 0.00
35 to 45
Regional Total 19.60 11.58 12.30 15.45 16.98 Austria 4.95 8.32 8.02 5.75 7.64 Belgium 1.90 1.57 1.63 1.71 2.10 France 10.33 8.05 8.66 9.32 10.19 Germany 21.68 16.96 16.92 16.80 19.84 Ireland 0.05 0.02 0.02 0.02 0.03 Luxembourg 0.00 0.00 0.00 0.00 0.00 Netherlands 3.47 1.32 4.77 2.63 3.27 Switzerland 1.75 3.12 3.00 3.08 2.72 Croatia 0.59 0.48 0.78 0.48 0.72 Czech Republic 0.97 0.78 1.27 0.78 1.17 Hungary 0.57 0.45 0.72 0.45 0.67 Poland 2.73 2.18 3.54 2.18 3.27 Romania 0.37 0.30 0.49 0.30 0.45 Slovakia 0.86 0.69 1.12 0.69 1.04 Slovenia 0.56 0.44 0.72 0.44 0.66
45 to 55
Regional Total 50.22 44.24 50.93 44.20 53.11 Denmark 0.42 0.38 0.77 0.30 0.52 United Kingdom 6.24 5.03 5.83 5.07 6.70 Estonia 0.07 0.05 0.09 0.05 0.08 Latvia 0.04 0.03 0.05 0.04 0.04 Lithuania 0.11 0.08 0.15 0.11 0.11
55 to 65
Regional Total 6.88 5.57 6.90 5.56 7.45 Finland 12.39 12.16 11.72 9.93 10.84 Iceland 0.00 0.00 0.00 0.00 0.00 Norway 2.22 1.37 1.10 1.00 1.16 Sweden 11.74 12.31 11.87 12.10 11.22
65 to 71
Regional Total 26.35 25.84 24.70 23.03 23.22 Notes: a data from FAO; b projections by ATEAM and CLIBIO on the basis of the Integrated Model to Assess the Global Environment (IMAGE), developed by Netherlands Environmental Assessment Agency; c interpreted by the European Commission as the baseline scenario, i.e. the scenario characterized by policy inaction.
.
Economic Assessment of Climate Change Impacts on Biodiversity, Ecosystem Services and Human Well-being
149
Table A2g. Projection of woodfuel (Estimates in Mm3/yr)
Latitude Country 2005a 2050 A1FI b
2050 A2b, c
2050 B1 b
2050 B2 b
Greece 1.00 0.32 0.33 0.52 0.50 Italy 5.36 2.69 2.66 3.46 3.83 Portugal 0.60 0.47 0.49 0.61 0.62 Spain 2.18 1.47 1.46 1.90 2.14 Albania 0.22 0.14 0.23 0.23 0.26 Bosnia and Herzegovina 1.36 0.74 1.21 1.20 1.35 Bulgaria 2.68 1.67 2.73 2.71 3.04 Serbia and Montenegro 1.85 1.22 2.00 1.98 2.22 Turkey 4.98 3.30 5.39 5.34 6.00 TFRY Macedonia 0.00 0.00 0.00 0.00 0.00
35 to 45
Regional Total 20.24 12.03 16.50 17.96 19.96 Austria 3.69 6.20 5.97 4.28 5.69 Belgium 0.65 0.54 0.56 0.59 0.72 France 2.80 2.18 2.35 2.53 2.76 Germany 6.04 4.73 4.71 4.68 5.53 Ireland 0.02 0.01 0.01 0.01 0.01 Luxembourg 0.01 0.01 0.01 0.02 0.01 Netherlands 0.29 0.11 0.40 0.22 0.27 Switzerland 1.07 1.90 1.83 1.88 1.65 Croatia 0.91 0.61 0.98 1.08 1.17 Czech Republic 1.23 0.99 1.60 0.99 1.48 Hungary 3.14 2.45 3.98 2.45 3.68 Poland 3.41 2.72 4.42 2.72 4.09 Romania 2.96 2.39 3.89 2.40 3.60 Slovakia 0.30 0.24 0.39 0.24 0.36 Slovenia 0.94 0.75 1.22 0.75 1.12
45 to 55
Regional Total 26.50 25.07 31.09 24.07 31.03 Denmark 1.26 1.13 2.31 0.89 1.54 United Kingdom 0.32 0.26 0.30 0.26 0.34 Estonia 1.30 0.96 1.80 1.03 1.55 Latvia 0.95 0.70 1.31 0.91 0.97 Lithuania 1.13 0.82 1.53 1.07 1.13
55 to 65
Regional Total 4.96 3.87 7.24 4.16 5.53 Finland 4.48 4.40 4.24 3.59 3.92 Iceland 0.00 0.00 0.00 0.00 0.00 Norway 1.18 0.72 0.58 0.53 0.61 Sweden 7.00 7.34 7.08 7.22 6.69
65 to 71
Regional Total 12.66 12.47 11.91 11.34 11.23 Notes: a data from FAO; b projections by ATEAM and CLIBIO on the basis of the Integrated Model to Assess the Global Environment (IMAGE), developed by Netherlands Environmental Assessment Agency; c interpreted by the European Commission as the baseline scenario, i.e. the scenario characterized by policy inaction.

An Application to European Forest Ecosystems
150
Table A3. Projection of carbon stock in European forests (Estimates in Mt/year)
Latitude Country 1990a 2005b 2050d A1FI
2050d A2
2050d B1
2050d B2
Greece 293.23 305.53 190.46 201.11 368.57 319.44 Italy 1,315.59 1,389.67 1,186.02 1,200.24 1,826.60 1,770.73 Portugal 161.08 170.08 99.55 101.92 218.21 169.31 Spain 987.42 1,076.28 738.83 758.43 1,224.48 1,162.31 Albania 62.62 64.66 43.15 71.14 89.95 88.03 Bosnia and Herzegovina 177.93 177.93 122.61 202.14 255.58 250.11 Bulgaria 274.83 295.19 189.39 312.23 394.78 386.33 Serbia and Montenegro 215.71 219.38 148.65 245.07 309.86 303.23 Turkey 818.55 828.57 564.07 929.94 1,175.81 1,150.64 TFRY Macedonia 73.78 73.78 50.84 83.82 105.98 103.71
35 to 45
Regional Total 4,380.75 4,601.05 3,333.57 4,106.03 5,969.82 5,703.84 Austria 937.51 943.37 1,454.04 1,440.26 1,549.25 1,562.36 Belgium 72.87 72.87 64.56 67.19 97.03 103.55 France 1,702.22 1,724.73 1,880.61 2,135.35 3,134.30 3,099.40 Germany 1,257.57 1,257.57 1,281.98 1,395.33 2,233.45 2,130.37 Ireland 71.30 78.33 58.13 51.71 99.80 94.39 Luxembourg 23.50 23.50 24.40 24.53 31.68 27.03 Netherlands 52.10 52.82 24.57 69.80 61.58 71.22 Switzerland 294.63 300.04 547.99 540.40 653.70 620.48 Croatia 575.06 576.68 436.35 722.68 779.21 788.89 Czech Republic 712.27 715.24 540.47 895.12 965.14 977.12 Hungary 515.09 533.73 390.85 647.32 697.96 706.63 Poland 2,446.89 2,482.82 1,856.69 3,075.03 3,315.58 3,356.76 Romania 1,719.50 1,720.58 1,304.75 2,160.91 2,329.95 2,358.88 Slovakia 518.87 521.03 393.72 652.07 703.08 711.81 Slovenia 334.66 341.41 253.94 420.57 453.47 459.10
45 to 55
Regional Total 11,234.0 11,344.7 10,513.0 14,298.2 17,105.1 17,068.0 Denmark 60.92 62.68 53.44 91.68 71.13 121.77 United Kingdom 409.39 417.01 300.10 334.64 498.37 568.02 Estonia 304.98 310.55 212.33 354.77 459.44 446.08 Latvia 392.27 399.88 273.10 456.31 590.95 573.76 Lithuania 274.66 285.40 191.22 319.50 413.77 401.73
55 to 65
Regional Total 1,442.21 1,475.52 1,030.20 1,556.89 2,033.65 2,111.36 65 to 71 Finland 1,040.16 1,041.32 869.50 903.69 1,219.41 991.76 Norway 786.34 793.61 564.61 560.76 511.91 535.89 Sweden 1,770.79 1,774.27 1,508.58 1,459.27 2,421.32 1,676.58 Regional Total 3,597.29 3,609.20 2,942.69 2,923.71 4,152.64 3,204.23 Notes: a data from Karjalainen et al. (2003) and Advanced Terrestrial Ecosystem Analysis and Modelling (ATEAM), PIK; b EIBURS projections ; c projections by Karjalainen et al. (2003); d projections by ATEAM and EIBURS need to add the Finland study.
Economic Assessment of Climate Change Impacts on Biodiversity, Ecosystem Services and Human Well-being
151
Table A4a. Economic value of wood pulp (Estimates in $/ha/year, $2005)
Latitude Country 2005a 2050 A1FI b
2050 A2b, c
2050 B1 b
2050 B2 b
Greece n.a. n.a. n.a. n.a. n.a. Italy 1.56 0.94 0.94 0.86 0.94 Portugal 102.35 140.45 146.85 121.32 121.40 Spain 29.49 29.48 29.48 26.52 29.45 Albania n.s. n.s. n.s. n.s. n.s. Bosnia and Herzegovina n.s. n.s. n.s. n.s. n.s. Bulgaria 6.88 8.43 8.31 5.93 7.50 Serbia and Montenegro 0.09 0.09 0.09 0.08 0.08 Turkey 0.02 0.02 0.02 0.02 0.02 TFRY Macedonia n.s. n.s. n.s. n.s. n.s.
35 to 45
Regional Average 16.25 19.66 16.54 16.01 16.56 Austria 33.80 41.43 40.86 29.16 36.85 Belgium 590.07 618.64 412.76 339.12 344.33 France 15.63 12.55 12.69 10.93 10.93 Germany 38.92 33.55 33.39 26.31 28.11 Ireland n.s. n.s. n.s. n.s. n.s. Luxembourg n.s. n.s. n.s. n.s. n.s. Netherlands 865.81 794.10 1,031.84 721.28 721.20 Switzerland 70.23 77.01 76.84 71.49 62.80 Croatia 6.24 5.84 6.07 5.05 5.12 Czech Republic 65.77 61.57 63.95 53.22 53.88 Hungary n.s. n.s. n.s. n.s. n.s. Poland 2.28 2.13 2.21 1.84 1.86 Romania 0.95 0.89 0.93 0.77 0.78 Slovakia 23.77 29.13 28.73 20.50 25.91 Slovenia 16.98 15.89 16.51 13.74 13.91
45 to 55
Regional Average 31.89 32.16 34.38 24.13 26.27 Denmark n.s. n.s. n.s. n.s. n.s. United Kingdom 0.96 1.11 1.19 0.80 0.85 Estonia n.a. n.a. n.a. 0.00 n.a. Latvia n.s. n.s. n.s. 0.00 n.s. Lithuania n.s. n.s. n.s. n.s. n.s.
55 to 65
Regional Average 0.29 0.43 0.28 0.22 0.26 Finland 45.60 55.26 53.91 49.75 52.56 Iceland n.s. n.s. n.s. n.s. n.s. Norway 39.79 35.52 29.48 32.70 33.75 Sweden 68.66 87.32 86.15 75.30 79.60
65 to 71
Regional Average 55.32 90.20 87.33 81.53 84.41 Notes: a data from FAO; b EIBURS projections; c interpreted by the European Commission as the baseline scenario, i.e. the scenario characterized by policy inaction; n.a. not available; n.s. not significant
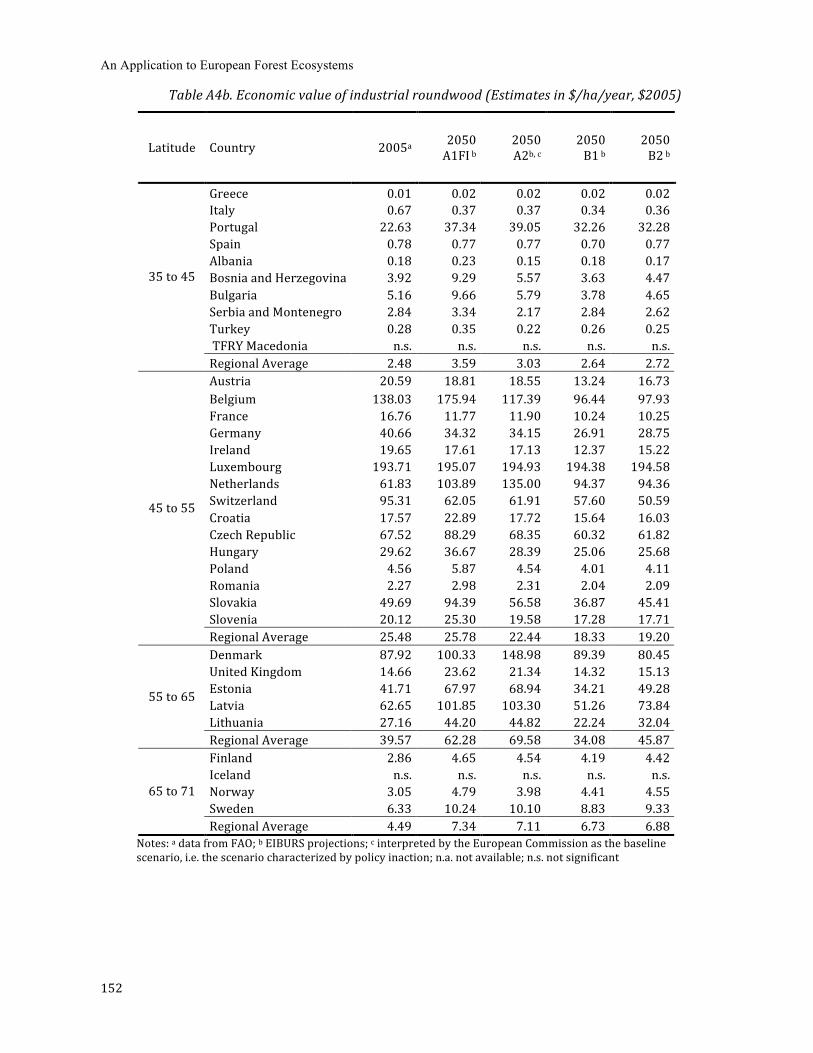
An Application to European Forest Ecosystems
152
Table A4b. Economic value of industrial roundwood (Estimates in $/ha/year, $2005)
Latitude Country 2005a 2050 A1FI b
2050 A2b, c
2050 B1 b
2050 B2 b
Greece 0.01 0.02 0.02 0.02 0.02 Italy 0.67 0.37 0.37 0.34 0.36 Portugal 22.63 37.34 39.05 32.26 32.28 Spain 0.78 0.77 0.77 0.70 0.77 Albania 0.18 0.23 0.15 0.18 0.17 Bosnia and Herzegovina 3.92 9.29 5.57 3.63 4.47 Bulgaria 5.16 9.66 5.79 3.78 4.65 Serbia and Montenegro 2.84 3.34 2.17 2.84 2.62 Turkey 0.28 0.35 0.22 0.26 0.25 TFRY Macedonia n.s. n.s. n.s. n.s. n.s.
35 to 45
Regional Average 2.48 3.59 3.03 2.64 2.72 Austria 20.59 18.81 18.55 13.24 16.73 Belgium 138.03 175.94 117.39 96.44 97.93 France 16.76 11.77 11.90 10.24 10.25 Germany 40.66 34.32 34.15 26.91 28.75 Ireland 19.65 17.61 17.13 12.37 15.22 Luxembourg 193.71 195.07 194.93 194.38 194.58 Netherlands 61.83 103.89 135.00 94.37 94.36 Switzerland 95.31 62.05 61.91 57.60 50.59 Croatia 17.57 22.89 17.72 15.64 16.03 Czech Republic 67.52 88.29 68.35 60.32 61.82 Hungary 29.62 36.67 28.39 25.06 25.68 Poland 4.56 5.87 4.54 4.01 4.11 Romania 2.27 2.98 2.31 2.04 2.09 Slovakia 49.69 94.39 56.58 36.87 45.41 Slovenia 20.12 25.30 19.58 17.28 17.71
45 to 55
Regional Average 25.48 25.78 22.44 18.33 19.20 Denmark 87.92 100.33 148.98 89.39 80.45 United Kingdom 14.66 23.62 21.34 14.32 15.13 Estonia 41.71 67.97 68.94 34.21 49.28 Latvia 62.65 101.85 103.30 51.26 73.84 Lithuania 27.16 44.20 44.82 22.24 32.04
55 to 65
Regional Average 39.57 62.28 69.58 34.08 45.87 Finland 2.86 4.65 4.54 4.19 4.42 Iceland n.s. n.s. n.s. n.s. n.s. Norway 3.05 4.79 3.98 4.41 4.55 Sweden 6.33 10.24 10.10 8.83 9.33
65 to 71
Regional Average 4.49 7.34 7.11 6.73 6.88 Notes: a data from FAO; b EIBURS projections; c interpreted by the European Commission as the baseline scenario, i.e. the scenario characterized by policy inaction; n.a. not available; n.s. not significant
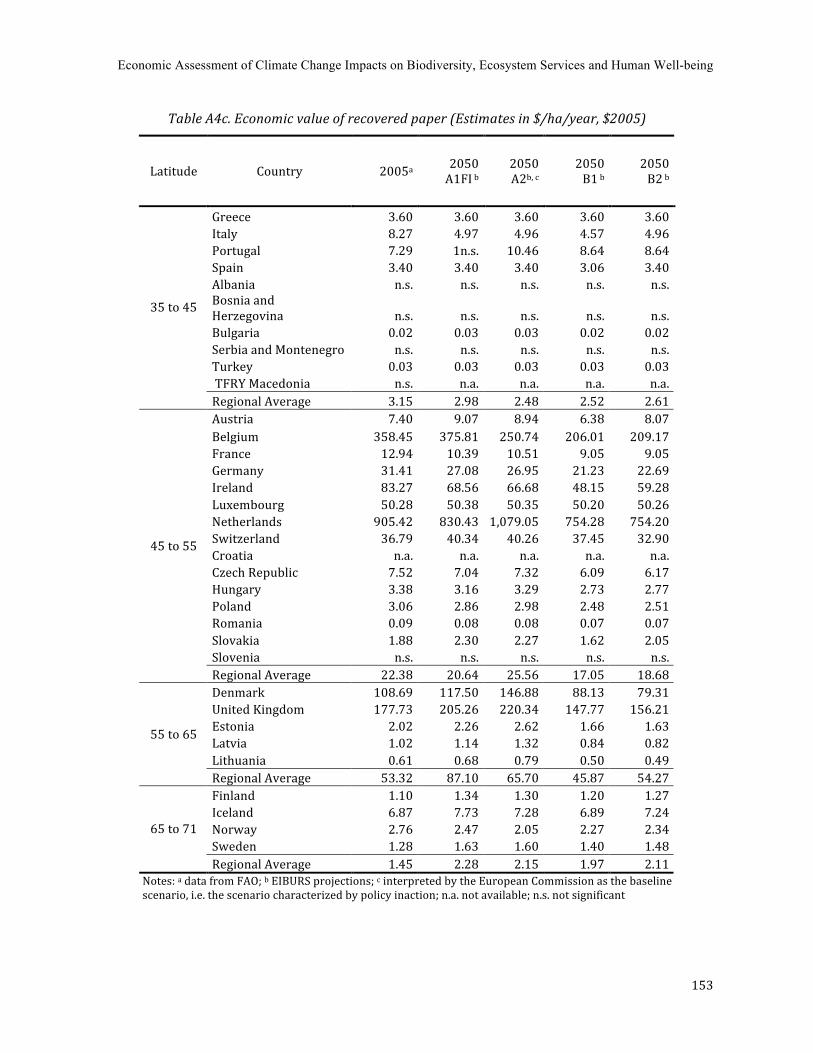
Economic Assessment of Climate Change Impacts on Biodiversity, Ecosystem Services and Human Well-being
153
Table A4c. Economic value of recovered paper (Estimates in $/ha/year, $2005)
Latitude Country 2005a 2050 A1FI b
2050 A2b, c
2050 B1 b
2050 B2 b
Greece 3.60 3.60 3.60 3.60 3.60 Italy 8.27 4.97 4.96 4.57 4.96 Portugal 7.29 1n.s. 10.46 8.64 8.64 Spain 3.40 3.40 3.40 3.06 3.40 Albania n.s. n.s. n.s. n.s. n.s. Bosnia and Herzegovina n.s. n.s. n.s. n.s. n.s. Bulgaria 0.02 0.03 0.03 0.02 0.02 Serbia and Montenegro n.s. n.s. n.s. n.s. n.s. Turkey 0.03 0.03 0.03 0.03 0.03 TFRY Macedonia n.s. n.a. n.a. n.a. n.a.
35 to 45
Regional Average 3.15 2.98 2.48 2.52 2.61 Austria 7.40 9.07 8.94 6.38 8.07 Belgium 358.45 375.81 250.74 206.01 209.17 France 12.94 10.39 10.51 9.05 9.05 Germany 31.41 27.08 26.95 21.23 22.69 Ireland 83.27 68.56 66.68 48.15 59.28 Luxembourg 50.28 50.38 50.35 50.20 50.26 Netherlands 905.42 830.43 1,079.05 754.28 754.20 Switzerland 36.79 40.34 40.26 37.45 32.90 Croatia n.a. n.a. n.a. n.a. n.a. Czech Republic 7.52 7.04 7.32 6.09 6.17 Hungary 3.38 3.16 3.29 2.73 2.77 Poland 3.06 2.86 2.98 2.48 2.51 Romania 0.09 0.08 0.08 0.07 0.07 Slovakia 1.88 2.30 2.27 1.62 2.05 Slovenia n.s. n.s. n.s. n.s. n.s.
45 to 55
Regional Average 22.38 20.64 25.56 17.05 18.68 Denmark 108.69 117.50 146.88 88.13 79.31 United Kingdom 177.73 205.26 220.34 147.77 156.21 Estonia 2.02 2.26 2.62 1.66 1.63 Latvia 1.02 1.14 1.32 0.84 0.82 Lithuania 0.61 0.68 0.79 0.50 0.49
55 to 65
Regional Average 53.32 87.10 65.70 45.87 54.27 Finland 1.10 1.34 1.30 1.20 1.27 Iceland 6.87 7.73 7.28 6.89 7.24 Norway 2.76 2.47 2.05 2.27 2.34 Sweden 1.28 1.63 1.60 1.40 1.48
65 to 71
Regional Average 1.45 2.28 2.15 1.97 2.11 Notes: a data from FAO; b EIBURS projections; c interpreted by the European Commission as the baseline scenario, i.e. the scenario characterized by policy inaction; n.a. not available; n.s. not significant

An Application to European Forest Ecosystems
154
Table A4d. Economic value of sawnwood (Estimates in $/ha/year, $2005)
Latitude Country 2005a 2050 A1FI b
2050 A2b, c
2050 B1 b
2050 B2 b
Greece 1.81 1.81 1.81 1.81 1.81 Italy 12.62 7.58 7.58 6.97 7.56 Portugal 19.58 26.88 28.10 23.22 23.23 Spain 2.76 2.76 2.76 2.49 2.76 Albania 5.42 5.38 5.47 4.93 5.13 Bosnia and Herzegovina 64.75 79.37 78.26 55.85 70.59 Bulgaria 9.93 12.17 12.00 8.57 10.83 Serbia and Montenegro 16.15 16.04 16.29 14.69 15.28 Turkey 1.41 1.40 1.42 1.28 1.33 TFRY Macedonia n.s. n.s. n.s. n.s. n.s.
35 to 45
Regional Average 8.40 11.50 9.41 7.39 8.19 Austria 384.74 471.59 465.02 331.85 419.42 Belgium 625.39 655.66 437.47 359.42 364.94 France 24.70 19.83 20.05 17.26 17.27 Germany 145.36 125.32 124.71 98.25 104.99 Ireland 101.69 83.73 81.44 58.80 72.39 Luxembourg 128.85 129.12 129.03 128.67 128.80 Netherlands 545.68 500.48 650.32 454.59 454.54 Switzerland 37.06 40.63 40.55 37.72 33.13 Croatia 71.22 66.67 69.25 57.63 58.35 Czech Republic 124.31 116.37 120.88 100.59 101.85 Hungary 34.17 31.99 33.23 27.65 28.00 Poland 19.21 17.98 18.68 15.54 15.74 Romania 79.43 74.35 77.23 64.27 65.07 Slovakia 130.64 160.13 157.90 112.68 142.42 Slovenia 64.45 60.33 62.67 52.15 52.81
45 to 55
Regional Average 98.03 108.13 95.41 70.80 78.50 Denmark 109.74 118.64 148.29 88.98 80.08 United Kingdom 38.67 44.66 47.94 32.15 33.99 Estonia 106.66 119.24 138.18 87.58 85.79 Latvia 189.99 212.41 246.14 156.01 152.81 Lithuania 95.41 106.67 123.61 78.35 76.74
55 to 65
Regional Average 109.43 173.30 189.22 94.61 126.62 Finland 71.84 87.07 84.94 78.39 82.81 Iceland n.s. n.s. n.s. n.s. n.s. Norway 10.06 8.98 7.45 8.27 8.53 Sweden 103.43 131.53 129.78 113.43 119.92
65 to 71
Regional Average 76.66 127.15 124.72 116.63 119.56 Notes: a data from FAO; b EIBURS projections; c interpreted by the European Commission as the baseline scenario, i.e. the scenario characterized by policy inaction; n.a. not available; n.s. not significant
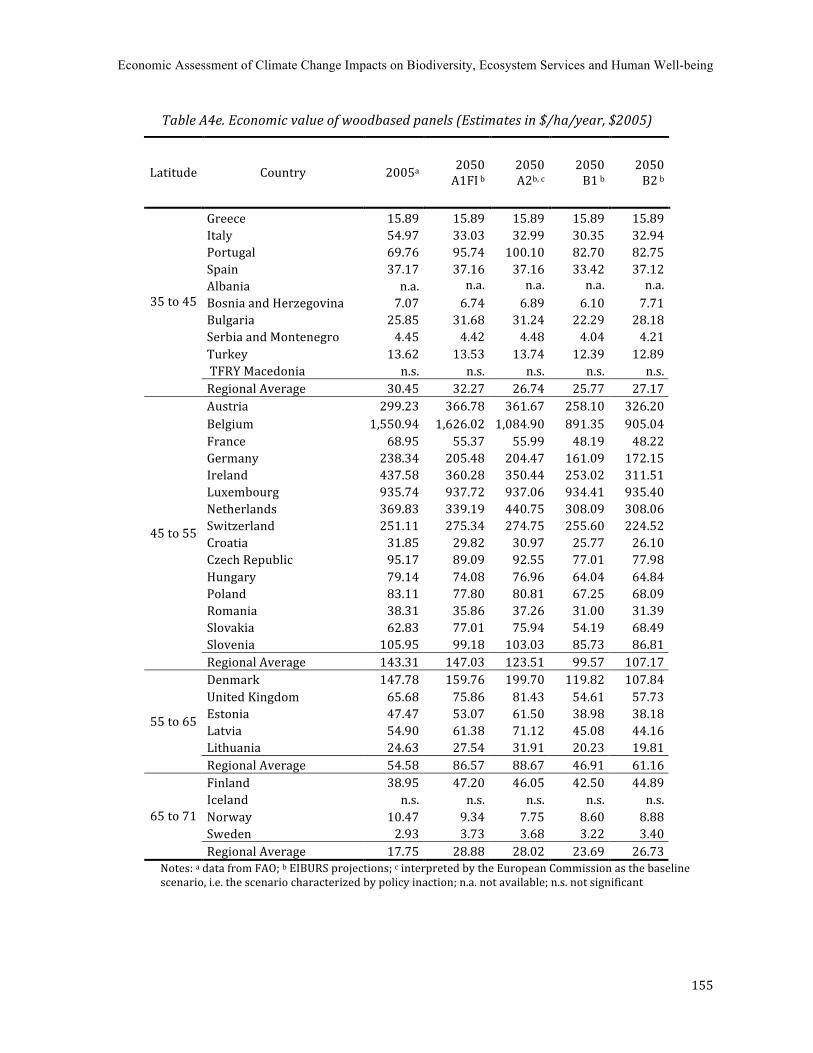
Economic Assessment of Climate Change Impacts on Biodiversity, Ecosystem Services and Human Well-being
155
Table A4e. Economic value of woodbased panels (Estimates in $/ha/year, $2005)
Latitude Country 2005a 2050 A1FI b
2050 A2b, c
2050 B1 b
2050 B2 b
Greece 15.89 15.89 15.89 15.89 15.89 Italy 54.97 33.03 32.99 30.35 32.94 Portugal 69.76 95.74 100.10 82.70 82.75 Spain 37.17 37.16 37.16 33.42 37.12 Albania n.a. n.a. n.a. n.a. n.a. Bosnia and Herzegovina 7.07 6.74 6.89 6.10 7.71 Bulgaria 25.85 31.68 31.24 22.29 28.18 Serbia and Montenegro 4.45 4.42 4.48 4.04 4.21 Turkey 13.62 13.53 13.74 12.39 12.89 TFRY Macedonia n.s. n.s. n.s. n.s. n.s.
35 to 45
Regional Average 30.45 32.27 26.74 25.77 27.17 Austria 299.23 366.78 361.67 258.10 326.20 Belgium 1,550.94 1,626.02 1,084.90 891.35 905.04 France 68.95 55.37 55.99 48.19 48.22 Germany 238.34 205.48 204.47 161.09 172.15 Ireland 437.58 360.28 350.44 253.02 311.51 Luxembourg 935.74 937.72 937.06 934.41 935.40 Netherlands 369.83 339.19 440.75 308.09 308.06 Switzerland 251.11 275.34 274.75 255.60 224.52 Croatia 31.85 29.82 30.97 25.77 26.10 Czech Republic 95.17 89.09 92.55 77.01 77.98 Hungary 79.14 74.08 76.96 64.04 64.84 Poland 83.11 77.80 80.81 67.25 68.09 Romania 38.31 35.86 37.26 31.00 31.39 Slovakia 62.83 77.01 75.94 54.19 68.49 Slovenia 105.95 99.18 103.03 85.73 86.81
45 to 55
Regional Average 143.31 147.03 123.51 99.57 107.17 Denmark 147.78 159.76 199.70 119.82 107.84 United Kingdom 65.68 75.86 81.43 54.61 57.73 Estonia 47.47 53.07 61.50 38.98 38.18 Latvia 54.90 61.38 71.12 45.08 44.16 Lithuania 24.63 27.54 31.91 20.23 19.81
55 to 65
Regional Average 54.58 86.57 88.67 46.91 61.16 Finland 38.95 47.20 46.05 42.50 44.89 Iceland n.s. n.s. n.s. n.s. n.s. Norway 10.47 9.34 7.75 8.60 8.88 Sweden 2.93 3.73 3.68 3.22 3.40
65 to 71
Regional Average 17.75 28.88 28.02 23.69 26.73 Notes: a data from FAO; b EIBURS projections; c interpreted by the European Commission as the baseline scenario, i.e. the scenario characterized by policy inaction; n.a. not available; n.s. not significant
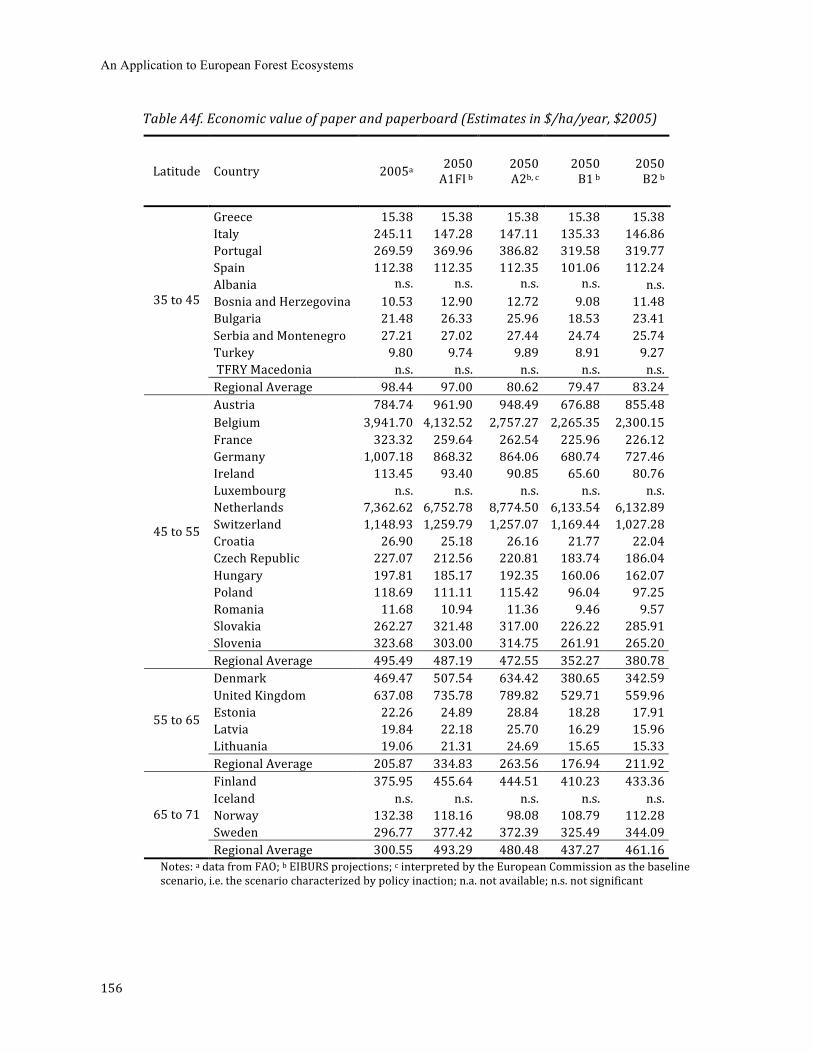
An Application to European Forest Ecosystems
156
Table A4f. Economic value of paper and paperboard (Estimates in $/ha/year, $2005)
Latitude Country 2005a 2050 A1FI b
2050 A2b, c
2050 B1 b
2050 B2 b
Greece 15.38 15.38 15.38 15.38 15.38 Italy 245.11 147.28 147.11 135.33 146.86 Portugal 269.59 369.96 386.82 319.58 319.77 Spain 112.38 112.35 112.35 101.06 112.24 Albania n.s. n.s. n.s. n.s. n.s. Bosnia and Herzegovina 10.53 12.90 12.72 9.08 11.48 Bulgaria 21.48 26.33 25.96 18.53 23.41 Serbia and Montenegro 27.21 27.02 27.44 24.74 25.74 Turkey 9.80 9.74 9.89 8.91 9.27 TFRY Macedonia n.s. n.s. n.s. n.s. n.s.
35 to 45
Regional Average 98.44 97.00 80.62 79.47 83.24 Austria 784.74 961.90 948.49 676.88 855.48 Belgium 3,941.70 4,132.52 2,757.27 2,265.35 2,300.15 France 323.32 259.64 262.54 225.96 226.12 Germany 1,007.18 868.32 864.06 680.74 727.46 Ireland 113.45 93.40 90.85 65.60 80.76 Luxembourg n.s. n.s. n.s. n.s. n.s. Netherlands 7,362.62 6,752.78 8,774.50 6,133.54 6,132.89 Switzerland 1,148.93 1,259.79 1,257.07 1,169.44 1,027.28 Croatia 26.90 25.18 26.16 21.77 22.04 Czech Republic 227.07 212.56 220.81 183.74 186.04 Hungary 197.81 185.17 192.35 160.06 162.07 Poland 118.69 111.11 115.42 96.04 97.25 Romania 11.68 10.94 11.36 9.46 9.57 Slovakia 262.27 321.48 317.00 226.22 285.91 Slovenia 323.68 303.00 314.75 261.91 265.20
45 to 55
Regional Average 495.49 487.19 472.55 352.27 380.78 Denmark 469.47 507.54 634.42 380.65 342.59 United Kingdom 637.08 735.78 789.82 529.71 559.96 Estonia 22.26 24.89 28.84 18.28 17.91 Latvia 19.84 22.18 25.70 16.29 15.96 Lithuania 19.06 21.31 24.69 15.65 15.33
55 to 65
Regional Average 205.87 334.83 263.56 176.94 211.92 Finland 375.95 455.64 444.51 410.23 433.36 Iceland n.s. n.s. n.s. n.s. n.s. Norway 132.38 118.16 98.08 108.79 112.28 Sweden 296.77 377.42 372.39 325.49 344.09
65 to 71
Regional Average 300.55 493.29 480.48 437.27 461.16 Notes: a data from FAO; b EIBURS projections; c interpreted by the European Commission as the baseline scenario, i.e. the scenario characterized by policy inaction; n.a. not available; n.s. not significant
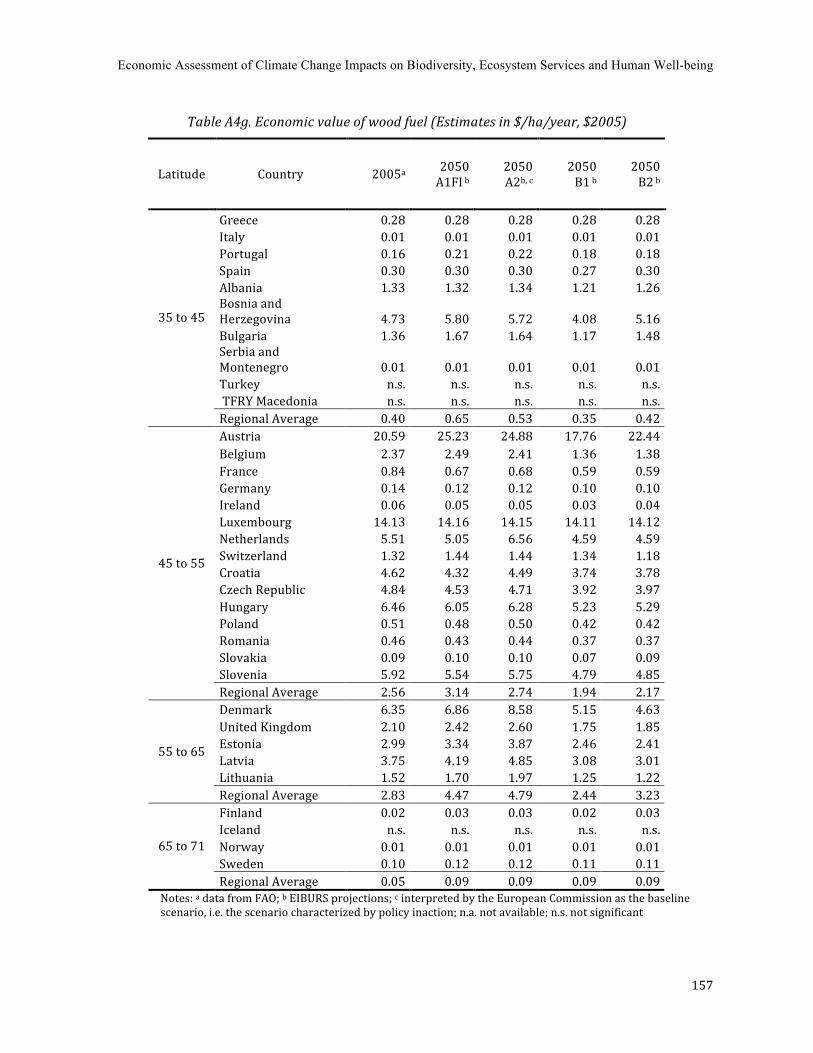
Economic Assessment of Climate Change Impacts on Biodiversity, Ecosystem Services and Human Well-being
157
Table A4g. Economic value of wood fuel (Estimates in $/ha/year, $2005)
Latitude Country 2005a 2050 A1FI b
2050 A2b, c
2050 B1 b
2050 B2 b
Greece 0.28 0.28 0.28 0.28 0.28 Italy 0.01 0.01 0.01 0.01 0.01 Portugal 0.16 0.21 0.22 0.18 0.18 Spain 0.30 0.30 0.30 0.27 0.30 Albania 1.33 1.32 1.34 1.21 1.26 Bosnia and Herzegovina 4.73 5.80 5.72 4.08 5.16 Bulgaria 1.36 1.67 1.64 1.17 1.48 Serbia and Montenegro 0.01 0.01 0.01 0.01 0.01 Turkey n.s. n.s. n.s. n.s. n.s. TFRY Macedonia n.s. n.s. n.s. n.s. n.s.
35 to 45
Regional Average 0.40 0.65 0.53 0.35 0.42 Austria 20.59 25.23 24.88 17.76 22.44 Belgium 2.37 2.49 2.41 1.36 1.38 France 0.84 0.67 0.68 0.59 0.59 Germany 0.14 0.12 0.12 0.10 0.10 Ireland 0.06 0.05 0.05 0.03 0.04 Luxembourg 14.13 14.16 14.15 14.11 14.12 Netherlands 5.51 5.05 6.56 4.59 4.59 Switzerland 1.32 1.44 1.44 1.34 1.18 Croatia 4.62 4.32 4.49 3.74 3.78 Czech Republic 4.84 4.53 4.71 3.92 3.97 Hungary 6.46 6.05 6.28 5.23 5.29 Poland 0.51 0.48 0.50 0.42 0.42 Romania 0.46 0.43 0.44 0.37 0.37 Slovakia 0.09 0.10 0.10 0.07 0.09 Slovenia 5.92 5.54 5.75 4.79 4.85
45 to 55
Regional Average 2.56 3.14 2.74 1.94 2.17 Denmark 6.35 6.86 8.58 5.15 4.63 United Kingdom 2.10 2.42 2.60 1.75 1.85 Estonia 2.99 3.34 3.87 2.46 2.41 Latvia 3.75 4.19 4.85 3.08 3.01 Lithuania 1.52 1.70 1.97 1.25 1.22
55 to 65
Regional Average 2.83 4.47 4.79 2.44 3.23 Finland 0.02 0.03 0.03 0.02 0.03 Iceland n.s. n.s. n.s. n.s. n.s. Norway 0.01 0.01 0.01 0.01 0.01 Sweden 0.10 0.12 0.12 0.11 0.11
65 to 71
Regional Average 0.05 0.09 0.09 0.09 0.09 Notes: a data from FAO; b EIBURS projections; c interpreted by the European Commission as the baseline scenario, i.e. the scenario characterized by policy inaction; n.a. not available; n.s. not significant
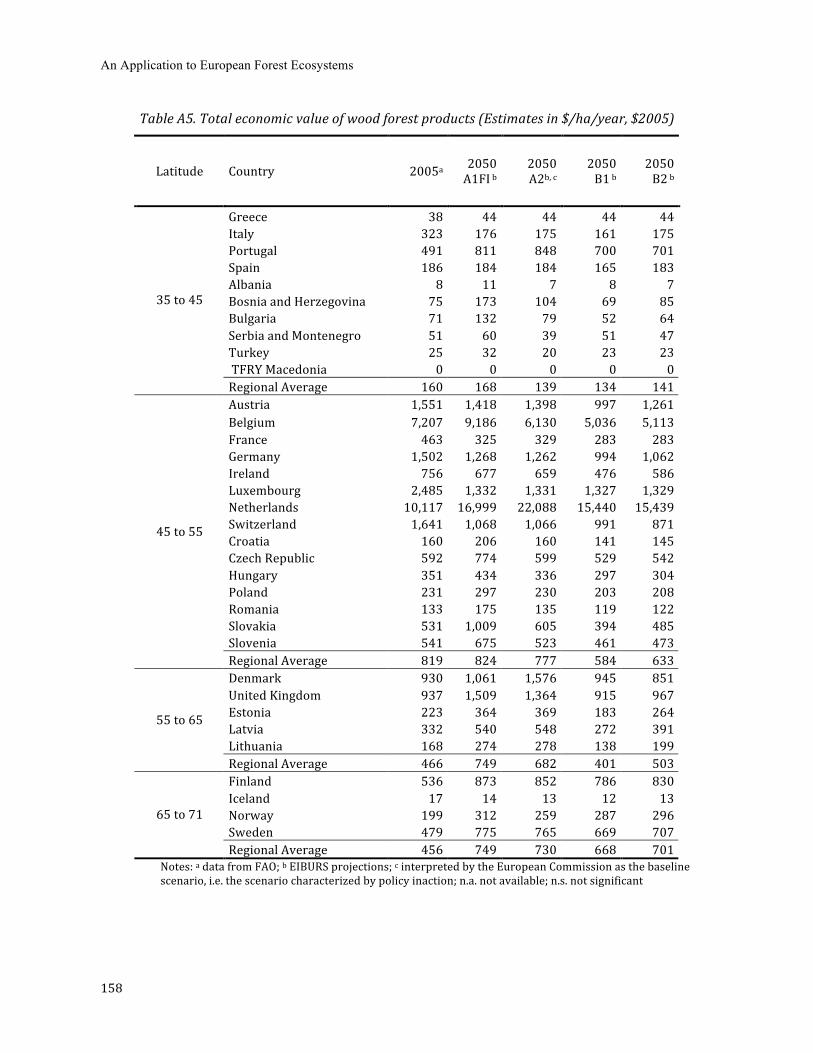
An Application to European Forest Ecosystems
158
Table A5. Total economic value of wood forest products (Estimates in $/ha/year, $2005)
Latitude Country 2005a 2050 A1FI b 2050
A2b, c 2050
B1 b 2050 B2 b
Greece 38 44 44 44 44 Italy 323 176 175 161 175 Portugal 491 811 848 700 701 Spain 186 184 184 165 183 Albania 8 11 7 8 7 Bosnia and Herzegovina 75 173 104 69 85 Bulgaria 71 132 79 52 64 Serbia and Montenegro 51 60 39 51 47 Turkey 25 32 20 23 23 TFRY Macedonia 0 0 0 0 0
35 to 45
Regional Average 160 168 139 134 141 Austria 1,551 1,418 1,398 997 1,261 Belgium 7,207 9,186 6,130 5,036 5,113 France 463 325 329 283 283 Germany 1,502 1,268 1,262 994 1,062 Ireland 756 677 659 476 586 Luxembourg 2,485 1,332 1,331 1,327 1,329 Netherlands 10,117 16,999 22,088 15,440 15,439 Switzerland 1,641 1,068 1,066 991 871 Croatia 160 206 160 141 145 Czech Republic 592 774 599 529 542 Hungary 351 434 336 297 304 Poland 231 297 230 203 208 Romania 133 175 135 119 122 Slovakia 531 1,009 605 394 485 Slovenia 541 675 523 461 473
45 to 55
Regional Average 819 824 777 584 633 Denmark 930 1,061 1,576 945 851 United Kingdom 937 1,509 1,364 915 967 Estonia 223 364 369 183 264 Latvia 332 540 548 272 391 Lithuania 168 274 278 138 199
55 to 65
Regional Average 466 749 682 401 503 Finland 536 873 852 786 830 Iceland 17 14 13 12 13 Norway 199 312 259 287 296 Sweden 479 775 765 669 707
65 to 71
Regional Average 456 749 730 668 701 Notes: a data from FAO; b EIBURS projections; c interpreted by the European Commission as the baseline scenario, i.e. the scenario characterized by policy inaction; n.a. not available; n.s. not significant
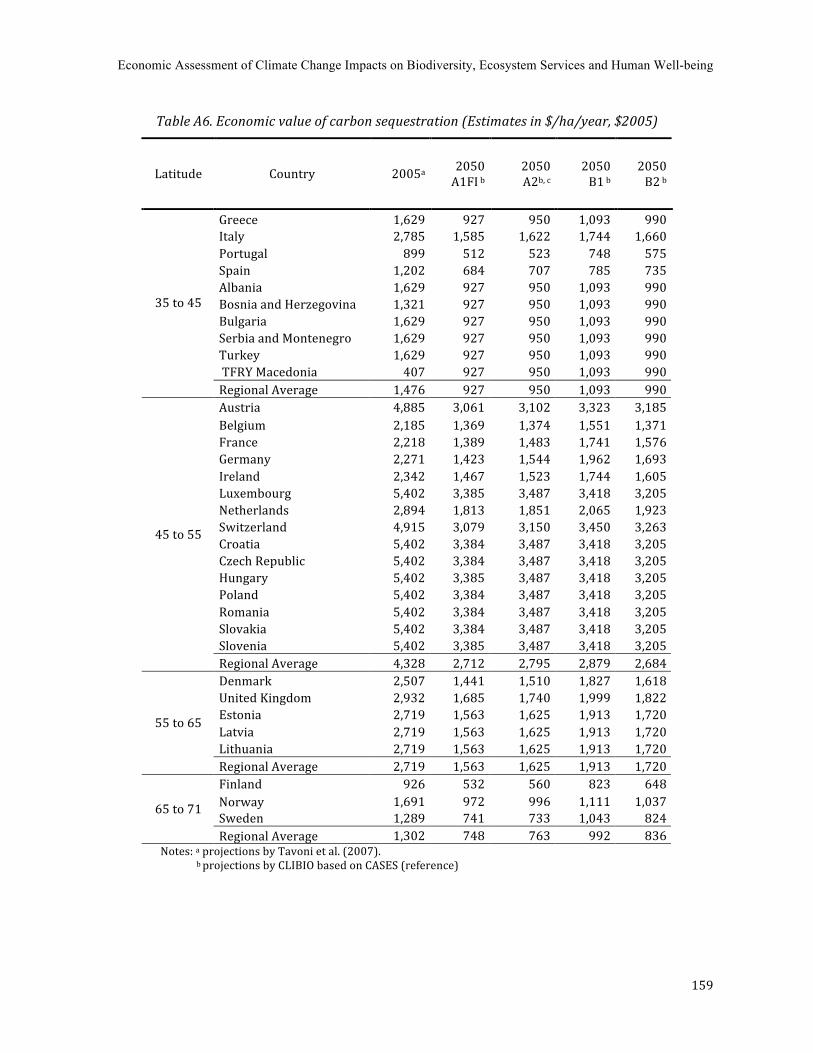
Economic Assessment of Climate Change Impacts on Biodiversity, Ecosystem Services and Human Well-being
159
Table A6. Economic value of carbon sequestration (Estimates in $/ha/year, $2005)
Latitude Country 2005a 2050 A1FI b
2050 A2b, c
2050 B1 b
2050 B2 b
Greece 1,629 927 950 1,093 990 Italy 2,785 1,585 1,622 1,744 1,660 Portugal 899 512 523 748 575 Spain 1,202 684 707 785 735 Albania 1,629 927 950 1,093 990 Bosnia and Herzegovina 1,321 927 950 1,093 990 Bulgaria 1,629 927 950 1,093 990 Serbia and Montenegro 1,629 927 950 1,093 990 Turkey 1,629 927 950 1,093 990 TFRY Macedonia 407 927 950 1,093 990
35 to 45
Regional Average 1,476 927 950 1,093 990 Austria 4,885 3,061 3,102 3,323 3,185 Belgium 2,185 1,369 1,374 1,551 1,371 France 2,218 1,389 1,483 1,741 1,576 Germany 2,271 1,423 1,544 1,962 1,693 Ireland 2,342 1,467 1,523 1,744 1,605 Luxembourg 5,402 3,385 3,487 3,418 3,205 Netherlands 2,894 1,813 1,851 2,065 1,923 Switzerland 4,915 3,079 3,150 3,450 3,263 Croatia 5,402 3,384 3,487 3,418 3,205 Czech Republic 5,402 3,384 3,487 3,418 3,205 Hungary 5,402 3,385 3,487 3,418 3,205 Poland 5,402 3,384 3,487 3,418 3,205 Romania 5,402 3,384 3,487 3,418 3,205 Slovakia 5,402 3,384 3,487 3,418 3,205 Slovenia 5,402 3,385 3,487 3,418 3,205
45 to 55
Regional Average 4,328 2,712 2,795 2,879 2,684 Denmark 2,507 1,441 1,510 1,827 1,618 United Kingdom 2,932 1,685 1,740 1,999 1,822 Estonia 2,719 1,563 1,625 1,913 1,720 Latvia 2,719 1,563 1,625 1,913 1,720 Lithuania 2,719 1,563 1,625 1,913 1,720
55 to 65
Regional Average 2,719 1,563 1,625 1,913 1,720 Finland 926 532 560 823 648 Norway 1,691 972 996 1,111 1,037 Sweden 1,289 741 733 1,043 824
65 to 71
Regional Average 1,302 748 763 992 836 Notes: a projections by Tavoni et al. (2007).
b projections by CLIBIO based on CASES (reference)
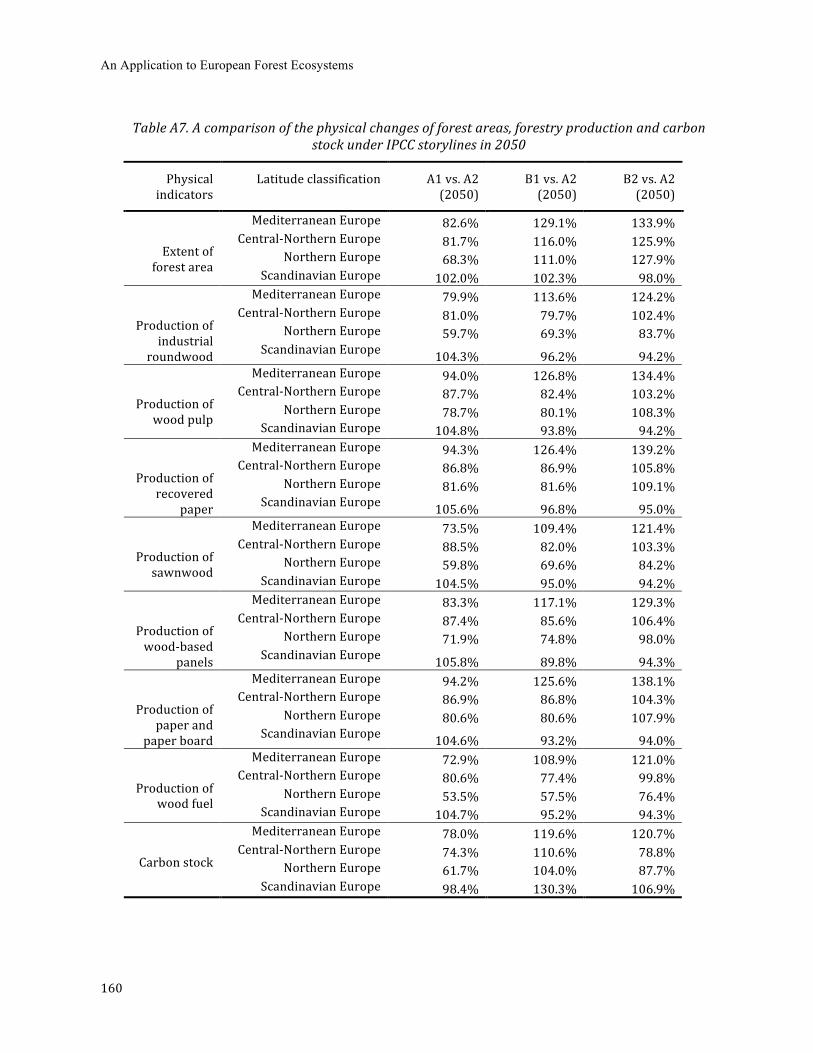
An Application to European Forest Ecosystems
160
Table A7. A comparison of the physical changes of forest areas, forestry production and carbon stock under IPCC storylines in 2050
Physical indicators
Latitude classification A1 vs. A2 (2050)
B1 vs. A2 (2050)
B2 vs. A2 (2050)
Mediterranean Europe 82.6% 129.1% 133.9% Central‐Northern Europe 81.7% 116.0% 125.9%
Northern Europe 68.3% 111.0% 127.9%
Extent of forest area Scandinavian Europe 102.0% 102.3% 98.0%
Mediterranean Europe 79.9% 113.6% 124.2% Central‐Northern Europe 81.0% 79.7% 102.4%
Northern Europe 59.7% 69.3% 83.7%
Production of industrial
roundwood Scandinavian Europe 104.3% 96.2% 94.2% Mediterranean Europe 94.0% 126.8% 134.4%
Central‐Northern Europe 87.7% 82.4% 103.2% Northern Europe 78.7% 80.1% 108.3%
Production of wood pulp Scandinavian Europe 104.8% 93.8% 94.2%
Mediterranean Europe 94.3% 126.4% 139.2% Central‐Northern Europe 86.8% 86.9% 105.8%
Northern Europe 81.6% 81.6% 109.1%
Production of recovered
paper Scandinavian Europe 105.6% 96.8% 95.0% Mediterranean Europe 73.5% 109.4% 121.4%
Central‐Northern Europe 88.5% 82.0% 103.3% Northern Europe 59.8% 69.6% 84.2%
Production of sawnwood Scandinavian Europe 104.5% 95.0% 94.2%
Mediterranean Europe 83.3% 117.1% 129.3% Central‐Northern Europe 87.4% 85.6% 106.4%
Northern Europe 71.9% 74.8% 98.0%
Production of wood‐based
panels Scandinavian Europe 105.8% 89.8% 94.3% Mediterranean Europe 94.2% 125.6% 138.1%
Central‐Northern Europe 86.9% 86.8% 104.3% Northern Europe 80.6% 80.6% 107.9%
Production of paper and
paper board Scandinavian Europe 104.6% 93.2% 94.0% Mediterranean Europe 72.9% 108.9% 121.0%
Central‐Northern Europe 80.6% 77.4% 99.8% Northern Europe 53.5% 57.5% 76.4%
Production of wood fuel Scandinavian Europe 104.7% 95.2% 94.3%
Mediterranean Europe 78.0% 119.6% 120.7% Central‐Northern Europe 74.3% 110.6% 78.8%
Northern Europe 61.7% 104.0% 87.7%
Carbon stock
Scandinavian Europe 98.4% 130.3% 106.9%
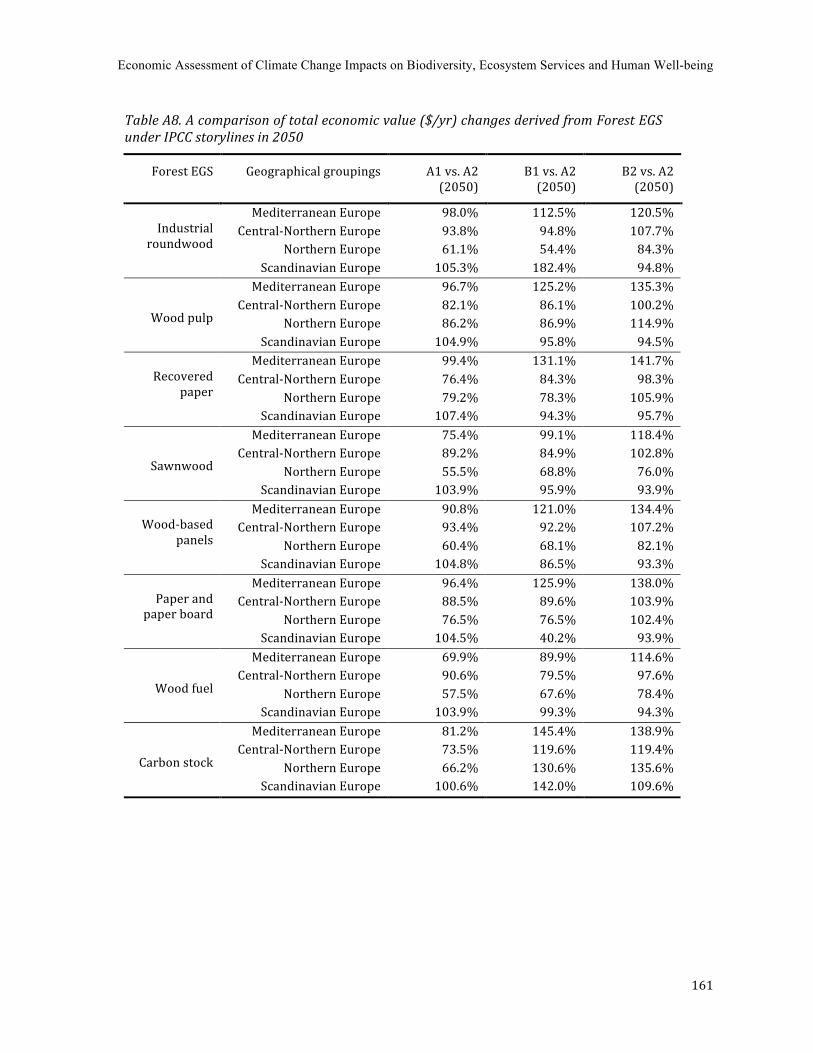
Economic Assessment of Climate Change Impacts on Biodiversity, Ecosystem Services and Human Well-being
161
Table A8. A comparison of total economic value ($/yr) changes derived from Forest EGS under IPCC storylines in 2050
Forest EGS Geographical groupings A1 vs. A2 (2050)
B1 vs. A2 (2050)
B2 vs. A2 (2050)
Mediterranean Europe 98.0% 112.5% 120.5% Central‐Northern Europe 93.8% 94.8% 107.7%
Northern Europe 61.1% 54.4% 84.3%
Industrial
roundwood
Scandinavian Europe 105.3% 182.4% 94.8% Mediterranean Europe 96.7% 125.2% 135.3%
Central‐Northern Europe 82.1% 86.1% 100.2% Northern Europe 86.2% 86.9% 114.9%
Wood pulp
Scandinavian Europe 104.9% 95.8% 94.5% Mediterranean Europe 99.4% 131.1% 141.7%
Central‐Northern Europe 76.4% 84.3% 98.3% Northern Europe 79.2% 78.3% 105.9%
Recovered
paper
Scandinavian Europe 107.4% 94.3% 95.7% Mediterranean Europe 75.4% 99.1% 118.4%
Central‐Northern Europe 89.2% 84.9% 102.8% Northern Europe 55.5% 68.8% 76.0%
Sawnwood
Scandinavian Europe 103.9% 95.9% 93.9% Mediterranean Europe 90.8% 121.0% 134.4%
Central‐Northern Europe 93.4% 92.2% 107.2% Northern Europe 60.4% 68.1% 82.1%
Wood‐based
panels
Scandinavian Europe 104.8% 86.5% 93.3% Mediterranean Europe 96.4% 125.9% 138.0%
Central‐Northern Europe 88.5% 89.6% 103.9% Northern Europe 76.5% 76.5% 102.4%
Paper and
paper board
Scandinavian Europe 104.5% 40.2% 93.9% Mediterranean Europe 69.9% 89.9% 114.6%
Central‐Northern Europe 90.6% 79.5% 97.6% Northern Europe 57.5% 67.6% 78.4%
Wood fuel
Scandinavian Europe 103.9% 99.3% 94.3% Mediterranean Europe 81.2% 145.4% 138.9%
Central‐Northern Europe 73.5% 119.6% 119.4% Northern Europe 66.2% 130.6% 135.6%
Carbon stock
Scandinavian Europe 100.6% 142.0% 109.6%
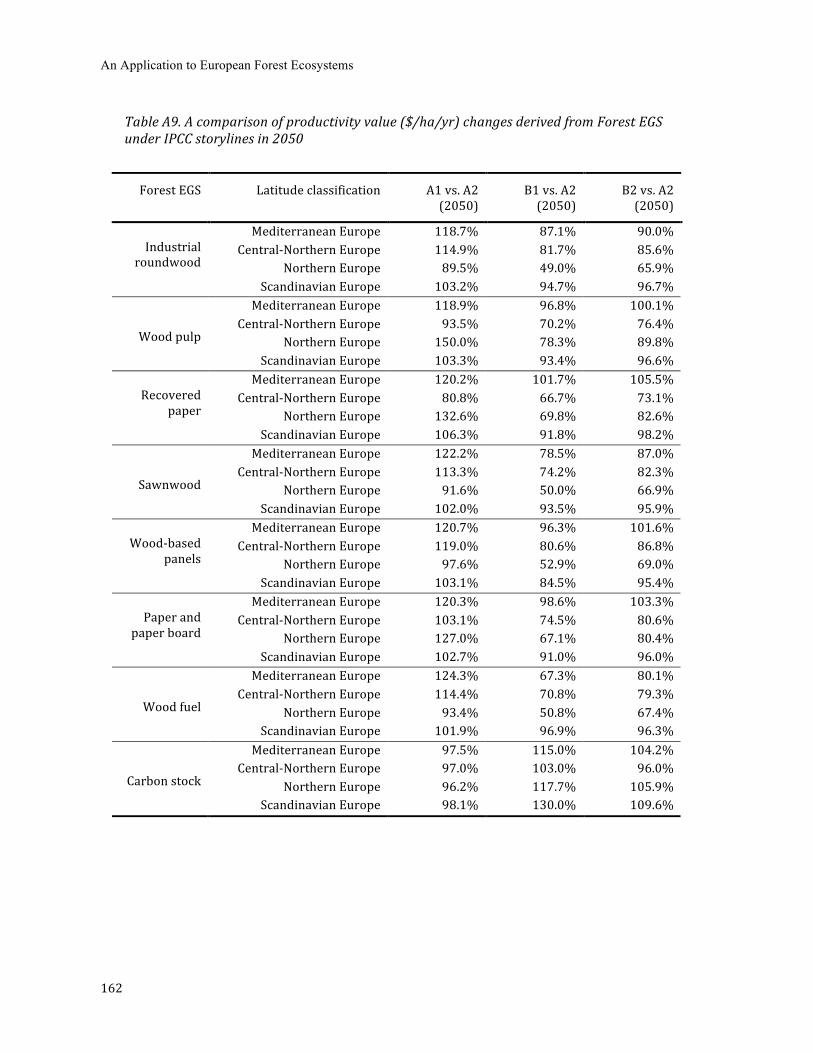
An Application to European Forest Ecosystems
162
Table A9. A comparison of productivity value ($/ha/yr) changes derived from Forest EGS under IPCC storylines in 2050
Forest EGS Latitude classification A1 vs. A2 (2050)
B1 vs. A2 (2050)
B2 vs. A2 (2050)
Mediterranean Europe 118.7% 87.1% 90.0% Central‐Northern Europe 114.9% 81.7% 85.6%
Northern Europe 89.5% 49.0% 65.9%
Industrial
roundwood
Scandinavian Europe 103.2% 94.7% 96.7% Mediterranean Europe 118.9% 96.8% 100.1%
Central‐Northern Europe 93.5% 70.2% 76.4% Northern Europe 150.0% 78.3% 89.8%
Wood pulp
Scandinavian Europe 103.3% 93.4% 96.6% Mediterranean Europe 120.2% 101.7% 105.5%
Central‐Northern Europe 80.8% 66.7% 73.1% Northern Europe 132.6% 69.8% 82.6%
Recovered
paper
Scandinavian Europe 106.3% 91.8% 98.2% Mediterranean Europe 122.2% 78.5% 87.0%
Central‐Northern Europe 113.3% 74.2% 82.3% Northern Europe 91.6% 50.0% 66.9%
Sawnwood
Scandinavian Europe 102.0% 93.5% 95.9% Mediterranean Europe 120.7% 96.3% 101.6%
Central‐Northern Europe 119.0% 80.6% 86.8% Northern Europe 97.6% 52.9% 69.0%
Wood‐based
panels
Scandinavian Europe 103.1% 84.5% 95.4% Mediterranean Europe 120.3% 98.6% 103.3%
Central‐Northern Europe 103.1% 74.5% 80.6% Northern Europe 127.0% 67.1% 80.4%
Paper and
paper board
Scandinavian Europe 102.7% 91.0% 96.0% Mediterranean Europe 124.3% 67.3% 80.1%
Central‐Northern Europe 114.4% 70.8% 79.3% Northern Europe 93.4% 50.8% 67.4%
Wood fuel
Scandinavian Europe 101.9% 96.9% 96.3% Mediterranean Europe 97.5% 115.0% 104.2%
Central‐Northern Europe 97.0% 103.0% 96.0% Northern Europe 96.2% 117.7% 105.9%
Carbon stock
Scandinavian Europe 98.1% 130.0% 109.6%
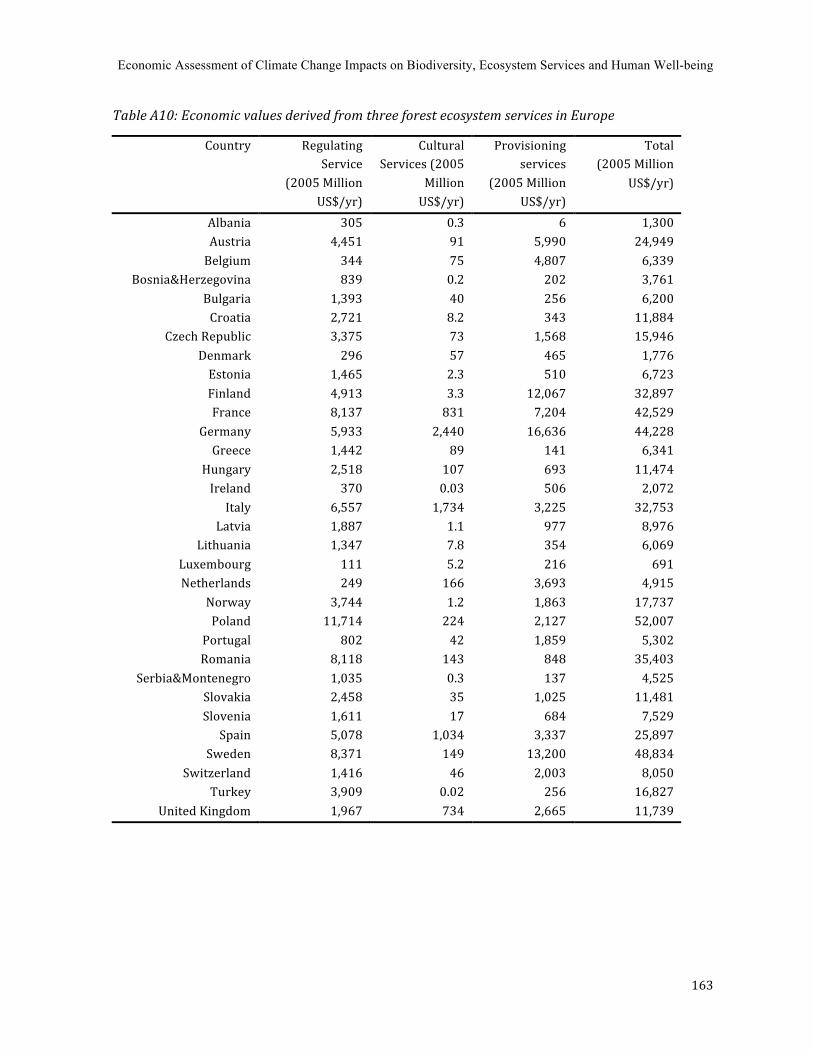
Economic Assessment of Climate Change Impacts on Biodiversity, Ecosystem Services and Human Well-being
163
Table A10: Economic values derived from three forest ecosystem services in Europe
Country Regulating Service
(2005 Million US$/yr)
Cultural Services (2005
Million US$/yr)
Provisioning services
(2005 Million US$/yr)
Total (2005 Million
US$/yr)
Albania 305 0.3 6 1,300 Austria 4,451 91 5,990 24,949 Belgium 344 75 4,807 6,339
Bosnia&Herzegovina 839 0.2 202 3,761 Bulgaria 1,393 40 256 6,200 Croatia 2,721 8.2 343 11,884
Czech Republic 3,375 73 1,568 15,946 Denmark 296 57 465 1,776 Estonia 1,465 2.3 510 6,723 Finland 4,913 3.3 12,067 32,897 France 8,137 831 7,204 42,529
Germany 5,933 2,440 16,636 44,228 Greece 1,442 89 141 6,341
Hungary 2,518 107 693 11,474 Ireland 370 0.03 506 2,072 Italy 6,557 1,734 3,225 32,753
Latvia 1,887 1.1 977 8,976 Lithuania 1,347 7.8 354 6,069
Luxembourg 111 5.2 216 691 Netherlands 249 166 3,693 4,915
Norway 3,744 1.2 1,863 17,737 Poland 11,714 224 2,127 52,007
Portugal 802 42 1,859 5,302 Romania 8,118 143 848 35,403
Serbia&Montenegro 1,035 0.3 137 4,525 Slovakia 2,458 35 1,025 11,481 Slovenia 1,611 17 684 7,529 Spain 5,078 1,034 3,337 25,897
Sweden 8,371 149 13,200 48,834 Switzerland 1,416 46 2,003 8,050
Turkey 3,909 0.02 256 16,827 United Kingdom 1,967 734 2,665 11,739
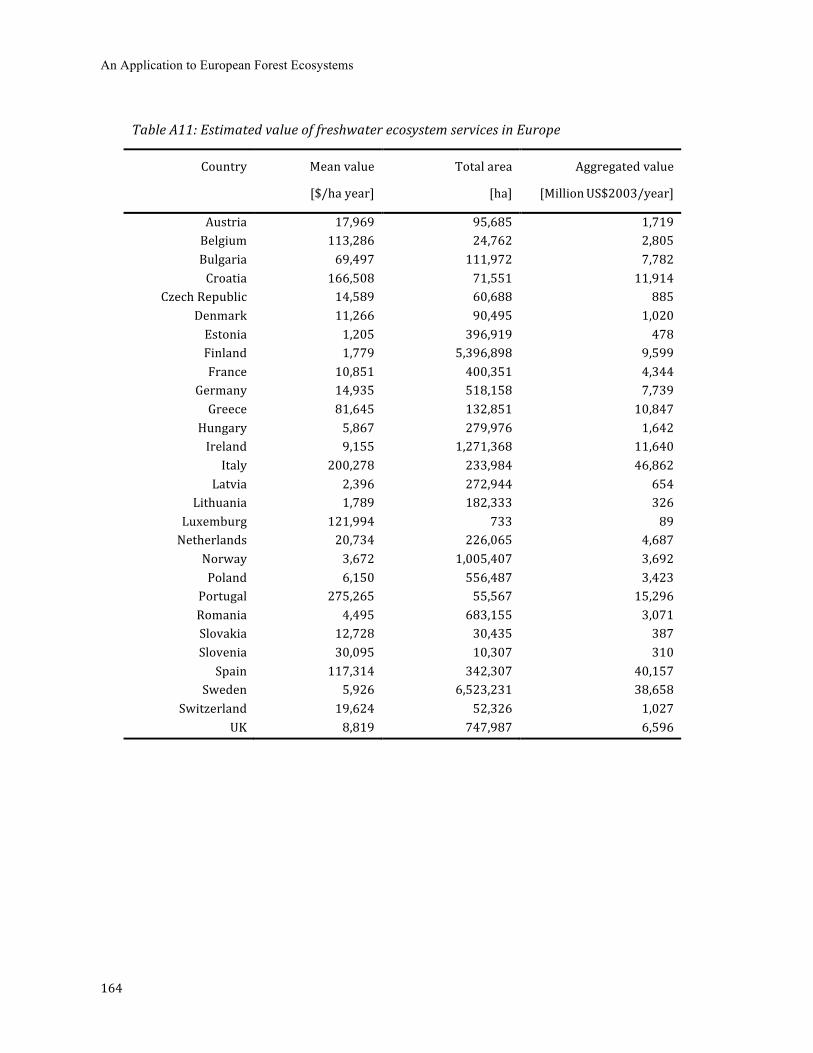
An Application to European Forest Ecosystems
164
Table A11: Estimated value of freshwater ecosystem services in Europe
Country Mean value
[$/ha year]
Total area
[ha]
Aggregated value
[Million US$2003/year]
Austria 17,969 95,685 1,719 Belgium 113,286 24,762 2,805 Bulgaria 69,497 111,972 7,782 Croatia 166,508 71,551 11,914
Czech Republic 14,589 60,688 885 Denmark 11,266 90,495 1,020 Estonia 1,205 396,919 478 Finland 1,779 5,396,898 9,599 France 10,851 400,351 4,344
Germany 14,935 518,158 7,739 Greece 81,645 132,851 10,847
Hungary 5,867 279,976 1,642 Ireland 9,155 1,271,368 11,640 Italy 200,278 233,984 46,862
Latvia 2,396 272,944 654 Lithuania 1,789 182,333 326
Luxemburg 121,994 733 89 Netherlands 20,734 226,065 4,687
Norway 3,672 1,005,407 3,692 Poland 6,150 556,487 3,423
Portugal 275,265 55,567 15,296 Romania 4,495 683,155 3,071 Slovakia 12,728 30,435 387 Slovenia 30,095 10,307 310 Spain 117,314 342,307 40,157
Sweden 5,926 6,523,231 38,658 Switzerland 19,624 52,326 1,027
UK 8,819 747,987 6,596
Economic Assessment of Climate Change Impacts on Biodiversity, Ecosystem Services and Human Well-being
165
CURRICULUM VITAE EDUCATION
Ph.D. in Science and Management of Climate Change, Department of Economics, Ca'Foscari University of Venice - Italy, September 2007 - March 2011(Expected). M.Sc. in Environmental Science, with Specialization in Environmental Economics and Natural Resources, Department of Environmental Science and Group of Environmental Economics and Natural Resources, Wageningen University - the Netherlands, September 2004 - June 2006 B.A. in Economics and Finance, School of Economics and Business Management, Shenyang University of Technology - P. R. China, September 1999 - July 2003
EXPERIENCE
Fondazione ENI Enrico Mattei (FEEM), Venice, Italy Researcher, Ecosystems and Biodiversity Economics Division, Sustainable Development Programme, October 2006 - present Intern, Ecosystems and Biodiversity Economics Division, Sustainable Development Programme, February -July 2006 Worked extensively on the EU projects related to the following topics: economic valuation of biodiversity and ecosystem services, damage assessment of environmental impacts and social dimension of biodiversity policy. Wrote research proposals, reports and peer-reviewed papers. Took part in project coordination.
European Commission (EC), Brussels, Belgium Economic consultant, DG Environment, January 2011 - present Participated in the project “Overall Economic Value of Natura 2000 Benefits”, provided technical support on value transfer techniques and the valuation of climate change regulation benefits from the Natura 2000 sites in Europe. Project co-coordinator & Economic consultant, DG Environment, February - August, 2010 Coordinated the project of “The Social Dimension of Biodiversity Policy” and conducted economic analysis of biodiversity benefits to vulnerable groups in the EU and beyond. The results of this study have been presented in the CBD-COP10 meeting held in Nagoya, Japan. Economic consultant, DG Environment, January - May, 2008 Participated in a couple of research projects that provided background studies for the EU to be presented in the CBD-COP 9 meeting in Bonn, including (1) “The Cost of Policy Inaction (COPI): The case of not meeting the 2010 biodiversity target”; (2) The Economics of Ecosystems and Biodiversity (TEEB): “Review on the Economics of Biodiversity Loss– phase 1 (scoping) economic analysis and synthesis”
Environment Canada, Gatineau (Québec), Canada Individual Contractor, Economic Analysis Directorate, January 2011 - present Identified and captured studies to the Environmental Valuation Reference Inventory (EVRI) website.
Venice International University (VIU), Venice, Italy Lecturer, Course of Globalization, Environment and Sustainable Development, 2009 - present Lectured in Model III: China’s challenges with respect to economic growth, environmental challenges and governance, and international cooperation for sustainable development. Project Assistant & Researcher, TEN Center – Thematic Environmental Networks, 2006 - 2007 Worked as training assistant in the Sino-Italian Cooperation Program for Environmental Protection to organize training courses to the Chinese governmental officials and academies in the area of environment and sustainable development. Wrote confidential report on China’s environmental problems and governance structure.
An Application to European Forest Ecosystems
166
Basque Center for Climate Change (BC3), Bilbao, Spain Economic consultant, for the BBVA-CLIMBE project, May 2010 - present Led the research task on cost/benefit analysis of Costa Rica’s alternative policy strategies to cope with climate change impact on tropical forests.
European Investment Bank (EIB), Luxemburg, Luxemburg Researcher, Projects Directorate, January - December 2010 Investigator of the STAREBEI research project on the SOcial costs of CARBon in the context of climate change: Results from an ecosystem-servicES based perspective (SOCARBES).
University of Maryland, MD, USA Visiting scholar, Department of Agricultural and Resource Economics, April - May, 2009
Ca'Foscari University of Venice, Venice, Italy Research collaborator, Department of Economics, 2006-2009 Collaborated on the EIBURS project of Impacts of Climate Change and Biodiversity Effects and led the research line on the economic valuation of forest ecosystems in Europe. Wrote scientific reports to the European Investment Bank.
PUBLICATIONS AND RESEARCH
PEER-REVIEWED PUBLICATIONS Chiabai, A., Travisi, C., Markandya, A., Ding, H., and P.A.L.D. Nunes (forthcoming) “Economic Assessment of Forest Ecosystem Services Losses: Cost of Policy Inaction”, Journal of Environmental and Resource Economics
WORKING PAPERS Ding, H., Silvestri, S. Chiabai, A. and P.A.L.D. Nunes (2010) “A Hybrid Approach to the Valuation of Climate Change Effects on Ecosystem Services: Evidence from the European Forests” FEEM Working Paper No. 2010.050 Ding, H., Nunes, P.A.L.D., and S. Teelucksingh (2010) “European Forests and Carbon Sequestration Services: An Economic Assessment of Climate Change Impacts”, FEEM Working Paper No. 2010.010 Nunes, P.A.L.D., Ding, H. and A. Markandya (2009) “Economic Valuation of Marine Ecosystems”, FEEM Working Paper No. 2009.068 Chiabai, A. , Travisi, C., Ding, H., Markandya, A., and P.A.L.D. Nunes (2009) “Economic Valuation of Forest Ecosystem Services: Methodology and Monetary Estimates”, FEEM Working Paper No.2009.012 Ding, H., Nunes, P.A.L.D., and L. Onofri (2007) "An Economic Model for Bioprospecting Contracts", FEEM Working Paper No.2007.102. Ding, H., Ruijs, A. and E.C., van Ierland (2007) “Designing a Decision Support System for Marine Reserves Management: An Economic Analysis for the Dutch North Sea”, FEEM Working Paper No. 2007.023.
BOOK CHAPTERS AND MONOGRAPHS Ding, H., Nunes, P.A.L.D. and S. Teelucksingh (2010) “European Forests and Carbon Sequestration Services: An Economic Assessment of Climate Change Impacts” in Pushpam and Wood (eds.) Valuation of Regulating Services of Ecosystems: Methodology and Applications, Routledge, ISBN: 978-0-415-56987-3 Nunes, P.A.L.D, Ding, H. and A. Markandya (2009) ‘The Economic Valuation of Marine Ecosystems” in F. Briand (eds.) Economic Valuation of Natural Coastal and Marine Ecosystems, CIESM Workshop Monograph N° 37, pages. 23-34, Monaco.
RESEARCH REPORTS Nunes, P.A.L.D., Ding, H., Ghermandi, A., Rayment, M., Varma, A., Pieterse, M., Kapthengst, T., Lago, M., Davis, M., Boteler, B., Naumann S., McConville, A. J. and P. ten Brink (2010) The Social Dimension of Biodiversity Policy: The Final Report. ENV.G.1/FRA/2006/0073 – 2nd, Contract: 070307/2009/550766/ETU/F1, pages vii-179, Italy, Venice 2010
Economic Assessment of Climate Change Impacts on Biodiversity, Ecosystem Services and Human Well-being
167
Carraro, C., Bosello, F., Nunes, P.A.L.D., De Cian, E., Ding, H., Eboli, F., Ghermandi, A., Lugato, E., Rosa, N.R. Parrado, R. and S. Silvestri (2009) “The Impacts of Climate Change and Biodiversity Effects: Final Year Report”, ix + 225 pages, European Investment Bank, Luxembourg. Carraro, C., Bosello, F., Nunes, P.A.L.D., Chiabai, A., Ding, H., Ghermandi, A., Lugato, E., Macagno, G., Ojea, E. and S. Silvestri (2008) “The Second Annual EIBURS-CLIBIO Report on the Impacts of Climate Change and Biodiversity Effects: 2007-2008”, Department of Economics, Ca’Foscari University of Venice, Italy and the European Investment Bank, Luxemburg.
Braat, L., ten Brink, P., Bakkes, J., Bolt, K., Braeuer, I., ten Brink, B., Chiabai, A., Ding, H., Gerdes, H., Jeuken, M., Kettunen, M., Kirchholtes, U., Klok, C., Markandya, A., Nunes, P., van Oorschot, M., Peralta-Bezerra, N., Rayment, M., Travisi, C., and M. Walpole (2008) “The Cost of Policy Inaction: The case of not meeting the 2010 biodiversity target” for the European Commission, DG Environment under contract: ENV.G.1/ETU/2007/0044 (Official Journal reference: 2007 / S 95 – 116033). Carraro, C., Bosello, F., Nunes, P.A.L.D., Chiabai, A., and H. Ding (2007) “The First Annual EIBURS-CLIBIO Report on the Impacts of Climate Change and Biodiversity Effects: 2006-2007”, Department of Economics, Ca’Foscari University of Venice, Italy and the European Investment Bank, Luxemburg. Ruijs, A., Ding, H., Punt, M.J. and E.C., van Ierland (2007) “Marine Biodiversity and Ecosystem Functioning: Responsive Mode Project 5.1 Decision Support System Progress Report”, MarBEF Project: GOCE-CT-2003-505446, EU Network of Excellence Sustainable Development, Global Change and Ecosystems.
POLICY BRIEFS Nunes, P.A.L.D. and H. Ding (2009) “Economic Assessment of Climate Change Caused Impacts on Biodiversity and Ecosystem Services”, FEEM Policy Brief 08.2009
CONFERENCE PRESENTATIONS “Modeling Climate Change and Biodiversity Effects on the Value of Ecosystem Goods and Services: An Empirical Investigation on the European Forest Ecosystem”, 12th BIOECON conference, Venice-Italy, 27-28 September, 2010 “Modeling the links between biodiversity, ecosystem services and human wellbeing in the context of climate change: results of an econometric exercise to the European forests.”, Belpasso summer school, Belpasso-Italy, 12-19 September, 2010 “Assessing the Impacts of Biodiversity and Ecosystem Service in Response to Climate Change in Europe: Results from Partial-General Equilibrium Valuation Model”, oral presentation in the Fourth World Congress of Environmental and Resource Economists, Montreal - Canada, 28 June - 2 July, 2010 “Economic modeling of biodiversity in the scenario of global change: results from a European study on forests”, 11th BIOECON conference, Venice-Italy, 21-22 September, 2009 “A hybrid approach to the valuation of climate change effects on ecosystem services: evidence from the European forests”, 11th BIOECON Conference, Venice - Italy, 21-22 September, 2009 “Economic Valuation of Forest Ecosystem Services: Methodology and Monetary Estimates”, 17th annual EAERE conference, Amsterdam - The Netherlands, 24-27 June, 2009 “Assessing the Climate Change Impact on European Forest Ecosystem”, 17th annual EAERE conference, Amsterdam - The Netherlands, 24-27 June, 2009 “An Environmental Economics Outlook of the Climate Change Impact on Carbon Regulation Services- Evidence from the European Forest Ecosystem”, the SCAPES workshop, Bangalore - India, 14-15 June 2009, “Economic Valuation of Forest Ecosystem Services: Methodology and Monetary Estimates”, 17h annual EAERE conference, Amsterdam - The Netherlands, 24-27 June 2009 “An Economic Model for Bioprospecting Contracts”, oral presentation (by co-author) of the 17h annual EAERE conference, Amsterdam - The Netherlands, 24-27 June 2009 “Designing a Decision Support System for Marine Reserves Management:”, International Marine Conservation Congress (IMCC), Washington DC – USA, 19-24 May, 2009
An Application to European Forest Ecosystems
168
“An Environmental Economics Outlook of the Climate Change Impact on Forest Ecosystems and Biodiversity: results from an empirical application to the Europe”, the international workshop on “SOCIO-ECONOMIC DRIVERS OF CLIMATE CHANGE” Department of Economics, Ca’ Foscari University - Venice, Italy 11-12 December, 2008 “Economic Valuation of Marine Environmental Damages: Assessment of Non-use Value Losses Involved with the Prestige Oil Spill by Means of Value Transfer”, World Conference on Marine Biodiversity (WCMB), Valencia – Spain, 11-15 November, 2008 “An Environmental Economics Outlook of the Climate Change Impact on Forest Biodiversity and Human Wellbeing: Results from a MEA Application to Europe”, 10th annual BIOECON conference, Sidney Sussex College of Cambridge – UK, 28-30 September, 2008 “Linking Biodiversity Indicators to Human Wellbeing: An Econometric Analysis of Climate Change Impacts on European Forest Biodiversity”, 2008 International Society for Ecological Economics (ISEE) Conference, Nairobi – Kenya, 07-11 August, 2008 “An Economic Model for Bioprospecting Contracts”, European Summer School in Resource and Environmental Economics: Trade, Property Rights and Biodiversity, VIU campus, Venice – Italy, 04 -10 July, 2007 “Designing a Decision Support System for Marine Reserves Management: An Economic Analysis for the Dutch North Sea”, 15th Annual Conference of the “European Association of Environmental and Resource Economists”(EAERE 2007), Thessaloniki – Greece, 27-30 June, 2007 “Spatial Allocation of Marine Reserves: an Economic Analysis for the Dutch North Sea”, 9th Biennial Conference of International Society for Ecological Economics (ISEE) on “Ecological Sustainability and Human Well-Being”, New Delhi – India, 15-19 December, 2006 “Is Biocontracting an Efficient Market-based Policy Instrument for Biodiversity Conservation?”, 8th Annual BIOECON Conference on “Economic Analysis of Ecology and Biodiversity”, Kings College of Cambridge – UK, 29-30 August, 2006
MEDIA Ding, H. (2010) “China’s Environment in a Globalizing World - An Overview on Environmental Issues in the Modern China”, The XXVI edition of "il Quaderno", Publications & Media Relations Executive of China-Italy Chamber of Commerce (CICC), Beijing.
CURRENT RESEARCH Economic valuation of biodiversity and ecosystem services and links to human livelihoods; Environmental policy design for coping with global change and promoting biodiversity conservation and poverty alleviation, with a particular interest in developing countries. POSTGRADUATE TRAINING
2010 Belpasso International Summer School on the Economics of Ecosystem Services and Biodiversity Conservation, jointly organized by the Faculty of Agriculture, the University of Catania, Belpasso, Sicily and the European Association of Environmental and Resource Economists (EAERE), Belpasso - Italy, 12-19 September 2010 (Scholarship holder); EXIOPOL Summer School on Environmental Accounting: Externality Valuation and Input-Output Tools for Policy Analysis, organized by the EU-FP6 EXIOPOL Integrated Project and held in Venice - Italy, 11-17 July, 2010 (Scholarship holder); State-of-the-Art Stated Preferences Modelling course (programming using R and LIMDEP), Umeå University and the Swedish University of Agricultural Sciences, Umeå - Sweden, 3-7 May, 2010; SUSDIV summer courses on Sustainable Development and Diversity, organized by University of the Basque Country, San Sebastian - Spain, 1-3 July, 2008 (Scholarship holder); EAERE-FEEM-VIU summer courses on ‘Economics of Trade, Property Rights and Biodiversity’, organized by European Annual Summer School in ‘Resource and Environmental Economics’, VIU campus, Venice - Italy, 4-10 July, 2007 (Scholarship holder)
Economic Assessment of Climate Change Impacts on Biodiversity, Ecosystem Services and Human Well-being
169
HONORS AND AWARDS
STAREBEI scholarship granted by the European Investment Bank (EIB), Luxembourg, 2010; PhD research scholarship granted by FEEM, Venice - Italy, 2007-2009; One-year research fellowship granted by Venice International University - Italy, 2006/2007; Scholarship granted by “Anne van den Ban Fund”, Wageningen - the Netherlands, 2005; Two scholarships for the 3rd best students’ academic achievement for the academic year 1999/2000 and 2001/02, Shenyang University of Technology, P.R.China; Outstanding Leadership Award awarded by the student council for the academic year 1999/2000, 2000/01 and 2001/02, Shenyang University of Technology, P.R.China; Student representative of Shenyang University of Technology for attending the governmental conference of ‘Outlook of the Economic Development in China’ held in the provincial government, Shenyang, Liaoning province, P.R.China, 1999 PERSONAL SKILLS
LANGUAGES Chinese Mandarin: Native English: Fluent – Written/Oral Italian: Conversational
COMPUTER SKILLS Knowledge of Stata, R, LIMDEP, SPSS, GAMS, EndNote, and Microsoft OfficeTM tools (incl. Word, Excel and PowerPoint).
OTHER COMPETENCES Team spirit and strong ability to adapt to multicultural environment gained through my overseas study experience and work experience in a large number of international research projects. Good technical and organizational skills in terms of writing research proposals, reports and peer-reviewed papers, project negotiations and coordination, gained through participating in the application of and research in a considerable number of EC-DG-ENV and EC-FP6/7 research projects, since 2006.