Embed Size (px)
Citation preview
CCHHAAPPTTEERR VV
AANN AAPPPPRRAAIISSAALL OOFF TTHHEE FFIINNAANNCCIIAALL
PPEERRFFOORRMMAANNCCEE OOFF TTHHEE GGDDCCCCBB
–– AA CCAAMMEELL AANNAALLYYSSIISS
125
AN APPRAISAL OF THE FINANCIAL PERFORMANCE OF THE
GDCCB - A CAMEL ANALYSIS
5.1 Introduction:
In this chapter an attempt is made to appraise the financial
performance of the Guntur District Central Co-operative Bank
(GDCCB), during the study period from 2000-01 to 2008-09. Capital
Adequacy, Asset Quality, Management Quality, Earnings and Liquidity
Ratios (CAMEL Model) is used to analyze the financial performance of
the GDCCB.
5.2 Financial Performance of the GDCCB:
As per the parameters indicated by NABARD a Weak
Co-operative Central Bank has been defined as a bank whose bad and
doubtful debts, accumulated losses and other overdues over three
years together, exceed 50 per cent of its Own Funds. The
Government or NABARD takes the Rehabilitation work, for weak bank
with the main emphasis of reviving it from its weak condition to attain
economically viable status over a phase of period.
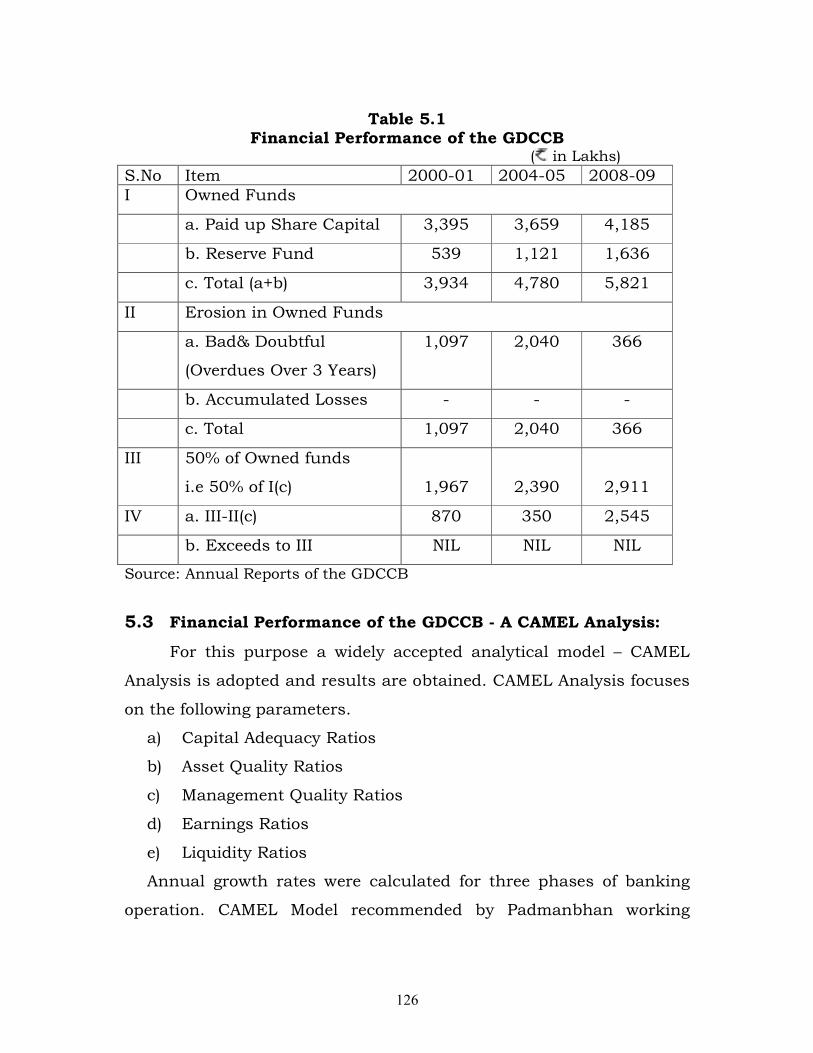
Table 5.1 presents an analysis of the financial performance of
the GDCCB during the period from 2000-01 to 2008-09. In the light of
the parameters indicated by NABARD, the GDCCB shows that during
the study period, the sum of the Bad & doubtful debts and
accumulated losses had been below 50 percent of the owned funds of
the bank. It is thus evident from the analysis that the GDCCB does
not fell in the category of weak Bank.
126
Table 5.1
Financial Performance of the GDCCB ( in Lakhs)
S.No Item 2000-01 2004-05 2008-09
I Owned Funds
a. Paid up Share Capital 3,395 3,659 4,185
b. Reserve Fund 539 1,121 1,636
c. Total (a+b) 3,934 4,780 5,821
II Erosion in Owned Funds
a. Bad& Doubtful
(Overdues Over 3 Years)
1,097 2,040 366
b. Accumulated Losses - - -
c. Total 1,097 2,040 366
III 50% of Owned funds
i.e 50% of I(c)
1,967
2,390
2,911
IV a. III-II(c) 870 350 2,545
b. Exceeds to III NIL NIL NIL
Source: Annual Reports of the GDCCB
5.3 Financial Performance of the GDCCB - A CAMEL Analysis:
For this purpose a widely accepted analytical model – CAMEL
Analysis is adopted and results are obtained. CAMEL Analysis focuses
on the following parameters.
a) Capital Adequacy Ratios
b) Asset Quality Ratios
c) Management Quality Ratios
d) Earnings Ratios
e) Liquidity Ratios
Annual growth rates were calculated for three phases of banking
operation. CAMEL Model recommended by Padmanbhan working
127
group 1995 has been employed to assess and appraise the financial
performance of GDCCB.
5.3.1 Capital Adequacy Ratios:
Capital adequacy has emerged as one of the major indicators of
the financial health of a banking entity. It is measured as a ratio of
bank’s own capital (new equity, retained earnings, etc.) to its
risk-weighted assets (loans, investments in stock markets, guarantees,
etc). Well adherence to capital adequacy regime does play a vital role
in minimizing the cascading effects of banking and financial sector
crises.
5.3.1.1 Capital to Risk Weighted Assets Ratio (CRAR) of the
GDCCB:
Capital adequacy is an indicator of the financial health of the
banking system. It explains the relation between net capital funds and
risk weighted assets. If the ratio is high, it is good for the organization.
In table 5.2 the ratio is calculated and examined for the data
pertaining to the GDCCB for the study period.
It is calculated by using following formula.
CRAR= (Net Capital Funds/Risk Weighted Assets) ×100
Net Capital Funds=(Paid up Capital+ Reserves+ Profit& Loss A/C (Cr))
- (Accumulated Losses +Short Fall in Provisions)
Risk Weighted Assets=Current Assets+ Investments+ Loans and
Advances.
128
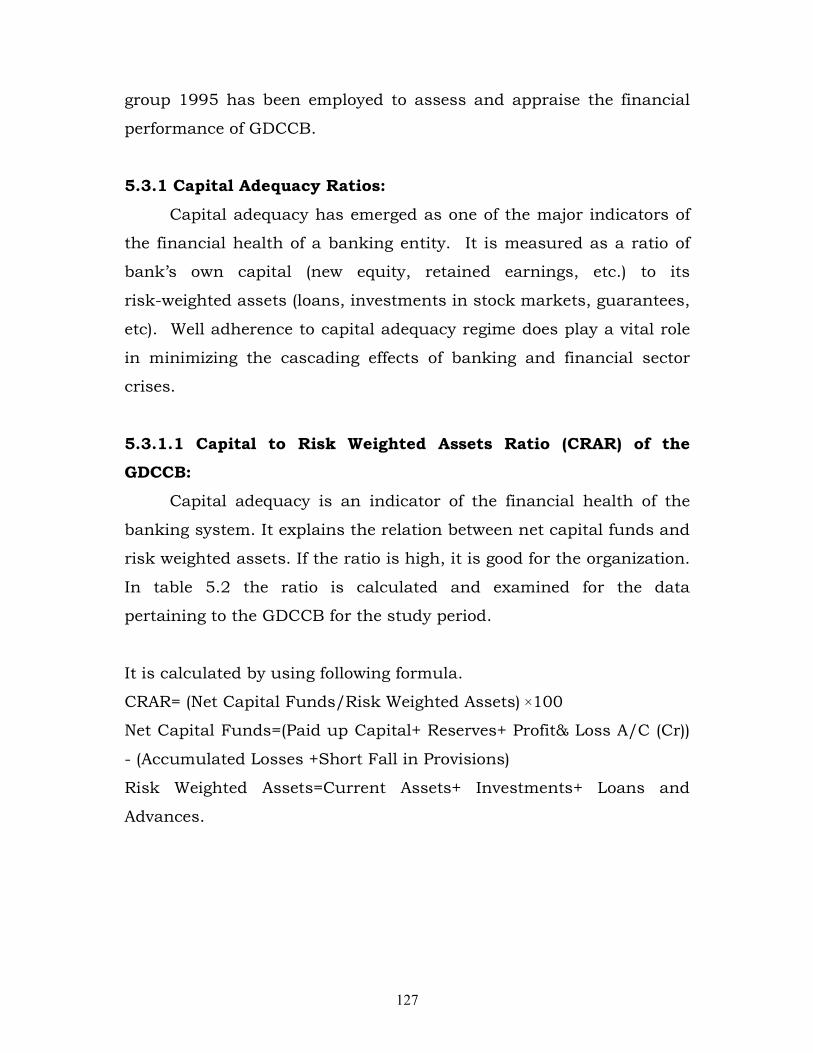
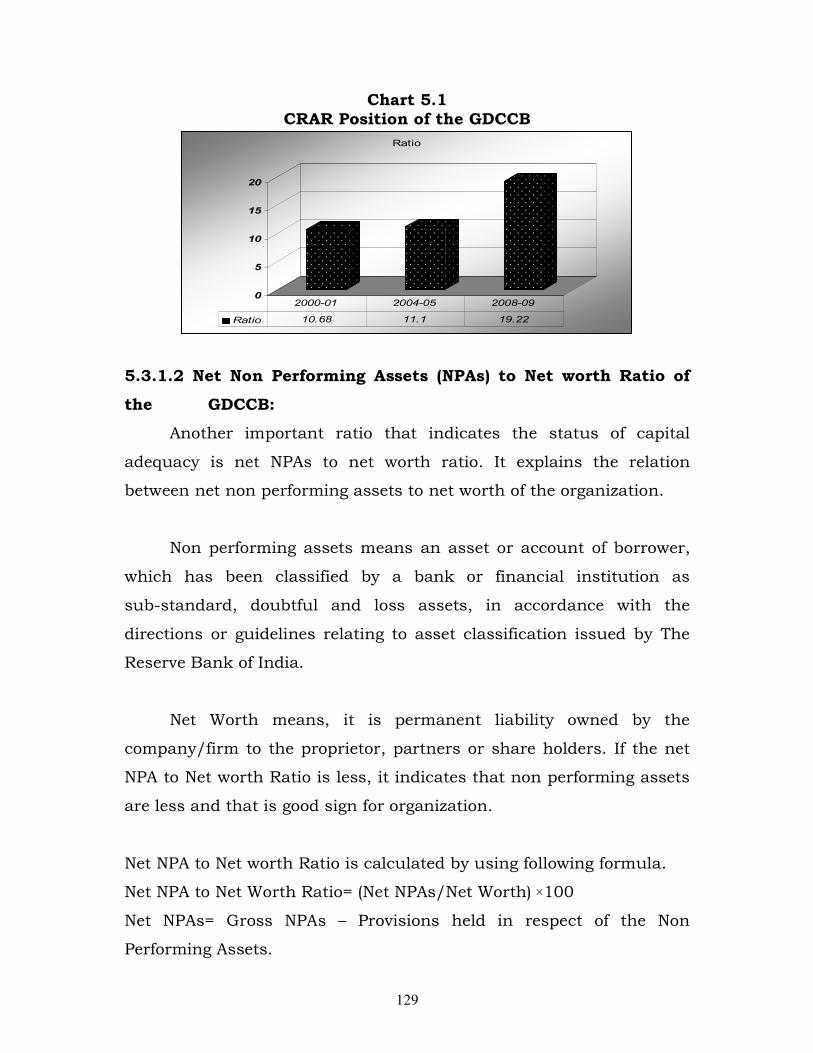
As is shown in the table 5.2, the growth rate of net capital funds
of the GDCCB had achieved steady increase during the years 2006-07
to 2008-09. It had increased by 3.22% in 2007-08 and further by
4.42% in 2008-09, which is a progressive sign. Interestingly, the
growth rate of risk weighted assets of GDCCB had got declined
considerably during the given period. This decline in the value of risk
weighted assets indicates that the GDCCB has got good solvency
position.
As per the prudential norms, the banks being operated in India
are required to achieve 9% CRAR. The table shows that the GDCCB
has well exceeded the stipulated level. Similarly, the CRAR was
10.68% in 2007-08 which had gone up and touched 20% mark in
2008-09. All this explains the strength of GDCCB in terms of sound
capital base and its adequacy.
Table 5.2 CRAR Position of the GDCCB
( in Lakhs) Sl. No.
Year Net Capital Funds
Risk Weighted Assets
Ratio (in % )
1. 2006-07 5590 52337 10.68
2. 2007-08 5770 (3.22)
51982 (-0.68)
11.10
3. 2008-09 6025
(4.42)
31352
(-39.69)
19.22
Source: Audit Reports of the GDCCB Note: Due to non-availability of previous data, the value of capital adequacy ratios of the years 2006-07 and 2007-08 are given in the table. Note: Figures in brackets show the Annual Growth Rates
129
Chart 5.1 CRAR Position of the GDCCB
0
5
10
15
20
Ratio
Ratio 10.68 11.1 19.22
2000-01 2004-05 2008-09
5.3.1.2 Net Non Performing Assets (NPAs) to Net worth Ratio of
the GDCCB:
Another important ratio that indicates the status of capital
adequacy is net NPAs to net worth ratio. It explains the relation
between net non performing assets to net worth of the organization.
Non performing assets means an asset or account of borrower,
which has been classified by a bank or financial institution as
sub-standard, doubtful and loss assets, in accordance with the
directions or guidelines relating to asset classification issued by The
Reserve Bank of India.
Net Worth means, it is permanent liability owned by the
company/firm to the proprietor, partners or share holders. If the net
NPA to Net worth Ratio is less, it indicates that non performing assets
are less and that is good sign for organization.
Net NPA to Net worth Ratio is calculated by using following formula.
Net NPA to Net Worth Ratio= (Net NPAs/Net Worth) ×100
Net NPAs= Gross NPAs – Provisions held in respect of the Non
Performing Assets.
130
Net Worth= Share Capital + Reserves and Surplus
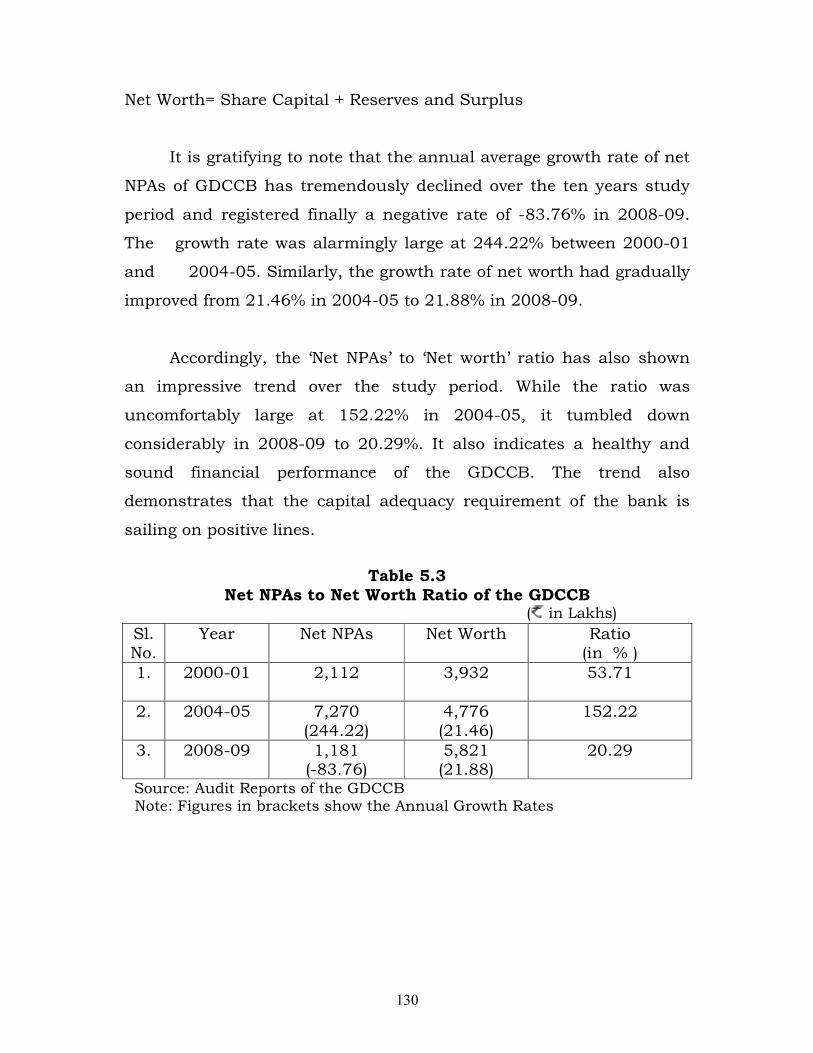
It is gratifying to note that the annual average growth rate of net
NPAs of GDCCB has tremendously declined over the ten years study
period and registered finally a negative rate of -83.76% in 2008-09.
The growth rate was alarmingly large at 244.22% between 2000-01
and 2004-05. Similarly, the growth rate of net worth had gradually
improved from 21.46% in 2004-05 to 21.88% in 2008-09.
Accordingly, the ‘Net NPAs’ to ‘Net worth’ ratio has also shown
an impressive trend over the study period. While the ratio was
uncomfortably large at 152.22% in 2004-05, it tumbled down
considerably in 2008-09 to 20.29%. It also indicates a healthy and
sound financial performance of the GDCCB. The trend also
demonstrates that the capital adequacy requirement of the bank is
sailing on positive lines.
Table 5.3 Net NPAs to Net Worth Ratio of the GDCCB
( in Lakhs)
Sl. No.
Year Net NPAs Net Worth Ratio (in % )
1. 2000-01 2,112 3,932 53.71
2. 2004-05 7,270 (244.22)
4,776 (21.46)
152.22
3. 2008-09 1,181 (-83.76)
5,821 (21.88)
20.29
Source: Audit Reports of the GDCCB Note: Figures in brackets show the Annual Growth Rates
131
Chart 5.2 Net NPAs to Net worth Ratio of the GDCCB
0
50
100
150
200
Ratio
Ratio 53.71 152.22 20.29
2000-01 2004-05 2008-09
5.3.2 Asset Quality Ratios:
Asset quality signifies the degree of financial strength of and
risks in a bank’s assets, mainly loans and investments. The
maintenance of asset quality is a fundamental feature of banking. A
broad evaluation of asset quality is one of the most important
components in assessing the current situation and future viability of a
bank.
Under CAMEL Model of analysis, the asset quality ratios
command significant recognition. Some of the important Asset Quality
ratios are adopted for analyzing the data of the GDCCB.
5.3.2.1 Government Securities to Total Investments Ratio of the
GDCCB:
Government securities to total investments ratio measures the
risk involved in total investments. Government securities are deemed
to be the risk free securities and thus it is generally believed that
higher proportion of this kind of securities in total investment carry
132
the minimum risk as compared to other securities. In other words,
higher the ratio lower is the risk and vice-versa.
This ratio is calculated by the following formula
Government Securities to Total Investments Ratio = (Government
Securities/Total Investments) ×100
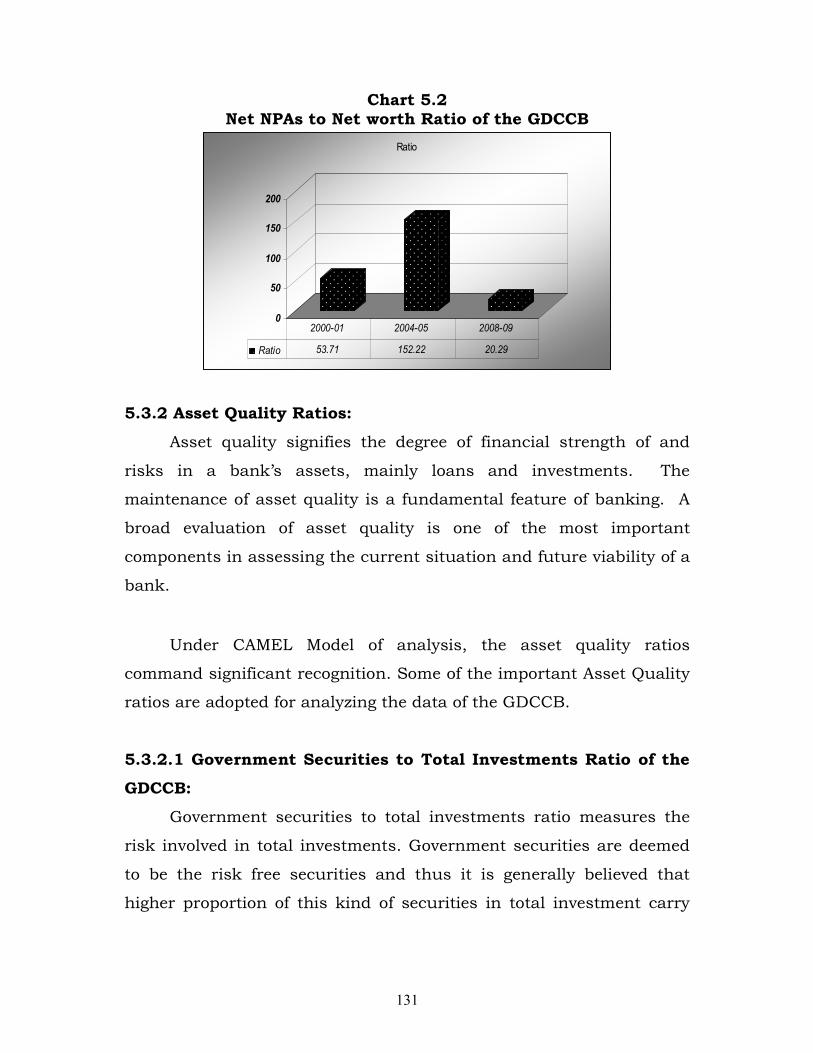
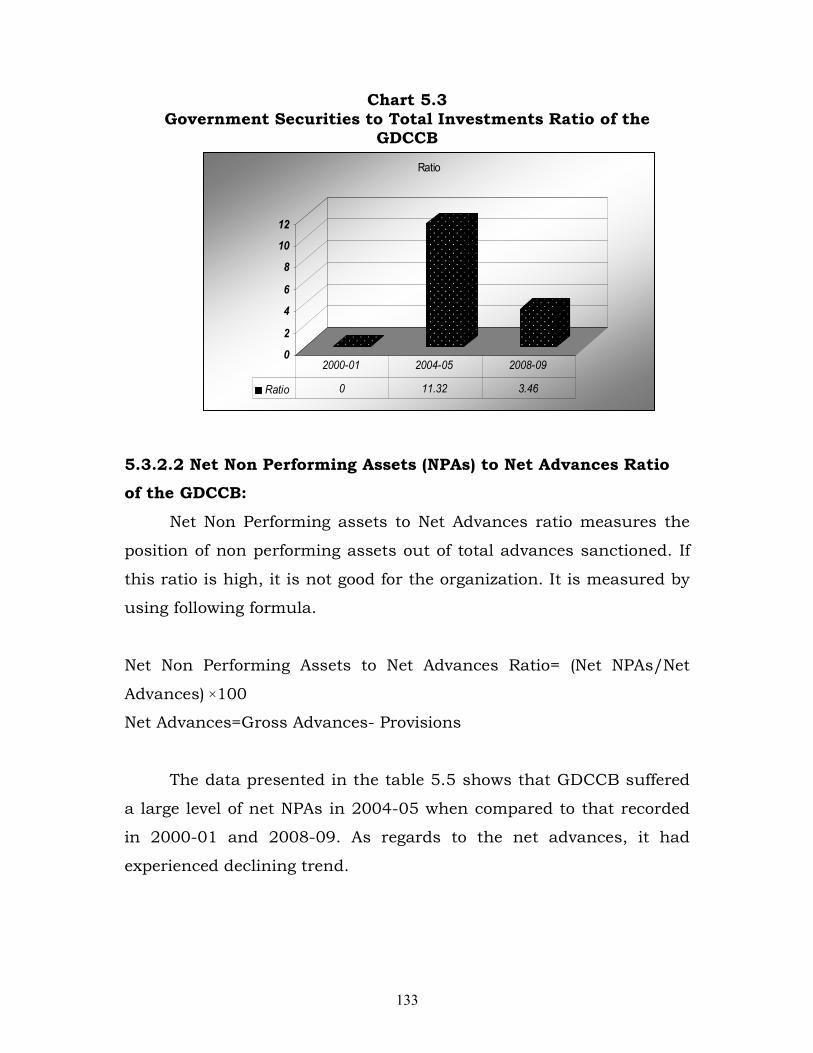
From table 5.4 it is observed that the ratio had touched the far
lower level of just 3.46% in 2008-09, when compared with the ratio of
about 11.32% in 2004-05. Here government securities value was
constant, but total investments were increased in the study period. It
indicates that from 2004-05 to 2008-09, GDCCB did not invest any
extra amount in government securities. It invested in other investment
avenues. So the Government Securities to Total Investments ratio is
declined in 2008-09. It indicates risk involvement position of the
investments.
Table 5.4 Government Securities to Total Investments Ratio of the
GDCCB ( in Lakhs)
Sl. No.
Year Government Securities
Total Investments
Ratio (in % )
1. 2000-01 -- 6,515 --
2. 2004-05 688 6,079
(-6.69)
11.32
3. 2008-09 688 19,886
(227.13)
3.46
Source: Audit Reports of the GDCCB Note: Figures in brackets show the Annual Growth Rates
133
Chart 5.3 Government Securities to Total Investments Ratio of the
GDCCB
0
2
4
6
8
10
12
Ratio
Ratio 0 11.32 3.46
2000-01 2004-05 2008-09
5.3.2.2 Net Non Performing Assets (NPAs) to Net Advances Ratio
of the GDCCB:
Net Non Performing assets to Net Advances ratio measures the
position of non performing assets out of total advances sanctioned. If
this ratio is high, it is not good for the organization. It is measured by
using following formula.
Net Non Performing Assets to Net Advances Ratio= (Net NPAs/Net
Advances) ×100
Net Advances=Gross Advances- Provisions
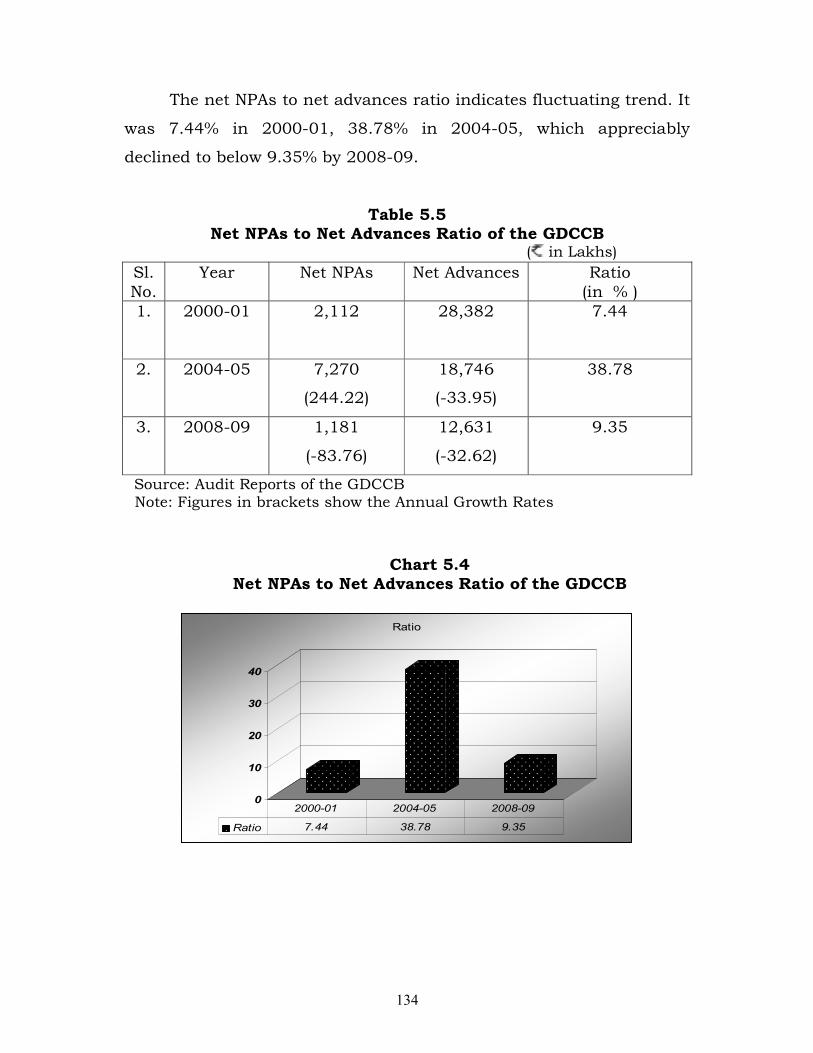
The data presented in the table 5.5 shows that GDCCB suffered
a large level of net NPAs in 2004-05 when compared to that recorded
in 2000-01 and 2008-09. As regards to the net advances, it had
experienced declining trend.
134
The net NPAs to net advances ratio indicates fluctuating trend. It
was 7.44% in 2000-01, 38.78% in 2004-05, which appreciably
declined to below 9.35% by 2008-09.
Table 5.5 Net NPAs to Net Advances Ratio of the GDCCB
( in Lakhs)
Sl.
No.
Year Net NPAs Net Advances Ratio
(in % )
1. 2000-01 2,112 28,382 7.44
2. 2004-05 7,270
(244.22)
18,746
(-33.95)
38.78
3. 2008-09 1,181
(-83.76)
12,631
(-32.62)
9.35
Source: Audit Reports of the GDCCB Note: Figures in brackets show the Annual Growth Rates
Chart 5.4 Net NPAs to Net Advances Ratio of the GDCCB
0
10
20
30
40
Ratio
Ratio 7.44 38.78 9.35
2000-01 2004-05 2008-09
135
5.3.2.3 Priority Sector Advances to Total Advances Ratio of the
GDCCB:
Priority sector advances to Total Advances Ratio helps to know
the importance that the bank is giving to priority sector and how
amount is sanctioned to that sector out of total advances. If this ratio
is high, it indicates the bank is giving more amounts for priority
sector. Priority sector advances includes advances given to agriculture,
small scale industries, housing finance, self employment education
loans, self help Groups etc.,
This ratio is calculated by the following this formula
Priority Sector Advances to Total Advances Ratio = (Priority Sector
Advances/Total Advances) ×100
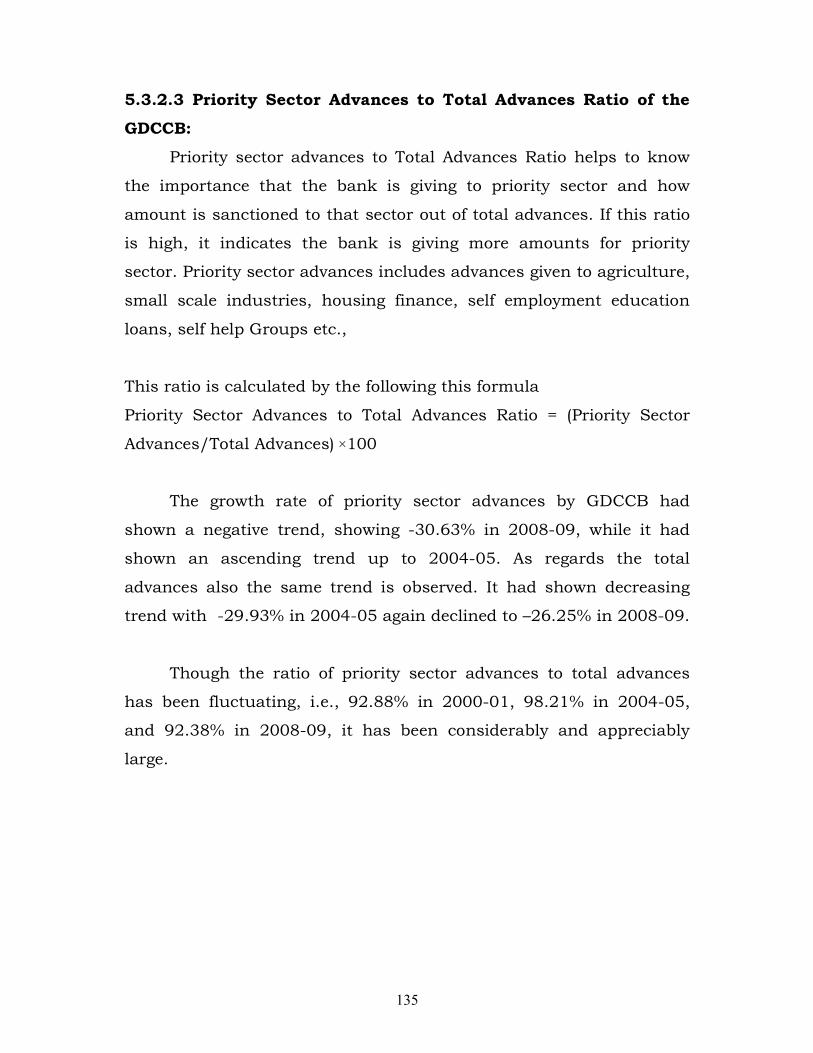
The growth rate of priority sector advances by GDCCB had
shown a negative trend, showing -30.63% in 2008-09, while it had
shown an ascending trend up to 2004-05. As regards the total
advances also the same trend is observed. It had shown decreasing
trend with -29.93% in 2004-05 again declined to –26.25% in 2008-09.
Though the ratio of priority sector advances to total advances
has been fluctuating, i.e., 92.88% in 2000-01, 98.21% in 2004-05,
and 92.38% in 2008-09, it has been considerably and appreciably
large.
136
Table 5.6 Priority Sector Advances to Total Advances Ratio of the GDCCB
( in Lakhs)
Sl. No.
Year Priority Sector Advances
Total Advances
Ratio (in % )
1. 2000-01 28,816 31,026 92.88
2. 2004-05 21,351
(-25.91)
21,741
(-29.93)
98.21
3. 2008-09 14,812 (-30.63)
16,033 (-26.25)
92.38
Source: Audit Reports of the GDCCB Note: Figures in brackets show the Annual Growth Rates
Chart 5.5
Priority Sector Advances to Total Advances Ratio of the GDCCB
88
90
92
94
96
98
100
Ratio
Ratio 92.88 98.21 92.38
2000-01 2004-05 2008-09
5.3.2.4 Asset Utilization Ratio of the GDCCB:
Asset Utilization ratio is useful to know how effectively the assets
are utilized and how much income is generated from that assets. So it
is the relation between the total income and total assets of an
organization.
This ratio is calculated by the following this formula
Asset Utilization Ratio = (Total Income/Total Assets) ×100
137
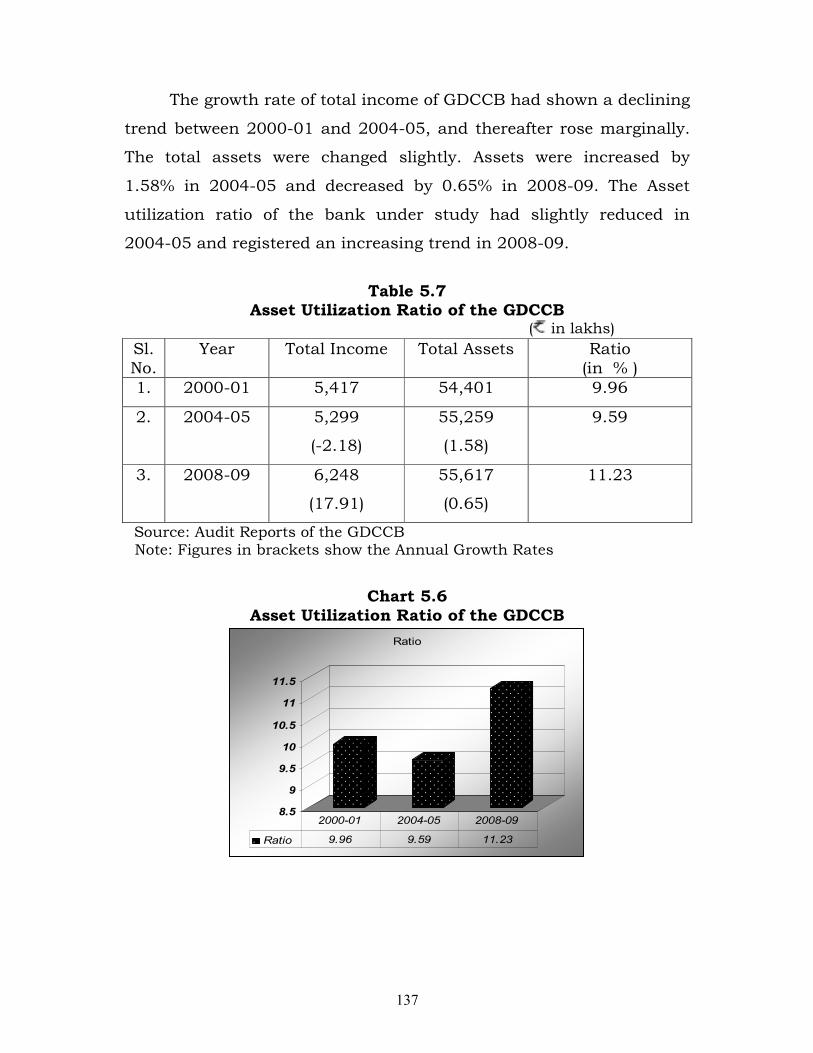
The growth rate of total income of GDCCB had shown a declining
trend between 2000-01 and 2004-05, and thereafter rose marginally.
The total assets were changed slightly. Assets were increased by
1.58% in 2004-05 and decreased by 0.65% in 2008-09. The Asset
utilization ratio of the bank under study had slightly reduced in
2004-05 and registered an increasing trend in 2008-09.
Table 5.7 Asset Utilization Ratio of the GDCCB
( in lakhs)
Sl. No.
Year Total Income Total Assets Ratio (in % )
1. 2000-01 5,417 54,401 9.96
2. 2004-05 5,299
(-2.18)
55,259
(1.58)
9.59
3. 2008-09 6,248
(17.91)
55,617
(0.65)
11.23
Source: Audit Reports of the GDCCB Note: Figures in brackets show the Annual Growth Rates
Chart 5.6
Asset Utilization Ratio of the GDCCB
8.5
9
9.5
10
10.5
11
11.5
Ratio
Ratio 9.96 9.59 11.23
2000-01 2004-05 2008-09
138
5.3.3 Management Quality Ratios:
Management efficiency is another vital component of the CAMEL
model that ensures the survival and growth of a bank. It is the
management which sets vision and goals for the organization and
ensures that it achieves them. In the process of achieving their goals,
management takes certain crucial decisions depending on its risk
perception. Hence, analysts and investors use this parameter to
evaluate management efficiency as to assign premium to better
managed banks and discount to poorly managed ones.
While the other factors of CAMEL model can be quantified fairly
easily from current financial statements, management quality is a
somewhat elusive and subjective measure, yet one that is crucial to
institutional success. As management quality is inextricably tied to a
bank’s success or failure, it is important to develop and improve
methods of grading management efficacy. Besides this, the banking
sector reforms also reinforce the need to improve productivity of the
banks through appropriate measures which aim at reducing the
operating cost and improving the profitability of the banks.
5.3.3.1 Profit per Employee of the GDCCB:
Net profit per employee is the amount of profit earned per an
employee. The range of profit determines the quality of management.
Higher the quality of management, higher the profits per employee.
It calculated by the following this formula
Profit per Employee of GDCCB= (Net Profit/No. of Employees)
139
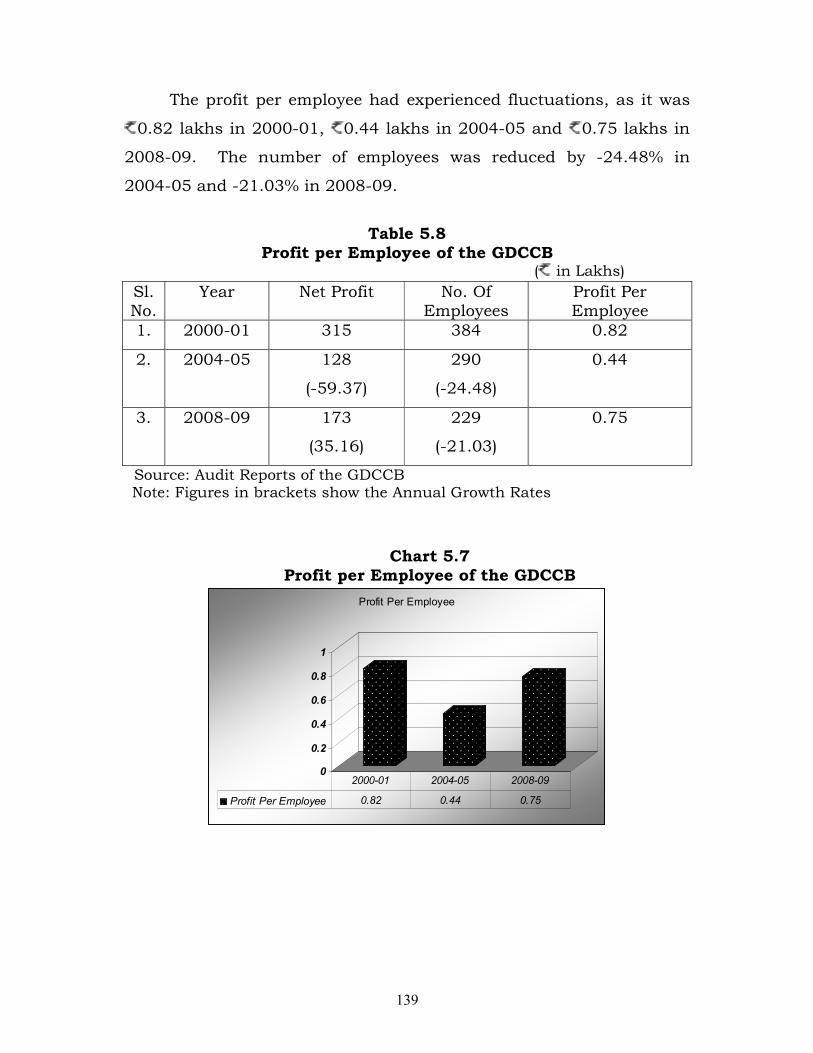
The profit per employee had experienced fluctuations, as it was
0.82 lakhs in 2000-01, 0.44 lakhs in 2004-05 and 0.75 lakhs in
2008-09. The number of employees was reduced by -24.48% in
2004-05 and -21.03% in 2008-09.
Table 5.8
Profit per Employee of the GDCCB ( in Lakhs)
Sl. No.
Year Net Profit No. Of Employees
Profit Per Employee
1. 2000-01 315 384 0.82
2. 2004-05 128
(-59.37)
290
(-24.48)
0.44
3. 2008-09 173
(35.16)
229
(-21.03)
0.75
Source: Audit Reports of the GDCCB Note: Figures in brackets show the Annual Growth Rates
Chart 5.7
Profit per Employee of the GDCCB
0
0.2
0.4
0.6
0.8
1
Profit Per Employee
Profit Per Employee 0.82 0.44 0.75
2000-01 2004-05 2008-09
140
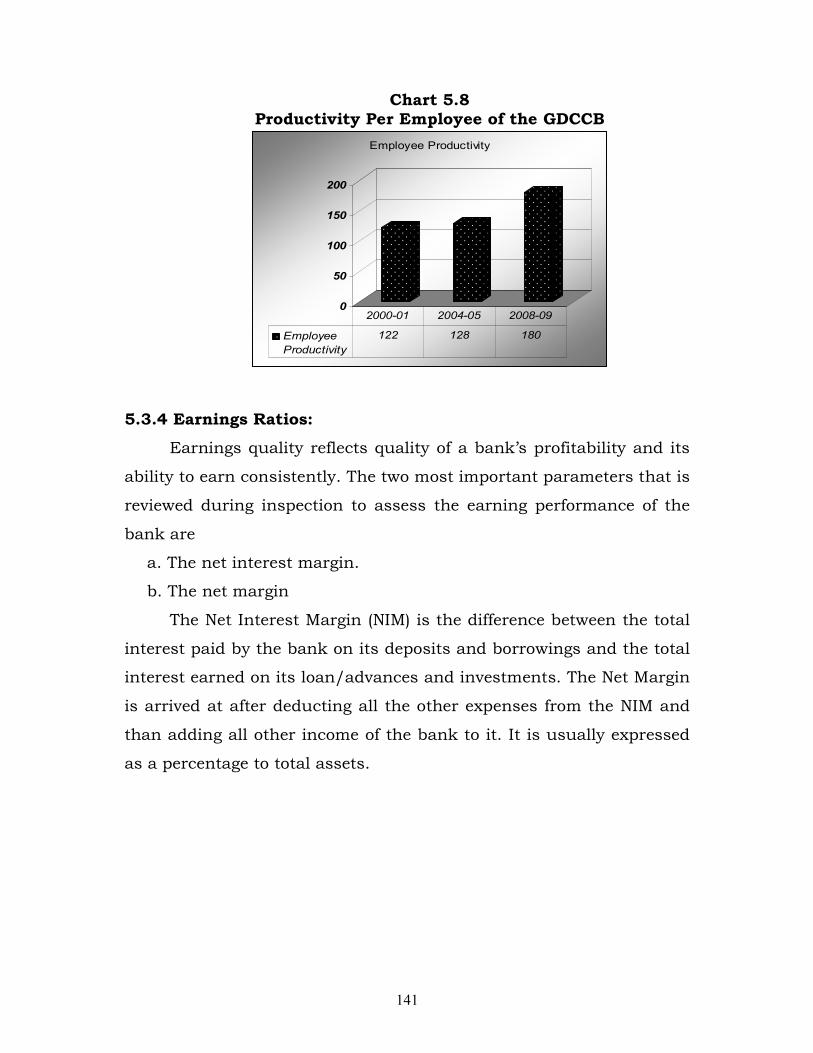
5.3.3.2 Productivity Per Employee of the GDCCB:
Productivity of the bank can be measured as a relation between
total business and total number of employees. So it can understand
how effectively the employees are contributing to total business. If it is
high, it is good for organization. This ratio is calculated by the
following this formula
Productivity Per Employee of the Bank= (Total Business/No. of
Employees) ×100
Total Business=Total Credit + Total Deposits
The total business of GDCCB had fluctuating trend with -20.53%
in 2004-05, when compared to an increased trend of 10.98% in
2008-09. Regarding number of employees there had been negative and
declining trend recording -24.48% in 2004-05 and -21.03 % in
2008-09. Regarding productivity of GDCCB, it can be stated that this
had increased satisfactorily to 180 lakh in 2008-09 when compared
to the given previous years. By 2008-09 number of employees had
decreased but the productivity had shown increasing trend.
Table 5.9
Productivity Per Employee of the GDCCB ( in Lakhs) Sl. No.
Year Total Business No. Of Employees
Per Employee Productivity
1. 2000-01 46,754 384 122
2. 2004-05 37,155 (-20.53)
290 (-24.48)
128
3. 2008-09 41,233 (10.98)
229 (-21.03)
180
Source: Audit Reports of the GDCCB Note: Figures in brackets show the Annual Growth Rates
141
Chart 5.8 Productivity Per Employee of the GDCCB
0
50
100
150
200
Employee Productivity
Employee
Productivity
122 128 180
2000-01 2004-05 2008-09
5.3.4 Earnings Ratios:
Earnings quality reflects quality of a bank’s profitability and its
ability to earn consistently. The two most important parameters that is
reviewed during inspection to assess the earning performance of the
bank are
a. The net interest margin.
b. The net margin
The Net Interest Margin (NIM) is the difference between the total
interest paid by the bank on its deposits and borrowings and the total
interest earned on its loan/advances and investments. The Net Margin
is arrived at after deducting all the other expenses from the NIM and
than adding all other income of the bank to it. It is usually expressed
as a percentage to total assets.
142
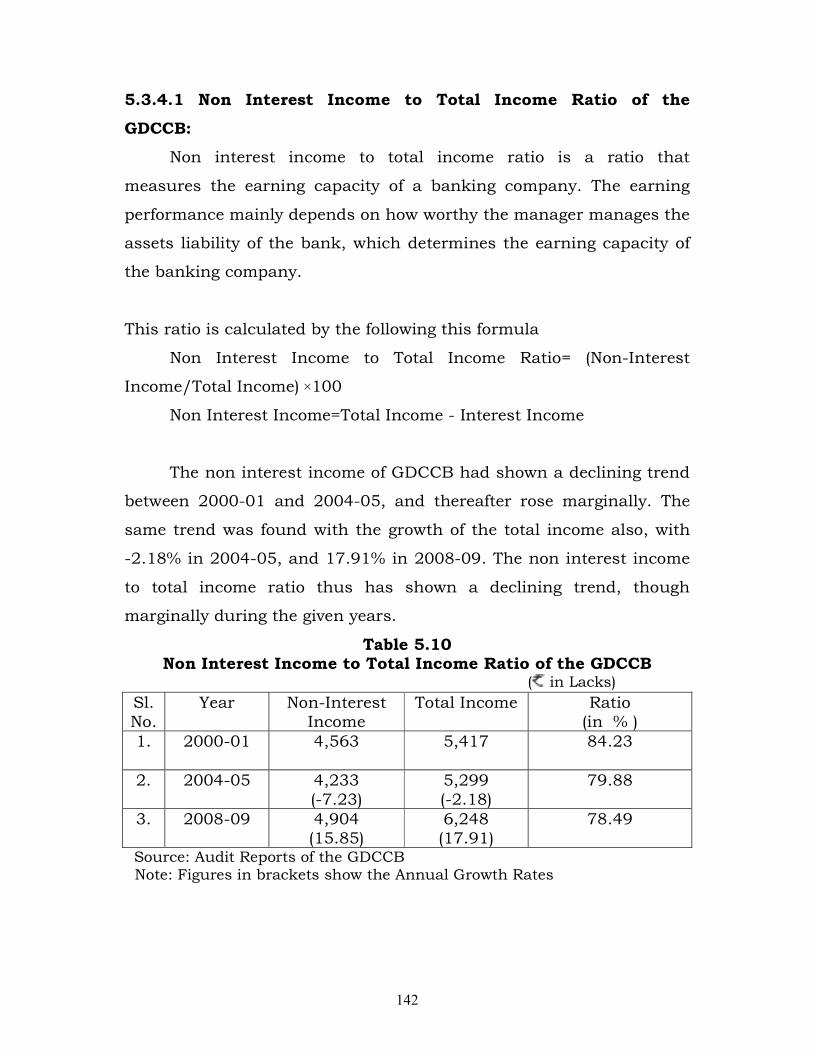
5.3.4.1 Non Interest Income to Total Income Ratio of the
GDCCB:
Non interest income to total income ratio is a ratio that
measures the earning capacity of a banking company. The earning
performance mainly depends on how worthy the manager manages the
assets liability of the bank, which determines the earning capacity of
the banking company.
This ratio is calculated by the following this formula
Non Interest Income to Total Income Ratio= (Non-Interest
Income/Total Income) ×100
Non Interest Income=Total Income - Interest Income
The non interest income of GDCCB had shown a declining trend
between 2000-01 and 2004-05, and thereafter rose marginally. The
same trend was found with the growth of the total income also, with
-2.18% in 2004-05, and 17.91% in 2008-09. The non interest income
to total income ratio thus has shown a declining trend, though
marginally during the given years.
Table 5.10 Non Interest Income to Total Income Ratio of the GDCCB
( in Lacks)
Sl. No.
Year Non-Interest Income
Total Income Ratio (in % )
1. 2000-01 4,563 5,417 84.23
2. 2004-05 4,233 (-7.23)
5,299 (-2.18)
79.88
3. 2008-09 4,904 (15.85)
6,248 (17.91)
78.49
Source: Audit Reports of the GDCCB Note: Figures in brackets show the Annual Growth Rates
143
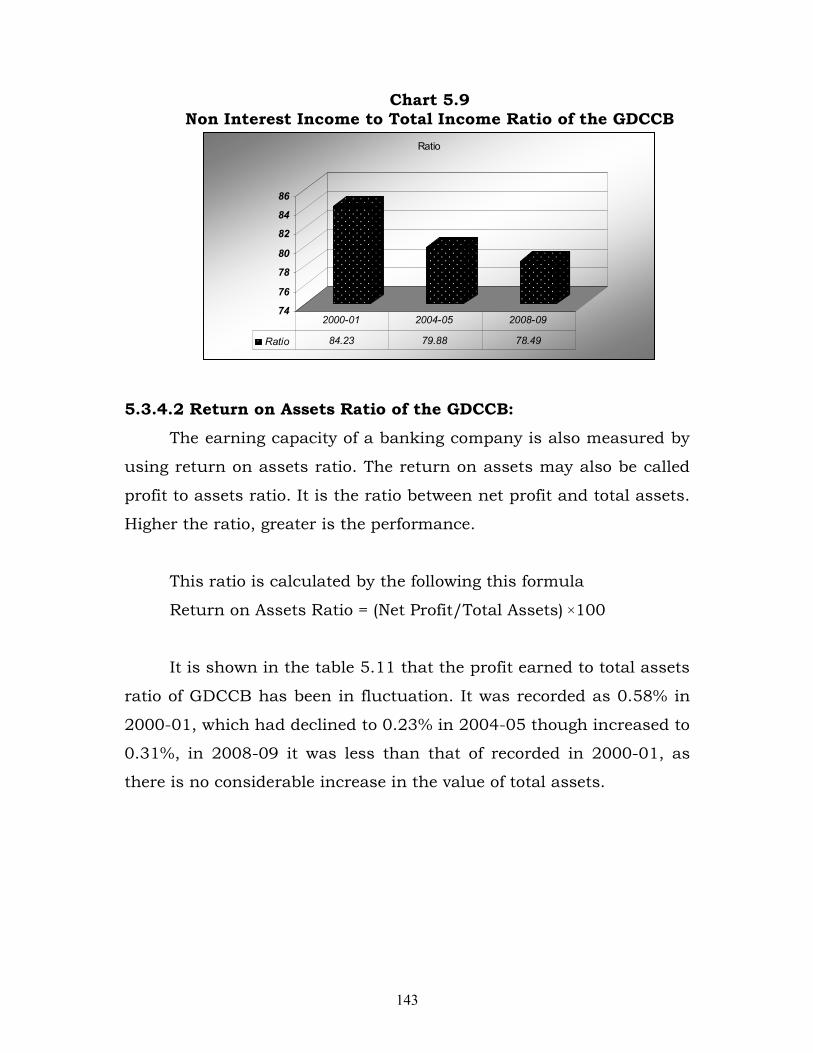
Chart 5.9 Non Interest Income to Total Income Ratio of the GDCCB
74
76
78
80
82
84
86
Ratio
Ratio 84.23 79.88 78.49
2000-01 2004-05 2008-09
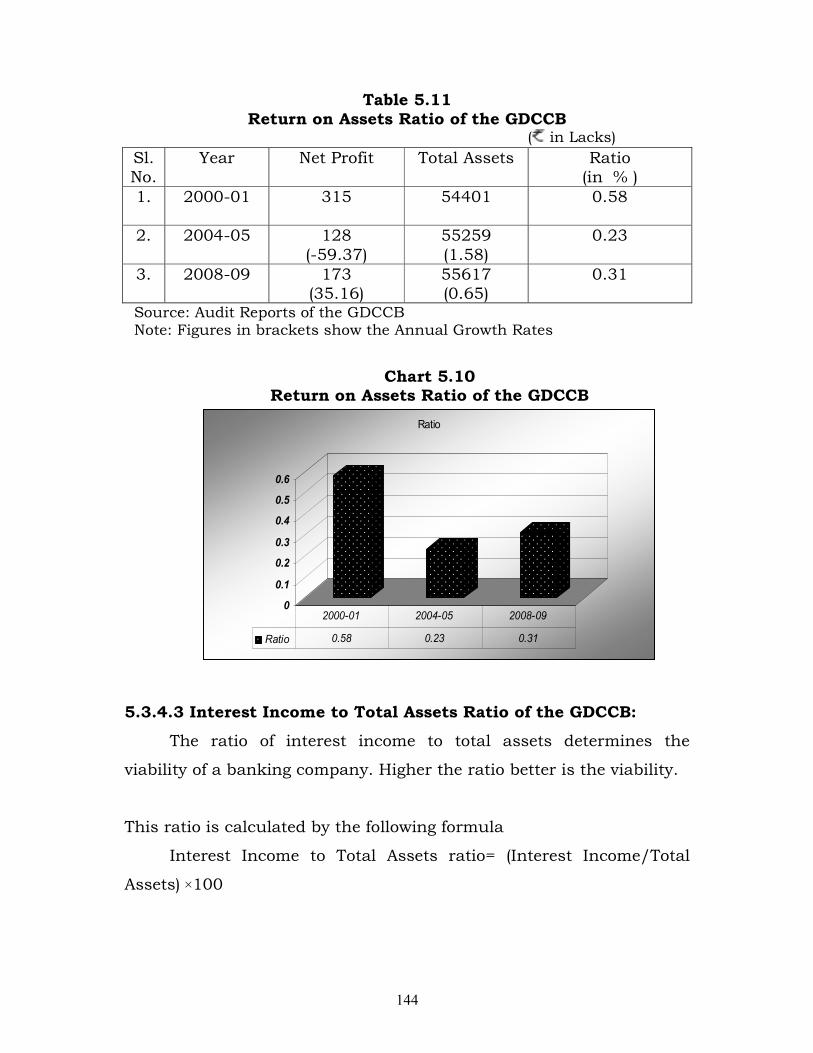
5.3.4.2 Return on Assets Ratio of the GDCCB:
The earning capacity of a banking company is also measured by
using return on assets ratio. The return on assets may also be called
profit to assets ratio. It is the ratio between net profit and total assets.
Higher the ratio, greater is the performance.
This ratio is calculated by the following this formula
Return on Assets Ratio = (Net Profit/Total Assets) ×100
It is shown in the table 5.11 that the profit earned to total assets
ratio of GDCCB has been in fluctuation. It was recorded as 0.58% in
2000-01, which had declined to 0.23% in 2004-05 though increased to
0.31%, in 2008-09 it was less than that of recorded in 2000-01, as
there is no considerable increase in the value of total assets.
144
Table 5.11 Return on Assets Ratio of the GDCCB
( in Lacks)
Sl. No.
Year Net Profit Total Assets Ratio (in % )
1. 2000-01 315 54401 0.58
2. 2004-05 128
(-59.37)
55259
(1.58)
0.23
3. 2008-09 173 (35.16)
55617 (0.65)
0.31
Source: Audit Reports of the GDCCB Note: Figures in brackets show the Annual Growth Rates
Chart 5.10
Return on Assets Ratio of the GDCCB
0
0.1
0.2
0.3
0.4
0.5
0.6
Ratio
Ratio 0.58 0.23 0.31
2000-01 2004-05 2008-09
5.3.4.3 Interest Income to Total Assets Ratio of the GDCCB:
The ratio of interest income to total assets determines the
viability of a banking company. Higher the ratio better is the viability.
This ratio is calculated by the following formula
Interest Income to Total Assets ratio= (Interest Income/Total
Assets) ×100
145
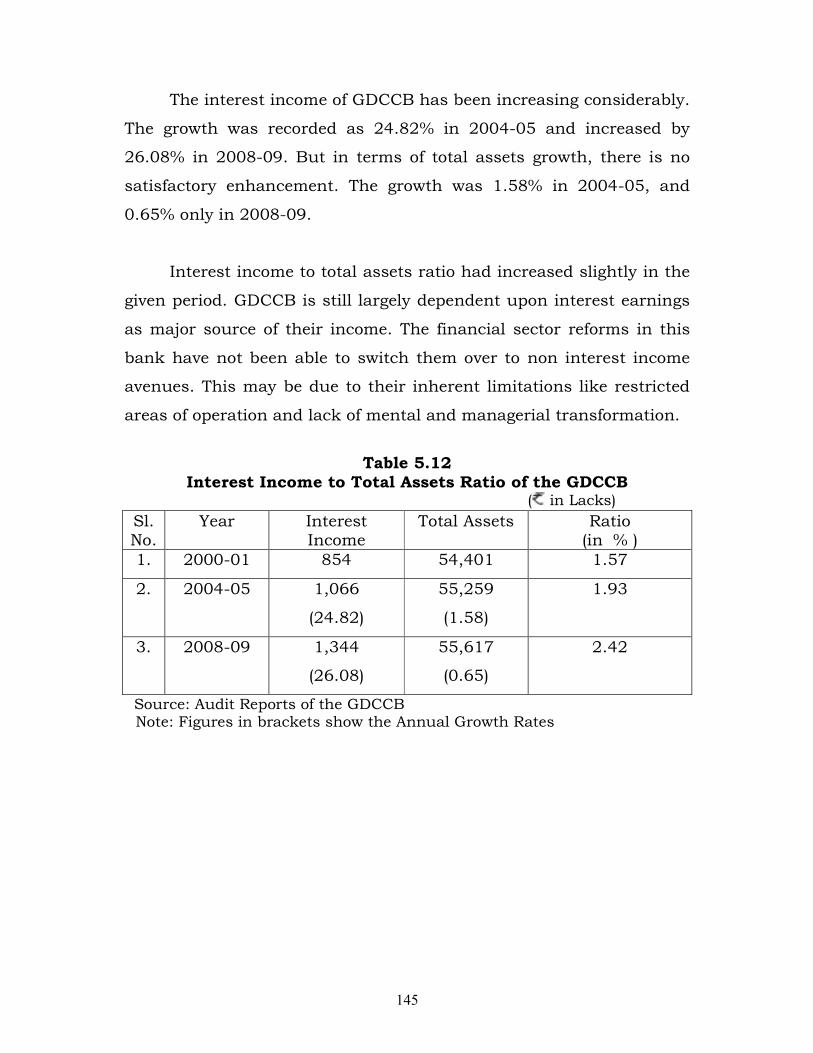
The interest income of GDCCB has been increasing considerably.
The growth was recorded as 24.82% in 2004-05 and increased by
26.08% in 2008-09. But in terms of total assets growth, there is no
satisfactory enhancement. The growth was 1.58% in 2004-05, and
0.65% only in 2008-09.
Interest income to total assets ratio had increased slightly in the
given period. GDCCB is still largely dependent upon interest earnings
as major source of their income. The financial sector reforms in this
bank have not been able to switch them over to non interest income
avenues. This may be due to their inherent limitations like restricted
areas of operation and lack of mental and managerial transformation.
Table 5.12
Interest Income to Total Assets Ratio of the GDCCB ( in Lacks)
Sl. No.
Year Interest Income
Total Assets Ratio (in % )
1. 2000-01 854 54,401 1.57
2. 2004-05 1,066
(24.82)
55,259
(1.58)
1.93
3. 2008-09 1,344
(26.08)
55,617
(0.65)
2.42
Source: Audit Reports of the GDCCB Note: Figures in brackets show the Annual Growth Rates
146
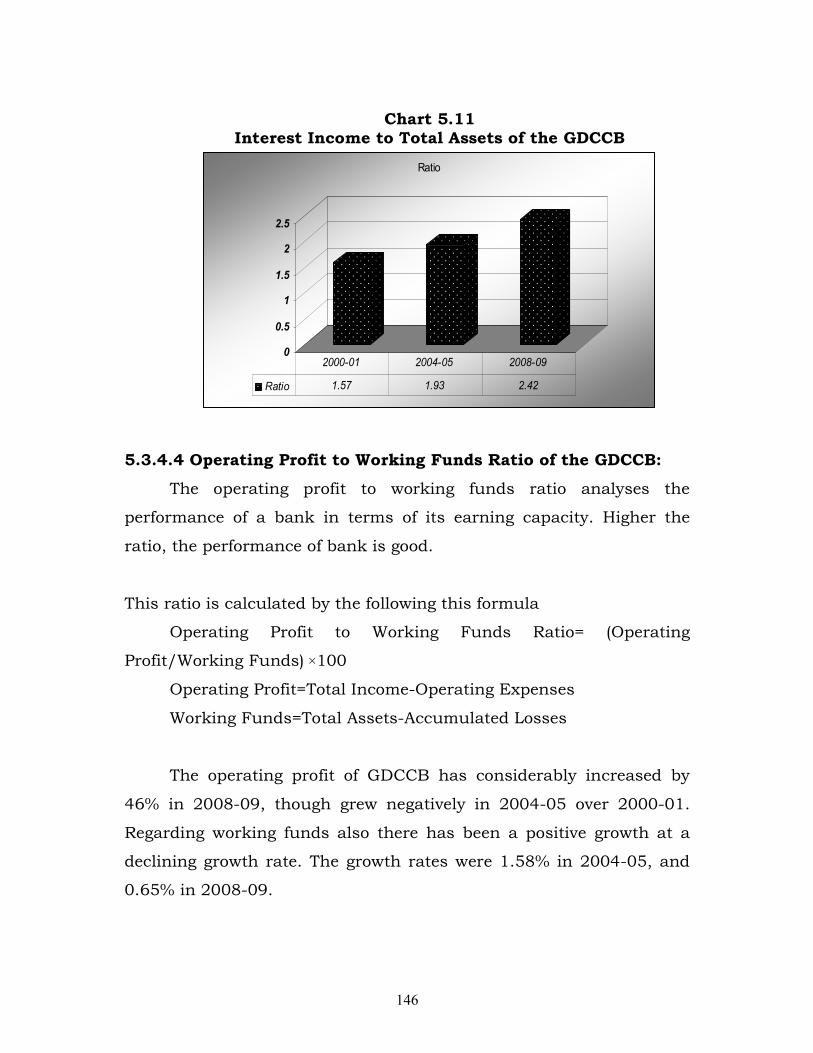
Chart 5.11
Interest Income to Total Assets of the GDCCB
0
0.5
1
1.5
2
2.5
Ratio
Ratio 1.57 1.93 2.42
2000-01 2004-05 2008-09
5.3.4.4 Operating Profit to Working Funds Ratio of the GDCCB:
The operating profit to working funds ratio analyses the
performance of a bank in terms of its earning capacity. Higher the
ratio, the performance of bank is good.
This ratio is calculated by the following this formula
Operating Profit to Working Funds Ratio= (Operating
Profit/Working Funds) ×100
Operating Profit=Total Income-Operating Expenses
Working Funds=Total Assets-Accumulated Losses
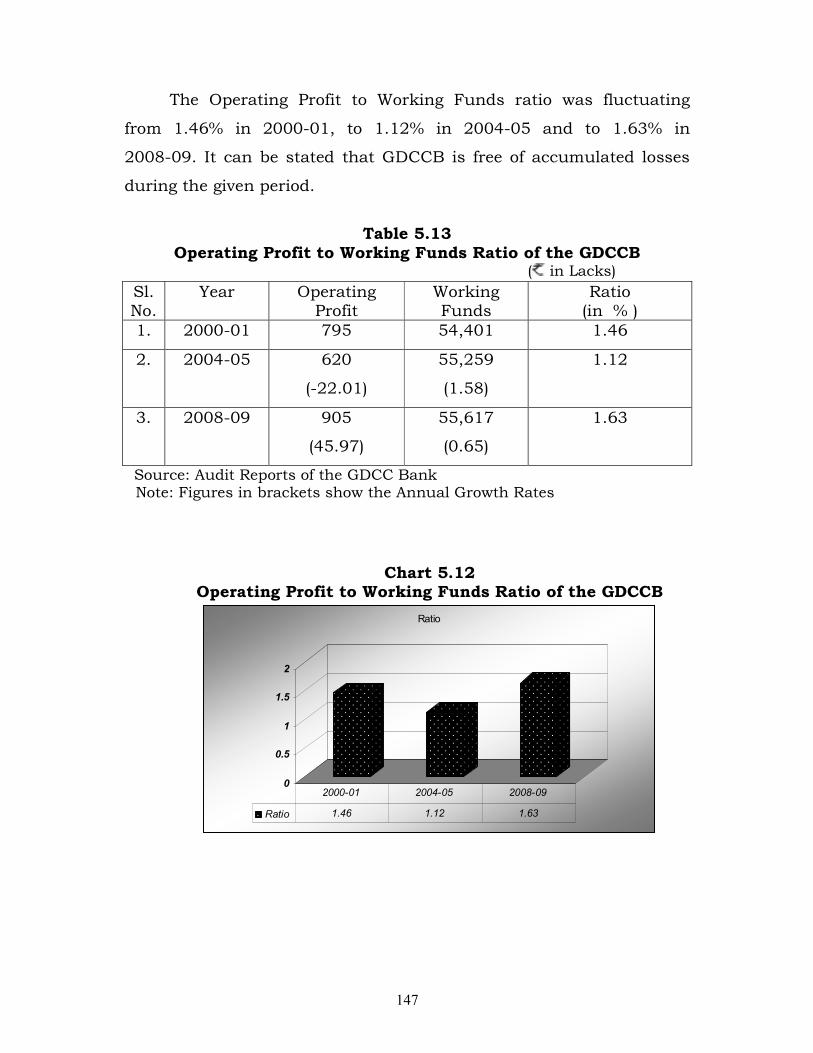
The operating profit of GDCCB has considerably increased by
46% in 2008-09, though grew negatively in 2004-05 over 2000-01.
Regarding working funds also there has been a positive growth at a
declining growth rate. The growth rates were 1.58% in 2004-05, and
0.65% in 2008-09.
147
The Operating Profit to Working Funds ratio was fluctuating
from 1.46% in 2000-01, to 1.12% in 2004-05 and to 1.63% in
2008-09. It can be stated that GDCCB is free of accumulated losses
during the given period.
Table 5.13
Operating Profit to Working Funds Ratio of the GDCCB ( in Lacks)
Sl. No.
Year Operating Profit
Working Funds
Ratio (in % )
1. 2000-01 795 54,401 1.46
2. 2004-05 620
(-22.01)
55,259
(1.58)
1.12
3. 2008-09 905
(45.97)
55,617
(0.65)
1.63
Source: Audit Reports of the GDCC Bank Note: Figures in brackets show the Annual Growth Rates
Chart 5.12 Operating Profit to Working Funds Ratio of the GDCCB
0
0.5
1
1.5
2
Ratio
Ratio 1.46 1.12 1.63
2000-01 2004-05 2008-09
148
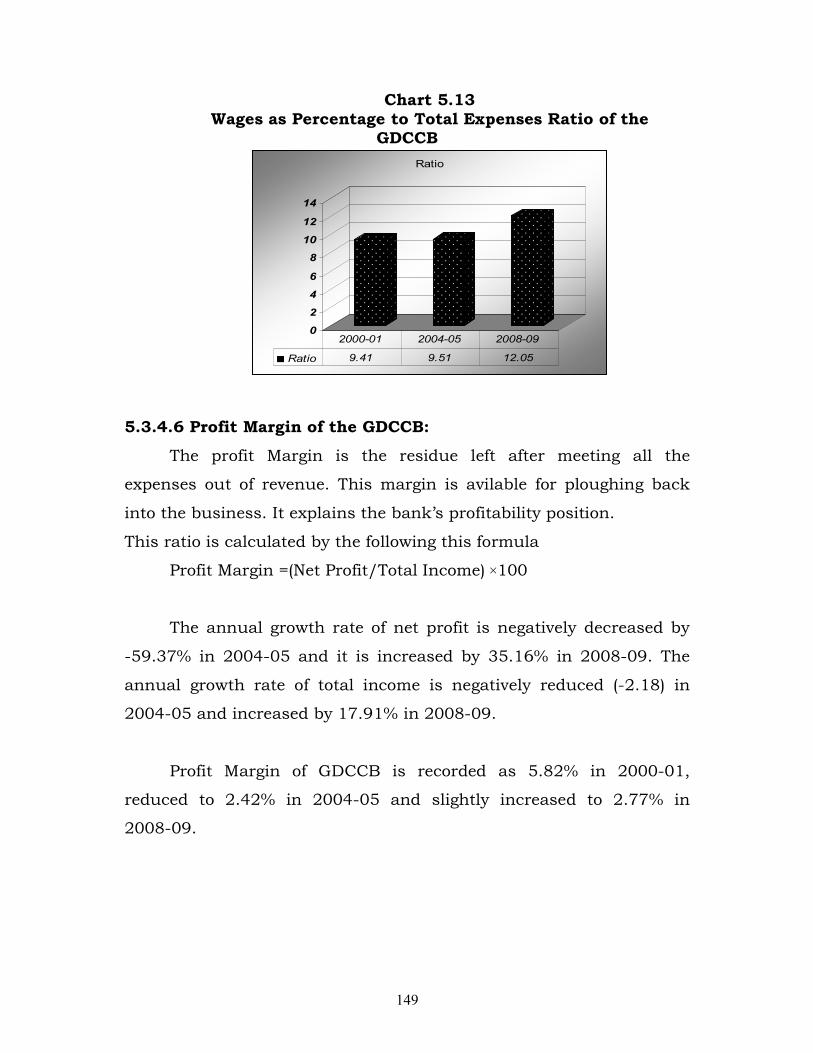
5.3.4.5 Wages as Percentage of Total Expenses Ratio of the
GDCCB:
Wages of staff to total expenses ratio also helps to know how
much amount is paid as wages out of total expenses. It explains the
relationship between the payment and provisions for employees and
total expenses. Lower the ratio better is the performance of a bank.
This ratio is calculated by the following this formula
Wages as % of Total Expenses Ratio= (Staff Expenses/Total
Expenses) ×100
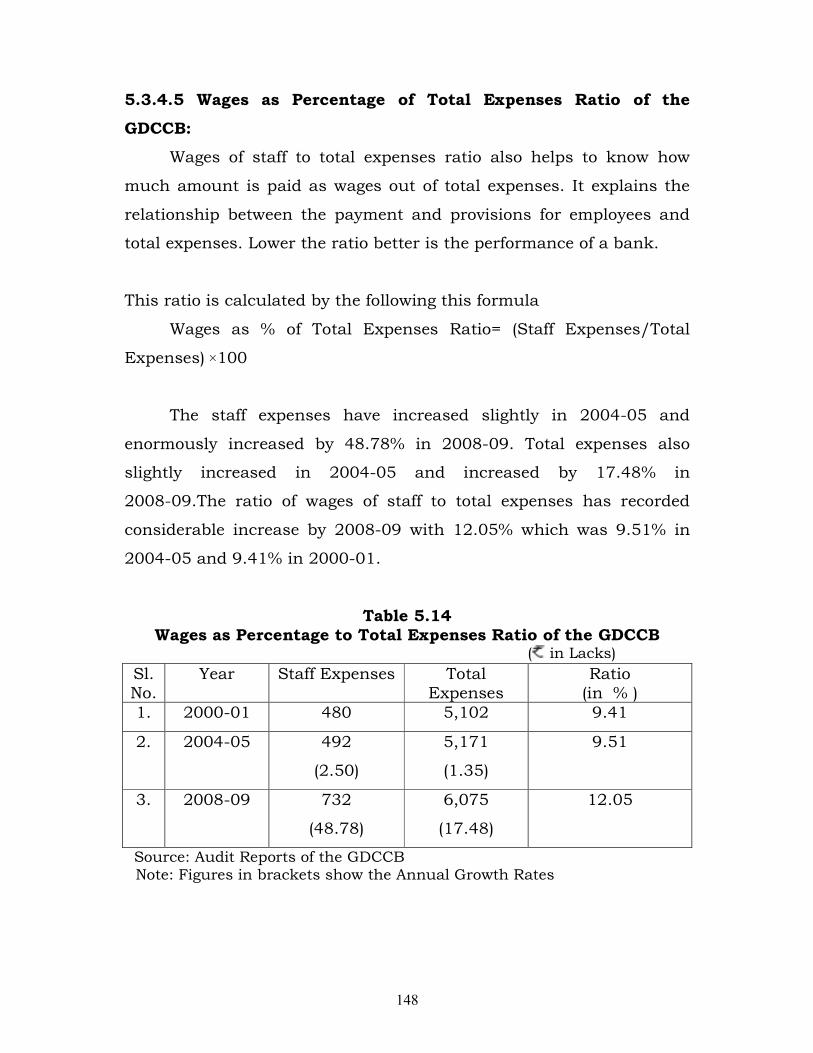
The staff expenses have increased slightly in 2004-05 and
enormously increased by 48.78% in 2008-09. Total expenses also
slightly increased in 2004-05 and increased by 17.48% in
2008-09.The ratio of wages of staff to total expenses has recorded
considerable increase by 2008-09 with 12.05% which was 9.51% in
2004-05 and 9.41% in 2000-01.
Table 5.14 Wages as Percentage to Total Expenses Ratio of the GDCCB
( in Lacks)
Sl. No.
Year Staff Expenses Total Expenses
Ratio (in % )
1. 2000-01 480 5,102 9.41
2. 2004-05 492
(2.50)
5,171
(1.35)
9.51
3. 2008-09 732
(48.78)
6,075
(17.48)
12.05
Source: Audit Reports of the GDCCB Note: Figures in brackets show the Annual Growth Rates
149
Chart 5.13 Wages as Percentage to Total Expenses Ratio of the
GDCCB
0
2
4
6
8
10
12
14
Ratio
Ratio 9.41 9.51 12.05
2000-01 2004-05 2008-09
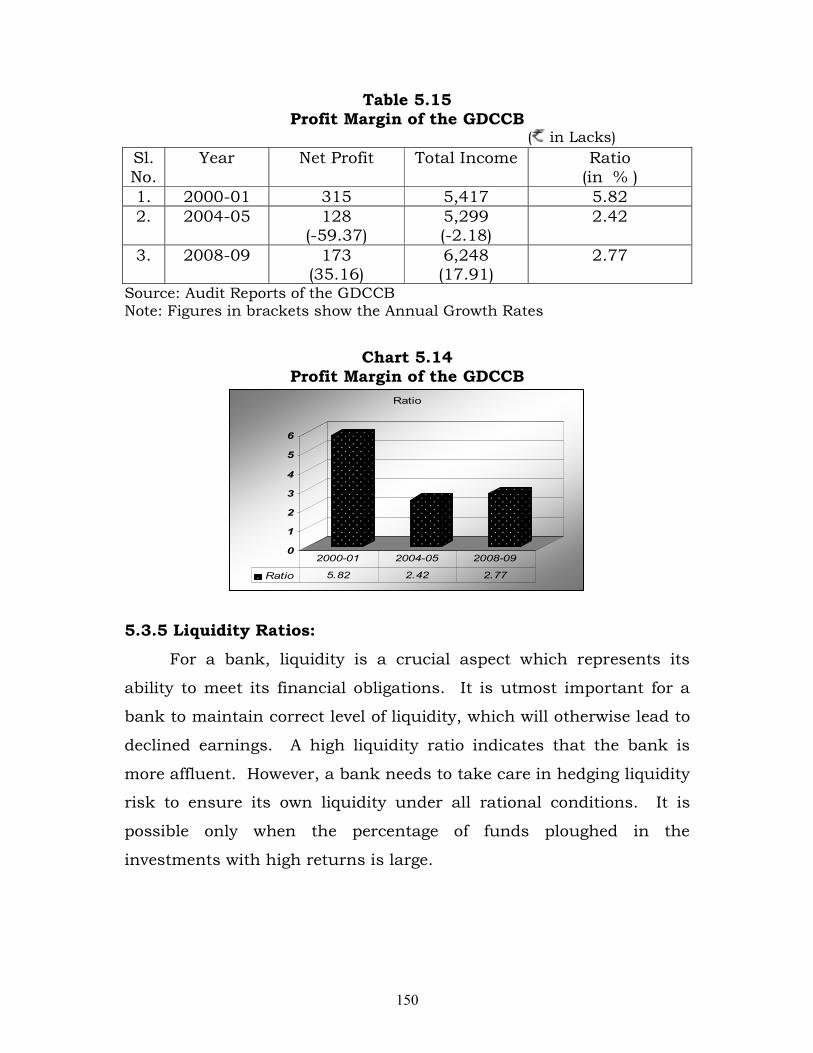
5.3.4.6 Profit Margin of the GDCCB:
The profit Margin is the residue left after meeting all the
expenses out of revenue. This margin is avilable for ploughing back
into the business. It explains the bank’s profitability position.
This ratio is calculated by the following this formula
Profit Margin =(Net Profit/Total Income) ×100
The annual growth rate of net profit is negatively decreased by
-59.37% in 2004-05 and it is increased by 35.16% in 2008-09. The
annual growth rate of total income is negatively reduced (-2.18) in
2004-05 and increased by 17.91% in 2008-09.
Profit Margin of GDCCB is recorded as 5.82% in 2000-01,
reduced to 2.42% in 2004-05 and slightly increased to 2.77% in
2008-09.
150
Table 5.15 Profit Margin of the GDCCB
( in Lacks)
Sl. No.
Year Net Profit Total Income Ratio (in % )
1. 2000-01 315 5,417 5.82
2. 2004-05 128 (-59.37)
5,299 (-2.18)
2.42
3. 2008-09 173 (35.16)
6,248 (17.91)
2.77
Source: Audit Reports of the GDCCB Note: Figures in brackets show the Annual Growth Rates
Chart 5.14
Profit Margin of the GDCCB
0
1
2
3
4
5
6
Ratio
Ratio 5.82 2.42 2.77
2000-01 2004-05 2008-09
5.3.5 Liquidity Ratios:
For a bank, liquidity is a crucial aspect which represents its
ability to meet its financial obligations. It is utmost important for a
bank to maintain correct level of liquidity, which will otherwise lead to
declined earnings. A high liquidity ratio indicates that the bank is
more affluent. However, a bank needs to take care in hedging liquidity
risk to ensure its own liquidity under all rational conditions. It is
possible only when the percentage of funds ploughed in the
investments with high returns is large.
151
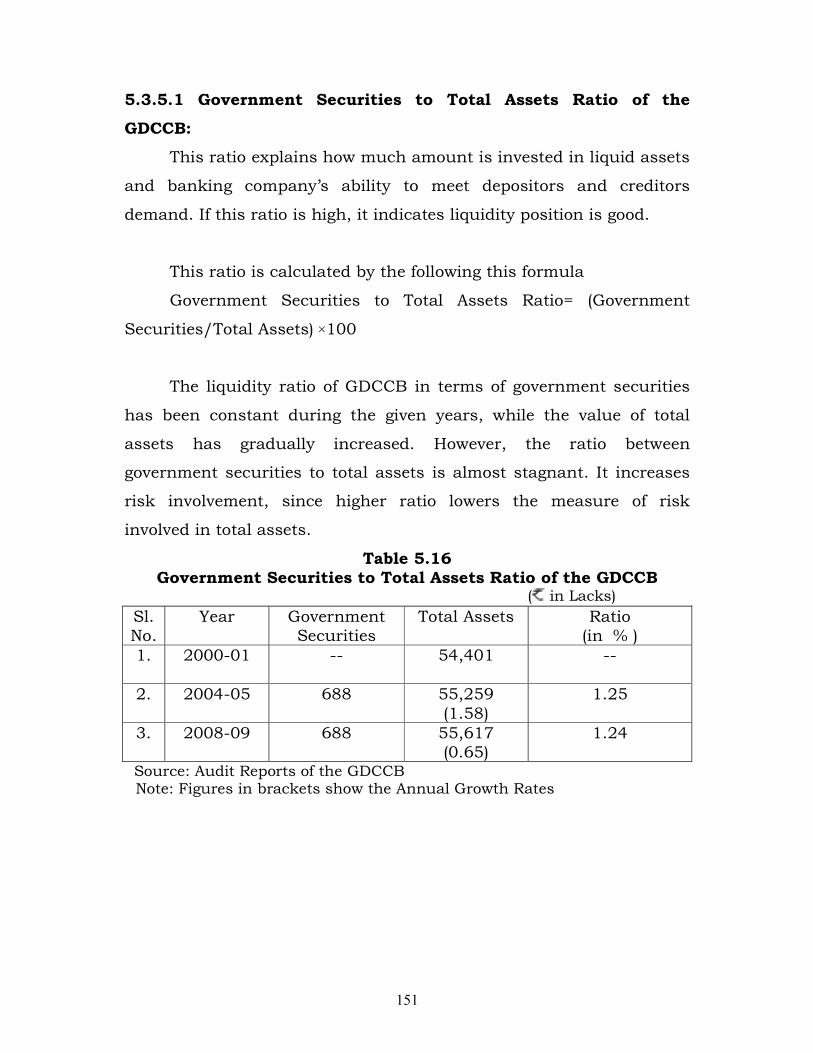
5.3.5.1 Government Securities to Total Assets Ratio of the
GDCCB:
This ratio explains how much amount is invested in liquid assets
and banking company’s ability to meet depositors and creditors
demand. If this ratio is high, it indicates liquidity position is good.
This ratio is calculated by the following this formula
Government Securities to Total Assets Ratio= (Government
Securities/Total Assets) ×100
The liquidity ratio of GDCCB in terms of government securities
has been constant during the given years, while the value of total
assets has gradually increased. However, the ratio between
government securities to total assets is almost stagnant. It increases
risk involvement, since higher ratio lowers the measure of risk
involved in total assets.
Table 5.16 Government Securities to Total Assets Ratio of the GDCCB
( in Lacks)
Sl. No.
Year Government Securities
Total Assets Ratio (in % )
1. 2000-01 -- 54,401 --
2. 2004-05 688 55,259
(1.58)
1.25
3. 2008-09 688 55,617 (0.65)
1.24
Source: Audit Reports of the GDCCB Note: Figures in brackets show the Annual Growth Rates
152
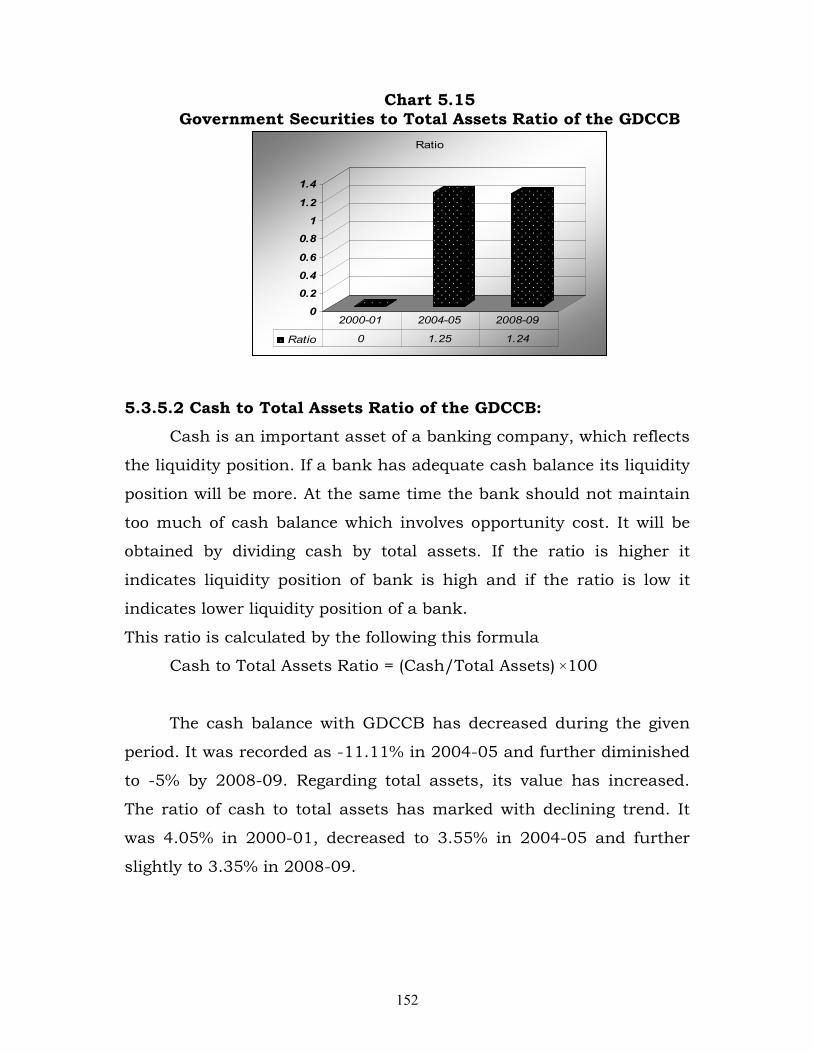
Chart 5.15 Government Securities to Total Assets Ratio of the GDCCB
0
0.2
0.4
0.6
0.8
1
1.2
1.4
Ratio
Ratio 0 1.25 1.24
2000-01 2004-05 2008-09
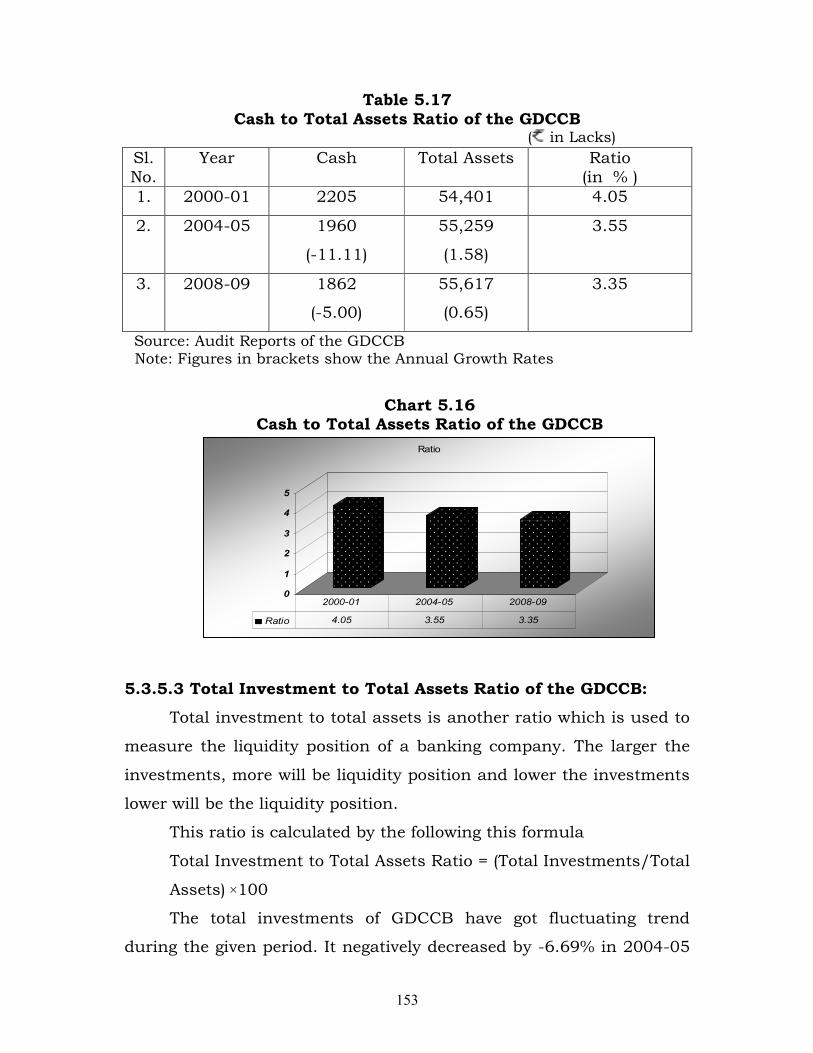
5.3.5.2 Cash to Total Assets Ratio of the GDCCB:
Cash is an important asset of a banking company, which reflects
the liquidity position. If a bank has adequate cash balance its liquidity
position will be more. At the same time the bank should not maintain
too much of cash balance which involves opportunity cost. It will be
obtained by dividing cash by total assets. If the ratio is higher it
indicates liquidity position of bank is high and if the ratio is low it
indicates lower liquidity position of a bank.
This ratio is calculated by the following this formula
Cash to Total Assets Ratio = (Cash/Total Assets) ×100
The cash balance with GDCCB has decreased during the given
period. It was recorded as -11.11% in 2004-05 and further diminished
to -5% by 2008-09. Regarding total assets, its value has increased.
The ratio of cash to total assets has marked with declining trend. It
was 4.05% in 2000-01, decreased to 3.55% in 2004-05 and further
slightly to 3.35% in 2008-09.
153
Table 5.17 Cash to Total Assets Ratio of the GDCCB
( in Lacks)
Sl. No.
Year Cash Total Assets Ratio (in % )
1. 2000-01 2205 54,401 4.05
2. 2004-05 1960
(-11.11)
55,259
(1.58)
3.55
3. 2008-09 1862
(-5.00)
55,617
(0.65)
3.35
Source: Audit Reports of the GDCCB Note: Figures in brackets show the Annual Growth Rates
Chart 5.16
Cash to Total Assets Ratio of the GDCCB
0
1
2
3
4
5
Ratio
Ratio 4.05 3.55 3.35
2000-01 2004-05 2008-09
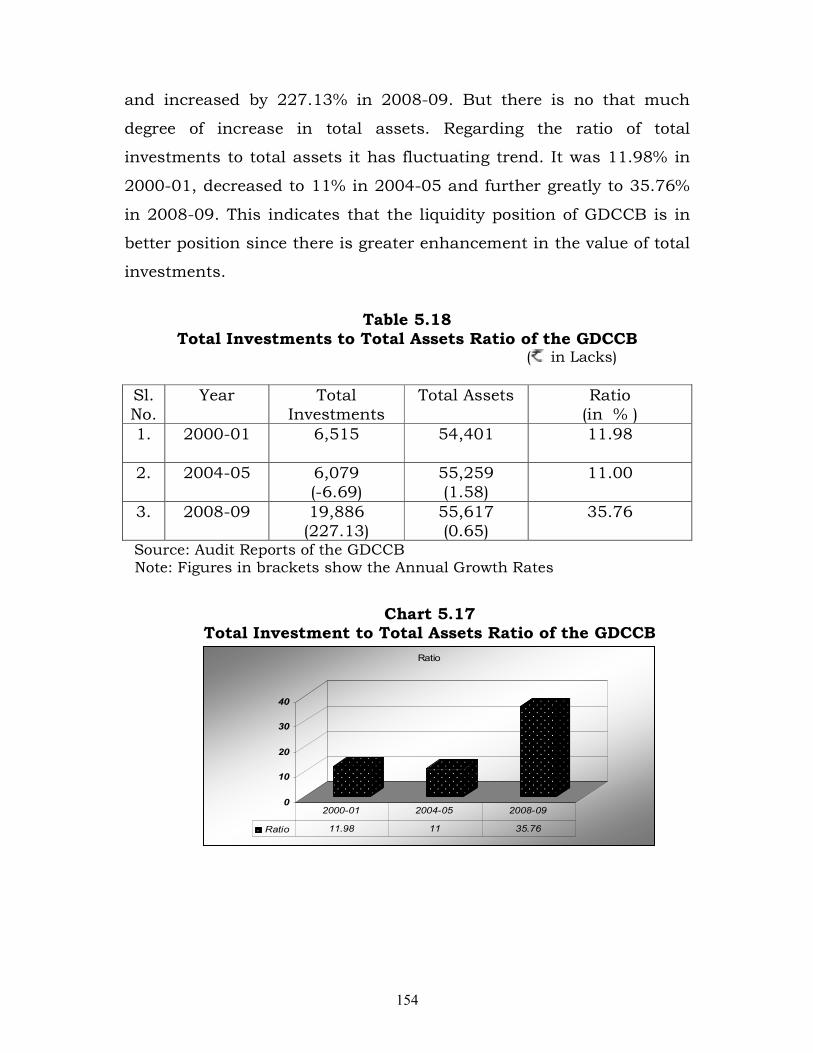
5.3.5.3 Total Investment to Total Assets Ratio of the GDCCB:
Total investment to total assets is another ratio which is used to
measure the liquidity position of a banking company. The larger the
investments, more will be liquidity position and lower the investments
lower will be the liquidity position.
This ratio is calculated by the following this formula
Total Investment to Total Assets Ratio = (Total Investments/Total
Assets) ×100
The total investments of GDCCB have got fluctuating trend
during the given period. It negatively decreased by -6.69% in 2004-05
154
and increased by 227.13% in 2008-09. But there is no that much
degree of increase in total assets. Regarding the ratio of total
investments to total assets it has fluctuating trend. It was 11.98% in
2000-01, decreased to 11% in 2004-05 and further greatly to 35.76%
in 2008-09. This indicates that the liquidity position of GDCCB is in
better position since there is greater enhancement in the value of total
investments.
Table 5.18
Total Investments to Total Assets Ratio of the GDCCB ( in Lacks)
Sl. No.
Year Total Investments
Total Assets Ratio (in % )
1. 2000-01 6,515 54,401 11.98
2. 2004-05 6,079 (-6.69)
55,259 (1.58)
11.00
3. 2008-09 19,886 (227.13)
55,617 (0.65)
35.76
Source: Audit Reports of the GDCCB Note: Figures in brackets show the Annual Growth Rates
Chart 5.17
Total Investment to Total Assets Ratio of the GDCCB
0
10
20
30
40
Ratio
Ratio 11.98 11 35.76
2000-01 2004-05 2008-09
155
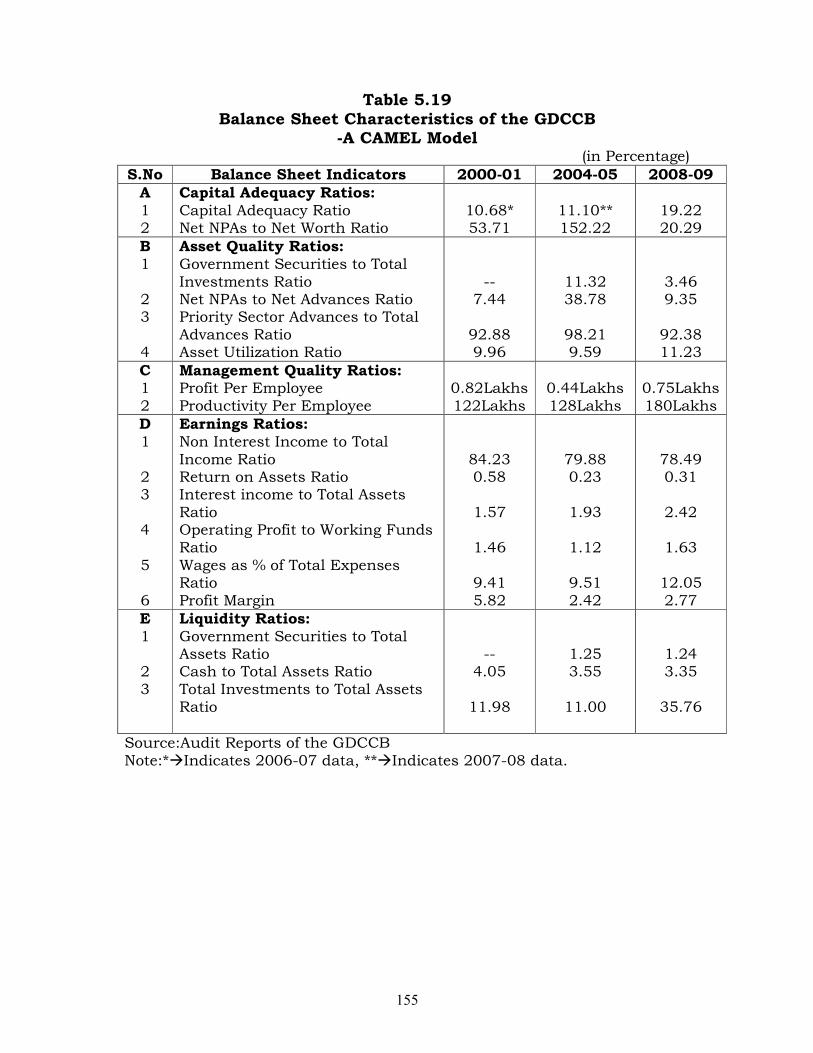
Table 5.19 Balance Sheet Characteristics of the GDCCB
-A CAMEL Model (in Percentage)
S.No Balance Sheet Indicators 2000-01 2004-05 2008-09
A 1 2
Capital Adequacy Ratios: Capital Adequacy Ratio Net NPAs to Net Worth Ratio
10.68* 53.71
11.10** 152.22
19.22 20.29
B 1 2 3 4
Asset Quality Ratios: Government Securities to Total Investments Ratio Net NPAs to Net Advances Ratio Priority Sector Advances to Total Advances Ratio Asset Utilization Ratio
--
7.44
92.88 9.96
11.32 38.78
98.21 9.59
3.46 9.35
92.38 11.23
C 1 2
Management Quality Ratios: Profit Per Employee Productivity Per Employee
0.82Lakhs 122Lakhs
0.44Lakhs 128Lakhs
0.75Lakhs 180Lakhs
D 1 2 3 4 5 6
Earnings Ratios: Non Interest Income to Total Income Ratio Return on Assets Ratio Interest income to Total Assets Ratio Operating Profit to Working Funds Ratio Wages as % of Total Expenses Ratio Profit Margin
84.23 0.58
1.57
1.46
9.41 5.82
79.88 0.23
1.93
1.12
9.51 2.42
78.49 0.31
2.42
1.63
12.05 2.77
E 1 2 3
Liquidity Ratios: Government Securities to Total Assets Ratio Cash to Total Assets Ratio Total Investments to Total Assets Ratio
--
4.05
11.98
1.25 3.55
11.00
1.24 3.35
35.76
Source:Audit Reports of the GDCCB Note:*�Indicates 2006-07 data, **�Indicates 2007-08 data.
156
5.4 Findings:
� According to the parameters indicated by NABARD, in the case
of the GDCCB, the sum of the Bad&Doubtful Debts and
Accumulated Losses has been below the 50 percent mark of the
owned funds. It is evident from the analysis that the financial
position of the GDCCB is better.
� As per the prudential norms, the banks being operated in India
are required to achieve 9% CRAR. It shows that the GDCCB has
well exceeded the stipulated level. Similarly, the CRAR was
10.68% in 2007-08 which has gone up and touched 20% mark
in 2008-09. All this explains the strength of GDCCB in terms of
sound capital base and its adequacy.
� Employee productivity of GDCCB, it can be stated that this is
increased satisfactorily to 180 lakhs in 2008-09 when
compared to the given previous years. By 2008-09 number of
employees had decreased but the productivity ratio has shown
increasing trend.
� The interest income of GDCCB has been increasing
considerably. The growth was recorded as 24.82% in 2004-05
and increased by 26.08% in 2008-09. Interest income to total
assets ratio is increasing slightly in the given period. GDCCB is
still largely dependent upon interest earnings as major source of
their income.
157
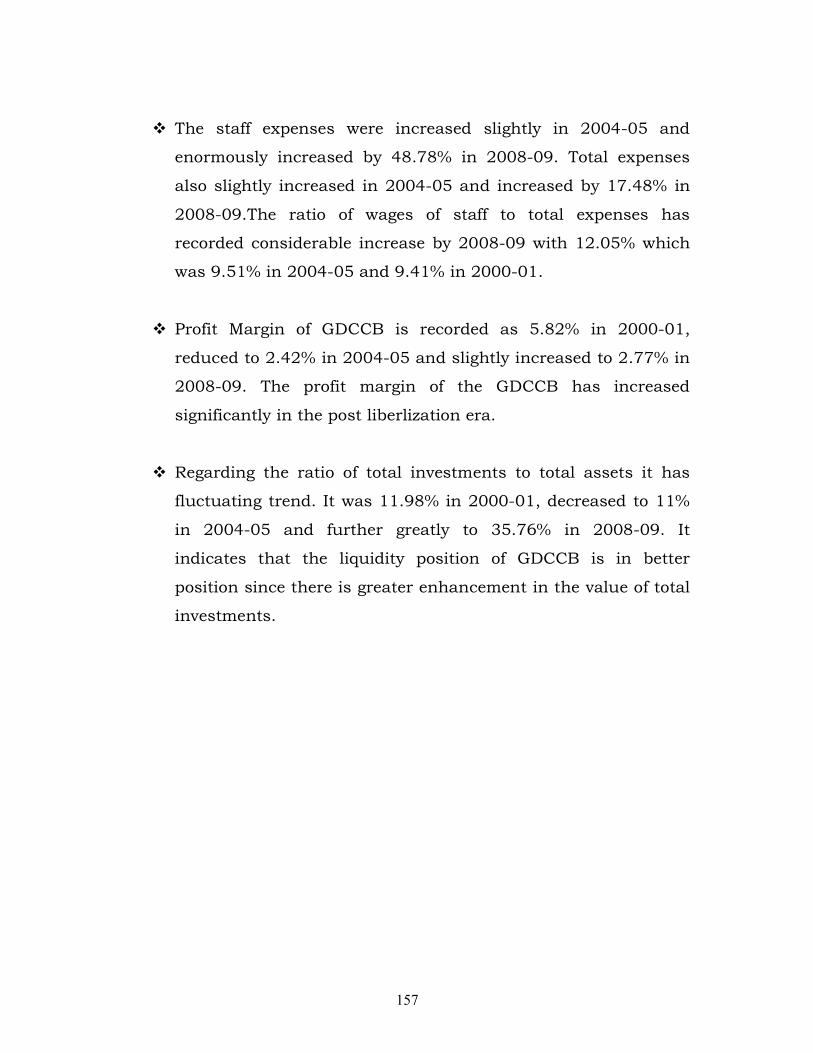
� The staff expenses were increased slightly in 2004-05 and
enormously increased by 48.78% in 2008-09. Total expenses
also slightly increased in 2004-05 and increased by 17.48% in
2008-09.The ratio of wages of staff to total expenses has
recorded considerable increase by 2008-09 with 12.05% which
was 9.51% in 2004-05 and 9.41% in 2000-01.
� Profit Margin of GDCCB is recorded as 5.82% in 2000-01,
reduced to 2.42% in 2004-05 and slightly increased to 2.77% in
2008-09. The profit margin of the GDCCB has increased
significantly in the post liberlization era.
� Regarding the ratio of total investments to total assets it has
fluctuating trend. It was 11.98% in 2000-01, decreased to 11%
in 2004-05 and further greatly to 35.76% in 2008-09. It
indicates that the liquidity position of GDCCB is in better
position since there is greater enhancement in the value of total
investments.


![8365 programacao semana_de_eng._florestal[1]](https://img.pdfslide.net/doc/110x75/5563ed8dd8b42a0a288b49b3/8365-programacao-semanadeengflorestal1.jpg)