Embed Size (px)
Citation preview

An Assessment of Regional State AidAn Assessment of Regional State Aid
Prof. P. NicolaidesEuropean Institute of Public Administration
Maastricht, The Netherlands

Three themes
• Distribution of regional aid
• Effectiveness of regional aid
• Policy implications in view of the forthcoming
reform

How much state aid?
Total state aid (2001) € 86 bnAgriculture & fisheries € 13 bnTransport € 39 bnCoal € 6 bnManufacturing € 21 bnServices [tourism, financial, media] € 3 bnEmployment/training € 3 bn
Total state aid (2001) € 86 bnAgriculture & fisheries € 13 bnTransport € 39 bnCoal € 6 bnManufacturing € 21 bnServices [tourism, financial, media] € 3 bnEmployment/training € 3 bn
Total state aid (2001) € 86 bnAgriculture & fisheries € 13 bnTransport € 39 bnOther sectors € 10 bnHorizontal objectives € 24 bn
Total state aid (2001) € 86 bnAgriculture & fisheries € 13 bnTransport € 39 bnOther sectors € 10 bnHorizontal objectives € 24 bn

How much regional aid?
Total aid to “a” regions (2001): € 8 bn [25% of aid other than agric. & transp. or 33% of horizontal aid] D & I account for 50% of regional aid to “a” regions

How is regional state aid distributed? - time series
Hypothesis: aid granted to reduce regional disparities=> so it is distributed according to “need” [income disparity] Dt+1 = a + bSt + e [D: income disparities; S: state aid]
Test results: sign of independent variable (* = significant)[aid as % of GDP / aid per capita; per country during 1990-2000]
Reg Hor Ag/Tr TotalBelgium +/+ -/- (*) -/+ -/- (*)France -/- +/+ +/+ +/+Germany +/+ -/- +/+ +/+Greece +/+ -/- (*) +/+ -/- (*)Italy -/- -/- -/- -/-Netherlands -/- -/- (*) +/+ -/-Portugal -/- -/+ -/+ +/+Spain +/+ +/+ -/- (*) -/-UK -/- -/- +/+ +/+

How is regional state aid distributed? - cross section
Type of state aid 2000 1999Regional -/- -/-Horizontal +/+ +/+Agric. & Transp. +/+ +/+Total +/- +/+
Test results: sign of independent variable[aid as % of GDP / aid per capita; across EU, 1999 & 2000]

Italy: Aid to Business
0
0.2
0.4
0.6
0.8
1
1.2
1.4
1.6
1 2 3 4 5 6 7 8 9 10 11 12 13 14 15 16 17 18 19 20
Business Aid as % of Regional GDP
2000 2001 GDP
Italy: Aid to Business
0
0.2
0.4
0.6
0.8
1
1.2
1.4
1.6
1 2 3 4 5 6 7 8 9 10 11 12 13 14 15 16 17 18 19 20
Business Aid as % of Regional GDP
2000 2001 GDP
I
Spain: Regional Aid
0
0.2
0.4
0.6
0.8
1
1.2
1.4
1.6
1.8
1 2 3 4 5 6 7 8 9 10 11 12 13 14 15 16 17 18
Regional Aid as % of Regional GDP
2001 2002 GDP
Spain: Regional Aid
0
0.2
0.4
0.6
0.8
1
1.2
1.4
1.6
1.8
1 2 3 4 5 6 7 8 9 10 11 12 13 14 15 16 17 18
Regional Aid as % of Regional GDP
2001 2002 GDP
E UK: Regional Selective Assistance & Enterprice Grants (GBP, mil; Apr 2001 - March 2002)
0
0.02
0.04
0.06
0.08
0.1
0.12
0.14
0.16
0.18
1 2 3 4 5 6 7 8 9 10 11
Regional Aid as % of Regional GDP
% Aid GDP
UK: Regional Selective Assistance & Enterprice Grants (GBP, mil; Apr 2001 - March 2002)
0
0.02
0.04
0.06
0.08
0.1
0.12
0.14
0.16
0.18
1 2 3 4 5 6 7 8 9 10 11
Regional Aid as % of Regional GDP
% Aid GDP
Member State experience: More resources for poor regions?Yes, but how about within poor regions & over time?
UK

Similar situation in other Member StatesFinland: Regional Distrubution of State Aid
0
0.2
0.4
0.6
0.8
1
1.2
1.4
1.6
1 2 3 4 5
Total Aid as % of Regional GDP
% Aid GDP
Finland: Regional Distrubution of State Aid
0
0.2
0.4
0.6
0.8
1
1.2
1.4
1.6
1 2 3 4 5
Total Aid as % of Regional GDP
% Aid GDP
France: Regional Distrubution of State Aid
0
1
2
3
4
5
6
1 2 3 4 5 6 7 8 9 10 11 12 13 14 15 16 17 18 19 20 21 22
State Aid per Head (euros)
1995-1998 1999-2002 GDP
France: Regional Distrubution of State Aid
0
1
2
3
4
5
6
1 2 3 4 5 6 7 8 9 10 11 12 13 14 15 16 17 18 19 20 21 22
State Aid per Head (euros)
1995-1998 1999-2002 GDP
Greece: Aid to investment and regional development
0
0.1
0.2
0.3
0.4
0.5
0.6
0.7
0.8
0.9
1
1 2 3 4 5 6 7 8 9 10 11 12 13
State Aid as % of Regional GDP
2000 2001 GDP
Greece: Aid to investment and regional development
0
0.1
0.2
0.3
0.4
0.5
0.6
0.7
0.8
0.9
1
1 2 3 4 5 6 7 8 9 10 11 12 13
State Aid as % of Regional GDP
2000 2001 GDP
Ireland: Incentive Schemes (grants & equity)
0
0.2
0.4
0.6
0.8
1
1.2
1.4
1 2
Grants & Equity as % of Regional GDP
2000 2001 GDP
Ireland: Incentive Schemes (grants & equity)
0
0.2
0.4
0.6
0.8
1
1.2
1.4
1 2
Grants & Equity as % of Regional GDP
2000 2001 GDP
FIN F
GR IRL
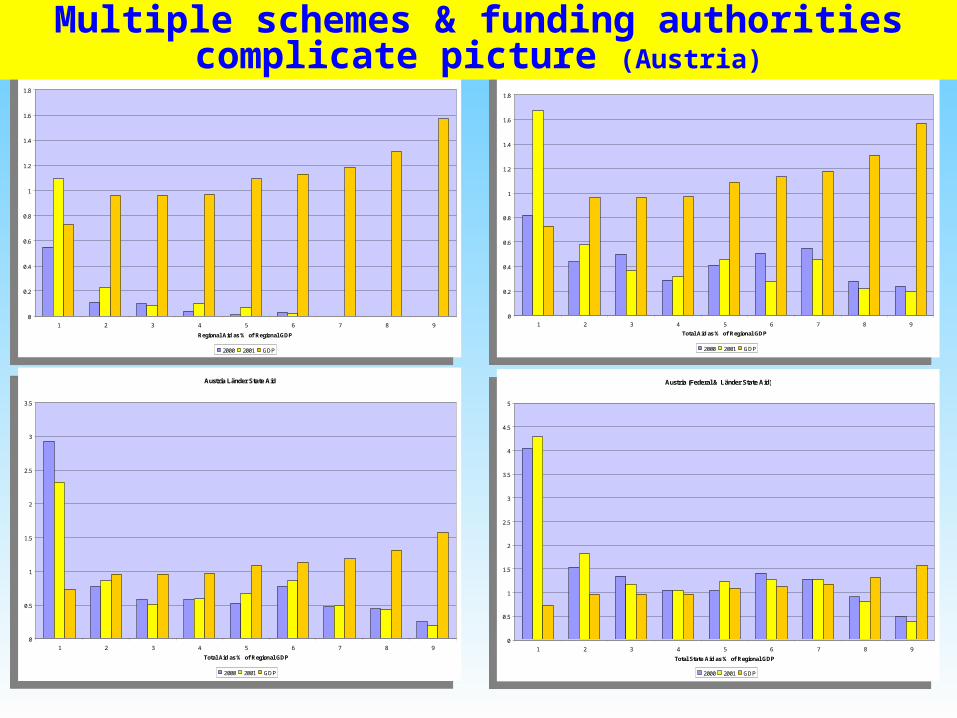
Austria Federal State Aid
0
0.2
0.4
0.6
0.8
1
1.2
1.4
1.6
1.8
1 2 3 4 5 6 7 8 9
Regional Aid as % of Regional GDP
2000 2001 GDP
Austria Federal State Aid
0
0.2
0.4
0.6
0.8
1
1.2
1.4
1.6
1.8
1 2 3 4 5 6 7 8 9
Regional Aid as % of Regional GDP
2000 2001 GDP
Austria Federal State Aid
0
0.2
0.4
0.6
0.8
1
1.2
1.4
1.6
1.8
1 2 3 4 5 6 7 8 9
Total Aid as % of Regional GDP
2000 2001 GDP
Austria Federal State Aid
0
0.2
0.4
0.6
0.8
1
1.2
1.4
1.6
1.8
1 2 3 4 5 6 7 8 9
Total Aid as % of Regional GDP
2000 2001 GDP
Multiple schemes & funding authorities complicate picture (Austria)
Austria Länder State Aid
0
0.5
1
1.5
2
2.5
3
3.5
1 2 3 4 5 6 7 8 9
Total Aid as % of Regional GDP
2000 2001 GDP
Austria Länder State Aid
0
0.5
1
1.5
2
2.5
3
3.5
1 2 3 4 5 6 7 8 9
Total Aid as % of Regional GDP
2000 2001 GDP
Austria (Federal & Länder State Aid)
0
0.5
1
1.5
2
2.5
3
3.5
4
4.5
5
1 2 3 4 5 6 7 8 9
Total State Aid as % of Regional GDP
2000 2001 GDP
Austria (Federal & Länder State Aid)
0
0.5
1
1.5
2
2.5
3
3.5
4
4.5
5
1 2 3 4 5 6 7 8 9
Total State Aid as % of Regional GDP
2000 2001 GDP

Is aid effective? (total aid)
state aid and cohesion
-8
-6
-4
-2
0
2
4
6
8
10
UK NL E EL F P B D I
member states
perc
enta
ge
Change in disparities Total State Aid/GDP
state aid and cohesion
-8
-6
-4
-2
0
2
4
6
8
10
UK NL E EL F P B D I
member states
perc
enta
ge
Change in disparities Total State Aid/GDP
State aid as % of GDP (1995-97)v
% change in regional income disparities (1998-00/1995-97)

Cont. (agriculture & transport aid)
state aid and cohesion
-8
-6
-4
-2
0
2
4
6
8
10
UK P E D EL I F NL B
member state
%
change in disparities agricultural aid/GDP
state aid and cohesion
-8
-6
-4
-2
0
2
4
6
8
10
UK P E D EL I F NL B
member state
%
change in disparities agricultural aid/GDP

Cont. (horizontal aid)
state aid and cohesion
-8
-6
-4
-2
0
2
4
6
8
10
EL NL UK F B D E I P
member state
%
change in disparities horizontal aid/GDP
state aid and cohesion
-8
-6
-4
-2
0
2
4
6
8
10
EL NL UK F B D E I P
member state
%
change in disparities horizontal aid/GDP

Cont. (regional aid)
state aid and cohesion
-8
-6
-4
-2
0
2
4
6
8
10
NL E P UK F B I D EL
member state
%
changes in disparities regional state aid/GDP
state aid and cohesion
-8
-6
-4
-2
0
2
4
6
8
10
NL E P UK F B I D EL
member state
%
changes in disparities regional state aid/GDP

Policy implications
Statistical evidence• There appears to be no systematic correlation between state aid
and regional disparities• State aid is unevenly distributed across regions and over time• Regional aid is not proportionally granted to most needy
regions
Statistical evidence• There appears to be no systematic correlation between state aid
and regional disparities• State aid is unevenly distributed across regions and over time• Regional aid is not proportionally granted to most needy
regions
Impact of enlargement• Average EU per capita income to decline by about 10% points• About 20-30 million of EU15 population lose 87(3)(a) status
Impact of enlargement• Average EU per capita income to decline by about 10% points• About 20-30 million of EU15 population lose 87(3)(a) status
Policy implications• Aid should be concentrated• Enlargement offers «politically convenient» opportunity to
carry out reform
Policy implications• Aid should be concentrated• Enlargement offers «politically convenient» opportunity to
carry out reform
+