Embed Size (px)
Citation preview

1
An Assessment of Small-Scale Biodigester Programmes in the Developing World: The SNV and
Hivos Approach
Name: Juliette van Hessen
Student number: 2052393
Date: June 29, 2014
Supervisor: E. Papyrakis
Environment and Resource Management Research Project (468017)
2
Table of Contents
Abstract .................................................................................................................................. 3
1.0 Introduction .................................................................................................................. 3
2.0 Principles of Domestic biogas ................................................................................. 5 2.1 What is biogas? ...................................................................................................................... 6 2.2 The technology of the domestic biogas plant ............................................................. 6 2.3 What are the benefits of domestic biodigesters? ...................................................... 7
2.3.1 Socio-economic benefits........................................................................................................... 8 2.3.2 Health benefits ............................................................................................................................. 9 2.3.3 Environmental benefits ............................................................................................................ 9
3.0 Biogas programs in developing countries ....................................................... 10 3.1 Failure story of the Ethiopia ...........................................................................................11 3.2 Success story of the National Programme on Biogas Development (NPBD) in India ................................................................................................................................................12 3.3 China’s Biogas Programme has to adapt ....................................................................12 3.4 What can be learned from the programmes? ...........................................................13
4.0 Description of SNV and Hivos programme/approach ................................. 17 4.1 SNV and Hivos ......................................................................................................................17
4.1.1 Netherlands Development Organisation - SNV............................................................ 17 4.1.2 Humanist Institute for Co-operation with Developing Countries - Hivos ........ 18
4.2 Biogas programmes implemented by SNV and Hivos ...........................................18 4.3 Market-oriented programme approach .....................................................................20
5.0 Evaluation of programs .......................................................................................... 23 5.1 Data evaluation ...................................................................................................................23
5.1.1 Sector development ................................................................................................................ 24 5.1.2 Production .................................................................................................................................. 27 5.1.3 Affordability ............................................................................................................................... 32 5.2.4 Bio- slurry Extension .............................................................................................................. 37 5.2.5 Gender .......................................................................................................................................... 39
5.2 Programmes in Africa and Asia .....................................................................................41
6.0 Discussion ................................................................................................................... 42
7.0 Conclusion ................................................................................................................... 44
Acknowledgements ......................................................................................................... 45
Literature ........................................................................................................................... 46
Appendix 1, Dashboard 2012 questionnaire ......................................................... 51
3
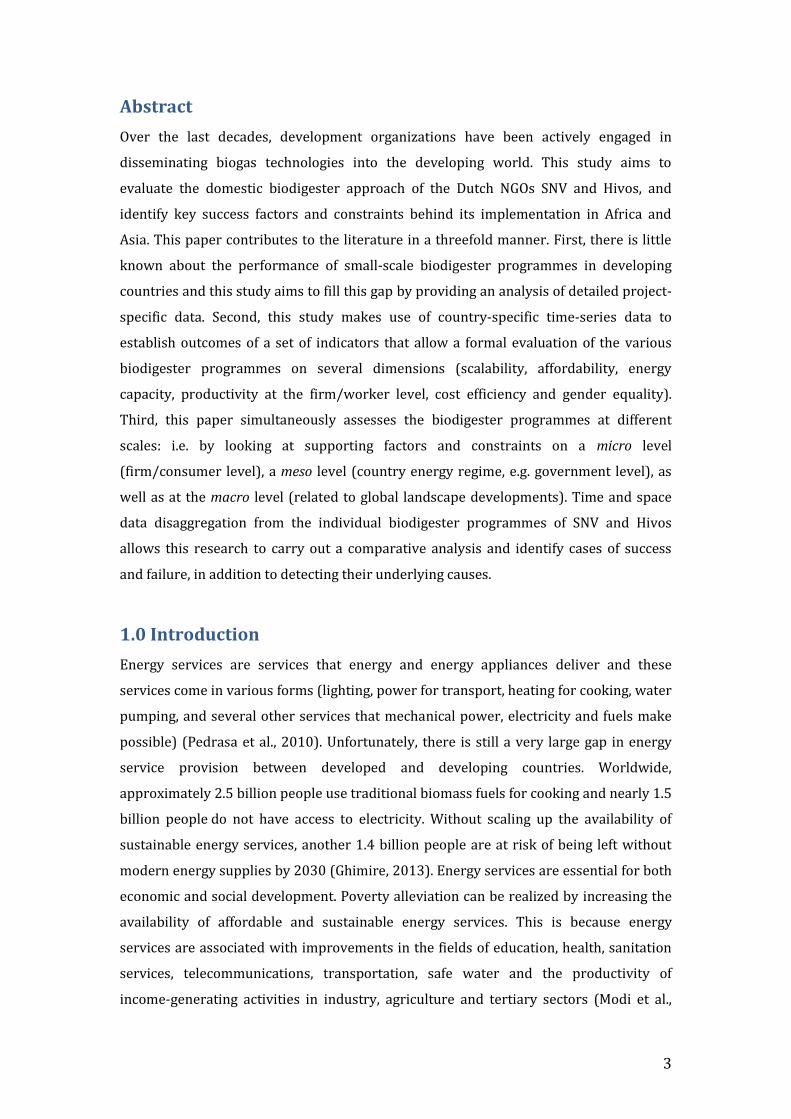
Abstract
Over the last decades, development organizations have been actively engaged in
disseminating biogas technologies into the developing world. This study aims to
evaluate the domestic biodigester approach of the Dutch NGOs SNV and Hivos, and
identify key success factors and constraints behind its implementation in Africa and
Asia. This paper contributes to the literature in a threefold manner. First, there is little
known about the performance of small-scale biodigester programmes in developing
countries and this study aims to fill this gap by providing an analysis of detailed project-
specific data. Second, this study makes use of country-specific time-series data to
establish outcomes of a set of indicators that allow a formal evaluation of the various
biodigester programmes on several dimensions (scalability, affordability, energy
capacity, productivity at the firm/worker level, cost efficiency and gender equality).
Third, this paper simultaneously assesses the biodigester programmes at different
scales: i.e. by looking at supporting factors and constraints on a micro level
(firm/consumer level), a meso level (country energy regime, e.g. government level), as
well as at the macro level (related to global landscape developments). Time and space
data disaggregation from the individual biodigester programmes of SNV and Hivos
allows this research to carry out a comparative analysis and identify cases of success
and failure, in addition to detecting their underlying causes.
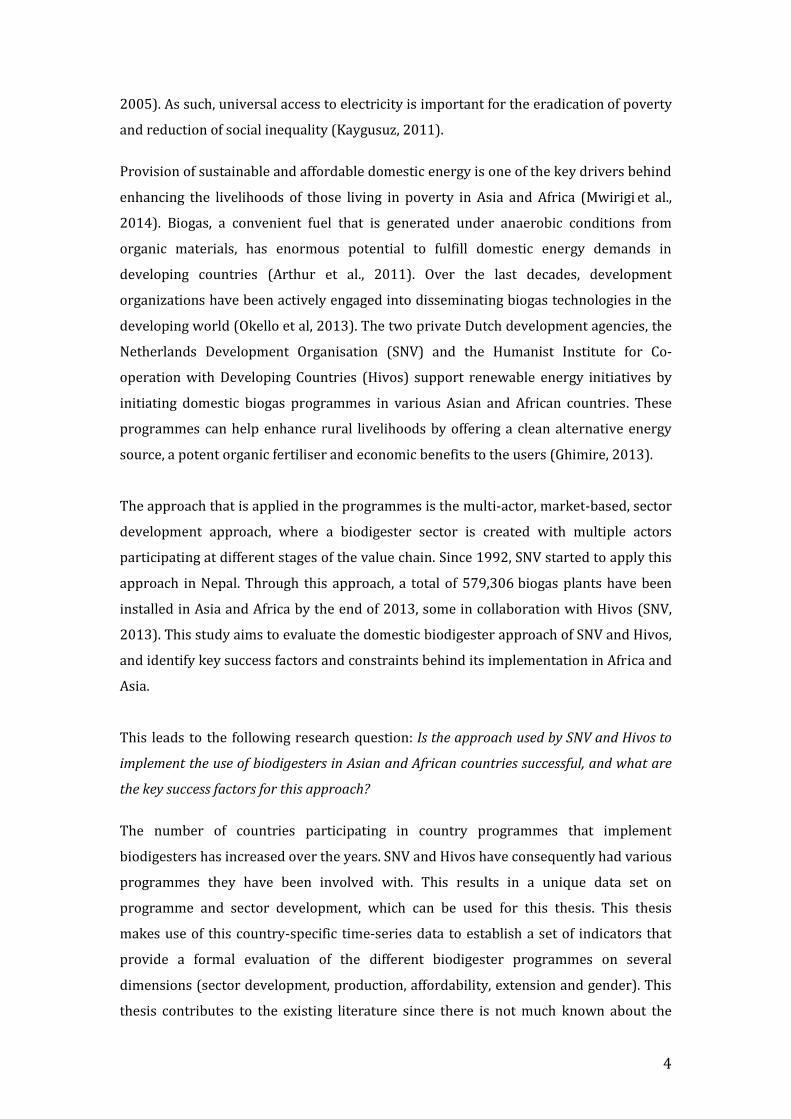
1.0 Introduction
Energy services are services that energy and energy appliances deliver and these
services come in various forms (lighting, power for transport, heating for cooking, water
pumping, and several other services that mechanical power, electricity and fuels make
possible) (Pedrasa et al., 2010). Unfortunately, there is still a very large gap in energy
service provision between developed and developing countries. Worldwide,
approximately 2.5 billion people use traditional biomass fuels for cooking and nearly 1.5
billion people.do not have access to electricity. Without scaling up the availability of
sustainable energy services, another 1.4 billion people are at risk of being left without
modern energy supplies by 2030 (Ghimire, 2013). Energy services are essential for both
economic and social development. Poverty alleviation can be realized by increasing the
availability of affordable and sustainable energy services. This is because energy
services are associated with improvements in the fields of education, health, sanitation
services, telecommunications, transportation, safe water and the productivity of
income-generating activities in industry, agriculture and tertiary sectors (Modi et al.,
4
2005). As such, universal access to electricity is important for the eradication.of poverty
and reduction of social inequality (Kaygusuz, 2011).
Provision of sustainable and affordable domestic energy is one of the key drivers behind
enhancing the livelihoods of those living in poverty in Asia and Africa (Mwirigi et al.,
2014). Biogas, a convenient fuel that is generated under anaerobic conditions from
organic materials, has enormous potential to fulfill domestic energy demands in
developing countries (Arthur et al., 2011). Over the last decades, development
organizations have been actively engaged into disseminating biogas technologies in the
developing world (Okello et al, 2013). The two private Dutch development agencies, the
Netherlands Development Organisation (SNV) and the Humanist Institute for Co-
operation with Developing Countries (Hivos) support renewable energy initiatives by
initiating domestic biogas programmes in various Asian and African countries. These
programmes can help enhance rural livelihoods by offering a clean alternative energy
source, a potent organic fertiliser and economic benefits to the users (Ghimire, 2013).
The approach that is applied in the programmes is the multi-actor, market-based, sector
development approach, where a biodigester sector is created with multiple actors
participating at different stages of the value chain. Since 1992, SNV started to apply this
approach in Nepal. Through this approach, a total of 579,306 biogas plants have been
installed in Asia and Africa by the end of 2013, some in collaboration with Hivos (SNV,
2013). This study aims to evaluate the domestic biodigester approach of SNV and Hivos,
and identify key success factors and constraints behind its implementation in Africa and
Asia.
This leads to the following research question: Is the approach used by SNV and Hivos to
implement the use of biodigesters in Asian and African countries successful, and what are
the key success factors for this approach?
The number of countries participating in country programmes that implement
biodigesters has increased over the years. SNV and Hivos have consequently had various
programmes they have been involved with. This results in a unique data set on
programme and sector development, which can be used for this thesis. This thesis
makes use of this country-specific time-series data to establish a set of indicators that
provide a formal evaluation of the different biodigester programmes on several
dimensions (sector development, production, affordability, extension and gender). This
thesis contributes to the existing literature since there is not much known about the
5
performance of small-scale biodigester programmes in developing countries. This
research aims to fill the gap by providing information regarding this performance with
the use of detailed project-specific data. Furthermore, this thesis makes use of country-
specific time-series data to establish a set of indicators. It simultaneously assesses the
biodigester programmes at three different scales: i.e. by looking at supporting factors
and constraints at a (1) micro level (firm/consumer level), at a (2) meso level (country
energy regime, e.g. government level) as well as at a (3) macro level (related to global
landscape developments). Time and space data disaggregation from the individual
biodigester programmes of SNV and Hivos allow this paper to carry out a comparative
analysis and identify cases of success and failure, as well as their underlying causes.
Before the data is evaluated, background information about biogas technologies is
presented in chapter 2. In this chapter information on what biogas is and how it is
produced will be given. In addition, the technology of domestic biodigesters and the
numerous benefits of investing in digesters for households, society at large and even for
the environment are given. In chapter 3, three different biogas programmes that operate
in developing countries, which are not part of the SNV and Hivos programmes, are
discussed. These programmes are evaluated through the use of the transition
framework that is based on the Multilevel Perspective on System Innovation by Geels
(2002, 2005). The importance of this is to establish what levels, namely micro, meso and
macro, are relevant. In addition, not only the relevance is tested of these levels but also
whether they have an impact on the success of biogas programmes. In chapter 4, the
biodigester programmes applied by SNV and Hivos are discussed. Furthermore, detailed
information about their specific approach is given. Chapter 5 consists of the evaluation
of the different SNV and Hivos programmes where the approach is applied. Hereafter
follows the discussion (chapter 6), in which an extensive evaluation of the programmes
on three levels is described. Namely, on a micro level, meso level and macro level. This
chapter also considers the assumptions and uncertainties associated with the
programmes. The research question will be answered in chapter 7, in the conclusion.
2.0 Principles of Domestic biogas
This chapter provides an overview of what biogas is, how biogas technologies operate,
as well as the benefits associated with the use of biogas technologies.
6
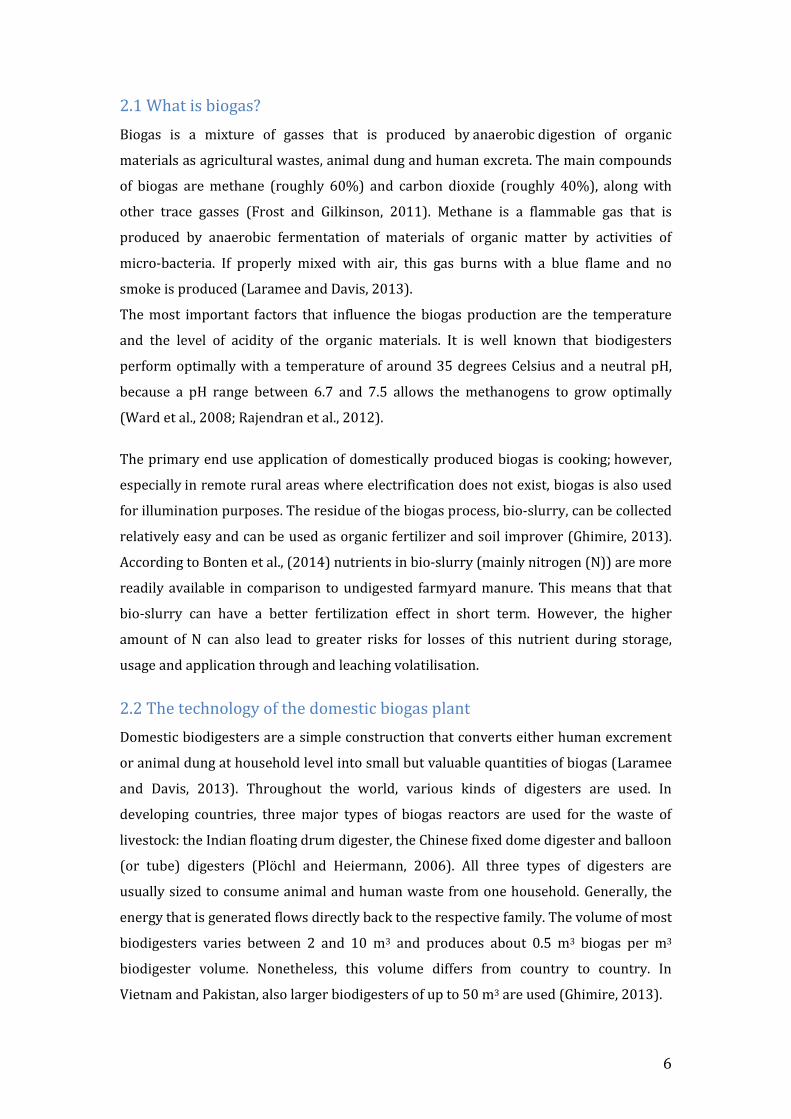
2.1 What is biogas?
Biogas is a mixture of gasses that is produced by.anaerobic.digestion of organic
materials as agricultural wastes, animal dung and human excreta. The main compounds
of biogas are methane (roughly 60%) and carbon dioxide (roughly 40%), along with
other trace gasses (Frost and Gilkinson, 2011). Methane is a flammable gas that is
produced by anaerobic fermentation of materials of organic matter by activities of
micro-bacteria. If properly mixed with air, this gas burns with a blue flame and no
smoke is produced (Laramee and Davis, 2013).
The most important factors that influence the biogas production are the temperature
and the level of acidity of the organic materials. It is well known that biodigesters
perform optimally with a temperature of around 35 degrees Celsius and a neutral pH,
because a pH range between 6.7 and 7.5 allows the methanogens to grow optimally
(Ward et al., 2008; Rajendran et al., 2012).
The primary end use application of domestically produced biogas is cooking;.however,
especially.in remote rural areas where electrification does not exist, biogas is also used
for illumination purposes. The residue of the biogas process, bio-slurry, can be collected
relatively easy and can be used as organic fertilizer and soil improver (Ghimire, 2013).
According to Bonten et al., (2014) nutrients in bio-slurry (mainly nitrogen (N)) are more
readily available in comparison to undigested farmyard manure. This means that that
bio-slurry can have a better fertilization effect in short term. However, the higher
amount of N can also lead to greater risks for losses of this nutrient during storage,
usage and application through and leaching volatilisation.
2.2 The technology of the domestic biogas plant
Domestic biodigesters are a simple construction that converts either human excrement
or animal dung at household level into small but valuable quantities of biogas (Laramee
and Davis, 2013). Throughout the world, various kinds of digesters are used. In
developing countries, three major types of biogas reactors are used for the waste of
livestock: the Indian floating drum digester, the Chinese fixed dome digester and balloon
(or tube) digesters (Plöchl and Heiermann, 2006). All three types of digesters are
usually sized to consume animal and human waste from one household. Generally, the
energy that is generated flows directly back to the respective family. The volume of most
biodigesters varies between 2 and 10 m3 and produces about 0.5 m3 biogas per m3
biodigester volume. Nonetheless, this volume differs from country to country. In
Vietnam and Pakistan, also larger biodigesters of up to 50 m3 are used (Ghimire, 2013).

7
The principle of how a biodigester works is roughly the same, regardless of the different
digester designs (figure 1). Generally the process is as follows. Feedstock enters the
biodigester through the inlet pipe. This can be done either directly or after a mixing pit.
Under anaerobic digestion the waste is fermented with the help of methanogenic
bacteria, which in turn produces biogas (Heegde, 2010). After a substrate retention
period of 20 to 100 days, the biogas is collected upon the slurry before it escapes
through the outlet pipe (Ghimire, 2013).
Figure 1. A typical design of a biogas plant (Ghimire, 2013).
Fixed dome digesters are the most popular design for rural households. The reason for
this is their low maintenance requirement, reliability and ease to construct. In addition,
it requires only locally and widely available materials for construction, such as stones,
bricks, clay and cement. This type of biodigester only has fixed parts, which are not
affected by erosion or rust, and is constructed underground to protect it from physical
damage. Resulting in a lifespan of more than 20 years. Moreover, the underground
construction helps to obtain a stable temperature regime to stimulate the
bacteriological processes. Additionally, the underground construction saves space.
Building the underground construction is labor intensive, which provides opportunities
for local employment (Heegde, 2010).
2.3 What are the benefits of domestic biodigesters?
Winrock International has carried out a holistic cost-benefit analysis of biogas
technology and considered the different benefits of a biodigester. The outcome of this
study shows a high economic return (Renwick et al., 2008). Nevertheless, there are
more benefits than economic ones. The most noteworthy benefits are listed below.
8
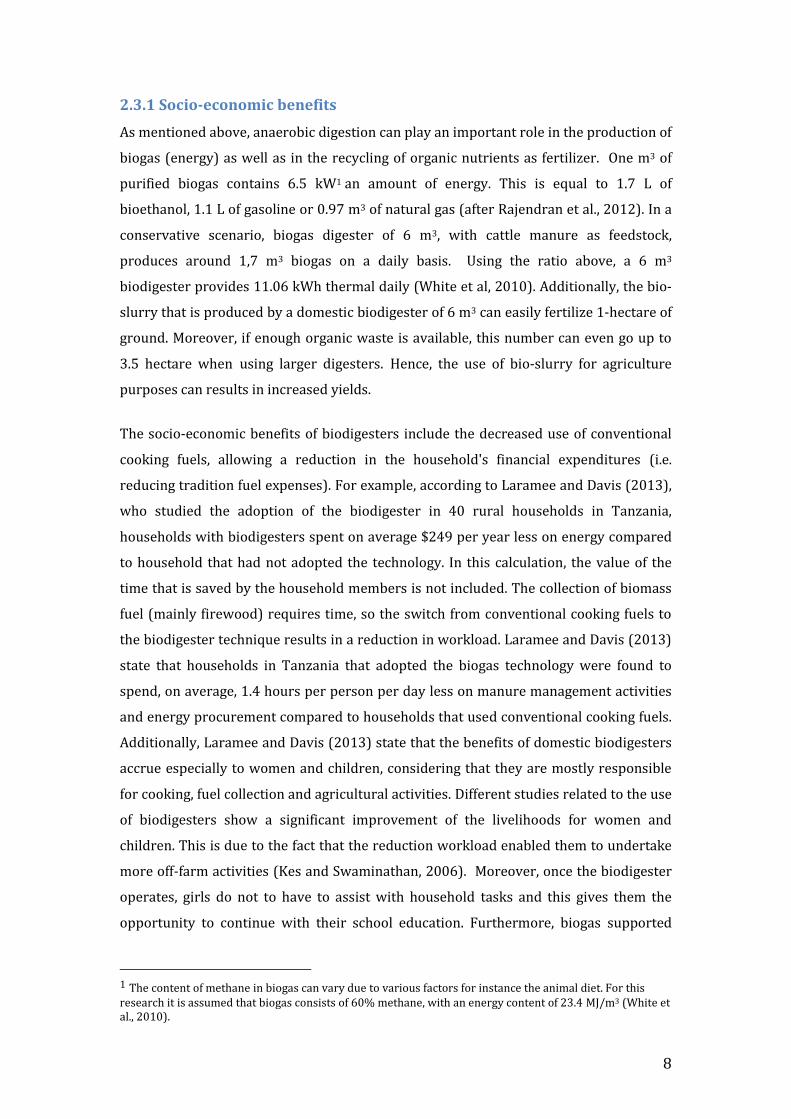
2.3.1 Socio-economic benefits
As mentioned above, anaerobic digestion can play an important role in the production of
biogas (energy) as well as in the recycling of organic nutrients as fertilizer. One m3 of
purified biogas contains 6.5 kW1 an amount of energy. This is equal to 1.7 L of
bioethanol, 1.1 L of gasoline or 0.97 m3 of natural gas (after Rajendran et al., 2012). In a
conservative scenario, biogas digester of 6 m3, with cattle manure as feedstock,
produces around 1,7 m3 biogas on a daily basis. Using the ratio above, a 6 m3
biodigester provides 11.06 kWh thermal daily (White et al, 2010). Additionally, the bio-
slurry that is produced by a domestic biodigester of 6 m3 can easily fertilize 1-hectare of
ground. Moreover, if enough organic waste is available, this number can even go up to
3.5 hectare when using larger digesters. Hence, the use of bio-slurry for agriculture
purposes can results in increased yields.
The socio-economic benefits of biodigesters include the decreased use of conventional
cooking fuels, allowing a reduction in the household's financial expenditures (i.e.
reducing tradition fuel expenses). For example, according to Laramee and Davis (2013),
who studied the adoption of the biodigester in 40 rural households in Tanzania,
households with biodigesters spent on average $249 per year less on energy compared
to household that had not adopted the technology. In this calculation, the value of the
time that is saved by the household members is not included. The collection of biomass
fuel (mainly firewood) requires time, so the switch from conventional cooking fuels to
the biodigester technique results in a reduction in workload. Laramee and Davis (2013)
state that households in Tanzania that adopted the biogas technology were found to
spend, on average, 1.4 hours per person per day less on manure management activities
and energy procurement compared to households that used conventional cooking fuels.
Additionally, Laramee and Davis (2013) state that the benefits of domestic biodigesters
accrue especially to women and children, considering that they are mostly responsible
for cooking, fuel collection and agricultural activities. Different studies related to the use
of biodigesters show a significant improvement of the livelihoods for women and
children. This is due to the fact that the reduction workload enabled them to undertake
more off-farm activities (Kes and Swaminathan, 2006). Moreover, once the biodigester
operates, girls do not to have to assist with household tasks and this gives them the
opportunity to continue with their school education. Furthermore, biogas supported
1 The content of methane in biogas can vary due to various factors for instance the animal diet. For this research it is assumed that biogas consists of 60% methane, with an energy content of 23.4 MJ/m3 (White et al., 2010).
9
illumination enables children to spend, for example, longer hours on reading (Ghimire,
2013).
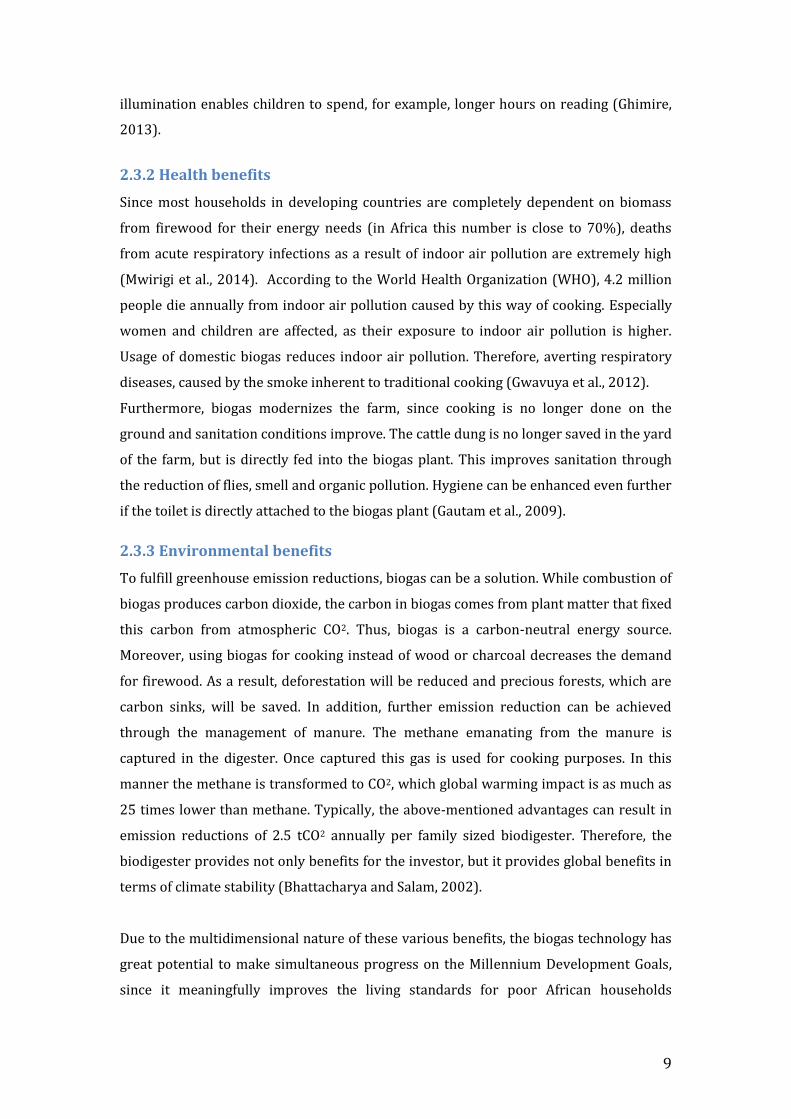
2.3.2 Health benefits
Since most households in developing countries are completely dependent on biomass
from firewood for their energy needs (in Africa this number is close to 70%), deaths
from acute respiratory infections as a result of indoor air pollution are extremely high
(Mwirigi et al., 2014). According to the World Health Organization (WHO), 4.2 million
people die annually from indoor air pollution caused by this way of cooking. Especially
women and children are affected, as their exposure to indoor air pollution is higher.
Usage of domestic biogas reduces indoor air pollution. Therefore, averting respiratory
diseases, caused by the smoke inherent to traditional cooking (Gwavuya et al., 2012).
Furthermore, biogas modernizes the farm, since cooking is no longer done on the
ground and sanitation conditions improve. The cattle dung is no longer saved in the yard
of the farm, but is directly fed into the biogas plant. This improves sanitation through
the reduction of flies, smell and organic pollution. Hygiene can be enhanced even further
if the toilet is directly attached to the biogas plant (Gautam et al., 2009).
2.3.3 Environmental benefits
To fulfill greenhouse emission reductions, biogas can be a solution. While combustion of
biogas produces carbon dioxide, the carbon in biogas.comes from plant matter that fixed
this carbon from atmospheric CO2. Thus, biogas is a carbon-neutral energy source.
Moreover, using biogas for cooking instead of wood or charcoal decreases the demand
for firewood. As a result, deforestation will be reduced and precious forests, which are
carbon sinks, will be saved. In addition, further emission reduction can be achieved
through the management of manure. The methane emanating from the manure is
captured in the digester. Once captured this gas is used for cooking purposes. In this
manner the methane is transformed to CO2, which global warming impact is as much as
25 times lower than methane. Typically, the above-mentioned advantages can result in
emission reductions of 2.5 tCO2 annually per family sized biodigester. Therefore, the
biodigester provides not only benefits for the investor, but it provides global benefits in
terms of climate stability (Bhattacharya and Salam, 2002).
Due to the multidimensional nature of these various benefits, the biogas technology has
great potential to make simultaneous progress on the Millennium Development Goals,
since it meaningfully improves the living standards for poor African households
10
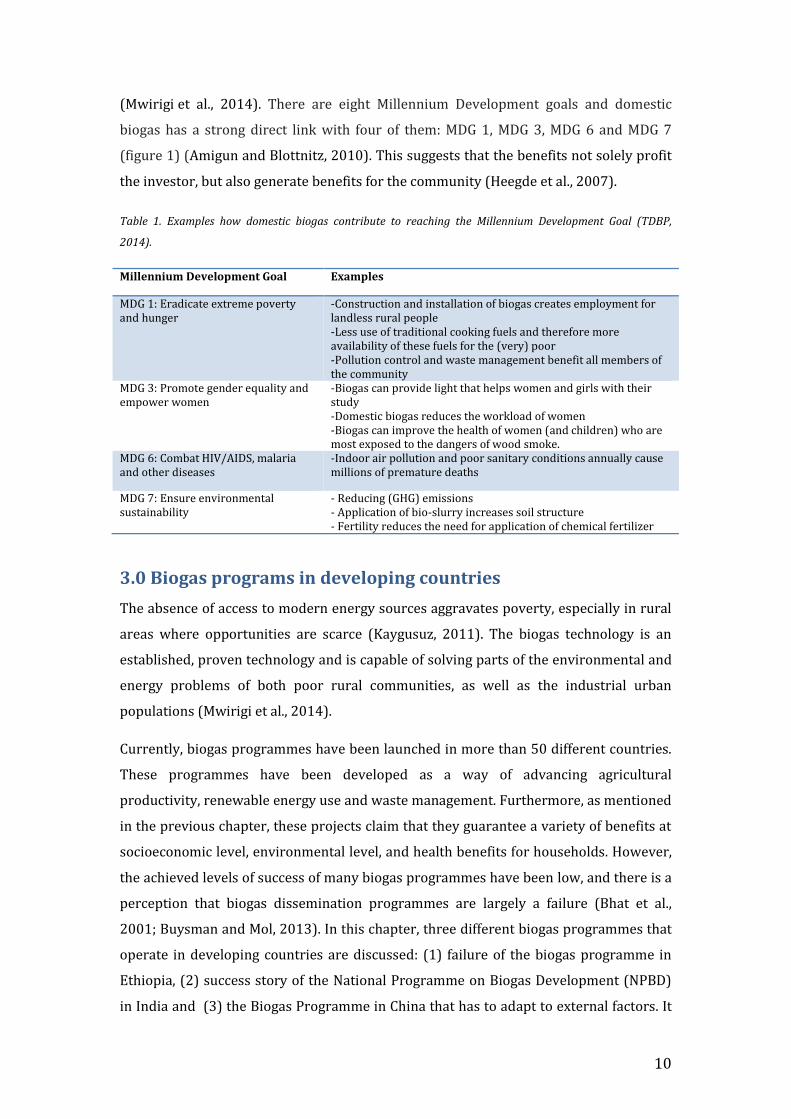
(Mwirigi et al., 2014). There are eight Millennium Development goals and domestic
biogas has a strong direct link with four of them: MDG 1, MDG 3, MDG 6 and MDG 7
(figure 1) (Amigun and Blottnitz, 2010). This suggests that the benefits not solely profit
the investor, but also generate benefits for the community (Heegde et al., 2007).
Table 1. Examples how domestic biogas contribute to reaching the Millennium Development Goal (TDBP,
2014).
Millennium Development Goal Examples
MDG 1: Eradicate extreme poverty and hunger
-Construction and installation of biogas creates employment for landless rural people -Less use of traditional cooking fuels and therefore more availability of these fuels for the (very) poor -Pollution control and waste management benefit all members of the community
MDG 3: Promote gender equality and empower women
-Biogas can provide light that helps women and girls with their study -Domestic biogas reduces the workload of women -Biogas can improve the health of women (and.children) who are most exposed to the dangers of wood smoke.
MDG 6: Combat.HIV/AIDS, malaria and other diseases
-Indoor air pollution and poor sanitary conditions annually cause millions of premature deaths
MDG 7: Ensure environmental sustainability
- Reducing (GHG) emissions - Application of bio-slurry increases soil structure - Fertility reduces the need for application of chemical fertilizer
3.0 Biogas programs in developing countries
The absence of access to modern energy sources aggravates poverty, especially in rural
areas where opportunities are scarce (Kaygusuz, 2011). The biogas technology is an
established, proven technology and is capable of solving parts of the environmental and
energy problems of both poor rural communities, as well as the industrial urban
populations (Mwirigi et al., 2014).
Currently, biogas programmes have been launched in more than 50 different countries.
These programmes have been developed as a way of advancing agricultural
productivity, renewable energy use and waste management. Furthermore, as mentioned
in the previous chapter, these projects claim that they guarantee a variety of benefits at
socioeconomic level, environmental level, and health benefits for households. However,
the achieved levels of success of many biogas programmes have been low, and there is a
perception that biogas dissemination programmes are largely a failure (Bhat et al.,
2001; Buysman and Mol, 2013). In this chapter, three different biogas programmes that
operate in developing countries are discussed: (1) failure of the biogas programme in
Ethiopia, (2) success story of the National Programme on Biogas Development (NPBD)
in India and (3) the Biogas Programme in China that has to adapt to external factors. It
11
needs to be noted that these three programmes are not part of the SNV and Hivos
programmes. The information regarding the three programmes is derived from
academic references. The evaluation relates primarily to how the programmes
performed as a business model. In this chapter, their success is evaluated and the main
barriers they faced are identified. These success and failure stories could provide
lessons to promote successful biogas programmes in other areas. By identifying sides,
this thesis tries to pinpoint the drivers behind the success and failure. Hereafter, a
comparison between their relevance in the context of the SNV and Hivos approach is
given. The most important programme selection criterion was age of the programme.
The programmes had to be implemented at least 20 years ago, as recently implemented
programmes cannot be assessed sufficiently in terms of failure or success. More
specifically, the first programme analyzed, Ethiopia, shows what can go wrong with
programmes and why. The second story, namely of India, shows the potential of
biodigester programmes and its successes. The third analysis shows the success of the
programme in China. However, this success might be threatened by changing factors. In
conclusion, different analyses are made to establish what drivers of success and failure
are.
3.1 Failure story of the Ethiopia
In 1979, Ambo Agricultural College constructed the first batch type digester in Ethiopia.
The Ethiopian Rural Energy Development and Promotion Centre introduced a new
renewable energy programme to reduce the negative effects of the energy crisis of the
1970s. The main focus of the programme was the introduction of anaerobic technologies
and demonstration pilots. The biodigester technology has not spread widely in Ethiopia;
the EEA reported in 1991 that only 103 biogas units had been installed. Over the last
two and a half decades around one thousand biogas plants were built. The government
built most of the biogas units mainly for demonstration purposes. The government did
not consider follow-up, variations in design and the existence of standardized biogas
technology. Consequently, the usage of biogas technology did not scale up as estimated
(Eshete et al., 2006). Nowadays, around 40% of the biogas units are not operational as a
result of weak and ineffective management, poor follow-up, technical complications, less
interest, reduction in animal holdings and evacuation of ownership. For the afore-
mentioned reasons, the reputation of domestic biodigesters in Ethiopia is not good
(NBP, 2008).
12
3.2 Success story of the National Programme on Biogas Development
(NPBD) in India
The Ministry of Non-Conventional Energy Sources in India launched the National
Programme on Biogas Development (NPBD) in 1982, with the objective to provide
quality fuel in the form of biogas in a sustainable way and to promote the use of bio-
slurry. In this period, it was seen that the majority of rural households could meet their
energy requirements for cooking through the use of biogas technology (Bhattacharya
and Jana, 2009). This required dissemination of biogas plants (c. 2 to 4 m3 gas per day)
by using dung as the major feedstock. In south India, in the Sirsi block of Uttara Kannada
(UK) district of the Karnataka state, the success rate of the dissemination of the biogas
technology was extremely high. Specifically, 100% of the digesters that were built
functioned satisfactorily. Furthermore, 85% of the households that use the biogas
technology met their energy needs for cooking with this biogas. This very high level of
success, despite being a high-rainfall region, can mainly be explained by the following
factors (Bhat et al., 2001):
High awareness among rural household for the need for high-quality fuel,
especially among women.
The households used cattle dung efficiently, and this led to gas sufficiency, even
when there was less than 5 kg per capita of dung available per day.
In the agricultural activities, the stake for quality manure was high.
The dissemination network involved multiple agencies with sufficient interest in
the project like promoters, private enterprises and users’ interest groups.
Several entrepreneurs were dependent on the construction of biogas plants for
their living. As a result, there was competition among builders and this
encouraged high quality construction of the biogas plants.
The main message for national programmes on biogas development that can be derived
from this example is to: launch a promotion programme, train a large number of
entrepreneurs, procure subsidies, guarantee performance and free
servicing/maintenance. In conclusion, the presence of multiple agencies and
stakeholders in the network is of great importance (Bhat et al., 2001).
3.3 China’s Biogas Programme has to adapt
China’s Biogas Programme plays the leading role in the worldwide dissemination of
household-based biogas technology. A decade of heavy investments by the government
13
of the People’s Republic of China resulted in around 41.68 million households using the
biogas technology by the end of 2011. When including centralized biogas supply, around
160 million people in rural China were benefitting from biogas by the end of 2011
(Cheng et al., 2013). Additionally, according to data from the Ministry of Agriculture,
biogas units in China produce 410 million tonnes of organic fertilizer annually and
moderate CO2 emissions by 61 million tonnes.
Nonetheless, China is changing, and different challenges with respect to the programme
have surfaced. Problems include migration from villages to cities. The urbanization that
occurred rapid has increased the cost of rural labor since the labor supply shrinks, and
this increased cost. Resulting in higher cost for biogas constructions. Furthermore, the
amount of manure is decreasing, since traditional animal husbandry is declining in rural
areas. This new socioeconomic landscape in China could put pressure on biogas as a
sustainable energy source for many rural households. Therefore, it is necessary for
China to review its biogas programme and biogas sector. In order to secure the success
of the biodigester programmes four important steps have to be taken. First, an objective
analysis of the biogas sector has to be made. Second, service and maintenance of
biodigesters has to be improved. Third, subsidies have to become more cost-effective.
Lastly, alternative forms of subsidy have to be explored. Once the above steps are taken
into consideration and actions to improve them are made the success of the programme
can be assured (Zuzhang and Wilson, 2014).
3.4 What can be learned from the programmes?
The reason that biogas programmes sometimes fail and sometimes succeed can be
explained by the transition framework, which is based on the Multilevel Perspective on
System Innovation by Geels (2002, 2005). This is a three-level model that includes a
micro-, meso- and macro-level (figure 2).
14
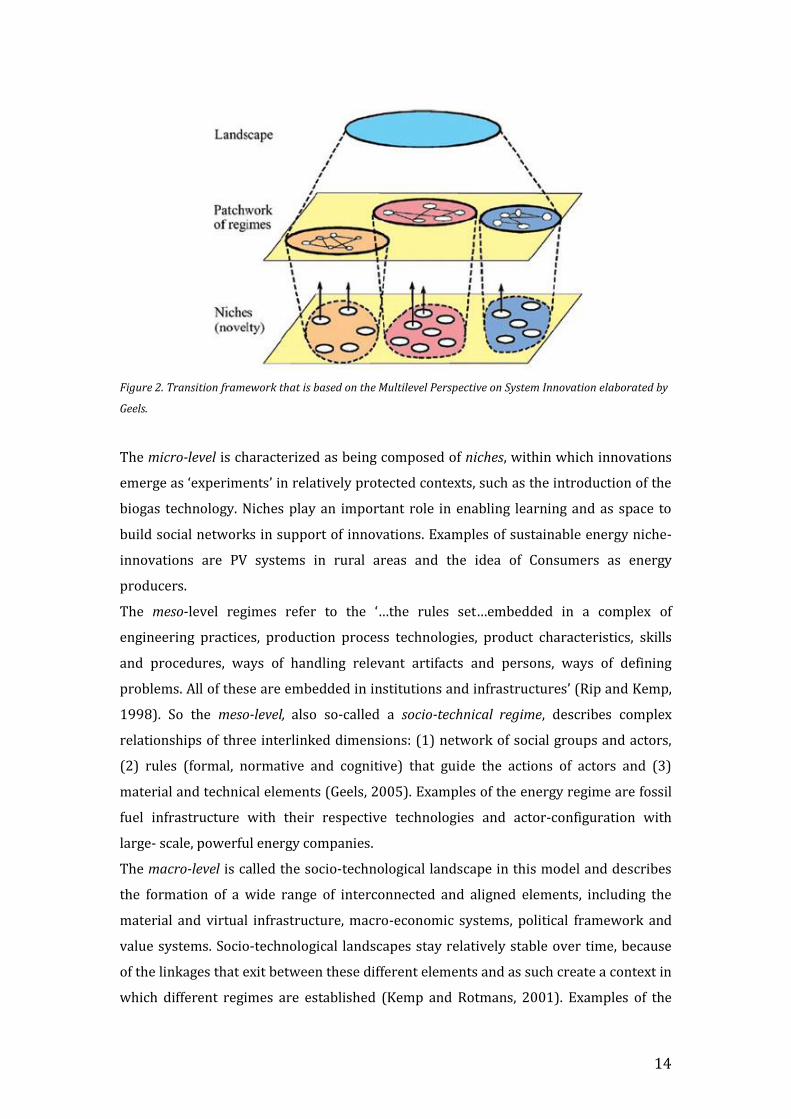
Figure 2. Transition framework that is based on the Multilevel Perspective on System Innovation elaborated by
Geels.
The micro-level is characterized as being composed of niches, within which innovations
emerge as ‘experiments’ in relatively protected contexts, such as the introduction of the
biogas technology. Niches play an important role in enabling learning and as space to
build social networks in support of innovations. Examples of sustainable energy niche-
innovations are PV systems in rural areas and the idea of Consumers as energy
producers.
The meso-level regimes refer to the ‘…the rules set…embedded in a complex of
engineering practices, production process technologies, product characteristics, skills
and procedures, ways of handling relevant artifacts and persons, ways of defining
problems. All of these are embedded in institutions and infrastructures’ (Rip and Kemp,
1998). So the meso-level, also so-called a socio-technical regime, describes complex
relationships of three interlinked dimensions: (1) network of social groups and actors,
(2) rules (formal, normative and cognitive) that guide the actions of actors and (3)
material and technical elements (Geels, 2005). Examples of the energy regime are fossil
fuel infrastructure with their respective technologies and actor-configuration with
large- scale, powerful energy companies.
The macro-level is called the socio-technological landscape in this model and describes
the formation of a wide range of interconnected and aligned elements, including the
material and virtual infrastructure, macro-economic systems, political framework and
value systems. Socio-technological landscapes stay relatively stable over time, because
of the linkages that exit between these different elements and as such create a context in
which different regimes are established (Kemp and Rotmans, 2001). Examples of the

15
energy landscape are: climate change discourse, population growth, depletion of fossil
fuels, increasing oil prices and the financial crisis.
This three-level model stresses the interaction between dynamics at these three
different levels. Although the landscapes are relatively stable they can and do change
over time, for instance under the influence of exogenous factors. Such exogenous factors
are, for example, an aging population, warfare, or change in oil prices. These changes in
the socio-technological landscape put pressure on one or more regimes. Consequently,
they destabilize a regime by the disturbance of its coherence. When regimes are instable
they are open for change and this creates opportunities for alternative solutions to be
obtained by system actors. Innovations that occur in technological niches may break
through into an incumbent regime. As a result, new technological practices and
platforms can be developed. Alternatively, innovations that arise in niche markets
seldom lead to changes in the incumbent regime since these adjustments will be
relatively local and have no implications for the structure of the system (Geels, 2005).
When applying this transition framework to the biogas sector in developing countries, it
can be observed that all three levels are relevant towards the understanding of the
effectiveness and efficiency of biogas programmes. Doing so helps to find the answer to
why in some cases the technology did lead to widespread dissemination and in other
cases it did not. For example, the barriers can be related to technological areas: the
technology may be costly, there may be resistance to use it and so on. Other barriers
could originate from both the incumbent regimes (for example, unfavorable legislation
or opposition to change due to vested interest), and landscape changes (e.g. population
growth and urbanization). Since barriers are caused and removed by multiple actors, it
should also be possible to identify those actors primarily responsible for each of the
barriers and opportunities.
In the case of Ethiopia, the biogas technology is seen as a niche that form alternative
ways of energy provision for traditional biomass-based energy systems. The biogas
technology was introduced free of charge through a demonstration project or a pilot.
These projects were generally implemented by the government, which believed that a
demonstration on ‘how to construct a biogas plant’ would ensure the automatic
adoption of the biogas technology. However, this approach seems not to be successful
since it did not lead to market development and dissemination of the technology on a
large scale (Mwirigi et al., 2014). In short, the alternative niches did not break through
to the regime. For widespread dissemination, one needs to arrive at a critical production
rate in the market. A pilot – as the word says – is an experiment, often heavily controlled
16
and subsidized, in a slight segment of the market2. Hence, a successful biogas
dissemination programme in the context of Ethiopia needs participation and
commitment of a number of different stakeholders, whose interests and perspectives
are aligned. Therefore, a clear design and institutional arrangement of the programme is
required with well-defined responsibilities for all stakeholders (Eshete et al., 2006).
This was the case in India, where multiple agencies were present in the network, and
consequently the programme was successful. For the case in China, the social technical
landscape is changing (e.g. rapid urbanization) and this puts pressures on the regime
were biogas is the sustainable energy source (Zuzhang and Wilson, 2014).
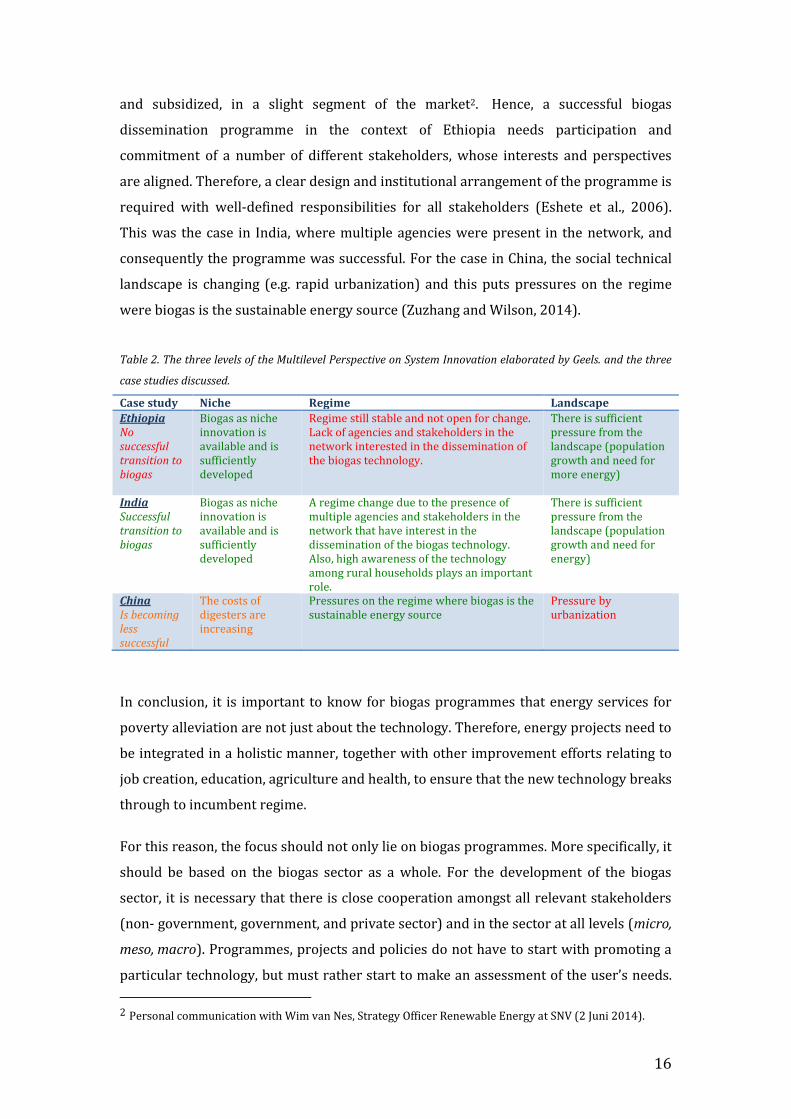
Table 2. The three levels of the Multilevel Perspective on System Innovation elaborated by Geels. and the three
case studies discussed.
Case study Niche Regime Landscape
Ethiopia No successful transition to biogas
Biogas as niche innovation is available and is sufficiently developed
Regime still stable and not open for change. Lack of agencies and stakeholders in the network interested in the dissemination of the biogas technology.
There is sufficient pressure from the landscape (population growth and need for more energy)
India Successful transition to biogas
Biogas as niche innovation is available and is sufficiently developed
A regime change due to the presence of multiple agencies and stakeholders in the network that have interest in the dissemination of the biogas technology. Also, high awareness of the technology among rural households plays an important role.
There is sufficient pressure from the landscape (population growth and need for energy)
China Is becoming less successful
The costs of digesters are increasing
Pressures on the regime where biogas is the sustainable energy source
Pressure by urbanization
In conclusion, it is important to know for biogas programmes that energy services for
poverty alleviation are not just about the technology. Therefore, energy projects need to
be integrated in a holistic manner, together with other improvement efforts relating to
job creation, education, agriculture and health, to ensure that the new technology breaks
through to incumbent regime.
For this reason, the focus should not only lie on biogas programmes. More specifically, it
should be based on the biogas sector as a whole. For the development of the biogas
sector, it is necessary that there is close cooperation amongst all relevant stakeholders
(non- government, government, and private sector) and in the sector at all levels (micro,
meso, macro). Programmes, projects and policies do not have to start with promoting a
particular technology, but must rather start to make an assessment of the user’s needs.
2 Personal communication with Wim van Nes, Strategy Officer Renewable Energy at SNV (2 Juni 2014).
17
Different rural communities also have different needs. Finding suitable technologies and
successful implementation strategies varies from case to case (Kaygusuz, 2011). In
order to ensure that biogas programmes succeed, they need to move away from a
product-based project approach that is implemented by just a single actor. Preferable is
the market-oriented programme approach, were different actors participate on the
basis of institutional arrangements (Mwirigi et al., 2014).
4.0 Description of SNV and Hivos programme/approach
As mentioned in chapter 3, several small-scale biogas projects report temporary
successes. However, many large-scale projects have failed and in the long run chances of
failure increase as well. The participation of different actors is an important success
factor, which is shown in the India case study. Furthermore, according to Buysman and
Mol (2013), the challenge to develop a successful biogas programme is to find a right
mode of implementation and design of biogas installations. It is important that they
ensure ownership, participation and responsibility of the end users of these biodigesters
and offer sustainable long-term financing mechanisms. Presently, SNV and Hivos have
long-term experience in market-based dissemination of domestic biodigesters in both
Asian and African countries. The support of SNV has resulted in the installation of
almost 580,000 biodigesters by the end of 2013, of which over 41,000 were built in
Africa, partially in collaboration with Hivos (data SVN, 2014). This chapter first provides
background information about the two organizations. Thereafter, the different biogas
programmes of SNV and Hivos are presented, followed by a clear explanation of the
approach that SNV and Hivos apply.
4.1 SNV and Hivos
4.1.1 Netherlands Development Organisation - SNV
SNV is an international non-profit development organization that operates in 38
countries and was founded in the Netherlands in 1965. A team of both local and
international advisors collaborates with local partners to equip businesses,
communities and organizations in the developing world with the knowledge,
connections and tools needed to increase their income to subsequently break the cycle
of poverty. By sharing specialist knowledge in renewable energy, agriculture, sanitation,
hygiene and water, this organization helps to solve some of the main problems that the
world is facing today. SNV has more than 25 years of experience in the management,
design and support of dissemination programmes for domestic biogas in different
18
countries. Specifically, SNV has been active as an NGO in Asia since 1989, in Africa since
2006 and in Latin America since 2012 (ABPP, 2013).
4.1.2 Humanist Institute for Co-operation with Developing Countries -
Hivos
Hivos was founded in 1968 and is a Dutch development NGO. Hivos operates in 32
countries across East and South Africa, South and South East Asia, and Latin America. It
has six regional offices and employs around 300 employees. Their key work areas are:
support smallholder organizations’ access to markets, sustainable agriculture, business
development and finance, carbon finance and sustainable energy. The Dutch NGO pays
attention to agricultural biodiversity, soil fertility, green knowledge and climate change
mitigation to improve the living conditions for farmers and gender inclusiveness (ABPP,
2013).
4.2 Biogas programmes implemented by SNV and Hivos
SNV first started the support of biogas activities in Nepal. Here, sector development has
started in a systemic manner in 1992 under The Biogas Support Programme (BSP).
Under this biogas programme, more than 290,000 biogas units had been installed
throughout Nepal by the end of 2013. This success in Nepal encouraged SNV to start the
support of another national biogas programme, namely in Vietnam in 2003. Afterwards,
comparable programmes were launched in other Asian countries: Cambodia,
Bangladesh, Laos, Pakistan and Indonesia (Surendra et al., 2014).
In Africa, the first actions to prepare national biogas programmes were started in 2005
by SNV, the Netherlands Directorate General for International Cooperation (DGIS) and
several African partners. In the run up to the programme launch, a preparatory
conference took place in Amsterdam in 2006, followed by an African domestic biogas
conference, which took place in Nairobi in 2007. In 2008 the programme preparations
were completed. This resulted in the Africa Biogas Partnership Programme (ABPP)
being officially launched in 2009. SNV and Hivos have together implemented ABPP,
which is co-funded by DGIS. Hivos is responsible as fund manager for the programme
and SNV provides technical assistance (table 3). The programme operates in six African
countries: Ethiopia, Kenya, Burkina Faso, Uganda, Tanzania and Senegal3. The general
3 In 2011, the programme in Senegal was terminated due to its poor results caused by a number of factors including the performance of the selected partner.
19
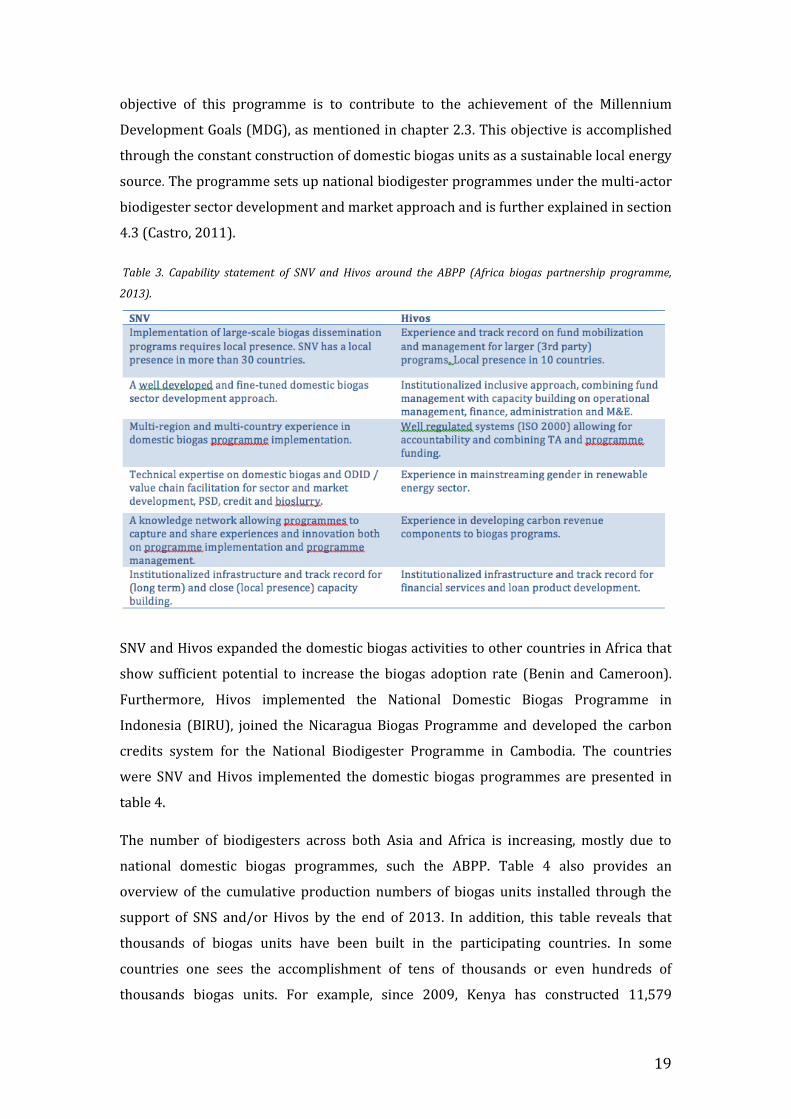
objective of this programme is to contribute to the achievement of the Millennium
Development Goals (MDG), as mentioned in chapter 2.3. This objective is accomplished
through the constant construction of domestic biogas units as a sustainable local energy
source. The programme sets up national biodigester programmes under the multi-actor
biodigester sector development and market approach and is further explained in section
4.3 (Castro, 2011).
Table 3. Capability statement of SNV and Hivos around the ABPP (Africa biogas partnership programme,
2013).
SNV and Hivos expanded the domestic biogas activities to other countries in Africa that
show sufficient potential to increase the biogas adoption rate (Benin and Cameroon).
Furthermore, Hivos implemented the National Domestic Biogas Programme in
Indonesia (BIRU), joined the Nicaragua Biogas Programme and developed the carbon
credits system for the National Biodigester Programme in Cambodia. The countries
were SNV and Hivos implemented the domestic biogas programmes are presented in
table 4.
The number of biodigesters across both Asia and Africa is increasing, mostly due to
national domestic biogas programmes, such the ABPP. Table 4 also provides an
overview of the cumulative production numbers of biogas units installed through the
support of SNS and/or Hivos by the end of 2013. In addition, this table reveals that
thousands of biogas units have been built in the participating countries. In some
countries one sees the accomplishment of tens of thousands or even hundreds of
thousands biogas units. For example, since 2009, Kenya has constructed 11,579
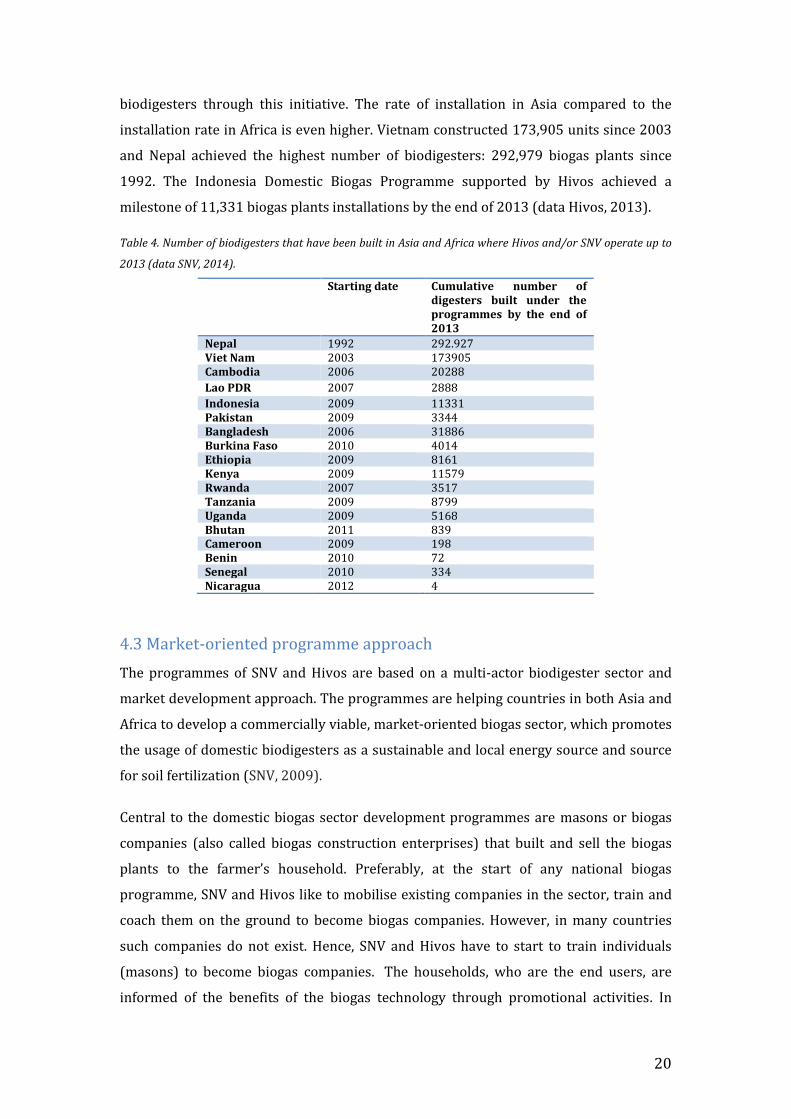
20
biodigesters through this initiative. The rate of installation in Asia compared to the
installation rate in Africa is even higher. Vietnam constructed 173,905 units since 2003
and Nepal achieved the highest number of biodigesters: 292,979 biogas plants since
1992. The Indonesia Domestic Biogas Programme supported by Hivos achieved a
milestone of 11,331 biogas plants installations by the end of 2013 (data Hivos, 2013).
Table 4. Number of biodigesters that have been built in Asia and Africa where Hivos and/or SNV operate up to
2013 (data SNV, 2014).
Starting date Cumulative number of digesters built under the programmes by the end of 2013
Nepal 1992 292.927 Viet Nam 2003 173905 Cambodia 2006 20288
Lao PDR 2007 2888
Indonesia 2009 11331 Pakistan 2009 3344 Bangladesh 2006 31886 Burkina Faso 2010 4014 Ethiopia 2009 8161 Kenya 2009 11579 Rwanda 2007 3517 Tanzania 2009 8799 Uganda 2009 5168 Bhutan 2011 839 Cameroon 2009 198 Benin 2010 72 Senegal 2010 334 Nicaragua 2012 4
4.3 Market-oriented programme approach
The programmes of SNV and Hivos are based on a multi-actor biodigester sector and
market development approach. The programmes are helping countries in both Asia and
Africa to develop a commercially viable, market-oriented biogas sector, which promotes
the usage of domestic biodigesters as a sustainable and local energy source and source
for soil fertilization (SNV, 2009).
Central to the domestic biogas sector development programmes are masons or biogas
companies (also called biogas construction enterprises) that built and sell the biogas
plants to the farmer’s household. Preferably, at the start of any national biogas
programme, SNV and Hivos like to mobilise existing companies in the sector, train and
coach them on the ground to become biogas companies. However, in many countries
such companies do not exist. Hence, SNV and Hivos have to start to train individuals
(masons) to become biogas companies. The households, who are the end users, are
informed of the benefits of the biogas technology through promotional activities. In
21
addition, they receive training about the operation and maintenance of the digester.
Likewise, information regarding the use of slurry in agriculture is provided. Bio-slurry
application trainings are provided by third party agricultural organizations.
Furthermore, quality controls over the construction and installation are carrying out.
Besides, quality assurance and warrantee systems are put in place. Meaning that one or
two year warrantee against any construction errors or other malfunctions is given.
Carbon credits are developed and provide finance that is plowed back into the
programmes. Households can make use of micro credits to finance the relatively high
investment costs required for the construction and installation of a biogas unit. Because
it is complicated to finance large-scale domestic biogas programmes it is required that
national governments contribute to these costs (Ghimire, 2013). Development and
research activities are done to create more efficient biogas digesters to achieve further
improvements for the biodigester technologies, for example by the use other materials
in the construction of biogas digester like Fiber-reinforced plastic and modified plastic
(Cheng et al., 2014). The biodigester programmes rely on digesters that: have relatively
low construction cost (achieved through the use of locally available materials), utilize
little space because they are constructed underground, have a high lifespan (around 20
years) and are constructed on-site. Depending on different factors like the needs of the
families, availability of space, cost and the number of animals on the farm, different
plant size can be purchased. If everything is organized well, it takes between 10 and 20
days to complete the construction of a biodigester.
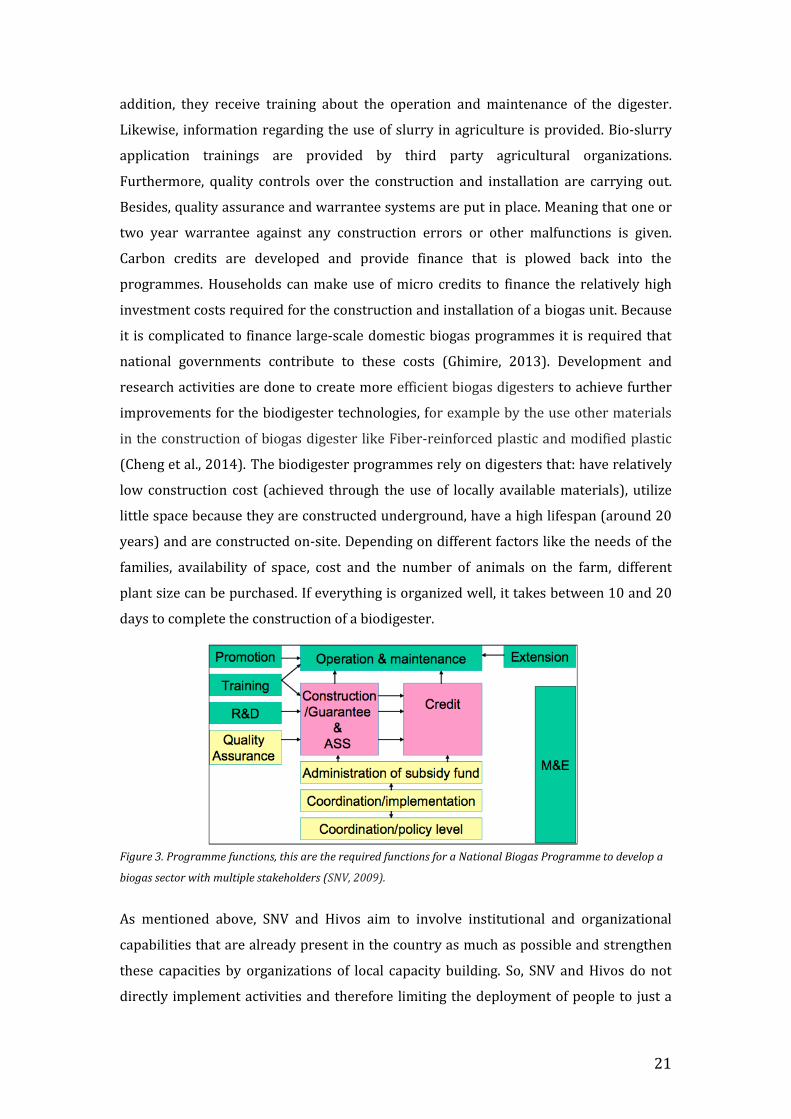
Figure 3. Programme functions, this are the required functions for a National Biogas Programme to develop a
biogas sector with multiple stakeholders (SNV, 2009).
As mentioned above, SNV and Hivos aim to involve institutional and organizational
capabilities that are already present in the country as much as possible and strengthen
these capacities by organizations of local capacity building. So, SNV and Hivos do not
directly implement activities and therefore limiting the deployment of people to just a
22
small number of advisers per programme (Ghimire, 2013). In every country, an existing
organization is selected to coordinate the programme among all different stakeholders
in the country. SNV and Hivos provide technical management support to these
coordinating organizations. In addition, SNV and Hivis are involved in planning,
monitoring and evaluation of the programmes (figure 3). When the programme evolves,
these functions of the programme team may be decentralized to a certain extent to
implementing partners. The ultimate goal for the market-based sector development
approach would be that biodigester constructors or contractors sell biodigesters to
households and that they provide the necessary services to these households to sustain
further market development (SNV, 2009).
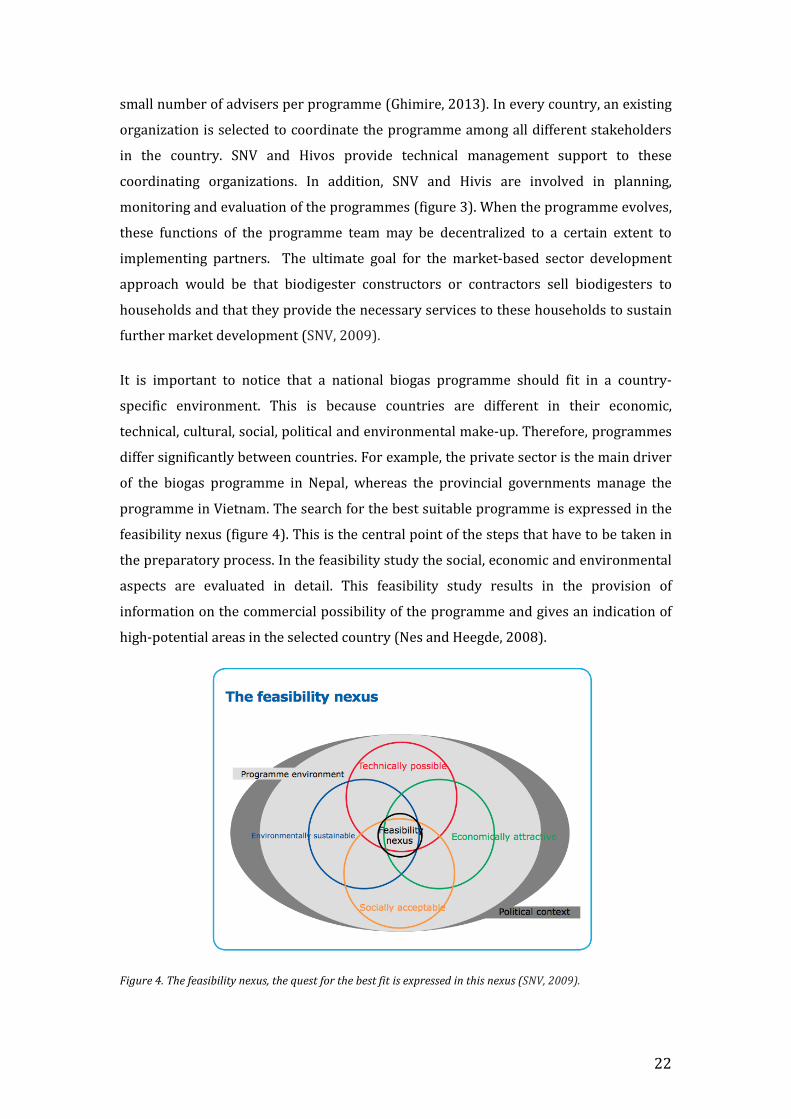
It is important to notice that a national biogas programme should fit in a country-
specific environment. This is because countries are different in their economic,
technical, cultural, social, political and environmental make-up. Therefore, programmes
differ significantly between countries. For example, the private sector is the main driver
of the biogas programme in Nepal, whereas the provincial governments manage the
programme in Vietnam. The search for the best suitable programme is expressed in the
feasibility nexus (figure 4). This is the central point of the steps that have to be taken in
the preparatory process. In the feasibility study the social, economic and environmental
aspects are evaluated in detail. This feasibility study results in the provision of
information on the commercial possibility of the programme and gives an indication of
high-potential areas in the selected country (Nes and Heegde, 2008).
Figure 4. The feasibility nexus, the quest for the best fit is expressed in this nexus (SNV, 2009).
23
5.0 Evaluation of programs
In table 4, the number of biodigesters that have been installed so far by the programmes
is presented. The number of biodigesters has increased in the selected African and Asian
countries, which shows that there is an increased interest in them. However, the
success of a biogas programme cannot only be measured in terms of the numbers of
biogas plants that have been built. Additionally, important indicators to measure success
include whether and to what extent biogas technology contributes to a sustainable
increase of quality of life of people (Ghimire, 2013). In this chapter, five indicators that
track the success of the biogas programmes are discussed; sector development,
production, affordability, extension and gender (figure 5). The indicators used to
evaluate success are similar to those in the ABPP dashboard that was developed in
2010. The aim of the ABPP dashboard was to present a tool for the management of
programmes to see if there was “development of a commercially viable biogas sector “
along a selected set of key indicators. (Dashboard Report, 2012). Furthermore, at the
end of this chapter an explanation of the different outcomes of the Asian and African
biogas programmes is given.
5.1 Data evaluation
Participation in country programmes has increased over time, resulting in a unique data
set on programme and sector development, which this chapter aims to document. The
data that is used for this chapter is made available by SNV and Hivos4
For the data from the African countries and Indonesia, the local programme officers
were asked to fill out a quarterly questionnaire (Appendix 1) and results were, together
with basic monthly data, processed in an excel spreadsheet
(http://sites.google.com/site/biogas4all/). The data of 2012 and 2013 was produced
with the same questionnaires and therefore entirely comparable. In contrast, the data of
2011 was generated with different surveys (in 2012 and 2013 the indicators were
reduced in measurement frequency and more simplified questionnaire were asked
quarterly instead of monthly). Therefore, most graphs regarding the African countries
are on a quarterly basis and from the following period: beginning of 2012 till the end of
2013. The data from the Asian countries is not as comprehensive as the data from Africa.
Furthermore, it is important to notice that the data used for this research is data till the
end of 2013 (Dashboard Report, 2012).
4 Data have been kindly provided by Mr Harrie Openoorth (HIVOS) and Wim van Nes (SNV).
24
Figure 5. The five indicators that track the biogas program that are used for this study are; sector development,
production, affordability, extension and gender.
5.1.1 Sector development
One central objective of all biogas programmes of the SNV and Hivos is the development
of a market-oriented biogas sector, i.e. a sector that can be sustained by capable
stakeholders and be financed without Official Development Assistance (ODA). Sector
development in this context means that all the relevant stakeholders (government, non-
government and the private sector) are involved in the biogas programme. All the
different sector levels will be involved, from micro, to meso and macro. The building
capacity of the different stakeholders should be in-line with the demands of a successful
biogas programme. In the selected Asian and African countries, the biogas sector was
either not present or weakly developed at the beginning of the programme
implementation. However, this sector is currently developing. Sector development is a
complex and difficult task. In order to create a sustainable biogas sector, a long-term
effort is needed, anywhere between seven and twenty years (SNV, 2009). SNV and Hivos
play an active role in mobilizing the necessary resources for subsequent phases of
programmes. An example in which the biogas sector is developed properly is in Nepal.
The key-reason for this success is the joint effort and collaboration of different
stakeholders (Gautam et al., 2009).
In order to determine whether a sector has developed sufficiently over the years, one
can look at different indicators, for instance:
25
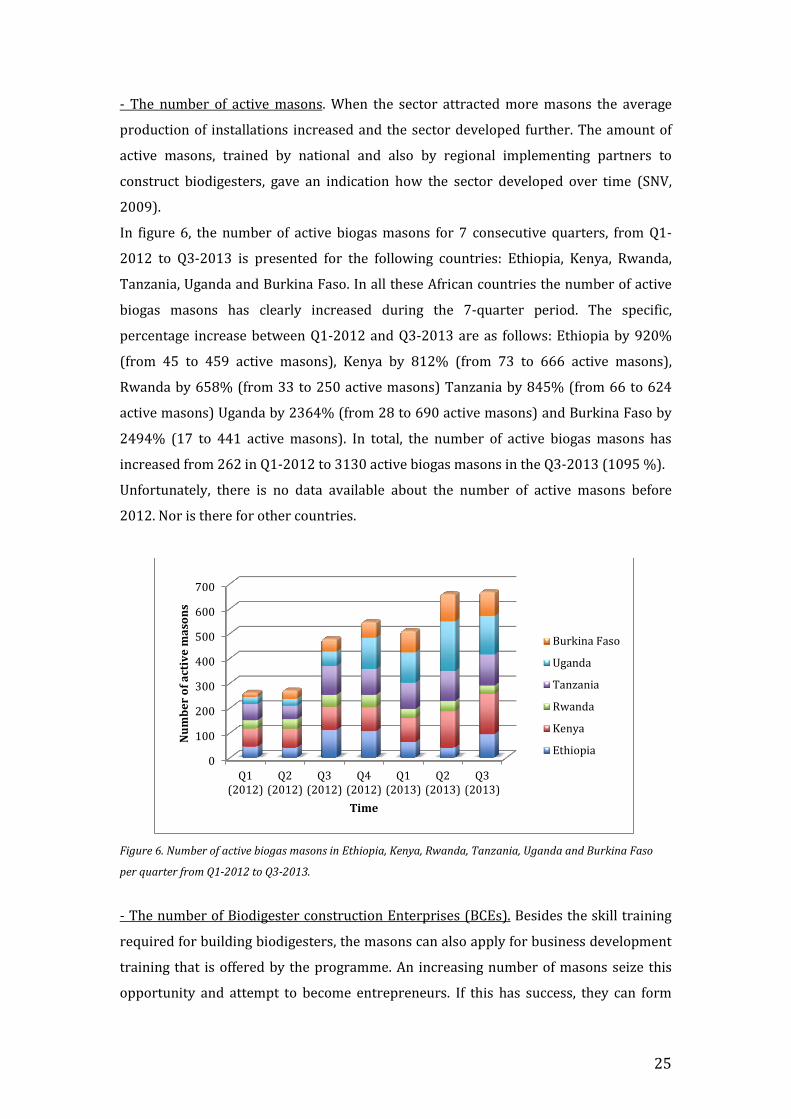
- The number of active masons. When the sector attracted more masons the average
production of installations increased and the sector developed further. The amount of
active masons, trained by national and also by regional implementing partners to
construct biodigesters, gave an indication how the sector developed over time (SNV,
2009).
In figure 6, the number of active biogas masons for 7 consecutive quarters, from Q1-
2012 to Q3-2013 is presented for the following countries: Ethiopia, Kenya, Rwanda,
Tanzania, Uganda and Burkina Faso. In all these African countries the number of active
biogas masons has clearly increased during the 7-quarter period. The specific,
percentage increase between Q1-2012 and Q3-2013 are as follows: Ethiopia by 920%
(from 45 to 459 active masons), Kenya by 812% (from 73 to 666 active masons),
Rwanda by 658% (from 33 to 250 active masons) Tanzania by 845% (from 66 to 624
active masons) Uganda by 2364% (from 28 to 690 active masons) and Burkina Faso by
2494% (17 to 441 active masons). In total, the number of active biogas masons has
increased from 262 in Q1-2012 to 3130 active biogas masons in the Q3-2013 (1095 %).
Unfortunately, there is no data available about the number of active masons before
2012. Nor is there for other countries.
Figure 6. Number of active biogas masons in Ethiopia, Kenya, Rwanda, Tanzania, Uganda and Burkina Faso
per quarter from Q1-2012 to Q3-2013.
- The number of Biodigester construction Enterprises (BCEs). Besides the skill training
required for building biodigesters, the masons can also apply for business development
training that is offered by the programme. An increasing number of masons seize this
opportunity and attempt to become entrepreneurs. If this has success, they can form
0
100
200
300
400
500
600
700
Q1(2012)
Q2(2012)
Q3(2012)
Q4(2012)
Q1(2013)
Q2(2013)
Q3(2013)
Nu
mb
er
of
act
ive
ma
son
s
Time
Burkina Faso
Uganda
Tanzania
Rwanda
Kenya
Ethiopia

26
Biodigester Construction Enterprises (BCEs) or masons are asked to join cooperatives.
In this way, the private sector is gradually becoming more important in the biogas
sector in the selected countries where the SNV and Hivos approach is applied. For
example, figure 7 shows that in 2012 the numbers of active biogas companies
continuously increased in several African countries. In total, the number of BCEs has
increased from 51 in Q1-2012 to 688 in the Q3-2013 (1249 %). Mainly in Tanzania,
which shows an increase from 6 in Q1-2012 to 213 BCEs in Q3-2013 (3450%), and in
Kenya where an increase from 23 BCE’s in Q1-2012 to 169 BCEs in Q3-2013 (635%) is
observed. Smaller increases are seen in Ethiopia, from 4 BCE’s to 45 BCEs (however in
percentage increase with 1025%) and Burkina Faso from 2 BCE’s to 15 BCEs (650%)
over the same period.
Figure 7. Number of active BCEs in Ethiopia, Kenya, Rwanda, Tanzania, Uganda and Burkina Faso per quarter:
from Q1-2013 to Q3-2013.
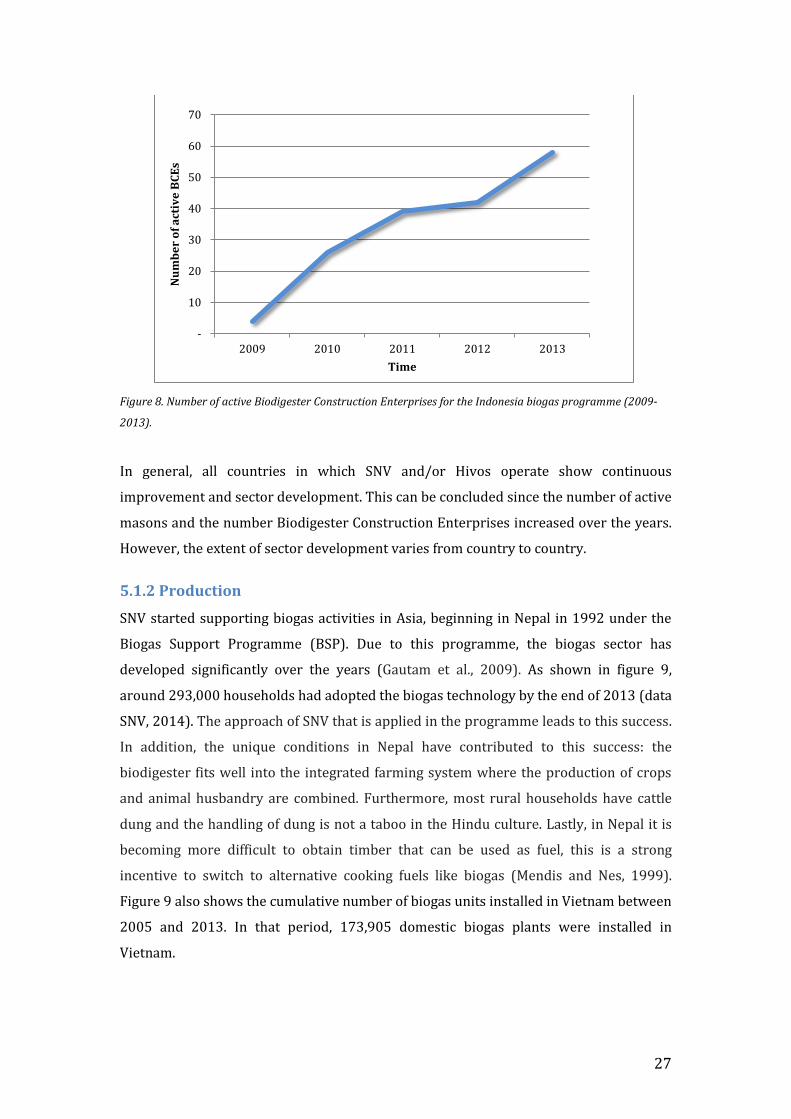
Not only in the African countries the number of Biodigester Construction Enterprises
increased over the years. For example, as shown in figure 8, in Indonesia this number
grew from 4 in 2009 to 58 BCEs in 2013 (increase during this 4 years period by 1350%).
0
20
40
60
80
100
120
140
160
Q1(2012)
Q2(2012)
Q3(2012)
Q4(2012)
Q1(2013)
Q2(2013)
Q3(2013)
Nu
mb
er
of
act
ive
BC
Es
Time
Burkina Faso
Uganda
Tanzania
Rwanda
Kenya
Ethiopia
27
Figure 8. Number of active Biodigester Construction Enterprises for the Indonesia biogas programme (2009-
2013).
In general, all countries in which SNV and/or Hivos operate show continuous
improvement and sector development. This can be concluded since the number of active
masons and the number Biodigester Construction Enterprises increased over the years.
However, the extent of sector development varies from country to country.
5.1.2 Production
SNV started supporting biogas activities in Asia, beginning in Nepal in 1992 under the
Biogas Support Programme (BSP). Due to this programme, the biogas sector has
developed significantly over the years (Gautam et al., 2009). As shown in figure 9,
around 293,000 households had adopted the biogas technology by the end of 2013 (data
SNV, 2014). The approach of SNV that is applied in the programme leads to this success.
In addition, the unique conditions in Nepal have contributed to this success: the
biodigester fits well into the integrated farming system where the production of crops
and animal husbandry are combined. Furthermore, most rural households have cattle
dung and the handling of dung is not a taboo in the Hindu culture. Lastly, in Nepal it is
becoming more difficult to obtain timber that can be used as fuel, this is a strong
incentive to switch to alternative cooking fuels like biogas (Mendis and Nes, 1999).
Figure 9 also shows the cumulative number of biogas units installed in Vietnam between
2005 and 2013. In that period, 173,905 domestic biogas plants were installed in
Vietnam.
-
10
20
30
40
50
60
70
2009 2010 2011 2012 2013
Nu
mb
er
of
act
ive
BC
Es
Time
28
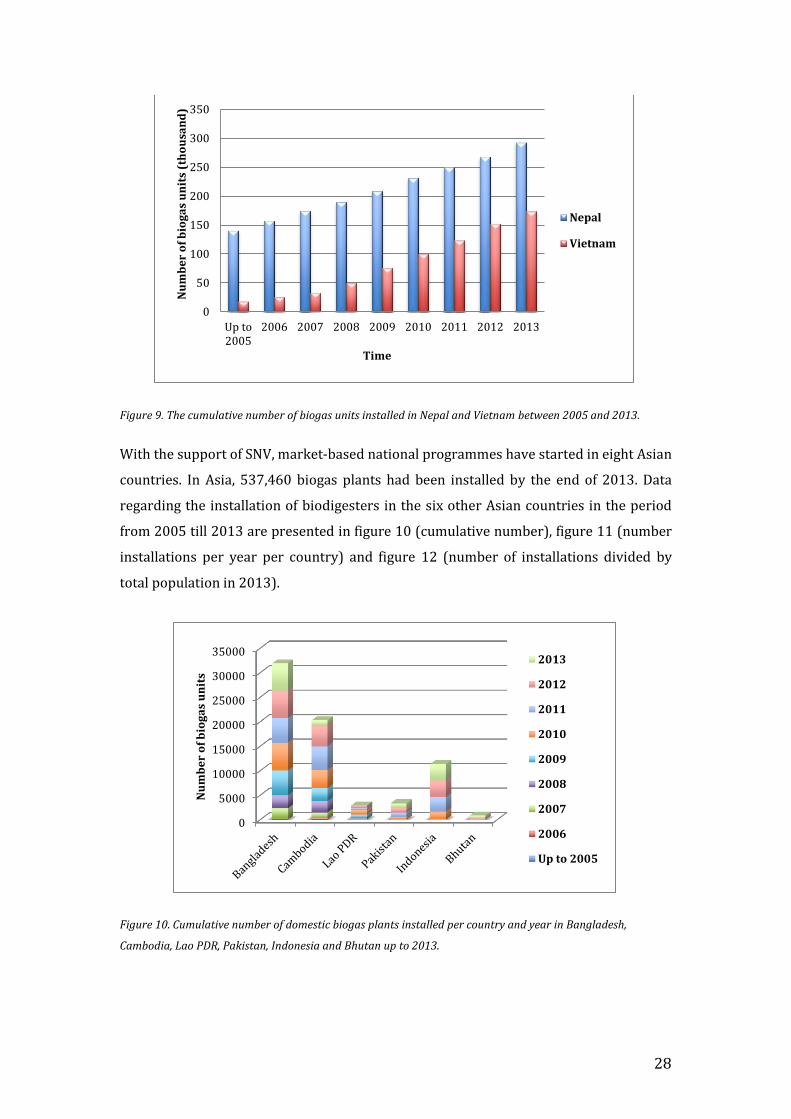
Figure 9. The cumulative number of biogas units installed in Nepal and Vietnam between 2005 and 2013.
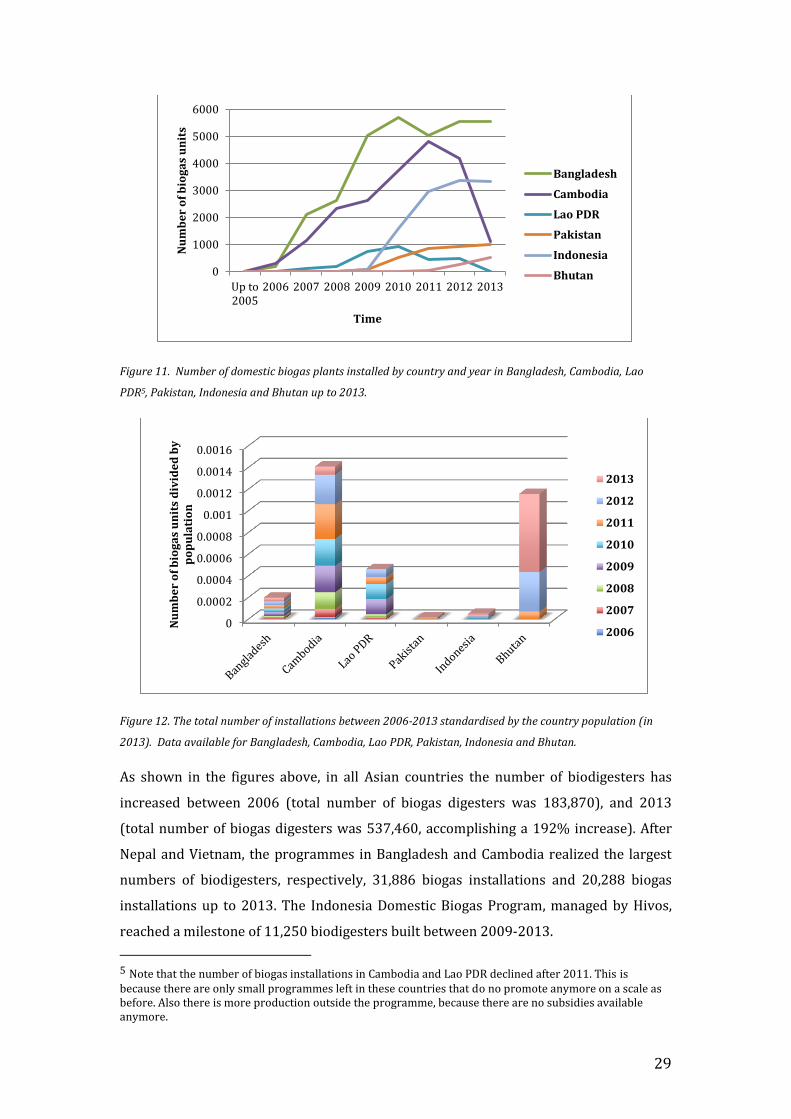
With the support of SNV, market-based national programmes have started in eight Asian
countries. In Asia, 537,460 biogas plants had been installed by the end of 2013. Data
regarding the installation of biodigesters in the six other Asian countries in the period
from 2005 till 2013 are presented in figure 10 (cumulative number), figure 11 (number
installations per year per country) and figure 12 (number of installations divided by
total population in 2013).
Figure 10. Cumulative number of domestic biogas plants installed per country and year in Bangladesh,
Cambodia, Lao PDR, Pakistan, Indonesia and Bhutan up to 2013.
0
50
100
150
200
250
300
350
Up to2005
2006 2007 2008 2009 2010 2011 2012 2013
Nu
mb
er
of
bio
ga
s u
nit
s (t
ho
usa
nd
)
Time
Nepal
Vietnam
0
5000
10000
15000
20000
25000
30000
35000
Nu
mb
er
of
bio
ga
s u
nit
s
2013
2012
2011
2010
2009
2008
2007
2006
Up to 2005
29
Figure 11. Number of domestic biogas plants installed by country and year in Bangladesh, Cambodia, Lao
PDR5, Pakistan, Indonesia and Bhutan up to 2013.
Figure 12. The total number of installations between 2006-2013 standardised by the country population (in
2013). Data available for Bangladesh, Cambodia, Lao PDR, Pakistan, Indonesia and Bhutan.
As shown in the figures above, in all Asian countries the number of biodigesters has
increased between 2006 (total number of biogas digesters was 183,870), and 2013
(total number of biogas digesters was 537,460, accomplishing a 192% increase). After
Nepal and Vietnam, the programmes in Bangladesh and Cambodia realized the largest
numbers of biodigesters, respectively, 31,886 biogas installations and 20,288 biogas
installations up to 2013. The Indonesia Domestic Biogas Program, managed by Hivos,
reached a milestone of 11,250 biodigesters built between 2009-2013.
5 Note that the number of biogas installations in Cambodia and Lao PDR declined after 2011. This is because there are only small programmes left in these countries that do no promote anymore on a scale as before. Also there is more production outside the programme, because there are no subsidies available anymore.
0
1000
2000
3000
4000
5000
6000
Up to2005
2006 2007 2008 2009 2010 2011 2012 2013
Nu
mb
er
of
bio
ga
s u
nit
s
Time
Bangladesh
Cambodia
Lao PDR
Pakistan
Indonesia
Bhutan
0
0.0002
0.0004
0.0006
0.0008
0.001
0.0012
0.0014
0.0016
Nu
mb
er
of
bio
ga
s u
nit
s d
ivid
ed
by
p
op
ula
tio
n
2013
2012
2011
2010
2009
2008
2007
2006
30
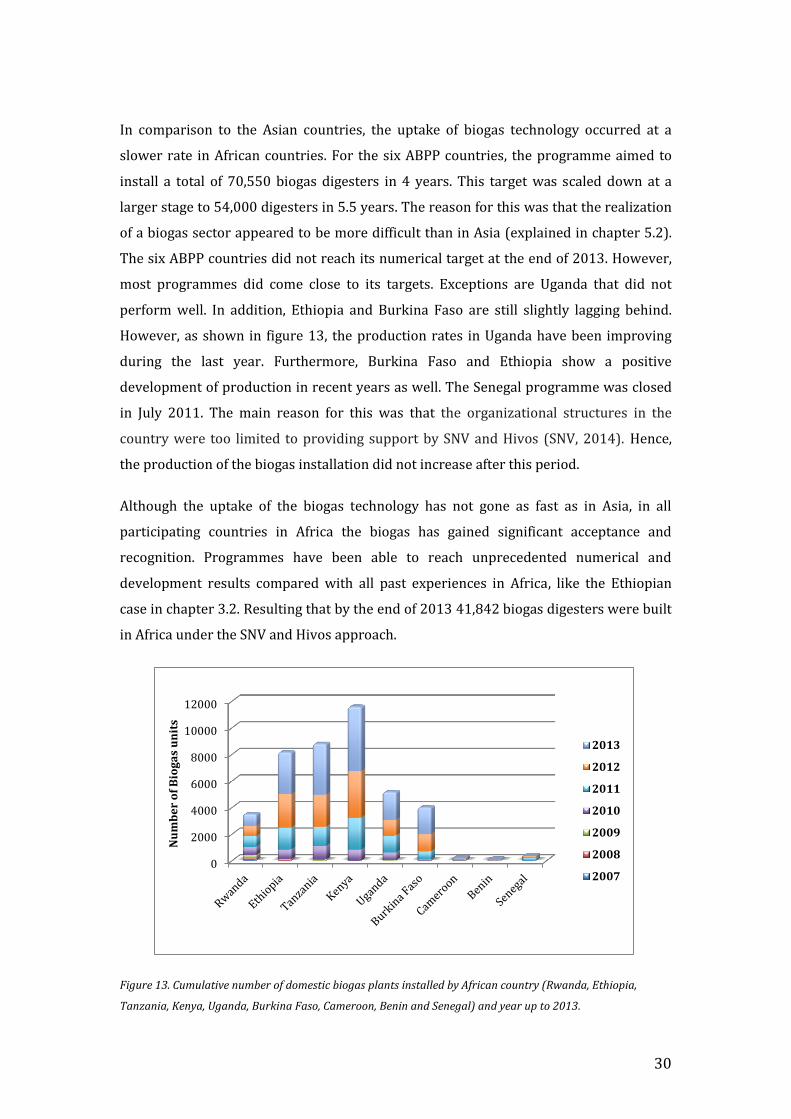
In comparison to the Asian countries, the uptake of biogas technology occurred at a
slower rate in African countries. For the six ABPP countries, the programme aimed to
install a total of 70,550 biogas digesters in 4 years. This target was scaled down at a
larger stage to 54,000 digesters in 5.5 years. The reason for this was that the realization
of a biogas sector appeared to be more difficult than in Asia (explained in chapter 5.2).
The six ABPP countries did not reach its numerical target at the end of 2013. However,
most programmes did come close to its targets. Exceptions are Uganda that did not
perform well. In addition, Ethiopia and Burkina Faso are still slightly lagging behind.
However, as shown in figure 13, the production rates in Uganda have been improving
during the last year. Furthermore, Burkina Faso and Ethiopia show a positive
development of production in recent years as well. The Senegal programme was closed
in July 2011. The main reason for this was that the organizational structures in the
country were too limited to providing support by SNV and Hivos (SNV, 2014). Hence,
the production of the biogas installation did not increase after this period.
Although the uptake of the biogas technology has not gone as fast as in Asia, in all
participating countries in Africa the biogas has gained significant acceptance and
recognition. Programmes have been able to reach unprecedented numerical and
development results compared with all past experiences in Africa, like the Ethiopian
case in chapter 3.2. Resulting that by the end of 2013 41,842 biogas digesters were built
in Africa under the SNV and Hivos approach.
Figure 13. Cumulative number of domestic biogas plants installed by African country (Rwanda, Ethiopia,
Tanzania, Kenya, Uganda, Burkina Faso, Cameroon, Benin and Senegal) and year up to 2013.
0
2000
4000
6000
8000
10000
12000
Nu
mb
er
of
Bio
ga
s u
nit
s
2013
2012
2011
2010
2009
2008
2007
31
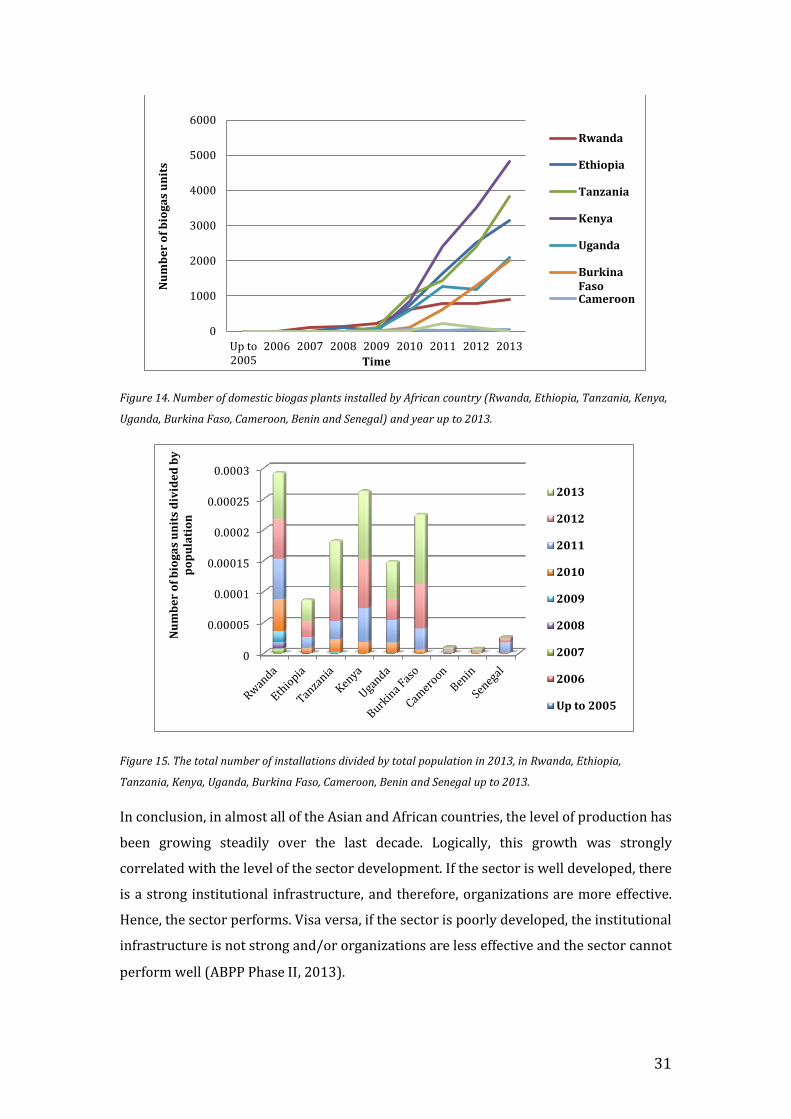
Figure 14. Number of domestic biogas plants installed by African country (Rwanda, Ethiopia, Tanzania, Kenya,
Uganda, Burkina Faso, Cameroon, Benin and Senegal) and year up to 2013.
Figure 15. The total number of installations divided by total population in 2013, in Rwanda, Ethiopia,
Tanzania, Kenya, Uganda, Burkina Faso, Cameroon, Benin and Senegal up to 2013.
In conclusion, in almost all of the Asian and African countries, the level of production has
been growing steadily over the last decade. Logically, this growth was strongly
correlated with the level of the sector development. If the sector is well developed, there
is a strong institutional infrastructure, and therefore, organizations are more effective.
Hence, the sector performs. Visa versa, if the sector is poorly developed, the institutional
infrastructure is not strong and/or organizations are less effective and the sector cannot
perform well (ABPP Phase , 2013).
0
1000
2000
3000
4000
5000
6000
Up to2005
2006 2007 2008 2009 2010 2011 2012 2013
Nu
mb
er
of
bio
ga
s u
nit
s
Time
Rwanda
Ethiopia
Tanzania
Kenya
Uganda
BurkinaFasoCameroon
0
0.00005
0.0001
0.00015
0.0002
0.00025
0.0003
Nu
mb
er
of
bio
ga
s u
nit
s d
ivid
ed
by
p
op
ula
tio
n
2013
2012
2011
2010
2009
2008
2007
2006
Up to 2005
32
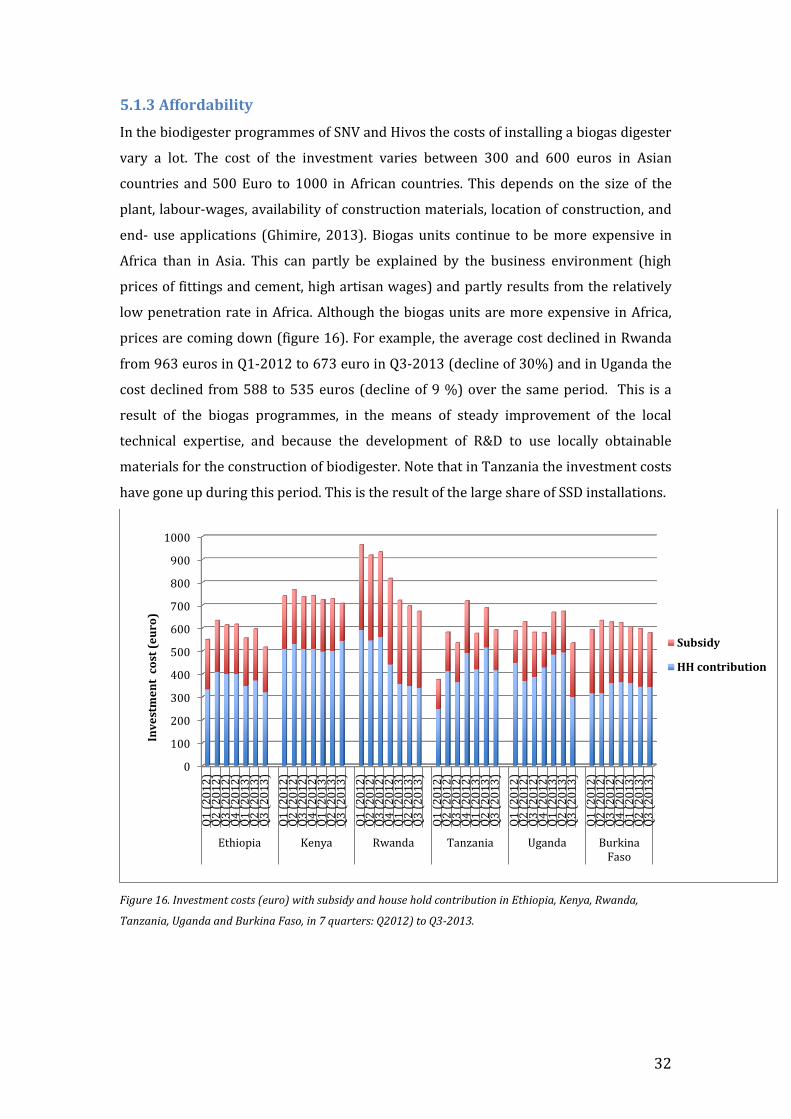
5.1.3 Affordability
In the biodigester programmes of SNV and Hivos the costs of installing a biogas digester
vary a lot. The cost of the investment varies between 300 and 600 euros in Asian
countries and 500 Euro to 1000 in African countries. This depends on the size of the
plant, labour-wages, availability of construction materials, location of construction, and
end- use applications (Ghimire, 2013). Biogas units continue to be more expensive in
Africa than in Asia. This can partly be explained by the business environment (high
prices of fittings and cement, high artisan wages) and partly results from the relatively
low penetration rate in Africa. Although the biogas units are more expensive in Africa,
prices are coming down (figure 16). For example, the average cost declined in Rwanda
from 963 euros in Q1-2012 to 673 euro in Q3-2013 (decline of 30%) and in Uganda the
cost declined from 588 to 535 euros (decline of 9 %) over the same period. This is a
result of the biogas programmes, in the means of steady improvement of the local
technical expertise, and because the development of R&D to use locally obtainable
materials for the construction of biodigester. Note that in Tanzania the investment costs
have gone up during this period. This is the result of the large share of SSD installations.
Figure 16. Investment costs (euro) with subsidy and house hold contribution in Ethiopia, Kenya, Rwanda,
Tanzania, Uganda and Burkina Faso, in 7 quarters: Q2012) to Q3-2013.
0
100
200
300
400
500
600
700
800
900
1000
Q1
(2
01
2)
Q2
(2
01
2)
Q3
(2
01
2)
Q4
(2
01
2)
Q1
(2
01
3)
Q2
(2
01
3)
Q3
(2
01
3)
Q1
(2
01
2)
Q2
(2
01
2)
Q3
(2
01
2)
Q4
(2
01
2)
Q1
(2
01
3)
Q2
(2
01
3)
Q3
(2
01
3)
Q1
(2
01
2)
Q2
(2
01
2)
Q3
(2
01
2)
Q4
(2
01
2)
Q1
(2
01
3)
Q2
(2
01
3)
Q3
(2
01
3)
Q1
(2
01
2)
Q2
(2
01
2)
Q3
(2
01
2)
Q4
(2
01
2)
Q1
(2
01
3)
Q2
(2
01
3)
Q3
(2
01
3)
Q1
(2
01
2)
Q2
(2
01
2)
Q3
(2
01
2)
Q4
(2
01
2)
Q1
(2
01
3)
Q2
(2
01
3)
Q3
(2
01
3)
Q1
(2
01
2)
Q2
(2
01
2)
Q3
(2
01
2)
Q4
(2
01
2)
Q1
(2
01
3)
Q2
(2
01
3)
Q3
(2
01
3)
Ethiopia Kenya Rwanda Tanzania Uganda BurkinaFaso
Inv
est
me
nt
co
st (
eu
ro)
Subsidy
HH contribution
33
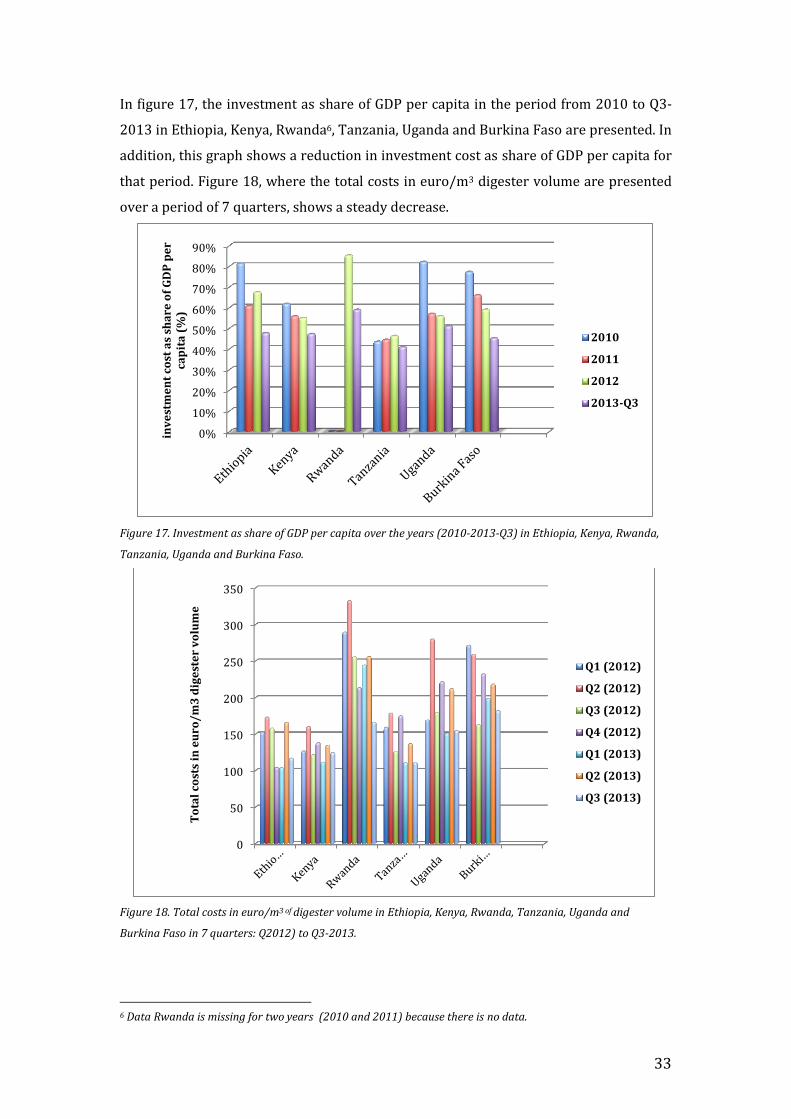
In figure 17, the investment as share of GDP per capita in the period from 2010 to Q3-
2013 in Ethiopia, Kenya, Rwanda6, Tanzania, Uganda and Burkina Faso are presented. In
addition, this graph shows a reduction in investment cost as share of GDP per capita for
that period. Figure 18, where the total costs in euro/m3 digester volume are presented
over a period of 7 quarters, shows a steady decrease.
Figure 17. Investment as share of GDP per capita over the years (2010-2013-Q3) in Ethiopia, Kenya, Rwanda,
Tanzania, Uganda and Burkina Faso.
Figure 18. Total costs in euro/m3 of digester volume in Ethiopia, Kenya, Rwanda, Tanzania, Uganda and
Burkina Faso in 7 quarters: Q2012) to Q3-2013.
6 Data Rwanda is missing for two years (2010 and 2011) because there is no data.
0%
10%
20%
30%
40%
50%
60%
70%
80%
90%
inv
est
me
nt
cost
as
sha
re o
f G
DP
pe
r ca
pit
a (
%)
2010
2011
2012
2013-Q3
0
50
100
150
200
250
300
350
To
tal
cost
s in
eu
ro/
m3
dig
est
er
vo
lum
e
Q1 (2012)
Q2 (2012)
Q3 (2012)
Q4 (2012)
Q1 (2013)
Q2 (2013)
Q3 (2013)
34
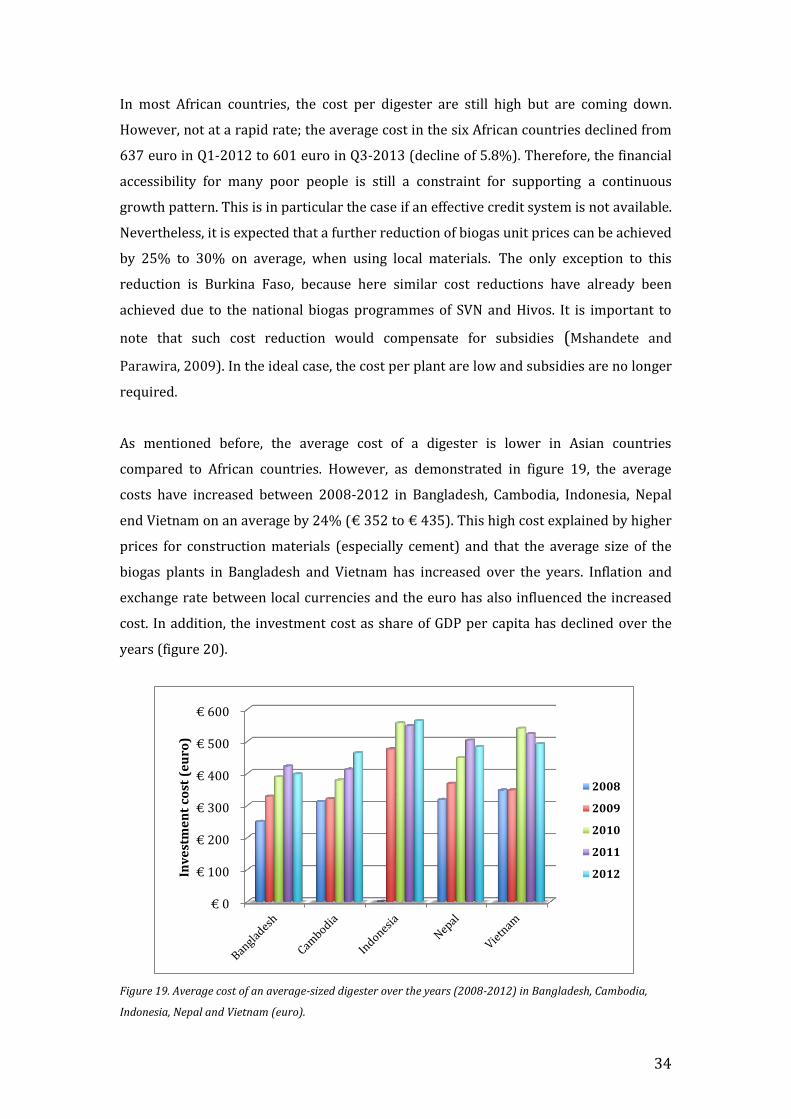
In most African countries, the cost per digester are still high but are coming down.
However, not at a rapid rate; the average cost in the six African countries declined from
637 euro in Q1-2012 to 601 euro in Q3-2013 (decline of 5.8%). Therefore, the financial
accessibility for many poor people is still a constraint for supporting a continuous
growth pattern. This is in particular the case if an effective credit system is not available.
Nevertheless, it is expected that a further reduction of biogas unit prices can be achieved
by 25% to 30% on average, when using local materials. The only exception to this
reduction is Burkina Faso, because here similar cost reductions have already been
achieved due to the national biogas programmes of SVN and Hivos. It is important to
note that such cost reduction would compensate for subsidies (Mshandete and
Parawira, 2009). In the ideal case, the cost per plant are low and subsidies are no longer
required.
As mentioned before, the average cost of a digester is lower in Asian countries
compared to African countries. However, as demonstrated in figure 19, the average
costs have increased between 2008-2012 in Bangladesh, Cambodia, Indonesia, Nepal
end Vietnam on an average by 24% (€ 352 to € 435). This high cost explained by higher
prices for construction materials (especially cement) and that the average size of the
biogas plants in Bangladesh and Vietnam has increased over the years. Inflation and
exchange rate between local currencies and the euro has also influenced the increased
cost. In addition, the investment cost as share of GDP per capita has declined over the
years (figure 20).
Figure 19. Average cost of an average-sized digester over the years (2008-2012) in Bangladesh, Cambodia,
Indonesia, Nepal and Vietnam (euro).
€ 0
€ 100
€ 200
€ 300
€ 400
€ 500
€ 600
Inv
est
me
nt
cost
(e
uro
)
2008
2009
2010
2011
2012
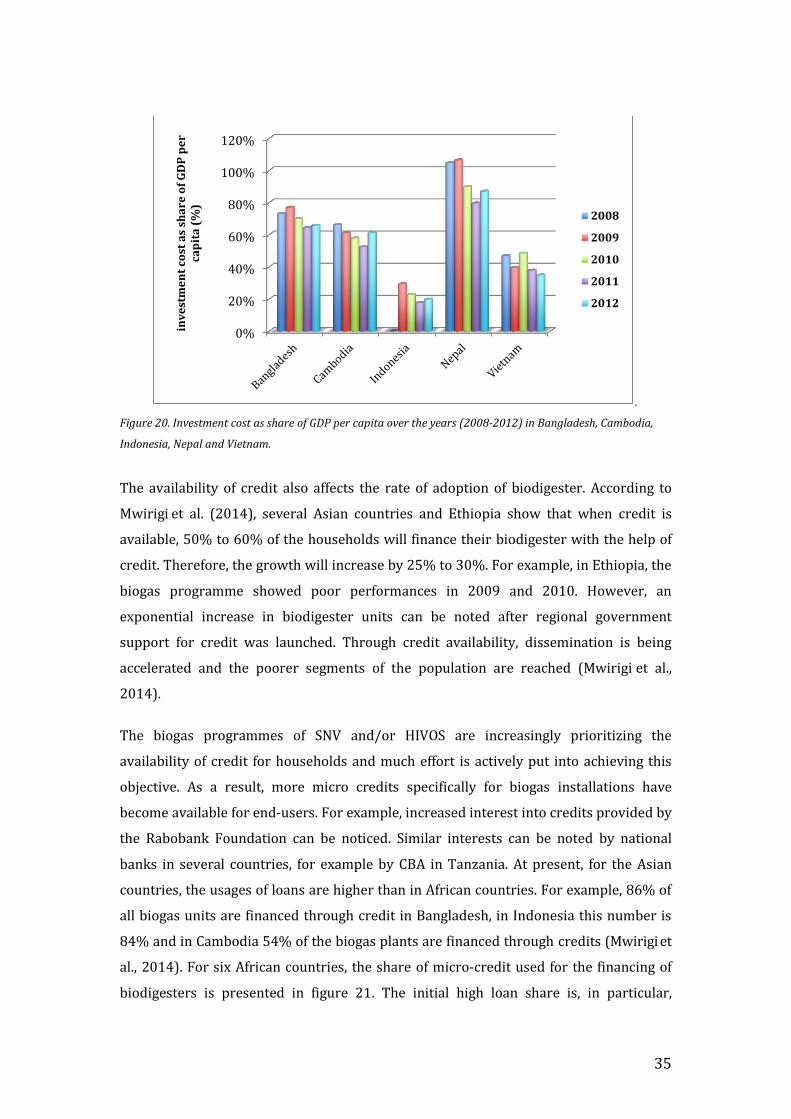
35
.
Figure 20. Investment cost as share of GDP per capita over the years (2008-2012) in Bangladesh, Cambodia,
Indonesia, Nepal and Vietnam.
The availability of credit also affects the rate of adoption of biodigester. According to
Mwirigi et al. (2014), several Asian countries and Ethiopia show that when credit is
available, 50% to 60% of the households will finance their biodigester with the help of
credit. Therefore, the growth will increase by 25% to 30%. For example, in Ethiopia, the
biogas programme showed poor performances in 2009 and 2010. However, an
exponential increase in biodigester units can be noted after regional government
support for credit was launched. Through credit availability, dissemination is being
accelerated and the poorer segments of the population are reached (Mwirigi et al.,
2014).
The biogas programmes of SNV and/or HIVOS are increasingly prioritizing the
availability of credit for households and much effort is actively put into achieving this
objective. As a result, more micro credits specifically for biogas installations have
become available for end-users. For example, increased interest into credits provided by
the Rabobank Foundation can be noticed. Similar interests can be noted by national
banks in several countries, for example by CBA in Tanzania. At present, for the Asian
countries, the usages of loans are higher than in African countries. For example, 86% of
all biogas units are financed through credit in Bangladesh, in Indonesia this number is
84% and in Cambodia 54% of the biogas plants are financed through credits (Mwirigi et
al., 2014). For six African countries, the share of micro-credit used for the financing of
biodigesters is presented in figure 21. The initial high loan share is, in particular,
0%
20%
40%
60%
80%
100%
120%
inv
est
me
nt
cost
as
sha
re o
f G
DP
pe
r ca
pit
a (
%)
2008
2009
2010
2011
2012
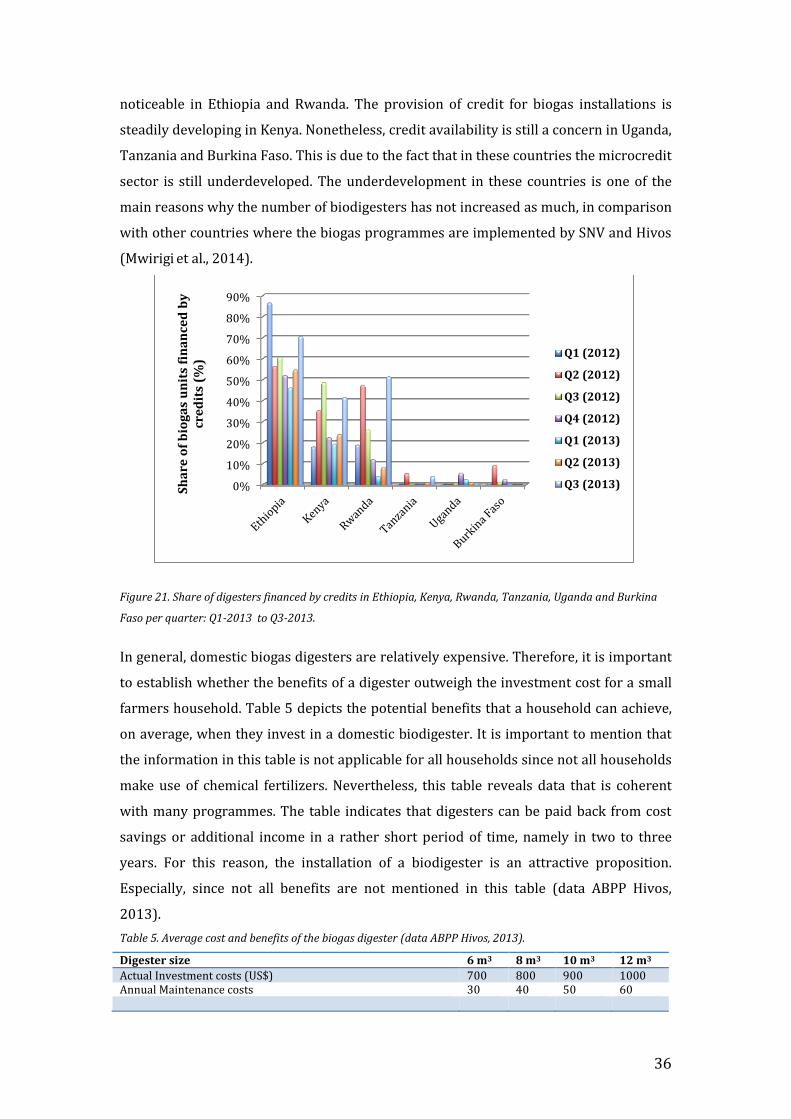
36
noticeable in Ethiopia and Rwanda. The provision of credit for biogas installations is
steadily developing in Kenya. Nonetheless, credit availability is still a concern in Uganda,
Tanzania and Burkina Faso. This is due to the fact that in these countries the microcredit
sector is still underdeveloped. The underdevelopment in these countries is one of the
main reasons why the number of biodigesters has not increased as much, in comparison
with other countries where the biogas programmes are implemented by SNV and Hivos
(Mwirigi et al., 2014).
Figure 21. Share of digesters financed by credits in Ethiopia, Kenya, Rwanda, Tanzania, Uganda and Burkina
Faso per quarter: Q1-2013 to Q3-2013.
In general, domestic biogas digesters are relatively expensive. Therefore, it is important
to establish whether the benefits of a digester outweigh the investment cost for a small
farmers household. Table 5 depicts the potential benefits that a household can achieve,
on average, when they invest in a domestic biodigester. It is important to mention that
the information in this table is not applicable for all households since not all households
make use of chemical fertilizers. Nevertheless, this table reveals data that is coherent
with many programmes. The table indicates that digesters can be paid back from cost
savings or additional income in a rather short period of time, namely in two to three
years. For this reason, the installation of a biodigester is an attractive proposition.
Especially, since not all benefits are not mentioned in this table (data ABPP Hivos,
2013).
Table 5. Average cost and benefits of the biogas digester (data ABPP Hivos, 2013).
Digester size 6 m3 8 m3 10 m3 12 m3
Actual Investment costs (US$) 700 800 900 1000 Annual Maintenance costs 30 40 50 60
0%
10%
20%
30%
40%
50%
60%
70%
80%
90%
Sh
are
of
bio
ga
s u
nit
s fi
na
nce
d b
y
cre
dit
s (%
)
Q1 (2012)
Q2 (2012)
Q3 (2012)
Q4 (2012)
Q1 (2013)
Q2 (2013)
Q3 (2013)

37
Annual Fuel cost reduction 120 150 180 210 Annual Fertiliser cost reduction 40 50 70 100 Annual Food cost reduction 60 80 110 150 Annual Additional revenue from increased agricultural production
120 150 200 250
Balance of annual costs and benefits to the rural household 310 390 510 650 Simple payback (years) 2.3 2.1 1.8 1.5
5.2.4 Bio- slurry Extension
The residue of the production of domestic biogas is ‘bio-slurry.' This slurry can simply
be collected and used as organic fertilizer. However, as mention in chapter 2.1, the value
of this fertilizer depends on the nutrient losses (leaching of nitrogen and potassium and
volatilisation of ammonia) that occur during storage, handling and/or application. In the
biogas programmes of SNV and Hivos research is done on the comparative value of the
slurry as fertilizer and soil improver (Bonten et al., 2014).
At the same time, the most biogas programmes supported by SNV and Hivos in both Asia
and Africa has included a bio-slurry extension component to realize the benefits of the
use of bio-slurry. This component aims to maximize the revenues for farmers on their
investments by making optimal use of the bio-slurry compost as organic fertilizer to
improve agricultural productivity. The national biogas programmes have bio-slurry
officers that are working with several institutions who deliver extension services. The
extension is carried out in numerous ways: directly thought by the bio-slurry officers,
visits to neighbors (promoter and model farmers), through government and private
training institutions, in short courses, through rural development NGOs, longer
trainings, presentations, etcetera. (SNV, 2009). The companies that construct the biogas
digesters are increasingly encouraged to provide bio-slurry extension in their
installations, like compost pits7. A study conducted in Nepal shows that compost pits
have become a fundamental requirement of biogas units to collect the biogas-slurry. The
availability of compost pits in the installation not only provides protection of bio-slurry
from surface flow, but also enhances the process of decomposition. The size and number
of the pit are normally determined by the biogas plant size and the availability of space
(Country Report on the Use of Bio-slurry in Nepal, 2006).
In this research the similar measurement for extension is used as the dashboard 2013
interim report: “the extent to which farmers made special provisions aiming at proper
bio-slurry application (compost pits)”. In figure 22, the extension in Ethiopia, Kenya,
7 A slurry pit is a hole in the ground where the slurry flows into when the gas pressure in the dome builds up. The slurry is store temporarily in this pit before it is applied to the field. When there is organic waste on the farm, this waste can compost together with the slurry to improve the fertilizing quality. This is done in another hole or two holes, called the compost pits.
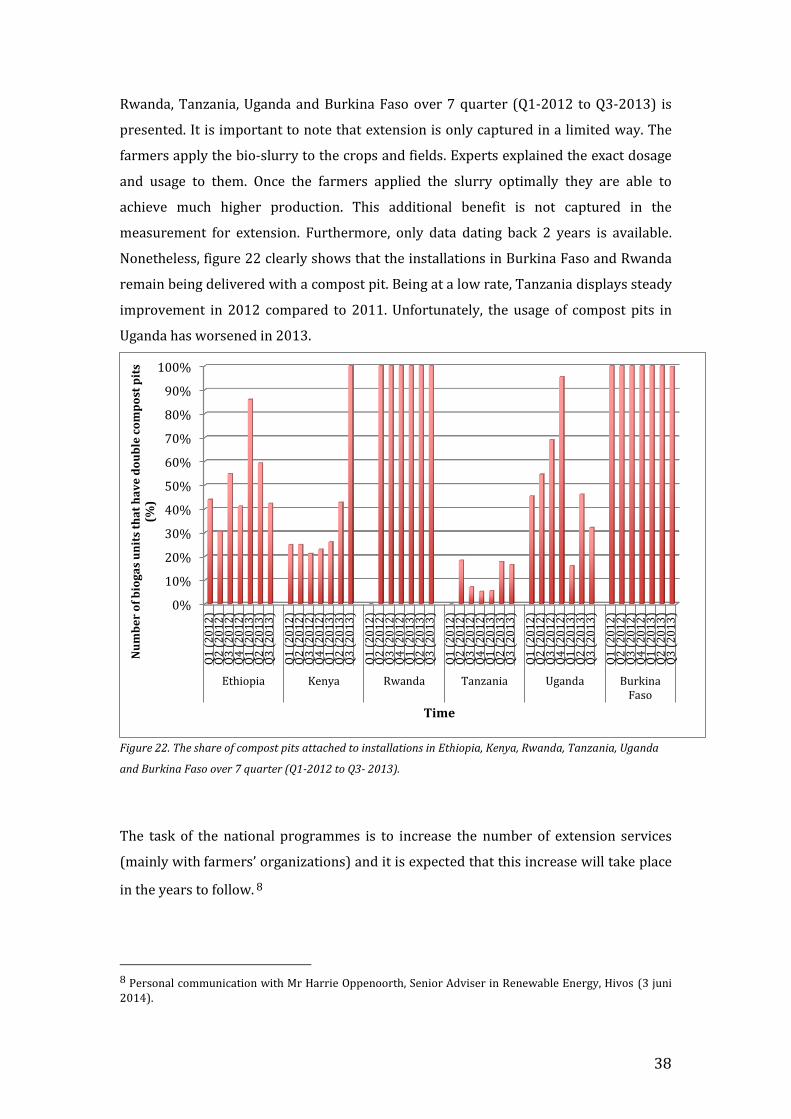
38
Rwanda, Tanzania, Uganda and Burkina Faso over 7 quarter (Q1-2012 to Q3-2013) is
presented. It is important to note that extension is only captured in a limited way. The
farmers apply the bio-slurry to the crops and fields. Experts explained the exact dosage
and usage to them. Once the farmers applied the slurry optimally they are able to
achieve much higher production. This additional benefit is not captured in the
measurement for extension. Furthermore, only data dating back 2 years is available.
Nonetheless, figure 22 clearly shows that the installations in Burkina Faso and Rwanda
remain being delivered with a compost pit. Being at a low rate, Tanzania displays steady
improvement in 2012 compared to 2011. Unfortunately, the usage of compost pits in
Uganda has worsened in 2013.
Figure 22. The share of compost pits attached to installations in Ethiopia, Kenya, Rwanda, Tanzania, Uganda
and Burkina Faso over 7 quarter (Q1-2012 to Q3- 2013).
The task of the national programmes is to increase the number of extension services
(mainly with farmers’ organizations) and it is expected that this increase will take place
in the years to follow. 8
8 Personal communication with Mr Harrie Oppenoorth, Senior Adviser in Renewable Energy, Hivos (3 juni 2014).
0%
10%
20%
30%
40%
50%
60%
70%
80%
90%
100%
Q1
(2
01
2)
Q2
(2
01
2)
Q3
(2
01
2)
Q4
(2
01
2)
Q1
(2
01
3)
Q2
(2
01
3)
Q3
(2
01
3)
Q1
(2
01
2)
Q2
(2
01
2)
Q3
(2
01
2)
Q4
(2
01
2)
Q1
(2
01
3)
Q2
(2
01
3)
Q3
(2
01
3)
Q1
(2
01
2)
Q2
(2
01
2)
Q3
(2
01
2)
Q4
(2
01
2)
Q1
(2
01
3)
Q2
(2
01
3)
Q3
(2
01
3)
Q1
(2
01
2)
Q2
(2
01
2)
Q3
(2
01
2)
Q4
(2
01
2)
Q1
(2
01
3)
Q2
(2
01
3)
Q3
(2
01
3)
Q1
(2
01
2)
Q2
(2
01
2)
Q3
(2
01
2)
Q4
(2
01
2)
Q1
(2
01
3)
Q2
(2
01
3)
Q3
(2
01
3)
Q1
(2
01
2)
Q2
(2
01
2)
Q3
(2
01
2)
Q4
(2
01
2)
Q1
(2
01
3)
Q2
(2
01
3)
Q3
(2
01
3)
Ethiopia Kenya Rwanda Tanzania Uganda BurkinaFaso
Nu
mb
er
of
bio
ga
s u
nit
s th
at
ha
ve
do
ub
le c
om
po
st p
its
(%)
Time

39
5.2.5 Gender
Women are primarily responsible for biogas related activities such as, the collection of
cooking fuel, organization of cattle dung, cooking, cleaning of cooking pots and the
collection of water. Hence, the installation of a biodigester benefits women the most
(Ghimire, 2013). Therefore, it is essential for the biogas programmes to have a
particular focus on women (Kaygusuz, 2011).
The SNV and Hivos programmes aim that the role of women in society will become more
on the foreground. They do so by empowering them as masons, plant owners, and also
by creating useful economic time that was previously wasted in search of fuel.
A study conducted in Nepal, researched the effect of biogas as a "new technology" on the
workload of women from a gender perspective (NDBMP, 2008). The research
demonstrated that the female users perceived this technology as workload reducing in
two ways. Firstly, in a quantitatively manner – the collection of fuel wood for cooking
was reduced by a factor of 5. Secondly, in a qualitatively manner - washing pots to
remove stains created by the fire was no longer needed, cooking became easier, one
does not have to blow the coals to keep the fire burning, indoor smoke is not developed
and mainly not needing to go to the jungle was felt as an improvement. Whereas the
above benefits are usually expressed in most studies, a biogas study in Bangladesh
(reference) states that the workload of several women did not decrease (UDBP, 2013).
The explanation for this is that the women spent the time that had been saved on other
household chores. Just a small percentage of women (4%) stated that their workload
had increased because of maintenance and management of the biogas plant, livestock
caring, slurry management and other biogas plant operation laborious.
The participation of woman in the biogas technology varies by country as shown in
figure 23. For example, the share of loans extended to women in three selected African
countries is presented in figure 23. In particular in Kenya it is shown that women got
most loans for biodigesters (80-90%). In Ethiopia, mainly men received the majority of
loans, because here the decision-making power lies with the male heads that control
resources and its allocation (Mwirigi et al., 2014).
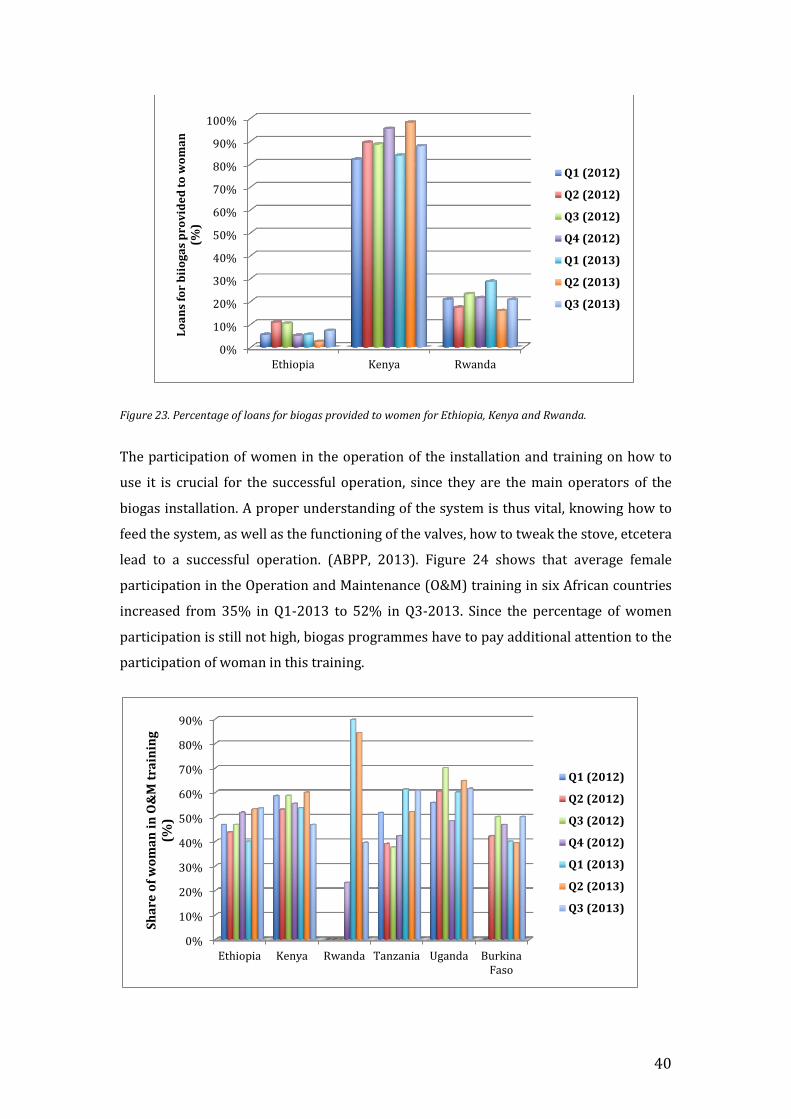
40
Figure 23. Percentage of loans for biogas provided to women for Ethiopia, Kenya and Rwanda.
The participation of women in the operation of the installation and training on how to
use it is crucial for the successful operation, since they are the main operators of the
biogas installation. A proper understanding of the system is thus vital, knowing how to
feed the system, as well as the functioning of the valves, how to tweak the stove, etcetera
lead to a successful operation. (ABPP, 2013). Figure 24 shows that average female
participation in the Operation and Maintenance (O&M) training in six African countries
increased from 35% in Q1-2013 to 52% in Q3-2013. Since the percentage of women
participation is still not high, biogas programmes have to pay additional attention to the
participation of woman in this training.
0%
10%
20%
30%
40%
50%
60%
70%
80%
90%
100%
Ethiopia Kenya Rwanda
Lo
an
s fo
r b
iio
ga
s p
rov
ide
d t
o w
om
an
(%
)
Q1 (2012)
Q2 (2012)
Q3 (2012)
Q4 (2012)
Q1 (2013)
Q2 (2013)
Q3 (2013)
0%
10%
20%
30%
40%
50%
60%
70%
80%
90%
Ethiopia Kenya Rwanda Tanzania Uganda BurkinaFaso
Sh
are
of
wo
ma
n i
n O
&M
tra
inin
g
(%)
Q1 (2012)
Q2 (2012)
Q3 (2012)
Q4 (2012)
Q1 (2013)
Q2 (2013)
Q3 (2013)
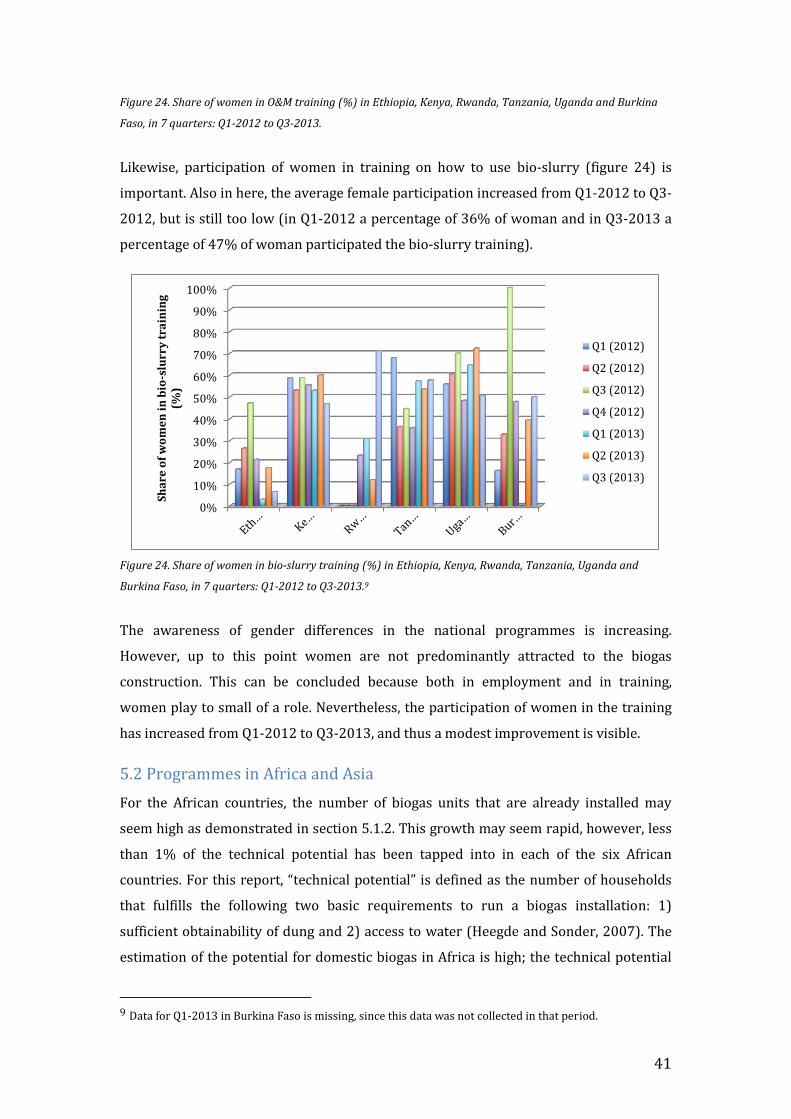
41
Figure 24. Share of women in O&M training (%) in Ethiopia, Kenya, Rwanda, Tanzania, Uganda and Burkina
Faso, in 7 quarters: Q1-2012 to Q3-2013.
Likewise, participation of women in training on how to use bio-slurry (figure 24) is
important. Also in here, the average female participation increased from Q1-2012 to Q3-
2012, but is still too low (in Q1-2012 a percentage of 36% of woman and in Q3-2013 a
percentage of 47% of woman participated the bio-slurry training).
Figure 24. Share of women in bio-slurry training (%) in Ethiopia, Kenya, Rwanda, Tanzania, Uganda and
Burkina Faso, in 7 quarters: Q1-2012 to Q3-2013.9
The awareness of gender differences in the national programmes is increasing.
However, up to this point women are not predominantly attracted to the biogas
construction. This can be concluded because both in employment and in training,
women play to small of a role. Nevertheless, the participation of women in the training
has increased from Q1-2012 to Q3-2013, and thus a modest improvement is visible.
5.2 Programmes in Africa and Asia
For the African countries, the number of biogas units that are already installed may
seem high as demonstrated in section 5.1.2. This growth may seem rapid, however, less
than 1% of the technical potential has been tapped into in each of the six African
countries. For this report, “technical potential” is defined as the number of households
that fulfills the following two basic requirements to run a biogas installation: 1)
sufficient obtainability of dung and 2) access to water (Heegde and Sonder, 2007). The
estimation of the potential for domestic biogas in Africa is high; the technical potential
9 Data for Q1-2013 in Burkina Faso is missing, since this data was not collected in that period.
0%
10%
20%
30%
40%
50%
60%
70%
80%
90%
100%
Sh
are
of
wo
me
n i
n b
io-s
lurr
y t
rain
ing
(%
)
Q1 (2012)
Q2 (2012)
Q3 (2012)
Q4 (2012)
Q1 (2013)
Q2 (2013)
Q3 (2013)
42
market in Africa for biogas installations is estimated at 18.5 million households (Nes
and Nhete, 2007).
Despite the huge potential of biogas, the dissemination of the biogas technology in Africa
has not been that successful relative to Asia. This is caused by the failure of national
governments to support biogas technology by the means of a clear energy policy.
Moreover, the following barriers were faced in the dissemination of the biogas
technology: poor dissemination strategies, poor design of biogas plants, lack of
maintenance and monitoring, poor ownership responsibility by users, ethnical barriers,
lack of awareness raising activities, fewer animals are available for manure production
in comparison to Asia. The two main problems for rural farmers are: (1) the investment
cost of biogas plants is often far too high for the rural farmer. This high cost is the result
of the fact that labour and prices of construction materials are higher in Africa compared
to Asia. (2) The credit facilities are not as widely spread in Africa (Arthur et al., 2011).
6.0 Discussion
The results of the evaluation of the SNV and/or Hivos biogas programmes show that the
approach has been successful especially in Asia; most programmes have resulted in the
construction of a considerable number of biodigesters, many BCE’s were involved and
created, new models of biodigester are entering the market, the investment cost are
declining (already low in Asia) and financial institutions offer microcredits (more in
Asia).
This success can be explained by the transition framework that is based on the
Multilevel Perspective on System Innovation elaborated by Geels (see chapter 3.4). The
biogas programmes of SNV and Hivos are not only introducing the biogas technology
through a demonstration project or a pilot. In the case of Ethiopia, where dissemination
of the technology did not take place on a large scale, it was seen that solely a
demonstration project or pilot did not contribute to widespread dissemination of
biodigesters (chapter 3.2). In the biogas programmes where the approach of SNV and
Hivos is applied, a holistic perspective is taken. Meaning that the whole biogas sector
and the relationship between the micro, meso and macro levels are taken into account.
These three levels all play an important role in the dissemination of the biogas
technology and they are being approached differently (Arthur et al., 2011). For
example, at the micro level, intensive promotion, sales and campaign programmes are
developed. At the meso level different functions, which are fulfilled by different actors
43
are analyzed. At the macro level (which receives less attention in their analysis) they
find that the biodigester market is rather stable and minimally affected by landscape
changes (Mwirigi et al., 2014).
Furthermore, according to Romijn et al. (2010), active inter-stakeholder interaction in
the niche network and the formation of expectations concerning the innovation among
and within several social groups are likely to be very important for successful outcomes.
The relevance of this is in particularly seen in the up-scaling of technologies. This is also
showed in the Indian case (chapter 3.3), multiple agencies were present in the network,
and consequently the programme was successful. These two processes are also
highlighted in the market based multi-actor sector development approach of SNV and
Hivos.
However, despite the significant achievements of the national biogas programmes
where the multi‐stakeholders sector development approach is applied, the sector and
the market are still facing several challenges to achieve up-scaling targets and to deal
with capacity constraints. The programmes key conditions and proposed activities are:
The dissemination of the biogas technology on a wide scale is difficult in
countries where a policy on renewable energy is largely absent. Therefore,
renewable energy should be part of the government’s policy agenda (Ghimire,
2013). The Government is supposed to provide the policy, but will not act as an
implementing agency. An independent implementation agency with a full
mandate to implement the biogas programme is essential.
A national policy has to be developed in such a manner that the participation of
private companies in the biogas sector is stimulated. The reason for this is that
the private sector plays a key role in the promotion of renewable energy, making
the biogas sector market-oriented and commercially sustainable. Furthermore,
the financial viability of the private sector needs to be strengthened to guarantee
sufficient supply of biogas producers (Ghimire, 2013).
Lowering of the existing costs of installation without affecting the quality and
performance is required and access to microcredit to make the biogas digester
more affordable are crucial to ensure the supply to those at the lowest layers in
the socio-economic pyramid. The carbon fund can be a sustainable source of
money to continue the programme. Therefore, attention should be given to this
fund from the start. Subsidies can be a temporary solution, but to make the
sector sustainable the final goal is to face out subsidies.
44
Institutional capabilities of the multiple stakeholders need to be supported.
Furthermore, collaboration between the stakeholders, even if their interests are
different and sometimes conflicting, can improve the chances of success
(Ghimire, 2013). The ultimate goal is to decrease the programme support and
increase privatized coordination.
The growth of slurry extension can improve production and increase income.
Consequently, the capacity to repay loans is enhanced. This can be achieved
since the slurry decreases traditional fertilizer expenses.
Create awareness and encourage potential farmers to make use of the biogas
technology. Specifically, if they have had previous negative experiences with the
technology.
Also, programmes can be faced with political instability in a country and/or
extreme weather conditions such as floods, earthquakes and droughts. This
could hinder the progress of the programme. Hence, risk management should be
performed and integrated within the programmes.
With the proposed activities, it is expected that countries were the approach is applied
will succeed to achieve a sustainable private sector led market development where the
sector develops its own dynamics. In the long run, the sector will be able to continue
without the programme support that was initially needed.
7.0 Conclusion
In this research, the domestic biodigester approach of the Dutch NGOs SNV and Hivos is
evaluated. Furthermore, the key success factors and constraints behind its
implementation in both Africa and Asia are identified.
The findings of this report show that the use of the biogas technology offers many socio-
economic, environmental and health benefits. In addition, if enhanced and continued,
these benefits can contribute to the Millennium Development Goals. However, often the
literature reports short-term successes of biogas programmes and failure of the
programmes in the long run. These failures can be explained because biogas
programmes do not focus on the biogas sector as a whole. A holistic approach is in most
cases necessary for success. For the development of a biogas sector, it is essential that
there is close cooperation between all relevant stakeholders (non-government,
government, and private sector) and in the sector at all levels (micro, meso and macro).
In that sense, the multi‐stakeholders sector development approach of SNV and Hivos
that is based on the creation of a market for domestic biodigesters, has been a success:
45
Sector development is showing continuous improvements. In Ethiopia, Kenya,
Rwanda, Tanzania, Uganda and Burkina Faso the total number of active biogas
masons has increased from 262 in Q1-2012 to 3130 active biogas masons in the
Q3-2013 (increase of 1095%). Likewise, the number of Biodigester Construction
Enterprises (BCEs) has increased in these countries; the total number has
increased from 51 in Q1-2012 to 688 in the Q3-2013 (increase 1249 %). Not
only in the African countries the number of BCEs increased over the years, but it
also did in Asia. For example, in Indonesia this number grew from 4 in 2009 to
58 BCEs in 2013 (increase of 1350%).
The programs have built a significant amount of biodigesters. The total number
of biogas installations that have been installed with the SNV and Hivos approach
until 2013 are: 537,460 in the selected Asian countries and 41,842 in the
selected African countries.
In most African countries the cost per digester remain relatively high.
Nevertheless prices are coming down. The average cost in the six African
countries declined from 637 euros in Q1-2012 to 601 euro in Q3-2013 (decline
of 5.8%).
The number of extension service (mainly with farmers’ organizations) is
expected to increase in the years to follow.
A biodigester is a financially interesting investment that gives high economic
returns. Additionally, the usage of the biogas resulted in timesaving, mainly for
the women who are most involved in household chores.
Despite the success of the national biogas programmes, the high cost of installation and
absence of credit for farmers hindered the widespread adoption in the African countries.
In general, the findings from this study show the multi-actor market and sector
development approach is effective in both Africa and Asia. However, more research is
needed to identify if the approach continues to be successful after 2013. In addition,
more data from the Asian biogas programmes is required for a more comprehensive
evaluation.
Acknowledgements
I would like to thank Harrie Oppenoorth and Wim van Nes for providing this
unpublished data and their help.
Furthermore, I would like to thank Elissaios Papyrakis. This very bright and friendly
thesis supervisor helped me greatly with this research.
46
Literature
ABPP (2013). Africa biogas partnership programme, Joint Proposal Hivos & SNV,
Phase II (2014 – 2017), September 2013.
Amigun, B. and Blottnitz, H.V. (2010). Capacity-cost and location-cost analyses
for biogas plants in Africa, Re- sources, Conservation and Recyclin, 55, 63-73.
Arthur, R., Baidoo, M.F. and Antwi, E. (2011). Biogas as a potential renewable
energy source: A Ghanaian case study. Renewable Energy, 36 (5), 1510–1516.
Bhat, P.R., Chanakya, H.N. and Ravindranath, N.H. (2001). Biogas plant
dissemination: success story of Sirsi, India. Energy for Sustainable Development,
5(1), 39–46.
Bhattacharya, S.C. and Salam, S.P. (2002). Low greenhouse gas biomass options
for cooking in the developing countries. Biomass Bioenergy, 22(4), 305–317.
Bhattacharya, S. C. and Jana, C. (2009). Renewable energy in India: Historical
developments and prospects. Energy Policy, 34(8), 981–991.
Buysman, E. and Mol, A.P.J. (2013). Market-based biogas sector development in
least developed countries —The case of Cambodia. Energy Policy, 63(1), 44-51.
Bonten, L.T.C., Zwart, K.B., Rietra, R.P.J.J., Postma R. and de Haas M.J.G. (2014).
Bio-slurry as fertilizer Is bio-slurry from household digesters a better fertilizer
than manure? A literature review. Wageningen, April 2014.
Castro, J. (2011). Mid-Term Review of theAfrica Biogas Partnership Program
Draft Synthesis Report November 2011.
Country Report on the Use of Bio-slurry in Nepal (2006). Final Report.
Submitted by: Dr. Amrit B. Karki ConsultantOrganic Recycling and Biogas
Expert September 15, 2006.
Cheng, S., Li, Z., Mang, H. P. and Huba, E. M. (2013). A review of prefabricated
biogas digesters in China. Renewable and Sustainable Energy Reviews, 28, 738–
748.
47
Cheng, S., Li, Z., Mang, H.P. and Huba, E.M., Gao, R. and Wang, X. (2014).
Development and application of prefabricated biogas digesters in developing
countries. Renewable and Sustainable Energy Reviews, 14, 387–400.
Dashboard Report (2012). Available at: http://africabiogas.org/wp-
content/uploads/downloads/2013/07/20130628-Dashboard-2012-
report1.pdf. (accessed on 1 June 2014).
Eshete, G., Sonder, K. and Heedge, R. (2006). Report on the feasibility study of a
national program for domestic biogas in Ethiopia SNV, Ethiopia. May 2006.
Frost, P. and Gilkinson, S. (2011). Interim Technical Report. 27 Months
performance summary for anaerobic digestion of dairy cow slurry at Afbi
Hillsborough. June 2011.
Gautam, R., Baral, S. and Heart, S. (2009). Biogas as a sustainable energy source
in Nepal: present status and future challenges. Renewable and Sustainable
Energy Reviews, 13, 248–252.
Geels, F.W. (2002). Technological transitions as evolutionary reconfiguration
processes: a multi-level perspective and a case-study. Research Policy, 31(8/9),
1257–1274.
Geels, F.W. and Schot, J. (2007). Typology of sociotechnical transition pathways.
Research Policy, 36, 399–417.
Ghimire, P.C. (2013). SNV supported domestic biogas programs in Asia and
Africa. Renewable Energy, 49, 90-94.
wavuya, S. ., Abele, S., Barfuss, ., eller, . and u ller, . (2 2). Household
energy economics in rural Ethiopia: a cost-benefit analysis of biogas energy.
Renewable Energy, 48, 202–9.
Heegde, F. (2010). Domestic biogas plants. Sizes and dimensions. SNV.

48
Heegde, F. and Sonder, K. (2007). Domestic biogas in Africa: a first assessment of
the potential and need (Draft/Discussion Paper). Biogas for Better Life: An
African Initiative, May 2007.
Hivos (2013). Data on Africa biogas partnership programme.
http://sites.google.com/site/biogas4all/ (accessed 1.06.14)
Katuwal, K. and Bohara, A.K. (2009). Biogas: A promising renewable technology
and its impact on rural households in Nepal. Renewable and Sustainable Energy
Reviews, 13(9), 2668–2674.
Kaygusuz, K. (2011). Energy services and energy poverty for sustainable rural
development. Renewable and Sustainable Energy Reviews 15, 936–947.
Kemp, R. and Rotmans, J. (2001. The Management of the Co-Evolution of
Technical, Environmental and Social Systems, paper for international conference
Towards Environmental Innovation Systems, 27-29 Sept, 2001, Garmisch
Partenkirchen, Germany.
Kes, A. and Swaminathan, H. (2006). Gender and time poverty in Sub-Saharan
Africa. World Bank Working Paper No. 73, Washington DC (2006), pp. 13–38
(Retrieved 24th March 2012).
Laramee, J. and Davis, J. (2013). Economic and environmental impacts of
domestic bio-digesters: Evidence from Arusha, Tanzania. Energy for Sustainable
Development, 17(3), 296–304.
Mendis, M.S. and Nes, W. van (1999). The Nepal Biogas Support Program:
Elements for Success in Rural Household Energy Supply. Ministry of Foreign
Affairs, The Netherlands.
Mshandete A. and Parawira W. (2009). Biogas technology research in selected
sub-Saharan African countries – a review. African Journal of Biotechnology, 8,
116-125.
49
Mwirigi, J., Balana, B., Mugisha, J., Walekhwa, P., Melamu, R., Nakami, S. and
Makenzi, P. (2014). Socio-economic hurdles to widespread adoption of small-
scale biogas digesters in Sub-Saharan Africa: A review. Biomass and Bioenergy
xxx, 1-9.
Modi, V., McDade, S., Lallement, D. and Saghir J. (2005). Energy services for
millennium development goals, achieving MGDs. Millennium project, UNDP,
World Bank and ESMAP;2005.
Nes, W. van and Nhete, T.D. (2007). Biogas for a better life e An African
initiatives. Renewable Energy World; July-August 2007:84e7.
NBP (2008). Biogasfor Better Life.Ethiopia, Addis Ababa, Ethiopia Rural Energy.
NDBMP (2008). Biogas Users’ Survey 2 8 under National Domestic Biogas and
Manure Programme. Final Report. Infrastructure Development Company
Limited (IDCOL).
Okello, C., Pindozzi, S., Faugno, S. and Boccia, L. (2013). Development of
bioenergy technologies in Uganda: A review of progress. Renewable and
Sustainable Energy Reviews, 18, 55–63.
Pedrasa, M.A.A., Spooner, T.D. and MacGill, I.F. (2010). Coordinated Scheduling of
Residential Distributed Energy Resources to Optimize Smart Home Energy
Services. Smart grid, 1(2), 134 – 143.
Plöchl, M. and Heiermann, M. (2006). Biogas farming in central and northern
Europe: a strategy for developing countries? Invited overview. Agriculture
Engineering International, 8 (8), 1-15.
Rajendran, K., Aslanzadeh, S., Taherzadeh, M.J., 2012. Household biogas digesters
– a review. Energies 5 (8), 2911–2942.
Renwick, M., Subedi, P.S. and Hutton, G. (2007). Biogas for better life: an African
initiative. A cost-benefit analysis of national and regional integrated biogas and
50
sanitation programs in Sub-Saharan Africa Winrock International, Little Rock,
Arkansas, p. 68.
Rip, A. and Kemp, R. ( 998). ‘Technological Change’, in: Rayner, S., and E.L.
Malone (eds): Human Choice and Climate Change, Columbus, Ohio: Battelle
Press, 1998. Volume 2, Chapter 6, 327-399.
Romijn, H., Raven, R. and Visser, I. de (2010). Biomass energy experiments in
rural India: Insights from learning-based development approaches and lessons
for Strategic Niche Management. Environmental Science & Policy, 1(4), 326–338.
SNV (2009). Building viable domestic biogas programmes: success factors in
sector development.
SNV (2014). Senegal biogas programme closes. Available at
http://www.snvworld.org/en/regions/africa/news/senegal-biogas-
programme-closes (accessed on 15 June 2014).
Surendra K.C., Takara, D., Hashimoto A.G. and Khanal, S.K. (2014). Biogas as a
sustainable energy source for developing countries: Opportunities and
challenges. Renewable and Sustainable Energy Reviews, 31, 846–859.
Ward, A.J., Hobbs, P.J., Holliman, P.J. and Jones, D.L. (2008). Optimisation of the
anaerobic digestion of agricultural resources, Bioresource Technology, 88(17)
7928–7940.
White, A.J., Kirk, D.W. and Graydon, J.W. (2011). Analysis of small-scale biogas
utilization systems on Ontario cattle farms. Renewable Energy, 36(3), 1019–
1025.
Zuzhang, X. and Wilson, E. (2013). Briefing, China’s domestic biogas sector must
adjust to changing conditions. IIED, London, 15 March 2013.
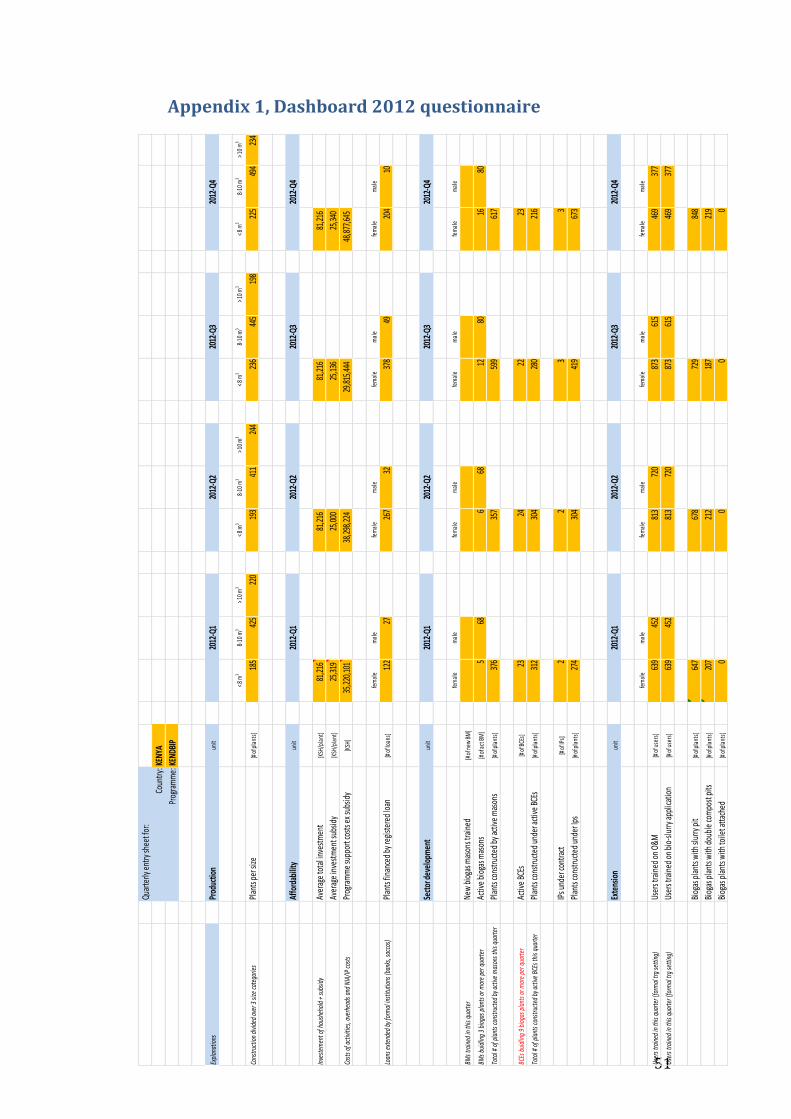
51
Appendix 1, Dashboard 2012 questionnaire
Quar
terly
ent
ry sh
eet f
or:
Coun
try:K
ENYA
Prog
ram
me:
KEND
BIP
Expl
anat
ions
Prod
uctio
nun
it
< 8 m
38-
10 m
3> 1
0 m
3< 8
m3
8-10
m3
> 10
m3
< 8 m
38-
10 m
3> 1
0 m
3< 8
m3
8-10
m3
> 10
m3
Cons
truct
ion
divid
ed o
ver 3
size
cate
gorie
sPl
ants
per
size
[# o
f pla
nts]
185
425
220
193
411
244
236
445
198
225
494
234
Affo
rdab
ility
unit
Inve
stem
ent o
f hou
sheh
old
+ su
bsid
yAv
erag
e to
tal i
nves
tmen
t[K
SH/p
lant
]81
,216
81
,216
81
,216
81
,216
Aver
age
inve
stm
ent s
ubsid
y [K
SH/p
lant
]25
,319
25
,000
25
,136
25
,340
Cost
s of a
ctivi
ties,
over
head
s and
NIA
/IP co
sts
Prog
ram
me
supp
ort c
osts
ex s
ubsid
y[K
SH]
35,2
20,1
01
38
,298
,224
29
,815
,444
48
,877
,645
fem
ale
mal
efe
mal
em
ale
fem
ale
mal
efe
mal
em
ale
Loan
s ext
ende
d by
form
al in
stitu
tions
(ban
ks, s
acco
s)Pl
ants
fina
nced
by r
egist
ered
loan
[# o
f loa
ns]
122
2726
732
378
4920
410
Sect
or d
evel
opm
ent
unit
fem
ale
mal
efe
mal
em
ale
fem
ale
mal
efe
mal
em
ale
BMs t
rain
ed in
this
quar
ter
New
bio
gas m
ason
s tra
ined
[# o
f new
BM
]
BMs b
uidl
ing
3 bi
ogas
pla
nts o
r mor
e pe
r qua
rter
Activ
e bi
ogas
mas
ons
[# o
f act
BM
]5
686
6812
8016
80
Tota
l # o
f pla
nts c
onst
ruct
ed b
y act
ive m
ason
s thi
s qua
rter
Plan
ts co
nstru
cted
by a
ctiv
e m
ason
s[#
of p
lant
s]37
635
759
961
7
BCEs
bui
dlin
g 9
biog
as p
lant
s or m
ore
per q
uarte
rAc
tive
BCEs
[# o
f BCE
s]23
2422
23
Tota
l # o
f pla
nts c
onst
ruct
ed b
y act
ive B
CEs t
his q
uarte
rPl
ants
cons
truct
ed u
nder
activ
e BC
Es[#
of p
lant
s]31
230
428
021
6
IPs u
nder
cont
ract
[# o
f IPs
]2
23
3
Plan
ts co
nstru
cted
und
er Ip
s[#
of p
lant
s]27
430
441
967
3
Exte
nsio
nun
it
fem
ale
mal
efe
mal
em
ale
fem
ale
mal
efe
mal
em
ale
User
s tra
ined
in th
is qu
arte
r (fo
rmal
trg
setti
ng)
User
s tra
ined
on
O&M
[# o
f use
rs]
639
452
813
720
873
615
469
377
User
s tra
ined
in th
is qu
arte
r (fo
rmal
trg
setti
ng)
User
s tra
ined
on
bio-
slurry
appl
icatio
n[#
of u
sers
]63
945
281
372
087
361
546
937
7
Biog
as p
lant
s with
slur
ry p
it[#
of p
lant
s]64
767
872
984
8
Biog
as p
lant
s with
dou
ble
com
post
pits
[# o
f pla
nts]
207
212
187
219
Biog
as p
lant
s with
toile
t atta
ched
[# o
f pla
nts]
00
00
2012
-Q3
2012
-Q3
2012
-Q3
2012
-Q3
2012
-Q4
2012
-Q4
2012
-Q4
2012
-Q4
2012
-Q1
2012
-Q1
2012
-Q1
2012
-Q1
2012
-Q2
2012
-Q2
2012
-Q2
2012
-Q2