Embed Size (px)
Citation preview
i
An assessment of the factors affecting food choices and
their corresponding association with overweight and
obesity among school going children in urban Guwahati
in the age group of 13-18 years
Dr. Siddhartha Dutta
Dissertation submitted in partial fulfillment of the
requirements for the award of the degree of
Master of Public Health
Achutha Menon Centre for Health Science Studies
Sree Chitra Tirunal Institute for Medical Sciences and Technology
Thiruvananthapuram, Kerala.
October 2011
ii
Acknowledgement
In the beginning I would thank my guide Dr. P. Sankara Sarma for his guidance and
unconditional support from the inception of this dissertation work to its present form. He
has been inspirational for students like me.
I thank Dr. K. R. Thankappan, Dr. Sundari Ravindran, Dr. V. Raman Kutty, Dr.
Raviprasad Varma, Dr. Mala Ramanathan, Dr. Biju Soman and all the faculty members
and visiting faculty for making these two years of learning enriched and rewarding.
My heartfelt thanks to all the students who participated in this study and also to the head
of the institutions who allowed me to conduct the survey. Without their contribution and
support this piece of work would not have seen the light of day.
I will forever be indebted to my parents for their sacrifice and encouragement in my
choice of career in public health.
My stay in Trivandrum was memorable thanks to the terrific company of my classmates.
I shall always treasure the things that I learnt from each one of them. My salutes to the
spirit of this batch MPH 2010.
Finally I thank all those who have helped me directly or indirectly in these two years.

iii
DEDICATION
This piece of work is dedicated to the Almighty God and my Parents and sister.
iv
Certificate
I hereby certify that the work embodied in this dissertation entitled “An
assessment of the factors affecting food choices and their corresponding
association with overweight and obesity among school going children in
urban Guwahati in the age group of 13-18 year.” is a bona fide record of
original research work undertaken by Dr. Siddhartha Dutta, in partial
fulfillment of the requirements for the award of the degree of ‗Master of
Public Health‘ under my guidance and supervision.
Dr. P. Sankara Sarma, Phd;
Professor,
Achutha Menon Centre for Health Science Studies,
Sree Chitra Tirunal Institute for Medical Sciences and Technology,
Thiruvananthapuram, Kerala.
October 2011.
v
Declaration
I hereby declare that the work embodied in this dissertation entitled “An
assessment of the factors affecting food choices and their corresponding
association with overweight and obesity among school going children in
urban Guwahati in the age group of 13-18 year.” is the result of original
research and has not been submitted for any degree in any other university or
institution.
Dr. Siddhartha Dutta, MPH-2010,
Achutha Menon Centre for Health Science Studies,
Sree Chitra Tirunal Institute for Medical Sciences and Technology,
Thiruvananthapuram, Kerala.
October 2011.
vi
CONTENTS
LIST OF TABLES AND FIGURES
ABSTRACT
CHAPTERS Page No.
Chapter 1 INTRODUCTION..................................................................1
Chapter 2 LITERATURE REVIEW...................................................... 3
2.1 Nutrition transition.................................................................................. 3
2.1.1 The change in developing countries...................................................5
2.1.2 The global scenario of sugar and edible oil........................................6
2.2 Trends in energy intake.......................................................................... 8
2.2.1 Snack food consumption................................................................... 9
2.3 Overweight prevalence and trends among adolescents.........................10
2.4 Mechanism of obesity development..................................................... 11
2.5 The medical risks of obesity................................................................. 12
2.6 Influences on adolescent‘s food consumption...................................... 14
2.7 Common eating behaviours among adolescents................................... 14
2.7.1 Adolescent‘s perceptions on food and eating.................................... 15
2.8 The scenario in India............................................................................16
2.8.1 The stature of the problem................................................................ 16
2.8.2 Prevalence of overweight and obesity among adolescents of India...17
2.9 The scenario in Assam and North-eastern region of India.................18
2.10 Rationale for the present study..........................................................18
2.11 Objectives..........................................................................................19
vii
Chapter 3 METHODOLOGY........................................................................ 20
3.1 Study design........................................................................................20
3.2 Study setting........................................................................................20
3.3 Sample size..........................................................................................20
3.4 Sample selection procedure.................................................................20
3.4.1 Selection of schools............................................................................21
3.4.2 Selection of classes/sections...............................................................21
3.4.3 Selection of study participants............................................................21
3.5 Data collection techniques....................................................................21
3.6 Anthropometric measurements.............................................................22
3.6.1 Procedures for measuring height.........................................................22
3.6.2 Procedures for measuring weight........................................................22
3.7 Data entry..............................................................................................22
3.8 Data analysis and statistical methods....................................................23
3.9 Variables used in the study................................................................... 23
3.9.1 Dependent variables............................................................................23
3.9.2 Independent variables......................................................................... 24
3.10 Ethical considerations......................................................................... 25
Chapter 4 RESULTS.............................................................................................27
4.1 Sample description...........................................................................28
4.2 Dietary behaviours...........................................................................28
4.3 Junk food consumption....................................................................30
4.4 Vegetable and fruit consumption.....................................................30
4.5 Family influences............................................................................31
4.6 Peer influences................................................................................32
viii
4.7 Availability and accessibility of vegetables and fruits.....................34
4.8 Perceived weight status....................................................................34
4.9 Knowledge ......................................................................................34
4.10 Body mass index..............................................................................35
4.11 Bivariate analysis.............................................................................36
4.12 Multivariate analysis........................................................................40
Chapter 5 DISCUSSION AND CONCLUSION.........................................43
5.1 Discussion...........................................................................................43
5.1.1 Dietary behaviours..............................................................................43
5.1.2 Family and peer influences.................................................................45
5.1.3 Availability and accessibility...............................................................45
5.1.4 Knowledge..........................................................................................46
5.1.5 Overweight and obesity......................................................................46
5.1.6 Junk food consumption.......................................................................46
5.1.7 Vegetable and fruit consumption........................................................47
5.2 Strength of the study............................................................................48
5.3 Limitations of the study...................................................................... 48
5.4 Conclusion...........................................................................................49
5.5 Recommendations............................................................................... 50
REFERENCES…………………………………………………………………………51
APPENDICES
Appendix I Informed Consent
Appendix II Assent
Appendix III Questionnaire
ix
LIST OF TABLES AND FIGURES
TABLE PAGE NO.
4.1 Sample characteristics by age and sex…………………………………….28
4.2 Dietary behaviours of study population………………………………….29
4.3 Junk food consumption……………………………………………………31
4.4 Vegetable and fruit consumption………………………………………….31
4.5 Family influences………………………………………………………….32
4.6 Peer views…………………………………………………………………33
4.7 Availability and accessibility………………………………………………34
4.8 Knowledge………………………………………………………………….35
4.9 Body mass index classification…………………………………………….35
4.10 Bivariate analysis of junk food consumption with other variables………37
4.11 Bivariate analysis of vegetable and fruit
consumption with other variables………………………………………….38
4.12 Multivariate analysis for junk food consumption…………………………40
4.13 Multivariate analysis for vegetable and fruit consumption……………….41
FIGURE PAGE NO.
1 Nutrition transition…………………………………………………………5
2 Conceptual framework……………………………………………………..26
x
ABSTRACT
An assessment of the factors affecting food choices and their
corresponding association with overweight and obesity among school
going children in urban Guwahati in the age group of 13-18 year.
Background:
There is an increased inclination to replace traditional meals with energy-dense
imbalanced foods. Urban residence has been positively associated with frequency of
intake of energy-dense foods in adolescents. As many healthy (or unhealthy) life-long
practices begin in adolescence, it is important to study the dietary behaviour and the
factors influencing food consumption in this age group.
Methods:
A cross-sectional and institutional study, adopting a multistage stratified cluster sampling
procedure, was carried out on adolescents 13 to 18 years of age of both sexes from urban
Guwahati, India.
Results:
Junk food consumption was highly associated with adolescents having lunch in school
canteens, hotels and bakers (adjusted OR=2.828; 95% CI: 1.941-4.122), not having
dinner with parents (adjusted OR=1.738; 95% CI: 1.244-2.429), eating dinner out
(adjusted OR=1.906; 95%CI: 1.312-2.769) and low consumption of vegetables and fruits
(adjusted OR=1.454; 95% CI: 1.039-2.037). Adolescents from government schools are
less likely to consume vegetables and fruits (adjusted OR=0.379;95%CI:0.256-
0.497).Those who brought tiffin to school are more likely to consume moderate amounts
of vegetables and fruits (adjusted OR=1.557;95%CI:1.09-2.223). Dinner with parents
results in more consumption of vegetables and fruits (adjusted OR=1.342;95%CI:1.014-
1.775). Those adolescents whose parents never eat vegetables and fruits in front of them
are also less likely to eat the same (adjustedOR=0.513;95%CI:0.384-0.685) and if
vegetables and fruits are not available at home than consumption is less (adjusted
OR=0.438;95%CI:0.282-0.681). The prevalence of overweight is 16.9%(15.8% among
boys and 17.9% among girls).
Conclusions:
Adolescent‘s dietary behavior is associated with various personal and environmental
factors.
1
CHAPTER 1
INTRODUCTION
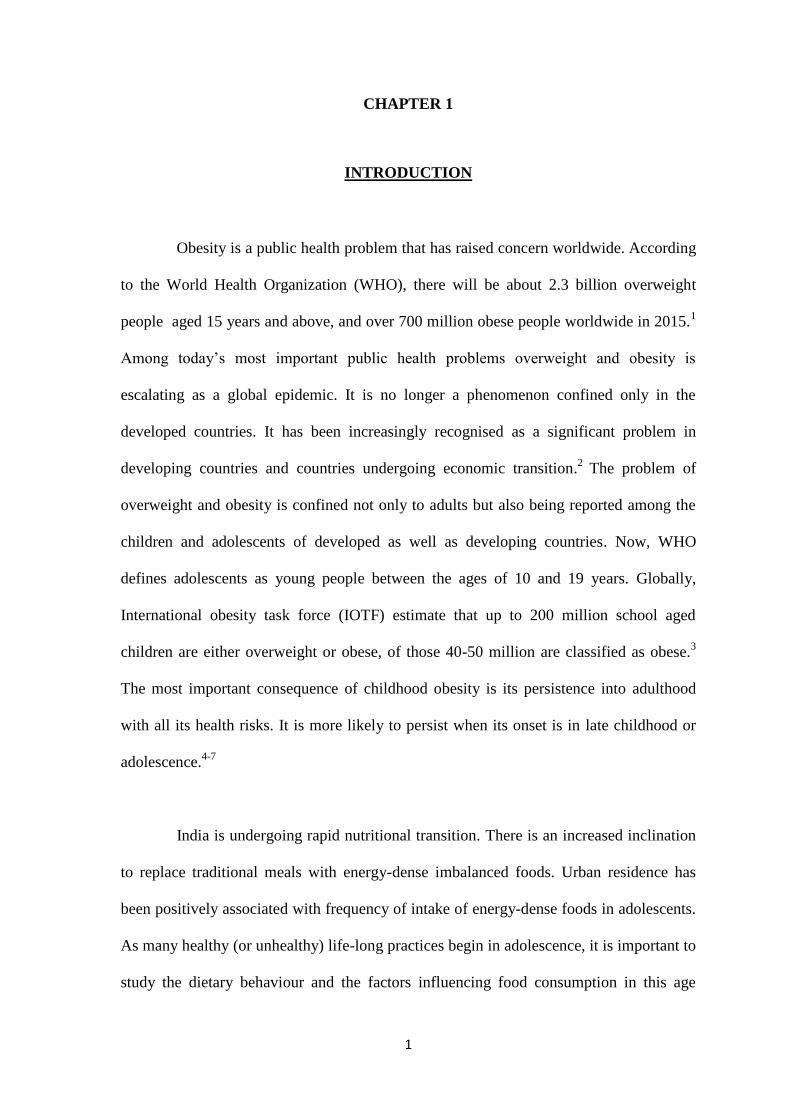
Obesity is a public health problem that has raised concern worldwide. According
to the World Health Organization (WHO), there will be about 2.3 billion overweight
people aged 15 years and above, and over 700 million obese people worldwide in 2015.1
Among today‘s most important public health problems overweight and obesity is
escalating as a global epidemic. It is no longer a phenomenon confined only in the
developed countries. It has been increasingly recognised as a significant problem in
developing countries and countries undergoing economic transition.2
The problem of
overweight and obesity is confined not only to adults but also being reported among the
children and adolescents of developed as well as developing countries. Now, WHO
defines adolescents as young people between the ages of 10 and 19 years. Globally,
International obesity task force (IOTF) estimate that up to 200 million school aged
children are either overweight or obese, of those 40-50 million are classified as obese.3
The most important consequence of childhood obesity is its persistence into adulthood
with all its health risks. It is more likely to persist when its onset is in late childhood or
adolescence.4-7
India is undergoing rapid nutritional transition. There is an increased inclination
to replace traditional meals with energy-dense imbalanced foods. Urban residence has
been positively associated with frequency of intake of energy-dense foods in adolescents.
As many healthy (or unhealthy) life-long practices begin in adolescence, it is important to
study the dietary behaviour and the factors influencing food consumption in this age
2
group. Dietary habits play an important role in the development of several chronic
diseases that are the largest causes of morbidity and mortality in the world.8
In a
prospective study of low and high risk children it was found that the high risk group, who
gained more weight during the 12 months study had altered dietary behavioural patterns,
especially with increased consumption of fatty foods or soft drinks.9
Eating a lot of fast
food and not eating a lot of fruits, vegetables and whole grains have also been linked with
obesity risk.10,11
A review reported that adolescent‘s eating behaviour is a function of individual
(i.e. attitudes, beliefs, knowledge, food preferences, dieting, etc.) and environmental
influences (i.e. social environmental, macro-system and physical environmental).12
In
particular, environmental influences on adolescent‘s eating behaviours and food choices
include family members, teachers, peers, marketing and advertising, as well as
accessibility and availability of foods.
Factors influencing the food preferences of
children and adolescents have received and continue to receive increasing research
interest.13,14,15
A fundamental step in the prevention and control of obesity is the
identification and understanding of factors contributing to the rapid increase of obesity.
There are evidences that children and adolescents of urban families are increasingly
becoming overweight/obese in recent times, possibly because of the change in dietary
habits. Relevant research which aggregates food into dietary patterns and investigates the
factors which influence food choices among adolescents in India is minimal. Moreover
no such systemic study in Assam could be found. Controversies and gaps in
understanding the role of dietary composition in subsequent weight gain and diet in the
aetiology of overweight and obesity remains.
16
3
CHAPTER 2
LITERATURE REVIEW
Over the past two decades, evidences have shown that the structure of dietary
intakes and the prevalence of obesity around the developing world have been changing at
an alarming pace.17
Although initially these shifts were felt to be limited to higher-income
urban populations, it is increasingly clear that these are much broader trends affecting all
segments of society. These changes have actually occurred at a very rapid pace both in
the low- and moderate-income countries. Large shifts have occurred in diet particularly in
the last one or two decades of the 20th century. Modern societies seem to be converging
on a diet high in saturated fats, sugar and refined foods but low in fibre - often termed the
‗Western diet‘. Along with it there is this shift toward increased obesity and
noncommunicable diseases (NCDs) which in turn is further aggravated by lifestyles
characterised by lower levels of activity.18
2.1 NUTRITION TRANSITION
Now nutrition transition has been described to pass through five patterns or
stages.19
Starting from the time of Palaeolithic man where the diet included mostly plants
and low fat animals. The people were robust and lean with little nutritional deficiencies.
Basically people back then were hunters and gatherers. The demographic profile was that
of high fertility and high mortality. This stage in nutrition is known as the stage of
collecting food. Then there was this stage of famine where diet was predominated by
4
cereals and was less varied. Women and children suffered most in this stage due to low
fat intake and resultant nutritional deficiencies. Economy was that of agriculture and
animal husbandry. There was high natural fertility, low life expectancy and high infant
and maternal mortality.20
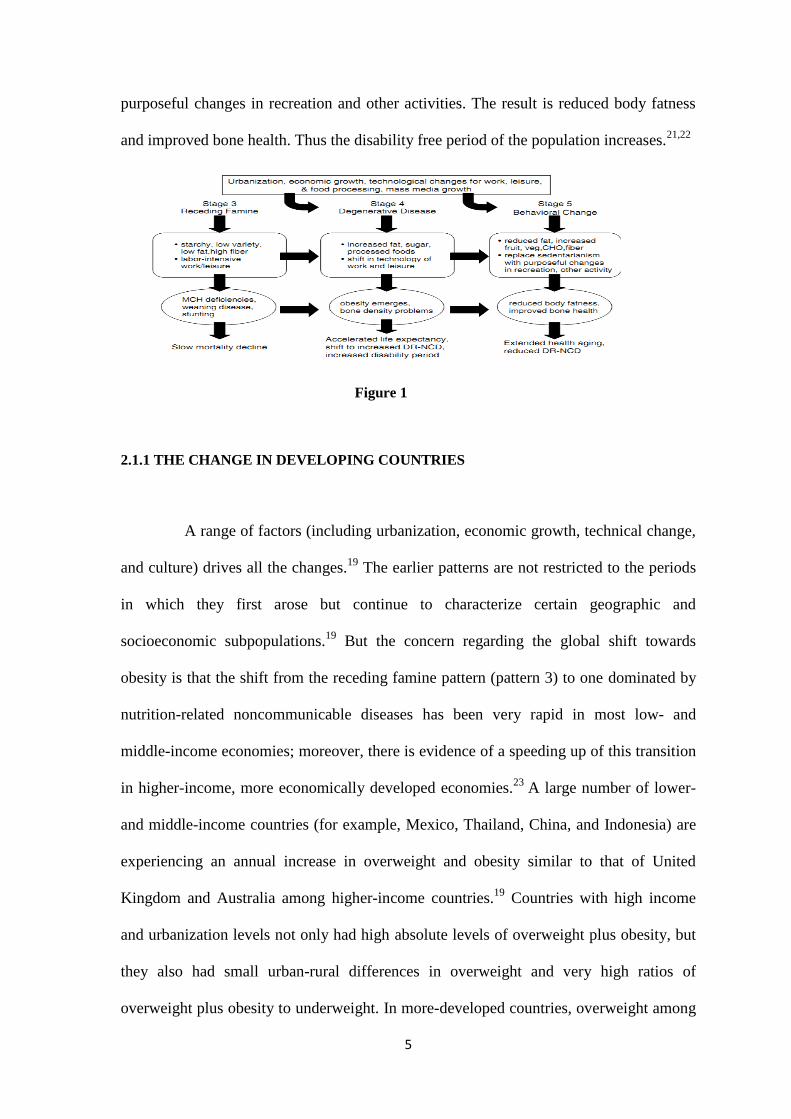
The last three stages of the nutrition transition are of more importance in the
present context as they are the ones represented by most of the global population
today.21,22
(figure 1). In stage 3, famine begins to recede as income rises; also called the
stage of receding famine. Diet consists of fewer starchy staples with more fruits,
vegetables and animal protein. However, low variety of diet continues to affect this stage.
There is continued maternal and child health problems, although many deficiencies
disappeared, weaning diseases (diarrhoea, retarded growth) emerged. Mortality declines
slowly and then rapidly, fertility is static and then declines; there is cumulative population
growth which ultimately explodes. In stage 4, changes in diet and activity patterns lead
to the emergence of new diseases and increases disability. This is the stage of
degenerative disease. Diet consists of more fat (especially from animal products), sugar,
and processed foods; less fibre. There is shift in technology of work and leisure. There
are fewer jobs with heavy physical activity, the service sector has become more and more
mechanized, household technology revolution is ever growing; hence there is reduced
opportunity for physical activity needed to compensate the energy dense diet which
people are shifting to. Here comes the problem of obesity and bone density. Accelerated
life expectancy shifts the epidemiologic transition to increased nutrition related
noncommunicable diseases and thus increased disability period. In stage 5, behavioural
change begins to reverse the negative tendencies of the preceding patterns and enable a
process of ―successful aging‖.18
There is reduced fat and refined carbohydrate intake,
increased fruit, vegetable and whole grain consumption. Sedentarianism is replaced by
5
purposeful changes in recreation and other activities. The result is reduced body fatness
and improved bone health. Thus the disability free period of the population increases.21,22
Figure 1
2.1.1 THE CHANGE IN DEVELOPING COUNTRIES
A range of factors (including urbanization, economic growth, technical change,
and culture) drives all the changes.19
The earlier patterns are not restricted to the periods
in which they first arose but continue to characterize certain geographic and
socioeconomic subpopulations.19
But the concern regarding the global shift towards
obesity is that the shift from the receding famine pattern (pattern 3) to one dominated by
nutrition-related noncommunicable diseases has been very rapid in most low- and
middle-income economies; moreover, there is evidence of a speeding up of this transition
in higher-income, more economically developed economies.23
A large number of lower-
and middle-income countries (for example, Mexico, Thailand, China, and Indonesia) are
experiencing an annual increase in overweight and obesity similar to that of United
Kingdom and Australia among higher-income countries.19
Countries with high income
and urbanization levels not only had high absolute levels of overweight plus obesity, but
they also had small urban-rural differences in overweight and very high ratios of
overweight plus obesity to underweight. In more-developed countries, overweight among
6
women with a low socioeconomic status was high in both rural (38 percent) and urban
(51 percent) settings. Even many poor countries—where underweight persists as a
significant problem—had fairly high levels of overweight in rural area.24
2.1.2 THE GLOBAL SCENARIO OF SUGAR AND EDIBLE OIL
Globally, our diet is becoming increasingly energy-dense and sweeter. At the
same time, high-fibre foods are being replaced by processed versions. There is enormous
variability in eating patterns globally, but the broad themes seem to be retained in most
countries. Sugar became the predominant sweetener most likely in the 17th
or 18th
century
when the New World began producing large quantities of sugar at reduced prices.25
The
increase in consumption of soft drinks and sugared fruit drinks is a critical element in the
shift in diet.26,27,28 Recently, several health concerns have been consistently voiced. First,
the high consumption of sugar-sweetened beverages has been linked with increased
energy intake and obesity. Second, cancer researchers have voiced concerns over the
reduced intake of more complex carbohydrates and high-fibre foods and replacement of
these food sources with refined carbohydrates.25
Third, milk has been increasingly
substituted with soft drinks. It has been observed that calories from fluids are less sating
than those from solid foods and often lead to overconsumption.29
In the United States, between 1977 and 1996, urbanization increased from 74
percent to 76 percent, while Gross national product per capita went from 19,930 to
28,350 US Dollars. 25
During this time, there was a remarkable increase of 83 kcal of
caloric sweetener consumed per day for all persons in the United States 2 years of age
and older. Now caloric sweetener consists of sugars, syrups, caramel, golden syrup,
maple syrup, corn syrup, artificial and natural honey, maltose, glucose, sugar
7
confectionery and lactose. Despite fluctuations in production, India‘s sugar consumption
has increased at an annual rate of 3.5 percent over the past decade, with a decline in
consumption growth during the period. Driven by the continued switching from ―gur‖ to
sugar, rising incomes and growing population, India‘s sugar consumption is projected to
increase at a high rate of 2.5 to 3 percent per annum (The Financial Express, dated
August 6th
, 2010). Although ―gur‖ and ―khandsari‖ are still the main sugar products
consumed in rural areas, demand for white sugar is expected to continue to increase both
in absolute and per capita terms. Moreover, the growth of sugar demand by food
industries and other non-household users, estimated to account for about 60 percent of
total consumption, could provide additional impetus. As income per capita and the
proportion of the population residing in urban areas increased, so did sugar intake.
Urbanization has correlated highly in the developing world with access to processed
foods higher in sugar.18
In many developing countries, dietary change has begun with major increases in
domestic production and imports of oilseeds and vegetable oils. For instance, between
1991 and 1996-97, global production of vegetable fats and oils rose from 60 to 71 million
metric tons. 18
Although the increase in edible vegetable fat intake has affected both rich
and poor countries equally, the net impact is relatively much greater on low–income
countries. The Indian edible oil market is the world‘s fourth-largest after the USA, China
and Brazil. A growing population, increasing rate of consumption and increasing per
capita income are accelerating the demand for edible oil in India. India is a leading player
in edible oils, being the world‘s largest importer (ahead of the EU and China) and the
world‘s third-largest consumer (after China and the EU). Each year, India consumes over
10 million tonnes of edible oils. Edible oils have a high penetration of 90 percent in India.
The Indian edible oil industry is expected to grow at a rate of 6 percent annually over the
8
next five years, said ‗Rabo India‘ in its latest research report (Business Standard, dated
June 5th
, 2011).
2.2 TRENDS IN ENERGY INTAKE
Take away food (available in fast food places, restaurants and bakeries)
contributes considerably to daily energy intake and accounts for roughly one-third of
energy intake among certain subpopulations, particularly young adult males.30,31
Fast
food consumption has been associated with adverse health outcomes including increased
risk of excess weight, body fatness, poor dietary quality, and insulin resistance/diabetes.32
Mechanisms for the direct contribution of fast food intake to the development of diabetes
and other obesity related co-morbidities have included low unsaturated to saturated fat
ratio, greater portion sizes, and lower fiber content of fast food.33
Increased consumption
of food prepared outside the home has occurred concurrently with rapid weight gain.
Many studies, some small in scale, have shown positive associations between the
frequency of fast food consumption and body fatness, weight gain, overweight or obesity
and total energy intake among both adolescents and adults.34
Over the past 20 years, evidences points out that the structure of dietary intakes
and the prevalence of obesity among children around the world have been changing at an
increasingly rapid pace.17 Most available evidence, especially in the area of dietary
behaviour, comes from the United States and other higher-income countries. Among the
prominent trends in these settings are increased snacking and away from home
consumption and a shift toward more fast food and calorically sweetened beverages.35
There are concomitant increases in energy intake and a higher percentage of calories from
energy-dense nutrient-poor foods and snacks eaten at greater frequency throughout the
9
day. Consumption of soft drinks, other sweetened beverages and fast food has increased
dramatically for adolescents.36
All these constitutes the category of foods called as „ Junk
food‟. Junk food is an informal term applied to some foods that are perceived to have
little or no nutritional value (i.e. containing "empty calories"); to products with nutritional
value, but also have ingredients considered unhealthy when regularly eaten; or to those
considered unhealthy to consume at all. The term was coined by Michael Jacobson,
director of the Center for Science in the Public Interest, in 1972.
Although availability and consumption of fruits and vegetables has been
increasing since 1970 the average number of servings per day remains far below the
recommended levels. As children moved from the third to eighth grade, fruit and
vegetable consumption decreased by 41percent and 25 percent, respectively, whereas soft
drink consumption more than tripled. Concomitant decreases in milk and fruit juice
intake were also observed. 37
2.2.1 SNACK FOOD CONSUMPTION
In a comparative study on the dietary behaviour done among the children and
adolescents of United States, Philippines, Russia and China it was found that children in
Philippines and the United States consumed the most calories from foods prepared away
from home.35
The Philippines‘ youth consumed nearly 40% of total calories from foods
prepared away from home. Snack foods were predominantly prepared away from home
(81.6 percent in 2002 to 90.3 percent in 1998). The foods prepared away from home and
consumed as snacks were typically small rolls and soft drinks purchased at small stores or
bakeries, whereas the away from home foods consumed as meals more typically came
from street vendors or small cafeterias and included rice and vegetable dishes and fried
10
foods such as egg rolls. In the United States, the percentage of calories consumed away
from home increased significantly from 1977 to 1996, such that by 1996, more than one-
third of calories were from away from home sources. By contrast, in 2003, Russian youth
consumed only 15 percent of total calories, and in 2003, 32 percent of snack calories,
away from home. The prevalence of snacking is much lower in China, with only 15.3
percent and 11.8 percent of Chinese youth reporting consuming any food as a snack in
1991 and 2000, respectively.35
2.3 OVERWEIGHT PREVALENCE AND TRENDS AMONG ADOLESCENTS
Consequently if we look at the increase in overweight prevalence among the
adolescents we see that in Brazil it increased from 4.2 to 14.3 percent from 1974-97, in
China from 6.4 to 7.7 percent between 191-97 and in USA it rose from 15.4 to 25.6
percent in the period from 1971-94.18
Now these findings were from nationally
representative data and overweight was defined as per the sex-age-specific body mass
index (BMI) cut-offs recommended by the International Obesity Task Force (IOTF).
Although there is lack of studies from India which looks into the prevalence of
junk food (ready-to-eat convenience foods containing high levels of saturated fats, salt,
or sugar, and little or no fruit, vegetables or dietary fibre) consumption among
adolescents, what can be of concern is the undeniable fact that there is an ever increasing
prevalence of obesity among the urban adolescents of our country. Obesity in children
appears to increase the risk of subsequent morbidity, whether or not obesity persists into
adulthood. Outcomes related to childhood obesity include hypertension, type 2 diabetes
mellitus, dyslipidaemia, left ventricular hypertrophy, non-alcoholic steatohepatitis,
obstructive sleep apnoea, and orthopaedic and psychosocial problems. 4-7
11
2.4 MECHANISM OF OBESITY DEVELOPMENT
In studies with adults, obesity was found to be a risk factor for cardiovascular
events and mortality.38
In adolescents, the accumulation of fat in the various parts of the
body has been identified as a risk factor for the occurrence of cardiovascular and
metabolic diseases. High consumption of soft drinks and a low intake of fruits and
vegetables are food indicators associated with greater abdominal fat accumulation among
adolescents.39
Biological factors and energy balance are impacted by behavioural factors
related to diet, activity and sedentary patterns, and other behaviours such as sleep,
substance use and weight control behaviours.40
Dietary choices and dietary patterns and
specific eating behaviours, such as skipping breakfast, consumption of sugar-sweetened
beverages affect caloric intake. Eating a lot of fast food and not eating a lot of fruits,
vegetables and whole grains have also been linked with obesity risk.41
Although the mechanism of obesity development is not fully understood, it is
confirmed that obesity occurs when energy intake exceeds energy expenditure. There are
multiple aetiologies for this imbalance, hence, and the rising prevalence of obesity cannot
be addressed by a single aetiology. Genetic factors influence the susceptibility of a given
child to an obesity-conducive environment. However, environmental factors, lifestyle
preferences, and cultural environment seem to play major roles in the rising prevalence of
obesity worldwide. In a small number of cases, childhood obesity is due to genes such as
leptin deficiency or medical causes such as hypothyroidism and growth hormone
deficiency or side effects due to drugs (for example steroids).42
Most of the time,
however, personal lifestyle choices and cultural environment significantly influence
obesity of adolescents. Over the last decades, food has become more affordable to larger
12
numbers of people as the price of food has decreased substantially relative to income and
the concept of 'food' has changed from a means of nourishment to a marker of lifestyle
and a source of pleasure. Clearly, increases in physical activity are not likely to offset an
energy rich, poor nutritive diet. It takes between 1–2 hours of extremely vigorous activity
to counteract a single large-sized (i.e., >=785 kcal) children's meal at a fast food
restaurant. Frequent consumption of such a diet can hardly be counteracted by the
average adolescent.43
It has been hypothesized that a steady decline in physical activity among all age
groups has heavily contributed to rising rates of obesity all around the world. Physical
activity strongly influenced weight gain in a study of monozygotic twins.44
Numerous
studies have shown that sedentary behaviours like watching television and playing
computer games are associated with increased prevalence of obesity. Furthermore,
parents report that they prefer having their children watch television at home rather than
play outside unattended because parents are then able to complete their chores while
keeping an eye on their children.45
In addition, increased proportions of children who are
being driven to school and low participation rates in sports and physical education,
particularly among adolescent girls, are also associated with increased obesity
prevalence.45
Since both parental and children's choices fashion these behaviours, it is
not surprising that overweight children tend to have overweight parents and are
themselves more likely to grow into overweight adults than normal weight children.
2.5 THE MEDICAL RISKS OF OBESITY
It is of major concern, given the consequences that are associated with
adolescent obesity both during adolescence and adult life which include increased
13
incidence of coronary artery diseases & hypertension, diabetes, obstructive sleep apnoea,
oesophageal reflux & gastric emptying disturbances, osteoarthritis & flat feet,
psychological dysfunction, self esteem & social isolation, dyslipidaemia and overall
increase in morbidity and mortality in later life.38
The most significant long-term
consequence of childhood and adolescent obesity is its persistence into adulthood, with
all the attendant health risks.
The long-term risk of type 2 diabetes increases significantly with increasing
weight. Obesity is an independent risk factor for cardio vascular disease, defined as
including coronary heart disease, myocardial infarction (MI), angina pectoris, congestive
heart failure (CHF), stroke, hypertension, and atrial fibrillation.38 A number of large-
scale, prospective studies have confirmed a significant association between obesity and
cancer. Body mass index was also significantly associated with higher rates of death due
to cancer of the oesophagus, colon and rectum, liver, gallbladder, pancreas, kidney,
breast, ovary, endometrium, non-Hodgkin lymphoma, and multiple myeloma.38
Obesity
is strongly associated with an increased risk of osteoarthritis of the knee. It has a major
impact on patient mobility, disability, lost productivity, and patients may become
disabled early in life. The pulmonary complications include obstructive sleep apnoea
characterized by upper airway obstruction that occurs as repetitive episodes during sleep.
Among the typical features of obstructive sleep apnoea are loud snoring, fragmented
sleep, repetitive hypoxemia/hypercapnia, daytime sleepiness, and cardiovascular
complications. An association between obesity and major depressive disorder (MDD) has
long been recognized although a causal association is uncertain. Interestingly, many
antidepressant drugs are associated with weight gain.38
14
2.6 INFLUENCES ON ADOLESCENT‟S FOOD CONSUMPTION
In Social Cognitive Theory, the principle of ―reciprocal determinism‖
postulates that behaviour, including dietary behaviour, is the result of environmental and
personal factors, and in turn it affects these factors in constant reciprocal relationships.46
People learn by observing others, with the environment, behaviour, and cognition all as
the chief factors in influencing a particular development. Family and peer influences
appear particularly promising influences on consumption of fruits, vegetables and junk
foods by children. On the other hand parental influence on children‘s food consumption is
a complex issue that appears to involve parental modelling, that is, whether parents eat
and enjoy certain foods in front of their child; parenting techniques like authoritative or
permissive; social influences like various forms of encouragement; and making foods
available and accessible. Again personal factors, that is, the child‘s knowledge, what a
child prefers, expects, believes and his/her self efficacy also largely determines the food
choices.46
2.7 COMMON EATING BEHAVIOURS AMONG ADOLESCENTS
The cognitive, physical, social, and lifestyle changes during adolescence can
create profound changes in their eating patterns. Teens as a group tend to snack, miss
meals, eat away from home, consume fast foods, and diet (especially among females)
more frequently than younger children. Snacking as already mentioned before constitutes
about one third of the daily total caloric intake among adolescents of developed countries.
Meal skipping is common among adolescents, especially during middle and late
adolescence. Breakfast is the most commonly skipped meal and is attributed to lack of
15
time, desire to sleep longer in the morning, lack of appetite, and dieting to lose weight.
Skipping breakfast may affect concentration, learning, and school performance.12
Dinner is the most frequently consumed meal among adolescents and it also
provides a larger proportion of intake of energy and key nutrients than any other meal or
snack. Only about one-third of United State‘s adolescents ate dinner with their family
nearly every day. Family meals are associated with better overall dietary quality among
children and adolescents. Increasing frequency of family dinner was associated with more
healthful dietary intake patterns, including more fruits and vegetables, less fried food and
soft drinks, less saturated and trans fats and more fibre and micronutrients from food.
During adolescence, teens spend less time with family and more time with friends.12
As teens become more independent, eating away from home increases. One-
third of all teen eating occasions occur outside the home. Majority of these eating out
occasions usually occurs in and around the school premises. On the other hand eating out
at fast food restaurants has direct bearing on the nutritional status of adolescents. Many
fast foods are high in fat and low in fibre and nutrients.12
In the United States dieting is a common and widespread practice among
adolescents, especially girls. In 1999, 59% of high school girls and 26% of high school
boys reported trying to lose weight during the 30 days preceding a national survey.
Almost 20% of girls had gone without eating for 24 hours or more to lose weight, 11%
had taken diet pills, and 8% had vomited or taken laxatives.12
2.7.1 ADOLESCENTS‟ PERCEPTIONS ON FOOD AND EATING
Adolescents report several key factors influencing their food choices and eating
behaviours, such as taste, hunger, convenience, availability, and parental and cultural
16
influences. Many adolescents feel that healthy eating is not a primary concern during the
teenage years and they feel that chronic diseases are connected with ―older people‖.12
2.8 THE SCENARIO IN INDIA
In the words of the 35th
President of the United States, John F. Kennedy,
―Children are the world‘s most valuable resource and its best hope for the future‖, it is
indeed true that the future is in the hands of the children. However, considering the
present scenario, according to a survey by the Food and Agriculture Organization of
United States (2006), on one side there is still prevalence of malnutrition and other
deficiency diseases like anaemia, vitamin A and iodine deficiency, improper
immunization and food insecurity, while on the other side overweight and obesity are
rampant among children in India. According to the WHO health report (2006) many low
and middle income countries are now facing a "double burden" of disease: while they
continue to deal with the problems of infectious disease and under-nutrition, at the same
time they are experiencing a rapid upsurge in chronic disease risk factors such as obesity
and overweight, particularly in urban settings.
2.8.1 THE STATURE OF THE PROBLEM
In India, approximately 19 percent (190 million) of the growing population
comprises school-aged children of whom 30 percent (48 million) currently reside in urban
India. A significant and increasing number of these children belong to middle and high
socio-economic groups.47
As a consequence of the socio-economic and demographic
transitions that are affecting developing countries such as India, it can be hypothesized
17
that the nutritional status of the children in middle and high-income groups could be
affected by the changes in dietary habits and lifestyle, leading to an increase in the
prevalence of overweight and obesity.
2.8.2 PREVALENCE OF OBESITY AND OVERWEIGHT AMONG ADOLESCENTS OF
INDIA
Although no study could be found which looked specifically into the
consumption of different food items and the factors influencing the consumption among
school going adolescents of India, there are several studies which found out the
prevalence of overweight and obesity among the adolescents of different cities and towns
of India. A study conducted among the affluent public school children in New Delhi,
revealed prevalence of overweight and obesity of about 25 percent and 7 percent,
respectively.48
Another study done in Delhi by Melissa H Stigler et al. reported a
combined overweight and obesity prevalence of 16.6 percent.49
Yet another study done
in Delhi by U Kapil et al. revealed the prevalence of overweight and obesity to be 13 and
9.3 percent respectively.50
Similarly, Subramanyam et al have reported that the
prevalence of overweight and obesity among the affluent adolescent school children in
Chennai, Tamil Nadu was about 15 percent.51
The results of studies among adolescents
from parts of Punjab, Maharashtra, Gujarat, Bangalore, Hyderabad and South India
revealed that the prevalence of overweight and obesity was high (11 percent to 29
percent). 52-56
18
2.9 THE SCENARIO IN ASSAM AND NORTH EASTEN REGION OF INDIA
No study could be traced which reported the prevalence of overweight or
obesity among adolescents from any part of Assam. The ―Sentinel Surveillance Systems
for Cardio vascular disease in Indian Industrial Populations‖ involving ten centres from
different parts of the country (survey period 2001-2003) studied the prevalence of
overweight and obesity among industrial employees and their family members aged 10-
69 years. Dibrugarh in Assam had the lowest prevalence of 0.5 percent. However the
study population consisted of low income groups. Another study done in Imphal,
Manipur among the school children of classes 8th
to 12th
reported the prevalence of
overweight and obesity to be 4.2 and 0.8 percent respectively.57
The reasons stated for
such low prevalence when compared with other parts of India were more traditional low
fat diet, less exposure to sedentary past times and greater time spent playing outdoors.
Nevertheless, Guwahati being the largest metropolis and also the trade and industrial hub
of north east India can be expected to be the obesity capital of north eastern region of
India. The ever increasing fast food restaurant joints and bakery shops in the city can be
thought of aggravating the overweight/obesity problems among the population of both
adults and adolescents to levels concerning the future.
2.10 RATIONALE FOR THE PRESENT STUDY
Available evidences show that one of the effective ways to prevent obesity in
the adult life may be prevention and management of childhood and adolescent overweight
and obesity. A fundamental step in the prevention and control of obesity is the
identification and understanding of factors contributing to the rapid increase of obesity
19
.There are evidences that children and adolescents of urban families are increasingly
becoming overweight/obese in recent times, possibly because of the change in dietary
habits. Relevant research which aggregates food into dietary patterns and investigates the
factors which influence food choices among adolescents in India is minimal. Moreover
no such systemic study in Assam could be found.
2.11 OBJECTIVES
1. To assess the dietary patterns of the school going adolescents in urban Guwahati.
2. To assess the factors that influence adolescent food choices and eating behavior.
3. To assess the association of overweight and obesity with the dietary pattern, if, any
among the adolescents.
20
CHAPTER 3
METHODOLOGY
3.1 Study design
Cross sectional survey with self administered questionnaire (pre tested) among
adolescents.
3.2 Study setting
Study was planned among adolescents studying in the schools of urban
Guwahati, Assam, India. All participants were drawn from both the government and
private owned schools of urban Guwahati. In total there are 52 private owned schools and
24 government schools in urban Guwahati (office of district education officer). Students
from the ‗madrasas‘ could not be included in the study.
3.3 Sample size
Based on previous studies we assuming the prevalence of bad eating behavior
to be 16% and to get 95% confidence interval (CI), with 20% relative precision the
sample size arrived at was 525. Twice this number, that is, a sample size of 1050 had to
be taken to account for design effect.
3.4 Sample selection procedures
We used a multistage stratified cluster random sampling procedure.
21
3.4.1 Selection of schools
The list of all the schools in the urban Guwahati area was obtained from the
office of the district education officer. From the list 6 private owned and 3 government
schools were selected randomly from the two types of schools. This stratified random
sampling of schools was done based on the proportion of government and private schools
in urban Guwahati. All the selected schools had similar timings.
3.4.2 Selection of classes/sections
List of all the sections of classes 9th
and 10th
was prepared from the selected
schools. From this list the required number of sections was selected randomly from each
type of school in order to cover 1050 adolescents. In total 18 sections were selected.
3.4.3 Selection of study participants
All the students from each selected sections were taken up for the survey. It was
also ensured that the selected students were in the age group of 13-18 years, that is, the
adolescent age group.
3.5 Data collection techniques
Data collection was done by the principal investigator between 16th
June to 15th
September 2011. Self administered questionnaire was the tool used for the survey. They
were collected after completion on the same day. The entire questionnaire session took
about 30-35 minutes for the students to complete. It was supervised by principal
investigator only.
22
3.6 Anthropometric measurements
All the participants were measured for height and weight to calculate the body
mass index. In order to avoid inter-observer and inter-instrument bias, all the
measurements were taken by the principal investigator using same instruments. Height
was measured using a portable anthropometric rod (with an error of ± 0.1 cm) and weight
was measured using SECA digital weighing scale (with an error of ± 100 grams).
3.6.1 Procedures for measuring height
The participants were asked to remove their footwear and any headgear if any.
They were to face the principal investigator measuring height. Feet were placed together,
heels against the back board and knees straight. They were made to look straight ahead
and not tilt their head up. It was ensured that eyes were at the same level as the ears. The
measure arm was gently moved down onto the head of the participant and the participants
were asked to breathe in and stand tall. The height in centimetres was read at the exact
point.
3.6.2 Procedures for measuring weight
The participants were asked to remove their footwear and socks. They were then
asked to step onto scale with one foot on each side of the scale. They were to stand still,
face forward, place arms on the side and wait until asked to step off. Weight was recorded
in kilograms.
3.7 Data entry
Data entry was done using SPSS Statistics 17.0 for windows by principal
investigator. Data was cleaned and scrutinized for missing values and consistency with
the forms. All the hard copies are stored securely by the principal investigator.
23
3.8 Data analysis and statistical methods
Data analysis was done using SPSS Statistics 17.0 for windows. Univariate
analysis was done to describe the sample characteristics. Bivariate analysis of
independent variables (categorised) with dependent variables (junk food consumption,
vegetable and fruit consumption) were done by cross tabulation and testing by Chi
square. Multivariate analysis was done using Multiple binary logistic regression for
adjusting possible confounding and interactions to arrive at two models explaining both
the outcome variables.
For classifying body mass index of the adolescents into overweight/obese and
non overweight and non obese the age and sex specific cut-off points for adolescents
proposed by Cole et al was used.58
These cut-off points are internationally accepted and
also referred by the International Obesity Task Force (IOTF).
3.9 Variables used in the study
3.9.1 Dependent variables
1. Junk food consumption
This was arrived at after clubbing six questions relating to different types of
junk food consumed in a day. Responses were categorised as ‗yes‘ if the participant
consumed any one type/item of junk food per day and as ‗no‘ if they do not consume any
type of junk food.
2. Vegetable and fruit consumption
This was arrived upon by combining three questions on the frequency of
consumption of vegetables, green leafy vegetables and fruits per day by the participants.
24
Responses were categorised as ‗low‘ and ‗moderate‘ depending on whether the
participants consumed less than one time fruit and two times vegetable per day or more
than or equal to one time fruit and two times vegetable consumption per day.
3.9.2 Independent variables
1. Sex: To study the gender variations in terms of junk food and vegetables and
fruits consumption.
2. Age: To see the changes in consumption pattern of junk foods and vegetables
and fruits across age groups.
3. Type of school: Used as a proxy for the socio-economic status of the
adolescents.
4. Dietary behaviour was captured using variables to find out the number of days
the adolescents had breakfast in a week, reason for not eating breakfast, place of
breakfast, breakfast had with whom, the number of days tiffin/lunch brought to school in
a week, place of having lunch if not brought from home, family meals, that is, whether
dinner was with parents or not and number of days of eating dinner out in a week.
5. Family influences on the choice of foods of the adolescents were assessed
with the help of variables which looked into the normative beliefs, that is, what
adolescents believe their parents think about eating vegetables and fruits; normative
expectations, that is, adolescent‘s beliefs about whether parents think they should or
should not eat vegetables and fruits; parental modelling of eating, that is, whether parents
eat vegetables and fruits in front of their children while having food with them.
6. Peer influences were assessed with the help of variables which looked into the
normative beliefs, that is, what adolescents believe their friends think about eating
25
vegetables and fruits; normative expectations, that is, adolescent‘s belief about whether
friends think they should or should not eat vegetables and fruits; peer modelling, that is,
friends eating vegetables and fruits in front of them.
7. Availability: To see if adequate types of vegetables and fruits were available at
home.
8. Accessibility: Captures whether vegetables and fruits were served to the
adolescents even though they were available at home.
9. Perceived weight status: Adolescents were asked to describe themselves as
underweight, right weight or overweight.
10. Knowledge: To know whether the adolescents were taught in any of their classes
the benefits of healthy eating and the benefits of eating more vegetables and fruits.
3.10 Ethical considerations
Ethical clearance was obtained from Institutional Ethics Committee (IEC) of
Sree Chitra Tirunal Institute for Medical Sciences and Technology. Written permission
from the head of the schools was taken to conduct the survey in the selected
schools.Written Informed Consent was obtained from the parents/guardians of the
adolescents. On the day of the survey written Assent was obtained from the participating
adolescents stating their willingness to take part in the survey.
26
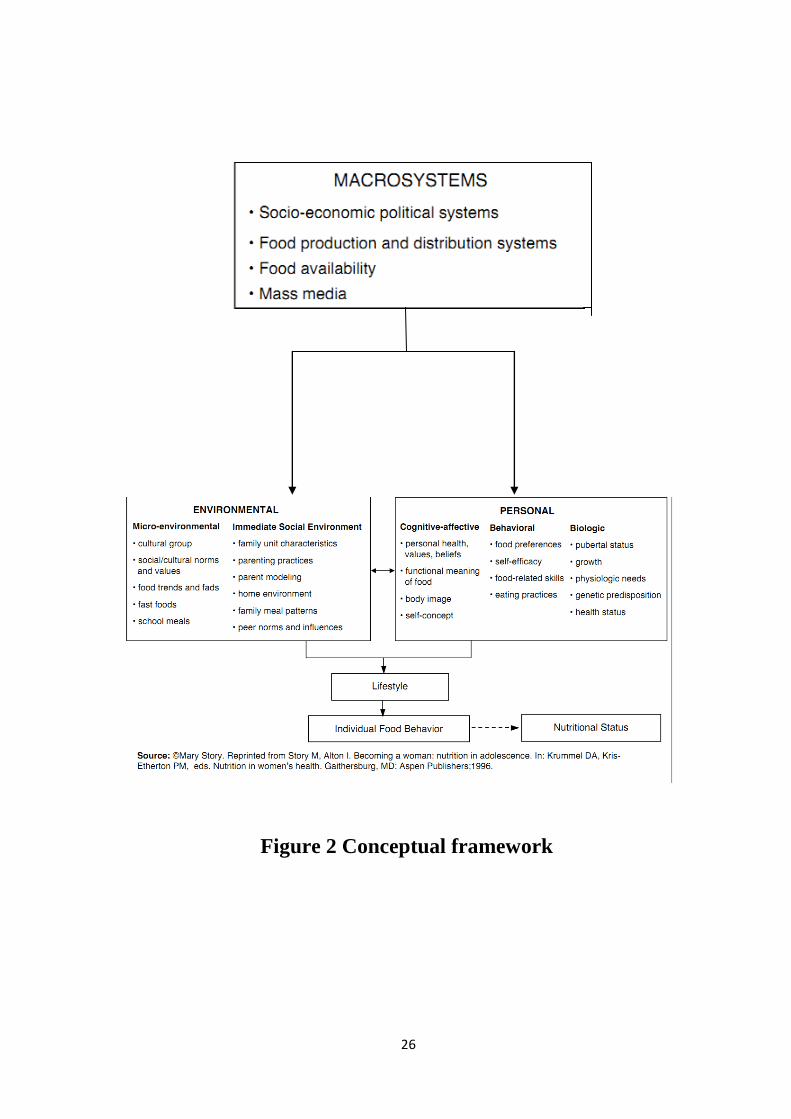
Figure 2 Conceptual framework
27
CHAPTER 4
RESULTS
This chapter primarily describes the outcomes of data analysis in concordance
with the objectives. After scrutinizing the data entered, they were analysed using SPSS
for windows version 17.0.
Following various steps, the data were analysed for identifying the baseline
characteristics of the sample population and the association between independent
variables and the outcome variables (junk food consumption and vegetable and fruit
consumption). The results are organized first with the description of the sample
characteristics, next distribution of variables capturing dietary behaviour across the
sample, then variables assessing parental and peer influences, availability and
accessibility of vegetables and fruits across the sample and finally personal factors like
perceived weight status and knowledge across the sample is described. Body mass index
classification of the sample population is done based on the Cole et al study.58
Bivariate analysis of some selected variables with the outcome variables and
multivariate models predicting the outcome variables is attempted.
28
4.1 Sample description
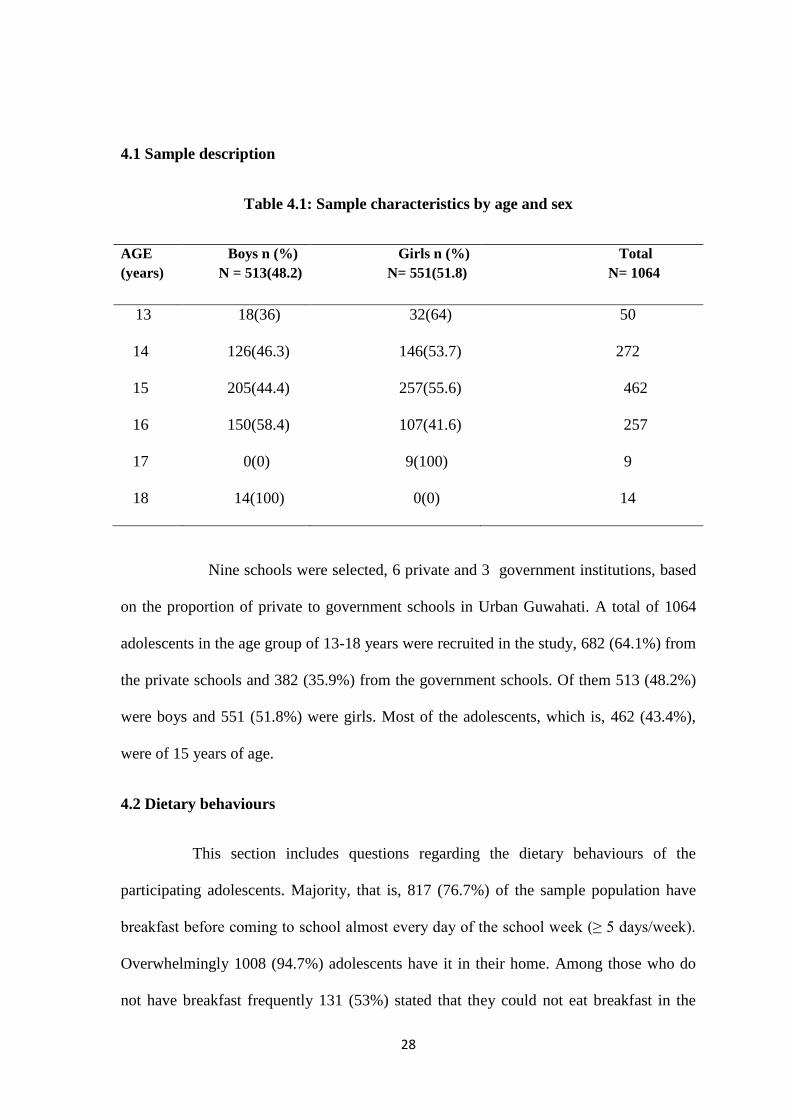
Table 4.1: Sample characteristics by age and sex
AGE
(years)
Boys n (%)
N = 513(48.2)
Girls n (%)
N= 551(51.8)
Total
N= 1064
13 18(36) 32(64) 50
14 126(46.3) 146(53.7) 272
15 205(44.4) 257(55.6) 462
16 150(58.4) 107(41.6) 257
17 0(0) 9(100) 9
18 14(100) 0(0) 14
Nine schools were selected, 6 private and 3 government institutions, based
on the proportion of private to government schools in Urban Guwahati. A total of 1064
adolescents in the age group of 13-18 years were recruited in the study, 682 (64.1%) from
the private schools and 382 (35.9%) from the government schools. Of them 513 (48.2%)
were boys and 551 (51.8%) were girls. Most of the adolescents, which is, 462 (43.4%),
were of 15 years of age.
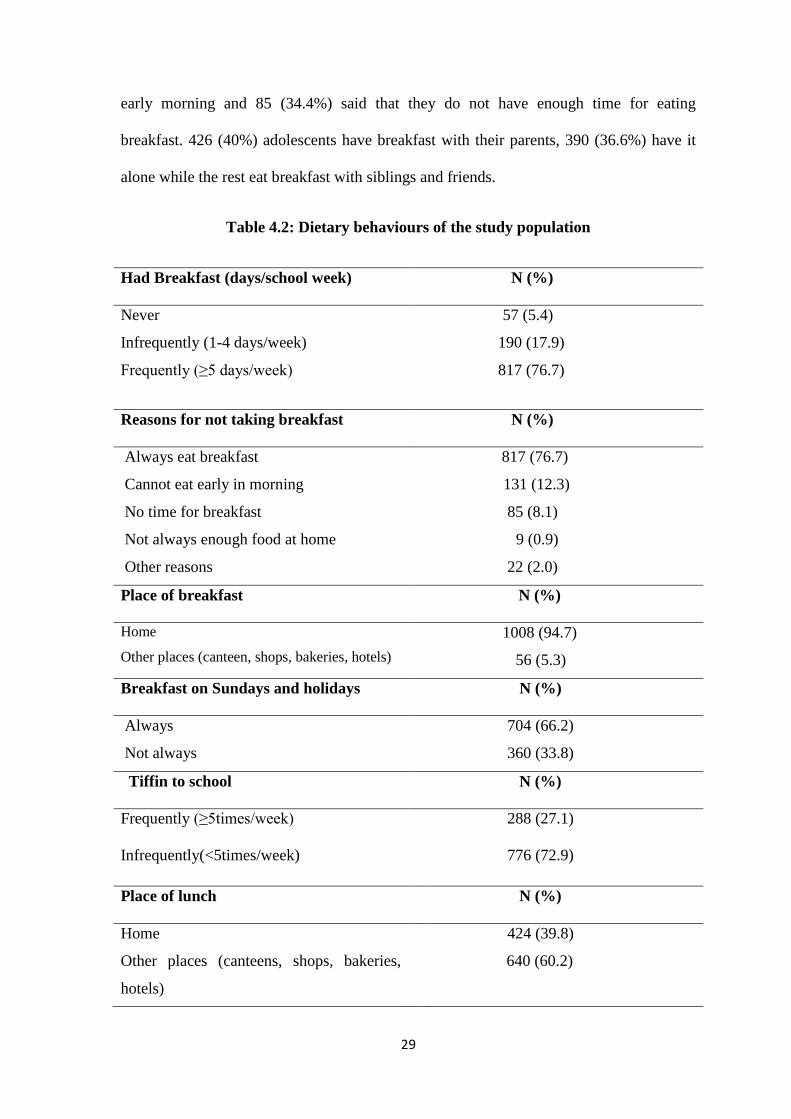
4.2 Dietary behaviours
This section includes questions regarding the dietary behaviours of the
participating adolescents. Majority, that is, 817 (76.7%) of the sample population have
breakfast before coming to school almost every day of the school week (≥ 5 days/week).
Overwhelmingly 1008 (94.7%) adolescents have it in their home. Among those who do
not have breakfast frequently 131 (53%) stated that they could not eat breakfast in the
29
early morning and 85 (34.4%) said that they do not have enough time for eating
breakfast. 426 (40%) adolescents have breakfast with their parents, 390 (36.6%) have it
alone while the rest eat breakfast with siblings and friends.
Table 4.2: Dietary behaviours of the study population
Had Breakfast (days/school week) N (%)
Never
Infrequently (1-4 days/week)
Frequently (≥5 days/week)
57 (5.4)
190 (17.9)
817 (76.7)
Reasons for not taking breakfast
N (%)
Always eat breakfast
Cannot eat early in morning
No time for breakfast
Not always enough food at home
Other reasons
817 (76.7)
131 (12.3)
85 (8.1)
9 (0.9)
22 (2.0)
Place of breakfast N (%)
Home
Other places (canteen, shops, bakeries, hotels)
1008 (94.7)
56 (5.3)
Breakfast on Sundays and holidays N (%)
Always
Not always
704 (66.2)
360 (33.8)
Tiffin to school N (%)
Frequently (≥5times/week)
Infrequently(<5times/week)
288 (27.1)
776 (72.9)
Place of lunch N (%)
Home
Other places (canteens, shops, bakeries,
hotels)
424 (39.8)
640 (60.2)
30
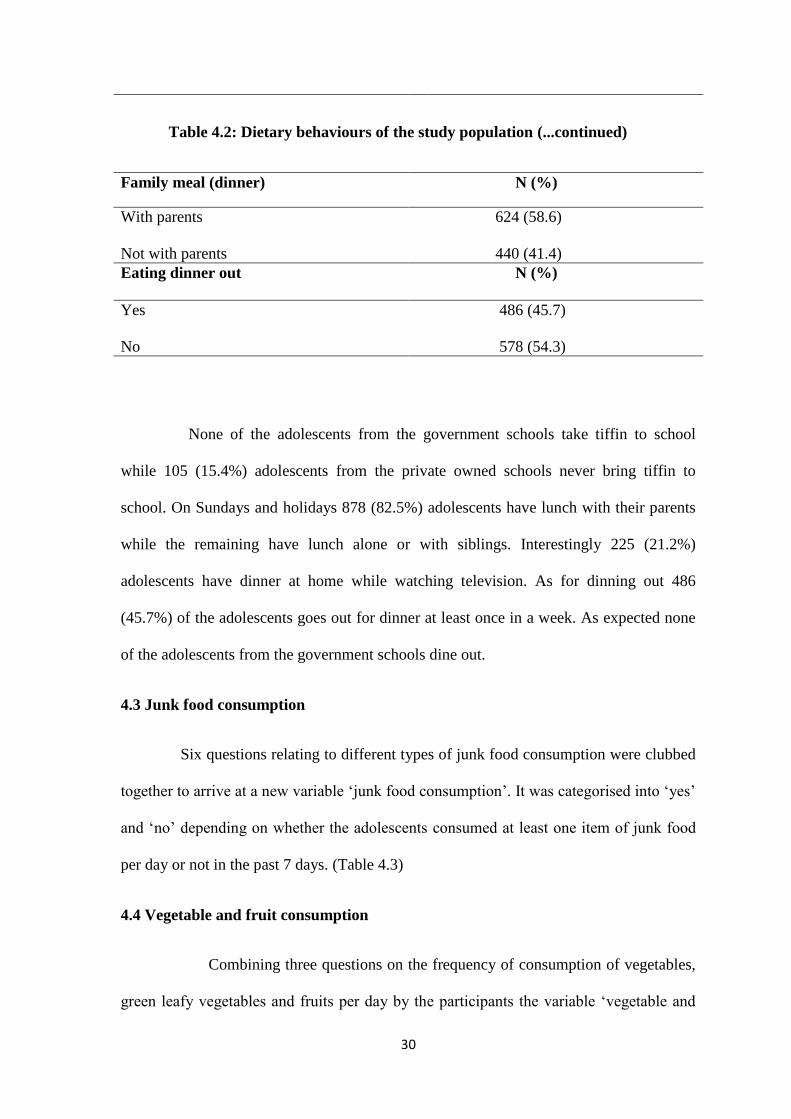
Table 4.2: Dietary behaviours of the study population (...continued)
Family meal (dinner) N (%)
With parents
Not with parents
624 (58.6)
440 (41.4)
Eating dinner out
N (%)
Yes
No
486 (45.7)
578 (54.3)
None of the adolescents from the government schools take tiffin to school
while 105 (15.4%) adolescents from the private owned schools never bring tiffin to
school. On Sundays and holidays 878 (82.5%) adolescents have lunch with their parents
while the remaining have lunch alone or with siblings. Interestingly 225 (21.2%)
adolescents have dinner at home while watching television. As for dinning out 486
(45.7%) of the adolescents goes out for dinner at least once in a week. As expected none
of the adolescents from the government schools dine out.
4.3 Junk food consumption
Six questions relating to different types of junk food consumption were clubbed
together to arrive at a new variable ‗junk food consumption‘. It was categorised into ‗yes‘
and ‗no‘ depending on whether the adolescents consumed at least one item of junk food
per day or not in the past 7 days. (Table 4.3)
4.4 Vegetable and fruit consumption
Combining three questions on the frequency of consumption of vegetables,
green leafy vegetables and fruits per day by the participants the variable ‗vegetable and
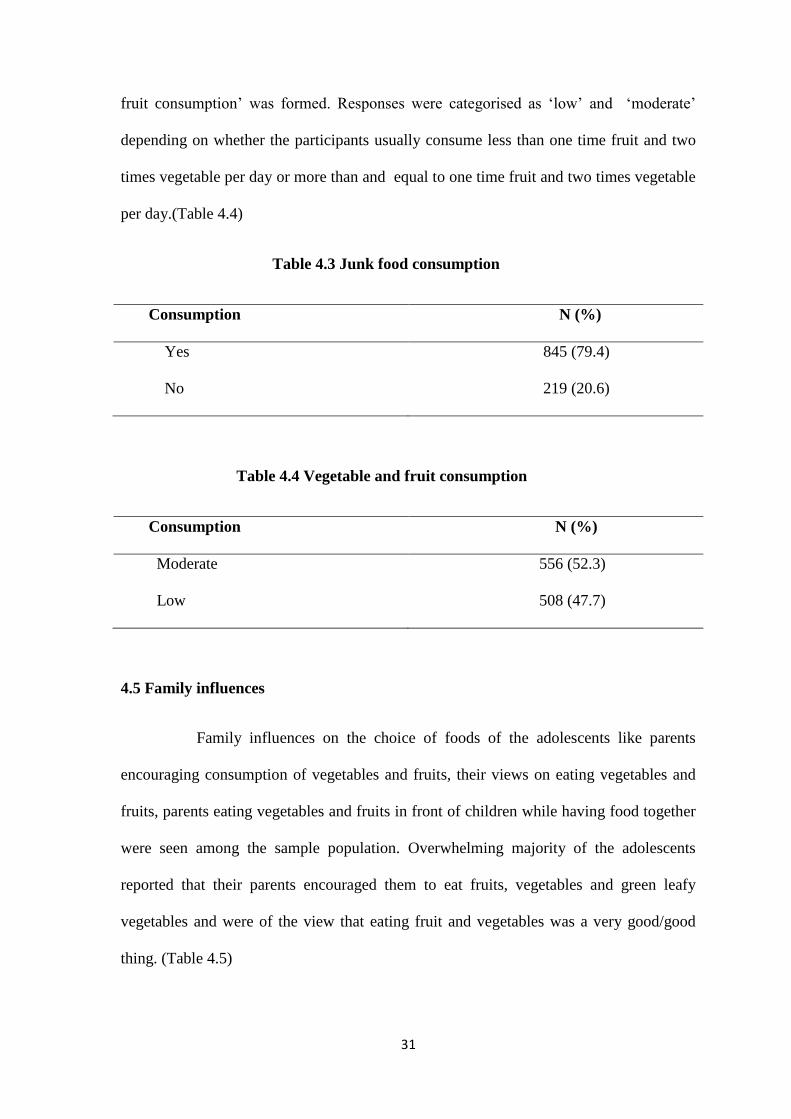
31
fruit consumption‘ was formed. Responses were categorised as ‗low‘ and ‗moderate‘
depending on whether the participants usually consume less than one time fruit and two
times vegetable per day or more than and equal to one time fruit and two times vegetable
per day.(Table 4.4)
Table 4.3 Junk food consumption
Consumption N (%)
Yes
No
845 (79.4)
219 (20.6)
Table 4.4 Vegetable and fruit consumption
Consumption N (%)
Moderate
Low
556 (52.3)
508 (47.7)
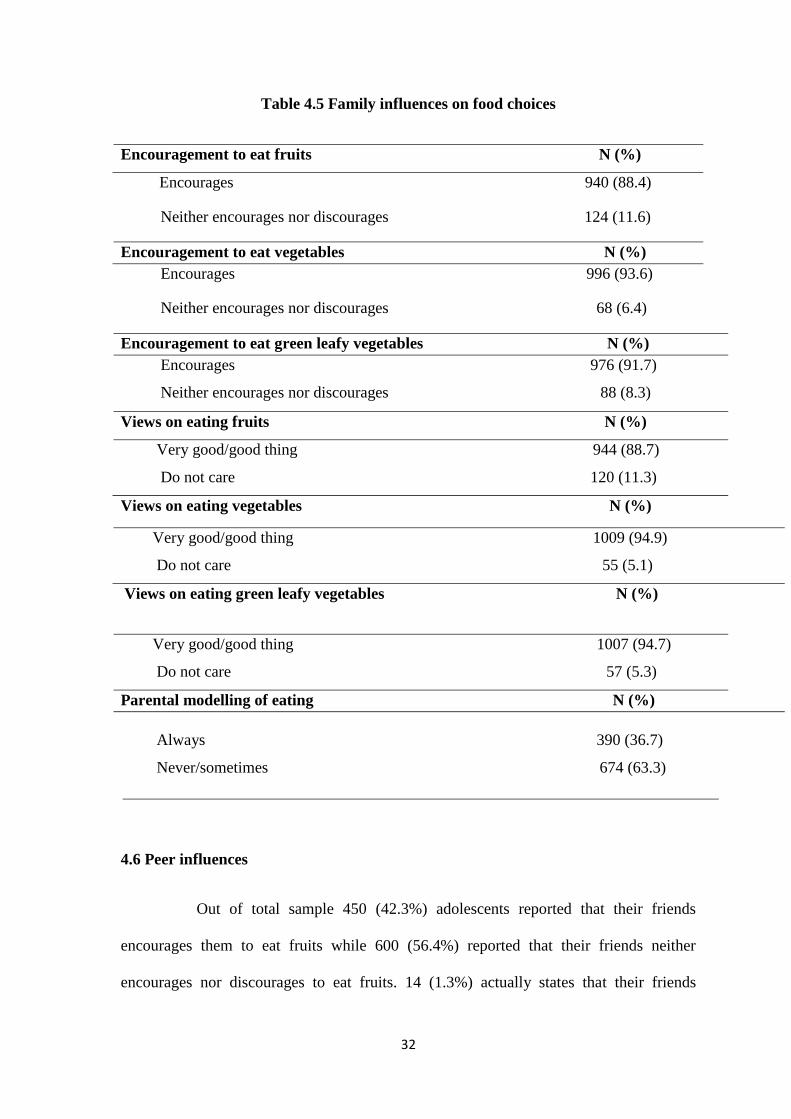
4.5 Family influences
Family influences on the choice of foods of the adolescents like parents
encouraging consumption of vegetables and fruits, their views on eating vegetables and
fruits, parents eating vegetables and fruits in front of children while having food together
were seen among the sample population. Overwhelming majority of the adolescents
reported that their parents encouraged them to eat fruits, vegetables and green leafy
vegetables and were of the view that eating fruit and vegetables was a very good/good
thing. (Table 4.5)
32
Table 4.5 Family influences on food choices
Encouragement to eat fruits N (%)
Encourages 940 (88.4)
Neither encourages nor discourages 124 (11.6)
Encouragement to eat vegetables N (%)
Encourages 996 (93.6)
Neither encourages nor discourages 68 (6.4)
Encouragement to eat green leafy vegetables N (%)
Encourages 976 (91.7)
Neither encourages nor discourages 88 (8.3)
Views on eating fruits N (%)
Very good/good thing 944 (88.7)
Do not care 120 (11.3)
Views on eating vegetables N (%)
Very good/good thing 1009 (94.9)
Do not care 55 (5.1)
Views on eating green leafy vegetables N (%)
Very good/good thing 1007 (94.7)
Do not care 57 (5.3)
Parental modelling of eating N (%)
Always 390 (36.7)
Never/sometimes 674 (63.3)
4.6 Peer influences
Out of total sample 450 (42.3%) adolescents reported that their friends
encourages them to eat fruits while 600 (56.4%) reported that their friends neither
encourages nor discourages to eat fruits. 14 (1.3%) actually states that their friends
33
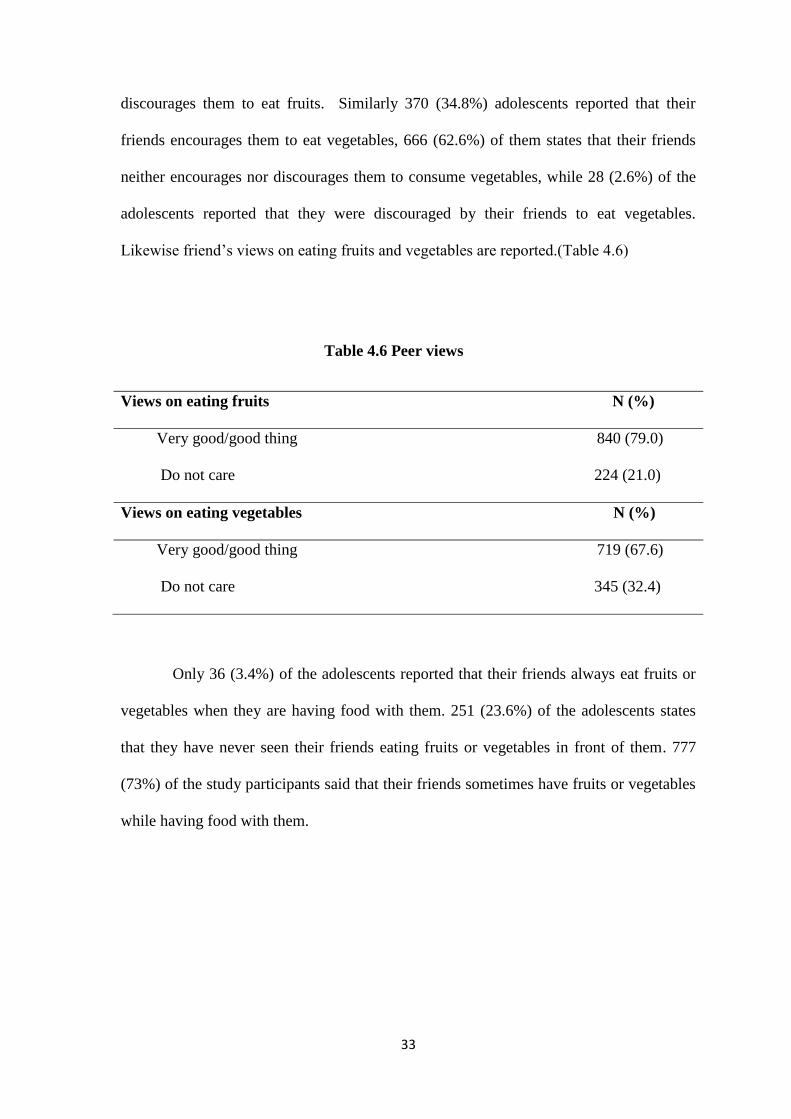
discourages them to eat fruits. Similarly 370 (34.8%) adolescents reported that their
friends encourages them to eat vegetables, 666 (62.6%) of them states that their friends
neither encourages nor discourages them to consume vegetables, while 28 (2.6%) of the
adolescents reported that they were discouraged by their friends to eat vegetables.
Likewise friend‘s views on eating fruits and vegetables are reported.(Table 4.6)
Table 4.6 Peer views
Views on eating fruits N (%)
Very good/good thing 840 (79.0)
Do not care 224 (21.0)
Views on eating vegetables N (%)
Very good/good thing 719 (67.6)
Do not care 345 (32.4)
Only 36 (3.4%) of the adolescents reported that their friends always eat fruits or
vegetables when they are having food with them. 251 (23.6%) of the adolescents states
that they have never seen their friends eating fruits or vegetables in front of them. 777
(73%) of the study participants said that their friends sometimes have fruits or vegetables
while having food with them.
34
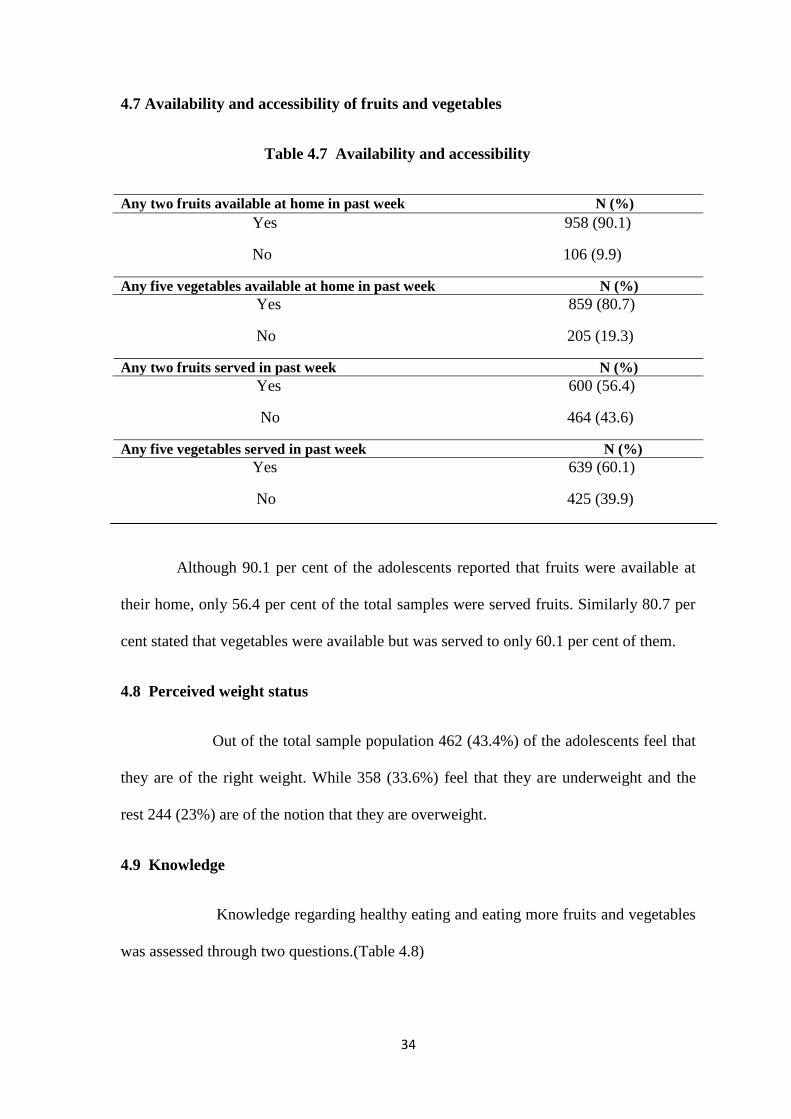
4.7 Availability and accessibility of fruits and vegetables
Table 4.7 Availability and accessibility
Any two fruits available at home in past week N (%)
Yes 958 (90.1)
No 106 (9.9)
Any five vegetables available at home in past week N (%)
Yes 859 (80.7)
No 205 (19.3)
Any two fruits served in past week N (%)
Yes 600 (56.4)
No 464 (43.6)
Any five vegetables served in past week N (%)
Yes 639 (60.1)
No 425 (39.9)
Although 90.1 per cent of the adolescents reported that fruits were available at
their home, only 56.4 per cent of the total samples were served fruits. Similarly 80.7 per
cent stated that vegetables were available but was served to only 60.1 per cent of them.
4.8 Perceived weight status
Out of the total sample population 462 (43.4%) of the adolescents feel that
they are of the right weight. While 358 (33.6%) feel that they are underweight and the
rest 244 (23%) are of the notion that they are overweight.
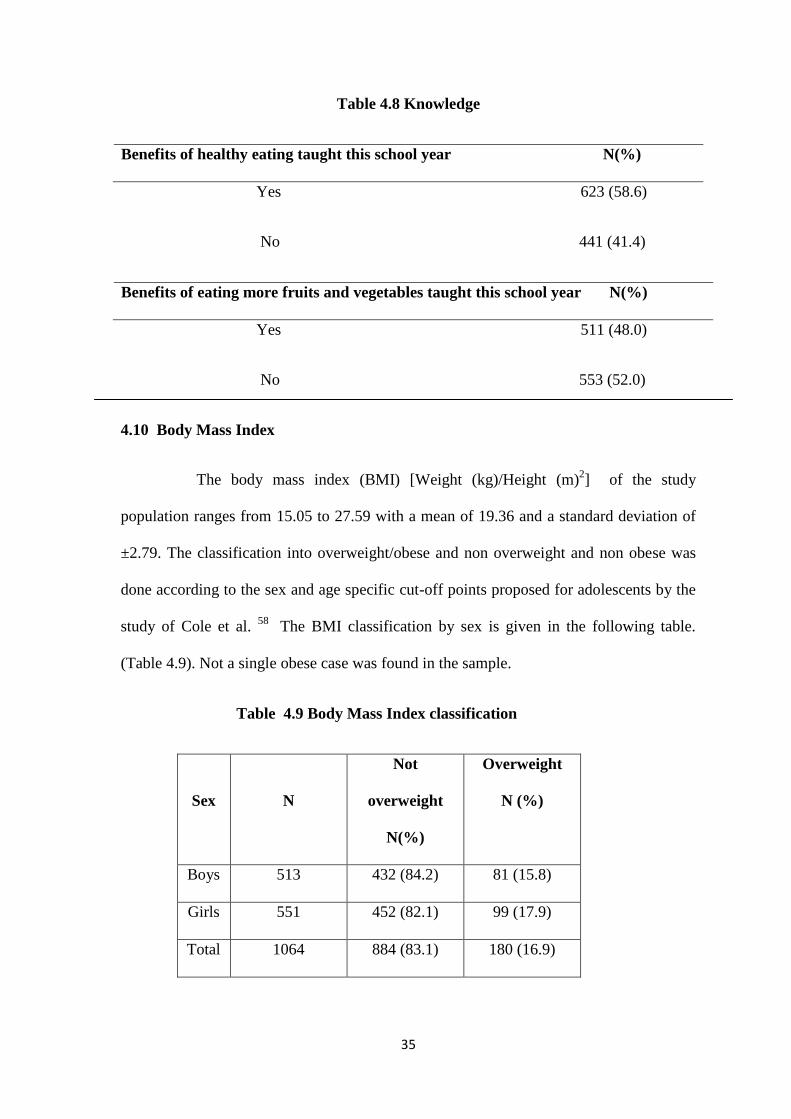
4.9 Knowledge
Knowledge regarding healthy eating and eating more fruits and vegetables
was assessed through two questions.(Table 4.8)
35
Table 4.8 Knowledge
Benefits of healthy eating taught this school year N(%)
Yes 623 (58.6)
No 441 (41.4)
Benefits of eating more fruits and vegetables taught this school year N(%)
Yes 511 (48.0)
No 553 (52.0)
4.10 Body Mass Index
The body mass index (BMI) [Weight (kg)/Height (m)2] of the study
population ranges from 15.05 to 27.59 with a mean of 19.36 and a standard deviation of
±2.79. The classification into overweight/obese and non overweight and non obese was
done according to the sex and age specific cut-off points proposed for adolescents by the
study of Cole et al. 58
The BMI classification by sex is given in the following table.
(Table 4.9). Not a single obese case was found in the sample.
Table 4.9 Body Mass Index classification
Sex
N
Not
overweight
N(%)
Overweight
N (%)
Boys 513 432 (84.2) 81 (15.8)
Girls 551 452 (82.1) 99 (17.9)
Total 1064 884 (83.1) 180 (16.9)
36
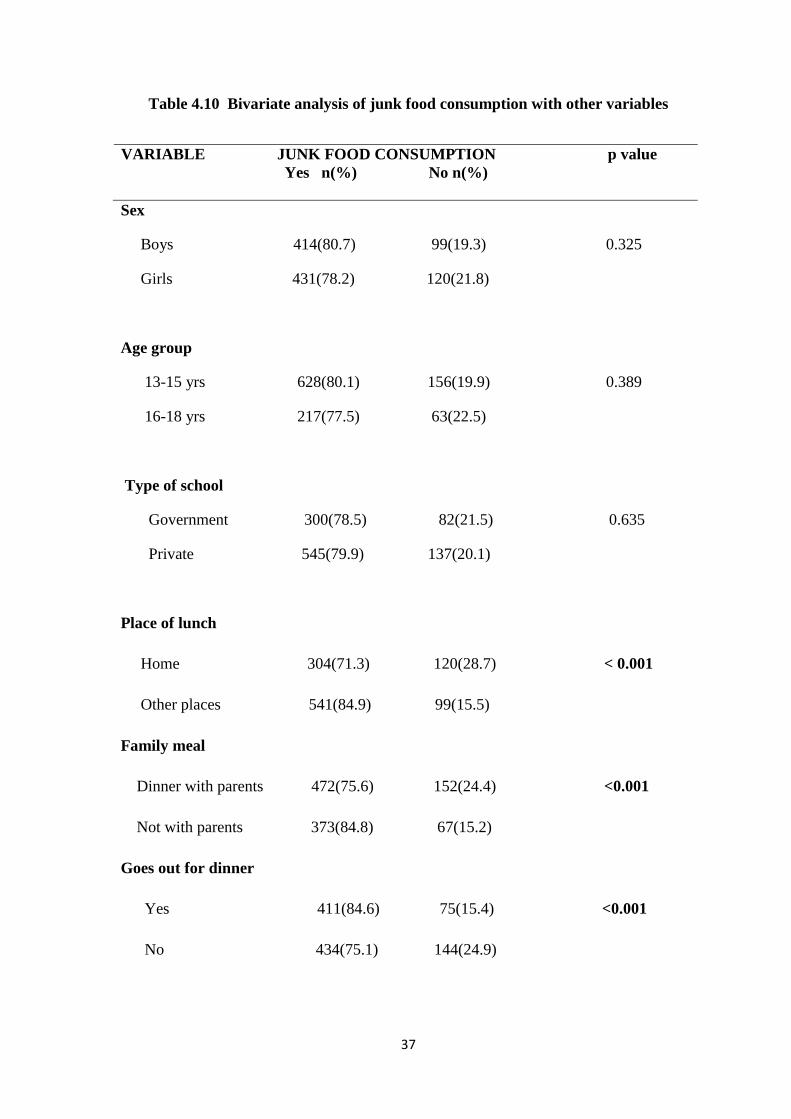
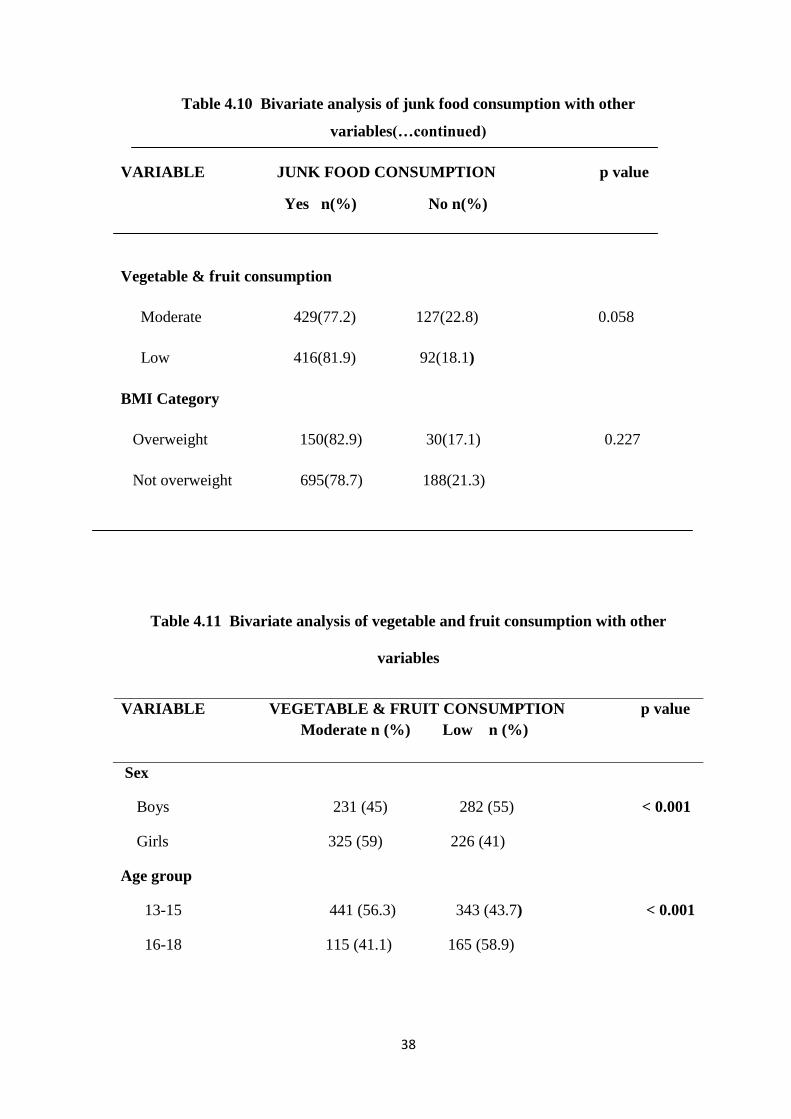
4.11 Bivariate analysis
Bivariate analysis of the outcome variable junk food consumption was done
with other independent variables. Cross tabulation and chi square test was done. P value
of <0.05 was set for significance. The results of bivariate analysis are given in table 4.10.
There is no significant difference in proportion of junk food consumption
between the groups of baseline variables like sex, age group and type of school. Across
the groups in the variables place of lunch, family meal (dinner), dinning out and fruit and
vegetable consumption there is found to be a significant difference in proportion of junk
food consumption. Interestingly there is no significant difference in proportion of junk
food consumption between overweight and non overweight.
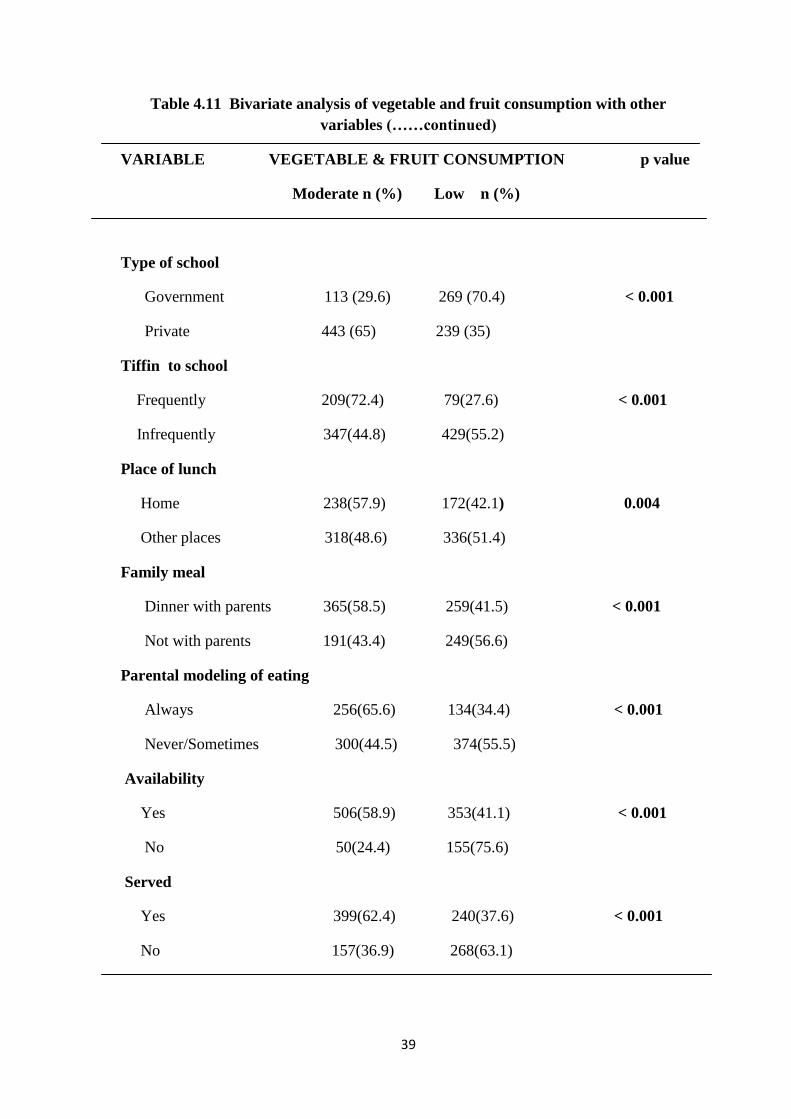
Similarly bivariate analysis of the outcome variable vegetable and fruit
consumption was done with the independent variables. There is found to be a significant
difference in the proportion of consumption of vegetables and fruits between the groups
of variables sex, age group, type of school, tiffin to school, place of lunch, family meal
(dinner), parental modelling, availability and accessibility. The results are given in table
4.11.
37
Table 4.10 Bivariate analysis of junk food consumption with other variables
VARIABLE JUNK FOOD CONSUMPTION p value
Yes n(%) No n(%)
Sex
Boys 414(80.7) 99(19.3) 0.325
Girls 431(78.2) 120(21.8)
Age group
13-15 yrs 628(80.1) 156(19.9) 0.389
16-18 yrs 217(77.5) 63(22.5)
Type of school
Government 300(78.5) 82(21.5) 0.635
Private 545(79.9) 137(20.1)
Place of lunch
Home 304(71.3) 120(28.7) < 0.001
Other places 541(84.9) 99(15.5)
Family meal
Dinner with parents 472(75.6) 152(24.4) <0.001
Not with parents 373(84.8) 67(15.2)
Goes out for dinner
Yes 411(84.6) 75(15.4) <0.001
No 434(75.1) 144(24.9)
38
Table 4.10 Bivariate analysis of junk food consumption with other
variables(…continued)
VARIABLE JUNK FOOD CONSUMPTION p value
Yes n(%) No n(%)
Vegetable & fruit consumption
Moderate 429(77.2) 127(22.8) 0.058
Low 416(81.9) 92(18.1)
BMI Category
Overweight 150(82.9) 30(17.1) 0.227
Not overweight 695(78.7) 188(21.3)
Table 4.11 Bivariate analysis of vegetable and fruit consumption with other
variables
VARIABLE VEGETABLE & FRUIT CONSUMPTION p value
Moderate n (%) Low n (%)
Sex
Boys 231 (45) 282 (55) < 0.001
Girls 325 (59) 226 (41)
Age group
13-15 441 (56.3) 343 (43.7) < 0.001
16-18 115 (41.1) 165 (58.9)
39
Table 4.11 Bivariate analysis of vegetable and fruit consumption with other
variables (……continued)
VARIABLE VEGETABLE & FRUIT CONSUMPTION p value
Moderate n (%) Low n (%)
Type of school
Government 113 (29.6) 269 (70.4) < 0.001
Private 443 (65) 239 (35)
Tiffin to school
Frequently 209(72.4) 79(27.6) < 0.001
Infrequently 347(44.8) 429(55.2)
Place of lunch
Home 238(57.9) 172(42.1) 0.004
Other places 318(48.6) 336(51.4)
Family meal
Dinner with parents 365(58.5) 259(41.5) < 0.001
Not with parents 191(43.4) 249(56.6)
Parental modeling of eating
Always 256(65.6) 134(34.4) < 0.001
Never/Sometimes 300(44.5) 374(55.5)
Availability
Yes 506(58.9) 353(41.1) < 0.001
No 50(24.4) 155(75.6)
Served
Yes 399(62.4) 240(37.6) < 0.001
No 157(36.9) 268(63.1)
40
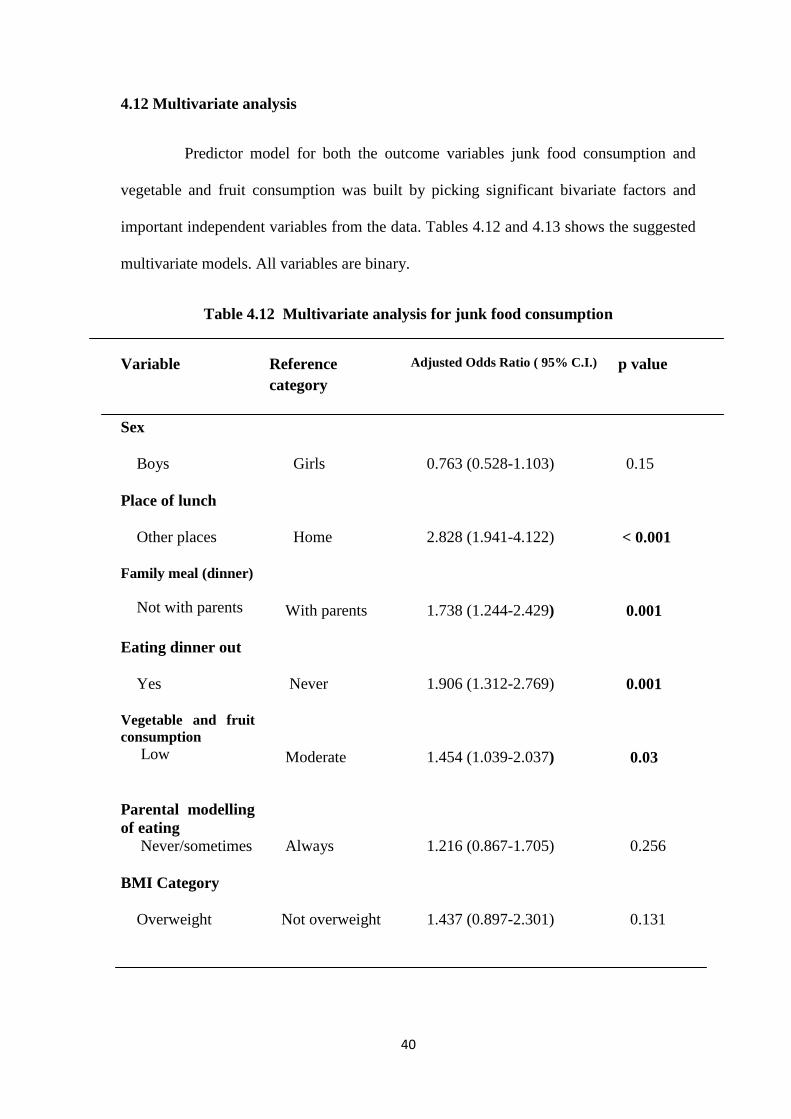
4.12 Multivariate analysis
Predictor model for both the outcome variables junk food consumption and
vegetable and fruit consumption was built by picking significant bivariate factors and
important independent variables from the data. Tables 4.12 and 4.13 shows the suggested
multivariate models. All variables are binary.
Table 4.12 Multivariate analysis for junk food consumption
Variable
Reference
category
Adjusted Odds Ratio ( 95% C.I.) p value
Sex
Boys
Girls
0.763 (0.528-1.103)
0.15
Place of lunch
Other places
Home
2.828 (1.941-4.122)
< 0.001
Family meal (dinner)
Not with parents
With parents
1.738 (1.244-2.429)
0.001
Eating dinner out
Yes
Never
1.906 (1.312-2.769)
0.001
Vegetable and fruit
consumption
Low
Moderate
1.454 (1.039-2.037)
0.03
Parental modelling
of eating
Never/sometimes
Always
1.216 (0.867-1.705)
0.256
BMI Category
Overweight
Not overweight
1.437 (0.897-2.301)
0.131
41
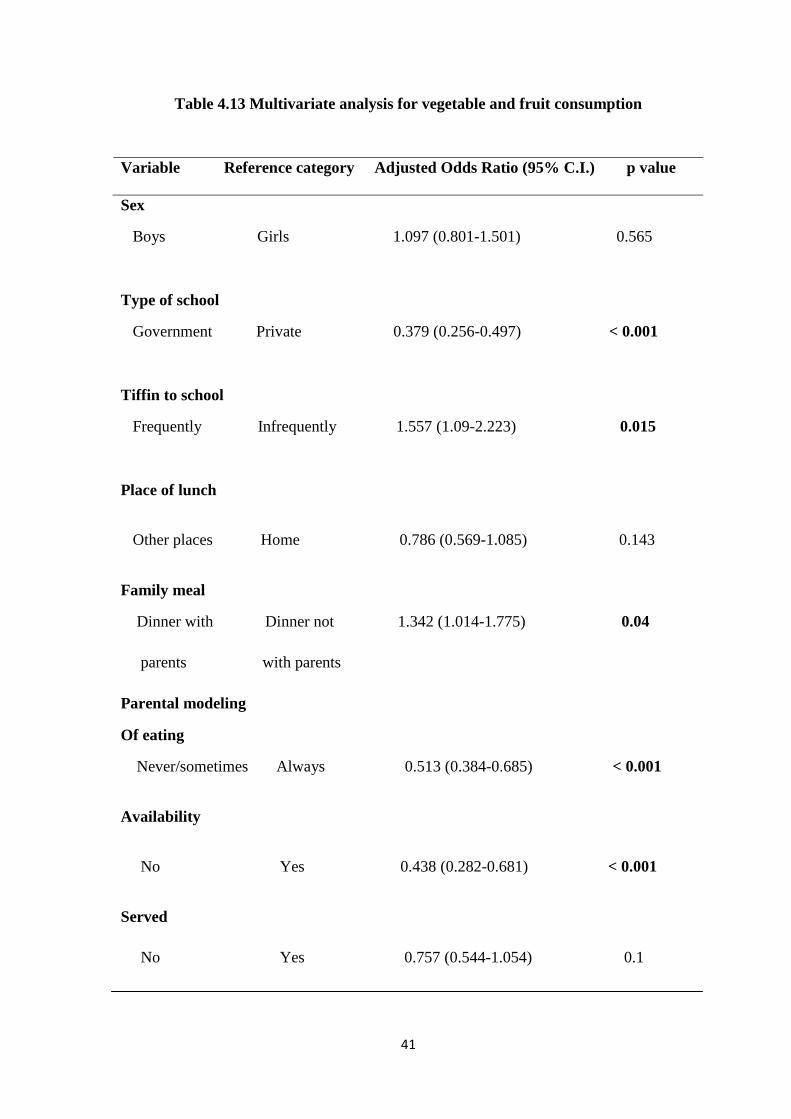
Table 4.13 Multivariate analysis for vegetable and fruit consumption
Variable Reference category Adjusted Odds Ratio (95% C.I.) p value
Sex
Boys Girls 1.097 (0.801-1.501) 0.565
Type of school
Government Private 0.379 (0.256-0.497) < 0.001
Tiffin to school
Frequently Infrequently 1.557 (1.09-2.223) 0.015
Place of lunch
Other places Home 0.786 (0.569-1.085) 0.143
Family meal
Dinner with Dinner not 1.342 (1.014-1.775) 0.04
parents with parents
Parental modeling
Of eating
Never/sometimes Always 0.513 (0.384-0.685) < 0.001
Availability
No Yes 0.438 (0.282-0.681) < 0.001
Served
No Yes 0.757 (0.544-1.054) 0.1
42
In both the models it was found that family meal (dinner) was significantly
associated with food consumption - those who take meal with family members are likely
to be consuming more fruits/vegetables and less junk food compared to those who do not
take meals with family members. No gender variation was found in terms of both junk
food consumption and fruits and vegetables consumption. Also being overweight was not
found to be associated with junk food consumption.
43
CHAPTER 5
DISCUSSION AND CONCLUSION
5.1 Discussion
This study primarily aimed to look into the environmental influences affecting
the junk food consumption. In addition a few personal factors were studied which are
thought to have an effect on the food choices. While doing so, parental and peer
influences on vegetable and fruit consumption were also judged. Basically a model was
tried to build which would most predict the junk food, vegetable and fruit consumption
by the adolescents.
Adolescents in the age group 13-18 years were chosen as it is a time of
psychological maturation and a crucial period for development of dietary behaviours that
continue into adulthood and influence the risk of chronic diseases later in life.
Furthermore school going adolescents are in a midst of several inter-playing factors
which moulds their lifestyle habits. Thus there is a call for understanding the factors
influencing adolescent‘s dietary practices so as to design an effective dietary intervention
program.
5.1.1 Dietary behaviours
About one fourth of the adolescents skipped breakfast on at least one day
during the school week. Skipping breakfast, in particular, can be especially problematic
for overweight and non-overweight youth alike, leading to nutritional problems and
44
interfering with learning and academic performance.59
A greater proportion of
adolescents studying in the private schools skipped breakfast than those from the
government schools. It has most probably to do with early school timings of the private
owned schools. Moreover students from the private schools have to catch their school
buses at least an hour before the school starts. This view is supported by the fact that one
fifth of the adolescents reported that they cannot eat early in the morning or there is not
enough time to have breakfast. Breakfast eating appears to contribute to the overall
nutritional adequacy of the diet and may provide an opportunity to consume foods such as
grain products and fruits, widely regarded as important in the prevention of chronic
disease.60
Furthermore, substantial evidence suggests that eating breakfast acutely
improves cognitive performance in terms of concentration and memory, with potential
implications for educational attainment.61
The percentage of adolescents skipping
breakfast (23.3%) in this study is in concordance to studies done in the United States.12
Only 27.1 per cent of the adolescents always bring tiffin to school. As a
result the study shows that a vast majority of the adolescents (60.2 per cent) have food
items from the school canteen, shops, bakeries or hotels nearby during the tiffin break. In
fact none of the participants from the government schools ever brought tiffin to school.
As a result 84.5 per cent of adolescents from government schools consume junk food
which are cheap to buy and easily available near the school premises.
Dinner is the most frequently consumed family meal among adolescents and
it also provides a large proportion of intake of energy and key nutrients than any other
meal or snack.62
Increasing frequency of family dinner is associated with more healthful
dietary intake patterns, including more fruits and vegetables, less fried food and soft
drinks, less saturated and trans fats and more fibre and micronutrients from food. Family
meals also provide an opportunity for family communication and interaction. The study
45
findings show that 41.4 per cent of the adolescents do not have dinner with parents and
21.2 per cent adolescents have dinner while watching television. Mass media had been
found to be a influential factor affecting the food choices of children.12
Eating out has direct bearing on the nutritional status of adolescents. Many fast
foods are high in fat and low in fibre and nutrients. The study found that 45.7 per cent of
the adolescents go out for dinner at least once a week. In fact eating dinner out is strongly
associated with junk food consumption (p = 0.001).
5.1.2 Family and peer influences
Family and peer influences have particularly promising effect on fruit and
vegetable consumption.63
This study found that vast majority of the adolescents reported
that their parents encouraged them to eat fruits, vegetables and green leafy vegetables and
were of the view that eating fruit and vegetables was a very good/good thing. Only 36.7
per cent of the adolescents reported that their parents always ate fruits and vegetables
while having food with them. Parental modelling of eating was found to be significant
factor associated with vegetable and fruit consumption. This has also been shown in
studies done in various European countries.63
Similarly majority of the adolescents
reported that their friends encouraged them to eat fruits and vegetables and thought that
eating fruits and vegetables is a very good thing.
5.1.3 Availability and accessibility
Although 90.1 per cent of the adolescents reported that fruits were available
at their home, only 56.4 per cent of the total samples were served fruits. Similarly 80.7
per cent stated that vegetables were available but was served to only 60.1 per cent of
them. This has more to do with the distribution of food among the members of the
46
household and also probably who prefer what items. Moreover preferential treatment to
other members of the family could not be ruled out.
5.1.4 Knowledge
Majority of the adolescents reported that they were not taught the benefits of
eating more fruits and vegetables in their school. However there were a proportion of
adolescents from the same schools who reported otherwise. Hence this finding may be
more due to the individual understanding of the adolescents.
5.1.5 Overweight and obesity
The overall prevalence of overweight among the sample population was
found to be 16.9 per cent. This is comparable to that seen in studies done in Delhi,
Chennai, Pune, Bangalore, Ahmadabad, Punjab and Trivandrum.48,50,51,54,55,56
Guwahati
being the economic hub and the largest metropolis of north east India very well explains
this high prevalence of overweight among adolescents.
5.1.6 Junk food consumption
There are no gender variations in terms of junk food consumption. Also
there is no significant difference in junk food consumption between adolescents of
government schools and private owned schools. This may be due to the fact that cheap
junk foods like ‗mixture‘, fried ‗pakoris‘ etc. are easily available near the government
schools. Junk food consumption was three times higher among the adolescents who have
lunch in hotels and bakery shops compared to those who have lunch at their home. Junk
food consumption was significantly higher among those who do not have dinner with
their parents or have dinner while watching television. Without parental control
adolescents would definitely opt for junk foods which are high on sugar, salt and fat

47
content. Also lack of parental control gives the adolescents a sense of autonomy to
choose their own choice of foods. Adolescents who go out for dinner has a two times
higher chance of consuming junk foods compared to those who never dines out. Also
adolescents who consume moderate amounts of vegetables and fruits daily are less likely
to eat junk items compared to those who take low amounts of vegetables and fruits. These
factors found to be significantly associated with junk food consumption had also been
confirmed in other studies.12,15
Interestingly being overweight was not found to be associated with junk
food consumption. This actually highlights the fact that junk food consumption is widely
prevalent among the urban adolescents. Junk foods are being consumed by the non
overweight and overweight alike. An overwhelming majority of the adolescents, 79.4 per
cent, consumes junk food on a daily basis. So it would require to investigate into the other
determinants of overweight and obesity such as sedentary lifestyle – like absence of
participation in outdoor activities, hours of watching television or sitting in front of the
computer and increased burden of academics; socio- economic status; heriditary factors;
some medical conditions and use of certain medicines. It also emphasizes the fact that
aetiology of being overweight or obese is a complex one and cannot be explained by
taking only one factor into consideration.
5.1.7 Vegetable and fruit consumption
As indicated in previous studies12,15,61,63
vegetable and fruit consumption was
found to be significantly associated with family meal (dinner), parental modelling of
vegetable and fruit eating in front of children, availability and accessibility (p≤0.1). In
addition to these factors the study also showed significant association of type of school
and whether tiffin was brought to school. Compared to private school adolescents the
48
adolescents from government schools are less likely to consume moderate amounts of
vegetables and fruits. This would be mainly due to the differential purchasing ability of
fruits and vegetables. Those who brought tiffin to school frequently are more likely to
consume moderate amounts of vegetables and fruits. Definitely the adolescents who do
not bring tiffin have food items from nearby shops and hotels and most of those items are
junk foods. Although adolescents having lunch at home are more likely to consume more
vegetables and fruits this association was not found to be significant (p=0.14).
Adolescents having dinner with parents and if influenced by parents to eat vegetables
and fruits through modelling are more likely to consume more amounts of fruits and
vegetables. As expected availability and accessibility (served or not) significantly
increases the chances of consuming more vegetables and fruits.
5.2 Strengths of the study
To the best of my knowledge, first study in India looking at some of the
environmental and personal factors that influence adolescent food choices.
Also the first study to assess the prevalence of overweight and obesity among
school going adolescents in Assam (as per principal investigator‘s knowledge).
All the surveys and the physical measurements were taken by the principal
investigator himself thereby avoiding inter-observer bias.
5.3 Limitations of the study
The study was a cross-sectional survey and as such all the limitations of a cross
sectional design apply to this study as well.
Purely urban based study so results cannot be extrapolated to other areas.
Adolescents from ‗madrasas‘ and night schools were not a part of the study.
49
5.4 Conclusions
The present study tries to understand some of the environmental and personal
factors influencing adolescent‘s eating behaviour and food choices. Conclusions of this
study are:
Early school timings act as a barrier to have regular breakfast resulting in skipping
of breakfast by the adolescents.
Vast majority of the adolescents consume junk foods of some kind or the other on
a daily basis.
Government school adolescents consume more unhealthy junk items.
Majority of the adolescents feel that the benefits of eating more vegetables and
fruits were not taught at school.
Prevalence of overweight/obesity is comparable to that observed in studies done
in big cities like Delhi, Chennai, Pune, Ahmadabad, Punjab, Bangalore and
Trivandrum.
Place of lunch, family meal (dinner), eating dinner out and moderate consumption
of vegetables and fruits are important factors influencing junk food consumption
by adolescents.
Better economic status, taking tiffin to school, family meal (dinner), parental
modelling of eating, availability and accessibility could contribute to moderate
consumption of vegetables and fruits by adolescents.
Arguably what we have seen from this study may be just the tip of the ice-berg. It
is likely that a greater proportion of adolescents consume junk foods and a lesser
proportion eats moderate amounts of vegetables and fruits.
50
5.5 Recommendations
School timings needs to be changed so as to encourage children to eat a meal
in the morning.
Provide nutrition education and counselling to adolescents that focuses on the
positive aspects of a healthy diet, such as increased energy levels, better
academic performance, improved concentration, and better athletic
performance.
Teach adolescents to choose wisely when eating at fast food restaurants or
buying foods at bakeries, shops and from street side vendors.
Encourage parents to keep a variety of healthy foods in the home, within easy
reach and counsel them on the importance of parental control on food choices
of their children and the benefits of having family meals together.
Work with school administration, parent-teacher organizations, school food
service staff, local politicians and urban planners to develop policies that limit
the sales of soft drinks, candy, snack foods, chips and fast foods within
schools and to pass ordinances that limit the building or location of fast food
restaurants, street side vendors and convenience stores close to schools.
Mid day meal programme for government schools should be extended to
cover adolescents also.
51
References:
1. World Health Organization.Fact sheet: obesity and overweight. Available online:
http://www.who.int/mediacentre/factsheets/fs311/en/ (accessed on 2 February 2011)
2. Popkin BM. The nutrition transition and obesity in the developing world. J Nutr
2001; 131: 871S-873.
3. InternationalObesityTaskforce.Availableonline:http://www.iaso.org/iotf/obesity/obesi
-ty.
4. Whitaker CR, Dietz WH. Role of the prenatal environment in the development of
obesity. J Pediatr 1998; 132 : 768-76.
5. Mossberg HO. 40 year‘s follow-up of overweight children.Lancet 1989; 2 : 491-3.
6. Must A, Jacques PF, Dallal GE, Bagsma CJ, Dietz WH. Longterm morbidity and
mortality of overweight adolescents: a follow-up of the Harvard growth study of 1922
to 1935.N Engl J Med 1992; 327 : 1350-5.
7. Wright CM, Parker L, Lamont D, Graft AW. Implications of childhood obesity for
adult health: Findings from thousand families cohort study. BMJ 2001; 323 : 1280-4.
8. Yach D, Hawkes C, Gould CL & Hofman KJ . The global burden of chronic diseases:
overcoming impediments to prevention and control. JAMA 2004 ;291:2616–22.
9. Eck LH. Klesges RC, Hansson CL, Slawson D. Children at familial risks of obesity:
an examination of dietary intake, physical activity and weight status. Int J Obes Relat
Metab Disord 1992; 16: 71-8.
10. Affenito SG, Thompson DR, Barton BA, Franko DL, Daniels SR, Obarzanek E, et al.
Breakfast consumption by African–American and white adolescent girls correlates
positively with calcium and fiber intake and negatively with body mass index.
Journal of the American Dietetic Association 2005;105(6):938–45
11. Ludwig DS, Peterson KE, Gortmaker SL. Relation between consumption of sugar-
sweetened drinks and childhood obesity: A prospective, observational analysis. The
Lancet 2001;357(9255):505–8.
52
12. Story M, Neumark-Sztainer D & French S .Individual and environmental influences
on adolescent eating behaviors.J Am Diet Assoc 2002; 102: S40–S51.
13. Shi Z, Lien N, Kumar BN & Holmboe-Ottesen G .Socio-demographic differences in
food habits and preferences of school adolescents in Jiangsu Province, China.Eur J
Clin Nutr2005; 59: 1439–48.
14. Lien N, Jacobs DR Jr & Klepp KI . Exploring predictors of eating behaviour among
adolescents by gender and socioeconomic status. Public Health Nutr2002; 5: 671–81
15. Neumark-Sztainer D, Hannan PJ, Story M, Croll J & Perry C. Family meal patterns:
associations with sociodemographic characteristics and improved dietary intake
among adolescents. J Am Diet Assoc2003; 103: 317–22.
16. World Health Organization (WHO), 1999. Obesity: Preventing and Managing the
Global epidemic, Report of WHO Consultation; technical research Series No.894,
2000: pp 1-253
17. Popkin BM. The shift in stages of the nutrition transition in the developing world
differs from past experiences.Public Health Nutr 2002; 5: 205–214.
18. Popkin BM,Gordon-Larsen P. The nutrition transition:worldwide obesity dynamics
and their determinants. International Journal of Obesity 2004;28:S2-S9
19. Popkin BM. Global nutrition dynamics: the world is shifting rapidly toward a diet
linked with noncommunicable diseases. Am J Clin Nutr 2006;84:289–98
20. Popkin B. Nutritional patterns and transitions. Popul Dev Rev 1993;19:138–57.
21. Popkin BM. The nutrition transition in low-income countries: an emerging crises.
Nutr Rev 1994; 52: 285–298.
22. Popkin BM. An overview on the nutrition transition and its health implications: the
Bellagio meeting. Public Health Nutr 2002; 5: 93–103.
23. Popkin BM, Conde W, Hou N, Monteiro C. Is there a lag globally in obesity trends
for children as compared to adults? Obesity 2006;14:1846–53
24. Mendez MA, Monteiro, Carlos A, Popkin BM. Overweight exceeds underweight
among women in most developing countries. Am J Clin Nutr 2005;81:714–21.
25. Popkin BM, Nielsen SJ. The Sweetening of the World‘s Diet. Obes Res.
2003;11:1325-32.
26. Guthrie JF, Morton JF. Food sources of added sweeteners in the diets of Americans. J
Am Diet Assoc. 2000;100:43–51.
53
27. Harnack L, Stang J, Story M. Soft drink consumption among US children and
adolescents: nutritional consequences.J Am Diet Assoc. 1999;99:436–41.
28. Ludwig DS. The glycemic index: physiological mechanisms relating to obesity,
diabetes, and cardiovascular disease. J Am Med Assoc. 2002;287:2414–23.
29. DiMeglio DP, Mattes RD. Liquid versus solid carbohydrate:effects on food intake
and body weight. Int J Obes Relat Metab Disord. 2000;24:794–800
30. Bowman SA, Gortmaker S, Ebbeling C, Pereira MA, Ludwig D. Effects of fast-food
consumption on energy intake and diet quality among children on a national
household survey. Pediatrics. 2004;113:112–8.
31. Nielsen SJ, Siega-Riz AM, Popkin BM. Trends in energy intake in the U.S. between
1977 and 1996: similar shifts seen across age groups. Obes Res. 2002;10:370–8.
32. Pereira MA, Kartashov AI, Ebbeling CB, Van Horn L, Slattery ML, Jacobs DR Jr.
Fast-food habits, weight gain and insulin resistance (the CARDIA) study: 15-year
prospective analysis. Lancet. 2005;365:36–42.
33. Nielsen SJ, Popkin BM. Patterns and trends in portion sizes, 1977–1998. JAMA.
2003;289:450–3.
34. Duffey KJ, Gordon-Larsen P, Jacobs DR Jr., Williams OD, Popkin BM. Differential
associations of fast food and restaurant food consumption with 3-y change in body
mass index: the Coronary Artery Risk Development in Young Adults Study. Am J
Clin Nutr 2007;85:201–8.
35. Adair SL, Popkin BM. Are Child Eating Patterns Being Transformed Globally? Obes
Res. 2005; 13:1281–99
36. Nielsen SJ, Siega-Riz AM, Popkin BM. Trends in food locations and sources among
adolescents and young adults. Prev Med. 2002;35:107–13.
37. Lytle L, Seifert S, Greenstein J, McGovern P. How do children‘s eating patterns and
food choices change over time? Results from a cohort study. Am J Health Promotion.
2000;14:222–8.
38. Pi-Sunyer X. The Medical Risks of Obesity. Postgrad Med. 2009; 121(6): 21–33
39. Francis DK, Van den Broeck J, Younger N, McFarlane S, Rudder K, Gordon-
Strachan G, et al. Fast-food and sweetened beverage consumption: association with
overweight and high waist circumference in adolescents. Public Health Nutr. 2009;
12 (8): 1106-14.
40. Hill JO, Peters JC: Environmental contributions to the obesity epidemic. Science
1998, 280:1371-74.
54
41. Grundy SM: Multifactorial causation of obesity: implications for prevention. Am J
Clin Nutr 1998, 67:563S-572S.
42. Link K, Moell C, Garwicz S, Cavallin-Stahl E, Bjork J, Thilen U, Ahren B, Erfurth
EM.Growth hormone deficiency predicts cardiovascular risk in young adults treated
for acute lymphoblastic leukemia in childhood. J Clin Endocrinol Metab
2004,89:5003-12.
43. Styne DM. Obesity in childhood: what's activity got to do with it? American Journal
of Clinical Nutrition 2005, 81:337-38.
44. Heitmann BL, Kaprio J, Harris JR, Rissanen A, Korkeila M, Koskenvuo M. Are
genetic determinants of weight gain modified by leisure-time physical activity? A
prospective study of Finnish twins. American Journal of Clinical Nutrition 1997,
66:672-78.
45. Gordon-Larsen P, Griffiths P, Bentley ME, Ward DS, Kelsey K, Shields K,
Ammerman A.Barriers to physical activity: qualitative data on caregiver-daughter
perceptions and practices. Am J Prev Med 2004, 27:218-23.
46. Cullen KW,Baranowski T , Rittenberry L , Cosart C, Hebert D, Moor C.Child
reported family and peer influences on fruit, juice and vegetable consumption. Health
Education research 2001; 16:187-200
47. Department of elementary education and literacy, Ministry of Human Resource
Development, Govt.of India, 2005. Available from
URL:http://ssa.nic.in/research/outschool.asp. Accessed January12, 2011.
48. Kapil U, Singh P, Pathak P, Dwivedi SN. Prevalence of obesity amongst affluent
adolescent school children. Indian Pediatrics. 2001;39:449-52.
49. Stigler MH,Arora M, Dhavan P,Shrivastav R, Reddy KS,Perry CL. Weight-related
concerns and weight-control behaviors among overweight adolescents in Delhi, India:
A cross-sectional study. International Journal of Behavioral Nutrition and Physical
Activity 2011, 8:9
50. Kaur S,Sachdev HPS, Dwivedi SN,Lakshmy R, Kapil U. Prevalence of overweight
and obesity amongst school children in Delhi, India. Asia Pac J Clin Nutr 2008;17
(4):592-6
51. Subramanyam V, Jayasree R, Mohmad Rafi. Prevalence of overweight and obesity in
Affluent girls in Chennai 1981 and 1998, Indian Pediatrics 2003;40(4):332-6
52. Goyal RK, Shah VN, Saboo BD, Phatak SR, Shah NN, Gohel MC, Raval PB, Patel
SS. Prevalence of overweight and obesity in Indian adolescent school going children:
its relationship with socioeconomic status and associated lifestyle factors. J Assoc
Physicians India. 2010;58:151-8
55
53. Laxmaiah A, Nagalla B, Vijayaraghavan K, Nair M. Factors affecting prevalence of
overweight among 12- to 17-year-old urban adolescents in Hyderabad, India. Obesity
(Silver Spring). 2007 ;15(6):1384-90
54. Aggarwal T, BhatiaRC,Singh D, SobtiPC.Prevalence of obesity and overweight in
affluent adolescents from ludhiana, Punjab. Indian Pediatr 2008;45:500-01
55. Khadilkar VV,Khadilkar AV.Prevalence of obesity in affluent school boys in
pune.Indian Pediatr 2004;41:857-8
56. Bharati DR, Deshmukh PR, Garg BS. Correlates of overweight & obesity among
school going children of Wardha city, Central India. Indian J Med
Res. 2008;127(6):539-4
57. Bishwalata R, Singh AB, Singh AJ, Devi LU, Singh RK. Overweight and obesity
among school children in Manipur, India. Natl Med J India 2010;23(5):263-6
58. Cole T, Bellizzi MC, Flegal KM, Dietz WH. Establishing a standard definition for
child overweight and obesity: international survey. BMJ. 2000;320:1–6
59. Newby PK: Are dietary intakes and eating behaviors related to childhood obesity? A
comprehensive review of the evidence. J Law, Med, Ethics 2007, 35:35-60
60. Liu SM, Sesso HD, Manson JE, Willett WC, Buring JE. Is intake of breakfast cereals
related to total and cause-specific mortality in men? American Journal of Clinical
Nutrition 2003; 77(3): 594–9
61. Rampersaud GC, Pereira MA, Girard BL, Adams J, Metzl JD.Breakfast habits,
nutritional status, body weight,and academic performance in children and
adolescents.Journal of the American Dietetic Association 2005; 105(5):743–60.
62. Siega-Riz AM, Carson T, Popkin B. Three squares or mostly snacks--what do teens
really eat? A sociodemographic study of meal patterns. J Adolesc Health
1998;22(1):29-36.
63. Baronowski T. Families and health action. Handbook of health behaviour research,
personal and social determinants. Plenum press,New York 1997; 179-205
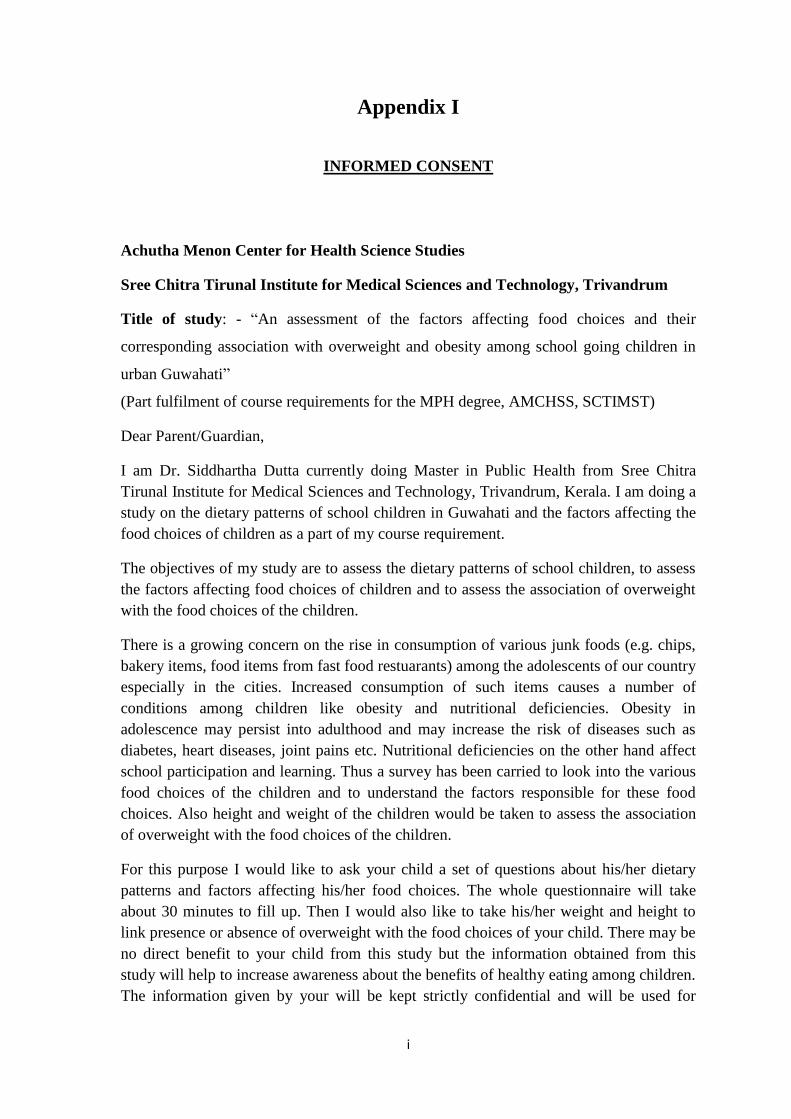
i
Appendix I
INFORMED CONSENT
Achutha Menon Center for Health Science Studies
Sree Chitra Tirunal Institute for Medical Sciences and Technology, Trivandrum
Title of study: - ―An assessment of the factors affecting food choices and their
corresponding association with overweight and obesity among school going children in
urban Guwahati‖
(Part fulfilment of course requirements for the MPH degree, AMCHSS, SCTIMST)
Dear Parent/Guardian,
I am Dr. Siddhartha Dutta currently doing Master in Public Health from Sree Chitra
Tirunal Institute for Medical Sciences and Technology, Trivandrum, Kerala. I am doing a
study on the dietary patterns of school children in Guwahati and the factors affecting the
food choices of children as a part of my course requirement.
The objectives of my study are to assess the dietary patterns of school children, to assess
the factors affecting food choices of children and to assess the association of overweight
with the food choices of the children.
There is a growing concern on the rise in consumption of various junk foods (e.g. chips,
bakery items, food items from fast food restuarants) among the adolescents of our country
especially in the cities. Increased consumption of such items causes a number of
conditions among children like obesity and nutritional deficiencies. Obesity in
adolescence may persist into adulthood and may increase the risk of diseases such as
diabetes, heart diseases, joint pains etc. Nutritional deficiencies on the other hand affect
school participation and learning. Thus a survey has been carried to look into the various
food choices of the children and to understand the factors responsible for these food
choices. Also height and weight of the children would be taken to assess the association
of overweight with the food choices of the children.
For this purpose I would like to ask your child a set of questions about his/her dietary
patterns and factors affecting his/her food choices. The whole questionnaire will take
about 30 minutes to fill up. Then I would also like to take his/her weight and height to
link presence or absence of overweight with the food choices of your child. There may be
no direct benefit to your child from this study but the information obtained from this
study will help to increase awareness about the benefits of healthy eating among children.
The information given by your will be kept strictly confidential and will be used for

ii
research purpose only. Information will not be disclosed to school authorities or anyone
else under any circumstances.
I have sought the permission of the school authorities for conducting this study. However
participation is purely voluntary. You are free to refuse participation of your child in this
study. However I would really appreciate it if you give your consent for your child‘s
participation in this study as it would provide us with valuable information.
Please tick your response
Yes, I am willing to let my son/daughter to participate in this study
No, I am not willing to let my son/daughter participate in this study
Signature of parent/guardian ___________________________ Date _________
Relationship with the child _______________________
If you have any queries you can contact.
1. Dr. Siddhartha Dutta
MPH 2010 , AMCHSS,
SCTIMST, Trivandrum.
Mobile No. 8891129883
2. Dr. P. Sankara Sarma
Professor,
AMCHSS, SCTIMST,
Trivandrum.
Ph. No. 0471-2524232
3. Dr. Anoop Kumar Thekkuveettil, Member Secretary,
Institutional Ethics Committee, SCTIMST, Trivandrum.
Ph. No. 0471-2520256
Thank you.

iii
Appendix II
Assent
Achutha Menon Center for Health Science Studies
Sree Chitra Tirunal Institute for Medical Sciences and Technology, Trivandrum
Title of study: - ―An assessment of the factors affecting food choices and their
corresponding association with overweight and obesity among school going children in
urban Guwahati‖
Dear Student,
I am Dr. Siddhartha Dutta currently doing Master in Public Health from Sree Chitra
Tirunal Institute for Medical Sciences and Technology, Trivandrum, Kerala. I am doing a
study on the dietary patterns of school children in Guwahati and the factors affecting the
food choices of children as a part of my course requirement.
The objectives of my study are to assess the dietary patterns of school children, to assess
the factors affecting food choices of children and to assess the association of overweight
with the food choices of the children.
I would like to ask you some questions about your dietary behaviour and some of the
factors that may affect your food choices. Also I would like to take your height and
weight to complete my study objectives. The whole questionnaire will take about 25-30
minutes to fill up. There may be no direct benefit to you from this study but the
information obtained from this study will help to increase awareness about the benefits of
healthy eating.
The information given by you will be kept strictly confidential and will be used for
research purpose only. Information will not be disclosed to your parents, school
authorities or anyone else under any circumstances.
I have sought the permission of school authorities and consent of your parents to let you
participate in this study. However participation is purely voluntary. You may choose not
to participate in this study if you do not want to. You may withdraw from this study at
any time after joining. However I would really appreciate it if you give your assent for
your participation in this study.
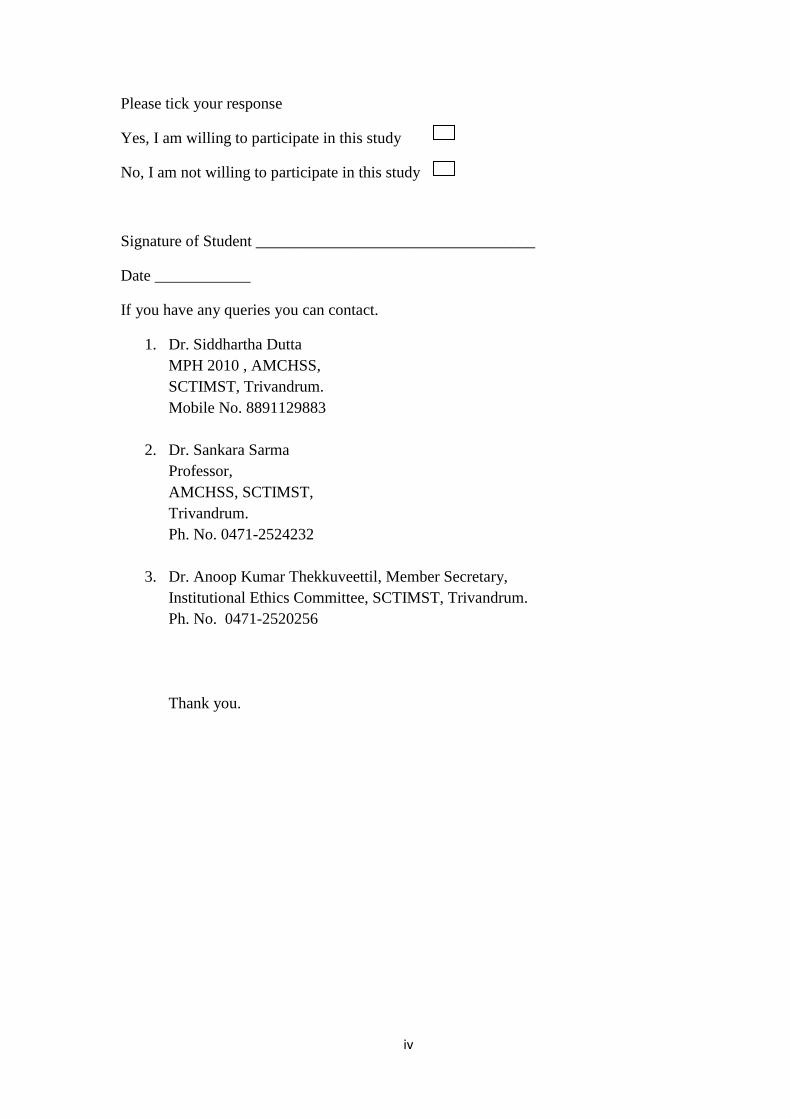
iv
Please tick your response
Yes, I am willing to participate in this study
No, I am not willing to participate in this study
Signature of Student ___________________________________
Date ____________
If you have any queries you can contact.
1. Dr. Siddhartha Dutta
MPH 2010 , AMCHSS,
SCTIMST, Trivandrum.
Mobile No. 8891129883
2. Dr. Sankara Sarma
Professor,
AMCHSS, SCTIMST,
Trivandrum.
Ph. No. 0471-2524232
3. Dr. Anoop Kumar Thekkuveettil, Member Secretary,
Institutional Ethics Committee, SCTIMST, Trivandrum.
Ph. No. 0471-2520256
Thank you.
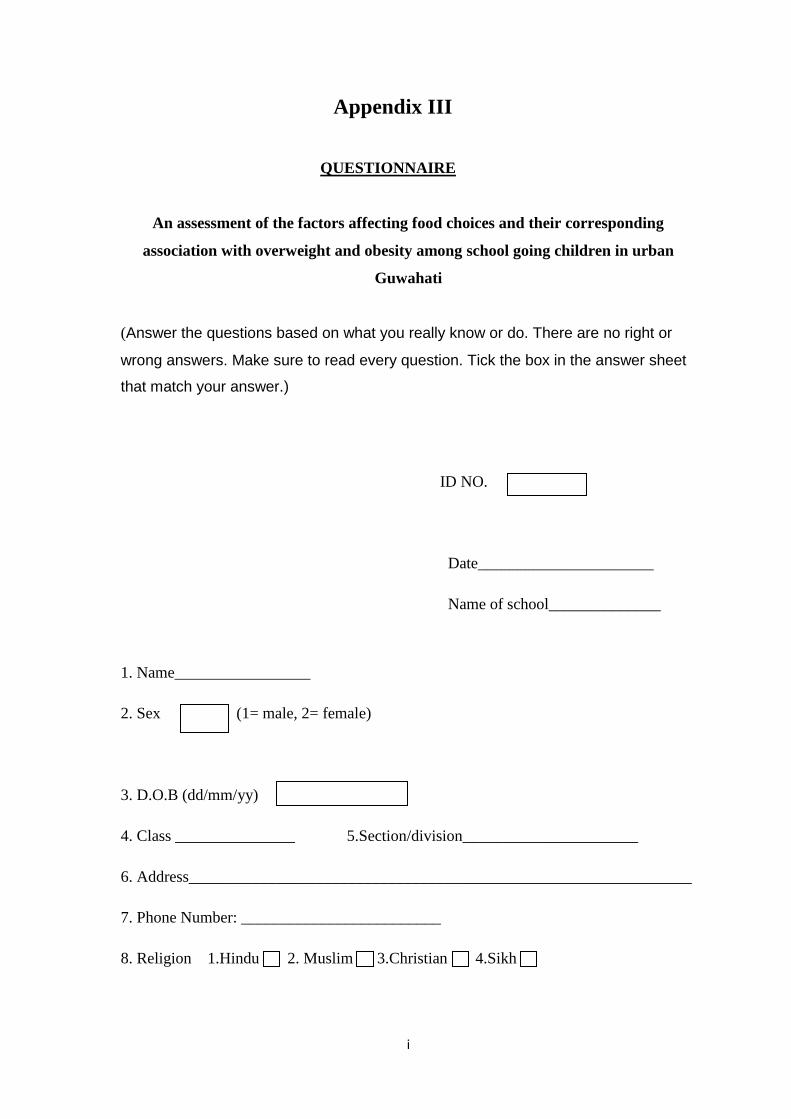
i
Appendix III
QUESTIONNAIRE
An assessment of the factors affecting food choices and their corresponding
association with overweight and obesity among school going children in urban
Guwahati
(Answer the questions based on what you really know or do. There are no right or
wrong answers. Make sure to read every question. Tick the box in the answer sheet
that match your answer.)
ID NO.
Date______________________
Name of school______________
1. Name_________________
2. Sex (1= male, 2= female)
3. D.O.B (dd/mm/yy)
4. Class _______________ 5.Section/division______________________
6. Address_______________________________________________________________
7. Phone Number: _________________________
8. Religion 1.Hindu 2. Muslim 3.Christian 4.Sikh
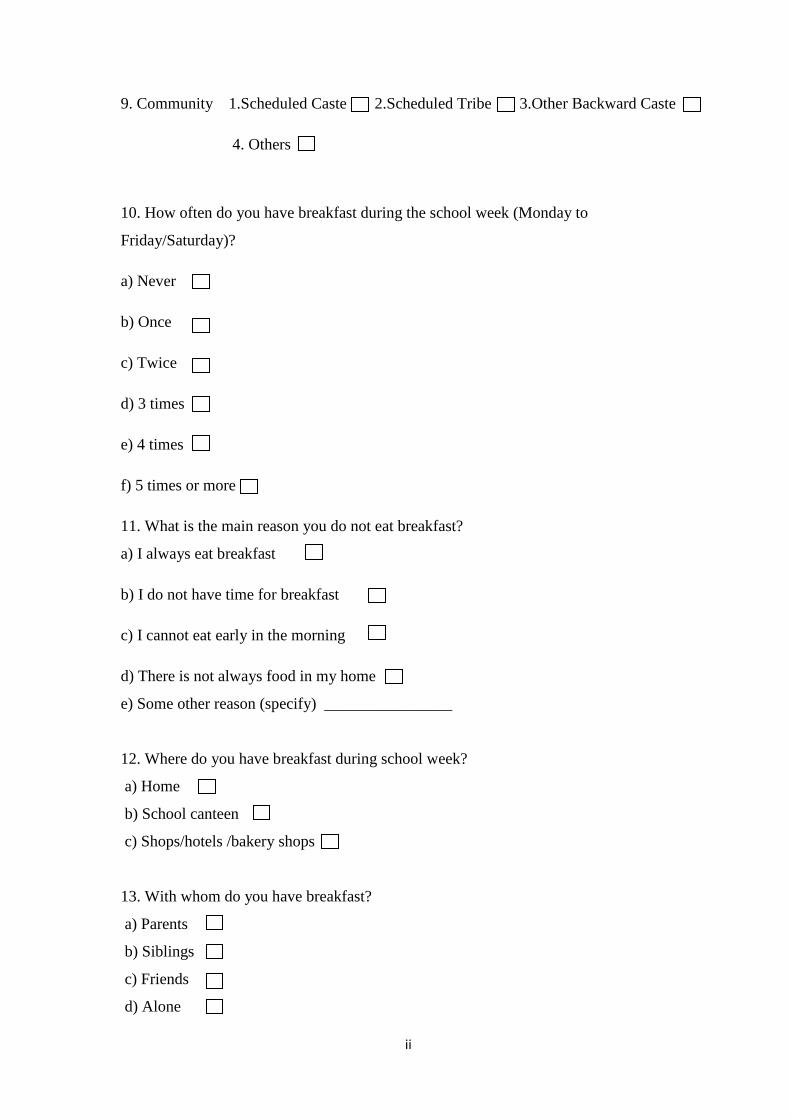
ii
9. Community 1.Scheduled Caste 2.Scheduled Tribe 3.Other Backward Caste
4. Others
10. How often do you have breakfast during the school week (Monday to
Friday/Saturday)?
a) Never
b) Once
c) Twice
d) 3 times
e) 4 times
f) 5 times or more
11. What is the main reason you do not eat breakfast?
a) I always eat breakfast
b) I do not have time for breakfast
c) I cannot eat early in the morning
d) There is not always food in my home
e) Some other reason (specify) ________________
12. Where do you have breakfast during school week?
a) Home
b) School canteen
c) Shops/hotels /bakery shops
13. With whom do you have breakfast?
a) Parents
b) Siblings
c) Friends
d) Alone
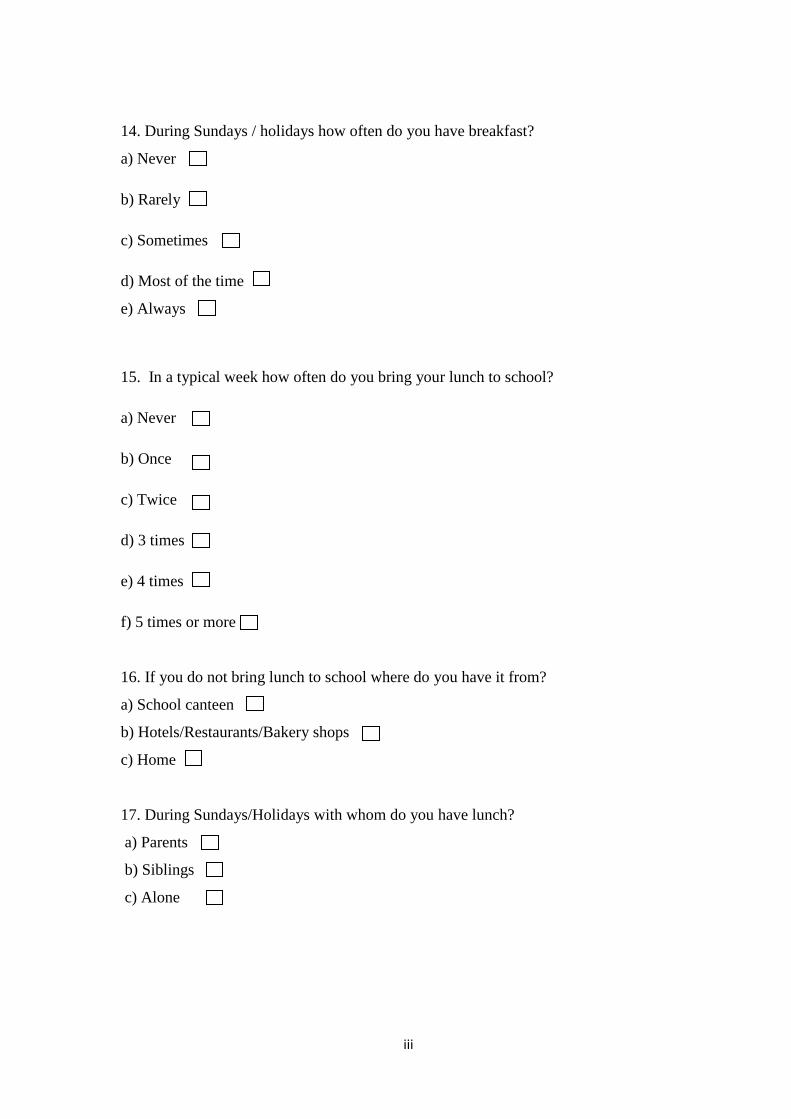
iii
14. During Sundays / holidays how often do you have breakfast?
a) Never
b) Rarely
c) Sometimes
d) Most of the time
e) Always
15. In a typical week how often do you bring your lunch to school?
a) Never
b) Once
c) Twice
d) 3 times
e) 4 times
f) 5 times or more
16. If you do not bring lunch to school where do you have it from?
a) School canteen
b) Hotels/Restaurants/Bakery shops
c) Home
17. During Sundays/Holidays with whom do you have lunch?
a) Parents
b) Siblings
c) Alone
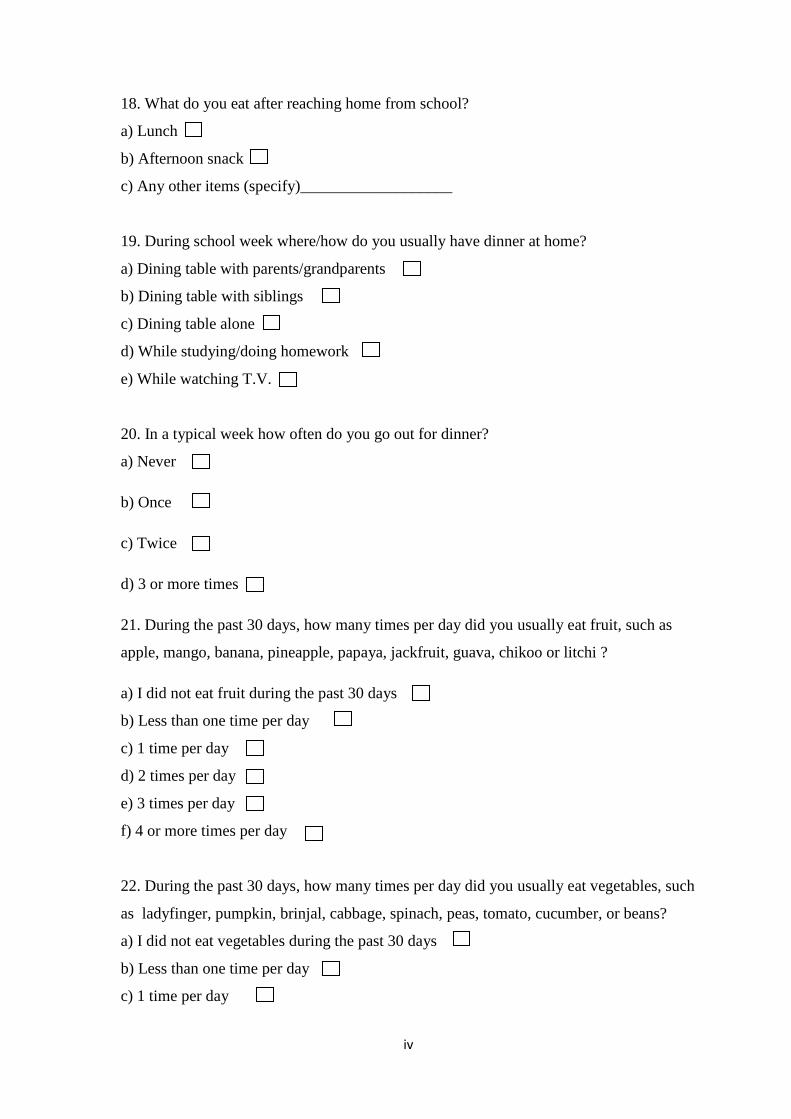
iv
18. What do you eat after reaching home from school?
a) Lunch
b) Afternoon snack
c) Any other items (specify)___________________
19. During school week where/how do you usually have dinner at home?
a) Dining table with parents/grandparents
b) Dining table with siblings
c) Dining table alone
d) While studying/doing homework
e) While watching T.V.
20. In a typical week how often do you go out for dinner?
a) Never
b) Once
c) Twice
d) 3 or more times
21. During the past 30 days, how many times per day did you usually eat fruit, such as
apple, mango, banana, pineapple, papaya, jackfruit, guava, chikoo or litchi ?
a) I did not eat fruit during the past 30 days
b) Less than one time per day
c) 1 time per day
d) 2 times per day
e) 3 times per day
f) 4 or more times per day
22. During the past 30 days, how many times per day did you usually eat vegetables, such
as ladyfinger, pumpkin, brinjal, cabbage, spinach, peas, tomato, cucumber, or beans?
a) I did not eat vegetables during the past 30 days
b) Less than one time per day
c) 1 time per day
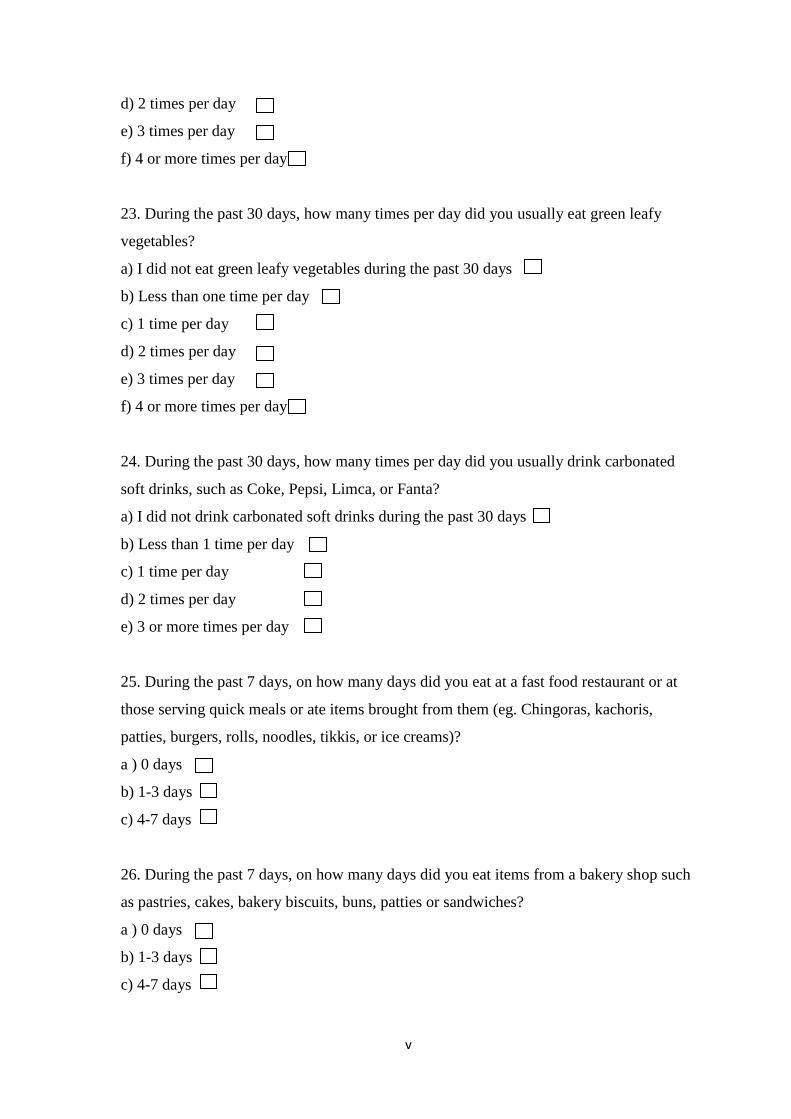
v
d) 2 times per day
e) 3 times per day
f) 4 or more times per day
23. During the past 30 days, how many times per day did you usually eat green leafy
vegetables?
a) I did not eat green leafy vegetables during the past 30 days
b) Less than one time per day
c) 1 time per day
d) 2 times per day
e) 3 times per day
f) 4 or more times per day
24. During the past 30 days, how many times per day did you usually drink carbonated
soft drinks, such as Coke, Pepsi, Limca, or Fanta?
a) I did not drink carbonated soft drinks during the past 30 days
b) Less than 1 time per day
c) 1 time per day
d) 2 times per day
e) 3 or more times per day
25. During the past 7 days, on how many days did you eat at a fast food restaurant or at
those serving quick meals or ate items brought from them (eg. Chingoras, kachoris,
patties, burgers, rolls, noodles, tikkis, or ice creams)?
a ) 0 days
b) 1-3 days
c) 4-7 days
26. During the past 7 days, on how many days did you eat items from a bakery shop such
as pastries, cakes, bakery biscuits, buns, patties or sandwiches?
a ) 0 days
b) 1-3 days
c) 4-7 days
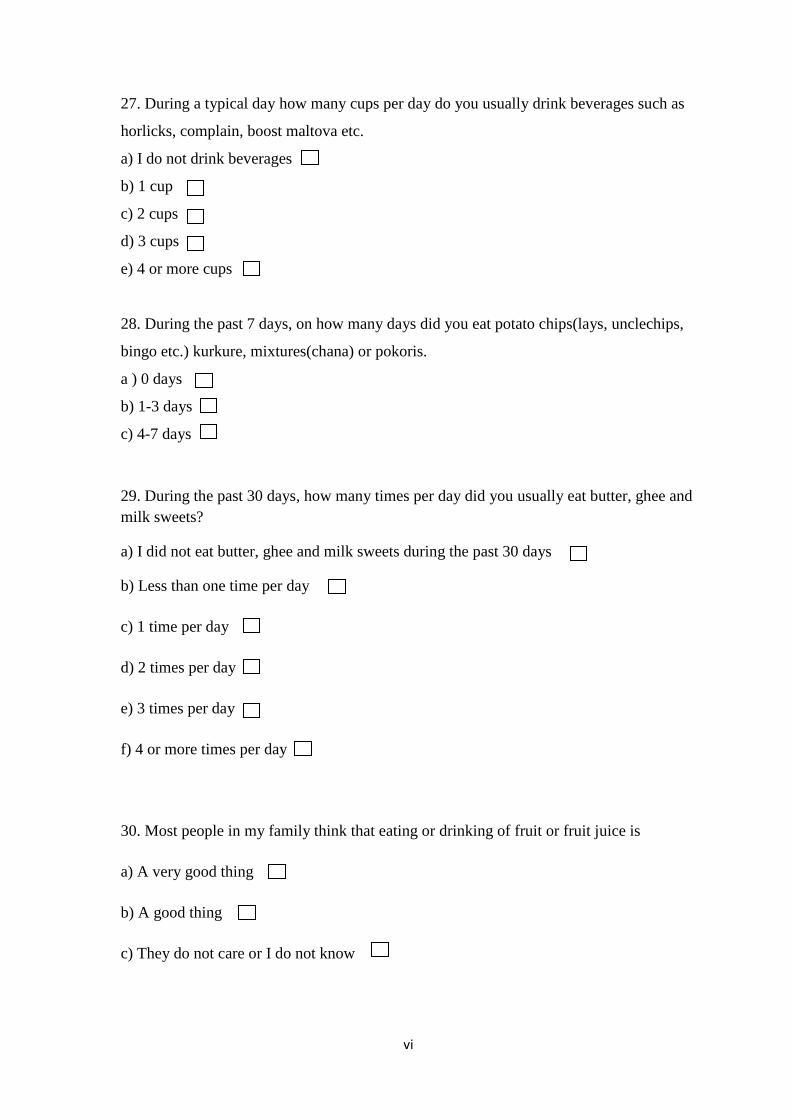
vi
27. During a typical day how many cups per day do you usually drink beverages such as
horlicks, complain, boost maltova etc.
a) I do not drink beverages
b) 1 cup
c) 2 cups
d) 3 cups
e) 4 or more cups
28. During the past 7 days, on how many days did you eat potato chips(lays, unclechips,
bingo etc.) kurkure, mixtures(chana) or pokoris.
a ) 0 days
b) 1-3 days
c) 4-7 days
29. During the past 30 days, how many times per day did you usually eat butter, ghee and
milk sweets?
a) I did not eat butter, ghee and milk sweets during the past 30 days
b) Less than one time per day
c) 1 time per day
d) 2 times per day
e) 3 times per day
f) 4 or more times per day
30. Most people in my family think that eating or drinking of fruit or fruit juice is
a) A very good thing
b) A good thing
c) They do not care or I do not know
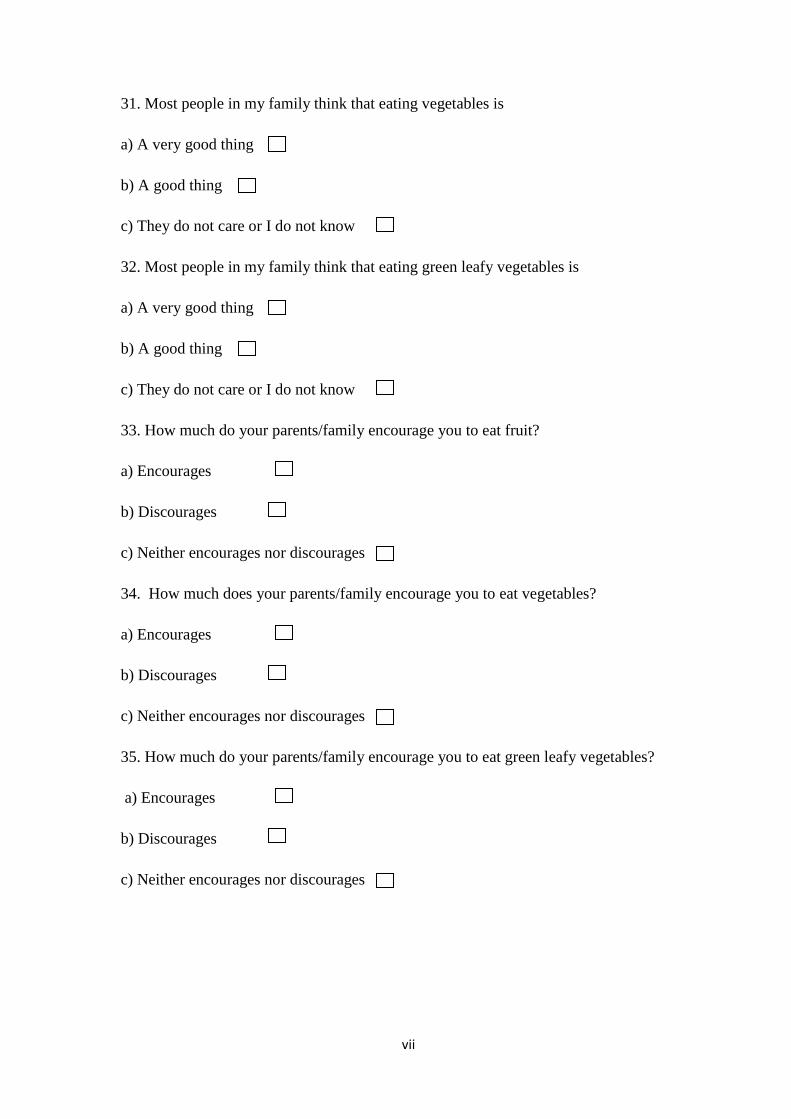
vii
31. Most people in my family think that eating vegetables is
a) A very good thing
b) A good thing
c) They do not care or I do not know
32. Most people in my family think that eating green leafy vegetables is
a) A very good thing
b) A good thing
c) They do not care or I do not know
33. How much do your parents/family encourage you to eat fruit?
a) Encourages
b) Discourages
c) Neither encourages nor discourages
34. How much does your parents/family encourage you to eat vegetables?
a) Encourages
b) Discourages
c) Neither encourages nor discourages
35. How much do your parents/family encourage you to eat green leafy vegetables?
a) Encourages
b) Discourages
c) Neither encourages nor discourages
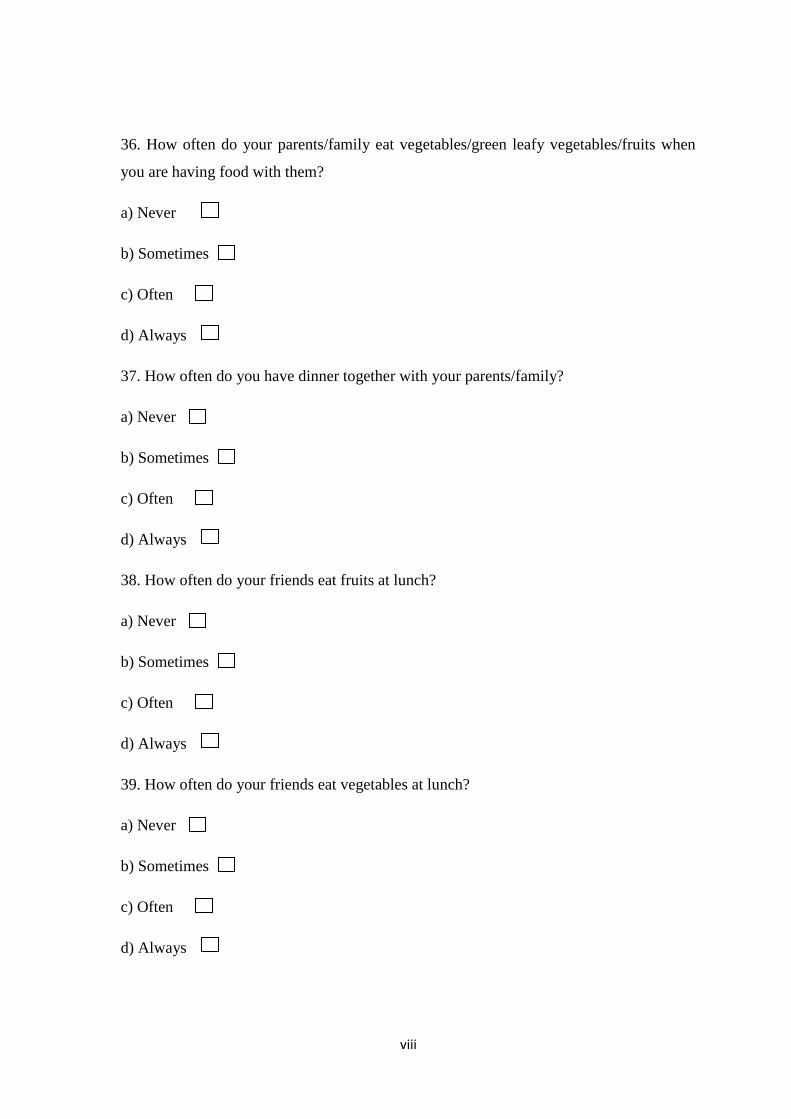
viii
36. How often do your parents/family eat vegetables/green leafy vegetables/fruits when
you are having food with them?
a) Never
b) Sometimes
c) Often
d) Always
37. How often do you have dinner together with your parents/family?
a) Never
b) Sometimes
c) Often
d) Always
38. How often do your friends eat fruits at lunch?
a) Never
b) Sometimes
c) Often
d) Always
39. How often do your friends eat vegetables at lunch?
a) Never
b) Sometimes
c) Often
d) Always
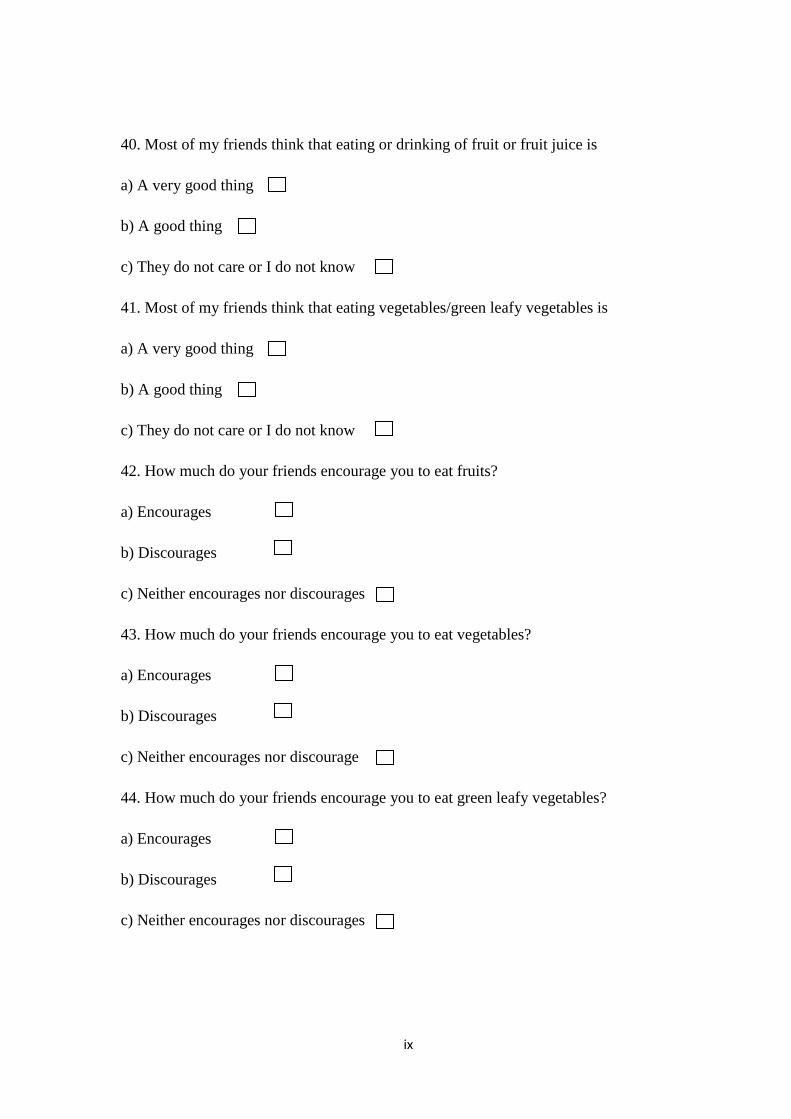
ix
40. Most of my friends think that eating or drinking of fruit or fruit juice is
a) A very good thing
b) A good thing
c) They do not care or I do not know
41. Most of my friends think that eating vegetables/green leafy vegetables is
a) A very good thing
b) A good thing
c) They do not care or I do not know
42. How much do your friends encourage you to eat fruits?
a) Encourages
b) Discourages
c) Neither encourages nor discourages
43. How much do your friends encourage you to eat vegetables?
a) Encourages
b) Discourages
c) Neither encourages nor discourage
44. How much do your friends encourage you to eat green leafy vegetables?
a) Encourages
b) Discourages
c) Neither encourages nor discourages
x
45. How often do your friends eat vegetables/green leafy vegetables/fruits when you are
having food with them?
a) Never
b) Sometimes
c) Often
d) Always
46. Whether any 2 fruits were available in your home in the past week?
a) Yes
b) No
47. Whether any 5 vegetables/green leafy vegetables (not potatoes) were available in your
home in the past week?
a) Yes
b) No
48. Whether any 2 fruits were served to you in your home or in the school canteen in the
past week?
a) Yes
b) No
49. Whether any 5 vegetables/green leafy vegetables (not potatoes) were served to you in
your home or in the school canteen in the past week?
a) Yes
b) No
xi
50. How much do you weigh?
a) _____ kg
51. What is your height?
a) _______ cm. / ___feet ___ inch
52. How do you describe your weight?
a) Very underweight
b) Slightly underweight
c) About the right weight
d) Slightly overweight
e) Very overweight
53. Which of the following are you trying to do about your weight?
a) I am not trying to do anything about my weight
b) Lose weight
c) Gain weight
d) Stay the same weight
54. During the past 30 days, did you exercise to lose weight or to keep from gaining
weight?
a) Yes
b) No
55. During the past 30 days, did you eat less food, fewer calories, or foods low in fat to
lose weight or to keep from gaining weight?
a) Yes
b) No

xii
56. During the past 30 days, did you eat more food, more calories, or foods high in fat to
gain weight?
a) Yes
b) No
(Physical activity is any activity that increases your heart rate and makes you get
out of breath some of the time. Physical activity can be done in sports, playing with
friends, or walking to school. Some examples of physical activity are running, fast
walking, cycling, dancing, or football)
57. During the past 7 days, on how many days were you physically active for a total of at
least 60 minutes per day (DO NOT INCLUDE YOUR PHYSICAL EDUCATION OR
GYM CLASS)?
a) 0 days
b) 1 day
c) 2 days
d) 3 days
e) 4 days
f) 5 days
g) 6 days
h) 7 days
58. During a typical or usual week, on how many days are you physically active for a
total of at least 60 minutes per day (DO NOT INCLUDE YOUR PHYSICAL
EDUCATION OR GYM CLASS)?
a) 0 days
b) 1 day
c) 2 days
d) 3 days
e) 4 days
f) 5 days
g) 6 days
h) 7 days
xiii
59. During the past 7 days, on how many days did you do stretching or strengthening
exercises, such as toe touches, knee bends, push-ups or sit-ups?
a) 0 days
b) 1 day
c) 2 days
d) 3 days
e) 4 days
f) 5 days
g) 6 days
h) 7 days
60. During this school year, were you taught in any of your classes the benefits of healthy
eating?
a) Yes
b) No
c) I do not know
61. During this school year, were you taught in any of your classes the benefits of eating
more fruits and vegetables?
a) Yes
b) No
c) I do not know