Embed Size (px)
Citation preview

An Assessment of the Pakistan-Sri LankaFree Trade Agreement
April, 2015


An Assessment of the Pakistan-Sri Lanka Free Trade Agreem
ent
Acknowledgements:
Team Leader: Samir S. AmirLead Researcher: Danish Hyder
Disclaimer: The findings, interpretations and conclusions expressed herein are those of the author(s) and do not necessarily reflect the views of the Board of Directors and Members of the Pakistan Business Council or the companies they represent.
Any conclusions of analysis based on ITC, IDB, CTS, UNCTSD and WEO data are the responsibility of the author(s) and do not necessarily reflect the opinion of the WTO, IMF or UN.
Although every effort has been made to cross-check and verify the authenticity of the data, the Pakistan Business Council does not guarantee the data included in this work. All data and statistics used are correct as of 1 February, 2015, and may be subject to change.

An Assessment of the Pakistan-Sri Lanka Free Trade Agreem
ent
The PBC’s Member Companies

An Assessment of the Pakistan-Sri Lanka Free Trade Agreem
ent
The PBC’s Member Companies
An Assessment of the Pakistan-Sri Lanka Free Trade Agreem
ent
TABLE OF CONTENTSSection 1: A Brief Introduction to Pakistan-Sri Lanka Trade
1.0 The Pakistan Business Council: An Overview ………………………………… .. 08
Executive Summary
2.0 Key Findings ……………………………………………………………………… ...... 09
2.1. Overview of Pak-Sri Lanka potential for trade ……………………………………… 09
2.2. High Potential Trade Item Lists …………………………………………………….… 10
3.0 Recommendations …………………………………………………………….… ...... 11
3.1. Trade Delegations and Single Country Exhibitions ............................................... 11
3.2. Agreement on changes to FTA terms ................................................................... 11
3.3. Greater involvement of businessmen in drafting of FTA ....................................... 11
3.4. Forums for trade dispute resolution ...................................................................... 11
4.0 Study Objective ................................................................................................ 12
5.0 Pakistan Sri Lanka Free Trade Agreement: Brief Introduction ……… ............ 14
5.1. Short Economy Profiles ......................................................................................... 14
5.2. Top Trading Partners ............................................................................................. 16
5.3. Overview of Pak-Sri Lanka Trade ........................................................................... 18
5.4. Overview of Pakistan’s Exports from the World and to Sri Lanka ........................ 21
5.5. Overview of Pakistan’s Imports from the World and from Sri Lanka………… ....... 26
Section 2: Analysis of Pakistan’s Exports to Sri Lanka under FTA
6.0 Prelimanry Analysis of Pakistani Exports to Sri Lanka Under FTA ..................................................................................... 29
6.1 Comparison of Pakistan and India’s Trade with Sri Lanka ................................... 31
7.0 Analysis of Pakistan’s Exports to Sri Lanka ................................................... 33
7.1. TradePotential≥USD10million .......................................................................... 35
7.2. USD5million≤TradePotential<USD10million ................................................. 37
7.3. USD1million≤TradePotential<USD5million .................................................. 39
7.4. High Trade Potential, Favourable CAGR items with tariff advantage over India … 41
7.5. High Trade Potential, Favourable CAGR items that should receive Tariff concessions ….. ................................................................................ 42
7.6. Two digit HS codes with High Trade Potential ...................................................... 45
7.7. Two digit HS codes with High Trade Potential and favourable CAGR values ...... 46
7.8. Comparison with India for high potential Pakistani products ……… .................... 47
7.9. Items on Sri Lanka’s no concession list with Pakistan RCA advantage …… ........ 48

An Assessment of the Pakistan-Sri Lanka Free Trade Agreem
ent
Section 3: Analysis of Sri Lanka’s Exports to Pakistan under FTA
8.0 Preliminary Analysis of Sri Lankan Exports to Pakistan Under FTA ........................................................................ 51
8.1. Comparison of Sri Lanka and China trade with Pakistan ...................................... 53
9.0 Analysis Of Sri Lanka’s Exports To Pakistan ................................................... 55
9.1. TradePotential≥USD10million…………………………… .................................. 55
9.2. USD5million≤TradePotential<USD10million ................................................. 57
9.3. USD1million≤TradePotential<USD5million .................................................. 58
9.4. USD500,000≤TradePotential<USD1million………. ...................................... 59
9.5. High Trade Potential, Favourable CAGR items that should receive Tariff concessions ….. ............................................................. 60
9.6. Two digit HS codes with High Trade Potential …… ............................................... 61
9.7. Two digit HS codes with High Trade Potential and favourable CAGR values …. .. 62
9.8. Items on Pakistan’s no concession list with Sri Lankan RCA Advantage ............. 63
Section 4: Concerns and Recommendations
10.0 General Concerns ............................................................................................ 65
10.1. Lack of interest in Pak-Sri Lanka trade .................................................................. 65
10.2. Unilateral changes made to FTA terms …………………………………………… ... 65
10.3. Insufficient involvement of businessmen in drafting of FTA……………………… .. 66
10.4. Lack of effective trade dispute resolution ……………………………………… ....... 66
11.0 Views of Selected High Potential Pakistani Exporters ................................... 66
11.1. Plastics …………………………………………………………………………………. 66
11.2. Fruits and Vegetables …………………………………………………………… ........ 66
11.3. Articles of Iron and Steel (Pipes) ........................................................................... 67
12.0 Recommendations ........................................................................................... 67
12.1. Trade Delegations and Single Country Exhibitions .............................................. 67
12.2. Increased involvement of businessmen in drafting of FTA ................................... 68
12.3. Discussion before change in FTA terms ............................................................... 68
12.4. Forums for efficient resolution of trade disputes .................................................. 69

An Assessment of the Pakistan-Sri Lanka Free Trade Agreem
ent
Annexures
Annexure A: List of most exportable product lines ................................................. 71
Table of Pakistani Exports to Sri Lanka .......................................................................... 71
Table of Sri Lankan Exports to Pakistan ......................................................................... 86
Annexure B: List of product lines on no concession lists with high RCA .............. 95
Table of high RCA Pakistani products with no concession................................. ........... 95
Table of high RCA Sri Lankan products with no concession ......................................... 98

An Assessment of the Pakistan-Sri Lanka Free Trade Agreem
ent
Section 1 A Brief
Introduction to Pakistan-Sri Lanka
Trade

08
An Assessment of the Pakistan-Sri Lanka Free Trade Agreem
ent
1.0 THE PAKISTAN BUSINESS COUNCIL: AN OVERVIEW
The Pakistan Business Council (PBC) is a business policy advocacy forum, representing private-sector businesses that have substantial investments in Pakistan’s economy. It was formed in 2005 by 14 (now 47) of Pakistan’s largest enterprises, including multinationals, to allow businesses to meaningfully interact with government and other stakeholders. The Pakistan Business Council is a pan-industry advocacy group. It is not a trade body nor does it advocate for any specific business sector. Rather, its key advocacy thrust is on easing barriers to allow Pakistani businesses to compete in regional and global arenas. The PBC works closely with the relevant government departments, ministries, regulators and institutions, as well as other stakeholders including professional bodies, to develop consensus on major issues which impact the conduct of business in and from Pakistan. The PBC has submitted key position papers and recommendations to the government on legislation and other government policies affecting businesses. It also serves on various taskforces and committees of the Government of Pakistan as well as those of the State Bank, SECP and other regulators with the objective to provide policy assistance on new initiatives and reforms. The PBC conducts research and holds conferences and seminars to facilitate the flow of relevant information to all stakeholders in order to help create an informed view on the major issues faced by Pakistan. The PBC’s Founding Objectives:
• Toprovidefortheformationandexchangeofviewsonanyquestionconnectedwiththeconduct of businesses in and from Pakistan.
•Toconduct,organize,setup,administerandmanagecampaigns,surveys,focusgroups,workshops, seminars and field works for carrying out research and raising awareness in regard to matters affecting businesses in Pakistan.
•Toacquire,collect,compile,analyze,publishandprovidestatistics,dataanalysisandotherinformation relating to businesses of any kind, nature or description and on opportunities for such businesses within and outside Pakistan.
•TopromoteandfacilitatetheintegrationofbusinessesinPakistanintotheworldeconomyand to encourage the development and growth of Pakistani multinationals.
• TointeractwithGovernmentsintheeconomicdevelopmentofPakistanandtofacilitate,foster and further the economic, social and human resource development of Pakistan.
The PBC is a Section 42 not-for-profit Company Limited by Guarantee. Its working is overseen by a Board of Directors elected every three years by the Membership with the Board being headed by a Non-Executive Chairman. The day-to-day operations of the PBC are run by a professional secretariat headed by a full-time, paid CEO.
More information on the PBC, its members, and its workings, can be found on its website: www.pbc.org.pk

09
An Assessment of the Pakistan-Sri Lanka Free Trade Agreem
ent
Executive Summary
2.0 KEY FINDINGS
2.1. OVERVIEW OF PAK-SRI LANKA TRADE AND POTENTIAL FOR GROWTH
Pakistan and Sri Lanka signed a Free Trade Agreement in July 2002 and it became operational in June 2005. The terms of the FTA were comprehensive and granted 100% immediate concession to major Pakistani exports such as cotton and cement and major Sri Lankan exportssuchasrubberandcoconutproducts.By2010bothcountrieswererequiredtohaveremoved tariffs on all items barring those listed in their respective no-concession lists or those facing Tariff Rate Quotas (TRQ).
Top Pakistani exports to Sri Lanka include cotton products, cement, refined sugar and potatoes. Top Sri Lankan exports to Pakistan include vegetable products, rubber, fibreboard and coconut products. Pakistan’s exports to Sri Lanka grew from USD 154 million in 2004 to USD 316 million in 2013, but Pakistan could only claim 1.7% of total Sri Lankan imports from the world in 2013. Sri Lanka’s exports to Pakistan grew from USD 46 million to USD 63 million between 2004 and 2013, and Sri Lanka claimed only 0.14% of total Pakistani imports from the world in 2013.
Fig.1 Pakistan-Sri Lanka trade numbers 2004-2013
Trade between the two countries has shown lacklustre growth despite the FTA. Both countries claim significant market shares in precious few exports to the other. Trade has continued in roughly the same mix of products that existed prior to the FTA and most tariff lines continue toreportzerotrade.ThisisinstarkcontrasttoSriLanka’straderelationswithcountriessuchas India and China, wherein significant and fast-paced growth has occurred.
This Study suggests that fledgling Pakistan-Sri Lanka trade relations cannot be blamed on a paucity of opportunities or lack of potential for trade. Both countries produce goods that have healthy markets in the partner country. The FTA is comprehensive and offers full concession on a variety of important exports. Sri Lanka is currently in a period of reconstruction following the conclusion of long-lasting political conflict and is growing its status as a prime tourist destination. Moreover, Pakistan and Sri Lanka have strong political ties and the goodwill between them is part of what led Pakistan to sign its first free trade agreement with Sri Lanka. Considerable potential remains dormant, and this Study attempts to flesh out the specifics of thispotentialandsuggestwaystoremoveobstructionstoitsrealization.
134.715153.662
177.595
208.573 216.72 216.963
283.87
347.722
300.904316.382
45.6659.18
70.9759.79 66.22 55.79 53.37 61.13
83.4163.52
0
50
100
150
200
250
300
350
400
2004 2005 2006 2007 2008 2009 2010 2011 2012 2013
US
D M
ILLI
ONS
Pakistan's Trade with Sri Lanka
Exports
Imports

10
An Assessment of the Pakistan-Sri Lanka Free Trade Agreem
ent
2.2. HIGH POTENTIAL TRADE ITEMS
This Study identifies export items at the 6 digit HS code level which, based on certain favourable metrics, are poised to effectively drive the growth of trade between Pakistan and Sri Lanka. The metrics used are those of trade potential and Compound Annual Growth Rate (CAGR) values. Trade potential represents the extent to which trade can theoretically be increased with another country, and therefore provides an idea of the scope for trade expansion. A CAGR value for growth in, say, exports of an item over a certain period gives us the rate at which the exports would have grown if they grew smoothly, and therefore can function as a rough indicator of a growth trend. If, for a product X, trade potential is high, and the CAGR values of its total world exports by the exporting country and its total world imports by the importing country are high, it can be said that the exporting country is a significant and growing producer and the importing country is a significant and growing consumer of product X. This Study identifies items that exhibit this combination of favourable metrics, but a low or negative CAGR value for their trade between Pakistan and Sri Lanka, suggesting that certain generally positive trends have failed to encompass the Pak-Sri Lanka trade relation.
This further suggests that once the Pak-Sri Lanka specific obstruction to trade is removed, tradecanbeincreasedquicklybyharnessingthepositivetrends.Investigationintotheissuesfaced in Pak-Sri Lanka trade give us some idea of what these obstructions might be.
The following are selected Pakistani export items with high trade potential and favourable CAGR values. Out of the total trade potential of around USD 1.7 billion for the items surveyed at the 6 digit level, USD 500 million is concentrated in items with favourable CAGR values.
Table 1. Pakistani products that have high trade potential and encouraging CAGR values
HS CODES WITH HIGH TRADE POTENTIAL AND FAVOURABLE CAGR VALUES
HS Code Product Label Total Trade Potential in High CAGR Items in USD millions
Number of high potential/CAGR items at 6 digit HS code
73 Articles of iron or steel 53 3
39 Plastics and articles thereof. 34 11
85 Electrical,electronicequipment 29 6
62Articles of apparel and clothing accessories, not knitted or crocheted.
16 3
The following are selected Sri Lankan export item HS codes with high potential and favourable CAGR values at the 6 digit HS code level. Out of the total trade potential of around USD 1 billion for the items surveyed at the 6 digit level, USD 880 million is concentrated in items with favourable CAGR values.
Table 2. Sri Lankan products that have high trade potential and encouraging CAGR values
HS CODES WITH HIGH TRADE POTENTIAL AND HIGH CAGR VALUES
HS Code Product Label Total Trade Potential in High CAGR Items in USD millions
Number of high potential/CAGR items at 6 digit HS code
09 Coffee, tea, mate and spices 316 2
85 Electrical,electronicequipment 75 13
40 Rubber and articles thereof 40 6
21 Miscellaneous edible preparations 31 2
These tables suggest that a lack of trade potential is not the primary impediment to better Pakistan-Sri Lanka trade relations.

11
An Assessment of the Pakistan-Sri Lanka Free Trade Agreem
ent
3.0 RECOMMENDATIONS
The major impediment to healthier trade relations between Pakistan and Sri Lanka seems to be disengagement between the countries’ business men as well as their policy makers. This could be due to misconceptions regarding Sri Lanka’s potential as a market for Pakistani goods and the resulting lack of interest in trade with the country. This suggests that the unrealizedpotentialthisStudyidentifiesremainsunrealizedlargelybecauseneithercountryviews the other as a priority market despite an abundance of opportunities. This is evinced by the lack of regular trade delegations and single country exhibitions, which leads to weak ties between the business communities of the two countries, thereby making it difficult to jump-start trade within neglected high potential items. While there are specific items which can be put forward to be considered for further concessions, by and large the FTA terms themselves are comprehensive and do not seem to be in need of any serious amendments.
3.1 TRADE DELEGATIONS AND SINGLE COUNTRY EXHIBITIONS
Trade delegations and single country exhibitions must be held regularly in order to lay the groundwork for stronger ties between the two countries’ business communities, as well as to raise awareness regarding the significant potential that lies in Pak-Sri Lanka trade. One of the major complaints voiced by Pakistani exporters to Sri Lanka is that a lack of interaction with their Sri Lankan counterparts impedes the identification of further opportunities for business in either country and prevents existing partnerships from being deepened. The granting of arrival visas by both sides would be a significant step towards facilitating the kind of interaction requiredtoboosttrade. 3.2 AGREEMENT ON CHANGES TO FTA TERMS
Any changes in tariffs, para-tariffs or no-concession lists that conflict with the terms of the FTA must be discussed by both countries before being brought into effect. There are instances of unilateral changes made by both Pakistan and Sri Lanka that have undermined the spirit of theFTAandconsequentlyseriouslydisruptedbusinessdealingsbetweenthetwocountrieswithin products such as broom corn and steel pipes. Problematic changes such as these will likely become less common as trade between Pakistan and Sri Lanka becomes more significant.
3.3 GREATER INVOLVEMENT OF BUSINESSMEN IN REVIEW OF THE FTA
Industrialists and exporters should have greater involvement in the drafting of future FTAs and the review of this existing FTA. A commonly voiced complaint was that an FTA can only be maximally advantageous if it takes into account the variegated and interwoven issues and concerns of different sectors affected by the FTA. In other words, an item-byitem discussion involving stakeholder is thought to be necessary.
3.4 FORUMS FOR TRADE DISPUTE RESOLUTION
Forums must be set up for the efficient arbitration of trade disputes. Disputes arise with regularity and end up unaddressed due to the lack of efficient mechanisms for their resolution. This has acted as an additional disincentive to trade between Pakistan and Sri Lanka, as the dangerofadelayedresolutionornoresolutionhasresultedinmorefrequentcasesoffraud.

12
An Assessment of the Pakistan-Sri Lanka Free Trade Agreem
ent
4.0 STUDY OBJECTIVES
The decade following the signing of the Pakistan-Sri Lanka Free Trade Agreement has witnessed low growth in trade between the two countries. This is particularly troubling becauseinadditiontohavingstrongpoliticaltiesandcomprehensiveFTAtermstocapitalizeon, both countries also seem to possess markets for the other’s major export goods. The primary aim of this Study is to estimate the potential for bilateral trade between Pakistan and Sri Lanka and recommend means for achieving the same. We therefore start by identifying:
a) Items possessing high potential for export from Pakistan to Sri Lanka b) Items possessing high potential for export from Sri Lanka to Pakistan
Sources of Data
The data for this study has been drawn from ITC Trademap for the period ended 2013 , which bases its data on UN Comtrade, maintained by the United Nations Statistics Division (UNSD). AnyquarterlyandmonthlydataisdrawnbyTrademapfromnationalandregionalsources.AlltariffvaluesareequivalentadvaloremtariffsdrawnfromTrademapunlessotherwisenoted.
Methodology
This study provides a list of items at the 6-digit HS code level that exhibit high trade potential, with items possessing favourable CAGR metrics highlighted.
Intuitively, trade potential is the theoretical extent to which trade of a given item can be expanded, which suggests the actual scope for growth in trade of that item. It is given by the followingequation:
Trade Potential
=Min (Pakistan’s exports to the world of X,Sri Lanka’s imports from the world of X)
-Pakistan’s current exports to Sri lanka of X
For instance, if Pakistan exports USD 500 million worth of cement to the world, and Sri Lanka imports USD 300 million worth of cement from the world, and Pakistan exports USD 40 million worth of cement to Sri Lanka, then trade potential is USD 260 million, since Pakistan has the capacity to export USD 260 million worth of cement to Sri Lanka given Sri Lanka’s import requirements.
The Compound Annual Growth Rate (CAGR) is the geometric mean of the individual annual growth rates during a period. It gives you the growth rate that would have gotten your initial value to your final value had the value grown smoothly over the relevant period. It is given by:
If the CAGR for Pakistan’s world exports of a good is high, and the CAGR for Sri Lanka’s world imports of that good is high, but the CAGR for export of that good from Pakistan to Sri Lanka is low or negative, the item has been highlighted, since the removal of an obstruction that is potentially specific to Pakistan-Sri Lanka relations can jump-start trade of the good between the two countries.
1 2013 was the last year for which complete data was available.

13
An Assessment of the Pakistan-Sri Lanka Free Trade Agreem
ent
Furthermore, the revealed comparative advantage has been calculated for items on either country’s no concession list to bring attention to items that may be worth considering for further concessions. Revealed comparative advantage is given by:
RCA indicates the relative efficiency of a country in exporting a particular good.

14
An Assessment of the Pakistan-Sri Lanka Free Trade Agreem
ent
5.0 PAKISTAN SRI LANKA FREE TRADE AGREEMENT (PSLFTA)
The Pakistan-Sri Lanka Free Trade agreement (PSLFTA) was signed in July 2002 and became operationalfrom12thJune2005.TheFTArequiredbothcountriestoachievezerotariffsona range of items during a certain time-frame. Pakistan granted 100% immediate concession on 206 items at the 6-digit HS level whereas Sri Lanka granted 100% immediate concession on 102 items at the same level. Pakistan’s no concession list ran to 540 items at the 6 digit level while Sri Lanka’s no concession list ran to 697 items, which were cut down to 607 items inApril2013.Furthermore,PakistangrantedSriLankaadutyfreetariffratequota(TRQ)ontea products as well as another TRQ at 35% margin of preference on the MFN rate on various clothing items. Sri Lanka reciprocated by granting Pakistan a duty free TRQ on long grain Basmati riceandpotatoes.Thetermsof theFTArequiredPakistantophaseout tariffsonitems not on its no-concession list by 2008, while Sri Lanka had till 2010 to do the same. Major Pakistani exports that Sri Lanka granted full concession to include cotton, apparel, knitted fabrics and cement. Major Sri Lankan exports granted full concession by Pakistan include rubber, coconut products and vegetable products.
Table 3. Summary of Pak-Sri Lanka FTA terms
Tariff Reduction Pakistan Sri Lanka
100% immediate concession 206 items 102 items
Tariff-phasing out period 3 years 5 years
Sensitive List 540 607 (amended in 2013)
Rules of OriginDirect Value Addition (DVA) is 35% of FOB value. If parts of an input originate from a contracting country, minimum aggregate content must be 35% with minimum domestic input content being 25%.
The most recent year for which comprehensive trade data was available was 2013 and therefore the tariff concessions granted to Sri Lankan import items by the Federal Board of Revenue in April 2014 have not been taken into account.
5.1 SHORT ECONOMY PROFILES
The GDP Average Annual Growth Rate (AAGR) in Sri Lanka averaged 6.59% from 2003 until 2014, whereas Pakistan’s GDP AAGR for the same period was 11.11%
Fig. 2 GDP Growth rates of Pakistan and Sri Lanka
From 2004 to 2013 Sri Lanka’s total trade with the world grew by 110% whereas Pakistan’s trade grew by 120%. However, since the FTA was fully implemented in 2010, Sri Lanka’s trade has grown by 35% whereas Pakistan’s trade has grown by only 17%. Both Pakistan and Sri
0
50
100
150
200
250
2003 2005 2007 2009 2011 2013
US
D B
ILLI
ON
S
GDP Annual Growth
Sri Lanka GDP
Pakistan GDP
-2.5
-2
-1.5
-1
-0.5
02003 2005 2007 2009 2011
US
D B
ILLI
ONS
Trade Deficit Growth Rate
Sri Lanka Trade Balance
Pakistan Trade Balance

15
An Assessment of the Pakistan-Sri Lanka Free Trade Agreem
ent
Lanka have had negative trade balances over the period 2004-2013, with the Sri Lankan trade imbalance increasing by 232% and the Pakistani trade balance increasing by 308% during this time.
Fig. 3 Pakistan and Sri Lanka’s balances of trade
0
50
100
150
200
250
2003 2005 2007 2009 2011 2013
US
D B
ILLI
ON
S
GDP Annual Growth
Sri Lanka GDP
Pakistan GDP
-2.5
-2
-1.5
-1
-0.5
02003 2005 2007 2009 2011
US
D B
ILLI
ONS
Trade Deficit Growth Rate
Sri Lanka Trade Balance
Pakistan Trade Balance

16
An Assessment of the Pakistan-Sri Lanka Free Trade Agreem
ent
5.2 TOP TRADING PARTNERS
Pakistan’s exports have continued to be dominated by the US over the past few years, whereas exports to China have grown over three times since 2007 to make it Pakistan’s second largest export destination in 2013. Both Afghanistan and the UK have shown healthy growth as export markets for Pakistani products over this period though the UAE has fallen off by a small amount.
Table 4. Pakistan’s top five export destinations Figures in USD Billions
Pakistan Export Partner 2007 2008 2009 2010 2011 2012 2013
USA 3.85 3.65 3.22 3.67 3.84 3.67 3.75
China 0.61 0.73 1.00 1.44 1.68 2.62 2.65
United Arab Emirates 2.11 2.01 1.54 1.83 1.92 2.87 1.78
Afghanistan 0.84 1.45 1.37 1.68 2.66 2.10 2.00
United Kingdom 0.97 1.00 0.94 1.11 1.26 1.25 1.43
The UAE has emerged as Pakistan’s major origin of imports over the period under consideration, and while imports from the rest of the top five import partners showed overall growth during this time, Saudi imports fell by a small amount.
Table 5. Pakistan’s top five origins of imports Figures in USD Billions
Pakistan Import Partner 2007 2008 2009 2010 2011 2012 2013
United Arab Emirates 2.77 3.78 3.35 5.25 6.82 7.21 7.75
China 4.16 4.74 3.78 5.25 6.47 6.69 6.63
Kuwait 1.85 3.44 1.80 2.61 3.89 4.21 3.95
Saudi Arabia 4.01 5.95 3.50 3.84 4.67 4.28 3.85
Malaysia 1.16 1.69 1.61 2.05 2.73 2.13 1.92
Sri Lanka’s exports have flowed primarily to the EU and the US over the past few years, with the US gradually gaining importance as an export destination until 2013 when it was only 4.6% lower than exports to the EU. India has held on to a distant third place in the top Sri Lankan import partners and has shown little growth as a market for Sri Lankan goods between 2007 and 2013.
Table 6. Sri Lanka’s top five export destinations Figures in USD Billions
Sri Lanka Export Partner 2007 2008 2009 2010 2011 2012 2013
EU 2.39 2.49 2.33 2.53 2.80 2.94 2.69
USA 1.98 1.89 1.59 1.77 2.14 2.12 2.57
India 0.52 0.42 0.33 0.47 0.52 0.60 0.54
Russia 0.20 0.22 0.19 0.24 0.28 0.26 0.28
United Arab Emirates 0.21 0.26 0.21 0.25 0.30 0.23 0.24
India has been Sri Lanka’s major source of imports over this period, though China has asserted itself as a serious competitor for the Sri Lankan market by more than doubling its exports to the country since 2007. The table suggests that the Sri Lankan market for foreign goods is healthy and growing, and this should be a guiding idea in assessing Pakistan’s fledgling trade relationship with the country.

17
An Assessment of the Pakistan-Sri Lanka Free Trade Agreem
ent
Table 7. Sri Lanka’s top five origins of import Figures in USD Billions
Sri Lanka Import Partner 2007 2008 2009 2010 2011 2012 2013
India 2.59 2.84 1.72 3.31 4.45 3.81 4.75
China 1.39 1.63 1.57 1.99 2.99 3.00 3.44
Singapore 0.83 0.99 0.76 1.20 1.33 1.56 1.96
EU 1.17 1.19 1.00 1.22 1.56 1.49 1.38
United Arab Emirates 0.37 0.46 0.30 0.34 0.81 1.29 1.22
18
An Assessment of the Pakistan-Sri Lanka Free Trade Agreem
ent
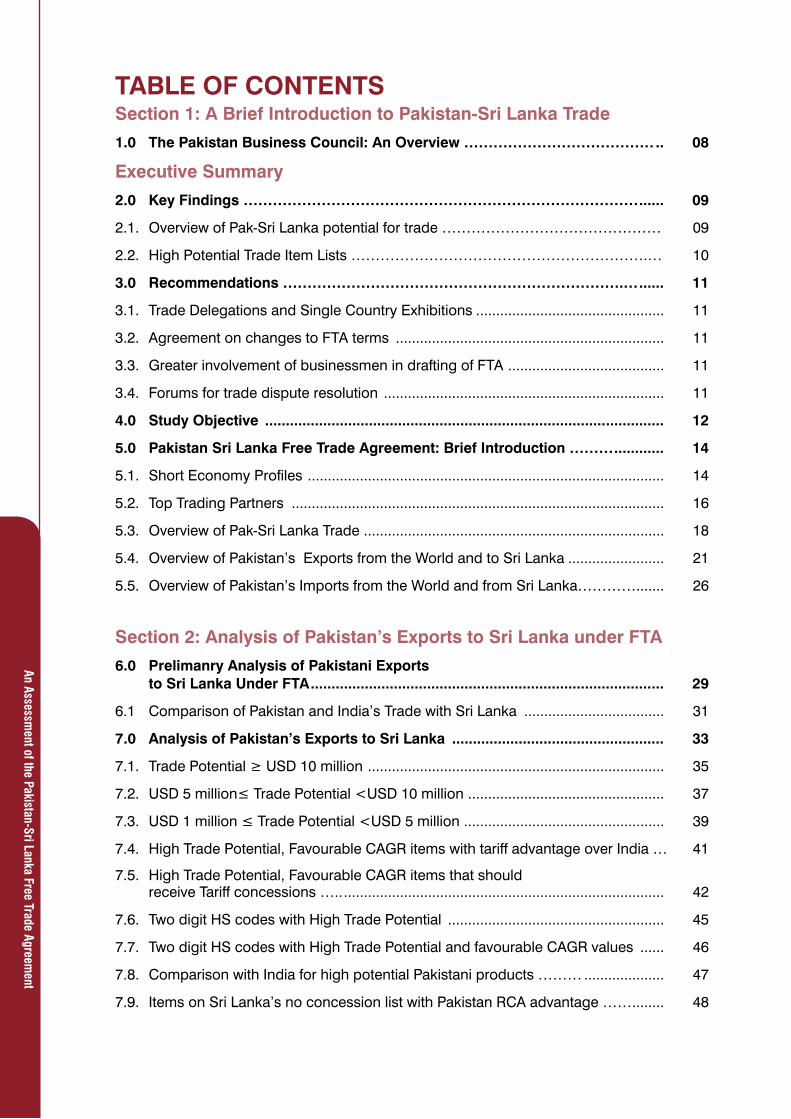
5.3 OVERVIEW OF PAKISTAN-SRI LANKA TRADEFig. 4 Pakistan-Sri Lanka trade numbers 2004-2013
Pakistan is Sri Lanka’s second largest source of imports in South Asia behind India, which also has an FTA with Sri Lanka that became operational in 2000 and was in full effect by 2008. However, India, China and Singapore dominated Sri Lankan imports in 2013 with 26.5%, 16.5% and 10% of total Sri Lankan imports respectively as compared to Pakistan’s negligible 1.7% share.
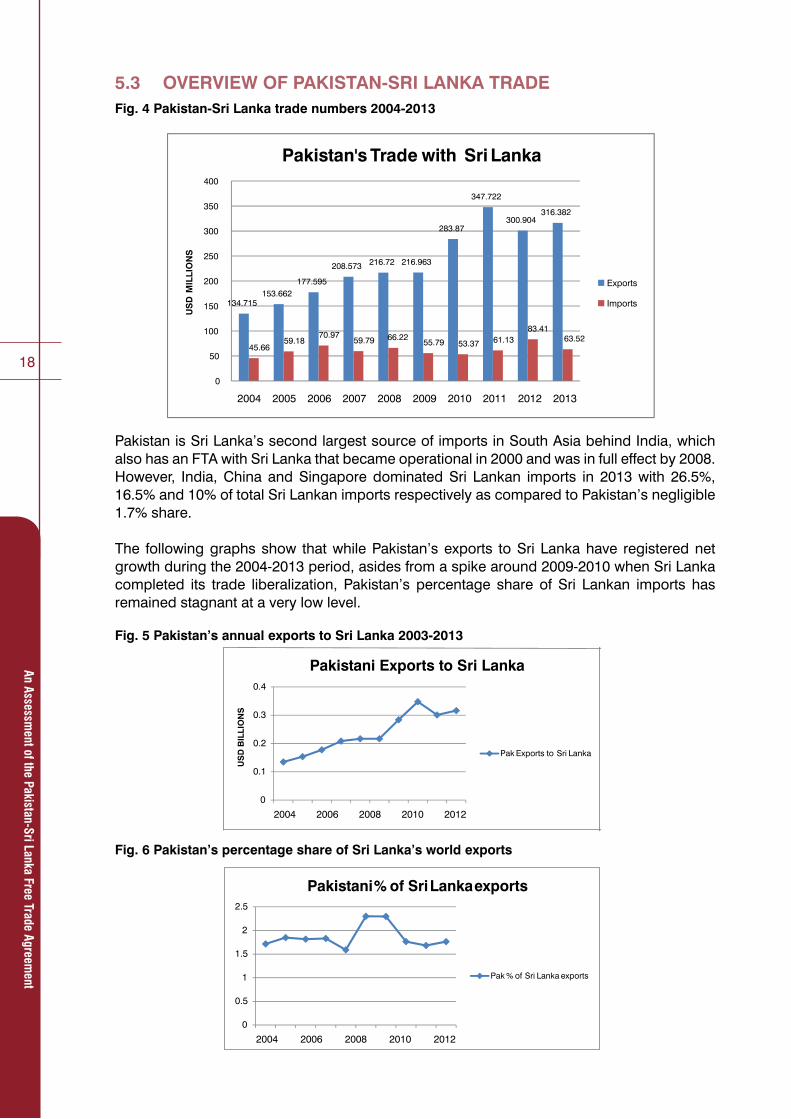
The following graphs show that while Pakistan’s exports to Sri Lanka have registered net growth during the 2004-2013 period, asides from a spike around 2009-2010 when Sri Lanka completed its trade liberalization, Pakistan’s percentage share of Sri Lankan imports hasremained stagnant at a very low level.
Fig. 5 Pakistan’s annual exports to Sri Lanka 2003-2013
Fig. 6 Pakistan’s percentage share of Sri Lanka’s world exports
134.715153.662
177.595
208.573 216.72 216.963
283.87
347.722
300.904316.382
45.6659.18
70.9759.79 66.22
55.79 53.37 61.1383.41
63.52
0
50
100
150
200
250
300
350
400
2004 2005 2006 2007 2008 2009 2010 2011 2012 2013
US
D M
ILLI
ON
S
Pakistan's Trade with Sri Lanka
Exports
Imports
Fig. 5 Pakistan’s annual exports to Sri Lanka 2003-2013
Fig. 6 Pakistan’s percentage share of Sri Lanka’s world exports
0
0.1
0.2
0.3
0.4
2004 2006 2008 2010 2012
US
D B
ILLI
ON
S
Pakistani Exports to Sri Lanka
Pak Exports to Sri Lanka
0
0.5
1
1.5
2
2.5
2004 2006 2008 2010 2012
Pakistani % of Sri Lanka exports
Pak % of Sri Lanka exports

19
An Assessment of the Pakistan-Sri Lanka Free Trade Agreem
ent
In 2004 Pakistani exports to Sri Lanka were USD 154 million, which was 1.15% of total Pakistani exports and 2.8% of Sri Lankan imports. By 2013 they were USD 316 million, which was 1.26% of total Pakistani exports and 1.7% of Sri Lankan imports. It is therefore clear that the period over which the FTA gradually came into effect Pakistan’s absolute level of exports to Sri Lanka increased by 105% but its share of Sri Lanka’s total imports actually fell, which is cause for concern since Pakistan’s share of the Sri Lankan import goods market was very small to begin with.
For comparison, India, Sri Lanka’s other FTA partner, had exports to Sri Lanka of USD 1.4 billion in 2004, which were 17.8% of Sri Lanka’s total imports and by 2013 exports were USD 4.8 billion, and 26.5% of Sri Lanka’s total imports. So, prima facie, India was able to better capitalizeonitsFTAwithSriLankathanPakistanwasonthePSLFTA.
On the other hand, Sri Lanka’s exports to Pakistan were USD 46 million (0.83% of Sri Lankan exports) in 2004 and USD 63 million (0.63% of Sri Lankan exports) in 2013. So Pakistan has remained an insignificant export destination for Sri Lankan products during the period the FTA has come into effect. Sri Lanka’s exports to India were USD 333 million (6.1% of Sri Lankan exports) in 2004 and USD 515 million (5.15 % of Sri Lankan exports) in 2013, suggesting that while there is a significant absolute rise in exports to India, Sri Lankan exports are finding other priority markets or have been unable to overcome India’s significant non-tariff barriers. It should be kept in mind, however, that while the current state of trade between Sri Lanka and Pakistan is not entirely encouraging, both are markets for the other’s primary exports. Pakistan is an important export market for tea, which is a top Sri Lankan export item, and it is also a significant importer of copra and rubber, which are also important Sri Lankan exports. Sri Lanka is an important market for textile products, machinery and pharmaceuticals along with other products that Pakistan records significant exports of. Therefore a more fruitful trading partnership seems to lie within reach for the two countries.
Table 8. Pakistan and India’s exports to Sri Lanka in 2004 and 2013
2004 2013
Pakistani Exports to Sri Lanka 154 million 316 million
Indian Exports to Sri Lanka 1.4 billion 4.8 billion
Table 9. Pakistan and India’s imports from Sri Lanka in 2004 and 2013
2004 2013
Pakistani Imports from Sri Lanka 46 million 63 million
Indian Imports from Sri Lanka 313 million 515 million

20
An Assessment of the Pakistan-Sri Lanka Free Trade Agreem
ent
The following graphs show that Sri Lanka’s major trade partners exhibited aggressive growth not just in absolute exports but also in their share of the Sri Lankan market during 2004-2013, whereas Pakistan remained a bit player in the Sri Lankan market.
Fig. 7 Composition of Sri Lanka’s total imports by country of origin
Fig. 8 Sri Lankan world imports by partner country percentage shares
It should be noted that Pakistan has been a major trading partner of Sri Lanka’s in the past: in 1990 Pakistan accounted for 27.6% of Sri Lanka’s imports from SAARC countries (South Asian Association for Regional Cooperation), and for 45.8% of Sri Lanka’s exports to the same region. However, the FTA does not seem to have done enough to counteract the falling off of Pakistan-Sri Lanka trade relations since their heyday.
Fig. 7 Composition of Sri Lanka’s total imports by country of origin
Fig. 8Sri Lankan world imports by partner country percentage shares
0
1
2
3
4
5
2004 2006 2008 2010 2012
US
D B
ILLI
ON
S
Sri Lankan Import Composition by Import origin
Pak Exports
India Exports
China Exports
Singapore Exports
0
5
10
15
20
25
30
2004 2006 2008 2010 2012
Trade Partner Percentage Share in Sri Lankan Imports
Pak % Share
India % Share
China % share
Singapore % share

21
An Assessment of the Pakistan-Sri Lanka Free Trade Agreem
ent
5.4 OVERVIEW OF PAKISTAN’S EXPORTS TO THE WORLD AND TO SRI LANKA
Pakistan’s export mix has remained consistent over the period 2007-2013, with cotton, textile products and cereals dominating. High growth in a number of export items is worth noting- export of cereals grew by 75%, salt, sulphur etc. by 187%, sugar exports grew over 900% and pearls and precious stones grew by 260%.
Table 9. Pakistan’s world exports 2007-2013 Figures in USD MillionsPAKISTAN’S EXPORTS TO THE WORLD
HS Code Product labelExported value in
2007
Exported value in
2008
Exported value in
2009
Exported value in
2010
Exported value in
2011
Exported value in
2012
Exported value in
2013
52 Cotton 3,440 3,596 3,204 4,013 5,097 5,226 5,334
63Other made textile articles, sets, worn clothing etc
3,179 3,146 2,918 3,285 3,570 3,285 3,685
10 Cereals 1,244 2,508 1,823 2,280 2,807 2,061 2,181
61Articles of apparel, accessories, knit or crochet
1,851 1,888 1,681 1,982 2,239 2,006 2,105
62Articles of apparel, accessories, not knit or crochet
1,371 1,361 1,206 1,462 1,775 1,694 1,855
42Articles of leather, animal gut, harness, travel goods
692 767 578 619 681 674 744
25Salt, sulphur, earth, stone, plaster, lime and cement
252 601 563 514 571 714 723
17 Sugars and sugar confectionery 61 239 112 88 67 254 634
41Raw hides and skins (other than fur skins) and leather
392 383 270 416 468 457 530
27Mineral fuels, oils, distillation products, etc
994 1,230 715 1,203 1,312 331 527
39 Plastics and articles thereof 187 296 306 408 544 521 450
71Pearls, precious stones, metals, coins, etc
120 240 479 590 469 1,634 437
8 Edible fruit, nuts, peel of citrus fruit, melons 125 145 203 254 311 348 434
55 Manmade staple fibres 386 285 300 511 606 449 418
22 Beverages, spirits and vinegar 156 231 122 187 273 173 364
90Optical, photo, technical, medical, etc apparatus
241 280 257 261 302 319 348

22
An Assessment of the Pakistan-Sri Lanka Free Trade Agreem
ent
The table on the following page is suggestive with regards to the importance of Pakistani imports to Sri Lanka. A number of top Pakistani exports to Sri Lanka registered significant growthinabsolutetermsduring2004-2013,thoughthisislargelyaconsequenceofverylowexport numbers in 2004 to begin with. While several exports exhibit this unarguably positive trajectory, growth in percentage shares of the Sri Lankan market suggests that the trend was not strong enough to carve out a space for Pakistan as a significant Sri Lankan trade partner. In other words, most Pakistani export items held onto only a marginal presence in Sri Lanka’s import market during this period. Notable exceptions to this were cotton (18.6%), raw hides (28.4%), milling products (21.5%) and sugar (12%), which all managed to capture a major part of their respective markets. On the other hand, market share in HS 63 (other textile articles) and HS 03 (fish, crustaceans etc.) dropped significantly from 68% and 13% to 24% and 4% respectively of total Sri Lankan imports.2
2The most recent year for which comprehensive trade data was available was 2013 and therefore the tariff concessions granted to Sri Lankan import items by the Federal Board of Revenue in April 2014 have not been taken into account in this report.
PAKISTAN’S EXPORTS TO THE WORLD
HS Code Product labelExported value in
2007
Exported value in
2008
Exported value in
2009
Exported value in
2010
Exported value in
2011
Exported value in
2012
Exported value in
2013
03Fish, crustaceans, molluscs,aquaticinvertebrates nes
161 218 193 231 261 292 333
07Edible vegetables and certain roots and tubers
73 46 86 120 259 188 249
11Milling products, malt, starches, inulin, wheat gluten
110 24 22 47 368 263 227
95 Toys, games, sports requisites 211 226 172 212 225 219 221

23
An Assessment of the Pakistan-Sri Lanka Free Trade Agreem
ent
Tab
le 1
0. P
akis
tani
imp
ort
s’ s
har
e o
f th
eir
mar
ket
in S
ri L
anka
Fi
gur
es in
US
D M
illio
ns
PA
KIS
TAN
’S S
HA
RE
OF
SR
I LA
NK
AN
IMP
OR
TS
HS
Co
de
Pro
duc
t La
bel
Exp
ort
s to
Sri
La
nka
2004
Sri
Lan
ka’s
im
po
rts
fro
m
wo
rld
200
4
% s
har
e o
f to
tal
Sri
Lan
kan
imp
ort
s
Exp
ort
s to
Sri
La
nka
2013
Sri
Lan
ka’s
im
po
rts
fro
m
wo
rld
201
3
% s
har
e o
f to
tal
Sri
Lan
kan
imp
ort
s
Ch
ang
e in
ex
po
rts
Ch
ang
e in
%
shar
e o
f S
ri
Lank
an Im
po
rts
Eq
uiva
lent
ad
va
lore
m t
ariff
ap
plie
d b
y S
ri L
anka
to
P
akis
tan
52C
otto
n60
527
11.5
0%10
254
918
.60%
427.
20
25S
alt,
sulp
hur,
eart
h,
ston
e, p
last
er, l
ime
and
cem
ent
097
0%45
587
7.70
%45
7.6
0.6
10C
erea
ls21
262
8.20
%38
355
10.7
0%16
2.5
6.9
17S
ugar
s an
d su
gar
conf
ectio
nery
212
81.
50%
3528
912
%33
10.4
12.3
07E
dibl
e ve
geta
bles
an
d ce
rtai
n ro
ots
and
tube
rs5
845.
80%
1828
66.
20%
130.
414
.9
30P
harm
aceu
tical
pr
oduc
ts5
103
5.20
%17
330
5.30
%12
0.1
0.2
73A
rtic
les
of ir
on o
r st
eel
414
03.
10%
1537
03.
90%
100.
92.
3
60K
nitte
d or
cro
chet
ed
fabr
ic2
343
0.50
%5
620
0.80
%3
0.3
0
03Fi
sh, c
rust
acea
ns,
molluscs,aquatic
inve
rteb
rate
s ne
s6
4113
.50%
511
74%
-1-9
.54.
5
11M
illin
g pr
oduc
ts, m
alt,
star
ches
, inu
lin, w
heat
gl
uten
07
0.10
%4
1921
.50%
421
.40.
6
41R
aw h
ides
and
ski
ns
(oth
er th
an fu
rski
ns)
and
leat
her
09
2.40
%4
1528
.40%
425
.90.
6
39P
last
ics
and
artic
les
ther
eof
627
92.
10%
459
50.
60%
-2-1
.52.
3
22B
ever
ages
, spi
rits
and
vine
gar
018
0%3
535.
60%
35.
681
.5
52C
otto
n60
527
11.5
0%10
254
918
.60%
427.
20
25S
alt,
sulp
hur,
eart
h,
ston
e, p
last
er, l
ime
and
cem
ent
097
0%45
587
7.70
%45
7.6
0.6
10C
erea
ls21
262
8.20
%38
355
10.7
0%16
2.5
6.9

24
An Assessment of the Pakistan-Sri Lanka Free Trade Agreem
ent
PA
KIS
TAN
’S S
HA
RE
OF
SR
I LA
NK
AN
IMP
OR
TS
HS
Co
de
Pro
duc
t La
bel
Exp
ort
s to
Sri
La
nka
2004
Sri
Lan
ka’s
im
po
rts
fro
m
wo
rld
200
4
% s
har
e o
f to
tal
Sri
Lan
kan
imp
ort
s
Exp
ort
s to
Sri
La
nka
2013
Sri
Lan
ka’s
im
po
rts
fro
m
wo
rld
201
3
% s
har
e o
f to
tal
Sri
Lan
kan
imp
ort
s
Ch
ang
e in
ex
po
rts
Ch
ang
e in
%
shar
e o
f S
ri
Lank
an Im
po
rts
Eq
uiva
lent
ad
va
lore
m t
ariff
ap
plie
d b
y S
ri L
anka
to
P
akis
tan
17S
ugar
s an
d su
gar
conf
ectio
nery
212
81.
50%
3528
912
%33
10.4
12.3
07E
dibl
e ve
geta
bles
an
d ce
rtai
n ro
ots
and
tube
rs5
845.
80%
1828
66.
20%
130.
414
.9
30P
harm
aceu
tical
pr
oduc
ts5
103
5.20
%17
330
5.30
%12
0.1
0.2
73A
rtic
les
of ir
on o
r st
eel
414
03.
10%
1537
03.
90%
100.
92.
3
60K
nitte
d or
cro
chet
ed
fabr
ic2
343
0.50
%5
620
0.80
%3
0.3
0
03Fi
sh, c
rust
acea
ns,
molluscs,aquatic
inve
rteb
rate
s ne
s6
4113
.50%
511
74%
-1-9
.54.
5
11M
illin
g pr
oduc
ts, m
alt,
star
ches
, inu
lin, w
heat
gl
uten
07
0.10
%4
1921
.50%
421
.40.
6
41R
aw h
ides
and
ski
ns
(oth
er th
an fu
rski
ns)
and
leat
her
09
2.40
%4
1528
.40%
425
.90.
6
39P
last
ics
and
artic
les
ther
eof
627
92.
10%
459
50.
60%
-2-1
.52.
3
22B
ever
ages
, spi
rits
and
vine
gar
018
0%3
535.
60%
35.
681
.5

25
An Assessment of the Pakistan-Sri Lanka Free Trade Agreem
ent
The following table is suggestive with regards to Sri Lanka’s importance to Pakistan as a destination for its exports. Items such as pharmaceutical products (10%), articles of iron and steel (8%) and knitted or crotched fabric (16%) are among the few Pakistani export categories that rely significantly on Sri Lankan demand. The table shows that several major exports to Sri Lanka have actually shrunk in their importance as sources of export revenue for Pakistan during 2004-2013, one example being edible vegetables which fell from 12% of Pakistan’s total exports of the item to 7%. Several top Pakistani exports to Sri Lanka account for less than 1% of those items’ total exports by Pakistan, such as raw hides and plastics.
Table 11. Sri Lanka’s share in world exports of Pakistani items Figures in USD Millions
SRI LANKA’S SHARE OF PAKISTAN’S EXPORTS
HS Code Product LabelExports to Sri Lanka
2004
Exports to world
2004
% Share of total world
exports
Exports to Sri Lanka 2013
Exports to world
2013
% Share of total world
exports
Change in % share
52 Cotton 60 2,979 2% 102 5,334 1.90% -0.1
25Salt, sulphur, earth, stone, plaster, lime and cement
0 44 0.10% 45 723 6.30% 6.2
10 Cereals 21 683 3.10% 38 2,181 1.70% -1.4
17 Sugars and sugar confectionery 2 107 1.80% 35 634 5.50% 3.6
07Edible vegetables and certain roots and tubers
5 40 12.10% 18 249 7.10% -5
30 Pharmaceutical products 5 57 9.40% 17 169 10.30% 0.9
73 Articles of iron or steel 4 55 7.80% 15 180 8.10% 0.3
60 Knitted or crocheted fabric 2 179 1% 5 33 16.10% 15.1
03Fish, crustaceans, molluscs,aquaticinvertebrates nes
6 114 4.90% 5 333 1.40% -3.5
11Milling products, malt, starches, inulin, wheat gluten
0 53 0% 4 227 1.80% 1.8
41Raw hides and skins (other than furskins) and leather
0 286 0.10% 4 530 0.80% 0.7
39 Plastics and articles thereof 6 165 3.50% 4 450 0.80% -2.7
22 Beverages, spirits and vinegar 0 29 0% 3 364 0.80% 0.8
08 Edible fruit, nuts, peel of citrus fruit, melons 2 107 1.60% 3 434 0.60% -1
09 Coffee, tea, mate and spices 1 16 5.90% 2 77 3.10% -2.8
63Other made textile articles, sets, worn clothing etc
6 2,353 0.20% 2 3,685 0.10% -0.2
61Articles of apparel, accessories, knit or crochet
2 1,665 0.10% 2 2,105 0.10% 0
87 Vehicles other than railway, tramway 1 37 2.80% 2 74 2.50% -0.3
55 Manmade staple fibres 1 111 0.70% 2 418 0.40% -0.3
85 Electrical, electronic equipment 1 66 1.20% 1 115 0.80% -0.4

26
An Assessment of the Pakistan-Sri Lanka Free Trade Agreem
ent
5.5 OVERVIEW OF PAKISTAN’S IMPORTS FROM THE WORLD AND FROM SRI LANKA
Major Pakistani imports from the world that registered significant percentage increases include mineral fuels (45%), animal and vegetable fats (34%), and printed books and newspapers (95%).Itemswhoseimportsfellduringthisperiodincludeelectronicequipment(-29%),vehiclesotherthanrailways(-15%)andtramwaysandfertilizers(-23%).
Table 12. Pakistan’s imports from the world 2007-2013 Figures in USD Millions
PAKISTAN’S IMPORTS FROM THE WORLD
HS Code Product labelImported value in
2007
Imported value in
2008
Imported value in
2009
Imported value in
2010
Imported value in
2011
Imported value in
2012
Imported value in
2013
% change in
Imports
27Mineral fuels, oils, distillation products, etc
8,350 14,054 8,838 11,399 14,860 15,947 15,247 45.2
84 Machinery, nuclear reactors, boilers, etc 3,262 3,924 3,120 2,953 2,951 3,060 3,058 -6.7
85 Electrical, electronic equipment 3,448 3,782 2,619 2,442 2,430 2,752 2,682 -28.6
29 Organic chemicals 1,570 1,761 1,518 1,721 2,213 2,038 2,016 22.1
15Animal,vegetable fats and oils, cleavage products, etc
1,301 1,880 1,412 1,852 2,589 2,313 1,980 34.3
72 Iron and steel 1,543 1,629 1,683 1,695 1,680 1,848 1,841 16.2
39 Plastics and articles thereof 1,281 1,360 1,185 1,458 1,679 1,501 1,570 18.4
87 Vehicles other than railway, tramway 1,419 1,184 969 1,308 1,502 1,596 1,238 -14.6
52 Cotton 918 1,209 498 831 909 684 1,047 12.3
89Ships, boats and other floating structures
573 183 399 839 527 544 981 41.6
49Printed books, newspapers, pictures etc
42 78 44 46 33 137 858 95.1
30 Pharmaceutical products 374 433 539 498 534 598 675 44.6
31 Fertilizers 748 729 805 648 1,028 908 606 -23.4
38 Miscellaneous chemical products 393 450 503 555 588 549 583 32.7
55 Manmade staple fibres 280 339 345 505 681 539 532 47.3
54 Manmade filaments 339 315 344 516 703 530 527 35.7
07Edible vegetables and certain roots and tubers
288 305 430 507 562 595 500 42.3
73 Articles of iron or steel 388 622 480 425 387 409 486 20.2
12Oil seed, oleagic fruits, grain, seed, fruit, etc, nes
501 380 459 628 691 616 479 -4.7
40 Rubber and articles thereof 342 365 292 413 536 464 460 25.7
A cursory glance at the table below suggests that Sri Lanka is not a major origin of imports for Pakistan, with the exception of vegetable plaiting materials whose Sri Lankan imports account for 69% of all Pakistani imports of the product. This is also the only HS code that has registered any significant growth in its share of Pakistani imports since 2004, growing its share from 31% to 69%. Several top Sri Lankan imports account for less than 1% of total Pakistani imports of those products, including edible vegetables and manmade filaments.

27
An Assessment of the Pakistan-Sri Lanka Free Trade Agreem
ent
Table 13. Sri Lanka’s share in Pakistan’s total world imports Figures in USD Millions
SRI LANKA’S SHARE OF PAKISTAN’S IMPORTS
HS Code Product Label
Pak Imports from SL
2004
Pak Imports
from world 2004
% Share in Pakistani Imports
Pak Imports from SL
2013
Pak Imports
from world 2013
% Share in Pakistan’s
imports
Change in % share
14Vegetable plaiting materials, vegetable products nes
4 12 31% 17 25 69.20% 38.2
40 Rubber and articles thereof 13 218 5.80% 11 460 2.50% -3.3
44 Wood and articles of wood, wood charcoal 3 54 4.80% 9 110 7.90% 3.1
09 Coffee, tea, mate and spices 7 251 2.60% 7 385 1.80% -0.8
8 Edible fruit, nuts, peel of citrus fruit, melons 4 50 7.40% 6 133 4.30% -3.1
07Edible vegetables and certain roots and tubers
0 106 0% 4 500 0.80% 0.8
54 Manmade filaments 0 156 0.10% 2 527 0.30% 0.2
12Oil seed, oleagic fruits, grain, seed, fruit, etc, nes
11 269 4% 1 479 0.30% -3.7
53Vegetable textile fibres nes, paper yarn, woven fabric
1 32 1.70% 1 51 1.80% 0.1
47Pulp of wood, fibrous cellulosic material, waste etc
0 46 0% 1 107 0.50% 0.5
48
Paper and paperboard, articles of pulp, paper and board
0 225 0.10% 1 441 0.10% 0
62Articles of apparel, accessories, not knit or crochet
0 5 0.60% 1 22 2.40% 1.8
87 Vehicles other than railway, tramway 0 769 0% 0 1,238 0% 0
39 Plastics and articles thereof 1 714 0.10% 0 1,570 0% -0.1
38 Miscellaneous chemical products 0 340 0.10% 0 583 0.10% 0
15Animal,vegetable fats and oils, cleavage products, etc
0 798 0.10% 0 1,980 0% -0.1
61Articles of apparel, accessories, knit or crochet
0 5 0.80% 0 25 1.20% 0.4
76 Aluminium and articles thereof 0 139 0.10% 0 195 0.10% 0
69 Ceramic products 0 62 0% 0 101 0.20% 0.2
55 Manmade staple fibres 0 149 0.20% 0 532 0% -0.2

An Assessment of the Pakistan-Sri Lanka Free Trade Agreem
ent
Section 2 Analysis of
Pakistan’s Exports to Sri Lanka under
FTA

29
An Assessment of the Pakistan-Sri Lanka Free Trade Agreem
ent
6.0 PRELIMINARY ANALYSIS OF PAKISTANI EXPORTS TO SRI LANKA UNDER FTA
At the 2-digit HS code level 16 of the top 20 items registered net growth over the 2004-2013 period. The major growth items were cotton, which showed an increase of over USD 41 million, and HS 25 (salt, sulphur etc.), which showed an increase of over USD 45 million, albeit from a very low initial level of exports. Other major Pakistani exports to Sri Lanka include cereals and sugar products. Four 2-digit HS code items experienced a net reduction in exports, with the steepest reduction hitting HS 63 (other made textiles), which fell by over 3 million dollars.
Table 14. Pakistan’s major exports to Sri Lanka Figures in USD Millions
PAKISTAN'S EXPORTS TO SRI LANKA
HS Code Product label Value in 2004
Value in 2013 Growth
Equivalent ad valorem tariff applied
by Sri Lanka to Pakistan
52 Cotton 60 102 42 0
25 Salt, sulphur, earth, stone, plaster, lime and cement 0 45 45 0.6
10 Cereals 21 38 16 6.9
17 Sugars and sugar confectionery 2 35 33 12.3
07 Edible vegetables and certain roots and tubers 5 18 13 14.9
30 Pharmaceutical products 5 17 12 0.2
73 Articles of iron or steel 4 15 10 2.3
60 Knitted or crocheted fabric 2 5 3 0
03 Fish,crustaceans,molluscs,aquaticinvertebrates nes 6 5 -1 4.5
11 Milling products, malt, starches, inulin, wheat gluten 0 4 4 0.6
41 Raw hides and skins (other than furskins) and leather 0 4 4 0.6
39 Plastics and articles thereof 6 4 -2 2.3
22 Beverages, spirits and vinegar 0 3 3 81.5
08 Edible fruit, nuts, peel of citrus fruit, melons 2 3 1 8.8
09 Coffee, tea, mate and spices 1 2 1 1.6
63 Other made textile articles, sets, worn clothing etc 6 2 -4 0
61 Articles of apparel, accessories, knit or crochet 2 2 0 0
87 Vehicles other than railway, tramway 1 2 1 15.8
55 Manmade staple fibres 1 2 1 0
85 Electrical,electronicequipment 1 1 0 2.7
An analysis at the 6 digit HS code level further highlights the worrying state of Pakistan-Sri Lanka trade relations over the past decade. Out of a total of 3502 items at full concession for exports from Pakistan, a mere 308 (8.8%) items showed net growth in the 2004-2013 period. 2952 (84.3%) full concession items exhibited no growth during this period, and the remaining 242 (6.9%)items showed a fall in exports. Furthermore, 3121 (89%) items at full concession showed0exportsin2013,and2934(83.7%)itemsalsoshowedzeroexportsin2004.Thissuggests that little diversification of exports has been achieved during the FTA period.
Full concession items accounted for around USD 94 million of exports to Sri Lanka in 2004 and for around USD 214 million in 2013, showing a growth by 129%. However, the extent to

30
An Assessment of the Pakistan-Sri Lanka Free Trade Agreem
ent
whichthetermsoftheFTAcontributedtothisgrowthrequiresfurtheranalysis.
Out of a total of 568 items at no concession (including the items granted partial concessions in the form of TRQs) for which data was available, only 53 (9.3%) items showed net growth. 469 (82.3%) items registered no growth whereas the remaining 46 (8.1%) items fell in exports. 501 (88%)of these items reportedno exports in 2013, and 471(83%)items reported zeroexports in 2004.
Non-concession items accounted for around USD 34 million of exports to Sri Lanka in 2004 and around USD 70 million in 2013, indicating a growth of 51%. Tariff information was not available for 74 items at the 6-digit code HS level. These items accounted for about USD 6 million of total exports to Sri Lanka in 2013.
Table 15. Pakistani export items with positive, negative or zero growth in exports to Sri Lanka
Positive Growth Items
Negative Growth Items
Zero Growth Items
Full Concession Items 8.8% 6.9% 84.3%
No Concession Items 9.3% 8.1% 82.3%
Fig.8 Pakistani export items to Sri Lanka categorized by positive, negative and zero growthFig.8 Pakistani export items to Sri Lanka categorized by positive, negative and zero growth
0
500
1000
1500
2000
2500
3000
3500
Full Concession Items No Concession Items
Pakistani Export Items to Sri Lanka by Growth
Positive Growth Items
Negative Growth Items
No Growth Items
Num
ber
of
Exp
ort
Item
s

31
An Assessment of the Pakistan-Sri Lanka Free Trade Agreem
ent
6.1 COMPARISON OF PAKISTAN & INDIA’S TRADE WITH SRI LANKA
India has emerged as Sri Lanka’s major source of imports and has outperformed Pakistan despite the fact that both countries have signed FTAs with Sri Lanka. A finer-grained comparison of India and Pakistan’s exports to Sri Lanka is necessary to better understand the challenges Pakistan faces with regards to its trade relationship with Sri Lanka.
The total list of Pakistani exports with available data at the 6 digit code comes out to 4070 items.TotalexportstoSriLankafortheseitemsreportedbyPakistanequalaroundUSD292million (this is different from the total reported exports due to missing data for some exports). India’s total exports for these same items amount to around USD 4.7 billion.
India outperforms Pakistan in exports to Sri Lanka in 2834 items on this list of 4070 items, whereas Pakistan outperforms India in a mere 134 items.
Fig 9. Comparison of the levels of Pakistan and India’s exports to Sri Lanka
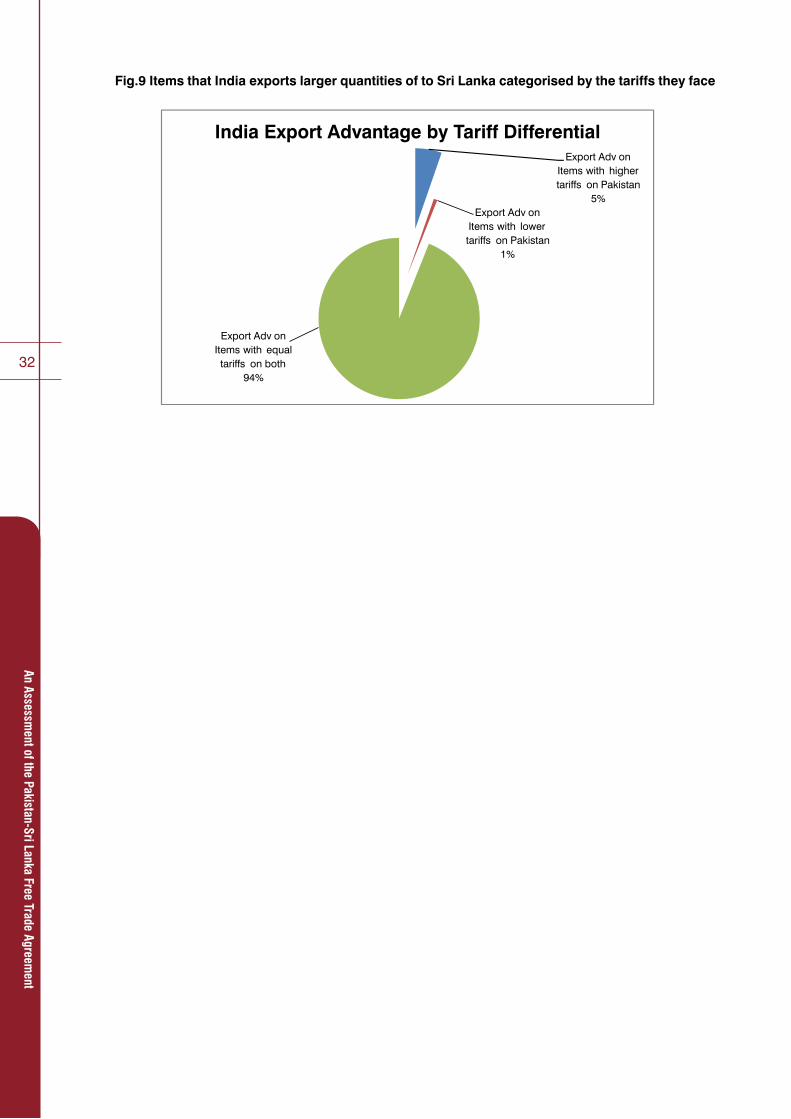
India has a tariff advantage over Pakistan in 21 of the items with available data. India’s export value for these 21 items exceeds Pakistan’s export value for them by around USD 32 million, which is a mere 0.7% of the total export value differential India has over Pakistan. This suggests that India’s superior performance with regards to Sri Lanka is likely not primarily a result of its tariff advantages over Pakistan.
The 308 items on which Pakistan has a tariff advantage on India also report higher total Indian exports to Sri Lanka by an amount of USD 230 million. This reasserts the fact that differences in tariffs are not the primary factor in India’s relatively stronger trade relation with Sri Lanka, since even in cases where Pakistan enjoys higher concessions from Sri Lanka India is able to outperform it.
Items with higher Indian exports
70%
Items with higher Pakistani exports
3%
Items with equal exports
27%
Pakistan and India Exports to Sri Lanka at 6 digit HS code
32
An Assessment of the Pakistan-Sri Lanka Free Trade Agreem
ent
Fig.9 Items that India exports larger quantities of to Sri Lanka categorised by the tariffs they face
Export Adv on Items with higher tariffs on Pakistan
5%
Export Adv onItems with lowertariffs on Pakistan
1%
Export Adv on Items with equal tariffs on both
94%
India Export Advantage by Tariff Differential
Fig.9 Items that India exports larger quantities of to Sri Lanka categorised by the tariffs they face

33
An Assessment of the Pakistan-Sri Lanka Free Trade Agreem
ent
7.0 ANALYSIS OF PAKISTAN’S EXPORTS TO SRI LANKA
We will now attempt to pinpoint those Pakistani export items to Sri Lanka at the 6 digit HS codelevelthatrequirethemostattentionandhavethehighestpotentialtobeturnedaroundbecause of certain favourable metrics associated with them.
Wewillconsider itemswith tradepotentialhigher thanorequal to1milliondollars.Tradepotential is given by:
Trade Potential therefore gives us a rough picture of the extent to which trade can theoretically be increased for any given item. For example, if Pakistan exports USD 490 million worth of sugar to the world, and Sri Lanka imports USD 260 million worth of sugar from the world, and Pakistan sells USD 30 million worth of sugar to Sri Lanka, Pakistan’s trade potential in this case is (USD 260 million-USD 30 million) USD 230 million.
TofurtherhelpzeroinonhighpotentialitemswewilltakeintoconsiderationtheCompoundAnnual Growth Rates (CAGR) for Pakistan’s exports to Sri Lanka, Sri Lanka’s imports from the world and Pakistan’s exports to the world. The CAGR is the geometric mean of the individual annual growth rates during a period. It gives you the growth rate that would have gotten your initial value to your final value had the value grown smoothly over the relevant period.
If the CAGR for Sri Lanka’s imports of a product X from the world is high, and the CAGR of Pakistan’s exports to the world of product X is similarly high, but the CAGR for Pakistan’s exports of product X to Sri Lanka is relatively low or negative, there is reason to think that somebarrieruniquetoPak-SriLankatraderelationsisimpedingexportsofproductXtoSriLanka. This information coupled with the trade potential for product X can give us a good idea ofwhichitemsrequireurgentattentionduetotheircurrentlywastedpotential.Theexportsof these items to Sri Lanka may be boosted by removing a non-tariff barrier such as a lack of awareness among exporters or prohibitively complex regulations that stand in the way of allowingPakistantocapitalizeontheafore-mentionedpositivetrendsvis-à-visSriLanka.TheCAGR values can also be used to pinpoint those products that are already performing well as Pakistani exports to Sri Lanka.
WecanzeroinevenfurtheronhighpotentialitemsifweconsiderSriLanka’stariffratesonIndia, Sri Lanka’s other South Asian FTA partner, in conjunction with the afore-mentioned metrics. So products that exhibit high trade potential, high-potential CAGR values and a Pakistani tariff advantage over India are particularly deserving of attention. Such items have been compiled into a table later in the report.
Thelistofhighpotentialitemsisorganizedbytradepotentialindescendingorderwithhighpotential CAGR value items highlighted in blue. The total trade potential for items with trade potential exceeding USD 1 million is USD 1.728 billion. Out of a total of these 275 items, 123 or about 45% show high potential CAGR values. These items show a collective trade potential of USD 548 million and so 30% of total trade potential of all items under consideration is concentrated in high CAGR items. In other words, this potential of USD 545 million lies in items that are growing as Pakistani exports to the world and as Sri Lankan imports from the world.

34
An Assessment of the Pakistan-Sri Lanka Free Trade Agreem
ent
This overview suggests that there is a wealth of items that have experienced favourable trends in their supply and demand by Pakistan and Sri Lanka respectively, and yet these trends have conspicuously failed to encompass the trade relationship between the two countries. 21 of the 275 items have a tariff advantage on India, whereas 242 items show no difference in tariffs imposed on India and Pakistan by Sri Lanka.
Only selected items from the total list of 275 are listed in the following tables.
Note: All CAGR values are calculated for the period 2004-2013. CAGR values have only been calculated if there are at least 3 consecutive years of recorded exports and at least one year of recorded exports within the period 2010-2013. This is so that the numbers used are recent and consistent enough to be suggestive of future trends. “_” indicates that these requirementsarenotmet,or in thecaseofnon-CAGRvalues,unavailabilityofdata. “_*”indicates that while export numbers were reported in 2013, the years before did not meet therequirements.Asaresult thisgenerally indicatesveryspottyand/or lowgrowthinthatparticular item and therefore the item should be considered to have not performed well in termsofexportstothecountryunderconsideration.Avalueprecededby“*”indicatesthatwhile there were no recorded exports in 2013, the previous years’ numbers met the afore-mentionedrequirementsforcalculatingaCAGR.ItshouldbenotedthatCAGRvaluesfurnisha suggestive but imprecise picture of growth trends, since very volatile growth cannot be represented accurately using measures such as CAGR or AAGR (Annual Average Growth Rate).

35
An Assessment of the Pakistan-Sri Lanka Free Trade Agreem
ent
7.1 TRADEPOTENTIAL≥USD10MILLION
38% of all items with trade potential exceeding USD 10 million exhibit encouraging CAGR values. Total trade potential in this bracket is USD 978 million, a very high value owing to the lack of several major Pakistani exports to Sri Lanka for which Sri Lanka has significant demand. Items with trade potential values exceeding USD 10 million and high potential CAGR values include HS 730890 (structures and parts of structures), HS 901890 (instruments used in medical sciences), and HS 870190 (wheeled tractors).
Tab
le 1
6. P
akis
tani
exp
ort
item
s to
Sri
Lan
ka w
ith h
igh
CA
GR
item
s h
igh
ligh
ted
Fig
ures
in U
SD
Mill
ions
TRADEPOTENTIAL≥USD10MILLION
HS
Co
de
Pro
duc
t La
bel
Pak
201
3 E
xpo
rt t
o
SL
SL
2013
W
orl
d
Imp
ort
Pak
201
3 W
orl
d
Exp
ort
Trad
e P
ote
ntia
lTa
riff
on
Pak
Pak
-SL
CA
GR
SL
Imp
ort
C
AG
RP
ak E
xpo
rt
CA
GR
Tari
ff o
n In
dia
2523
29P
ortla
nd c
emen
t nes
44.4
431
2.28
506.
6626
7.84
043
.50%
27.8
0%37
.60%
0
1701
99R
efin
ed s
ugar
, in
solid
form
, ne
s34
.39
257.
2448
7.78
222.
857.
5_
9.50
%48
.00%
14.9
3004
90M
edic
amen
ts n
es, i
n do
sage
9.41
73.4
827
9.61
64.0
70
12.4
0%14
.20%
9.10
%0
7308
90S
truc
ture
s&pa
rts
of
structures,i/s(exprefabbldgs
of h
eadg
no.
9406
)0.
0046
.56
50.1
146
.56
00.
00%
9.20
%27
.60%
1.3
8517
12Te
leph
ones
for
cellu
lar
netw
orks
mob
ile te
leph
ones
or
for
othe
r w
irele
0.00
44.3
810
6.25
44.3
80
0.00
%7.
10%
-1.2
0%0
9018
90In
stru
men
ts a
nd a
pplia
nces
us
ed in
med
ical
or
vete
rinar
y sc
ienc
es, n
es0.
2334
.90
296.
8134
.66
01.
30%
5.60
%7.
90%
0
5208
39W
oven
fabr
ics
of
cotton,>/=85%,notmore
than200g/m2,dyed,nes
3.40
46.2
638
.00
34.6
00
8.70
%21
.20%
6.70
%0
8701
90W
heel
ed tr
acto
rs n
es0.
7628
.37
33.9
527
.61
02.
90%
7.20
%17
.90%
0
8414
51Fa
ns: t
able
,roo
f etc
w a
sel
f-co
nt e
lec
mtr
of a
n ou
tput
nt
excd
g 12
5W0.
0817
.98
36.1
617
.89
025
.20%
13.6
0%12
.50%
0
2106
90Fo
od p
repa
ratio
ns n
es0.
0128
.56
17.4
717
.46
13.5
-17.
30%
12.2
0%7.
00%
13.4
6203
42Mens/boystrousersand
shor
ts, o
f cot
ton,
not
kni
tted
0.03
16.0
465
3.12
16.0
10
9.30
%21
.60%
8.30
%0
5209
42D
enim
fabr
ics
of
cotton,>/=85%,morethan
200g/m2
23.4
638
.80
495.
9415
.34
073
.80%
3.10
%28
.10%
0
8507
10Le
ad-a
cid
elec
tric
ac
cum
ulat
ors
of a
kin
d us
d f
star
tg p
isto
n en
gine
s0.
0015
.32
20.3
215
.32
300.
00%
14.4
0%51
.30%
30
5209
39W
oven
fabr
ics
of
cotton,>/=85%,morethan
200g/m2,dyed,nes
1.25
127.
0416
.48
15.2
30
63.4
0%0.
90%
41.0
0%0

36
An Assessment of the Pakistan-Sri Lanka Free Trade Agreem
ent
TRADEPOTENTIAL≥USD10MILLION
HS
Co
de
Pro
duc
t La
bel
Pak
201
3 E
xpo
rt t
o
SL
SL
2013
W
orl
d
Imp
ort
Pak
201
3 W
orl
d
Exp
ort
Trad
e P
ote
ntia
lTa
riff
on
Pak
Pak
-SL
CA
GR
SL
Imp
ort
C
AG
RP
ak E
xpo
rt
CA
GR
Tari
ff o
n In
dia
5208
59W
oven
fabr
ics
of
cotton,>/=85%,notmore
than200g/m2,printed,nes
0.24
38.9
314
.54
14.3
00
-14.
60%
25.7
0%-1
5.80
%0
5211
42D
enim
fabr
ics
of c
otto
n,
<85%mixedwithm-mfib,
morethan200g/m2
1.61
15.7
551
.54
14.1
40
20.3
0%23
.10%
5.00
%0
2401
10To
bacc
o, u
nman
ufac
ture
d,
not s
tem
med
or
strip
ped
0.00
56.2
013
.11
13.1
175
0.00
%5.
10%
41.9
0%75
3903
19P
olys
tyre
ne n
es0.
1513
.20
53.6
813
.05
0-2
43.0
0%9.
30%
23.8
0%0
5205
11Cottonyarn,>/=85%,single
,uncombd,>/=714.29dtex,
nt p
ut u
p0.
5513
.56
155.
4513
.01
018
.20%
-8.9
0%6.
50%
0

37
An Assessment of the Pakistan-Sri Lanka Free Trade Agreem
ent
7.2 USD5MILLION≤TRADEPOTENTIAL<USD10MILLION
45% of all items in this category show high potential CAGR values. Total trade potential in this category is USD 341.9 million.
Tab
le 1
7. P
akis
tani
exp
ort
item
s to
Sri
Lan
ka w
ith h
igh
CA
GR
item
s h
igh
ligh
ted
Fig
ures
in U
SD
Mill
ions
USD5MILLION≤TRADEPOTENTIAL<USD10MILLION
HS
Co
de
Pro
duc
t La
bel
Pak
201
3 E
xpo
rt t
o
SL
SL
2013
W
orl
d
Imp
ort
s
Pak
201
3 W
orl
d
Exp
ort
s
Trad
e P
ote
ntia
lTa
riff
on
Pak
Pak
-SL
CA
GR
SL
Imp
ort
C
AG
RP
ak E
xpo
rt
CA
GR
Tari
ff o
n In
dia
2301
20Fl
our,m
eal&
pelle
t of
fish,crust,mol/othaqua
inve
rt,u
nfit
hum
an c
ons
0.11
9.75
16.9
89.
640
-9.7
0%5.
40%
161.
20%
0
3208
90P
aint
s &
varn
i bas
ed o
n po
lym
ers
diss
olv
in a
non
-aqueoussolvnes
0.00
12.1
99.
439.
4320
0.00
%15
.20%
73.3
0%20
5209
29W
oven
fabr
ics
of
cotton,>/=85%,morethan
200g/m2,bleached,nes
1.59
20.6
210
.71
9.12
013
.20%
1.30
%0.
40%
0
2515
12M
arbl
e &
trav
ertin
e,m
erel
y cu
t,by
saw
ing
or o
ther
wis
e in
to b
lock
s et
c0.
009.
0650
.26
9.06
00.
00%
11.1
0%32
.70%
0
2309
90A
nim
al fe
ed p
repa
ratio
ns n
es0.
0422
.71
8.80
8.76
0_*
15.9
0%58
.70%
0
6203
49Mens/boystrousersand
shor
ts, o
f oth
er te
xtile
m
ater
ials
, not
kni
tted
0.04
8.66
115.
338.
620
22.3
0%17
.50%
50.5
0%0
0904
20
Frui
ts o
f the
gen
us C
apsi
cum
or
of t
he g
enus
Pim
enta
: D
ried,
nei
ther
cru
shed
nor
gr
ound
0.00
49.0
96.
368.
610
0.00
%0.
00%
2.50
%0
6405
90Fo
otw
ear,
nes
0.00
10.4
18.
598.
597.
20.
00%
21.4
0%-1
.90%
7.2
3004
20A
ntib
iotic
s ne
s, in
dos
age
0.78
9.21
13.1
68.
430
12.5
0%16
.50%
28.9
0%0
7113
19A
rtic
les
of je
wel
lery
&pt
ther
of
of/oprecmetw/nplatd/clad
w p
rec
met
0.13
8.18
400.
808.
050
_25
.30%
36.5
0%0
7113
19A
rtic
les
of je
wel
lery
&pt
ther
of
of/oprecmetw/nplatd/clad
w p
rec
met
0.13
8.18
400.
808.
050
69.7
0%25
.30%
36.5
0%0
5209
59W
oven
fabr
ics
of
cotton,>/=85%,morethan
200g/m2,printed,nes
0.37
9.66
8.23
7.86
028
.70%
-8.2
0%42
.20%
0
1516
20Ve
g fa
ts &
oils
&fra
ctio
ns
hydrogenatd,inter/re-
esterifid,etc,refd/not
0.00
7.73
150.
557.
730
0.00
%5.
20%
12.6
0%37
.8
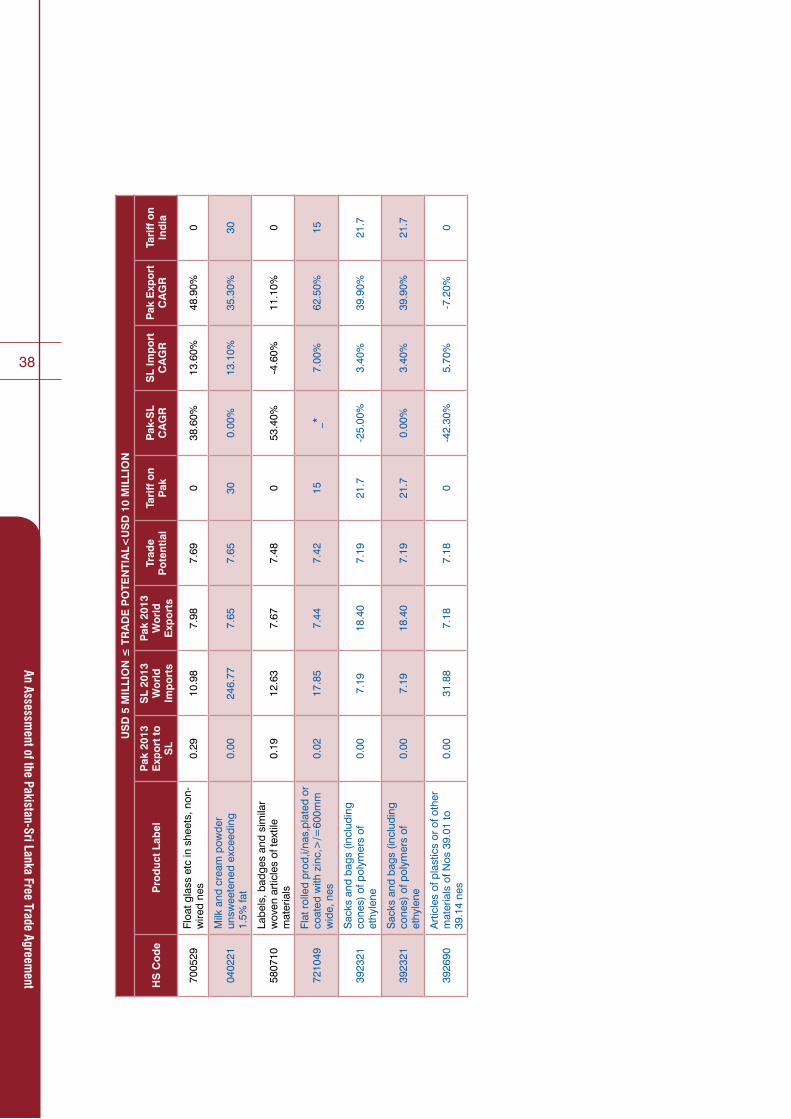
38
An Assessment of the Pakistan-Sri Lanka Free Trade Agreem
ent
USD5MILLION≤TRADEPOTENTIAL<USD10MILLION
HS
Co
de
Pro
duc
t La
bel
Pak
201
3 E
xpo
rt t
o
SL
SL
2013
W
orl
d
Imp
ort
s
Pak
201
3 W
orl
d
Exp
ort
s
Trad
e P
ote
ntia
lTa
riff
on
Pak
Pak
-SL
CA
GR
SL
Imp
ort
C
AG
RP
ak E
xpo
rt
CA
GR
Tari
ff o
n In
dia
7005
29Fl
oat g
lass
etc
in s
heet
s, n
on-
wire
d ne
s0.
2910
.98
7.98
7.69
038
.60%
13.6
0%48
.90%
0
0402
21M
ilk a
nd c
ream
pow
der
unsw
eete
ned
exce
edin
g 1.
5% fa
t0.
0024
6.77
7.65
7.65
300.
00%
13.1
0%35
.30%
30
5807
10La
bels
, bad
ges
and
sim
ilar
wov
en a
rtic
les
of te
xtile
m
ater
ials
0.19
12.6
37.
677.
480
53.4
0%-4
.60%
11.1
0%0
7210
49Flatrolledprod,i/nas,platedor
coatedwithzinc,>/=600mm
wid
e, n
es0.
0217
.85
7.44
7.42
15_*
7.00
%62
.50%
15
3923
21S
acks
and
bag
s (in
clud
ing
cone
s) o
f pol
ymer
s of
et
hyle
ne0.
007.
1918
.40
7.19
21.7
-25.
00%
3.40
%39
.90%
21.7
3923
21S
acks
and
bag
s (in
clud
ing
cone
s) o
f pol
ymer
s of
et
hyle
ne0.
007.
1918
.40
7.19
21.7
0.00
%3.
40%
39.9
0%21
.7
3926
90A
rtic
les
of p
last
ics
or o
f oth
er
mat
eria
ls o
f Nos
39.
01 to
39
.14
nes
0.00
31.8
87.
187.
180
-42.
30%
5.70
%-7
.20%
0

39
An Assessment of the Pakistan-Sri Lanka Free Trade Agreem
ent
7.3 USD1MILLION≤TRADEPOTENTIAL<USD5MILLION
46% of all items in this category have high potential CAGR values. The total trade potential for this bracket is USD 462.7 million.
Tab
le 1
7. P
akis
tani
exp
ort
item
s to
Sri
Lan
ka w
ith h
igh
CA
GR
item
s h
igh
ligh
ted
Fig
ures
in U
SD
Mill
ions
USD1MILLION≤TRADEPOTENTIAL<USD5MILLION
HS
Co
de
Pro
duc
t La
bel
Pak
201
3 E
xpo
rt t
o
SL
SL
2013
W
orl
d
Imp
ort
Pak
201
3 W
orl
d
Exp
ort
Trad
e P
ote
ntia
lTa
riff
on
Pak
Pak
-SL
CA
GR
SL
Imp
ort
C
AG
RP
ak E
xpo
rt
CA
GR
Tari
ff o
n In
dia
1108
12Maize(corn)starch
0.00
4.68
12.1
54.
680
*80.58%
17.5
0%27
.60%
0
8705
90S
peci
al p
urpo
se m
otor
ve
hicl
es n
es0.
007.
084.
604.
60_
0.00
%19
.70%
23.9
0%_
1701
13R
aw c
ane
suga
r, (s
ee
subh
eadi
ng n
ote
2.)
0.00
14.4
24.
594.
590
0.00
%_
_0
4411
14M
ediu
m d
ensi
ty fi
breb
oard
M
DF
of w
ood,
of a
thic
knes
s >
9 m
m0.
005.
954.
564.
560
0.00
%17
.10%
53.0
0%0
4811
59P
aper
and
pap
erbo
ard,
su
rface
-col
oure
d, s
urfa
ce-
deco
rate
d or
prin
ted,
0.00
4.48
38.5
54.
4822
.50.
00%
28.1
0%80
.20%
22.5
8502
39E
lect
ric g
ener
atin
g se
ts0.
0011
.81
4.48
4.48
00.
00%
23.1
0%2.
90%
0
8212
10Razorsincludingsafetyrazors
and
open
bla
de ty
pe0.
004.
437.
074.
4318
.10.
00%
8.70
%21
.10%
28.1
1404
90Ve
geta
ble
prod
ucts
nes
0.01
7.12
4.36
4.35
020
.10%
9.50
%53
.20%
0
7326
90A
rtic
les,
iron
or
stee
l, ne
s0.
0028
.04
4.35
4.35
0-7
.40%
16.1
0%17
.00%
0
5513
21P
lain
wea
ve p
olye
ster
staplefibfab,<85%,mixdw/
cotton,<=170g/m2,dyd
0.07
4.39
54.5
84.
320
25.9
0%-1
.90%
29.6
0%0
3809
91Fi
nish
g ag
ents
,dye
ca
rrie
rs&
oth
prep
,nes
,for
use
in th
e te
xtile
indu
st0.
0022
.90
4.28
4.28
0*-2.75%
11.5
0%12
.40%
0
8501
40A
C m
otor
s, s
ingl
e-ph
ase,
nes
0.00
4.26
4.44
4.26
00.
00%
13.0
0%73
.00%
0
8544
49E
lect
ric c
ondu
ctor
s, fo
r a
volta
ge n
ot e
xcee
ding
80
V,
nes
0.03
26.5
04.
254.
220
62.6
0%19
.10%
37.9
0%0
5509
53Ya
rn o
f pol
yest
er s
tapl
e fib
res
mix
ed w
ith c
otto
n, n
ot p
ut
up, n
es0.
004.
2018
.17
4.20
0*25.74%
18.8
0%14
.00%
0
3904
10P
olyv
inyl
chl
orid
e, n
ot m
ixed
w
ith a
ny o
ther
sub
stan
ces
0.00
36.1
54.
144.
140
*-12.85%
2.20
%-1
2.90
%0

40
An Assessment of the Pakistan-Sri Lanka Free Trade Agreem
ent
USD1MILLION≤TRADEPOTENTIAL<USD5MILLION
HS
Co
de
Pro
duc
t La
bel
Pak
201
3 E
xpo
rt t
o
SL
SL
2013
W
orl
d
Imp
ort
Pak
201
3 W
orl
d
Exp
ort
Trad
e P
ote
ntia
lTa
riff
on
Pak
Pak
-SL
CA
GR
SL
Imp
ort
C
AG
RP
ak E
xpo
rt
CA
GR
Tari
ff o
n In
dia
3503
00G
elat
in a
nd g
elat
in d
eriv
s;
isin
glas
s; g
lues
of a
nim
al
orig
in, n
es0.
004.
106.
344.
100
0.00
%13
.70%
10.0
0%0
6109
90T-
shirt
s,si
ngle
ts a
nd o
ther
ve
sts,
of o
ther
text
ile
mat
eria
ls,k
nitte
d0.
004.
0764
.86
4.07
00.
00%
4.20
%39
.00%
0
7801
10Le
ad r
efin
ed u
nwro
ught
0.00
9.54
4.00
4.00
300.
00%
6.70
%61
.70%
30
9403
60Fu
rnitu
re, w
oode
n, n
es0.
013.
974.
143.
970
-15.
00%
11.4
0%-6
.70%
0
9026
80In
stru
men
ts&
appa
ratu
s fo
r m
easu
rg o
che
ck v
aria
bles
of
liqogases,nes
0.00
3.86
13.0
03.
860
0.00
%19
.40%
56.6
0%0

41
An Assessment of the Pakistan-Sri Lanka Free Trade Agreem
ent
7.4 HIGH TRADE POTENTIAL AND FAVOURABLE CAGR ITEMS WITH TARIFF ADVANTAGE OVER INDIA
The following table lists all 6 digit HS code items with trade potential exceeding USD 1 million and high potential CAGR metrics that receive greater tariff concessions from Sri Lanka than does India. The total trade potential of these items is around USD 79 million. These items deserve attention since Pakistan has the ability to supply them, Sri Lanka has a healthy market for them, and Pakistan receives greater tariff concessions on them than does India.
Tab
le 1
8. P
akis
tani
exp
ort
item
s to
Sri
Lan
ka w
ith h
igh
po
tent
ial a
nd t
ariff
ad
v. o
ver
Ind
ia
F
igur
es in
US
D M
illio
ns
HIG
H P
OTE
NTI
AL
ITE
MS
WIT
H T
AR
IFF
AD
V. O
VE
R IN
DIA
HS
Co
de
Pro
duc
t La
bel
Pak
201
3 E
xpo
rt t
o
SL
SL
2013
W
orl
d
Imp
o-r
ts
Pak
201
3 W
orl
d
Exp
ort
s
Trad
e P
ote
ntia
lTa
riff
on
Pak
Pak
-SL
CA
GR
SL
Imp
ort
C
AG
R
Pak
E
xpo
rtC
AG
R
Tari
ff o
n In
dia
Pak
Tar
iff
Ad
v.
3305
90H
air
prep
arat
ions
, nes
0.00
3.73
1.98
1.98
0-1
8.40
%12
.40%
9.00
%30
30
5210
21
Pla
in w
eave
cot
ton
fab,<85%mixdwm-m
fib,n
ot m
ore
than
200
g/m2,bl
0.32
1.51
145.
151.
190
-8.3
0%28
.90%
1.00
%30
30
6006
42
Dye
d fa
bric
s, k
nitte
d or
cro
chet
ed, o
f ar
tific
ial f
ibre
s, o
f a
wid
th o
0.08
37.9
61.
401.
320
-50.
20%
17.6
0%48
.20%
3030
7615
10
Tabl
e, k
itche
n or
oth
er
hous
ehol
d ar
ticle
s an
d pa
rts
ther
eof,
and
pot
scou
rers
and
sco
urin
0.00
1.40
28.3
71.
400
0.00
%12
.70%
167.
00%
3030
8041
0D
ates
, fre
sh o
r dr
ied
0.04
2.45
85.7
22.
416
3.80
%7.
70%
13.3
0%27
21
6206
90
Womens/girlsblouses
and
shirt
s,of
oth
er
text
ile m
ater
ials
,not
kn
itted
0.00
2.64
3.58
2.64
00.
00%
9.50
%25
.10%
1212
4819
10C
arto
ns, b
oxes
and
ca
ses,
of c
orru
gate
d pa
per
or p
aper
boar
d0.
004.
112.
122.
120
0.00
%9.
80%
31.0
0%10
.810
.8
8212
10Razorsincluding
safetyrazorsandopen
blad
e ty
pe0.
004.
437.
074.
4318
.10.
00%
8.70
%21
.10%
28.1
10
6108
29
Womens/girlsbriefs
and
pant
ies,
of o
ther
te
xtile
mat
eria
ls,
knitt
ed
0.00
2.11
1.62
1.62
00.
00%
26.9
0%94
.90%
7.5
7.5
1901
10
Pre
p of
cereals,flour,starch/
milk
f in
fant
use
,put
up
f ret
ail s
ale
0.00
11.2
45.
365.
360
0.00
%12
.30%
55.1
0%5
5
7308
90
Str
uctu
res&
part
s ofstructures,i/s(ex
pref
ab b
ldgs
of h
eadg
no
.940
6)
0.00
46.5
650
.11
46.5
60
0.00
%9.
20%
27.6
0%1.
31.
3

42
An Assessment of the Pakistan-Sri Lanka Free Trade Agreem
ent
Tab
le 1
9. H
igh
po
tent
ial P
akis
tani
exp
ort
item
s to
Sri
Lan
ka f
acin
g t
ariff
s
F
igur
es in
US
D M
illio
ns
HIG
H T
RA
DE
PO
TEN
TIA
L A
ND
CA
GR
ITE
MS
FA
CIN
G T
AR
IFFS
HS
Co
de
Pro
duc
t La
bel
Pak
201
3 E
xpo
rt t
o
SL
SL
2013
Wo
rld
Im
po
rts
Pak
201
3 W
orl
d
Exp
ort
s
Trad
e P
ote
nti-
alTa
riff
on
Pak
Pak
-SL
CA
GR
SL
Imp
ort
s C
AG
R
Pak
E
xpo
rts
CA
GR
Tari
ff o
n In
dia
0402
21M
ilk a
nd c
ream
pow
der
unsw
eete
ned
exce
edin
g 1.
5% fa
t0.
0024
6.77
7.65
7.65
300.
00%
13.1
0%35
.30%
30
0713
10P
eas
drie
d, s
helle
d,
whe
ther
or
not s
kinn
ed o
r sp
lit0.
0018
.43
5.71
5.71
300.
00%
14.8
0%11
8.60
%30
0804
10D
ates
, fre
sh o
r dr
ied
0.04
2.45
85.7
22.
416
3.80
%7.
70%
13.3
0%27
0902
30
Bla
ck te
a (f
erm
ente
d)&
part
ly
ferm
entd
tea
in p
acka
ges
not e
xcee
dg 3
kg
0.00
1.40
3.07
1.40
300.
00%
39.0
0%27
.90%
30
1302
32M
ucila
ges
& th
icke
ners
de
rived
from
locu
st b
eans
&
see
ds o
r gu
ar s
eeds
0.06
2.59
119.
232.
5314
.2-1
.60%
42.6
0%82
.00%
14.2
2106
90Fo
od p
repa
ratio
ns n
es0.
0128
.56
17.4
717
.46
13.5
-17.
30%
12.2
0%7.
00%
13.4
2401
10To
bacc
o, u
nman
ufac
ture
d,
not s
tem
med
or
strip
ped
0.00
56.2
013
.11
13.1
175
0.00
%5.
10%
41.9
0%75
2815
11S
odiu
m h
ydro
xide
(ca
ustic
so
da)
solid
0.07
7.70
1.12
1.05
30-8
.30%
12.3
0%40
.60%
30
3204
17S
ynth
etic
org
anic
pig
men
ts
and
prep
arat
ions
bas
ed
ther
eon
0.00
9.82
1.85
1.85
300.
00%
9.30
%13
.40%
30
3208
90P
aint
s &
var
ni b
ased
on
poly
mer
s di
ssol
v in
a n
on
aqueoussolvnes
0.00
12.1
99.
439.
4320
0.00
%15
.20%
73.3
0%20
3402
90S
urfa
ce-a
ctiv
e pr
epar
atio
ns,
was
hing
and
cle
anin
g pr
epar
atio
ns, n
es0.
007.
901.
181.
1830
0.00
%8.
60%
47.3
0%30
3903
11P
olys
tyre
ne, e
xpan
sibl
e0.
003.
134.
823.
1330
0.00
%6.
30%
24.4
0%30
3917
40Fi
tting
s, p
last
ic0.
003.
681.
401.
4030
0.00
%14
.70%
97.9
0%30
3920
20Fi
lm a
nd s
heet
etc
, non
-ce
llula
r et
c, o
f pol
ymer
s of
pr
opyl
ene
0.69
21.9
87.
486.
8015
1.50
%12
.20%
19.1
0%15
7.5 HIGH TRADE POTENTIAL AND FAVOURABLE CAGR ITEMS THAT SHOULD RECEIVE TARIFF CONCESSIONS
The following table lists the 32 items with trade potential exceeding $1 million and favourable CAGR metrics that face tariffs from Sri Lanka. The collective trade potential of these items is around $700 million. Particular attention should be paid to HS 32 Tanning and dyeing extracts (2 items on list), HS 39 Plastics (4 items on list), HS 61 Articles of Apparel (2 items on list), HS 84 Machinery and Nuclear reactors (3 items on list) and HS 85 Electrical and electronic equipment(3itemsonlist).

43
An Assessment of the Pakistan-Sri Lanka Free Trade Agreem
ent
HIG
H T
RA
DE
PO
TEN
TIA
L A
ND
CA
GR
ITE
MS
FA
CIN
G T
AR
IFFS
HS
Co
de
Pro
duct
Lab
elP
ak 2
013
Exp
ort t
o S
L
SL
2013
Wor
ld
Impo
rts
Pak
201
3 W
orld
E
xpor
ts
Trad
e P
oten
ti-al
Tarif
f on
Pak
Pak
-SL
CA
GR
SL
Impo
rts
CA
GR
Pak
E
xpor
ts
CA
GR
Tari
ff o
n In
dia
3923
21S
acks
and
bag
s (in
clud
ing
cone
s) o
f pol
ymer
s of
et
hyle
ne0.
007.
1918
.40
7.19
21.7
-25.
00%
3.40
%39
.90%
21.7
4811
59P
aper
and
pap
erbo
ard,
su
rface
-col
oure
d, s
urfa
ce-
deco
rate
d or
prin
ted,
0.00
4.48
38.5
54.
4822
.50.
00%
28.1
0%80
.20%
22.5
6110
90P
ullo
vers
,car
diga
ns&
sim
ilar
artic
les
of o
th te
xtile
m
ater
ials
,kni
ttd0.
001.
1181
.24
1.11
8.8
_*37
.50%
37.3
0%8.
8
6116
99G
love
s, m
itten
s an
d m
itts,
nes
, of o
ther
text
ile
mat
eria
ls, k
nitte
d0.
103.
4215
.51
3.32
41.2
3.70
%5.
10%
19.4
0%41
.2
6405
90Fo
otw
ear,
nes
0.00
10.4
18.
598.
597.
20.
00%
21.4
0%-1
.90%
7.2
6910
90C
eram
ic s
inks
, was
h ba
sins
et
c &
sim
ilar
sani
tary
fix
ture
s ne
s0.
006.
506.
646.
5022
.50.
00%
7.70
%8.
50%
21.4
7210
49Flatrolledprod,i/
nas,
plat
ed o
r co
ated
with
zinc,>/=600mmwide,nes
0.02
17.8
57.
447.
4215
_*7.
00%
62.5
0%15
7801
10Le
ad r
efin
ed u
nwro
ught
0.00
9.54
4.00
4.00
300.
00%
6.70
%61
.70%
30
8212
10Razorsincludingsafety
razorsandopenbladetype
0.00
4.43
7.07
4.43
18.1
0.00
%8.
70%
21.1
0%28
.1
8415
10A
ir co
nditi
onin
g m
achi
nes
win
dow
or
wal
l typ
es, s
elf-
cont
aine
d0.
0021
.23
11.4
611
.46
31.2
0.00
%76
5.00
%21
.50%
17
8438
90P
ts o
f mac
h ne
s f t
he in
d prep/mfrfoodetcexfex/
prepvegfat/oil
0.00
1.29
5.83
1.29
17.5
0.00
%6.
90%
29.9
0%17
.5
8451
40W
ashi
ng,b
leac
hg o
r dy
eg
machines(o/tmachinesof
head
g N
o 84
.50)
0.00
8.45
3.82
3.82
150.
00%
1.70
%56
.00%
15
8507
10Le
ad-a
cid
elec
tric
ac
cum
ulat
ors
of a
kin
d us
d f s
tart
g pi
ston
eng
ines
0.00
15.3
220
.32
15.3
230
0.00
%14
.40%
51.3
0%30

44
An Assessment of the Pakistan-Sri Lanka Free Trade Agreem
ent
HIG
H T
RA
DE
PO
TEN
TIA
L A
ND
CA
GR
ITE
MS
FA
CIN
G T
AR
IFFS
HS
Co
de
Pro
duct
Lab
elP
ak 2
013
Exp
ort t
o S
L
SL
2013
Wor
ld
Impo
rts
Pak
201
3 W
orld
E
xpor
ts
Trad
e P
oten
ti-al
Tarif
f on
Pak
Pak
-SL
CA
GR
SL
Impo
rts
CA
GR
Pak
E
xpor
ts
CA
GR
Tari
ff o
n In
dia
8537
20B
oard
s,pa
nels
,incl
udg
num
eric
al c
ontr
ol p
anel
s,fo
r a
volta
ge >
1,0
00 V
0.00
14.9
41.
771.
7721
.70.
00%
-1.5
0%12
9.60
%1.
4
8544
70O
ptic
al fi
bre
cabl
es, m
ade
up o
f ind
ivid
ually
she
athe
d fib
res
0.00
11.3
61.
911.
9130
.60.
00%
19.5
0%79
.30%
30.6
8708
99M
otor
veh
icle
par
ts n
es0.
2111
.24
10.9
210
.71
14-3
.80%
1.60
%-0
.60%
14
9015
80S
urve
yg,h
ydro
grap
hic,
oce
anographic,meteorologic/
geop
hysi
cal i
nst n
es0.
002.
719.
442.
7130
0.00
%30
.40%
42.0
0%30
9617
00Vacuumflasks/vacuum
vesselscompletew/
cases;partso/tglassinners
0.00
1.58
1.77
1.58
150.
00%
2.80
%74
.10%
15

45
An Assessment of the Pakistan-Sri Lanka Free Trade Agreem
ent
7.6 TWO DIGIT HS CODES WITH HIGH TRADE POTENTIAL
The following table lists high trade potential HS codes for Pakistani export items to Sri Lanka. Items within the HS codes that display considerable potential for growth include cement, which is already a major export to Sri Lanka, polystyrene, various clothing items and medical instruments and articles of iron and steel such as plates and rods used in construction.
It should be noted that trade potential values show the theoretical capacity for expanding trade with a particular country. In other words, the values signify the amount of trade Pakistan could do with Sri Lanka if both countries did as much trade with one another as possible (given the supplying capacity of one and the total demand of the other) before moving on to trade with other countries. Therefore trade potential values are not the same as rigorous projectionsofabest-case-scenarioforanygivenexportitemvis-à-visSriLanka.
Table 20. Two digit HS codes with high potential Pakistani exports to Sri Lanka Figures in USD Millions
HS CODES WITH HIGH TRADE POTENTIAL
HS Code Product Name Total Trade Potential in USD Millions
Main Products at 6 Digit HS code with high potential
84Nuclear reactors, boilers, machinery and mechanical appliances; parts thereof
442 Fans, Air conditioners, Refrigerators
25 Salt, sulphur, earth, stone, lime and cement 297 Portland Cement, Gypsum,
Cut Marble
52 Cotton 244 Woven cotton fabrics, denim fabrics
17 Sugars and sugar confectionary 233 Refined sugar
39 Plastics 107 Polystyrene
85
Electricalmachineryandequipmentand parts thereof; sound recorders and reproducers, television image and sound recorders and reproducers, and parts and accessories of such articles.
103 Telephone sets
30 Pharmaceutical products 79 Medicaments
73 Articles of iron or steel 75 Plates, rods etc. for use in structures
62 Articles of apparel and clothing accessories, not knitted or crocheted. 72 Jackets,blazers,trousersetc.
55 Manmade staple fibres 66 Woven fabrics, plain weave polyester
87Vehicles other than railway or tramway rolling-stock, and parts and accessories thereof.
61 Wheeled tractors, motor vehicle parts
90
Optical, photographic, cinematographic, measuring, checking, precision, medical or surgical instruments and apparatus; parts and accessories thereof.
50 Medical instruments
7 Edible vegetables and certain roots and tubers 43 Onions, shallots, potatoes
61 Articles of apparel and clothing accessories, knitted or crocheted. 30 T-shirts, gloves

46
An Assessment of the Pakistan-Sri Lanka Free Trade Agreem
ent
7.7 TWO DIGIT HS CODES WITH HIGH TRADE POTENTIAL AND FAVOURABLE CAGR VALUES
The following table lists 2 digit HS codes that have the highest concentration of trade potential within favourable CAGR items at the 6 digit HS code level. This is to say that several items within these 2 digit HS codes have witnessed growth as Pakistani exports and as Sri Lankan imports and also have high trade potential, and yet their flow between the two countries has decreased or stagnated. It should be noted that several HS codes from the previous table are listed here as well, suggesting that many high potential HS codes also exhibit favourable CAGR values. These HS codes indicate a breadth of opportunity for expansion in Pak-Sri Lankatrade,sincefavourabletrendsarealreadyfirmlyinplace-whatisrequiredistheremovalofobstructionsuniquetoPak-SriLankatrade.
Table 21. Two digit HS codes with Pakistani exports to Sri Lanka with high CAGR items Figures in USD Millions
HS CODES WITH HIGH TRADE POTENTIAL AND FAVOURABLE CAGR VALUES
HS Code Product Label Total Trade Potential in USD millions
Number of high potential items at 6 digit HS code
73 Articles of iron or steel 53 3
90
Optical, photographic, cinematographic, measuring, checking, precision, medical or surgical instruments and apparatus; parts and accessories thereof.
43 4
39 Plastics and articles thereof. 34 11
87Vehicles other than railway or tramway rolling-stock, and parts and accessories thereof.
31 3
85
Electricalmachineryandequipmentand parts thereof; sound recorders and reproducers, television image and sound recorders and reproducers, and parts and accessories of such articles.
29 6
84Nuclear reactors, boilers, machinery and mechanical appliances; parts thereof
27 9
21 Miscellaneous edible preparations. 17 1
62 Articles of apparel and clothing accessories, not knitted or crocheted. 16 3
61 Articles of apparel and clothing accessories, knitted or crocheted. 15 6
52 Cotton 14 2
This table indicates that a mere 48 items at the 6 digit HS code have a total trade potential of over USD 275 million along with high potential CAGR values that have so far not been used to bolster trade between the two countries. It should be noted that cotton and articles of iron and steel are already within the top ten Pakistani exports to Sri Lanka, and this suggests that it will be relatively easier to boost exports of products within these HS codes owing to established traderelationships.Furthermore,HS61ArticlesofApparelandHS85Electricalequipmentare in the top 20 Pakistani exports to Sri Lanka.
HS codes on this high potential list that face significant tariffs from Sri Lanka are HS 39 Plastics, HS 61 Articles of Apparel, HS 84 Machinery and Nuclear reactors and HS 85 Electrical equipment.TheseHScodesaccountforUSD105milliontradepotential,andthefactthattheyfacetariffssuggeststhatconcessionsmaybeanimportantsteptowardsrealizingthispotential.

47
An Assessment of the Pakistan-Sri Lanka Free Trade Agreem
ent
7.8 COMPARISON WITH INDIA FOR HIGH POTENTIAL PAKISTANI PRODUCTS
Pakistan’s total volume of trade in these 275 items is a little over USD 206 million, whereas India’s total volume of trade in these items is over USD 1.4 billion. India outperforms Pakistan in exports to Sri Lanka in 84% of the items within this category, whereas Pakistan outperforms India in only 9%.
Fig.10 Comparison between India and Pakistan in items with high potential for Pakistani exports to Sri Lanka
These high trade potential items already account for around 65% of Pakistan’s total exports to Sri Lanka, whereas they account for only 29% of India’s total exports. This suggests that India’s primary exports to Sri Lanka lie in items other than these, and therefore Pakistan does not have to go up against India’s primary exports in its attempt to expand its high potential items.
Out of the 275 high trade potential items considered Pakistan has a tariff advantage on India in 21 items, whereas India has a tariff advantage over Pakistan on 5. Therefore around 91% of these items offer a level playing field to both countries with regards to the Sri Lankan market. This strongly suggests that Pakistan’s relatively lacklustre performance within these high potential items is not primarily due to tariff advantages afforded to India.
Items with Indian
advantage84%
Items with Pakistani
advantage9%
Items with equal
exports7%
India and Pakistan Comparison for Pakistan's High Potential Items
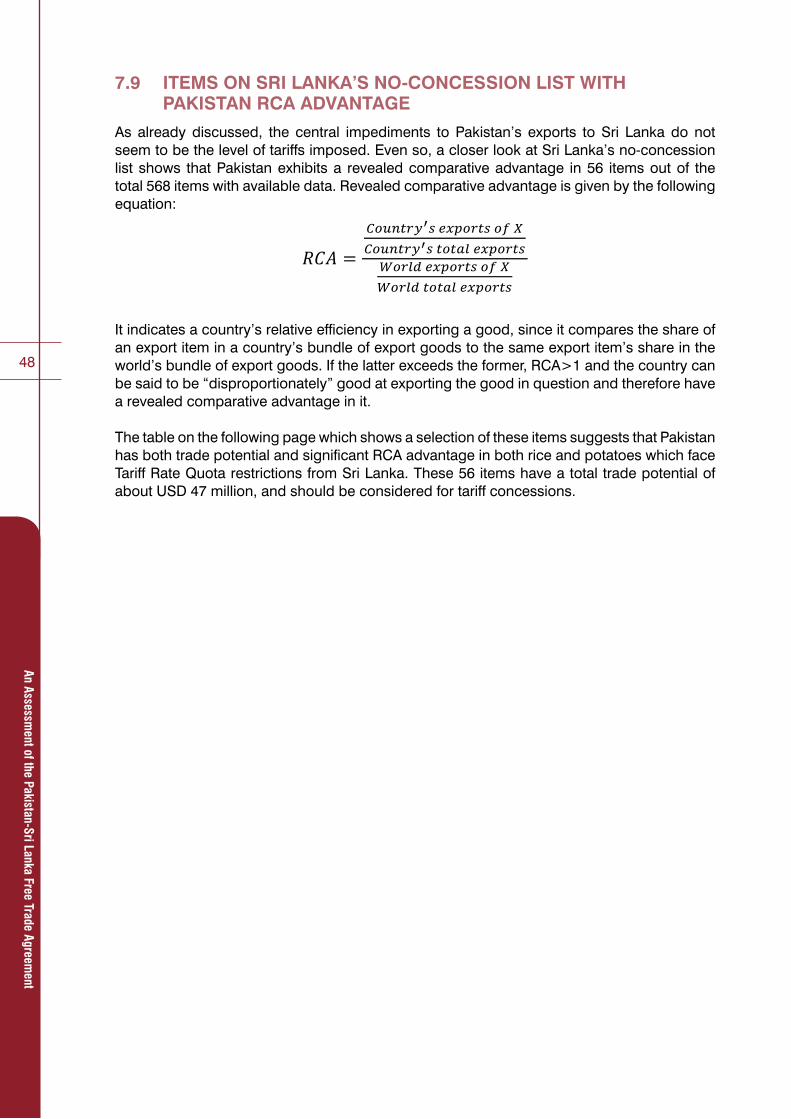
48
An Assessment of the Pakistan-Sri Lanka Free Trade Agreem
ent
7.9 ITEMS ON SRI LANKA’S NO-CONCESSION LIST WITH PAKISTAN RCA ADVANTAGE
As already discussed, the central impediments to Pakistan’s exports to Sri Lanka do not seem to be the level of tariffs imposed. Even so, a closer look at Sri Lanka’s no-concession list shows that Pakistan exhibits a revealed comparative advantage in 56 items out of the total 568 items with available data. Revealed comparative advantage is given by the following equation:
It indicates a country’s relative efficiency in exporting a good, since it compares the share of an export item in a country’s bundle of export goods to the same export item’s share in the world’s bundle of export goods. If the latter exceeds the former, RCA>1 and the country can besaidtobe“disproportionately”goodatexportingthegoodinquestionandthereforehavea revealed comparative advantage in it.
The table on the following page which shows a selection of these items suggests that Pakistan has both trade potential and significant RCA advantage in both rice and potatoes which face Tariff Rate Quota restrictions from Sri Lanka. These 56 items have a total trade potential of about USD 47 million, and should be considered for tariff concessions.

49
An Assessment of the Pakistan-Sri Lanka Free Trade Agreem
ent
Tab
le 2
1. P
akis
tani
exp
ort
item
s o
n no
co
nces
sio
n lis
t w
ith a
n R
CA
ad
v. o
ver
Sri
Lan
ka
F
igur
es in
US
D M
illio
ns
PA
KIS
TAN
RC
A A
DV
AN
TAG
E IT
EM
S W
ITH
NO
CO
NC
ES
SIO
N
HS
co
de
Pro
duc
t La
bel
Pak
Exp
ort
s
2013
to
SL
SL
Wo
rld
Im
po
rts
2013
Pak
Wo
rld
E
xpo
rts
2013
Tari
ff o
n P
akTr
ade
po
tent
ial
Gro
wth
20
04-2
013
Pak
RC
AS
L R
CA
Pak
RC
A
Ad
v.
4113
10Le
athe
r fu
rthe
r pr
epar
ed a
fter
tann
ing
or
crus
ting
"incl
. par
chm
ent-d
r0.
342.
1015
8.95
111.
760.
2112
9.34
43.
7612
5.58
4
0813
40Fr
uits
, drie
d ne
s0.
010.
2374
.93
300.
220.
0173
.696
073
.696
8214
20M
anic
ure
or p
edic
ure
sets
and
in
stru
men
ts (
incl
udin
g na
il fil
es)
0.00
0.09
49.5
030
0.09
0.00
73.6
960
73.6
96
1006
30R
ice,
sem
i-mill
ed o
r w
holly
mill
ed,
whetherornotpolishedorglazed
10.3
917
.53
1,79
0.21
297.
14-1
0.25
66.1
761.
8864
.296
0204
50Goatmeat,fresh,chilledorfrozen
0.00
0.56
19.0
830
0.56
0.00
46.6
243.
7642
.864
5608
90Knottdnettgoftwine/cordage/
rope
,nes
,and
mad
e up
net
s of
oth
tex
mat
0.00
0.82
11.3
530
0.82
0.00
51.1
369.
441
.736
1006
20R
ice,
hus
ked
(bro
wn)
0.00
0.01
64.2
519
0.01
0.00
41.3
60
41.3
6
2207
20E
thyl
alc
ohol
and
oth
er s
pirit
s, d
enat
ured
, of
any
str
engt
h0.
230.
4382
.49
136
0.20
0.23
36.0
960
36.0
96
2207
10U
nden
atur
d et
hyl a
lcoh
ol o
f an
alco
hol
strgthbyvolof80%vol/higher
2.76
8.74
274.
0722
05.
972.
7629
.328
1.88
27.4
48
1207
40S
esam
um s
eeds
, whe
ther
or
not b
roke
n0.
010.
0857
.64
300.
08-0
.02
15.7
920
15.7
92
0710
10Potatoes,frozen
0.97
0.02
3.36
14_
0.97
15.7
920
15.7
92
0701
90P
otat
oes,
fres
h or
chi
lled
nes
12.0
928
.39
130.
2664
16.3
09.
2126
.32
13.1
613
.16
3401
19S
oap&
orgn
sur
f pr
ep,s
hapd
,nes
;pap
ers&
nonw
oven
s impregwsoap/prep,nes
0.00
0.04
28.6
530
0.04
0.00
12.7
840
12.7
84
0402
29M
ilk a
nd c
ream
pow
der
swee
tene
d ex
ceed
ing
1.5%
fat
0.00
1.91
11.2
031
1.91
0.00
15.7
923.
7612
.032
9404
90Articlesofbedding/furnishing,nes,
stuf
fed
or in
tern
ally
fitte
d0.
080.
3690
.80
300.
280.
057.
520
7.52

An Assessment of the Pakistan-Sri Lanka Free Trade Agreem
ent
Section 3 Analysis of Sri
Lanka’s Exports to Pakistan under
FTA

51
An Assessment of the Pakistan-Sri Lanka Free Trade Agreem
ent
8.0 PRELIMINARY ANALYSIS OF SRI LANKAN EXPORTS TO PAKISTAN UNDER FTA
All top 20 items at two digit HS code with the exception of HS 39 (Plastics), which experienced a reduction of 500,000 dollars, have experienced growth in their imports by Pakistan, though the absolute level of Sri Lankan imports remains low. The highest growth occurred in HS09 (Coffee, tea) imports, which grew by over 12 million dollars.
Table 22. Major Sri Lankan exports to Pakistan Figures in USD Millions
TOP SRI LANKAN EXPORTS TO PAKISTAN
HS Code Product label Value in 2004 Value in 2013 Growth in Exports
Equivalent ad valorem tariff
applied by Pakistan to Sri Lanka
09 Coffee, tea, mate and spices 6.87 19.51 12.64 3.4
40 Rubber and articles thereof 10.79 14.47 3.68 5.5
14 Vegetable plaiting materials, vegetable products nes 3.66 11.96 8.30 17.1
08 Edible fruit, nuts, peel of citrus fruit, melons 2.50 9.96 7.47 6.4
44 Wood and articles of wood, wood charcoal 2.23 9.72 7.49 4.4
07 Edible vegetables and certain roots and tubers 0.00 3.46 3.46 1
23 Residues, wastes of food industry, animal fodder 0.08 1.93 1.85 3.7
58 Special woven or tufted fabric, lace, tapestry etc 0.00 1.61 1.61 8.2
38 Miscellaneous chemical products 0.04 1.25 1.21 3.1
47 Pulp of wood, fibrous cellulosic material, waste etc 0.00 1.12 1.12 0.8
54 Manmade filaments 0.00 0.82 0.82 6.1
15 Animal,vegetable fats and oils, cleavage products, etc 0.40 0.80 0.40 16.1
53 Vegetable textile fibres nes, paper yarn, woven fabric 0.37 0.74 0.38 5.6
62 Articles of apparel, accessories, not knit or crochet 0.00 0.63 0.63 22.7
48 Paper and paperboard, articles of pulp, paper and board 0.29 0.62 0.33 6.9
69 Ceramic products 0.02 0.51 0.49 9.7
33 Essential oils, perfumes, cosmetics, toileteries 0.02 0.49 0.48 9.8
61 Articles of apparel, accessories, knit or crochet 0.07 0.40 0.34 22.8
39 Plastics and articles thereof 0.88 0.37 -0.50 9.5
76 Aluminium and articles thereof 0.14 0.36 0.22 3.9
A look at the available data at the 6-digit HS code level further fills in this grim picture. Out of 4905 items at full concession, a meagre 134 items showed growth, 65 showed contraction in exports, and 4706 showed no change, with all of the unchanged items reporting 0 exports in both 2004 and 2013. Only 147 items reported any exports at all in 2013, which is 3% of total concession items. This was up from 1.7% of all concession items showing any exports in 2004.

52
An Assessment of the Pakistan-Sri Lanka Free Trade Agreem
ent
There were total concession item exports by Sri Lanka in 2013 to Pakistan of about USD 66 million, up from exports of about USD 29 million in 2004, a rise of 130%.
Out of a total of 540 no concession items, data was available for 484. 44 no concession items showed growth, 16 fell in Sri Lankan exports to Pakistan, and 424 remained unchanged, all of these having reported 0 exports in both 2004 and 2013. 51 non-concession items reported exports in 2013, up from 25 in 2004.
There were total non-concession item exports by Sri Lanka to Pakistan of USD 17.2 million in 2013, up from exports of USD 10.4 million in 2004, a rise by 64%.
This brief overview confirms that the Pakistan-Sri Lanka FTA has failed to improve either country’s fortunes very significantly. We have already seen that huge potential exists for Pakistani exports to Sri Lanka, confirmed by trends in supply and demand, unhindered by excessive tariffs. A similar analysis of Sri Lankan exports at the 6 digit HS code level will revealwhetherasimilaramountofpotentialtradeisgoingunrealizedforgoodscomingintoPakistan from Sri Lanka.
Table 23. Sri Lankan export items with positive, negative or zero growth in exports to Pakistan
Positive Growth Items
Negative Growth Items
Zero Growth Items
Full Concession Items 2.7% 1.4% 95.9%
No Concession Items 9% 3.3 % 87.7%
Fig.11 Sri Lankan export items to Pakistan categorized by positive, negative and zero growthFig.11Sri Lankan export items to Pakistan categorized by positive, negative and zero growth
0
500
1000
1500
2000
2500
3000
3500
4000
4500
5000
Full Concession Item No Concession Items
Sri Lankan Exports to Pakistan by Growth
Positive Growth Items
Negative Growth Items
No Growth
Num
ber
of
Exp
ort
Item
s
Items

53
An Assessment of the Pakistan-Sri Lanka Free Trade Agreem
ent
8.1 COMPARISON OF SRI LANKA AND CHINA TRADE WITH PAKISTAN
It may be useful to compare China and Sri Lanka’s trade relationships with Pakistan since in addition to Pakistan and China having an FTA, a China-Sri Lanka FTA is currently under negotiation. China’s dominance in Pakistani imports is unsurprising, (Sri Lankan imports to Pakistan are around 1% of China’s USD 6.6 billion exports to Pakistan), but a closer look at trade figures can reveal any disproportionate advantages conferred by tariff differentials.
For the 5445 export items at the 6 digit HS code level for which data is available for Sri Lanka, there are a corresponding 4226 items with available data for China. China’s total exports of these 4226 products to Pakistan amount to around USD 6.6 billion (nearly the entirety of its exports to Pakistan), whereas Sri Lanka’s exports of these 4226 products comes out to USD 63 million. China outperforms Sri Lanka in the exports of 3261 items to Pakistan, whereas Sri Lanka outperforms China in 55 items.
China has a tariff advantage over Sri Lanka on a mere 278 items out of the total 4226 for which data is available, and within these items it’s export advantage over Sri Lanka is a little over USD 300 million. Therefore, the 7% of export items that have tariff advantages account for 5% of China’s total export advantage over Sri Lanka, suggesting that the items with tariffs favouring China are not benefitting from the tariff policy to a disproportionate extent. Moreover, Sri Lanka faces greater concessions from Sri Lanka than does China in 3372 items, 80% of the items under consideration, once again suggesting that the fledgling state of Pakistan-Sri Lanka relations cannot be accounted for primarily by lack of tariff concessions.
Fig. 12 Comparison between China and Sri Lanka export items to Pakistan
The following chart indicates the relative insignificance of items with higher Pakistani tariffs on Sri Lanka in terms of China’s export differential over Sri Lanka.
Items with higher Chinese exports
77%
Items with higher Sri Lankan exports
1%
Items with equal exports
22%
China and Sri Lanka exports to Pakistan at 6 digit HS code

54
An Assessment of the Pakistan-Sri Lanka Free Trade Agreem
ent
Fig 13. Items that China exports larger quantities of to Pakistan categorised by the tariffs they face
Export Adv on Items with higher tariff on Sri Lanka
4%
Export Adv on Items with lower
tariffs on Sri Lanka 94%
Export Adv on Items with equal
tariffs2%
China Export advatage on Sri Lanka by Tariff differential

55
An Assessment of the Pakistan-Sri Lanka Free Trade Agreem
ent
9.0 ANALYSIS OF SRI LANKA’S EXPORTS TO PAKISTAN
We will now use the same approach as in our analysis of Sri Lankan imports from Pakistan to try and determine which Sri Lankan exports to Pakistan should be considered high priority itemsduetothemetricsassociatedwiththem.Wewillonceagainbecategorizingtheitemsby trade potential while also bringing to bear CAGR information on our outlook.
There are 247 items with trade potential exceeding USD 500,000, out of which 161 (65%) items show high potential CAGR values. The total trade potential for these 247 items is USD 1.08 billion. The total trade potential for the 161 favourable CAGR items is USD 878 million, indicating that most of the trade potential for Sri Lankan exports to Pakistan lies in products that already face trends conducive to the expansion of trade.
This brief overview suggests that Sri Lanka too has export items that have experienced favourable trends in Pakistani demand and Sri Lankan supply but that have failed to make headwayinthePakistanimarket.Moreover,thefactthat91%ofthe247itemsfacezerotariffsfrom Pakistan strongly suggests that the lacklustre state of trade here too is not primarily a consequenceoftariffdisadvantages.Onlyselecteditemsfromthetotal247arelistedinthefollowing tables.
9.1 TRADEPOTENTIAL≥USD10MILLION
79% of the 19 items in this category have high potential CAGR values associated with them. ThetotaltradepotentialinthiscategoryequalsUSD656million.Thehighestamountoftradepotential resides in HS 090240 (Black Tea) which faces a Tariff Rate Quota from Pakistan, whereinitonlyutilizesaround20%ofitsduty-freeallowance.However,nootheritemsinthiscategory face any tariffs. The items are listed in the table on the following page.

56
An Assessment of the Pakistan-Sri Lanka Free Trade Agreem
ent
Tab
le 2
4. S
ri L
anka
n ex
po
rt it
ems
to P
akis
tan
with
hig
h C
AG
R it
ems
hig
hlig
hte
d
Fig
ures
in U
SD
Mill
ions
TRADEPOTENTIAL≥USD10MILLION
HS
Co
de
Pro
duc
t la
bel
SL
2013
E
xpo
rt t
o
Pak
Pak
201
3 W
orl
d
Imp
ort
s
Sri
Lan
ka
2013
W
orl
d
Exp
ort
s
Trad
e P
ote
ntia
lS
L-P
ak
CA
GR
Pak
Im
po
rts
CA
GR
SL
Exp
ort
s C
AG
RTa
riff
on
SL
0902
40B
lack
tea
(fer
men
ted)
& p
artly
ferm
ente
d te
a in
pac
kage
s ex
ceed
g 3
kg2.
1831
3.15
800.
6931
0.96
-10.
90%
5.06
%6.
65%
10
2710
19O
ther
pet
role
um o
ils a
nd p
repa
ratio
ns0.
007,
164.
5931
.12
31.1
20.
00%
18.2
6%16
.03%
0
2106
90Fo
od p
repa
ratio
ns n
es0.
0142
.63
30.1
530
.14
0.00
%17
.32%
23.6
1%0
2309
90A
nim
al fe
ed p
repa
ratio
ns n
es0.
0030
.00
38.7
530
.00
0.00
%21
.14%
88.3
3%0
4907
00Unusdpostage,revenuestamps;chequeforms,banknotes,bond
cert
ific,
etc
0.00
815.
8028
.67
28.6
70.
00%
137.
52%
22.2
5%0
8504
31Tr
ansf
orm
ers
elec
tric
pow
er h
andl
ing
capa
city
not
exc
eedi
ng 1
KVA
, ne
s0.
0026
.77
28.4
226
.77
0.00
%54
.36%
5.79
%0
9503
00Tr
icyc
les,
sco
oter
s, p
edal
car
s an
d si
mila
r w
heel
ed to
ys; d
olls
'' car
r0.
0024
.02
27.4
924
.02
0.00
%6.
70%
5.65
%0
9031
80M
easu
ring
or c
heck
ing
inst
rum
ents
, app
lianc
es a
nd m
achi
nes,
nes
0.00
21.5
025
.19
21.5
0-2
5.98
%11
.30%
17.1
2%0
8538
90P
arts
for
use
with
the
appa
ratu
s of
hea
dg n
o. 8
5.35
,85.
36 o
r 85
.37,
nes
0.00
20.8
021
.65
20.7
9_*
6.23
%10
.28%
0
8537
10Boards,panels,includgnumericalcontrolpanels,foravoltage<=1000
V0.
0028
.55
19.9
619
.96
0.00
%31
.69%
25.2
8%0
4016
99A
rtic
les
of v
ulca
nise
d ru
bber
nes
, oth
er th
an h
ard
rubb
er0.
0017
.84
55.5
517
.84
0.00
%14
.20%
17.5
5%0
4011
20P
neum
atic
tire
s ne
w o
f rub
ber
for
buse
s or
lorr
ies
1.06
168.
1318
.21
17.1
554
.91%
9.31
%12
.35%
0
4707
90W
aste
&sc
rap
of p
aper
or
pape
rboa
rd,n
es (
incl
udg
unso
rted
w
aste
&sc
rap)
0.48
20.8
817
.45
16.9
773
.95%
7.14
%17
.39%
0
4016
93G
aske
ts, w
ashe
rs a
nd o
ther
sea
ls o
f vul
cani
sed
rubb
er0.
0016
.72
14.8
614
.86
0.00
%20
.85%
9.38
%0
0802
80A
reca
nut
s0.
0072
.92
11.7
611
.76
0.00
%_*
_*0
7801
10Le
ad r
efin
ed u
nwro
ught
0.00
90.7
011
.65
11.6
50.
00%
27.5
9%11
4.73
%0
2401
20To
bacc
o, u
nman
ufac
ture
d, p
artly
or
who
lly s
tem
med
or
strip
ped
0.00
11.1
737
.06
11.1
70.
00%
33.4
5%45
.31%
0
8544
49E
lect
ric c
ondu
ctor
s, fo
r a
volta
ge n
ot e
xcee
ding
80
V, n
es0.
0042
.96
10.8
510
.85
-41.
29%
22.3
5%-1
0.25
%0

57
An Assessment of the Pakistan-Sri Lanka Free Trade Agreem
ent
Tab
le 2
5. S
ri L
anka
n ex
po
rt it
ems
to P
akis
tan
with
hig
h C
AG
R it
ems
hig
hlig
hte
d
Fig
ures
in U
SD
Mill
ions
USD5MILLION≤TRADEPOTENTIAL<USD10MILLION
HS
Co
de
Pro
duc
t la
bel
SL
2013
E
xpo
rt t
o
Pak
Pak
201
3 W
orl
d
Imp
ort
s
Sri
Lan
ka20
13
Wo
rld
E
xpo
rts
Trad
eP
ote
ntia
lS
L-P
ak
CA
GR
Pak
Im
po
rts
CA
GR
SL
Exp
ort
s C
AG
RTa
riff
on
SL
6911
10Ta
blew
are
and
kitc
henw
are
of p
orce
lain
or
chin
a0.
219.
5326
.96
9.32
31.3
2%3.
08%
0.66
%20
7010
90C
arbo
ys, b
ottle
s, fl
asks
, jar
s, p
ots,
phi
als
and
othe
r co
ntai
ners
, of
0.00
7.49
11.8
07.
490.
00%
10.5
7%66
.34%
0
5510
11Yarn,>/=85%ofartificialstaplefibres,single,notputup
0.00
7.11
20.7
77.
110.
00%
22.4
0%17
.95%
0
8534
00P
rinte
d ci
rcui
ts0.
007.
0816
.74
7.08
0.00
%14
.55%
38.3
1%0
8802
30A
ircra
ft ne
s of
an
unla
den
wei
ght >
2,0
00 k
g bu
t not
ex
ceed
g 15
,000
kg
0.00
9.53
6.89
6.89
0.00
%63
.43%
128.
87%
0
3926
90A
rtic
les
of p
last
ics
or o
f oth
er m
ater
ials
of N
os 3
9.01
to
39.1
4 ne
s0.
0034
.03
6.53
6.53
-24.
47%
8.99
%1.
32%
12.2
7113
19Articlesofjewellry&pttherofof/oprecmetw/nplatd/clad
w p
rec
met
0.00
6.39
12.1
36.
390.
00%
59.0
6%-2
.48%
0
4411
14M
ediu
m d
ensi
ty fi
breb
oard
MD
F of
woo
d, o
f a th
ickn
ess
> 9
mm
3.64
9.95
20.6
46.
3222
6.00
%-3
.20%
57.6
7%0
8537
20B
oard
s,pa
nels
,incl
udg
num
eric
al c
ontr
ol p
anel
s,fo
r a
volta
ge >
1,0
00 V
0.00
12.7
56.
116.
110.
00%
22.2
4%62
.82%
0
1006
30R
ice,
sem
i-mill
ed o
r w
holly
mill
ed, w
heth
er o
r no
t pol
ishe
d orglazed
0.00
15.1
75.
815.
810.
00%
41.7
8%25
.44%
0
1404
90Ve
geta
ble
prod
ucts
nes
11.9
624
.31
17.7
35.
7759
.59%
16.7
7%17
.33%
15.3
8422
30Machffil/clos/seal/etc.btle/can/box/bag/ctnrnes,machf
aera
tg b
ev0.
0063
.16
5.52
5.52
_*19
.38%
39.6
6%0
6908
90Tiles,cubesandsimnes,glazedceramics
0.30
38.9
85.
755.
4511
8.63
%1.
82%
13.4
4%0
8507
20Le
ad-a
cid
elec
tric
acc
umul
ator
s ne
s0.
0034
.26
5.23
5.23
0.00
%32
.04%
316.
58%
0
5806
20Narrowwovenfab,cntgbywt>/=5%elastomericyarn/
rubb
er th
read
nes
0.00
5.04
11.1
95.
040.
00%
23.5
1%-5
.30%
0
9.2 USD5MILLION≤TRADEPOTENTIAL<USD10MILLION
69% of the 16 items in this category exhibit favourable CAGR values. The total trade potential inthiscategoryequalsUSD106million.

58
An Assessment of the Pakistan-Sri Lanka Free Trade Agreem
ent
9.3 USD1MILLION≤TRADEPOTENTIAL<USD5MILLION
45% of the 119 items in this category show high potential CAGR values. The total trade potentialinthiscategoryequalsUSD252million.
Tab
le 2
6. S
ri L
anka
n ex
po
rt it
ems
to P
akis
tan
with
hig
h C
AG
R it
ems
hig
hlig
hte
d
F
igur
es in
US
D M
illio
ns
USD1MILLION≤TRADEPOTENTIAL<USD5MILLION
HS
Co
de
Pro
duc
t la
bel
SL
2013
E
xpo
rt t
o
Pak
Pak
201
3 W
orl
d
Imp
ort
s
Sri
Lan
ka
2013
W
orl
d
Exp
ort
s
Trad
eP
ote
ntia
lS
L-P
ak
CA
GR
Pak
Im
po
rts
CA
GR
SL
Exp
ort
s C
AG
RTa
riff
on
SL
4001
21N
atur
al r
ubbe
r in
sm
oked
she
ets
5.09
10.0
513
.50
4.95
-4.2
2%-0
.17%
-5.1
5%0
8704
21D
iese
l pow
ered
truc
ks w
ith a
GV
W n
ot e
xcee
ding
five
to
nnes
0.00
53.4
54.
844.
840.
00%
2.01
%64
.14%
0
0902
20G
reen
tea
(not
ferm
ente
d) in
pac
kage
s ex
ceed
ing
3 kg
0.00
5.11
4.63
4.63
0.00
%17
.46%
21.7
0%0
0813
40Fr
uits
, drie
d ne
s0.
064.
597.
554.
53-1
5.37
%2.
63%
18.4
6%0
4821
10P
aper
labe
ls o
f all
kind
s, p
rinte
d0.
254.
6010
.10
4.36
0.51
%-0
.22%
10.7
8%0
6111
90B
abie
s ga
rmen
ts&
clot
hg a
cces
sorie
s of
oth
er te
xtile
m
ater
ials
,kni
tted
0.00
4.27
10.8
54.
270.
00%
12.8
9%4.
47%
0
3507
90Enzymesnes;preparedenzymesnes
0.04
22.1
64.
224.
18-9
.03%
16.5
5%12
.94%
0
8504
21Liquiddielectrictransformershavgapowerhandlgcapa
<=650KVA
0.00
4.13
8.25
4.13
0.00
%36
.50%
44.8
5%0
0810
90Fr
uits
, fre
sh n
es0.
004.
924.
104.
100.
00%
13.6
7%30
.46%
0
6203
49Mens/boystrousersandshorts,ofothertextilematerials,
not k
nitte
d0.
003.
8346
.26
3.83
0.00
%42
.62%
4.32
%0
8538
10B
oard
s,pa
nels
,etc
for
good
s of
hea
dg n
o. 8
5.37
,not
equippdwtheirapp
0.00
3.78
12.6
13.
780.
00%
8.38
%0.
58%
0
4911
99P
rinte
d m
atte
r, ne
s0.
003.
753.
903.
750.
00%
16.9
0%74
.49%
0
4008
21P
late
s,sh
eets
&st
rip o
f non
cel
lula
r ru
bber
,oth
than
har
d ru
bber
(vu
lc)
0.04
3.57
8.61
3.53
-8.2
1%26
.05%
6.54
%0
5903
90Te
xtile
fabr
ics
impr
egna
ted,
ctd
, cov
, or
lam
inat
ed w
ith
plas
tics,
nes
0.00
7.00
3.29
3.29
0.00
%0.
11%
46.9
5%0
8712
00B
icyc
les
and
othe
r cy
cles
(in
clud
ing
deliv
ery
tric
ycle
s),n
ot
mot
oris
ed0.
023.
1524
.44
3.13
_*11
.78%
14.8
2%0
6116
93G
love
s, m
itten
s an
d m
itts,
nes
, of s
ynth
etic
fibr
es, k
nitte
d0.
013.
076.
213.
06-1
3.53
%27
.14%
0.11
%0

59
An Assessment of the Pakistan-Sri Lanka Free Trade Agreem
ent
9.4 USD500,000≤TRADEPOTENTIAL<USD1MILLION
54% of the 94 items in this category have high potential CAGR values associated with them. The total trade potential in this category comes out to USD 67 million.
Tab
le 2
7. S
ri L
anka
n ex
po
rt it
ems
to P
akis
tan
with
hig
h C
AG
R it
ems
hig
hlig
hte
d
F
igur
es in
US
D M
illio
ns
USD500,000≤TRADEPOTENTIAL<USD1MILLION
HS
Co
de
Pro
duc
t la
bel
Sri
Lan
ka
2013
E
xpo
rt t
o
Pak
Pak
201
3 W
orl
d
Imp
ort
s
Sri
Lan
ka
2013
W
orl
dE
xpo
rts
Trad
eP
ote
ntia
lS
L-P
ak
CA
GR
Pak
Im
po
rts
CA
GR
SL
Exp
ort
s C
AG
RTa
riff
on
SL
1301
90N
atur
al g
ums,
res
ins,
gum
-res
ins
and
bals
am, e
xcep
t ar
abic
gum
0.00
2.35
1.00
1.00
0.00
%9.
78%
0.17
%0
4819
40S
acks
and
bag
s, o
f pap
er, n
es; i
nclu
ding
con
es0.
031.
013.
570.
98_*
4.86
%11
.43%
0
3301
90Conc&aqueousdistlsofessentloils;terpenicby-prodsof
esse
ntl o
ils0.
010.
9822
.59
0.97
_*17
.48%
22.2
2%0
9603
29S
havi
ng,h
air,n
ail,e
yela
sh &
oth
er to
ilet b
rush
es fo
r us
e on
th
e pe
rson
0.00
0.95
1.66
0.95
0.00
%24
.40%
8.49
%0
5508
10S
ewin
g th
read
of s
ynth
etic
sta
ple
fibre
s0.
221.
163.
100.
95-8
.38%
24.7
3%-0
.04%
0
3204
17S
ynth
etic
org
anic
pig
men
ts a
nd p
repa
ratio
ns b
ased
th
ereo
n0.
0021
.63
0.94
0.94
0.00
%1.
95%
4.73
%0
8426
19Tr
ansp
orte
r or
brid
ge c
rane
s0.
0015
.99
0.94
0.94
0.00
%1.
52%
83.3
1%0
9506
91Gymnasiumorathleticsarticlesandequipment
0.00
6.79
0.93
0.93
0.00
%14
.57%
39.3
8%0
9606
21B
utto
ns o
f pla
stic
s, n
ot c
over
ed w
ith te
xtile
mat
eria
l0.
003.
050.
880.
880.
00%
35.6
4%14
.36%
0
4203
10A
rtic
les
of a
ppar
el o
f lea
ther
or
of c
ompo
sitio
n le
athe
r0.
000.
8614
.39
0.86
0.00
%28
.55%
21.2
1%0
4421
90W
ood
artic
les
nes
0.00
0.85
8.15
0.85
0.00
%8.
61%
9.66
%0
7117
19Im
itatio
n je
wel
lery
nes
of b
ase
met
al w
heth
er o
not
pla
td
w p
rec
met
al0.
000.
853.
790.
850.
00%
24.0
2%20
.55%
0
6403
19Sportsfootwear,o/tski,outrsoleofrbr/plas/leather&upper
of le
athe
r0.
005.
610.
840.
84-2
8.86
%8.
27%
-2.0
0%0
0801
11C
ocon
uts,
des
sica
ted
4.06
4.90
59.2
90.
8421
.98%
1.28
%2.
78%
0
7326
90A
rtic
les,
iron
or
stee
l, ne
s0.
0037
.06
0.83
0.83
0.00
%19
.08%
-0.3
2%0
8504
50In
duct
ors,
ele
ctric
0.00
3.39
0.82
0.82
0.00
%26
.25%
20.1
4%0
8543
70E
lect
rical
mac
hine
s an
d ap
para
tus,
hav
ing
indi
vidu
al
func
tions
, n.e
.s.
0.00
13.8
80.
820.
820.
00%
13.9
2%28
2.34
%0
7320
10S
prin
gs, l
eaf a
nd le
aves
ther
efor
, iro
n or
ste
el0.
001.
020.
820.
820.
00%
20.8
7%5.
35%
0
8428
20P
neum
atic
ele
vato
rs a
nd c
onve
yors
0.00
0.86
0.82
0.82
0.00
%6.
62%
72.5
8%0
4819
50C
onta
iner
s, p
acki
ng, n
es (
incl
udin
g re
cord
sle
eves
) of
pa
per
0.00
1.63
0.81
0.81
0.00
%50
.14%
80.3
9%0
6402
99Footwear,outersoles/uppersofrubberorplastics,nes
0.00
3.44
0.80
0.80
0.00
%12
.52%
38.4
0%0
6815
99A
rtic
les
of s
tone
or
of o
ther
min
eral
sub
stan
ces
nes
0.00
0.75
7.77
0.75
0.00
%17
.40%
74.0
5%0
7404
00W
aste
and
scr
ap, c
oppe
r or
cop
per
allo
y0.
004.
430.
750.
750.
00%
11.4
1%11
.15%
0

60
An Assessment of the Pakistan-Sri Lanka Free Trade Agreem
ent
9.5 HIGH TRADE POTENTIAL AND FAVOURABLE CAGR ITEMS THAT SHOULD RECEIVE TARIFF CONCESSIONS
The following table lists 11 items with trade potential exceeding USD 500,000 that have favourable CAGR metrics and face tariffs from Pakistan. The items have a total trade potential of USD 330 million. Particular attention should be paid to HS 39 Plastics, which has 5 items on the table, and HS 15 Animal, Vegetable fats and oils, which has 2 items.
Tab
le 2
8. S
ri L
anka
n ex
po
rt it
ems
to P
akis
tan
with
hig
h C
AG
R it
ems
hig
hlig
hte
d
Fig
ures
in U
SD
Mill
ions
HIG
H T
RA
DE
PO
TEN
TIA
L A
ND
CA
GR
ITE
MS
FA
CIN
G T
AR
IFFS
HS
Co
de
Pro
duc
t la
bel
Sri
Lan
ka
2013
E
xpo
rts
to
Pak
Pak
201
3 W
orl
d
Imp
ort
s
Sri
Lan
ka
2013
W
orl
d
Exp
ort
s
Trad
eP
ote
ntia
lS
L-P
ak
CA
GR
Pak
Im
po
rts
CA
GR
SL
Exp
ort
s C
AG
RTa
riff
on
SL
0902
40B
lack
tea
(fer
men
ted)
& p
artly
ferm
ente
d te
a in
pac
kage
s ex
ceed
g 3
kg2.
1831
3.15
800.
6931
0.96
-10.
90%
5.06
%6.
65%
10
3926
90A
rtic
les
of p
last
ics
or o
f oth
er m
ater
ials
of N
os
39.0
1 to
39.
14 n
es0.
0034
.03
6.53
6.53
-24.
47%
8.99
%1.
32%
12.2
3923
21S
acks
and
bag
s (in
clud
ing
cone
s) o
f po
lym
ers
of e
thyl
ene
0.04
4.79
28.6
54.
75_*
37.8
7%1.
88%
25
6305
33S
acks
, bag
s, p
acki
ng, o
f str
ip p
last
ic m
ater
ial
0.01
2.13
9.91
2.12
_*3.
71%
9.77
%25
1517
90Ediblemx/prepofanimal/vegfats&oils/of
fract
ions
ex
hd N
o 15
.16
0.21
6.68
1.71
1.50
_*37
.95%
8.10
%14
.4
3924
90H
ouse
hold
and
toile
t art
icle
s ne
s, o
f pla
stic
s0.
011.
491.
771.
48_*
0.23
%36
.14%
25
3919
10S
elf-a
dhes
ive
plat
es,s
heet
s,fil
m e
tc,o
f pla
stic
inrolls<20cmwide
0.00
9.85
0.82
0.82
0.00
%9.
48%
17.6
5%17
.5
1511
90P
alm
oil
and
its fr
actio
ns r
efin
ed b
ut n
ot
chem
ical
ly m
odifi
ed0.
081,
610.
010.
710.
63-6
0.42
%11
.88%
36.1
4%30
.1
3305
10H
air
sham
poos
0.02
18.0
60.
570.
5613
.90%
5.59
%17
.21%
12.5
3923
50S
topp
ers,
lids
, cap
s an
d ot
her
clos
ures
of
plas
tics
0.01
9.33
0.54
0.52
_*12
.99%
42.5
9%25
4013
20In
ner
tube
s of
rub
ber
for
bicy
cles
0.00
0.51
2.04
0.51
_*32
.80%
18.0
0%25

61
An Assessment of the Pakistan-Sri Lanka Free Trade Agreem
ent
9.6 TWO DIGIT HS CODES WITH HIGH TRADE POTENTIAL
The following table identifies Sri Lankan export items to Pakistan at 2 digit HS codes which have high trade potential. Items within the HS codes that represent high proportions of the potential include black tea, tires for buses and lorries, food preparations and ethylene sacks andbags.Itshouldbenotedthatwhileteafacesatariffratequota,itsimportsfromSriLankafall far below the allowance that has been made for duty free imports, suggesting that Sri Lanka has lost much of the Pakistani tea market.
Table 29. Two digit HS codes with high potential Sri Lankan exports to Pakistan Figures in USD Millions
HS CODES WITH HIGH TRADE POTENTIAL
HS Code Product Label Total Trade Potential in USD Millions
Main Products at 6 Digit HS code with high
potential
09 Coffee, tea, mate and spices 327 Black tea
85 Electrical,electronicequipment 128 Transformers, numerical control panels, conductors
40 Rubber and articles thereof 82Tires for buses and lorries, articles of vulcanised rubber
49 Printed books, newspapers, pictures etc 36 Postage stamps
21 Miscellaneous edible preparations 31 Food preparations
95 Toys,games,sportsrequisites 28 Wheeled toys
39 Plastics and articles thereof 26Ethylene sacks and bags, clothing accessories (gloves etc.)

62
An Assessment of the Pakistan-Sri Lanka Free Trade Agreem
ent
9.7 TWO DIGIT HS CODES WITH HIGH TRADE POTENTIAL AND HIGH POTENTIAL CAGR VALUES
The following table lists 2 digit HS codes with high trade potential and favourable CAGR metrics, usually within several items at the 6-digit level. Many HS codes from the previous table show up here as well, with more than 50% of the potential within coffee, tea etc., electrical, electronicequipment,rubber,printedbooksetc,toys,miscellaneousediblepreparationsandplastics also showing favourable CAGR values. These HS codes therefore represent prime opportunities for boosting Sri Lankan exports to Pakistan since they experienced positive growth in terms of Sri Lankan exports as well as in terms of Pakistani imports over the period 2004-2013.There is considerable overlap between this and the previous table, indicating that hightradepotentialitemsfrequentlyexhibitfavourableCAGRmetrics.
Table 30. Two digit HS codes with Sri Lankan exports items to Pakistan with high CAGR items Figures in USD Millions
HS CODES WITH HIGH TRADE POTENTIAL AND HIGH CAGR VALUES
HS Code Product LabelTotal Trade Potential in
High CAGR Items in USD millions
Number of items at 6 digit HS code
09 Coffee, tea, mate and spices 316 2
85 Electrical,electronicequipment 75 13
40 Rubber and articles thereof 40 6
21 Miscellaneous edible preparations 31 2
49 Printed books, newspapers, pictures etc 33 3
95 Toys,games,sportsrequisites 27 3
84 Machinery, nuclear reactors, boilers, etc 15 10
24 Tobacco and manufactured tobacco substitutes 13 2
78 Lead and articles thereof 12 1
39 Plastics and articles thereof 18 9
This table indicates that a total of 47 items at the 6-digit HS code have a trade potential of over USD 570 million as Sri Lankan exports to Pakistan. Only HS09 faces any kind of notable import restriction since a TRQ is in effect on tea imports, whereas the other HS codes enjoy full concession in the relevant items with the exception of Plastics and offer trade potential worth about USD 254 million. For instance, thirteen 6-digit HS code electronic items alone represent a total USD 75 million trade potential with favourable CAGR values and full concession. Moreover, HS 40 Rubber faces tariffs on only one of the 6 high CAGR items considered.
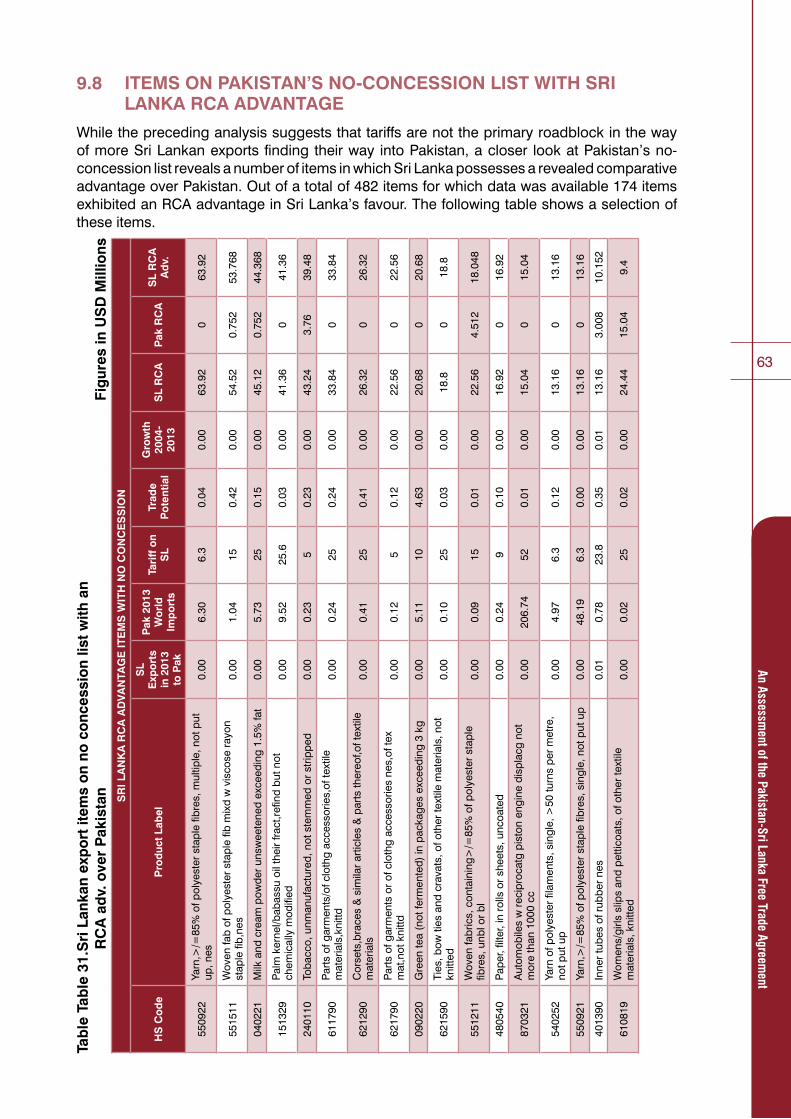
63
An Assessment of the Pakistan-Sri Lanka Free Trade Agreem
ent
9.8 ITEMS ON PAKISTAN’S NO-CONCESSION LIST WITH SRI LANKA RCA ADVANTAGE
While the preceding analysis suggests that tariffs are not the primary roadblock in the way of more Sri Lankan exports finding their way into Pakistan, a closer look at Pakistan’s no-concession list reveals a number of items in which Sri Lanka possesses a revealed comparative advantage over Pakistan. Out of a total of 482 items for which data was available 174 items exhibited an RCA advantage in Sri Lanka’s favour. The following table shows a selection of these items.
Tab
le T
able
31.
Sri
Lan
kan
exp
ort
item
s o
n no
co
nces
sio
n lis
t w
ith a
n
R
CA
ad
v. o
ver
Pak
ista
n
Fi
gur
es in
US
D M
illio
ns
SR
I LA
NK
A R
CA
AD
VA
NTA
GE
ITE
MS
WIT
H N
O C
ON
CE
SS
ION
HS
Co
de
Pro
duc
t La
bel
SL
Exp
ort
s in
201
3 to
Pak
Pak
201
3 W
orl
d
Imp
ort
s
Tari
ff o
n S
LTr
ade
Po
tent
ial
Gro
wth
20
04-
2013
SL
RC
AP
ak R
CA
SL
RC
A
Ad
v.
5509
22Yarn,>/=85%ofpolyesterstaplefibres,multiple,notput
up, n
es0.
006.
306.
30.
040.
0063
.92
063
.92
5515
11W
oven
fab
of p
olye
ster
sta
ple
fib m
ixd
w v
isco
se r
ayon
st
aple
fib,
nes
0.00
1.04
150.
420.
0054
.52
0.75
253
.768
0402
21M
ilk a
nd c
ream
pow
der
unsw
eete
ned
exce
edin
g 1.
5% fa
t0.
005.
7325
0.15
0.00
45.1
20.
752
44.3
68
1513
29Palmkernel/babassuoiltheirfract,refindbutnot
chem
ical
ly m
odifi
ed0.
009.
5225
.60.
030.
0041
.36
041
.36
2401
10To
bacc
o, u
nman
ufac
ture
d, n
ot s
tem
med
or
strip
ped
0.00
0.23
50.
230.
0043
.24
3.76
39.4
8
6117
90Partsofgarments/ofclothgaccessories,oftextile
mat
eria
ls,k
nittd
0.00
0.24
250.
240.
0033
.84
033
.84
6212
90C
orse
ts,b
race
s &
sim
ilar
artic
les
& p
arts
ther
eof,o
f tex
tile
mat
eria
ls0.
000.
4125
0.41
0.00
26.3
20
26.3
2
6217
90P
arts
of g
arm
ents
or
of c
loth
g ac
cess
orie
s ne
s,of
tex
mat
,not
kni
ttd0.
000.
125
0.12
0.00
22.5
60
22.5
6
0902
20G
reen
tea
(not
ferm
ente
d) in
pac
kage
s ex
ceed
ing
3 kg
0.00
5.11
104.
630.
0020
.68
020
.68
6215
90Ti
es, b
ow ti
es a
nd c
rava
ts, o
f oth
er te
xtile
mat
eria
ls, n
ot
knitt
ed0.
000.
1025
0.03
0.00
18.8
018
.8
5512
11Wovenfabrics,containing>/=85%ofpolyesterstaple
fibre
s, u
nbl o
r bl
0.00
0.09
150.
010.
0022
.56
4.51
218
.048
4805
40P
aper
, filt
er, i
n ro
lls o
r sh
eets
, unc
oate
d0.
000.
249
0.10
0.00
16.9
20
16.9
2
8703
21A
utom
obile
s w
rec
ipro
catg
pis
ton
engi
ne d
ispl
acg
not
mor
e th
an 1
000
cc0.
0020
6.74
520.
010.
0015
.04
015
.04
5402
52Ya
rn o
f pol
yest
er fi
lam
ents
, sin
gle,
>50
turn
s pe
r m
etre
, no
t put
up
0.00
4.97
6.3
0.12
0.00
13.1
60
13.1
6
5509
21Yarn,>/=85%ofpolyesterstaplefibres,single,notputup
0.00
48.1
96.
30.
000.
0013
.16
013
.16
4013
90In
ner
tube
s of
rub
ber
nes
0.01
0.78
23.8
0.35
0.01
13.1
63.
008
10.1
52
6108
19Womens/girlsslipsandpetticoats,ofothertextile
mat
eria
ls, k
nitte
d0.
000.
0225
0.02
0.00
24.4
415
.04
9.4

An Assessment of the Pakistan-Sri Lanka Free Trade Agreem
ent
Section 4 Concerns and
Recommendations

65
An Assessment of the Pakistan-Sri Lanka Free Trade Agreem
ent
10.0 GENERAL CONCERNS
Table 31. Major concerns about the FTA between Pakistan and Sri Lanka
MAIN CONCERNS VOICED ABOUT PAK-SRI LANKA FTA
1. Sri Lanka perceived as small market by businessmen
2. Few links between Pak-Sri Lanka business communities
3. Unilateral changes that oppose the spirit of the FTA
4. Insufficient involvement of business community in drafting of FTA
5. Lack of awareness about FTA terms and potential of Sri Lankan market
6. Lack of reliable forums for the arbitration of trade disputes
10.1 LACK OF INTEREST IN PAK-SRI LANKA TRADE
Certain exporters within high potential export sectors did not view Sri Lanka as having significant potential as a prospective trading partner. They substantiated this outlook by makingreferencetoSriLanka’ssmallsizewhichintheirmindstranslatedtoasignificantlysmaller market for Pakistani goods than countries such as Malaysia and Indonesia. They argued that establishing a foothold in a new market involved taking risks that the relatively low potential benefits of trade with Sri Lanka could not justify.
Exporters also claimed that there was a lack of awareness of the Pak- Sri Lanka FTA in the business community. They argued that it was incumbent on the government to work to raise awareness and apprise businessmen of opportunities existing in underdeveloped markets such as Sri Lanka, and this could be done through trade delegations and exhibitions.
Akeyconcernexpressedbyseveralquarterswastheneedforincreasedinteractionbetweenthe business communities of Pakistan and Sri Lanka. Such a back-and-forth is thought to be vital to the advancement of trade. Businessmen and bureaucrats interviewed were of themindthatopportunitiesforgrowthrequirestronglinksbetweenthecountries’businesscommunitiesandtradebodiesinordertoberealized.
10.2 UNILATERAL CHANGES MADE TO FTA TERMS
There were also concerns about unilateral changes made by both countries that are in opposition to the spirit of the FTA. For instance, in April 2014 broomcorn, a significant Sri Lankan export to Pakistan, was placed on the no concession list through Statutory Regulatory Order 280 (SRO 280), despite the fact that it previously faced no restrictions as per the terms of the FTA. This and other unilateral changes were later reversed by SRO 854. On the Sri Lankan side, in 2011 a special commodity levy was imposed on certain fruits and vegetables, such as oranges, onions and potatoes, despite the fact that, with the exception of potatoes which were under a TRQ, none of the items appeared on Sri Lanka’s no concession list. This levy replacedacess thatwaspreviously requiredofSriLankan importers,and led to thecancellation of orders made to Pakistani exporters because of the hike in prices. Similarly, steelpipes,whichareasignificantPakistaniexport-50%oftheSriLankangalvanizedpipemarket was supplied by Pakistani producers in 2013-now face a cess. The imposition of a cess haspushedpricesupby26.5%,andthePakistanishareofthepre-galvanizedtubemarkethas shrunk from 60% in 2011 to 40% in 2013. The cess falls under the category of para-tariff, the impositionofwhichasper theFTA requiresmutualconsentofbothcountries.Thesechanges, like others made by both sides, seem to have been made without consultation with the FTA partner and have therefore been particularly disruptive.

66
An Assessment of the Pakistan-Sri Lanka Free Trade Agreem
ent
10.3 INSUFFICIENT INVOLVEMENT OF BUSINESSMEN IN DRAFTING OF FTA
Several exporters raised concerns about insufficient consultation with the business community during the drafting of trade agreements. This was an issue that was seen to apply across the board and to the Pak-Sri Lanka FTA in particular as well. The contention of the businessmen interviewed was that close attention was needed to ensure that the FTA terms were appreciative of the complex ins-and-outs of their businesses, since otherwise the FTAs may become counterproductive. For instance, one businessman raised concerns about the fact that concessions granted on key raw materials to a small country like Sri Lanka with relatively low production capacity created a difficult situation for the relevant businesses at home. The concern therefore was that since each sector has its own needs and challenges which are best known to stakeholders in those sectors, the government must involve the stakeholders to a greater degree during the drafting process of trade agreements.
10.4 LACK OF EFFECTIVE TRADE DISPUTE RESOLUTION
Another common concern was the arbitration of trade disputes. The current resources for arbitrationwere thought to be insufficient and trade disputes arose frequently due tomisconduct by traders on both sides. The absence of efficient forums for arbitration was taken to be an additional disincentive to parties on both sides.
Concerns were also raised about the potential for and difficulties involved in setting up Pakistani concerns in Sri Lanka. Several stakeholders involved in trade with Sri Lanka thought that investment in the country was a very attractive option, but cited difficulties faced in establishing a presence in the country. Most notable was Thatta Cement, a Pakistani company that suspended its project in Sri Lanka because the Sri Lanka Ports Authority did not execute its land lease agreement. Plans to establish Pakistani sugar mills in Sri Lanka also seem to havestalled.Thegeneralopinionofstakeholderswasthateffortwasrequiredonbothendsto facilitate Pakistani investment into Sri Lanka since there was serious interest from several parties within Pakistan.
11.0 VIEWS OF SELECTED HIGH POTENTIAL PAKISTANI EXPORTERS
11.1 PLASTICS
A key issue voiced regarding the plastics sector was that the Sri Lanka market did not appear to be large enough to merit expanding their exports to the country. However, there was an admission that the Sri Lankan market remains unexplored due to the afore-mentioned lack of linkages between the two countries’ business communities. The high costs of transporting plastic were cited as an additional impediment given the smaller market, though stakeholders said that if freight concessions were offered by Sri Lanka they would provide sufficient incentive to increase exports to the country. It was also suggested that warehouses be allotted by Sri Lanka to house Pakistani plastic products so that buyers may view the items before purchase.There was uneasiness with the terms of the FTA that seemed to have to do as much with the substantive details of the agreement as it did with the perception that the formulation of FTAs does not sufficiently involve businessmen.
11.2 FRUITS AND VEGETABLES
Theexportoffruitsandvegetablesfacesseveralchallengestoexpansionvis-à-visSriLanka.In 2012 the duty structure on certain vegetables such as onions was changed from custom duties to a special commodity levy that charged a fixed duty per kg. This had led to Pakistani exporters suddenly losing much of the benefit of the FTA concessions, and while the structure

67
An Assessment of the Pakistan-Sri Lanka Free Trade Agreem
ent
reverted to custom duty on certain key exports, exporters have encountered similar difficulties since then. There were complaints that duties were increased by Sri Lankan authorities without prior notice, leading to the disruption of transactions already underway. It was also pointed out that there was misconduct by traders from both countries and that greater attention was requiredbygovernmentbodiestocurbsuchbehaviour.Itwasclaimedthatinstanceswhereintraders perpetrate fraud knowing that the resulting dispute may not be resolved at all are not uncommon. Therefore the need for arbitration bodies was also reiterated.
11.3 ARTICLES OF IRON AND STEEL (PIPES)
As already mentioned, the export of steel pipes has faltered in the face of a cess charged bytheSriLankangovernment.IILpipescommandsthehighestmarketshareofgalvanizedpipes in the Sri Lankan market and has made an official appeal to the Pakistani Ministry of Commerce,butnoprogresshasbeenmadeontheissuesofar.Thisissuerequiresurgentattention since it sets a troubling precedent for those doing business with Sri Lanka, given the fact that the export of a major product has been disrupted by this sudden change that is in opposition to the intentions of the FTA. Furthermore, there were attempts to establish a plant for the production of steel pipes in Sri Lanka but these too stalled.
12.0 RECOMMENDATIONS
The central impediment facing Pak-Sri Lanka trade relations seems to be a relatively low amount of interest by the wider business communities of both countries in trade with the other country, as well as a correspondingly modest investment by government bodies on either side in the development of trade. The relationships between the myriad challenges facing Pak-Sri Lanka trade are complex and interrelated, but the afore-mentioned lack of initiative seems to be the central problem. Related issues such as unilateral changes that conflict with FTA terms and a lack of arbitration bodies adversely impact existing trade and de-incentivise entry into trade, but the primary problem still seems to be the lack of serious intent to build strong ties to begin with. Moreover, the identification of concrete business opportunities and general potential for trade will mitigate the discouragement that results from ancillary problems such as the risk of unresolved trade disputes, since the potential gains will make doing trade worth it. A concerted effort to bring the business communities of either country into regular contact and enable the countries’ trade bodies to work in concert is therefore the likely antidote to the fledgling Pak-Sri Lanka trade relationship. Moreover, an effort to this end will likely be well-served by Pakistan and Sri Lanka’s strong political ties.
Table 32. Recommendations to improve Pakistan-Sri Lanka trade relations
RECOMMENDATIONS
1. Regular trade delegations and single country exhibitions to build ties between business communities
2. Increased involvement of stakeholders in drafting of FTA, item-by-item discussion
3. Discussions before undertaking changes that conflict with FTA terms
4. Reliable and expeditious mechanisms for the resolution of trade disputes
12.1 TRADE DELEGATIONS AND SINGLE COUNTRY EXHIBITIONS
This report has attempted to outline the significant potential for trade that exists between Pakistan and Sri Lanka. Efforts must be made to further explore opportunities for expanding trade between the two countries and give businessmen reasons to focus on Sri Lanka as a trading partner. Trade bodies and business promotion forums must play a central role in raising

68
An Assessment of the Pakistan-Sri Lanka Free Trade Agreem
ent
awareness about the scope of these opportunities. It was suggested by several businessmen andbureaucratsthatSriLanka,despiteitssmallsize,possessesgreatpotentialasatradingpartner and investment destination for Pakistan. This report suggests that much potential arises from both countries being healthy markets for the other’s products. In addition to this, Sri Lanka is currently in the process of rapid development and rebuilding following the conclusion of long-lasting political strife, and Pakistan can play a role in this growth. Sri Lanka has an FTA with India and will soon sign another with China, and therefore investment in Sri Lanka will allow Pakistani companies restriction-free access to these huge markets. With reference to the concern noted in the previous section, it should be kept in mind that while countries such as Malaysia and Indonesia do record greater world imports than Sri Lanka, Pakistan’s exports to Sri Lanka happen to be disproportionately high- in 2013 Pakistan’s exports to Malaysia and Indonesia were around USD 200 million and USD 144 million respectively, whereas exports to Sri Lanka were USD 316 million. In other words, Pakistan is currently a more significant trading partner for Sri Lanka than it is for either Malaysia or Indonesia.
Concerns about the lack of a back-and-forth between the two countries’ business communities arewell-foundedandneedtobeaddressed.Tothisendseveralbusinessmenemphasizedthe need for comprehensive single country exhibitions and regular trade delegations. Single country exhibitions should not be tokenistic and should involve the presence of major producers of relevant export items. Similarly, trade delegations must be composed of key businessmen who have been apprised of the kinds of opportunities available in the other country’s market. It was suggested that more could be done to facilitate Sri Lankan delegations to Pakistan by trade bodies, with particular attention paid to local security concerns that may discourage such visits. Without unhindered communication between Pakistan and Sri Lanka’s business communities trade will continue to stall, since while opportunities exist on paper, a channel for the exchange of ideas and proposals must be developed in order to translate said opportunities into trade figures.As already stated, this appears to be the primary hurdle to better Pak-Sri Lanka relations, since the FTA terms themselves are comprehensive and favourable and the problems that do arise during trade are surmountable. Delegations and single-country exhibitions will also help to raise awareness regarding the FTA in both countries.
12.2 INCREASED INVOLVEMENT OF STAKEHOLDERS IN FORMULATION OF FTA TERMS
Producers and exporters felt that the Pak-Sri Lanka FTA, much like other FTAs signed by Pakistan, did not sufficiently take into account their views and expertise during the drafting phase and suffered for it. However, it should be noted that most of their substantive criticism was directed not towards the terms of the FTA, but rather ancillary issues such as the need for more regular delegations and arbitration forums. Even so, increased participation of stakeholders during the drafting phase of future FTAs will serve to make FTAs more sensitive to Pakistan’s interests while also creating a more inclusive exchange between policy makers and businessmen. While the terms of the Pak-Sri Lanka FTA seems to be by and large in the interests of both sides, businessmen may still take issue on certain points that they feel they were unable to present a case for, and to avoid this a more inclusive drafting process may be in order.
12.3 DISCUSSION BEFORE CHANGES TO FTA TERMS
Both countries must work to make sure any changes made in tariff policy or any other FTA terms follow only after an agreement between Pakistan and Sri Lanka is reached. Sudden unilateral changes to tariff rates or regulations that conflict with the spirit of the FTA act as a disincentive to businessmen who are already reluctant to step into an underdeveloped market. Both governments must acknowledge the importance of the FTA and assure businessmen that the terms will be adhered to.Furthermore, once there are strong ties between the two

69
An Assessment of the Pakistan-Sri Lanka Free Trade Agreem
ent
countries’businesscommunities,stabilityvis-à-visthetermsofFTAwilllikelyfollowasPak-Sri Lanka trade becomes more and more important.
12.4 FORUMS FOR EFFICIENT RESOLUTION OF TRADE DISPUTES
Efficient forums for the arbitration of trade disputes are sorely needed, as reflected by the reiteration of this issue throughout our survey of businessmen. Pakistan-Sri Lanka trade relationscanbecategorizedasstillbeingnascent,andbusinessmenrequirefurtherincentivesto step into the market. If there are too many instances of unresolved trade disputes many businessmen will simply choose to concentrate elsewhere.
An Assessment of the Pakistan-Sri Lanka Free Trade Agreem
ent
Annexures

71
An Assessment of the Pakistan-Sri Lanka Free Trade Agreem
ent
Annexure A: List of most exportable product lines
Table 1 lists the 275 Pakistani export items to Sri Lanka at the 6 digit HS code with a trade potential greater than or equal to USD 1 million. Items with favourable CAGR metrics are highlighted in blue.
Tab
le T
able
31.
Sri
Lan
kan
exp
ort
item
s o
n no
co
nces
sio
n lis
t w
ith a
n
R
CA
ad
v. o
ver
Pak
ista
n
Fig
ures
in U
SD
Mill
ions
S
RI L
AN
KA
RC
A A
DV
AN
TAG
E IT
EM
S W
ITH
NO
CO
NC
ES
SIO
N
HS
Co
de
Pro
duc
t La
bel
Pak
201
3 E
xpo
rt
SL
2013
W
orl
d
Imp
ort
Pak
201
3 W
orl
d
Exp
ort
Trad
e P
ote
ntia
lP
ak t
ariff
Pak
-SL
CA
GR
SL
Imp
ort
CA
GR
Pak
E
xpo
rt
CA
GR
Ind
ia
Tari
ffP
ak T
ariff
A
dv.
2523
29P
ortla
nd c
emen
t nes
44.4
431
2.28
506.
6626
7.84
043
.5%
27.8
%37
.6%
00
1701
99R
efin
ed s
ugar
, in
solid
form
, nes
34.3
925
7.24
487.
7822
2.85
7.5
_9.
5%48
.0%
14.9
7.4
3004
90M
edic
amen
ts n
es, i
n do
sage
9.41
73.4
827
9.61
64.0
70
12.4
%14
.2%
9.1%
00
7308
90Structures&partsofstructures,i/s(exprefab
bldg
s of
hea
dg n
o.94
06)
0.00
46.5
650
.11
46.5
60
0.0%
9.2%
27.6
%1.
31.
3
8517
12Te
leph
ones
for
cellu
lar
netw
orks
mob
ile
tele
phon
es o
r fo
r ot
her
wire
le0.
0044
.38
106.
2544
.38
00.
0%7.
1%-1
.2%
00
9018
90In
stru
men
ts a
nd a
pplia
nces
use
d in
med
ical
or
vete
rinar
y sc
ienc
es, n
es0.
2334
.90
296.
8134
.66
01.
3%5.
6%7.
9%0
0
5208
39Wovenfabricsofcotton,>/=85%,notmore
than200g/m2,dyed,nes
3.40
46.2
638
.00
34.6
00
8.7%
21.2
%6.
7%0
0
8701
90W
heel
ed tr
acto
rs n
es0.
7628
.37
33.9
527
.61
02.
9%7.
2%17
.9%
00
8414
51Fa
ns: t
able
,roo
f etc
w a
sel
f-con
t ele
c m
tr o
f an
outp
ut n
t exc
dg 1
25W
0.08
17.9
836
.16
17.8
90
25.2
%13
.6%
12.5
%0
0
2106
90Fo
od p
repa
ratio
ns n
es0.
0128
.56
17.4
717
.46
13.5
-17.
3%12
.2%
7.0%
13.4
-0.1
6203
42Mens/boystrousersandshorts,ofcotton,not
knitt
ed0.
0316
.04
653.
1216
.01
09.
3%21
.6%
8.3%
00
5209
42Denimfabricsofcotton,>/=85%,morethan
200g/m2
23.4
638
.80
495.
9415
.34
073
.8%
3.1%
28.1
%0
0
8507
10Le
ad-a
cid
elec
tric
acc
umul
ator
s of
a k
ind
usd
f st
artg
pis
ton
engi
nes
0.00
15.3
220
.32
15.3
230
0.0%
14.4
%51
.3%
300
5209
39Wovenfabricsofcotton,>/=85%,morethan
200g/m2,dyed,nes
1.25
127.
0416
.48
15.2
30
63.4
%0.
9%41
.0%
00
5208
59Wovenfabricsofcotton,>/=85%,notmore
than200g/m2,printed,nes
0.24
38.9
314
.54
14.3
00
-14.
6%25
.7%
-15.
8%0
0
5211
42Denimfabricsofcotton,<85%mixedwith
m-mfib,morethan200g/m2
1.61
15.7
551
.54
14.1
40
20.3
%23
.1%
5.0%
00
2401
10To
bacc
o, u
nman
ufac
ture
d, n
ot s
tem
med
or
strip
ped
0.00
56.2
013
.11
13.1
175
0.0%
5.1%
41.9
%75
0
3903
19P
olys
tyre
ne n
es0.
1513
.20
53.6
813
.05
0-2
43.0
%9.
3%23
.8%
00

72
An Assessment of the Pakistan-Sri Lanka Free Trade Agreem
ent
SR
I LA
NK
A R
CA
AD
VA
NTA
GE
ITE
MS
WIT
H N
O C
ON
CE
SS
ION
HS
Co
de
Pro
duc
t La
bel
Pak
201
3 E
xpo
rt
SL
2013
W
orl
d
Imp
ort
Pak
201
3 W
orl
d
Exp
ort
Trad
e P
ote
ntia
lP
ak t
ariff
Pak
-SL
CA
GR
SL
Imp
ort
CA
GR
Pak
E
xpo
rt
CA
GR
Ind
ia
Tari
ffP
ak T
ariff
A
dv.
5205
11Cottonyarn,>/=85%,single,uncom
bd,>/=714.29dtex,ntputup
0.55
13.5
615
5.45
13.0
10
18.2
%-8
.9%
6.5%
00
3907
60P
olye
thyl
ene
tere
phth
alat
e1.
2513
.25
204.
5512
.00
036
.0%
22.2
%11
.7%
00
3907
60P
olye
thyl
ene
tere
phth
alat
e0.
0013
.25
204.
5512
.00
036
.0%
22.2
%11
.7%
00
6204
69Womens/girlstrousers&shorts,ofothertextile
mat
eria
ls,n
ot k
nitte
d0.
0011
.84
63.3
111
.84
00.
0%27
.0%
70.1
%0
0
8415
10A
ir co
nditi
onin
g m
achi
nes
win
dow
or
wal
l ty
pes,
sel
f-con
tain
ed0.
0021
.23
11.4
611
.46
31.2
0.0%
765.
0%21
.5%
17-1
4.2
5208
29Wovenfabricsofcotton,>/=85%,ntmorethan
200g/m2,bleached,nes
0.57
11.8
623
.27
11.3
00
-17.
7%13
.4%
-8.1
%0
0
5205
22Cottonyarn,>/=85%,single,combed,714.29
>dtex>/=232.56,notputup
2.14
13.2
814
1.70
11.1
50
-2.4
%24
.4%
-4.3
%0
0
8418
21R
efrig
erat
ors,
hou
seho
ld ty
pe, c
ompr
essi
on-
type
0.00
13.5
610
.78
10.7
80
-54.
4%-9
.0%
57.1
%0
0
8708
99M
otor
veh
icle
par
ts n
es0.
2111
.24
10.9
210
.71
14-3
.8%
1.6%
-0.6
%14
0
2520
10G
ypsu
m; a
nhyd
rite
0.06
10.1
514
.98
10.0
90
24.1
%23
.2%
120.
8%0
0
2301
20Flour,meal&pelletoffish,crust,mol/othaqua
inve
rt,u
nfit
hum
an c
ons
0.11
9.75
16.9
89.
640
-9.7
%5.
4%16
1.2%
00
3208
90P
aint
s &
var
ni b
ased
on
poly
mer
s di
ssol
v in
a
nonaqueoussolvnes
0.00
12.1
99.
439.
4320
0.0%
15.2
%73
.3%
200
5209
29Wovenfabricsofcotton,>/=85%,morethan
200g/m2,bleached,nes
1.59
20.6
210
.71
9.12
013
.2%
1.3%
0.4%
00
2515
12M
arbl
e &
trav
ertin
e,m
erel
y cu
t,by
saw
ing
or
othe
rwis
e in
to b
lock
s et
c0.
009.
0650
.26
9.06
00.
0%11
.1%
32.7
%0
0
2309
90A
nim
al fe
ed p
repa
ratio
ns n
es0.
0422
.71
8.80
8.76
0_*
15.9
%58
.7%
00
6203
49Mens/boystrousersandshorts,ofothertextile
mat
eria
ls, n
ot k
nitte
d0.
048.
6611
5.33
8.62
022
.3%
17.5
%50
.5%
00
0904
20Fr
uits
of t
he g
enus
Cap
sicu
m o
r of
the
genu
s P
imen
ta :
Drie
d, n
eith
er c
rush
ed n
or g
roun
d0.
0049
.09
6.36
8.61
00.
0%0.
0%2.
5%0
0
6405
90Fo
otw
ear,
nes
0.00
10.4
18.
598.
597.
20.
0%21
.4%
-1.9
%7.
20
3004
20A
ntib
iotic
s ne
s, in
dos
age
0.78
9.21
13.1
68.
430
12.5
%16
.5%
28.9
%0
0
7113
19Articlesofjewellry&pttherofof/oprecmetw/n
platd/cladwprecmet
0.13
8.18
400.
808.
050
_25
.3%
36.5
%0
0

73
An Assessment of the Pakistan-Sri Lanka Free Trade Agreem
ent7113
19Articlesofjewellry&pttherofof/oprecmetw/n
platd/cladwprecmet
0.13
8.18
400.
808.
050
69.7
%25
.3%
36.5
%0
0
5209
59Wovenfabricsofcotton,>/=85%,morethan
200g/m2,printed,nes
0.37
9.66
8.23
7.86
028
.7%
-8.2
%42
.2%
00
1516
20Vegfats&oils&fractionshydrogenatd,inter/re-
esterifid,etc,ref'd/not
0.00
7.73
150.
557.
730
0.0%
5.2%
12.6
%37
.837
.8
7005
29Fl
oat g
lass
etc
in s
heet
s, n
on-w
ired
nes
0.29
10.9
87.
987.
690
38.6
%13
.6%
48.9
%0
0
0402
21M
ilk a
nd c
ream
pow
der
unsw
eete
ned
exce
edin
g 1.
5% fa
t0.
0024
6.77
7.65
7.65
300.
0%13
.1%
35.3
%30
0
5807
10La
bels
, bad
ges
and
sim
ilar
wov
en a
rtic
les
of
text
ile m
ater
ials
0.19
12.6
37.
677.
480
53.4
%-4
.6%
11.1
%0
0
7210
49Flatrolledprod,i/nas,platedorcoatedwith
zinc,>/=600mmwide,nes
0.02
17.8
57.
447.
4215
_*7.
0%62
.5%
150
3923
21S
acks
and
bag
s (in
clud
ing
cone
s) o
f pol
ymer
s of
eth
ylen
e0.
007.
1918
.40
7.19
21.7
-25.
0%3.
4%39
.9%
21.7
0
3926
90A
rtic
les
of p
last
ics
or o
f oth
er m
ater
ials
of N
os
39.0
1 to
39.
14 n
es0.
0031
.88
7.18
7.18
0-4
2.3%
5.7%
-7.2
%0
0
7113
19Articlesofjewellry&pttherofof/oprecmetw/n
platd/cladwprecmet
0.13
8.18
400.
808.
050
69.7
%25
.3%
36.5
%0
0
5209
59Wovenfabricsofcotton,>/=85%,morethan
200g/m2,printed,nes
0.37
9.66
8.23
7.86
028
.7%
-8.2
%42
.2%
00
1516
20Vegfats&oils&fractionshydrogenatd,inter/re-
esterifid,etc,ref'd/not
0.00
7.73
150.
557.
730
0.0%
5.2%
12.6
%37
.837
.8
7005
29Fl
oat g
lass
etc
in s
heet
s, n
on-w
ired
nes
0.29
10.9
87.
987.
690
38.6
%13
.6%
48.9
%0
0
0402
21M
ilk a
nd c
ream
pow
der
unsw
eete
ned
exce
edin
g 1.
5% fa
t0.
0024
6.77
7.65
7.65
300.
0%13
.1%
35.3
%30
0
5807
10La
bels
, bad
ges
and
sim
ilar
wov
en a
rtic
les
of
text
ile m
ater
ials
0.19
12.6
37.
677.
480
53.4
%-4
.6%
11.1
%0
0
7210
49Flatrolledprod,i/nas,platedorcoatedwith
zinc,>/=600mmwide,nes
0.02
17.8
57.
447.
4215
_*7.
0%62
.5%
150
3923
21S
acks
and
bag
s (in
clud
ing
cone
s) o
f pol
ymer
s of
eth
ylen
e0.
007.
1918
.40
7.19
21.7
-25.
0%3.
4%39
.9%
21.7
0
3926
90A
rtic
les
of p
last
ics
or o
f oth
er m
ater
ials
of N
os
39.0
1 to
39.
14 n
es0.
0031
.88
7.18
7.18
0-4
2.3%
5.7%
-7.2
%0
0
2836
20D
isod
ium
car
bona
te0.
007.
167.
287.
160
65.6
%22
.0%
130.
3%0
0
1006
30R
ice,
sem
i-mill
ed o
r w
holly
mill
ed, w
heth
er o
r notpolishedorglazed
10.3
917
.53
1,79
0.21
7.14
29.4
7.9%
-12.
7%11
.6%
29.4
0

74
An Assessment of the Pakistan-Sri Lanka Free Trade Agreem
ent
SR
I LA
NK
A R
CA
AD
VA
NTA
GE
ITE
MS
WIT
H N
O C
ON
CE
SS
ION
HS
Co
de
Pro
duc
t La
bel
Pak
201
3 E
xpo
rt
SL
2013
W
orl
d
Imp
ort
Pak
201
3 W
orl
d
Exp
ort
Trad
e P
ote
ntia
lP
ak t
ariff
Pak
-SL
CA
GR
SL
Imp
ort
CA
GR
Pak
E
xpo
rt
CA
GR
Ind
ia
Tari
ffP
ak T
ariff
A
dv.
5205
21Cottonyarn,>/=85%,single,
combed,>/=714.29,notputup
0.07
39.9
87.
127.
050
-20.
3%5.
9%-1
4.3%
00
5205
12Cottonyarn,>/=85%,single,uncombed,714.29
>dtex>/=232.56,notputup
1.14
8.18
1,43
6.43
7.04
0-1
5.9%
3.5%
10.7
%0
0
3920
20Fi
lm a
nd s
heet
etc
, non
-cel
lula
r et
c, o
f po
lym
ers
of p
ropy
lene
0.69
21.9
87.
486.
8015
1.5%
12.2
%19
.1%
150
5205
23Cottonyarn,>/=85%,single,combed,232.56
>dtex>/=192.31,notputup
0.84
7.63
48.5
06.
790
9.4%
38.5
%6.
1%0
0
6910
90C
eram
ic s
inks
, was
h ba
sins
etc
& s
imila
r sa
nita
ry fi
xtur
es n
es0.
006.
506.
646.
5022
.50.
0%7.
7%8.
5%21
.4-1
.1
0902
40B
lack
tea
(fer
men
ted)
& p
artly
ferm
ente
d te
a in
pa
ckag
es e
xcee
dg 3
kg
0.00
6.36
10.6
96.
360
0.0%
-7.5
%49
.9%
3030
5407
10W
oven
fab
of h
igh
tena
city
fi y
arns
of n
ylon
oth
polyamides/polyesters
0.00
6.55
6.33
6.33
0_*
-6.7
%31
.0%
00
3824
90Chemical/alliedindustrypreparations/prods
nes
0.14
21.6
97.
216.
300
-5.1
%14
.5%
14.4
%0
0
8517
70P
arts
of t
elep
hone
set
s, te
leph
ones
for
cellu
lar
netw
orks
or
for
othe
r0.
0020
.57
6.09
6.09
00.
0%-1
9.2%
-13.
8%0
0
2207
10U
nden
atur
d et
hyl a
lcoh
ol o
f an
alco
hol s
trgt
h byvolof80%vol/higher
2.76
8.74
274.
075.
9721
9.6
72.8
%2.
3%42
.7%
219.
60
5208
32Plainweavecottonfabric,>/=85%,>100g/m=
to200g/m=,dyed
0.80
6.70
19.1
45.
910
24.5
%15
.6%
65.8
%0
0
3808
91In
sect
icid
es0.
0519
.20
5.80
5.75
10_
18.2
%87
.3%
100
0713
10P
eas
drie
d, s
helle
d, w
heth
er o
r no
t ski
nned
or
spl
it0.
0018
.43
5.71
5.71
300.
0%14
.8%
118.
6%30
0
5210
39Wovenfabricsofcotton,<85%mixdwithm-m
fib,<=200g/m2,dyed,nes
0.02
6.92
5.71
5.68
010
.2%
-4.7
%23
.0%
00
3304
99B
eaut
y or
mak
e-up
pre
para
tions
nes
; su
nscr
een
or s
un ta
n pr
epar
atio
ns0.
026.
465.
705.
680
9.2%
9.6%
21.4
%0
0
3303
00P
erfu
mes
and
toile
t wat
ers
0.00
8.96
5.61
5.61
00.
0%22
.8%
22.4
%0
0
1211
90P
lant
s &
pts
of p
lant
s(in
cl s
ed&
fruit)
usd
in
phar
m,p
erf,i
nsec
t etc
nes
0.71
6.29
17.9
75.
590
20.7
%18
.8%
26.6
%0
0
5210
19Wovenfabofcotton,<85%mixdwithm-m
fib,<=200g/m2,unbl,nes
0.09
5.61
13.4
95.
520
10.2
%-4
.9%
25.3
%0
0

75
An Assessment of the Pakistan-Sri Lanka Free Trade Agreem
ent3907
99P
olye
ster
s ne
s, in
prim
ary
form
s0.
005.
4515
.41
5.45
00.
0%9.
8%4.
7%0
0
8431
43P
arts
of b
orin
g or
sin
king
mac
hine
ry, w
heth
er
or n
ot s
elf-p
rope
lled
0.00
7.14
5.43
5.43
00.
0%60
.0%
-10.
1%0
0
8431
43P
arts
of b
orin
g or
sin
king
mac
hine
ry, w
heth
er
or n
ot s
elf-p
rope
lled
0.00
7.14
5.43
5.43
00.
0%60
.0%
-10.
1%0
0
1901
10Prepofcereals,flour,starch/milkfinfantuse,put
up f
reta
il sa
le0.
0011
.24
5.36
5.36
00.
0%12
.3%
55.1
%5
5
5209
12Twillweavecottonfabric,>/=85%,morethan
200g/m2,unbleached
2.30
7.17
214.
524.
870
67.0
%11
.9%
82.4
%0
0
8711
20M
otor
cycl
es w
ith r
ecip
roca
tg p
isto
n en
gine
di
spla
cg >
50
cc to
250
cc
0.00
111.
824.
824.
820
_6.
0%8.
1%15
15
1108
12Maize(corn)starch
0.00
4.68
12.1
54.
680
*80.58%
17.5
%27
.6%
00
8705
90S
peci
al p
urpo
se m
otor
veh
icle
s ne
s0.
007.
084.
604.
600
0.0%
19.7
%23
.9%
00
1701
13R
aw c
ane
suga
r, (s
ee s
ubhe
adin
g no
te 2
.)0.
0014
.42
4.59
4.59
00.
0%_
_0
0
4411
14M
ediu
m d
ensi
ty fi
breb
oard
MD
F of
woo
d, o
f a
thic
knes
s >
9 m
m0.
005.
954.
564.
560
0.0%
17.1
%53
.0%
00
4811
59P
aper
and
pap
erbo
ard,
sur
face
-col
oure
d,
surfa
ce-d
ecor
ated
or
prin
ted,
0.00
4.48
38.5
54.
4822
.50.
0%28
.1%
80.2
%22
.50
8502
39E
lect
ric g
ener
atin
g se
ts0.
0011
.81
4.48
4.48
00.
0%23
.1%
2.9%
00
8212
10Razorsincludingsafetyrazorsandopenblade
type
0.00
4.43
7.07
4.43
18.1
0.0%
8.7%
21.1
%28
.110
1404
90Ve
geta
ble
prod
ucts
nes
0.01
7.12
4.36
4.35
020
.1%
9.5%
53.2
%0
0
7326
90A
rtic
les,
iron
or
stee
l, ne
s0.
0028
.04
4.35
4.35
0-7
.4%
16.1
%17
.0%
00
5513
21P
lain
wea
ve p
olye
ster
sta
ple
fib
fab,<85%,mixdw/cotton,<=170g/m2,dyd
0.07
4.39
54.5
84.
320
25.9
%-1
.9%
29.6
%0
0
3809
91Fi
nish
g ag
ents
,dye
car
riers
&ot
h pr
ep,n
es,fo
r us
e in
the
text
ile in
dust
0.00
22.9
04.
284.
280
*-2.75%
11.5
%12
.4%
00
8501
40A
C m
otor
s, s
ingl
e-ph
ase,
nes
0.00
4.26
4.44
4.26
00.
0%13
.0%
73.0
%0
0
5512
11Wovenfabrics,containing>/=85%ofpolyester
stap
le fi
bres
, unb
l or
bl0.
006.
714.
234.
2327
0.0%
-10.
8%34
.1%
270
8544
49E
lect
ric c
ondu
ctor
s, fo
r a
volta
ge n
ot
exce
edin
g 80
V, n
es0.
0326
.50
4.25
4.22
062
.6%
19.1
%37
.9%
00
5509
53Ya
rn o
f pol
yest
er s
tapl
e fib
res
mix
ed w
ith
cotto
n, n
ot p
ut u
p, n
es0.
004.
2018
.17
4.20
0*25.74%
18.8
%14
.0%
00
5209
32Twillweavecottonfabrics,>/=85%,morethan
200g/m2,dyed
25.2
029
.38
187.
434.
170
109.
8%3.
2%38
.8%
00
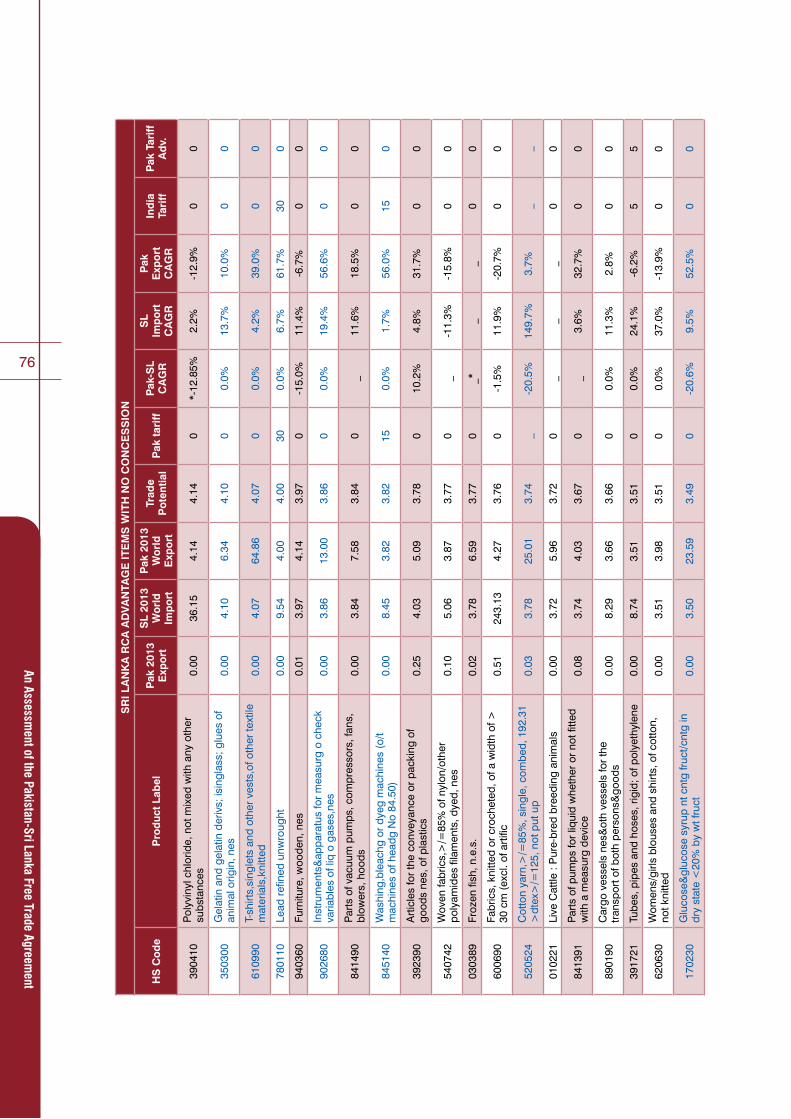
76
An Assessment of the Pakistan-Sri Lanka Free Trade Agreem
ent
SR
I LA
NK
A R
CA
AD
VA
NTA
GE
ITE
MS
WIT
H N
O C
ON
CE
SS
ION
HS
Co
de
Pro
duc
t La
bel
Pak
201
3 E
xpo
rt
SL
2013
W
orl
d
Imp
ort
Pak
201
3 W
orl
d
Exp
ort
Trad
e P
ote
ntia
lP
ak t
ariff
Pak
-SL
CA
GR
SL
Imp
ort
CA
GR
Pak
E
xpo
rt
CA
GR
Ind
ia
Tari
ffP
ak T
ariff
A
dv.
3904
10P
olyv
inyl
chl
orid
e, n
ot m
ixed
with
any
oth
er
subs
tanc
es0.
0036
.15
4.14
4.14
0*-12.85%
2.2%
-12.
9%0
0
3503
00G
elat
in a
nd g
elat
in d
eriv
s; is
ingl
ass;
glu
es o
f an
imal
orig
in, n
es0.
004.
106.
344.
100
0.0%
13.7
%10
.0%
00
6109
90T-
shirt
s,si
ngle
ts a
nd o
ther
ves
ts,o
f oth
er te
xtile
m
ater
ials
,kni
tted
0.00
4.07
64.8
64.
070
0.0%
4.2%
39.0
%0
0
7801
10Le
ad r
efin
ed u
nwro
ught
0.00
9.54
4.00
4.00
300.
0%6.
7%61
.7%
300
9403
60Fu
rnitu
re, w
oode
n, n
es0.
013.
974.
143.
970
-15.
0%11
.4%
-6.7
%0
0
9026
80In
stru
men
ts&
appa
ratu
s fo
r m
easu
rg o
che
ck
variablesofliqogases,nes
0.00
3.86
13.0
03.
860
0.0%
19.4
%56
.6%
00
8414
90P
arts
of v
acuu
m p
umps
, com
pres
sors
, fan
s,
blow
ers,
hoo
ds0.
003.
847.
583.
840
_11
.6%
18.5
%0
0
8451
40Washing,bleachgordyegmachines(o/t
mac
hine
s of
hea
dg N
o 84
.50)
0.00
8.45
3.82
3.82
150.
0%1.
7%56
.0%
150
3923
90A
rtic
les
for
the
conv
eyan
ce o
r pa
ckin
g of
go
ods
nes,
of p
last
ics
0.25
4.03
5.09
3.78
010
.2%
4.8%
31.7
%0
0
5407
42Wovenfabrics,>/=85%ofnylon/other
poly
amid
es fi
lam
ents
, dye
d, n
es0.
105.
063.
873.
770
_-1
1.3%
-15.
8%0
0
0303
89Frozenfish,n.e.s.
0.02
3.78
6.59
3.77
0_*
__
00
6006
90Fa
bric
s, k
nitte
d or
cro
chet
ed, o
f a w
idth
of >
30
cm
(ex
cl. o
f art
ific
0.51
243.
134.
273.
760
-1.5
%11
.9%
-20.
7%0
0
5205
24Cottonyarn,>/=85%,single,combed,192.31
>dtex>/=125,notputup
0.03
3.78
25.0
13.
74_
-20.
5%14
9.7%
3.7%
__
0102
21Li
ve C
attle
: P
ure-
bred
bre
edin
g an
imal
s0.
003.
725.
963.
720
__
_0
0
8413
91Partsofpumpsforliquidwhetherornotfitted
with
a m
easu
rg d
evic
e0.
083.
744.
033.
670
_3.
6%32
.7%
00
8901
90C
argo
ves
sels
nes
&ot
h ve
ssel
s fo
r th
e tr
ansp
ort o
f bot
h pe
rson
s&go
ods
0.00
8.29
3.66
3.66
00.
0%11
.3%
2.8%
00
3917
21Tu
bes,
pip
es a
nd h
oses
, rig
id; o
f pol
yeth
ylen
e0.
008.
743.
513.
510
0.0%
24.1
%-6
.2%
55
6206
30Womens/girlsblousesandshirts,ofcotton,
not k
nitte
d0.
003.
513.
983.
510
0.0%
37.0
%-1
3.9%
00
1702
30Glucose&glucosesyrupntcntgfruct/cntgin
drystate<20%bywtfruct
0.00
3.50
23.5
93.
490
-20.
6%9.
5%52
.5%
00
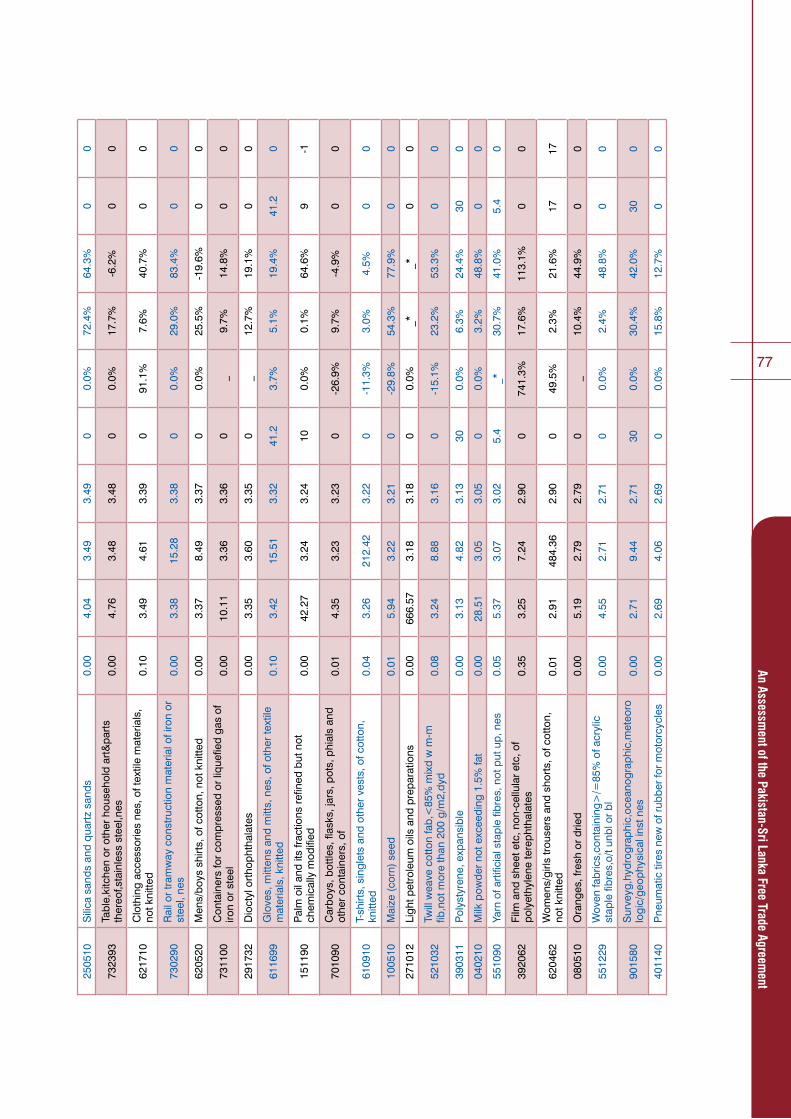
77
An Assessment of the Pakistan-Sri Lanka Free Trade Agreem
ent2505
10Silicasandsandquartzsands
0.00
4.04
3.49
3.49
00.
0%72
.4%
64.3
%0
0
7323
93Ta
ble,
kitc
hen
or o
ther
hou
seho
ld a
rt&
part
s th
ereo
f,sta
inle
ss s
teel
,nes
0.00
4.76
3.48
3.48
00.
0%17
.7%
-6.2
%0
0
6217
10C
loth
ing
acce
ssor
ies
nes,
of t
extil
e m
ater
ials
, no
t kni
tted
0.10
3.49
4.61
3.39
091
.1%
7.6%
40.7
%0
0
7302
90R
ail o
r tr
amw
ay c
onst
ruct
ion
mat
eria
l of i
ron
or
stee
l, ne
s0.
003.
3815
.28
3.38
00.
0%29
.0%
83.4
%0
0
6205
20Mens/boysshirts,ofcotton,notknitted
0.00
3.37
8.49
3.37
00.
0%25
.5%
-19.
6%0
0
7311
00Containersforcompressedorliquefiedgasof
iron
or s
teel
0.00
10.1
13.
363.
360
_9.
7%14
.8%
00
2917
32D
ioct
yl o
rtho
phth
alat
es0.
003.
353.
603.
350
_12
.7%
19.1
%0
0
6116
99G
love
s, m
itten
s an
d m
itts,
nes
, of o
ther
text
ile
mat
eria
ls, k
nitte
d0.
103.
4215
.51
3.32
41.2
3.7%
5.1%
19.4
%41
.20
1511
90P
alm
oil
and
its fr
actio
ns r
efin
ed b
ut n
ot
chem
ical
ly m
odifi
ed0.
0042
.27
3.24
3.24
100.
0%0.
1%64
.6%
9-1
7010
90C
arbo
ys, b
ottle
s, fl
asks
, jar
s, p
ots,
phi
als
and
othe
r co
ntai
ners
, of
0.01
4.35
3.23
3.23
0-2
6.9%
9.7%
-4.9
%0
0
6109
10T-
shirt
s, s
ingl
ets
and
othe
r ve
sts,
of c
otto
n,
knitt
ed0.
043.
2621
2.42
3.22
0-1
1.3%
3.0%
4.5%
00
1005
10Maize(corn)seed
0.01
5.94
3.22
3.21
0-2
9.8%
54.3
%77
.9%
00
2710
12Li
ght p
etro
leum
oils
and
pre
para
tions
0.00
666.
573.
183.
180
0.0%
_*_*
00
5210
32Twillweavecottonfab,<85%mixdwm-m
fib,notmorethan200g/m2,dyd
0.08
3.24
8.88
3.16
0-1
5.1%
23.2
%53
.3%
00
3903
11P
olys
tyre
ne, e
xpan
sibl
e0.
003.
134.
823.
1330
0.0%
6.3%
24.4
%30
0
0402
10M
ilk p
owde
r no
t exc
eedi
ng 1
.5%
fat
0.00
28.5
13.
053.
050
0.0%
3.2%
48.8
%0
0
5510
90Ya
rn o
f art
ifici
al s
tapl
e fib
res,
not
put
up,
nes
0.05
5.37
3.07
3.02
5.4
_*30
.7%
41.0
%5.
40
3920
62Fi
lm a
nd s
heet
etc
, non
-cel
lula
r et
c, o
f po
lyet
hyle
ne te
reph
thal
ates
0.35
3.25
7.24
2.90
074
1.3%
17.6
%11
3.1%
00
6204
62Womens/girlstrousersandshorts,ofcotton,
not k
nitte
d0.
012.
9148
4.36
2.90
049
.5%
2.3%
21.6
%17
17
0805
10O
rang
es, f
resh
or
drie
d0.
005.
192.
792.
790
_10
.4%
44.9
%0
0
5512
29Wovenfabrics,containing>/=85%ofacrylic
staplefibres,o/tunblorbl
0.00
4.55
2.71
2.71
00.
0%2.
4%48
.8%
00
9015
80S
urve
yg,h
ydro
grap
hic,
ocea
nogr
aphi
c,m
eteo
rologic/geophysicalinstnes
0.00
2.71
9.44
2.71
300.
0%30
.4%
42.0
%30
0
4011
40P
neum
atic
tire
s ne
w o
f rub
ber
for
mot
orcy
cles
0.00
2.69
4.06
2.69
00.
0%15
.8%
12.7
%0
0

78
An Assessment of the Pakistan-Sri Lanka Free Trade Agreem
ent
SR
I LA
NK
A R
CA
AD
VA
NTA
GE
ITE
MS
WIT
H N
O C
ON
CE
SS
ION
HS
Co
de
Pro
duc
t La
bel
Pak
201
3 E
xpo
rt
SL
2013
W
orl
d
Imp
ort
Pak
201
3 W
orl
d
Exp
ort
Trad
e P
ote
ntia
lP
ak t
ariff
Pak
-SL
CA
GR
SL
Imp
ort
CA
GR
Pak
E
xpo
rt
CA
GR
Ind
ia
Tari
ffP
ak T
ariff
A
dv.
3906
90A
cryl
ic p
olym
ers
nes,
in p
rimar
y fo
rms
0.00
9.82
2.68
2.68
0*-29.29%
16.5
%32
.8%
00
5407
52Wovenfabrics,>/=85%oftexturedpolyester
filam
ents
, dye
d, n
es0.
002.
663.
772.
660
-33.
1%18
.0%
37.8
%0
0
6206
90Womens/girlsblousesandshirts,ofother
text
ile m
ater
ials
,not
kni
tted
0.00
2.64
3.58
2.64
00.
0%9.
5%25
.1%
1212
1901
90Maltextract&foodprepofCh19<50%
cocoa&hd0401to0404<10%cocoa
0.00
36.9
92.
642.
6415
_11
.7%
30.2
%15
0
4004
00W
aste
,par
ing&
scra
p (e
xc h
ard
rubber)&powder/granulesobtaindtherefrom
0.00
2.61
5.12
2.61
00.
0%13
.6%
35.8
%0
0
8479
82Machfmixing/kneading/crushing/grindgetc
nes
havg
indi
vid
func
tion
0.01
4.63
2.61
2.59
0_
22.6
%-2
.0%
00
6005
32D
yed
war
p kn
it fa
bric
s of
syn
thet
ic fi
bres
"inc
l. th
ose
mad
e on
gal
loo
0.00
2.60
2.58
2.58
0-1
9.1%
1.5%
-17.
3%0
0
1302
32M
ucila
ges
& th
icke
ners
der
ived
from
locu
st
bean
s &
see
ds o
r gu
ar s
eeds
0.06
2.59
119.
232.
5314
.2-1
.6%
42.6
%82
.0%
14.2
0
8708
29P
arts
and
acc
esso
ries
of b
odie
s ne
s fo
r m
otor
ve
hicl
es0.
076.
242.
582.
510
37.4
%14
.3%
25.1
%0
0
8517
69A
ppar
atus
for
the
tran
smis
sion
or
rece
ptio
n of
vo
ice,
imag
es o
r ot
her
0.14
2.60
3.60
2.46
0_*
2.7%
-3.4
%0
0
6116
92G
love
s, m
itten
s an
d m
itts,
nes
, of c
otto
n,
knitt
ed1.
664.
0751
.49
2.41
012
.0%
-4.2
%7.
9%0
0
0804
10D
ates
, fre
sh o
r dr
ied
0.04
2.45
85.7
22.
416
3.8%
7.7%
13.3
%27
21
5607
90Tw
ine,
cor
dage
, rop
es a
nd c
able
s, o
f oth
er
mat
eria
ls0.
002.
406.
222.
400
_9.
9%14
.6%
00
5209
11Plainweavecottonfabric,>/=85%,morethan
200g/m2,unbleached
13.3
715
.73
150.
462.
360
86.9
%-1
2.3%
92.2
%10
.810
.8
4112
00Le
athe
r fu
rthe
r pr
epar
ed a
fter
tann
ing
or
crus
ting
"incl
. par
chm
ent-d
r3.
215.
5653
.48
2.35
051
.8%
2.6%
10.4
%0
0
3924
90H
ouse
hold
and
toile
t art
icle
s ne
s, o
f pla
stic
s0.
002.
3529
.12
2.35
00.
0%9.
8%19
.5%
00
3916
90M
onof
ilam
ents
>1
mm
, pro
file
shap
es e
tc o
f pl
astic
s ne
s0.
002.
342.
702.
340
0.0%
12.2
%13
.8%
00
4901
99B
ooks
, bro
chur
es, l
eafle
ts a
nd s
imila
r pr
inte
d m
atte
r, ne
s0.
0510
.27
2.35
2.29
018
.2%
2.2%
1.2%
00

79
An Assessment of the Pakistan-Sri Lanka Free Trade Agreem
ent3924
10Ta
blew
are
and
kitc
henw
are
of p
last
ics
0.01
2.29
2.66
2.28
0_*
1.3%
-12.
6%0
0
5402
69Ya
rn o
f syn
thet
ic fi
lam
ents
, mul
tiple
, nes
, not
pu
t up
0.00
2.47
2.27
2.27
00.
0%-8
.2%
90.1
%_
#VA
LUE
!
1001
99W
heat
and
mes
lin (
excl
. see
d fo
r so
win
g, a
nd
duru
m w
heat
)2.
8624
1.14
5.13
2.27
0_
_*_
00
5210
29Wovenfabricsofcotton,<85%mixdwithm-m
fib,<=200g/m2,bl,nes
0.24
2.51
9.00
2.26
08.
2%-6
.1%
0.3%
00
8708
40Ta
nsm
issi
ons
for
mot
or v
ehic
les
0.00
2.24
6.21
2.24
0-2
7.7%
24.4
%16
3.9%
00
5205
14Cottonyarn,>/=85%,single,uncombed,192.31
>dtex>/=125,notputup
0.01
2.24
7.91
2.24
13.5
6.4%
69.9
%-1
.1%
13.5
0
0303
49Tunasnes,frozen,excludingheadingNo
03.0
4, li
vers
and
roe
s0.
006.
592.
232.
230
0.0%
12.7
%-2
5.7%
00
3917
22Tu
bes,
pip
es a
nd h
oses
, rig
id; o
f po
lypr
opyl
ene
0.00
2.23
11.7
72.
230
0.0%
4.7%
137.
0%0
0
7208
27H
ot r
oll s
teel
, coi
l, pi
ckle
d >
600m
m w
ide
<3mmthick
0.04
2.24
3.80
2.20
0_*
45.6
%10
0.8%
00
5208
19Wovenfabricsofcotton,>/=85%,notmore
than200g/m2,unbleached,nes
0.50
2.63
91.9
82.
130
-30.
7%-1
1.2%
-14.
9%0
0
5201
00C
otto
n, n
ot c
arde
d or
com
bed
0.02
2.15
217.
162.
130
_*7.
4%10
.8%
00
6211
49Womens/girlsgarmentsnes,ofothertextile
mat
eria
ls, n
ot k
nitte
d0.
002.
1312
.67
2.13
30_*
-6.2
%17
.1%
300
4819
10C
arto
ns, b
oxes
and
cas
es, o
f cor
ruga
ted
pape
r or
pap
erbo
ard
0.00
4.11
2.12
2.12
00.
0%9.
8%31
.0%
10.8
10.8
0303
29Salmonidae,nes,frozen,excludingheadingNo
03.0
4, li
vers
and
roe
s0.
002.
115.
912.
110
0.0%
22.0
%74
.7%
00
5208
33Twillweavecottonfabrics,>/=85%,notmore
than200g/m2,dyed
0.01
8.27
2.12
2.11
0-1
1.9%
39.5
%36
.2%
00
3204
16R
eact
ive
dyes
and
pre
para
tions
bas
ed th
ereo
n0.
009.
322.
082.
080
_*22
.8%
28.3
%0
0
8205
59To
ols
for
mas
ons,
wat
chm
aker
s, m
iner
s an
d ha
nd to
ols
nes
0.00
4.59
2.06
2.06
00.
0%23
.8%
23.7
%0
0
6006
21U
nble
ache
d or
ble
ache
d co
tton
fabr
ics,
kni
tted
or c
roch
eted
, of a
wid
t0.
4337
.54
2.48
2.05
046
.9%
-3.1
%35
.1%
00
8422
30Machffil/clos/seal/etc.btle/can/box/bag/ctnr
nes,
mac
h f a
erat
g be
v0.
0027
.89
2.02
2.02
00.
0%12
.7%
49.9
%0
0
5903
90Te
xtile
fabr
ics
impr
egna
ted,
ctd
, cov
, or
lam
inat
ed w
ith p
last
ics,
nes
0.03
14.6
12.
052.
020
44.8
%-7
.6%
13.6
%0
0

80
An Assessment of the Pakistan-Sri Lanka Free Trade Agreem
ent
SR
I LA
NK
A R
CA
AD
VA
NTA
GE
ITE
MS
WIT
H N
O C
ON
CE
SS
ION
HS
Co
de
Pro
duc
t La
bel
Pak
201
3 E
xpo
rt
SL
2013
W
orl
d
Imp
ort
Pak
201
3 W
orl
d
Exp
ort
Trad
e P
ote
ntia
lP
ak t
ariff
Pak
-SL
CA
GR
SL
Imp
ort
CA
GR
Pak
E
xpo
rt
CA
GR
Ind
ia
Tari
ffP
ak T
ariff
A
dv.
5208
31Plainweavecottonfabric,>/=85%,notmore
than100g/m2,dyed
1.56
3.57
54.1
02.
000
100.
4%-1
1.2%
36.1
%0
0
3305
90H
air
prep
arat
ions
, nes
0.00
3.73
1.98
1.98
0-1
8.4%
12.4
%9.
0%30
30
4819
20C
arto
ns,b
oxes
and
cas
es,fo
ldin
g,of
non
-co
rrug
ated
pap
er o
r pa
perb
oard
0.06
2.03
2.31
1.97
092
.0%
-0.9
%93
.7%
00
5209
51Plainweavecottonfabrics,>/=85%,morethan
200g/m2,printed
0.01
1.98
2.80
1.97
7.5
-25.
5%-5
.0%
-15.
3%7.
50
3920
10Fi
lm a
nd s
heet
etc
, non
-cel
lula
r et
c, o
f po
lym
ers
ofet
hyle
ne0.
007.
011.
941.
940
_15
.1%
3.2%
00
5205
34Cottonyarn,>/=85%,multi,uncombed,192.31
>dtex>/=125,ntputup,nes
0.40
2.32
14.3
81.
920
131.
4%14
3.9%
41.9
%0
0
8544
70O
ptic
al fi
bre
cabl
es, m
ade
up o
f ind
ivid
ually
sh
eath
ed fi
bres
0.00
11.3
61.
911.
9130
.60.
0%19
.5%
79.3
%30
.60
0402
29M
ilk a
nd c
ream
pow
der
swee
tene
d ex
ceed
ing
1.5%
fat
0.00
1.91
11.2
01.
9130
0.0%
-17.
0%35
.3%
300
4013
90In
ner
tube
s of
rub
ber
nes
0.00
3.74
1.89
1.89
0_
7.8%
31.0
%0
0
8502
11Generatgsets,diesel/semi-dieselengines,ofan
outp
ut n
ot e
xced
75
KVA
0.00
10.7
61.
891.
8930
_8.
5%40
.6%
300
3401
20S
oap
nes
0.00
2.51
1.86
1.86
00.
0%3.
0%31
.7%
00
8701
20R
oad
trac
tors
for
sem
i-tra
ilers
(tr
uck
trac
tors
)0.
003.
121.
861.
860
-30.
2%61
.8%
5.4%
00
3204
17S
ynth
etic
org
anic
pig
men
ts a
nd p
repa
ratio
ns
base
d th
ereo
n0.
009.
821.
851.
8530
0.0%
9.3%
13.4
%30
0
9609
10P
enci
ls a
nd c
rayo
ns, w
ith le
ads
enca
sed
in a
rig
id s
heat
h, n
es0.
003.
221.
841.
840
0.0%
27.3
%37
.0%
00
8411
99P
arts
of g
as tu
rbin
es n
es0.
0021
.18
1.84
1.84
00.
0%23
.8%
14.7
%0
0
8419
20Medical,surgicalorlaboratorysterilizers
0.00
2.29
1.83
1.83
0_*
15.6
%54
.2%
00
7404
00W
aste
and
scr
ap, c
oppe
r or
cop
per
allo
y0.
001.
8112
1.03
1.81
00.
0%-3
4.1%
44.5
%0
0
7209
16Coldrollediron/steel,coils>600mmx1-3mm
0.00
1.81
1.85
1.81
150.
0%5.
2%_
150
3005
90D
ress
ings
&si
mila
r ar
ticle
s,im
preg
or
coat
d or
pa
ckag
d fo
r m
d us
e,ne
s0.
312.
116.
051.
800
46.7
%10
.6%
22.0
%0
0
6815
99A
rtic
les
of s
tone
or o
f oth
er m
iner
al s
ubst
ance
s ne
s0.
001.
7910
.51
1.78
0-4
.4%
36.3
%-1
.8%
00
8905
10D
redg
ers
0.00
1.78
4.14
1.78
150.
0%52
.9%
-36.
4%15
0

81
An Assessment of the Pakistan-Sri Lanka Free Trade Agreem
ent8537
20B
oard
s,pa
nels
,incl
udg
num
eric
al c
ontr
ol
pane
ls,fo
r a
volta
ge >
1,0
00 V
0.00
14.9
41.
771.
7721
.70.
0%-1
.5%
129.
6%1.
4-2
0.3
3923
29S
acks
and
bag
s (in
clud
ing
cone
s) o
f pla
stic
s ne
s0.
004.
671.
771.
7710
.89.
1%11
.2%
-6.3
%10
.80
4113
10Le
athe
r fu
rthe
r pr
epar
ed a
fter
tann
ing
or
crus
ting
"incl
. par
chm
ent-d
r0.
342.
1015
8.95
1.76
011
.8%
54.4
%6.
0%0
0
5802
19Te
rry
tow
ellg
&si
mila
r w
oven
terr
y fa
b of
cotton,o/tunbl&o/tnarfab
0.45
2.17
4.38
1.72
033
.7%
17.0
%-0
.3%
00
8473
30P
arts
&ac
cess
orie
s of
aut
omat
ic d
ata
proc
essg
m
achi
nes&
units
ther
eof
0.00
17.2
31.
721.
720
0.0%
-7.4
%1.
4%0
0
4203
30B
elts
and
ban
dolie
rs o
f lea
ther
or
of
com
posi
tion
leat
her
0.03
1.74
6.01
1.72
032
.4%
14.3
%11
.8%
00
3901
30E
thyl
ene-
viny
l ace
tate
cop
olym
ers
0.00
2.61
1.70
1.70
0_
3.1%
63.0
%0
0
3402
11A
nion
ic s
urfa
ce-a
ctiv
e ag
ents
0.00
16.2
21.
701.
700
0.0%
24.3
%41
.0%
00
3919
90S
elf-a
dhes
ive
plat
es, s
heet
s, fi
lm e
tc, o
f pla
stic
ne
s0.
009.
391.
691.
690
0.0%
7.6%
22.0
%0
0
3402
20S
urfa
ce-a
ctiv
e pr
ep, w
ashi
ng &
cle
anin
g pr
ep
put u
p fo
r re
tail
sale
0.00
1.69
4.09
1.69
00.
0%4.
1%89
.5%
00
4421
90W
ood
artic
les
nes
0.00
1.65
1.96
1.65
2.5
-7.4
%17
.9%
-4.9
%2.
50
8212
20Safetyrazorblades,includingrazorblade
blan
ks in
str
ips
0.00
1.63
10.3
11.
630
0.0%
8.0%
12.5
%0
0
6108
29Womens/girlsbriefsandpanties,ofother
text
ile m
ater
ials
, kni
tted
0.00
2.11
1.62
1.62
00.
0%26
.9%
94.9
%7.
57.
5
8418
30Freezersofthechesttype,notexceeding800
l cap
acity
0.00
2.16
1.62
1.62
0_
1.5%
13.9
%0
0
4107
19Le
athe
r "in
cl. p
arch
men
t-dre
ssed
leat
her"
of
the
who
le h
ides
and
ski
ns0.
041.
6537
.91
1.61
1544
.2%
27.5
%99
.1%
150
3215
19P
rintin
g in
k, n
es0.
0014
.27
1.59
1.59
0_
8.2%
62.6
%0
0
9617
00Vacuumflasks/vacuumvesselscompletew/
cases;partso/tglassinners
0.00
1.58
1.77
1.58
150.
0%2.
8%74
.1%
150
3005
10D
ress
ings
and
oth
er a
rtic
les
havi
ng a
n ad
hesi
ve la
yer
0.21
1.79
9.21
1.57
032
.4%
5.3%
10.1
%0
0
5208
11Plainweavecottonfabric,>/=85%,notmore
than100g/m2,unbleached
0.38
1.91
22.0
61.
530
12.6
%-1
4.3%
40.2
%0
0
5513
23Wovenfabofpolyesterstaplefib,<85%,mixd
w/cot,<=170g/m2,dyd,nes
0.04
1.57
2.62
1.53
22.5
106.
0%-2
.5%
66.9
%22
.50
3923
30C
arbo
ys, b
ottle
s, fl
asks
and
sim
ilar
artic
les
of
plas
tics
0.00
2.38
1.53
1.52
7.5
-14.
3%2.
1%-1
.0%
7.5
0

82
An Assessment of the Pakistan-Sri Lanka Free Trade Agreem
ent
SR
I LA
NK
A R
CA
AD
VA
NTA
GE
ITE
MS
WIT
H N
O C
ON
CE
SS
ION
HS
Co
de
Pro
duc
t La
bel
Pak
201
3 E
xpo
rt
SL
2013
W
orl
d
Imp
ort
Pak
201
3 W
orl
d
Exp
ort
Trad
e P
ote
ntia
lP
ak t
ariff
Pak
-SL
CA
GR
SL
Imp
ort
CA
GR
Pak
E
xpo
rt
CA
GR
Ind
ia
Tari
ffP
ak T
ariff
A
dv.
7310
29Cans,ironorsteel,capacity<50litresnes
0.00
13.2
51.
521.
520
_9.
3%37
.0%
00
8207
19Rockdrilling/earthboringtools,nes,parts
0.00
5.10
1.50
1.50
00.
0%36
.5%
0.6%
00
6211
43Womens/girlsgarmentsnes,ofman-made
fibre
s, n
ot k
nitte
d0.
001.
502.
491.
500
0.0%
-5.5
%-7
.5%
00
5209
19Wovenfabricsofcotton,>/=85%,morethan
200g/m2,unbleached,nes
1.69
3.16
93.3
41.
470
95.7
%-2
1.2%
35.0
%27
.527
.5
0910
99S
pice
s ne
s0.
001.
4710
.26
1.47
0-5
.6%
9.7%
3.5%
00
7013
37D
rinki
ng g
lass
es (
excl
. gla
sses
of g
lass
ce
ram
ics
or o
f lea
d cr
ysta
l a0.
001.
452.
901.
450
0.0%
12.7
%22
4.9%
00
8803
90P
arts
of b
allo
ons,
diri
gibl
es, a
nd s
pace
craf
t ne
s0.
001.
441.
961.
440
0.0%
59.9
%3.
1%0
0
6204
49Womens/girlsdresses,ofothertextile
mat
eria
ls, n
ot k
nitte
d0.
001.
771.
421.
420
0.0%
4.9%
11.6
%0
0
7615
10Ta
ble,
kitc
hen
or o
ther
hou
seho
ld a
rtic
les
and
part
s th
ereo
f, an
d po
t sco
urer
s an
d sc
ourin
0.00
1.40
28.3
71.
400
0.0%
12.7
%16
7.0%
3030
0902
30B
lack
tea
(fer
men
ted)
&pa
rtly
ferm
entd
tea
in
pack
ages
not
exc
eedg
3 k
g0.
001.
403.
071.
4030
0.0%
39.0
%27
.9%
300
3917
40Fi
tting
s, p
last
ic0.
003.
681.
401.
4030
0.0%
14.7
%97
.9%
300
3920
43P
late
s, s
heet
s, fi
lm, f
oil a
nd s
trip
, of n
on-
cellu
lar
poly
mer
s of
vin
y0.
204.
531.
571.
370
40.0
%6.
0%-4
.3%
00
4821
10P
aper
labe
ls o
f all
kind
s, p
rinte
d0.
2112
.64
1.58
1.37
039
.1%
-0.4
%36
.4%
00
7801
99Le
ad u
nwro
ught
nes
0.00
1.36
7.26
1.36
00.
0%5.
4%59
.1%
00
9027
80In
stru
men
ts a
nd a
ppar
atus
for
phys
ical
or
chem
ical
ana
lysi
s, n
es0.
008.
561.
361.
360
0.0%
15.2
%64
.9%
00
8502
13Generatgsets,diesel/semi-dieselengines,ofan
outp
ut e
xcee
dg 3
75 K
VA0.
0012
.92
1.36
1.36
00.
0%-1
5.4%
-0.7
%0
0
3204
14D
irect
dye
s an
d pr
epar
atio
ns b
ased
ther
eon
0.00
1.35
1.70
1.35
00.
0%10
.4%
76.9
%0
0
6006
42D
yed
fabr
ics,
kni
tted
or c
roch
eted
, of a
rtifi
cial
fib
res,
of a
wid
th o
0.08
37.9
61.
401.
320
-50.
2%17
.6%
48.2
%30
30
1904
10P
rep
food
s ob
tain
d by
the
swel
lg o
roa
stg
of
cere
al o
cer
eal p
rodu
cts
0.00
2.15
1.32
1.32
00.
0%12
.6%
38.1
%0
0
5512
99Wovenfabrics,containg>/=85%ofother
syntheticstaplefib,o/tunbl/bl
0.00
1.31
3.79
1.31
00.
0%-1
1.6%
75.5
%0
0

83
An Assessment of the Pakistan-Sri Lanka Free Trade Agreem
ent2523
21P
ortla
nd c
emen
t, w
hite
, whe
ther
or
not
artif
icia
lly c
olou
red
0.01
1.30
4.18
1.30
0_*
24.1
%11
1.2%
00
9506
99Articles&equipforsports&outdoorgames
nes&
swim
mg&
padd
lg p
ools
0.14
1.43
47.8
21.
300
1.6%
13.3
%-3
.3%
00
8438
90Ptsofmachnesftheindprep/mfrfoodetcexf
ex/prepvegfat/oil
0.00
1.29
5.83
1.29
17.5
0.0%
6.9%
29.9
%17
.50
8544
11In
sula
ted
(incl
udin
g en
amel
led
or a
nodi
sed)
w
indi
ng w
ire o
f cop
per
0.00
7.81
1.28
1.28
00.
0%5.
1%14
.4%
00
3917
29Tu
bes,
pip
es a
nd h
oses
, rig
id; o
f pla
stic
s ne
s0.
002.
411.
251.
250
_*21
.4%
120.
8%0
0
3206
49In
orga
nic
colo
urin
g m
atte
r ne
s an
d pr
epar
atio
ns b
ased
ther
eon
0.00
11.0
31.
221.
220
0.0%
15.3
%-5
.8%
00
6111
20B
abie
s ga
rmen
ts a
nd c
loth
ing
acce
ssor
ies
of
cotto
n, k
nitte
d0.
001.
2226
.79
1.21
0-1
6.7%
80.4
%2.
1%0
0
2847
00H
ydro
gen
pero
xide
0.19
1.39
3.50
1.21
09.
9%5.
9%66
.6%
00
5210
21Plainweavecottonfab,<85%mixdwm-m
fib,notmorethan200g/m2,bl
0.32
1.51
145.
151.
190
-8.3
%28
.9%
1.0%
3030
2008
19Nuts&seedsnesinclmx,o/wprepo
pres
vd,s
ugar
d,sw
eete
nd,s
pirit
d o
not
0.00
1.19
6.32
1.19
00.
0%15
.9%
164.
4%0
0
5515
11W
oven
fab
of p
olye
ster
sta
ple
fib m
ixd
w
visc
ose
rayo
n st
aple
fib,
nes
0.00
46.4
51.
181.
180
0.0%
13.6
%51
.3%
00
3402
90S
urfa
ce-a
ctiv
e pr
epar
atio
ns, w
ashi
ng a
nd
clea
ning
pre
para
tions
, nes
0.00
7.90
1.18
1.18
300.
0%8.
6%47
.3%
300
1704
90S
ugar
con
fect
ione
ry n
es (
incl
udg
whi
te
choc
olat
e),n
ot c
onta
ing
coco
a0.
191.
3538
.83
1.17
0-1
2.0%
0.1%
21.1
%0
0
8474
31C
oncr
ete
or m
orta
r m
ixer
s0.
003.
761.
171.
170
0.0%
21.6
%2.
7%0
0
3910
00S
ilico
nes
in p
rimar
y fo
rms
0.00
2.86
1.16
1.16
00.
0%13
.6%
81.2
%0
0
5209
21Plainweavecottonfabric,>/=85%,morethan
200g/m2,bleached
0.05
2.33
1.21
1.16
054
.1%
-11.
8%19
.8%
00
4412
39P
lyw
ood
cons
istin
g so
lely
of s
heet
s of
woo
d <=6mmthick(excl.ofba
0.00
1.14
1.36
1.14
00.
0%-3
1.5%
1.5%
00
4202
99C
onta
iner
s, n
es0.
001.
141.
881.
140
0.0%
11.2
%16
.5%
00
8430
49B
orin
g or
sin
king
mac
hine
ry n
es, n
ot s
elf-
prop
elle
d0.
002.
901.
131.
130
0.0%
92.4
%8.
6%0
0
8415
90P
arts
of a
ir co
nditi
onin
g m
achi
nes
0.00
7.59
1.13
1.13
00.
0%15
.6%
4.7%
00
6110
90P
ullo
vers
,car
diga
ns&
sim
ilar
artic
les
of o
th
text
ile m
ater
ials
,kni
ttd0.
001.
1181
.24
1.11
8.8
_*37
.5%
37.3
%8.
80
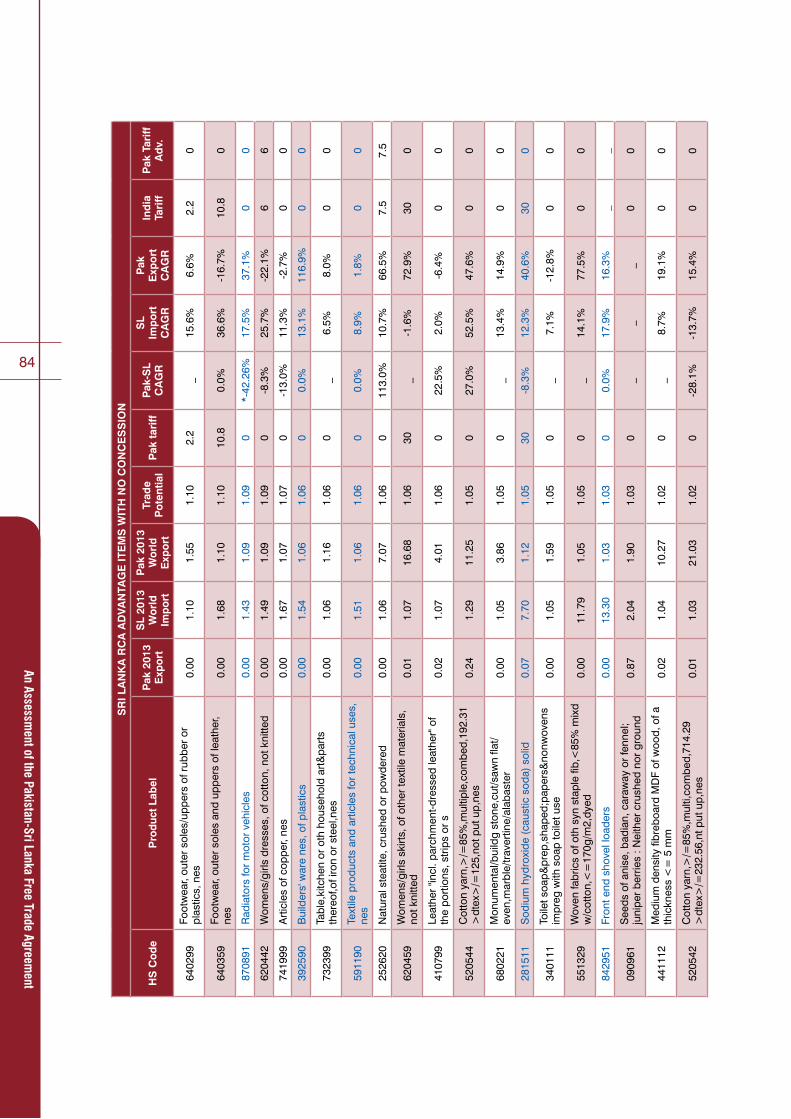
84
An Assessment of the Pakistan-Sri Lanka Free Trade Agreem
ent
SR
I LA
NK
A R
CA
AD
VA
NTA
GE
ITE
MS
WIT
H N
O C
ON
CE
SS
ION
HS
Co
de
Pro
duc
t La
bel
Pak
201
3 E
xpo
rt
SL
2013
W
orl
d
Imp
ort
Pak
201
3 W
orl
d
Exp
ort
Trad
e P
ote
ntia
lP
ak t
ariff
Pak
-SL
CA
GR
SL
Imp
ort
CA
GR
Pak
E
xpo
rt
CA
GR
Ind
ia
Tari
ffP
ak T
ariff
A
dv.
6402
99Footwear,outersoles/uppersofrubberor
plas
tics,
nes
0.00
1.10
1.55
1.10
2.2
_15
.6%
6.6%
2.2
0
6403
59Fo
otw
ear,
oute
r so
les
and
uppe
rs o
f lea
ther
, ne
s0.
001.
681.
101.
1010
.80.
0%36
.6%
-16.
7%10
.80
8708
91R
adia
tors
for
mot
or v
ehic
les
0.00
1.43
1.09
1.09
0*-42.26%
17.5
%37
.1%
00
6204
42Womens/girlsdresses,ofcotton,notknitted
0.00
1.49
1.09
1.09
0-8
.3%
25.7
%-2
2.1%
66
7419
99A
rtic
les
of c
oppe
r, ne
s0.
001.
671.
071.
070
-13.
0%11
.3%
-2.7
%0
0
3925
90B
uild
ers'
war
e ne
s, o
f pla
stic
s0.
001.
541.
061.
060
0.0%
13.1
%11
6.9%
00
7323
99Ta
ble,
kitc
hen
or o
th h
ouse
hold
art
&pa
rts
ther
eof,o
f iro
n or
ste
el,n
es0.
001.
061.
161.
060
_6.
5%8.
0%0
0
5911
90Te
xtile
pro
duct
s an
d ar
ticle
s fo
r te
chni
cal u
ses,
ne
s0.
001.
511.
061.
060
0.0%
8.9%
1.8%
00
2526
20N
atur
al s
teat
ite, c
rush
ed o
r po
wde
red
0.00
1.06
7.07
1.06
011
3.0%
10.7
%66
.5%
7.5
7.5
6204
59Womens/girlsskirts,ofothertextilematerials,
not k
nitte
d0.
011.
0716
.68
1.06
30_
-1.6
%72
.9%
300
4107
99Le
athe
r "in
cl. p
arch
men
t-dre
ssed
leat
her"
of
the
port
ions
, str
ips
or s
0.02
1.07
4.01
1.06
022
.5%
2.0%
-6.4
%0
0
5205
44Cottonyarn,>/=85%,multiple,combed,192.31
>dtex>/=125,notputup,nes
0.24
1.29
11.2
51.
050
27.0
%52
.5%
47.6
%0
0
6802
21Monumental/buildgstone,cut/sawnflat/
even,marble/travertine/alabaster
0.00
1.05
3.86
1.05
0_
13.4
%14
.9%
00
2815
11S
odiu
m h
ydro
xide
(ca
ustic
sod
a) s
olid
0.07
7.70
1.12
1.05
30-8
.3%
12.3
%40
.6%
300
3401
11To
ilet s
oap&
prep
,sha
ped;
pape
rs&
nonw
oven
s im
preg
with
soa
p to
ilet u
se0.
001.
051.
591.
050
_7.
1%-1
2.8%
00
5513
29Wovenfabricsofothsynstaplefib,<85%mixd
w/cotton,<=170g/m2,dyed
0.00
11.7
91.
051.
050
_14
.1%
77.5
%0
0
8429
51Fr
ont e
nd s
hove
l loa
ders
0.00
13.3
01.
031.
030
0.0%
17.9
%16
.3%
__
0909
61S
eeds
of a
nise
, bad
ian,
car
away
or
fenn
el;
juni
per
berr
ies
: Nei
ther
cru
shed
nor
gro
und
0.87
2.04
1.90
1.03
0_
__
00
4411
12M
ediu
m d
ensi
ty fi
breb
oard
MD
F of
woo
d, o
f a
thickness<=5mm
0.02
1.04
10.2
71.
020
_8.
7%19
.1%
00
5205
42Cottonyarn,>/=85%,multi,combed,714.29
>dtex>/=232.56,ntputup,nes
0.01
1.03
21.0
31.
020
-28.
1%-1
3.7%
15.4
%0
0

85
An Assessment of the Pakistan-Sri Lanka Free Trade Agreem
ent
9506
91G
ymna
sium
or
athl
etic
s ar
ticle
s an
d equipment
0.00
4.33
1.01
1.01
00.
0%8.
7%20
.9%
00
'300
450
Vita
min
s an
d th
eir
deriv
ativ
es,in
dos
age
0.32
1.32
2.75
1.00
0-0
.6%
13.6
%5.
6%0
0

86
An Assessment of the Pakistan-Sri Lanka Free Trade Agreem
ent
HIG
H T
RA
DE
PO
TEN
TIA
L S
RI L
AN
KA
N E
XP
OR
TS T
O P
AK
ISTA
N W
ITH
FA
VO
UR
AB
LE C
AG
R IT
EM
S H
IGH
LIG
HTE
D
HS
Co
de
Pro
duc
t la
bel
Pak
201
3 Im
po
rt
Pak
201
3 W
orl
d
Imp
ort
s
Sri
Lan
ka
2013
E
xpo
rts
Po
tent
ial
in 2
013
SL-
Pak
C
AG
RP
ak Im
po
rtC
AG
RS
L E
xpo
rt
CA
GR
Tari
ff o
n S
L
0902
40B
lack
tea
(fer
men
ted)
& p
artly
ferm
ente
d te
a in
pac
kage
s ex
ceed
g 3
kg21
8431
3146
8006
9431
0962
-10.
90%
5.06
%6.
65%
10
2710
19O
ther
pet
role
um o
ils a
nd p
repa
ratio
ns0
7164
594
3111
731
117
0.00
%18
.26%
16.0
3%0
2106
90Fo
od p
repa
ratio
ns n
es9
4262
830
145
3013
60.
00%
17.3
2%23
.61%
0
2309
90A
nim
al fe
ed p
repa
ratio
ns n
es0
2999
838
745
2999
80.
00%
21.1
4%88
.33%
0
4907
00Unusdpostage,revenuestamps;chequeforms,banknotes,bond
cert
ific,
etc
081
5799
2866
828
668
0.00
%13
7.52
%22
.25%
0
8504
31Tr
ansf
orm
ers
elec
tric
pow
er h
andl
ing
capa
city
not
exc
eedi
ng 1
KVA
, ne
s0
2677
128
417
2677
10.
00%
54.3
6%5.
79%
0
9503
00Tr
icyc
les,
sco
oter
s, p
edal
car
s an
d si
mila
r w
heel
ed to
ys; d
olls
'' car
r0
2402
227
489
2402
20.
00%
6.70
%5.
65%
0
9031
80M
easu
ring
or c
heck
ing
inst
rum
ents
, app
lianc
es a
nd m
achi
nes,
nes
421
499
2518
721
495
-25.
98%
11.3
0%17
.12%
0
8538
90P
arts
for
use
with
the
appa
ratu
s of
hea
dg n
o. 8
5.35
,85.
36 o
r 85
.37,
nes
220
795
2165
420
793
_*6.
23%
10.2
8%0
8537
10Boards,panels,includgnumericalcontrolpanels,foravoltage<=1000
V0
2854
819
961
1996
10.
00%
31.6
9%25
.28%
0
4016
99A
rtic
les
of v
ulca
nise
d ru
bber
nes
, oth
er th
an h
ard
rubb
er0
1783
855
551
1783
80.
00%
14.2
0%17
.55%
0
4011
20P
neum
atic
tire
s ne
w o
f rub
ber
for
buse
s or
lorr
ies
1061
1681
3418
209
1714
854
.91%
9.31
%12
.35%
0
4707
90W
aste
&sc
rap
of p
aper
or
pape
rboa
rd,n
es (
incl
udg
unso
rted
w
aste
&sc
rap)
482
2087
917
454
1697
273
.95%
7.14
%17
.39%
0
4016
93G
aske
ts, w
ashe
rs a
nd o
ther
sea
ls o
f vul
cani
sed
rubb
er0
1672
214
861
1486
10.
00%
20.8
5%9.
38%
0
0802
80A
reca
nut
s0
7291
811
758
1175
80.
00%
_*_*
0
7801
10Le
ad r
efin
ed u
nwro
ught
090
702
1164
611
646
0.00
%27
.59%
114.
73%
0
2401
20To
bacc
o, u
nman
ufac
ture
d, p
artly
or
who
lly s
tem
med
or
strip
ped
011
165
3705
811
165
0.00
%33
.45%
45.3
1%0
8544
49E
lect
ric c
ondu
ctor
s, fo
r a
volta
ge n
ot e
xcee
ding
80
V, n
es0
4295
610
853
1085
3-4
1.29
%22
.35%
-10.
25%
0
1101
00W
heat
or
mes
lin fl
our
097
6135
664
9761
0.00
%3.
00%
40.8
1%0
6911
10Ta
blew
are
and
kitc
henw
are
of p
orce
lain
or
chin
a20
995
2526
960
9316
31.3
2%3.
08%
0.66
%20
7010
90C
arbo
ys, b
ottle
s, fl
asks
, jar
s, p
ots,
phi
als
and
othe
r co
ntai
ners
, of
074
9411
797
7494
0.00
%10
.57%
66.3
4%0
5510
11Yarn,>/=85%ofartificialstaplefibres,single,notputup
071
1020
766
7110
0.00
%22
.40%
17.9
5%0
8534
00P
rinte
d ci
rcui
ts0
7075
1674
270
750.
00%
14.5
5%38
.31%
0
8802
30A
ircra
ft ne
s of
an
unla
den
wei
ght >
2,0
00 k
g bu
t not
exc
eedg
15,
000
kg0
9527
6892
6892
0.00
%63
.43%
128.
87%
0
Tab
le 2
list
s th
e 24
7 S
ri L
anka
n ex
po
rt it
ems
to P
akis
tan
at th
e 6
dig
it H
S c
od
e w
ith tr
ade
po
tent
ial g
reat
er th
an o
r eq
ual t
o U
SD
500
,000
. Ite
ms
with
fav
our
able
CA
GR
met
rics
are
hig
hlig
hte
d in
red
.
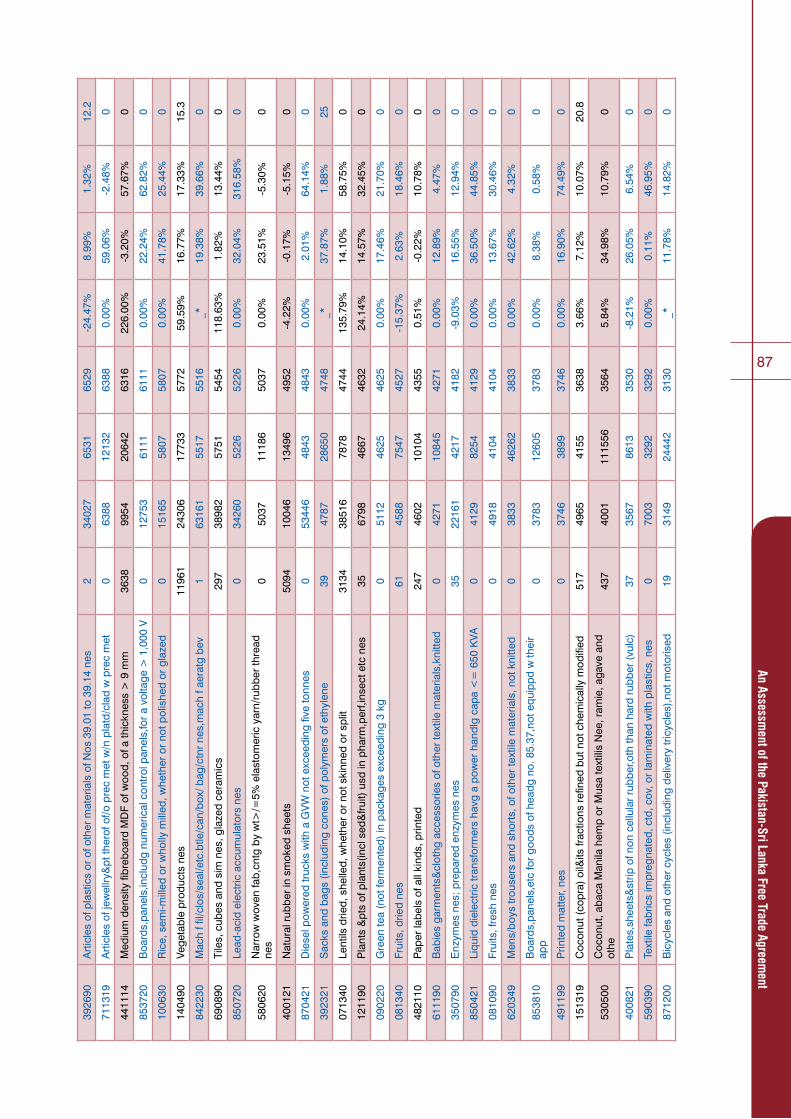
87
An Assessment of the Pakistan-Sri Lanka Free Trade Agreem
ent
3926
90A
rtic
les
of p
last
ics
or o
f oth
er m
ater
ials
of N
os 3
9.01
to 3
9.14
nes
234
027
6531
6529
-24.
47%
8.99
%1.
32%
12.2
7113
19Articlesofjewellry&pttherofof/oprecmetw/nplatd/cladwprecmet
063
8812
132
6388
0.00
%59
.06%
-2.4
8%0
4411
14M
ediu
m d
ensi
ty fi
breb
oard
MD
F of
woo
d, o
f a th
ickn
ess
> 9
mm
3638
9954
2064
263
1622
6.00
%-3
.20%
57.6
7%0
8537
20B
oard
s,pa
nels
,incl
udg
num
eric
al c
ontr
ol p
anel
s,fo
r a
volta
ge >
1,0
00 V
012
753
6111
6111
0.00
%22
.24%
62.8
2%0
1006
30Rice,semi-milledorwhollymilled,whetherornotpolishedorglazed
015
165
5807
5807
0.00
%41
.78%
25.4
4%0
1404
90Ve
geta
ble
prod
ucts
nes
1196
124
306
1773
357
7259
.59%
16.7
7%17
.33%
15.3
8422
30Machffil/clos/seal/etc.btle/can/box/bag/ctnrnes,machfaeratgbev
163
161
5517
5516
_*19
.38%
39.6
6%0
6908
90Tiles,cubesandsimnes,glazedceramics
297
3898
257
5154
5411
8.63
%1.
82%
13.4
4%0
8507
20Le
ad-a
cid
elec
tric
acc
umul
ator
s ne
s0
3426
052
2652
260.
00%
32.0
4%31
6.58
%0
5806
20Narrowwovenfab,cntgbywt>/=5%elastomericyarn/rubberthread
nes
050
3711
186
5037
0.00
%23
.51%
-5.3
0%0
4001
21N
atur
al r
ubbe
r in
sm
oked
she
ets
5094
1004
613
496
4952
-4.2
2%-0
.17%
-5.1
5%0
8704
21D
iese
l pow
ered
truc
ks w
ith a
GV
W n
ot e
xcee
ding
five
tonn
es0
5344
648
4348
430.
00%
2.01
%64
.14%
0
3923
21S
acks
and
bag
s (in
clud
ing
cone
s) o
f pol
ymer
s of
eth
ylen
e39
4787
2865
047
48_*
37.8
7%1.
88%
25
0713
40Le
ntils
drie
d, s
helle
d, w
heth
er o
r no
t ski
nned
or
split
3134
3851
678
7847
4413
5.79
%14
.10%
58.7
5%0
1211
90P
lant
s &
pts
of p
lant
s(in
cl s
ed&
fruit)
usd
in p
harm
,per
f,ins
ect e
tc n
es35
6798
4667
4632
24.1
4%14
.57%
32.4
5%0
0902
20G
reen
tea
(not
ferm
ente
d) in
pac
kage
s ex
ceed
ing
3 kg
051
1246
2546
250.
00%
17.4
6%21
.70%
0
0813
40Fr
uits
, drie
d ne
s61
4588
7547
4527
-15.
37%
2.63
%18
.46%
0
4821
10P
aper
labe
ls o
f all
kind
s, p
rinte
d24
746
0210
104
4355
0.51
%-0
.22%
10.7
8%0
6111
90B
abie
s ga
rmen
ts&
clot
hg a
cces
sorie
s of
oth
er te
xtile
mat
eria
ls,k
nitte
d0
4271
1084
542
710.
00%
12.8
9%4.
47%
0
3507
90Enzymesnes;preparedenzymesnes
3522
161
4217
4182
-9.0
3%16
.55%
12.9
4%0
8504
21Liquiddielectrictransformershavgapowerhandlgcapa<=650KVA
041
2982
5441
290.
00%
36.5
0%44
.85%
0
0810
90Fr
uits
, fre
sh n
es0
4918
4104
4104
0.00
%13
.67%
30.4
6%0
6203
49Mens/boystrousersandshorts,ofothertextilematerials,notknitted
038
3346
262
3833
0.00
%42
.62%
4.32
%0
8538
10Boards,panels,etcforgoodsofheadgno.85.37,notequippdwtheir
app
037
8312
605
3783
0.00
%8.
38%
0.58
%0
4911
99P
rinte
d m
atte
r, ne
s0
3746
3899
3746
0.00
%16
.90%
74.4
9%0
1513
19C
ocon
ut (
copr
a) o
il&its
frac
tions
ref
ined
but
not
che
mic
ally
mod
ified
517
4965
4155
3638
3.66
%7.
12%
10.0
7%20
.8
5305
00C
ocon
ut, a
baca
Man
ila h
emp
or M
usa
text
ilis
Nee
, ram
ie, a
gave
and
ot
he43
740
0111
1556
3564
5.84
%34
.98%
10.7
9%0
4008
21P
late
s,sh
eets
&st
rip o
f non
cel
lula
r ru
bber
,oth
than
har
d ru
bber
(vu
lc)
3735
6786
1335
30-8
.21%
26.0
5%6.
54%
0
5903
90Te
xtile
fabr
ics
impr
egna
ted,
ctd
, cov
, or
lam
inat
ed w
ith p
last
ics,
nes
070
0332
9232
920.
00%
0.11
%46
.95%
0
8712
00B
icyc
les
and
othe
r cy
cles
(in
clud
ing
deliv
ery
tric
ycle
s),n
ot m
otor
ised
1931
4924
442
3130
_*11
.78%
14.8
2%0

88
An Assessment of the Pakistan-Sri Lanka Free Trade Agreem
ent
HIG
H T
RA
DE
PO
TEN
TIA
L S
RI L
AN
KA
N E
XP
OR
TS T
O P
AK
ISTA
N W
ITH
FA
VO
UR
AB
LE C
AG
R IT
EM
S H
IGH
LIG
HTE
D
HS
Co
de
Pro
duc
t la
bel
Pak
201
3 Im
po
rt
Pak
201
3 W
orl
d
Imp
ort
s
Sri
Lan
ka
2013
E
xpo
rts
Po
tent
ial
in 2
013
SL-
Pak
C
AG
RP
ak Im
po
rtC
AG
RS
L E
xpo
rt
CA
GR
Tari
ff o
n S
L
6116
93G
love
s, m
itten
s an
d m
itts,
nes
, of s
ynth
etic
fibr
es, k
nitte
d10
3065
6205
3055
-13.
53%
27.1
4%0.
11%
0
4819
10C
arto
ns, b
oxes
and
cas
es, o
f cor
ruga
ted
pape
r or
pap
erbo
ard
6197
1230
7530
14_*
14.5
1%20
.25%
0
4001
22Te
chni
cally
spe
cifie
d na
tura
l rub
ber
(TS
NR
)30
5924
807
6023
2964
72.1
8%17
.43%
20.7
5%0
6209
90B
abie
s ga
rmen
ts&
clot
hg a
cces
sorie
s of
oth
text
ile m
ater
ials
,not
kni
ttd0
3907
2957
2957
0.00
%18
.86%
-4.8
6%0
4011
99P
neum
atic
tire
s ne
w o
f rub
ber
nes
1628
3714
4268
2821
-0.6
7%-1
1.69
%13
.67%
10
6403
99Footwear,outersolesofrubber/plasticsuppersofleather,nes
013
664
2759
2759
0.00
%27
.27%
-9.5
2%0
4015
11G
love
s su
rgic
al o
f rub
ber
1050
3776
6396
427
2641
.56%
14.5
4%13
.41%
0
8411
99P
arts
of g
as tu
rbin
es n
es0
8780
727
1527
150.
00%
10.6
3%49
.00%
0
8544
11In
sula
ted
(incl
udin
g en
amel
led
or a
nodi
sed)
win
ding
wire
of c
oppe
r0
5266
2693
2693
0.00
%27
.53%
-3.3
5%0
8517
62M
achi
nes
for
the
rece
ptio
n, c
onve
rsio
n an
d tr
ansm
issi
on o
r re
gene
ratio
017
8493
2682
2682
0.00
%-0
.40%
128.
56%
0
8431
39P
arts
of l
iftin
g, h
andl
ing,
load
ing
or u
nloa
ding
mac
hine
ry n
es0
1303
925
9725
970.
00%
37.0
2%12
1.79
%0
3809
91Fi
nish
g ag
ents
,dye
car
riers
&ot
h pr
ep,n
es,fo
r us
e in
the
text
ile in
dust
1623
163
2495
2479
_*5.
46%
22.9
7%0
6109
90T-
shirt
s,si
ngle
ts a
nd o
ther
ves
ts,o
f oth
er te
xtile
mat
eria
ls,k
nitte
d31
2487
2269
8624
5663
.32%
27.0
2%15
.87%
25
4707
10W
aste
and
scr
ap o
f unb
leac
hed
kraf
t or
corr
ugat
ed p
aper
and
pa
perb
oard
122
2570
6713
2448
3.52
%5.
67%
1.34
%0
1001
99W
heat
and
mes
lin (
excl
. see
d fo
r so
win
g, a
nd d
urum
whe
at)
069
0424
4224
420.
00%
_*_*
0
0304
99Frozenfishmeatwhetherornotminced(excl.swordfish,toothfishand
024
2422
334
2424
0.00
%98
.33%
2.65
%0
8207
19Rockdrilling/earthboringtools,nes,parts
025
244
2374
2374
0.00
%20
.99%
174.
92%
0
8207
30To
ols
for
pres
sing
, sta
mpi
ng o
r pu
nchi
ng0
2333
3391
2333
0.00
%18
.75%
128.
46%
0
6110
90P
ullo
vers
,car
diga
ns&
sim
ilar
artic
les
of o
th te
xtile
mat
eria
ls,k
nittd
023
0524
665
2305
0.00
%40
.51%
-7.2
5%0
0713
20C
hick
peas
, drie
d, s
helle
d, w
heth
er o
r no
t ski
nned
or
split
190
3960
024
3222
42_*
4.35
%91
.57%
0
2402
20C
igar
ette
s co
ntai
ning
toba
cco
026
5621
5221
520.
00%
27.7
1%15
.55%
0
6309
00W
orn
clot
hing
and
oth
er w
orn
artic
les
715
9541
2148
2141
-21.
84%
17.7
1%17
.25%
0
6305
33S
acks
, bag
s, p
acki
ng, o
f str
ip p
last
ic m
ater
ial
721
3199
0821
24_*
3.71
%9.
77%
25
6307
90M
ade
up a
rtic
les,
of t
extil
e m
ater
ials
, nes
, inc
ludi
ng d
ress
pat
tern
s35
2140
9864
2105
_*31
.83%
48.9
7%0
8308
10H
ooks
,eye
s&ey
elet
s of
bas
e m
etal
f cl
othi
ng,fo
otw
ear,t
rave
l goo
ds,e
tc0
2359
2095
2095
0.00
%16
.82%
24.8
1%0
3926
20A
ppar
el a
nd c
loth
ing
acce
ssor
ies
(incl
glo
ves)
of p
last
ic23
322
5364
2820
20-2
.66%
13.3
4%-7
.18%
0
5910
00Tr
ansm
issi
on o
r co
nvey
or b
elts
or
belti
ng o
f tex
tile
mat
eria
l0
1993
4708
1993
0.00
%9.
41%
8.74
%0
7019
90G
lass
fibr
es (
incl
udin
g gl
ass
woo
l) an
d ar
ticle
s th
ereo
f nes
019
9116
419
1991
0.00
%7.
46%
48.3
8%0

89
An Assessment of the Pakistan-Sri Lanka Free Trade Agreem
ent
4411
13M
ediu
m d
ensi
ty fi
breb
oard
MD
F of
woo
d, o
f a th
ickn
ess
> 5
mm
but
<=9
537
2500
3086
1963
_*0.
56%
21.9
6%0
5205
23Cottonyarn,>/=85%,single,combed,232.56>dtex>/=192.31,not
put u
p0
8216
1958
1958
0.00
%96
.48%
4.43
%0
7601
10A
lum
iniu
m u
nwro
ught
, not
allo
yed
030
791
1943
1943
0.00
%-0
.97%
6.09
%0
9403
60Fu
rnitu
re, w
oode
n, n
es12
1922
3493
1910
-1.5
9%4.
81%
2.98
%0
7601
20A
lum
iniu
m u
nwro
ught
, allo
yed
017
510
1881
1881
0.00
%4.
57%
-13.
31%
0
4819
20C
arto
ns,b
oxes
and
cas
es,fo
ldin
g,of
non
-cor
ruga
ted
pape
r or
pa
perb
oard
235
2111
6981
1876
_*14
.67%
25.6
2%0
6110
30P
ullo
vers
, car
diga
ns a
nd s
imila
r ar
ticle
s of
man
-mad
e fib
res,
kni
tted
2418
9643
338
1872
_*61
.06%
3.51
%25
3923
30C
arbo
ys, b
ottle
s, fl
asks
and
sim
ilar
artic
les
of p
last
ics
237
6618
3718
35_*
12.7
0%24
.53%
0
4005
99C
ompo
unde
d ru
bber
, unv
ulca
nise
d in
prim
ary
form
s ne
s0
1828
3467
618
280.
00%
30.2
0%13
1.73
%0
9506
99Articles&equipforsports&outdoorgamesnes&swimmg&paddlgpools
068
0117
2917
290.
00%
8.85
%32
.33%
0
7409
11P
late
,she
et &
str
ip o
f ref
ined
cop
per,i
n co
il,ex
ceed
ing
0.15
mm
thic
k0
1728
4068
1728
0.00
%19
.15%
106.
34%
0
8544
60E
lect
ric c
ondu
ctor
s, fo
r a
volta
ge e
xcee
ding
1,0
00 V
, nes
092
8717
1617
160.
00%
27.4
9%6.
84%
0
1804
00C
ocoa
but
ter,
fat a
nd o
il0
3745
1678
1678
0.00
%25
.79%
24.2
8%0
6203
39Mens/boysjacketsandblazers,ofothertextilematerials,notknitted
016
7041
9916
700.
00%
57.5
0%-1
6.68
%0
6802
21Monumental/buildgstone,cut/sawnflat/even,marble/travertine/
alab
aste
r0
1660
1618
016
600.
00%
7.96
%4.
42%
0
9013
80O
ptic
al d
evic
es, a
pplia
nces
and
inst
rum
ents
, nes
, of t
his
Cha
pter
016
3079
8616
300.
00%
16.2
6%-5
.29%
0
3303
00P
erfu
mes
and
toile
t wat
ers
067
2216
2516
250.
00%
16.5
3%28
.26%
0
6109
10T-
shirt
s, s
ingl
ets
and
othe
r ve
sts,
of c
otto
n, k
nitte
d13
217
5217
5993
1620
79.1
0%45
.22%
2.94
%25
5209
42Denimfabricsofcotton,>/=85%,morethan200g/m2
4148
4416
5016
09_*
13.8
8%25
.22%
0
8480
71M
ould
s, in
ject
ion
or c
ompr
essi
on ty
pes,
for
rubb
er o
r pl
astic
s0
6748
1597
1597
0.00
%11
.31%
40.6
8%0
9403
50B
edro
om fu
rnitu
re, w
oode
n, n
es0
1595
7372
1595
0.00
%8.
10%
28.5
9%0
8703
24A
utom
obile
s w
ith r
ecip
roca
ting
pist
on e
ngin
e di
spla
cing
> 3
000
cc0
3634
615
6515
650.
00%
13.7
6%33
.22%
0
8544
42Electricconductorsforavoltage<=1.000V,insulated,fittedwithc
013
954
1556
1556
0.00
%-4
8.23
%18
6.94
%0
8404
90Partsforauxiliaryplant&condenserforsteam/vapourgeneratgunitnes
045
8715
5215
520.
00%
65.5
9%_*
0
5504
10S
tapl
e fib
res
of v
isco
se, n
ot c
arde
d or
com
bed
012
1060
1543
1543
0.00
%6.
04%
_*0
8308
90Beads,spangles&othermadeupartnes,forclothing/footwear,awnings
etc
026
4215
4115
410.
00%
20.0
8%11
.38%
0
1806
90C
hoco
late
and
oth
er fo
od p
repa
ratio
ns c
onta
inin
g co
coa
nes
015
3431
8115
340.
00%
8.15
%56
.34%
0
1517
90Ediblemx/prepofanimal/vegfats&oils/offractionsexhdNo15.16
208
6676
1707
1499
_*37
.95%
8.10
%14
.4

90
An Assessment of the Pakistan-Sri Lanka Free Trade Agreem
ent
HIG
H T
RA
DE
PO
TEN
TIA
L S
RI L
AN
KA
N E
XP
OR
TS T
O P
AK
ISTA
N W
ITH
FA
VO
UR
AB
LE C
AG
R IT
EM
S H
IGH
LIG
HTE
D
HS
Co
de
Pro
duc
t la
bel
Pak
201
3 Im
po
rt
Pak
201
3 W
orl
d
Imp
ort
s
Sri
Lan
ka
2013
E
xpo
rts
Po
tent
ial
in 2
013
SL-
Pak
C
AG
RP
ak Im
po
rtC
AG
RS
L E
xpo
rt
CA
GR
Tari
ff o
n S
L
3924
90H
ouse
hold
and
toile
t art
icle
s ne
s, o
f pla
stic
s12
1493
1767
1481
_*0.
23%
36.1
4%25
3923
29S
acks
and
bag
s (in
clud
ing
cone
s) o
f pla
stic
s ne
s0
8906
1434
1434
_21
.61%
4.25
%0
8708
70W
heel
s in
clud
ing
part
s an
d ac
cess
orie
s fo
r m
otor
veh
icle
s0
1422
8764
1422
0.00
%-6
.69%
0.83
%0
1901
90Maltextract&foodprepofCh19<50%cocoa&hd0401to0404<10%
coco
a0
1622
914
1214
120.
00%
3.42
%4.
94%
0
4901
99B
ooks
, bro
chur
es, l
eafle
ts a
nd s
imila
r pr
inte
d m
atte
r, ne
s4
2197
514
1014
06_*
11.5
2%8.
76%
0
7308
90Structures&partsofstructures,i/s(exprefabbldgsofheadgno.9406)
043
840
1400
1400
0.00
%25
.63%
25.9
9%0
0907
10C
love
s, w
hole
frui
t, cl
oves
and
ste
ms,
nei
ther
cru
shed
nor
gro
und
1033
2420
4915
213
87_*
_*_*
0
1901
10Prepofcereals,flour,starch/milkfinfantuse,putupfretailsale
051
999
1373
1373
0.00
%18
.39%
39.1
9%0
4004
00Waste,paring&scrap(exchardrubber)&powder/granulesobtaind
ther
efro
m0
1055
913
4813
480.
00%
20.8
8%22
.07%
0
6212
10B
rass
iere
s an
d pa
rts
ther
eof,
of te
xtile
mat
eria
ls52
118
6848
5430
1347
164.
82%
26.8
9%12
.73%
25
6217
10C
loth
ing
acce
ssor
ies
nes,
of t
extil
e m
ater
ials
, not
kni
tted
013
2197
8313
210.
00%
25.9
2%40
.08%
0
3802
10A
ctiv
ated
car
bon
204
1523
8122
413
1933
.64%
-10.
73%
19.0
1%0
3912
39C
ellu
lose
eth
ers
nes,
in p
rimar
y fo
rms
5515
320
1349
1294
-4.3
3%14
.94%
4.89
%0
4411
12MediumdensityfibreboardMDFofwood,ofathickness<=5mm
5516
1157
968
0112
8542
.37%
5.60
%-1
9.62
%0
6404
19Footwearo/tsports,woutersolesofrubber/plastics&uppersoftexmat
014
085
1277
1277
0.00
%21
.67%
45.7
6%0
3004
90M
edic
amen
ts n
es, i
n do
sage
124
4773
1272
1271
_*11
.78%
3.64
%0
3402
19O
rgan
ic s
urfa
ce-a
ctiv
e ag
ents
, nes
022
0612
6412
640.
00%
13.4
4%89
.56%
0
1702
90S
ugar
nes
, inc
ludi
ng in
vert
sug
ar0
4304
1263
1263
0.00
%22
.62%
12.5
2%0
8423
90W
eigh
ing
mac
hine
wei
ghts
of a
ll ki
nds;
par
ts o
f wei
ghin
g m
achi
nery
012
6382
3012
630.
00%
14.5
8%11
3.31
%0
5807
10La
bels
, bad
ges
and
sim
ilar
wov
en a
rtic
les
of te
xtile
mat
eria
ls66
1040
113
0312
3759
.28%
12.4
0%-6
.11%
0
4823
90P
aper
and
pap
er a
rtic
les,
nes
1219
2912
3212
2011
.56%
6.82
%39
.65%
0
4001
10N
atur
al r
ubbe
r la
tex,
whe
ther
or
not p
revu
lcan
ised
667
2954
818
5911
926.
64%
1.74
%0.
65%
0
6301
40Blankets(o/telectric)andtravellingrugs,ofsyntheticfibres
021
194
1183
1183
0.00
%42
.70%
19.2
3%0
4821
90P
aper
labe
ls o
f all
kind
s, n
ot p
rinte
d0
1662
311
7411
74-2
6.52
%35
.19%
12.2
2%0
5402
45Filamentyarnofnylonorotherpolyamides,incl.monofilamentof<67
066
0411
6811
6841
.18%
-8.8
3%-1
.69%
0
8544
30Ig
nitio
n w
irg s
ets&
oth
wirg
set
s us
d in
veh
icle
s,ai
rcra
ft et
c0
1155
3607
811
550.
00%
7.06
%18
.16%
0
1513
11C
ocon
ut (
copr
a) o
il cr
ude
011
5112
986
1151
0.00
%-5
.68%
72.3
1%20
.9

91
An Assessment of the Pakistan-Sri Lanka Free Trade Agreem
ent
7801
99Le
ad u
nwro
ught
nes
011
4938
1811
490.
00%
19.8
6%11
.87%
0
5407
20Wovenfabobtaindfromstrip/thelikeofsynthetictextilematerials
023
3111
3111
310.
00%
10.6
6%10
.89%
0
8536
69E
lect
rical
plu
gs a
nd s
ocke
ts, f
or a
vol
tage
not
exc
eedi
ng 1
,000
vol
ts14
657
6712
7611
3014
.55%
13.9
5%0.
74%
0
4015
19G
love
s ne
s of
rub
ber
8611
9513
0730
1109
16.9
6%37
.28%
9.93
%0
8480
79M
ould
s fo
r ru
bber
or
plas
tics,
nes
011
741
1104
1104
0.00
%17
.64%
12.2
2%0
3005
90D
ress
ings
&si
mila
r ar
ticle
s,im
preg
or
coat
d or
pac
kagd
for
md
use,
nes
024
8311
0311
030.
00%
22.2
5%2.
61%
0
2009
89Ju
ice
of fr
uit o
r ve
geta
bles
, unf
erm
ente
d, w
heth
er o
r no
t con
tain
ing
adde
d su
gar
or o
ther
6511
6118
5410
96_*
_*_*
0
3402
90S
urfa
ce-a
ctiv
e pr
epar
atio
ns, w
ashi
ng a
nd c
lean
ing
prep
arat
ions
, nes
211
832
1096
1094
_*5.
68%
20.4
1%0
6105
90Mens/boysshirts,ofothertextilematerials,knitted
010
8468
0210
840.
00%
13.2
8%-3
.34%
0
3208
90Paints&varnibasedonpolymersdissolvinanonaqueoussolvnes
012
310
1083
1083
0.00
%4.
50%
23.6
7%0
8504
22Liqdielecttransfhavgapowerhandlgcap>650KVAbut<=
10,0
00K
VA0
1364
1061
1061
0.00
%13
.69%
-9.4
8%0
4008
11P
late
s, s
heet
s an
d st
rip o
f cel
lula
r ru
bber
(vu
lcan
ised
)0
1028
5909
1028
0.00
%22
.54%
24.4
7%0
6203
42Mens/boystrousersandshorts,ofcotton,notknitted
110
2330
1353
1022
0.00
%31
.33%
8.81
%0
5205
24Cottonyarn,>/=85%,single,combed,192.31>dtex>/=125,notput
up0
5051
1019
1019
0.00
%1.
60%
35.7
7%0
6405
90Fo
otw
ear,
nes
010
1494
0610
140.
00%
-7.5
7%43
.44%
0
2202
90Non-alcoholicbeveragesnes,excludgfruit/vegjuicesofheadgNo
20.0
90
1006
5781
1006
0.00
%3.
26%
58.0
4%0
1301
90N
atur
al g
ums,
res
ins,
gum
-res
ins
and
bals
am, e
xcep
t ara
bic
gum
023
5099
699
60.
00%
9.78
%0.
17%
0
4819
40S
acks
and
bag
s, o
f pap
er, n
es; i
nclu
ding
con
es30
1013
3566
983
_*4.
86%
11.4
3%0
3301
90Conc&aqueousdistlsofessentloils;terpenicby-prodsofessentloils
597
622
590
971
_*17
.48%
22.2
2%0
9603
29S
havi
ng,h
air,n
ail,e
yela
sh &
oth
er to
ilet b
rush
es fo
r us
e on
the
pers
on0
949
1664
949
0.00
%24
.40%
8.49
%0
5508
10S
ewin
g th
read
of s
ynth
etic
sta
ple
fibre
s21
611
6231
0194
6-8
.38%
24.7
3%-0
.04%
0
3204
17S
ynth
etic
org
anic
pig
men
ts a
nd p
repa
ratio
ns b
ased
ther
eon
021
631
943
943
0.00
%1.
95%
4.73
%0
8426
19Tr
ansp
orte
r or
brid
ge c
rane
s0
1599
293
593
50.
00%
1.52
%83
.31%
0
9506
91Gymnasiumorathleticsarticlesandequipment
067
9193
393
30.
00%
14.5
7%39
.38%
0
3210
00P
aint
s &
var
nish
es n
es; w
ater
pig
men
ts fo
r fin
ishi
ng le
athe
r0
2128
929
929
0.00
%4.
89%
-5.2
8%0
6702
90Artificialflowers/foliage/fruit&pts&articlesthereof,ofothermat
092
217
7492
20.
00%
16.7
4%-3
.06%
0
9403
30O
ffice
furn
iture
, woo
den,
nes
090
317
3590
30.
00%
5.62
%3.
80%
0
3915
90P
last
ics
was
te a
nd s
crap
nes
251
8190
590
3-2
6.94
%12
.43%
29.7
2%0
0407
11Fe
rtili
sed
eggs
for
incu
batio
n, o
f dom
estic
fow
ls0
898
2045
898
0.00
%_*
_*0

92
An Assessment of the Pakistan-Sri Lanka Free Trade Agreem
ent
HIG
H T
RA
DE
PO
TEN
TIA
L S
RI L
AN
KA
N E
XP
OR
TS T
O P
AK
ISTA
N W
ITH
FA
VO
UR
AB
LE C
AG
R IT
EM
S H
IGH
LIG
HTE
D
HS
Co
de
Pro
duc
t la
bel
Pak
201
3 Im
po
rt
Pak
201
3 W
orl
d
Imp
ort
s
Sri
Lan
ka
2013
E
xpo
rts
Po
tent
ial
in 2
013
SL-
Pak
C
AG
RP
ak Im
po
rtC
AG
RS
L E
xpo
rt
CA
GR
Tari
ff o
n S
L
0709
99Fr
esh
or c
hille
d ve
geta
bles
n.e
.s.
088
579
3288
50.
00%
_*_*
0
9606
21B
utto
ns o
f pla
stic
s, n
ot c
over
ed w
ith te
xtile
mat
eria
l1
3046
880
879
0.00
%35
.64%
14.3
6%0
4203
10A
rtic
les
of a
ppar
el o
f lea
ther
or
of c
ompo
sitio
n le
athe
r0
863
1439
086
30.
00%
28.5
5%21
.21%
0
4421
90W
ood
artic
les
nes
085
481
4685
40.
00%
8.61
%9.
66%
0
7117
19Im
itatio
n je
wel
lery
nes
of b
ase
met
al w
heth
er o
not
pla
td w
pre
c m
etal
084
737
8584
70.
00%
24.0
2%20
.55%
0
6403
19Sportsfootwear,o/tski,outrsoleofrbr/plas/leather&upperofleather
056
0583
783
7-2
8.86
%8.
27%
-2.0
0%0
0801
11C
ocon
uts,
des
sica
ted
4064
4900
5929
383
621
.98%
1.28
%2.
78%
0
7326
90A
rtic
les,
iron
or
stee
l, ne
s0
3705
782
982
90.
00%
19.0
8%-0
.32%
0
8504
50In
duct
ors,
ele
ctric
033
8982
482
40.
00%
26.2
5%20
.14%
0
8543
70E
lect
rical
mac
hine
s an
d ap
para
tus,
hav
ing
indi
vidu
al fu
nctio
ns, n
.e.s
.0
1388
481
781
70.
00%
13.9
2%28
2.34
%0
3919
10Self-adhesiveplates,sheets,filmetc,ofplasticinrolls<20cmwide
098
5181
681
60.
00%
9.48
%17
.65%
17.5
7320
10S
prin
gs, l
eaf a
nd le
aves
ther
efor
, iro
n or
ste
el0
1024
815
815
0.00
%20
.87%
5.35
%0
8428
20P
neum
atic
ele
vato
rs a
nd c
onve
yors
086
281
581
50.
00%
6.62
%72
.58%
0
4819
50C
onta
iner
s, p
acki
ng, n
es (
incl
udin
g re
cord
sle
eves
) of
pap
er0
1628
809
809
0.00
%50
.14%
80.3
9%0
6402
99Footwear,outersoles/uppersofrubberorplastics,nes
034
4080
180
10.
00%
12.5
2%38
.40%
0
0908
21M
ace
: Nei
ther
cru
shed
nor
gro
und
079
148
5379
10.
00%
_*_*
0
6006
90Fa
bric
s, k
nitte
d or
cro
chet
ed, o
f a w
idth
of >
30
cm (
excl
. of a
rtifi
c0
2527
788
788
0.00
%19
.08%
-16.
84%
0
6310
90U
sed
or n
ew r
ags
of te
xtile
mat
eria
ls, n
ot s
orte
d22
804
1792
782
_*41
.22%
23.8
7%0
1701
99R
efin
ed s
ugar
, in
solid
form
, nes
058
2177
277
20.
00%
5.26
%10
.75%
0
4015
90A
rtic
les
of a
ppar
el &
clo
thin
g ac
cess
orie
s ne
s,of
vul
cani
sed
rubb
er0
1068
768
768
0.00
%14
.25%
-20.
16%
0
6815
99A
rtic
les
of s
tone
or
of o
ther
min
eral
sub
stan
ces
nes
075
477
6875
40.
00%
17.4
0%74
.05%
0
7404
00W
aste
and
scr
ap, c
oppe
r or
cop
per
allo
y0
4433
746
746
0.00
%11
.41%
11.1
5%0
8409
99P
arts
for
dies
el a
nd s
emi-d
iese
l eng
ines
059
675
741
741
0.00
%5.
02%
7.30
%0
5202
99C
otto
n w
aste
, nes
073
879
273
8-2
7.43
%21
.60%
12.8
9%0
4013
10In
ner
tube
s of
rub
ber
for
mot
or c
ars
etc
buse
s or
lorr
ies
4614
1078
473
839
.53%
4.60
%24
.77%
0
5604
10R
ubbe
r th
read
and
cor
d, te
xtile
cov
ered
073
545
5573
50.
00%
10.7
2%79
.12%
0
5401
10S
ewin
g th
read
of s
ynth
etic
fila
men
ts0
9742
734
734
0.00
%28
.44%
-2.4
0%6.
3
2504
10N
atur
al g
raph
ite in
pow
der
or fl
akes
104
837
4327
733
-8.6
6%0.
30%
12.8
6%0
8529
10A
eria
ls&
aeria
l ref
lect
ors
of a
ll ki
nds;
part
s su
itabl
e f u
se th
erew
ith0
2036
731
731
0.00
%-8
.25%
56.4
7%0

93
An Assessment of the Pakistan-Sri Lanka Free Trade Agreem
ent
3923
10B
oxes
, cas
es, c
rate
s &
sim
ilar
artic
les
of p
last
ic0
5516
720
720
0.00
%16
.61%
17.0
9%0
5806
32N
arro
w w
oven
fabr
ics
of m
an-m
ade
fibre
s, n
es64
3404
777
713
30.1
9%14
.30%
-5.2
0%0
6115
10G
radu
ated
com
pres
sion
hos
iery
[e.
g., s
tock
ings
for
varic
ose
vein
s], o
f0
706
4229
706
0.00
%3.
52%
-19.
37%
0
0402
99M
ilk a
nd c
ream
nes
sw
eete
ned
024
4570
370
30.
00%
32.5
9%12
.89%
0
2008
20Pineapplesnes,o/wpreporpresvd,sugared,sweetened,spiritedornot
033
9970
070
00.
00%
7.64
%7.
18%
0
6911
90H
ouse
hold
art
icle
s ne
s &
toile
t art
icle
s of
por
cela
in o
r ch
ina
012
6769
769
70.
00%
-2.9
7%20
.83%
0
6111
20B
abie
s ga
rmen
ts a
nd c
loth
ing
acce
ssor
ies
of c
otto
n, k
nitte
d0
695
1111
8469
50.
00%
106.
91%
19.3
0%0
8422
90P
ts o
f dis
h w
ashi
ng,c
lean
g or
dry
g co
ntai
ner,p
ackg
or
wra
ppg
mac
h0
1716
269
569
50.
00%
32.0
9%28
.85%
0
8471
50D
igita
l pro
cess
ing
units
not
sol
d as
com
plet
e sy
stem
s0
1862
569
569
50.
00%
18.3
6%52
.05%
0
7408
19W
ire o
f ref
ind
copp
er o
f whi
ch th
e m
ax c
ross
sec
tionl
dim
ensi
on
<=6mm
014
8669
069
00.
00%
50.2
8%4.
56%
0
3812
30Anti-oxidisgprep&othercompoundstabilizersforrubberorplastics
067
4068
468
40.
00%
11.8
4%77
.31%
0
9505
90Fe
stiv
e,ca
rniv
al o
oth
ent
erta
inm
ent a
rt in
cl c
onju
rg tr
icks
&no
v jo
kes
013
5968
068
00.
00%
38.1
8%-1
3.90
%0
3301
29E
ssen
tial o
ils, n
es0
1031
674
674
0.00
%18
.66%
61.5
4%0
8517
61B
ase
stat
ions
of a
ppar
atus
for
the
tran
smis
sion
or
rece
ptio
n of
voi
ce,
250
607
652
650
_*1.
09%
28.6
5%0
3505
10D
extr
ins
and
othe
r m
odifi
ed s
tarc
hes
040
5764
964
90.
00%
6.72
%71
.72%
0
4203
29Glovesmittens&mitts,o/tforsport,ofleatheroofcompositionleather
064
439
7964
40.
00%
7.15
%8.
93%
0
4903
00C
hild
ren'
s pi
ctur
e, d
raw
ing
or c
olou
ring
book
s0
5637
644
644
0.00
%84
.28%
58.1
7%0
9401
30S
wiv
el s
eats
&va
riabl
e he
ight
adj
ustm
ent o
th th
an th
ose
of h
eadg
94.
020
644
708
644
0.00
%56
.39%
23.7
5%0
1905
90C
omm
unio
n w
afer
s,em
pty
cach
ets
f pha
rm u
se&
sim
pro
d&ba
kers
' w
ares
nes
220
1463
863
6_*
19.1
9%21
.33%
0
9999
99C
omm
oditi
es n
ot e
lsew
here
spe
cifie
d0
8190
631
631
0.00
%-2
0.15
%60
.36%
0
1511
90P
alm
oil
and
its fr
actio
ns r
efin
ed b
ut n
ot c
hem
ical
ly m
odifi
ed77
1610
012
707
630
-60.
42%
11.8
8%36
.14%
30.1
7315
11C
hain
, rol
ler,
iron
or s
teel
048
6560
360
30.
00%
9.80
%88
.57%
0
8418
50Refrigeratingorfreezingdisplaycounters,cabinets,show-cases,etc
060
229
528
602
0.00
%-7
.26%
81.5
2%0
0801
32C
ashe
w n
uts,
with
out s
hell,
fres
h or
drie
d0
2064
595
595
0.00
%17
.68%
-2.8
4%0
8431
20Partsoffork-lift&otherworkstrucksfittedwithliftingequipment
059
443
582
594
0.00
%1.
02%
0.86
%0
5811
00Q
uilte
d te
xtile
pro
duct
s in
the
piec
e0
588
741
588
0.00
%45
.60%
59.6
5%0
3305
90H
air
prep
arat
ions
, nes
388
5772
976
588
60.1
5%5.
64%
6.62
%12
.5
8504
90P
arts
of e
lect
rical
tran
sfor
mer
s, s
tatic
con
vert
ers
and
indu
ctor
s0
9530
587
587
0.00
%16
.09%
-25.
64%
0
2103
90S
auce
s an
d pr
epar
atio
ns n
es a
nd m
ixed
con
dim
ents
and
mix
ed
seas
onin
gs0
1370
583
583
0.00
%13
.65%
2.72
%0
3823
19In
dust
rial f
atty
aci
ds, a
cid
oils
nes
1016
2809
415
9357
729
0.97
%4.
37%
38.1
6%0

94
An Assessment of the Pakistan-Sri Lanka Free Trade Agreem
ent
HIG
H T
RA
DE
PO
TEN
TIA
L S
RI L
AN
KA
N E
XP
OR
TS T
O P
AK
ISTA
N W
ITH
FA
VO
UR
AB
LE C
AG
R IT
EM
S H
IGH
LIG
HTE
D
HS
Co
de
Pro
duc
t la
bel
Pak
201
3 Im
po
rt
Pak
201
3 W
orl
d
Imp
ort
s
Sri
Lan
ka
2013
E
xpo
rts
Po
tent
ial
in 2
013
SL-
Pak
C
AG
RP
ak Im
po
rtC
AG
RS
L E
xpo
rt
CA
GR
Tari
ff o
n S
L
3926
40S
tatu
ette
s an
d ot
her
orna
men
tal a
rtic
les,
of p
last
ics
018
0957
757
70.
00%
32.4
7%-1
5.33
%0
6105
10Mens/boysshirts,ofcotton,knitted
257
770
175
575
_*35
.69%
-0.4
3%0
2202
10W
ater
s in
cl m
iner
al&
aera
td,c
onta
ing
suga
r o
swee
teng
mat
ter
o fla
vour
d2
3578
576
574
_*23
.69%
-0.6
0%0
3304
99B
eaut
y or
mak
e-up
pre
para
tions
nes
; sun
scre
en o
r su
n ta
n pr
epar
atio
ns3
8052
573
570
_*12
.84%
6.43
%0
3921
19Fi
lm a
nd s
heet
etc
, cel
lula
r of
pla
stic
s ne
s0
5285
570
570
0.00
%10
.77%
69.2
6%0
5808
90Ornamentaltrimmingsinthepiece,o/tknit;tassels,pompons&similarart
057
020
564
570
0.00
%39
.23%
67.9
9%0
2208
30W
hisk
ies
062
257
057
00.
00%
-10.
90%
27.7
3%0
2009
90M
ixtu
res
of ju
ices
unf
erm
entd
&no
t spi
ritd
whe
ther
o n
ot s
ugar
d o
swee
t0
557
876
557
0.00
%8.
29%
1.31
%0
3305
10H
air
sham
poos
1718
055
572
555
13.9
0%5.
59%
17.2
1%12
.5
8544
19In
sula
ted
(incl
udin
g en
amel
led
or a
nodi
sed)
win
ding
wire
, nes
064
4655
255
20.
00%
23.4
5%-1
4.26
%0
3824
90Chemical/alliedindustrypreparations/prodsnes
015
7945
549
549
-30.
66%
11.6
0%36
.71%
0
5608
19Knottdnettgoftwine/cordage/rope,andothmadeupnetsofm-mtex
mat
054
910
497
549
0.00
%9.
38%
159.
02%
0
5209
32Twillweavecottonfabrics,>/=85%,morethan200g/m2,dyed
4158
879
1654
789
.76%
40.8
2%41
.78%
0
3403
99Lu
bric
atin
g pr
epar
atio
ns &
sim
ilar
prep
arat
ions
not
cnt
g pe
t oils
,nes
140
5154
754
6_*
1.07
%59
.91%
0
5807
90La
bels
,bad
ges
and
sim
ilar
artic
les,
not w
oven
,of t
extil
e m
ater
ials
,nes
1432
1511
419
7454
214
8.02
%22
.73%
17.6
8%0
0602
90P
lant
s liv
e, n
es3
543
3863
540
-6.1
9%28
.97%
3.47
%0
9030
39Inst&app,formeasurgorcheckgvoltage,current,etcw/oarecorddev
053
689
153
60.
00%
-13.
52%
50.1
3%0
8438
60M
achi
nery
for
the
prep
arat
ion
of fr
uits
, nut
s or
veg
etab
les
020
2053
353
30.
00%
11.4
1%10
0.90
%0
8518
30Headphones,earphonesandcombinedmicrophone/speakersets
022
9853
053
00.
00%
10.8
7%26
.31%
0
3923
50S
topp
ers,
lids
, cap
s an
d ot
her
clos
ures
of p
last
ics
1293
2753
652
4_*
12.9
9%42
.59%
25
4013
20In
ner
tube
s of
rub
ber
for
bicy
cles
151
420
3651
3_*
32.8
0%18
.00%
25
1209
99S
eeds
, fru
it an
d sp
ores
for
sow
ing,
nes
095
7350
650
60.
00%
41.3
9%84
.93%
0

95
An Assessment of the Pakistan-Sri Lanka Free Trade Agreem
ent
Annexure B: List of product lines on no concession lists with high RCATable 3 lists Pakistani items on Sri Lanka’s no concession list that Pakistan has a higher RCA in than does Sri Lanka.
PA
KIS
TAN
RC
A A
DV
AN
TAG
E IT
EM
S W
ITH
NO
CO
NC
ES
SIO
N
HS
co
de
Pro
duc
t La
bel
Pak
ex
po
rts
2013
to
S
L
Sri
Lan
kan
Wo
rld
Im
po
rts
2013
Pak
Wo
rld
E
xpo
rts
2013
Trad
e P
ote
ntia
lTa
riff
on
Pak
Pak
RC
AS
L R
CA
Pak
RC
A
Ad
v
4113
10Le
athe
r fu
rthe
r pr
epar
ed a
fter
tann
ing
or c
rust
ing
"incl
. pa
rchm
ent-d
r33
720
9815
8948
1761
10.8
129.
344
3.76
125.
584
1006
40R
ice,
bro
ken
1134
207
2537
010
33.6
103.
024
010
3.02
4
0910
91Mixturesoftwo/moreoftheprodsofdifferentheadgstothis
chap
ter
519
3769
20
3075
.20
75.2
0813
40Fr
uits
, drie
d ne
s10
227
7493
121
730
73.6
960
73.6
96
8214
20M
anic
ure
or p
edic
ure
sets
and
inst
rum
ents
(in
clud
ing
nail
files
)1
8849
495
8730
73.6
960
73.6
96
3605
00M
atch
es0
025
155
030
71.4
40
71.4
4
1006
30R
ice,
sem
i-mill
ed o
r w
holly
mill
ed, w
heth
er o
r no
t pol
ishe
d or
glazed
1039
217
528
1790
214
7136
29.4
66.1
761.
8864
.296
6802
10Tilesetcrectornot>7cmetc;articolourdgranules/chippings/
pow
der
4022
1798
10
3050
.384
050
.384
1703
10C
ane
mol
asse
s0
042
532
030
45.8
720
45.8
72
0204
50Goatmeat,fresh,chilledorfrozen
055
919
077
559
3046
.624
3.76
42.8
64
5608
90Knottdnettgoftwine/cordage/rope,nes,andmadeupnetsof
oth
tex
mat
082
111
346
821
3051
.136
9.4
41.7
36
1006
20R
ice,
hus
ked
(bro
wn)
014
6425
114
1941
.36
041
.36
2207
20E
thyl
alc
ohol
and
oth
er s
pirit
s, d
enat
ured
, of a
ny s
tren
gth
226
425
8249
219
913
5.9
36.0
960
36.0
96
2207
10Undenaturdethylalcoholofanalcoholstrgthbyvolof80%vol/
high
er27
6487
3727
4068
5973
219.
629
.328
1.88
27.4
48
0201
10B
ovin
e ca
rcas
ses
and
half
carc
asse
s, fr
esh
or c
hille
d0
078
844
030
25.5
680
25.5
68
0804
50G
uava
s, m
ango
es a
nd m
ango
stee
ns, f
resh
or
drie
d5
157
200
030
24.0
640
24.0
64
1207
40S
esam
um s
eeds
, whe
ther
or
not b
roke
n5
8357
636
7830
15.7
920
15.7
92
0710
10Potatoes,frozen
966
2433
610
14.1
15.7
920
15.7
92
8450
19Household/laundry-typewashgmachofadrylinencapa
<=10kg,nes
04
2801
427
.914
.288
014
.288
6403
20Footwear,outrsole/upprofleathr,strapacrosstheinstep/arnd
big
toe
344
8125
414.
114
.288
014
.288
0701
90P
otat
oes,
fres
h or
chi
lled
nes
1209
228
393
1302
6316
301
63.8
26.3
213
.16
13.1
6
3401
19S
oap&
orgn
sur
f pre
p,sh
apd,
nes;
pape
rs&
nonw
oven
s im
preg
w
soap/prep,nes
041
2864
641
3012
.784
012
.784

96
An Assessment of the Pakistan-Sri Lanka Free Trade Agreem
ent
PA
KIS
TAN
RC
A A
DV
AN
TAG
E IT
EM
S W
ITH
NO
CO
NC
ES
SIO
N
HS
co
de
Pro
duc
t La
bel
Pak
ex
po
rts
2013
to
S
L
Sri
Lan
kan
Wo
rld
Im
po
rts
2013
Pak
Wo
rld
E
xpo
rts
2013
Trad
e P
ote
ntia
lTa
riff
on
Pak
Pak
RC
AS
L R
CA
Pak
RC
A
Ad
v
0402
29M
ilk a
nd c
ream
pow
der
swee
tene
d ex
ceed
ing
1.5%
fat
019
0811
195
1908
30.6
15.7
923.
7612
.032
9404
90Articlesofbedding/furnishing,nes,stuffedorinternallyfitted
7635
590
795
279
307.
520
7.52
2402
90C
igar
s, c
hero
ots,
cig
arill
os a
nd c
igar
ette
s, c
ntg
toba
cco
subs
titut
es0
887
18
250
6.01
60
6.01
6
0403
90B
utte
rmilk
,cur
dled
milk
& c
ream
,kep
hir
& fe
rm o
r ac
id m
ilk &
cr
eam
nes
037
1811
237
306.
016
06.
016
2401
30To
bacc
o re
fuse
00
1967
075
5.26
40
5.26
4
2501
00S
alt (
incl
udg
tabl
e sa
lt&de
natu
rd s
alt)
pur
e so
dium
ch
lorid
e&se
a w
ater
3550
018
450
465
31.8
5.26
40
5.26
4
2001
90Veg,fruit,nut&edibleprtsofplantsnes,prep/presvdbyvin/
acet
ic a
cid
063
9264
6330
5.26
40
5.26
4
3208
10P
aint
s&va
rnis
hes
base
d on
pol
yest
ers,
disp
erse
d in
a n
on-
aqueousmedium
078
419
086
784
305.
264
05.
264
0710
90Mixturesofvegetables,frozen
09
4797
930
4.51
20
4.51
2
1905
31S
wee
t bis
cuits
1320
240
330
189
303.
760
3.76
4819
50C
onta
iner
s, p
acki
ng, n
es (
incl
udin
g re
cord
sle
eves
) of
pap
er0
506
6161
506
303.
760
3.76
1102
90C
erea
l flo
ur n
es43
2018
930
16.5
3.76
03.
76
8211
92B
utch
er's
kni
ves,
hun
ting
kniv
es a
nd o
ther
kni
ves
havi
ng fi
xed
blad
es0
242
5420
242
153.
760
3.76
5607
90Tw
ine,
cor
dage
, rop
es a
nd c
able
s, o
f oth
er m
ater
ials
023
9862
1623
986
18.0
4815
.04
3.00
8
4106
22H
ides
and
ski
ns o
f goa
ts o
r ki
ds, i
n th
e dr
y st
ate
"cru
st",
with
out w
o0
262
641
262
156.
768
3.76
3.00
8
0409
00H
oney
, nat
ural
215
987
9915
730
3.00
80
3.00
8
1704
90S
ugar
con
fect
ione
ry n
es (
incl
udg
whi
te c
hoco
late
),no
t con
tain
g co
coa
186
1352
3883
211
6630
3.00
80
3.00
8
9609
20P
enci
l lea
ds, b
lack
or
colo
ured
013
336
1317
.53.
008
03.
008
0304
99Frozenfishmeatwhetherornotminced(excl.swordfish,
toot
hfis
h an
d0
3111
175
3110
.83.
008
03.
008
8418
29R
efrig
erat
ors,
hou
seho
ld ty
pe, n
es1
163
3697
162
7.5
3.00
80
3.00
8
0708
90Le
gum
inou
s ve
geta
bles
, she
lled
or u
nshe
lled,
fres
h or
chi
lled
nes
00
294
030
2.25
60
2.25
6

97
An Assessment of the Pakistan-Sri Lanka Free Trade Agreem
ent0710
80Vegetables,frozennes
054
1003
554
302.
256
02.
256
2009
90M
ixtu
res
of ju
ices
unf
erm
entd
¬ s
pirit
d w
heth
er o
not
sug
ard
o sw
eet
093
060
7193
030
2.25
60
2.25
6
1006
10R
ice
in th
e hu
sk (
padd
y or
rou
gh)
021
2826
2116
.42.
256
02.
256
1604
20Fi
sh p
repa
red
or p
rese
rved
, exc
ept w
hole
or
in p
iece
s0
3759
5337
11.3
2.25
60
2.25
6
6403
99Footwear,outersolesofrubber/plasticsuppersofleather,nes
090
374
610
903
3.4
2.25
60
2.25
6
8212
20Safetyrazorblades,includingrazorbladeblanksinstrips
016
3410
314
1634
2.5
3.76
1.88
1.88
2007
10Homoprep(jams,fruitjelliesetc)ckdprepwhether/ntsugard/
swee
tend
00
873
030
1.50
40
1.50
4
6904
10B
uild
ing
bric
ks0
2092
820
301.
504
01.
504
1902
19U
ncoo
ked
past
a, n
ot s
tuffe
d or
oth
erw
ise
prep
ared
, nes
493
099
0292
617
.51.
504
01.
504
9404
30S
leep
ing
bags
02
1053
217
.51.
504
01.
504
6907
10Ti
les,
cub
es a
nd s
im0
124
469
124
303.
008
1.88
1.12
8
5607
29Tw
ine
nes,
cor
dage
, rop
es a
nd c
able
s, o
f sis
al te
xtile
fibr
es0
3423
734
153.
008
1.88
1.12
8
6405
10Fo
otw
ear
with
upp
ers
of le
athe
r or
com
posi
tion
leat
her,
nes
063
030
2863
06.
83.
008
1.88
1.12
8

98
An Assessment of the Pakistan-Sri Lanka Free Trade Agreem
ent
Tab
le 4
list
s S
ri L
anka
n ite
ms
on
Pak
ista
n’s
no c
onc
essi
on
list
that
Sri
Lan
ka h
as a
hig
her
RC
A in
th
an d
oes
Pak
ista
n.
S
RI L
AN
KA
RC
A A
DV
AN
TAG
E IT
EM
S W
ITH
NO
CO
NC
ES
SIO
N
HS
Co
de
Pro
duc
t La
bel
SL
Exp
ort
s 20
13 t
o
Pak
Pak
Wo
rld
Im
po
rts
2013
Tari
ff o
n S
LTr
ade
Po
tent
ial
Gro
wth
SL
RC
AP
ak R
CA
SL
RC
A
Ad
v.
5513
19Wovenfabricsofothsynstaplefib,<=170g/m2,unbl/bl
00
150
041
5.48
2.25
641
3.22
4
8701
10P
edes
tria
n co
ntro
lled
trac
tors
065
305
071
.44
071
.44
5509
22Yarn,>/=85%ofpolyesterstaplefibres,multiple,notputup,nes
063
006.
338
063
.92
063
.92
5515
11W
oven
fab
of p
olye
ster
sta
ple
fib m
ixd
w v
isco
se r
ayon
sta
ple
fib,n
es0
1037
1542
20
54.5
20.
752
53.7
68
4022
1M
ilk a
nd c
ream
pow
der
unsw
eete
ned
exce
edin
g 1.
5% fa
t0
5733
2515
30
45.1
20.
752
44.3
68
1513
29Palmkernel/babassuoiltheirfract,refindbutnotchemicallymodifid
095
2225
.633
041
.36
041
.36
2401
10To
bacc
o, u
nman
ufac
ture
d, n
ot s
tem
med
or
strip
ped
022
85
228
043
.24
3.76
39.4
8
6117
90Partsofgarments/ofclothgaccessories,oftextilematerials,knittd
023
825
238
033
.84
033
.84
5402
62Ya
rn o
f pol
yest
er fi
lam
ents
, mul
tiple
, nes
, not
put
up
059
816.
32
026
.32
026
.32
6212
90C
orse
ts,b
race
s &
sim
ilar
artic
les
& p
arts
ther
eof,o
f tex
tile
mat
eria
ls0
405
2540
50
26.3
20
26.3
2
8418
91Furnituredesignedtoreceiverefrigeratingorfreezingequipment
056
825
0-3
26.3
20
26.3
2
6217
90P
arts
of g
arm
ents
or
of c
loth
g ac
cess
orie
s ne
s,of
tex
mat
,not
kni
ttd0
121
512
10
22.5
60
22.5
6
9022
0G
reen
tea
(not
ferm
ente
d) in
pac
kage
s ex
ceed
ing
3 kg
051
1210
4625
020
.68
020
.68
3920
71Fi
lm a
nd s
heet
etc
, non
-cel
lula
r et
c, o
f reg
ener
ated
cel
lulo
se0
101
206
018
.80
18.8
6215
90Ti
es, b
ow ti
es a
nd c
rava
ts, o
f oth
er te
xtile
mat
eria
ls, n
ot k
nitte
d0
9725
250
18.8
018
.8
6108
29Womens/girlsbriefsandpanties,ofothertextilematerials,knitted
249
250
2420
.68
2.25
618
.424
5512
11Wovenfabrics,containing>/=85%ofpolyesterstaplefibres,unblorbl
087
157
022
.56
4.51
218
.048
4805
40P
aper
, filt
er, i
n ro
lls o
r sh
eets
, unc
oate
d0
238
999
016
.92
016
.92
2815
11S
odiu
m h
ydro
xide
(ca
ustic
sod
a) s
olid
059
320
10
16.9
20.
752
16.1
68
3307
41A
garb
atti
& o
ther
odo
rifer
ous
prep
arat
ions
whi
ch o
pera
te b
y bu
rnin
g0
122
.51
015
.04
015
.04
8703
21A
utom
obile
s w
rec
ipro
catg
pis
ton
engi
ne d
ispl
acg
not m
ore
than
100
0 cc
020
6743
525
015
.04
015
.04
5402
52Ya
rn o
f pol
yest
er fi
lam
ents
, sin
gle,
>50
turn
s pe
r m
etre
, not
put
up
049
746.
312
10
13.1
60
13.1
6
5509
21Yarn,>/=85%ofpolyesterstaplefibres,single,notputup
048
186
6.3
40
13.1
60
13.1
6
1404
90Ve
geta
ble
prod
ucts
nes
1196
124
306
15.3
5772
9018
18.8
6.76
812
.032
3907
50A
lkyd
res
ins
015
1020
10
11.2
80
11.2
8
4013
90In
ner
tube
s of
rub
ber
nes
977
923
.835
38
13.1
63.
008
10.1
52

99
An Assessment of the Pakistan-Sri Lanka Free Trade Agreem
ent
6108
19Womens/girlsslipsandpetticoats,ofothertextilematerials,knitted
017
2517
024
.44
15.0
49.
4
3909
10U
rea
resi
ns; t
hiou
rea
resi
ns0
571
22.5
00
9.4
09.
4
3920
69Fi
lm a
nd s
heet
etc
, non
-cel
lula
r et
c, o
f pol
yest
ers
nes
016
8120
10
9.4
09.
4
3921
12Fi
lm a
nd s
heet
etc
, cel
lula
r of
pol
ymer
s of
vin
yl c
hlor
ide
038
7920
170
9.4
09.
4
4016
95R
ubbe
r ar
ticle
s in
flata
ble
nes,
vul
cani
sed
rubb
er0
121
2012
1-5
9.4
09.
4
7208
54Hotrolliron/steel,notcoil>600mmx<3mm
011
3215
00
9.4
09.
4
7216
69A
ngle
s, s
hape
s an
d se
ctio
ns, c
old
form
ed, n
es0
429
2022
40
9.4
09.
4
3917
21Tu
bes,
pip
es a
nd h
oses
, rig
id; o
f pol
yeth
ylen
e0
538
200
09.
41.
504
7.89
6
3921
13Fi
lm a
nd s
heet
etc
, cel
lula
r of
pol
yure
than
e0
1883
320
40
7.52
07.
52
5402
33Te
xtur
ed y
arn
nes,
of p
olye
ster
fila
men
ts,n
ot p
ut u
p fo
r re
tail
sale
018
1493
6.3
570
7.52
07.
52
7208
53Hotrolliron/steel,notcoil>600mmx3-4.75mm
013
5015
00
7.52
07.
52
7321
12Cookingappliances&platewarmersforliquidfuel,ironorsteel
01
250
07.
520
7.52
8301
30Lo
cks
of a
kin
d us
ed fo
r fu
rnitu
re o
f bas
e m
etal
030
8125
00
7.52
07.
52
8702
10D
iese
l pow
ered
bus
es w
ith a
sea
ting
capa
city
of >
nin
e pe
rson
s0
3871
118
.30
07.
520
7.52
1513
19C
ocon
ut (
copr
a) o
il&its
frac
tions
ref
ined
but
not
che
mic
ally
mod
ified
517
4965
20.8
3638
143
5.64
05.
64
1517
10Margarine,excludingliquidmargarine
018
349.
623
50
5.64
05.
64
1518
00Animal/vegfats&oils&fractboildoxid,etc,&indmix/prepnesex15.16
013
1215
.41
05.
640
5.64
3904
10P
olyv
inyl
chl
orid
e, n
ot m
ixed
with
any
oth
er s
ubst
ance
s0
2254
910
00
5.64
05.
64
8703
22A
utom
obile
s w
rec
ipro
catg
pis
ton
engi
ne d
ispl
acg
> 1
000
cc to
150
0 cc
019
6831
6063
05.
640
5.64
8703
33A
utom
obile
s w
ith d
iese
l eng
ine
disp
laci
ng m
ore
than
250
0 cc
078
409
9032
80
5.64
05.
64
8704
21D
iese
l pow
ered
truc
ks w
ith a
GV
W n
ot e
xcee
ding
five
tonn
es0
5344
660
4843
05.
640
5.64
9028
30E
lect
ricity
sup
ply,
pro
duct
ion
and
calib
ratin
g m
eter
s0
1707
257
05.
640
5.64
8418
21R
efrig
erat
ors,
hou
seho
ld ty
pe, c
ompr
essi
on-ty
pe0
3150
250
05.
641.
504
4.13
6
9609
10P
enci
ls a
nd c
rayo
ns, w
ith le
ads
enca
sed
in a
rig
id s
heat
h, n
es0
5643
202
05.
641.
504
4.13
6
1511
90P
alm
oil
and
its fr
actio
ns r
efin
ed b
ut n
ot c
hem
ical
ly m
odifi
ed77
1610
012
30.1
630
773.
760
3.76
1513
11C
ocon
ut (
copr
a) o
il cr
ude
011
5120
.911
51-1
63.
760
3.76
1515
50Sesameoil&itsfractionswhether/notrefind,butnotchemicallymodifid
08
9.6
80
3.76
03.
76
1517
90Ediblemx/prepofanimal/vegfats&oils/offractionsexhdNo15.16
208
6676
14.4
1499
198
3.76
03.
76
2208
30W
hisk
ies
062
290
570
03.
760
3.76
3901
10P
olye
thyl
ene
havi
ng a
spe
cific
gra
vity
of l
ess
than
0.9
40
2343
205
520
3.76
03.
76
3905
12Polyvinylacetate,inaqueousdispersion
057
920
470
3.76
03.
76

100
An Assessment of the Pakistan-Sri Lanka Free Trade Agreem
ent
SR
I LA
NK
A R
CA
AD
VA
NTA
GE
ITE
MS
WIT
H N
O C
ON
CE
SS
ION
HS
Co
de
Pro
duc
t La
bel
SL
Exp
ort
s 20
13 t
o
Pak
Pak
Wo
rld
Im
po
rts
2013
Tari
ff o
n S
LTr
ade
Po
tent
ial
Gro
wth
SL
RC
AP
ak R
CA
SL
RC
A
Ad
v.
3907
91P
olye
ster
s ne
s, u
nsat
urat
ed0
382
200
03.
760
3.76
3920
49P
late
s, s
heet
s, fi
lm, f
oil a
nd s
trip
, of n
on-c
ellu
lar
poly
mer
s of
vin
y0
9051
204
-13
3.76
03.
76
4013
20In
ner
tube
s of
rub
ber
for
bicy
cles
151
425
513
-13.
760
3.76
4811
49G
umm
ed o
r ad
hesi
ve p
aper
and
pap
erbo
ard,
sur
face
-col
oure
d, s
urfa
ce-
dec
015
350
20
3.76
03.
76
5401
10S
ewin
g th
read
of s
ynth
etic
fila
men
ts0
9742
6.3
734
-13.
760
3.76
5402
20Hightenacityyarn(o/tsewgthread),ofpolyesterfilaments,notputup
015
76.
315
30
3.76
03.
76
5515
13Wovenfabofpolyesterstaplefibresmixdw/wool/fineanimalhair,nes
256
115
02
3.76
03.
76
7208
40Hotrolliron/steel,notcoil>600mmreliefpattern
054
615
00
3.76
03.
76
7210
30Flatrolledi/nas,electrolyticallyzinccoated>600mm
023
869
14.5
00
3.76
03.
76
7216
31Sections,U,i/nas,nfwthanhotrolld,drawnorextrudd,hght80mmormore
015
5612
.51
03.
760
3.76
7216
33Sections,H,i/nas,nfwthanhotrolld,drawnorextrudd,hght80mmormore
045
4912
.58
03.
760
3.76
8415
83A
ir co
nd m
ach
nes,
not
inco
rpor
atin
g re
frige
ratin
g un
it0
3480
250
03.
760
3.76
8544
70O
ptic
al fi
bre
cabl
es, m
ade
up o
f ind
ivid
ually
she
athe
d fib
res
025
8025
10
3.76
03.
76
8704
22D
iese
l pow
erd
truc
ks w
a G
VW
exc
five
tonn
es b
ut n
ot e
xc tw
enty
tonn
es0
2825
830
500
3.76
03.
76
6217
10C
loth
ing
acce
ssor
ies
nes,
of t
extil
e m
ater
ials
, not
kni
tted
013
215
1321
05.
642.
256
3.38
4
2836
30S
odiu
m h
ydro
genc
arbo
nate
(so
dium
bic
arbo
nate
)0
1153
200
03.
760.
752
3.00
8
3920
20Fi
lm a
nd s
heet
etc
, non
-cel
lula
r et
c, o
f pol
ymer
s of
pro
pyle
ne1
1463
020
181
3.76
0.75
23.
008
3920
43P
late
s, s
heet
s, fi
lm, f
oil a
nd s
trip
, of n
on-c
ellu
lar
poly
mer
s of
vin
y0
2783
200
03.
760.
752
3.00
8
8415
10A
ir co
nditi
onin
g m
achi
nes
win
dow
or
wal
l typ
es, s
elf-c
onta
ined
018
576
21.3
810
3.76
0.75
23.
008
6910
90C
eram
ic s
inks
, was
h ba
sins
etc
& s
imila
r sa
nita
ry fi
xtur
es n
es0
114
2518
05.
643.
008
2.63
2
4011
40P
neum
atic
tire
s ne
w o
f rub
ber
for
mot
orcy
cles
2510
9625
352
213.
761.
504
2.25
6
8211
95H
andl
es fo
r kn
ives
, of b
ase
met
al0
325
00
3.76
1.50
42.
256
9021
0G
reen
tea
(not
ferm
ente
d) in
pac
kage
s no
t exc
eedi
ng 3
kg
239
1037
-14
1.88
01.
88
1514
99Higherucicacidrapeorcolzaoil"fixedoilwhichhasanerucicacid
00
12.5
00
1.88
01.
88
1515
19Li
nsee
d oi
l and
its
fract
ions
, ref
ined
but
not
che
mic
ally
mod
ified
09
10.3
20
1.88
01.
88
1515
29Maize(corn)oilanditsfractions,refinedbutnotchemicallymodified
030
724
.10
01.
880
1.88
2203
00B
eer
mad
e fro
m m
alt
047
390
473
01.
880
1.88
2208
40R
um a
nd ta
fia0
1590
150
1.88
01.
88
2403
10S
mok
g to
bacc
o,w
heth
er o
not
cnt
g to
bacc
o su
bstit
utes
in a
ny p
ropo
rtio
n0
221
2522
10
1.88
01.
88

101
An Assessment of the Pakistan-Sri Lanka Free Trade Agreem
ent
3209
90Paints&varnishesbasedonpolymers,dispersedinanaqueous
med
ium
,nes
030
7712
.511
40
1.88
01.
88
3214
10M
astic
s; p
aint
ers'
filli
ngs
022
6317
630
1.88
01.
88
3307
10P
re-s
have
, sha
ving
or
afte
r sh
avin
g pr
ep0
1031
12.5
193
01.
880
1.88
3307
20P
erso
nal d
eodo
rant
s &
ant
iper
spira
nts
027
1012
.528
00
1.88
01.
88
3814
00O
rgan
ic c
ompo
site
sol
vent
s&th
inne
rs,n
es;p
repa
rd p
aint
&va
rnis
h re
mov
ers
025
2920
108
01.
880
1.88
3901
20P
olye
thyl
ene
havi
ng a
spe
cific
gra
vity
of 0
.94
or m
ore
018
9484
50
01.
880
1.88
3906
90A
cryl
ic p
olym
ers
nes,
in p
rimar
y fo
rms
032
643
1249
01.
880
1.88
3909
20M
elam
ine
resi
ns0
1632
200
01.
880
1.88
3909
40P
heno
lic r
esin
s0
2553
200
01.
880
1.88
3912
31C
arbo
xym
ethy
lcel
lulo
se a
nd it
s sa
lts11
8888
1032
9-4
351.
880
1.88
3917
10S
ausa
ge c
asin
gs o
f har
dene
d pr
otei
n or
of c
ellu
losi
c m
ater
ials
046
49
00
1.88
01.
88
3917
23Tu
bes,
pip
es a
nd h
oses
, rig
id; o
f pol
yvin
yl c
hlor
ide
015
0812
.584
01.
880
1.88
3917
39Tu
bes,
pip
es a
nd h
oses
nes
, pla
stic
047
9612
.588
01.
880
1.88
3917
40Fi
tting
s, p
last
ic0
3269
2096
01.
880
1.88
3919
10S
elf-a
dhes
ive
plat
es,s
heet
s,fil
m e
tc,o
f pla
stic
in r
olls
098
5117
.581
6-1
1.88
01.
88
3919
90S
elf-a
dhes
ive
plat
es, s
heet
s, fi
lm e
tc, o
f pla
stic
nes
023
109
2022
00
1.88
01.
88
3920
30Fi
lm a
nd s
heet
etc
, non
-cel
lula
r et
c, o
f pol
ymer
s of
sty
rene
031
0520
80
1.88
01.
88
3920
51Fi
lm a
nd s
heet
etc
, non
-cel
lula
r et
c, o
f pol
ymet
hyl m
etha
cryl
ate
072
420
100
1.88
01.
88
3920
61Fi
lm a
nd s
heet
etc
, non
-cel
lula
r et
c, o
f pol
ycar
bona
tes
029
220
290
1.88
01.
88
3920
92Fi
lm a
nd s
heet
etc
, non
-cel
lula
r et
c, o
f pol
yam
ides
015
120
00
1.88
01.
88
3921
11Fi
lm a
nd s
heet
etc
, cel
lula
r of
pol
ymer
s of
sty
rene
010
620
650
1.88
01.
88
3921
19Fi
lm a
nd s
heet
etc
, cel
lula
r of
pla
stic
s ne
s0
5285
2057
00
1.88
01.
88
3921
90Fi
lm a
nd s
heet
etc
, nes
of p
last
ics
012
406
12.5
118
01.
880
1.88
3922
20La
vato
ry s
eats
and
cov
ers
of p
last
ics
013
620
00
1.88
01.
88
3923
10B
oxes
, cas
es, c
rate
s &
sim
ilar
artic
les
of p
last
ic0
5516
2072
00
1.88
01.
88
3923
29S
acks
and
bag
s (in
clud
ing
cone
s) o
f pla
stic
s ne
s0
8906
2514
340
1.88
01.
88
3923
40S
pool
s, c
ops,
bob
bins
and
sim
ilar
supp
orts
, of p
last
ics
035
6425
196
01.
880
1.88
3923
50S
topp
ers,
lids
, cap
s an
d ot
her
clos
ures
of p
last
ics
1293
2725
524
121.
880
1.88
3925
10R
eser
voirs
, tan
ks, v
ats
etc
of a
cap
acity
exc
eedi
ng 3
00 l,
of p
last
ics
056
525
190
1.88
01.
88
3926
90A
rtic
les
of p
last
ics
or o
f oth
er m
ater
ials
of N
os 3
9.01
to 3
9.14
nes
234
027
12.2
6529
-23
1.88
01.
88
4011
50P
neum
atic
tire
s ne
w o
f rub
ber
for
bicy
cles
9641
125
315
871.
880
1.88

102
An Assessment of the Pakistan-Sri Lanka Free Trade Agreem
ent
SR
I LA
NK
A R
CA
AD
VA
NTA
GE
ITE
MS
WIT
H N
O C
ON
CE
SS
ION
HS
Co
de
Pro
duc
t La
bel
SL
Exp
ort
s 20
13 t
o
Pak
Pak
Wo
rld
Im
po
rts
2013
Tari
ff o
n S
LTr
ade
Po
tent
ial
Gro
wth
SL
RC
AP
ak R
CA
SL
RC
A
Ad
v.
4011
99P
neum
atic
tire
s ne
w o
f rub
ber
nes
1628
3710
2821
-11.
880
1.88
4803
00Paper,household/sanitary,rollsofaw>36cm,sheetsoneside>36cm
020
3120
10
1.88
01.
88
5602
10N
eedl
eloo
m fe
lt an
d st
itch-
bond
ed fi
bre
fabr
ics
061
213
.511
30
1.88
01.
88
6204
42Womens/girlsdresses,ofcotton,notknitted
573
2568
51.
880
1.88
6212
10B
rass
iere
s an
d pa
rts
ther
eof,
of te
xtile
mat
eria
ls52
118
6825
1347
521
1.88
01.
88
7117
11Imitationjewellerycuff-links&studofbasemetalw/nplatdwprecmet
060
92
01.
880
1.88
7117
90Im
itatio
n je
wel
lery
nes
048
319
216
01.
880
1.88
7208
51Hotrolliron/steel,notcoil>600mmx>10mm
020
023
14.5
00
1.88
01.
88
7208
90Flatrolledprod,i/nas,notfurtherworkedthanhotrolled,nes
013
569
150
01.
880
1.88
7210
12Flatrolldprod,i/nas,platdorcoatdwithtin,>/=600mmwide,
018
629
150
01.
880
1.88
7216
21Sections,L,i/nas,nfwthanhotrolld,drawnorextrudd,ofaheight<80mm
050
202
01.
880
1.88
7216
32Sections,I,i/nas,nfwthanhotrolld,drawnorextrudd,hght80mmormore
015
8112
.50
01.
880
1.88
7216
40Sections,LorT,i/nas,nfwthnhotrolld,drawnorextruded,hght>/=80mm
026
412
.510
01.
880
1.88
7216
50Angles,shapes§,i/nas,nfwthnhotrolld/drawn/extrudd,hght>/=80mm
022
320
40
1.88
01.
88
7321
11Cookgappliances&platewarmersforgasfuelorbothgas&o/fuels,iors
084
125
430
01.
880
1.88
7607
20Fo
il,al
umin
ium
,bac
ked,
not e
xcee
ding
0.2
mm
thic
k ex
clud
ing
any
back
ing
281
1572
320
5328
11.
880
1.88
8301
40Lo
cks
of b
ase
met
al, n
es0
2209
22.5
100
1.88
01.
88
8301
50C
lasp
s an
d fra
mes
with
cla
sps,
inco
rpor
atin
g lo
cks,
of b
ase
met
al0
3220
00
1.88
01.
88
8402
11W
ater
tube
boi
lers
with
a s
team
pro
duct
ion
exce
edin
g 45
T pe
r ho
ur0
2665
716
.30
01.
880
1.88
8413
19P
umps
fitte
d or
des
igne
d to
be
fitte
d w
ith a
mea
surin
g de
vice
nes
090
2212
.51
01.
880
1.88
8413
70C
entr
ifuga
l pum
ps n
es0
2342
612
.570
01.
880
1.88
8418
50Refrigeratingorfreezingdisplaycounters,cabinets,show-cases,etc
060
225
602
01.
880
1.88
8418
61Compressiontyperefrigeratg/freezequipwhosecondensrsareheat
exch
016
48.
31
01.
880
1.88
8418
69Refrigeratingorfreezingequipmentnes
021
964
1551
01.
880
1.88
8418
99Partsofrefrigeratingorfreezingequipment,nes
032
290
1028
01.
880
1.88
8516
10E
lect
ric in
stan
tane
ous
or s
tora
ge w
ater
hea
ters
and
imm
ersi
on h
eate
rs0
133
201
01.
880
1.88
8516
40E
lect
ric s
moo
thin
g iro
ns0
1022
203
01.
880
1.88

103
An Assessment of the Pakistan-Sri Lanka Free Trade Agreem
ent
8516
60O
vens
;coo
kers
,coo
kg p
late
s,bo
ilg r
ings
,gril
lers
& r
oast
ers,
elec
,nes
014
7020
20
1.88
01.
88
8516
79E
lect
ro-th
erm
ic a
pplia
nces
, dom
estic
, nes
019
0022
.528
01.
880
1.88
8521
90V
ideo
rec
ordi
ng o
r re
prod
ucin
g ap
para
tus
nes
014
9420
20
1.88
01.
88
8539
22Fi
lam
ent l
amps
,of a
pow
er n
ot e
xcee
d 20
0 W
&fo
r a
volta
ge e
xcee
dg 1
00
V0
1639
200
01.
880
1.88
8544
49E
lect
ric c
ondu
ctor
s, fo
r a
volta
ge n
ot e
xcee
ding
80
V, n
es0
4295
620
1085
30
1.88
01.
88
8707
10B
odie
s fo
r pa
ssen
ger
carr
ying
veh
icle
s0
110
502
01.
880
1.88
8716
80W
heel
barr
ows,
han
d-ca
rts,
ric
ksha
ws
and
othe
r ha
nd p
rope
lled
vehi
cles
014
6615
10
1.88
01.
88
6206
90Womens/girlsblousesandshirts,ofothertextilematerials,notknitted
573
2568
55.
643.
761.
88
6209
90B
abie
s ga
rmen
ts&
clot
hg a
cces
sorie
s of
oth
text
ile m
ater
ials
,not
kni
ttd0
3907
2529
570
5.64
3.76
1.88
9024
0B
lack
tea
(fer
men
ted)
& p
artly
ferm
ente
d te
a in
pac
kage
s ex
ceed
g 3
kg21
8431
3146
1031
0962
-398
73.
762.
256
1.50
4
2836
20D
isod
ium
car
bona
te0
1710
610
10
3.76
2.25
61.
504
8029
0N
uts
edib
le, f
resh
or
drie
d, w
heth
er o
r no
t she
lled
or p
eele
d, n
es0
7294
77.
516
750
01.
880.
752
1.12
8
3401
20S
oap
nes
058
6825
105
01.
880.
752
1.12
8
3901
30E
thyl
ene-
viny
l ace
tate
cop
olym
ers
018
963
50
01.
880.
752
1.12
8
3903
11P
olys
tyre
ne, e
xpan
sibl
e0
1043
150
01.
880.
752
1.12
8
3917
29Tu
bes,
pip
es a
nd h
oses
, rig
id; o
f pla
stic
s ne
s0
480
203
01.
880.
752
1.12
8
3917
33Tu
bes,
pip
es a
nd h
oses
nes
, pla
stic
, not
rei
nfor
ced
etc,
with
fitti
ngs
081
200
01.
880.
752
1.12
8
3923
90A
rtic
les
for
the
conv
eyan
ce o
r pa
ckin
g of
goo
ds n
es, o
f pla
stic
s0
4842
2032
9-9
51.
880.
752
1.12
8
5407
52Wovenfabrics,>/=85%oftexturedpolyesterfilaments,dyed,nes
023
931
1515
80
1.88
0.75
21.
128
5509
51Yarnofpolyesterstaplefibresmixdw/artistaplefib,notputup,nes
014
919
6.3
00
1.88
0.75
21.
128
6204
49Womens/girlsdresses,ofothertextilematerials,notknitted
142
2541
11.
880.
752
1.12
8
6206
30Womens/girlsblousesandshirts,ofcotton,notknitted
1492
2578
141.
880.
752
1.12
8
6908
10Ti
les,
cub
es a
nd s
im0
160
2016
00
1.88
0.75
21.
128
6911
90H
ouse
hold
art
icle
s ne
s &
toile
t art
icle
s of
por
cela
in o
r ch
ina
012
6720
697
01.
880.
752
1.12
8
9404
10M
attr
ess
supp
orts
032
22.5
320
1.88
0.75
21.
128

An Assessment of the Pakistan-Sri Lanka Free Trade Agreem
ent
Text of Pakistan- Sri Lanka Free
Trade Agreement

105
An Assessment of the Pakistan-Sri Lanka Free Trade Agreem
ent
FREE TRADE AGREEMENT BETWEENTHE ISLAMIC REPUBLIC OF PAKISTAN AND
THE DEMOCRATIC SOCIALIST REPUBLIC OF SRI LANKA
The Government of the Islamic Republic of Pakistan and the Government of the Democratic Socialist Republic of Sri Lanka (hereinafter referred to individually as a “Contracting Party” and collectively as the “Contracting Parties”),
CONSIDERING that the expansion of their domestic markets, through commercial cooperation, isan importantprerequisite foraccelerating theirprocessesofeconomicdevelopment,
BEARING in mind the desire to promote mutually beneficial bilateral trade in goods and services,
CONVINCED of the need to establish and promote free trade arrangements for strengthening intra-regional economic cooperation and the development of national economies,
RECOGNIZING that progressive reductions and elimination of obstacles to bilateral trade through a bilateral free trade agreement (hereinafter referred to as “The AGREEMENT”) will contribute to the expansion of bilateral as well as world trade,
HAVE agreed as follows:
ARTICLE I - OBJECTIVES
The Contracting Parties shall establish a Free Trade Area in accordance with the provisions of this Agreement and in conformity with relevant provisions of the General Agreement on Tariffs and Trade, 1994.
2. The objectives of this Agreement are:
(i) To promote through the expansion of trade in goods and services the harmonious development of economic relations between Pakistan and Sri Lanka,
(ii) To provide fair conditions of competition for trade in goods and services between Pakistan and Sri Lanka,
(iii) To contribute in this way, by the removal of barriers to trade in goods and services, to
the harmonious development and expansion of bilateral as well as world trade,
ARTICLE II - DEFINITIONS
For the purpose of this Agreement:
1.“Tariffs” mean basic customs duties included in the national schedules of the Contracting Parties,
2. “Para tariffs” mean border charges and fees, other than “tariffs”, on foreign trade transactions of a tariff-like effect which are levied solely on imports, but not those indirect taxes and charges, which are levied in the same manner on like domestic products. Import charges corresponding to specific services rendered are not considered as para-tariff measures,

106
An Assessment of the Pakistan-Sri Lanka Free Trade Agreem
ent
3. “Non-tariff barriers” mean any measures, regulation, or practice, other than “tariffs” and “para-tariffs”, the effect of which is to restrict imports, or to significantly distort trade within the Contracting Parties,
4. “Products” mean all products including manufactures and commodities in their raw, semi-processed and processed forms.
5. “Preferential Treatment” means any concession or privilege granted under this Agreement by a Contracting Party through the elimination of tariffs on the movement of goods and services,
6. “The Committee” means the Joint Committee referred to in Article Xl,
7. “Serious Injury” means significant damage to domestic producers, of like or similar products, resulting from a substantial increase of preferential imports in situations which cause substantial losses in terms of earnings, production or employment unsustainable in the short term. The examination of the impact on the domestic industry concerned shall also include an evaluation of other relevant economic factors and indices having a bearing on the state of the domestic industry of that product,
8. “Threat of Serious Injury” means a situation in which a substantial increase of preferential imports is of a nature so as to cause “serious injury” to domestic products, and that such Injury, although not yet existing is clearly imminent. A determination of threat of serious injury shall be based on facts and not on mere allegation, conjecture, or remote or hypothetical possibility.
9. “Critical circumstances” mean the emergence of an exceptionalsituation where massive preferential imports are causing or threatening to cause “serious injury” difficult to repair and which calls for immediate action.
ARTICLE III - ELIMINATION OF TARIFFS, PARA TARIFFS
AND NON-TARIFF BARRIERS
1. The Contracting Parties hereby agree to establish a Free Trade Area for the purpose of free movement of goods and services between their countries through elimination of tariffs on the movement of goods and services in accordance with the provisions of Annexes A& B which shall form an integral part of this Agreement.
2. The Contracting Parties further agree to eliminate from the date this Agreement enters into force,allnon-tariffbarriers,andanyotherequivalentmeasureson themovementof goods and services, other than those imposed in accordance with Article IV of this Agreement.
3. The Contracting Parties also agree not to make any increase in the existing para tariffs, if any, or introduce new or additional para tariffs, without mutual consent.
4. In the implementation of this Agreement the Contracting Parties shall pay due regard to the principle of reciprocity.

107
An Assessment of the Pakistan-Sri Lanka Free Trade Agreem
ent
ARTICLE IV - GENERAL EXCEPTIONS
Nothing in this Agreement shall prevent a Contracting Party from taking action and adopting measures, which it considers necessary for the protection of its national security, the protection of public morals, the protection of human, animal or plant life and health, and the protection of articles of artistic, historic, and archaeological value, as is provided for in Article XX and XXI of the General Agreement on Tariff and Trade, 1994 and WTO Agreement on Application of Sanitary and Phytosanitary Measures.
ARTICLE V - NATIONAL TREATMENT
The Contracting Parties affirm their commitment to the principles enshrined in Article III of GATT 1994.
ARTICLE VI - STATE TRADING ENTERPRISES
1. Nothing in this Agreement shall be construed to prevent a Contracting Party from maintaining or establishing a state trading enterprise as understood in Article XVII of General Agreement on Tariff and Trade, 1994.
2. Each Contracting Party shall ensure that any state enterprise that it maintains or establishes acts in a manner that is not inconsistent with the obligations of that Contracting Party under this Agreement and accords nondiscriminatory treatment in the import from and export to the other Contracting Party.
ARTICLE VII - RULES OF ORIGIN
1. Products covered by the provisions of this Agreement shall be eligible for preferential treatment provided they satisfy the Rules of Origin as set out in Annex C to this Agreement which shall form an integral part of this Agreement.
2. For the development of specific sectors of the industry of either Contracting Party, lower value addition norms for the products manufactured or produced by those sectors may be considered through mutual negotiations.
ARTICLE VIII - SAFEGUARD MEASURES
1. If any product which is subject to preferential treatment under this Agreement is imported into the territory of a Contracting Party in such amanner or in such quantities as tocause or threaten to cause serious injury in the territory of that Contracting Party, such Contracting Party may, with prior consultations with the other Contracting Party, except in critical circumstances, suspend provisionally without discrimination, the preferential treatment accorded to that product under the Agreement.
2. When action has been taken by either Contracting Party in terms of paragraph 1 of this Article, it shall simultaneously notify the other Contracting Party and the Joint Committee established in terms of Article Xl. The Committee shall enter into consultations with the Contracting Parties and endeavour to reach mutually acceptable agreement to remedy the situation. If the consultations fail to resolve the issue within sixty days, the Contracting Partyaffectedbysuchactionshallhavetherighttowithdrawtheequivalentpreferentialtreatment in accordance with the WTO Agreement on Safeguards.

108
An Assessment of the Pakistan-Sri Lanka Free Trade Agreem
ent
ARTICLE IX - DOMESTIC LEGISLATION
The Contracting Parties shall be free to apply their domestic legislation to restrict imports in cases where prices are influenced by unfair trade practices like subsidies or dumping. Subsidies and dumping shall be understood to have the same meaning as in the General Agreement on Tariff and Trade 1994 and the relevant WTO Agreements.
ARTICLE X - BALANCE OF PAYMENT MEASURES
1. Notwithstanding the provisions of this Agreement, any Contracting Party, facing balance of payments difficulties, may suspend provisionally the preferential treatment as to the quantityandvalueofmerchandisepermittedtobeimportedundertheAgreement.Whensuch action has taken place, the Contracting Party, which initiates such action, shall simultaneously notify the other Contracting Party.
2. A Contracting Party, which takes action according to paragraph 1 of this Article, shall afford, uponrequestfromtheotherContractingParty,adequateopportunitiesforconsultationswith a view to preserving the stability of the preferential treatment provided under this Agreement.
ARTICLE Xl - JOINT COMMITTEE
1. A Joint Committee shall be established at Ministerial level. The Committee shall meet initially within six months of the entry into force of the Agreement and thereafter at least once a year to review the progress made in the implementation of this Agreement and to ensure that benefits of trade expansion emanating from this Agreement accrue to the ContractingPartiesequitably.ThemeetingsoftheJointCommitteewilltakeplace,totheextent possible, to coincide with the meetings of the Sri Lanka-Pakistan Joint Economic Commission.
2. TheCommitteemaysetupanyotherSub-Committeeand/orWorkingGroupforspecificpurposes as it may consider necessary.
3. In order to facilitate cooperation in customs matters, the Contracting Parties agree to establishaWorkingGrouponcustoms related issues includingharmonizationof tariffheadings.TheWorkingGroupshallmeetasoftenasrequiredandshallreporttotheJointCommittee on its deliberations.
4. (i)TheCommitteeshallaccordadequateopportunitiesforconsultationonrepresentationsmade by either Contacting Party with respect to any matter affecting the implementation of the Agreement.
(ii) The Committee shall adopt appropriate measures for settling any matter arising from such representations within 6 months of the representation having been made. Each Contracting Party shall implement such measures immediately.
5. The Committee shall nominate one apex Chamber of Trade and Industry in each country as the nodal chamber to represent the views of the trade and industry on matters relating to this Agreement.

109
An Assessment of the Pakistan-Sri Lanka Free Trade Agreem
ent
ARTICLE XII - CONSULTATIONS
1. Each Contracting Party shall accord sympathetic consideration to and shall afford adequateopportunityforconsultationsregardingsuchrepresentationsasmaybemadeby the other Contracting Party with respect to any matter affecting the operation of this Agreement.
2. TheCommitteesetupunderArticleXlmaymeetat therequestofaContractingPartyto consider any matter for which it has not been possible to find a satisfactory solution through consultations under paragraph 1 above.
ARTICLE XIII - SETTLEMENT OF DISPUTES
1. Any dispute that may arise between commercial entities of the Contracting Parties shall be referred for amicable settlement to the nodal Chambers. Such references shall, as far as possible, be settled through mutual consultations by the Chambers. In the event of an amicable solution not being found, the matter shall be referred to an Arbitration Tribunal for a binding decision. The Tribunal shall be constituted by the Joint Committee.
2. Any dispute between the Contracting Parties regarding the interpretation and application of this Agreement or any instrument adopted within its framework shall be amicably settled through negotiations failing which a notification may be made to the Committee by any one of the Contracting Parties for settlement of the dispute.
ARTICLE XIV - DURATION AND TERMINATION OF AGREEMENT
This Agreement shall remain in force until either Contracting Party terminates this Agreement by giving six months written notice to the other Contracting Party, through Diplomatic Channels, of its intention to terminate the Agreement.
ARTICLE XV - AMENDMENTS
The Agreement may be modified or amended through mutual agreement of the Contracting Parties. Proposals for such modifications or amendments shall be submitted to the Joint Committee and upon acceptance by the Joint Committee shall be approved in accordance with the applicable legal procedures of each Contracting Party. Such modifications or amendments shall become effective when confirmed through an exchange of diplomatic notes and shall constitute an integral part of the Agreement:
Provided, however, that in emergency situation proposals for modifications may be considered by the Contracting Parties and if agreed, given effect to through an exchange of diplomatic notes.
ARTICLE XVI – ANNEXES TO BE FINALISED
Annex A (Attachments I, II, III, and IV) containing the No Concession lists and tariff preferences to be granted by the Government of Pakistan and Annex B (Attachments I, II, and III) containing the No Concession list and tariff preferences to be granted by the Government of Sri Lanka andAnnexCcontainingtheRulesofOriginundertheAgreementshallbefinalizedwithinaperiod of 90 days of the signing of this Agreement.
All the Annexes shall become effective and shall constitute an integral part of the Agreement when the two Contracting Parties have confirmed through the exchange of Diplomatic Notes.

110
An Assessment of the Pakistan-Sri Lanka Free Trade Agreem
ent
ARTICLE XVII – ENTRY INTO FORCE
The Agreement shall enter into force on the 30th day after the Contracting Parties hereto have notified each other through Diplomatic Channels that their respective constitutional requirementsandprocedureshavebeencompletedinrespectofthisAgreementincludingthe Annexes under Article XVI.
InWitnessWhereoftheundersigned,dulyauthorizedtheretobytheirrespectiveGovernments,have signed this Agreement.
Done in duplicate at Colombo this 1st day of August, 2002 in two originals in the English language.

An Assessment of the Pakistan-Sri Lanka Free Trade Agreem
ent
Sectorial Perspective
regarding effects of the Pakistan-Sri
Lanka FTA

112
An Assessment of the Pakistan-Sri Lanka Free Trade Agreem
ent
Sectorial Perspective on Effects of Pakistan-Sri Lanka FTA
Shown ahead are the opinions of a Pakistani industry regarding the Pakistan-Sri Lanka FTA,and the perceived effects it has had or may in the future have on the local manufacturing industry. This submission (including, but not limited to interpretations, conclusions and recommendations) is solely reflective of the opinions of the company that has submitted the information, and does not reflect the findings of the report or the views of the Pakistan Business Council. The purpose of including this submission is to allow for a wider range of viewpoints.
Pakistan’s Automobile Industry
The Auto Sector of Pakistan has voiced concerns regarding potential PSFTA concessions allowingtheentryofsubsidizedIndianautoproductsintothePakistanimarketthroughSriLanka. They have noted that Sri Lanka has sought concessions along auto product tariff lines during a review of the PSFTA in 2008 within which it does not itself have export potential. However,investmentfromIndiainSriLankawouldallowbothSriLankaandIndiatocapitalizeon the requestedconcessions.Partssuchas IgnitionCoils (HSCode851130),CDIUnits(Old HS Code 853230 Revised HS Code 851180) and parts and accessories for motorcycles including mopeds (Old HS Code 871419, revised HS Code 871410, this HS Code includes 49localizedparts)etc.facebasiccustomdutyat35%andanadditionaldutyof15%.Thesesame parts, if imported from Sri Lanka, would face a duty of 5 % or less. The view of the auto sector is therefore that concessions to Sri Lanka on such products should be strictly blocked, since they would allow cheaper Indian products to harm a domestic value-adding industry.


8th Floor, Dawood Centre, M. T. Khan Road, Telephone: (+9221) 35630528-29 Fax: (+9221) 35630530Website: www.pbc.org.pk
Prin
ted
& D
esig
ned
at: T
he T
imes
Pre
ss (P
vt) L
td.