Embed Size (px)
Citation preview
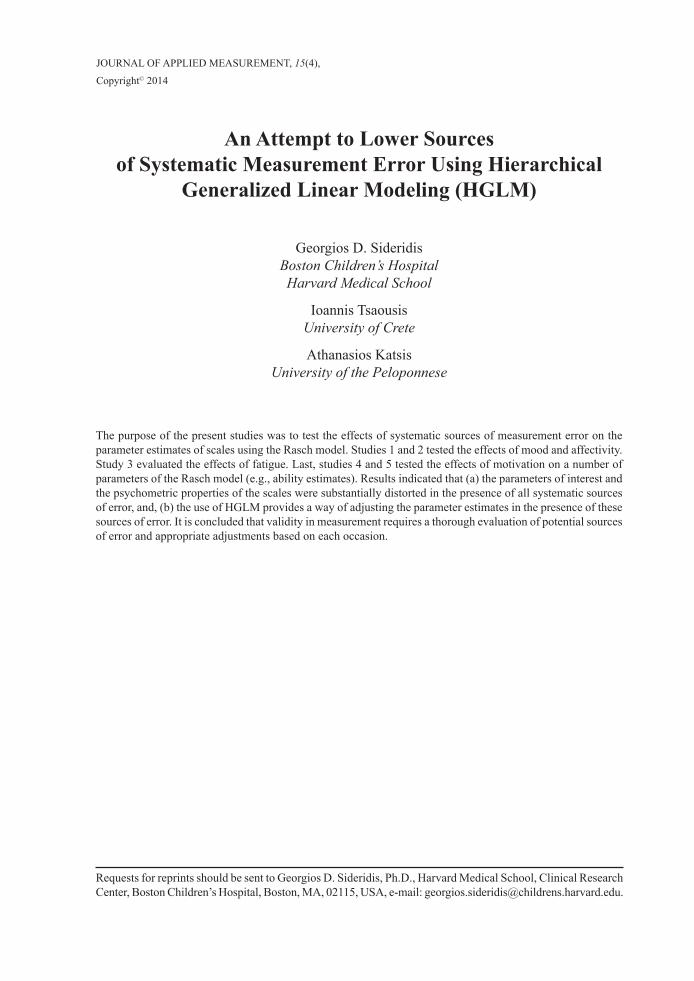
Requests for reprints should be sent to Georgios D. Sideridis, Ph.D., Harvard Medical School, Clinical Research Center, Boston Children’s Hospital, Boston, MA, 02115, USA, e-mail: [email protected].
An Attempt to Lower Sources of Systematic Measurement Error Using Hierarchical
Generalized Linear Modeling (HGLM)
Georgios D. SideridisBoston Children’s HospitalHarvard Medical School
Ioannis TsaousisUniversity of Crete
Athanasios KatsisUniversity of the Peloponnese
The purpose of the present studies was to test the effects of systematic sources of measurement error on the parameter estimates of scales using the Rasch model. Studies 1 and 2 tested the effects of mood and affectivity. Study 3 evaluated the effects of fatigue. Last, studies 4 and 5 tested the effects of motivation on a number of parameters of the Rasch model (e.g., ability estimates). Results indicated that (a) the parameters of interest and the psychometric properties of the scales were substantially distorted in the presence of all systematic sources of error, and, (b) the use of HGLM provides a way of adjusting the parameter estimates in the presence of these sources of error. It is concluded that validity in measurement requires a thorough evaluation of potential sources of error and appropriate adjustments based on each occasion.
JOURNAL OF APPLIED MEASUREMENT, 15(4),
Copyright© 2014
2 SideridiS, et al.
Attempts to improve the validity of our measurements are always worthwhile and should be a goal of measurement scientists. The present project attempts to shed light to an unexplored topic, the sources of systematic error that are due to the person or the testing situation and af-fect the validity of measurement (Guolo, 2008). Hutchison (2008) graphically described some of the confusion around the concept of measurement error. In his words: “The most usual treatment of the problem [of measurement error] is simply to ignore it, but where writers do make the attempt to allow for measurement error, there is often not a coherent description of how measurement error is conceptualized.” (p. 443) (brackets added). Furthermore, most of the approaches to its treat-ment involved the use of statistical means to a purely methodological problem (e.g., Guolo, 2008; Wang, 2008).
At any given time, an observed score is a function of the true score plus some form of er-ror of measurement. A true score in this model is defined as a hypothetical expected value of repeated measures on the same individual, and an error score is simply the difference between true and observed scores.Thus, for any individual i, who is measured on occasion j, his/her observed score Yij is a function of his/her true score T of that occasion, plus the error of measurement of that occasion:
Yij = Tij+eij
This model has been extensively described in classical measurement theory (Nunnaly and Bernstein, 1994) and has been termed True Score Theory. Based on the above equation, Yij = Tij if there is no error, that is the measurement instru-ment is valid and reliable. Unfortunately, how-ever, error does exist because our instruments express approximations of the true state of affairs at any given measurement. We hope that these measurements include some source of error that is distributed normally around the participants in our study and has no systematic form (Hutchison, 2008). If that’s the case then that effect is “washed out” as some participants would perform better than usually, others worse than their typical ability
levels, but overall this deviance is expected to be distributed at a rate of 50:50.
Although there is potentially a large number of measurement error sources (termed facets in generalizability theory; Cronbach, Gleser, Nanda, and Rajaratnam, 1972), research has shown that random and systematic errors are the main error types that significantly contribute to the observed variance of self-report measures (Schmidt, Le, and Ilies, 2003). Random error could be due to biology, instrumentation or the measurement protocol (Atkinson and Nevill, 1998) but is not the objective of the present paper. The present studies address systematic sources of error, which can seriously invalidate our measurements in the social sciences. Systematic error, or bias, is a difference between an observed value and the true value due to all causes other than sampling variability (Waller, Thompson, and Wenk 2000). Systematic error arises from a flaw in the mea-surement scheme which is repeated each time a measurement is made. In other words, if each time we administer a psychometric instrument we do the same thing wrong, our measurement will differ systematically from the correct result. Systematic error can arise from (a) the character-istics of the tool, (b) the measurement process, (c) the participants’ characteristics, and (d) combina-tions of the three main sources (Campbell and Russo, 2001). This type of error has been termed “transient error” (Becker, 2000). As Schmidt, Le, and Ilies (2003) stated: “Transient errors are defined as longitudinal variations in responses to measures that are produced by random varia-tions in respondents’ psychological states across time” (p. 206).
Systematic error introduces to our measure-ment a bias that has direction. That is, across repeated measurements of the same effect we observe that scores of the same participants drift in a specific direction (e.g., improve as if there is a learning effect). Some sources of systematic error are: a) errors in the quality of the measur-ing instrument: for example, if there is no correct answer in a multiple choice item all test takers will systematically get lower than the actual scores; b) inappropriate testing conditions: for
an attempt to lower SourceS of SyStematic meaSurement error 3
example, if there is loud traffic going by just outside of a classroom where students are tak-ing a test, this noise is liable to affect all of the children’s scores—in this case, systematically lowering them; c) bias of the experimenter: the experimenter might consistently read the in-structions of an instrument incorrectly, or might let knowledge of the expected value of a result influence the measurements, (d) can be just an expression of different response styles (Weijters, Geuens, and Schillewaert, 2010) or (e) can reflect an interaction of factors (Kim, and Seltzer, 2011). Although random errors can be handled more or less routinely, there is no prescribed way to find systematic errors. One must simply sit down and think about all of the possible sources of errors in a given measurement, and then do small experi-ments to see if these sources are active. Thus, the main objective in a psychological assessment pro-cedure is to reduce the systematic error to a value smaller than the random error (Taylor, 1997).
What do We Know about Sources of Measurement Error?
Several studies have attempted to explain sources of systematic error in measurement. For instance, Meddis (1972) identified a set of systematic sources of error variances related to response style in the measurement of emotions and affect (i.e., positive and negative affect). Particularly, he identified that asymmetries in response styles in various studies (e.g., the “don’t know” category was not in the middle of the scale but rather at the end or the fact that in many adjective rating scales the positive pole of the scale was overrepresented over the negative pole by including more points) were “...suppressing negative correlations and prejudicing the factor analysis against the discovery of bipolar factors” (p. 180). Furthermore, Russell (1979) argued that although previous research had shown evidence supporting the independence of positive and nega-tive affect dimensions, this evidence was biased due to systematic sources of error identified in many studies (e.g., the sample of emotion words included on scales often underrepresented one end of the scale, instructions often asked participants
to rate how they feel over extended periods of time, etc.). Notably, when these shortcomings in measurement were controlled, a strong primary bipolar factor was emerged.
Apart from low quality instrumentation or inappropriate measurement situations, person’s characteristics may also become potential sources of systematic error. Sitzia and Wood (1997) found that patient’s expectations about health care produced systematic error in the assess-ment of patients’ satisfaction about health care. Similarly, Sideridis, Padeliadu and Antoniou (2008) found that the validity of teacher ratings was related to characteristics of the teachers such as their gender and levels of experience teaching students in special education classrooms. By tak-ing into account those factors it was evident that systematic sources of bias were present in their decision to identify students as having learning disabilities. Other researchers have frequently presented raters and judges as bringing systematic error to measurement situations (e.g., Myford and Wolfe, 2003; 2004; Wolfe, 2004; Wolfe and Smith, 2007).
Coughlin (1990), in an attempt to clarify and estimate the extent of inaccurate recall in retrospective studies (i.e., recall bias), identified various sources of systematic error such as the interviewing technique and the study protocol, the time period involved, the degree of detail, but also sources that are related to the respondents’ characteristics, such as the significance of the recalling object to the respondent, its social ac-ceptance, and the motivation of the respondent. Harvill (1991) argued that when examinees are uninterested in doing well on the test, examiners cannot assume that the obtained scores are an accurate assessment of the examinees’ true abili-ties. Indeed, previous research has shown that, when respondents feel low intrinsic motivation to generate high-quality data and perceive the cognitive costs of performing the process neces-sary for high-quality answers as burdensome, they will compromise their standards, expend less energy, and therefore choose a satisficing response strategy (Krosnick, 1999).
4 SideridiS, et al.
Fatigue (mental or physical) is another potential source of systematic error in testing conditions. Fatigue can be defined as a psycho-physiological state resulting from sustained per-formance on cognitively demanding tasks and co-inciding with changes in motivation, information processing, and mood (Sanders, 1998). One of the main characteristics of fatigue is an increased resistance against further effort and a tendency to reduce task engagement. Bergersen and Hannay (2010) argue that when fatigue exists on the part of the examinees this has a systematic decrease in performance throughout a test, especially when achievement or abilities are examined. This situa-tion is called fatigue effect. From a psychometric point of view, fatigue effect could cause several concerns; for example, in case we are interested in calibrating item difficulty of a set of items (i.e., scale) and estimating person’s ability, the existence of fatigue effect might threaten the validity of the measure if substantive theory pre-sumes that the latent variable under investigation is supposed to be stable. Additionally, the fatigue effect will also affect item difficulty parameters; for example, if an item is consistently presented as the first item of a test, item difficulty will be biased upwards (the item will appear more dif-ficult than it really is). This may, further, limit the feasibility of computer adaptive testing, as item parameters are dependent on the order of when they appeared during the calibration of the test.
From the aforementioned it is evident that systematic error can seriously threaten the validity of a measurement procedure. Under this perspec-tive, the main aim of this paper is to examine to what extent some of the commonest sources of systematic error in testing situations affect test takers’ scores. The sources of error that will be discussed in the present paper are personal emotions/affect, fatigue, and motivation (or its lack of).
Why Are the Present Studies Important?
If there is systematic, rather than random, error due to e.g., anxiety, then if we test the abil-ity of a highly anxious group of individuals our
estimates of the item characteristics of a test will be invalid compared to their true propensities. That is, the results of the test would present a negative bias against that group of individuals. Invalid estimates will likely be associated with poor (erroneous) predictions. Let’s take a look at an example: Let’s suppose that competitiveness is associated with a maladaptive cognitive-moti-vational scheme that is associated with learned helplessness. This means that when highly com-petitive individuals are tested, later ability items that followed earlier failed items will likely lead to frustration, effort withdrawal and subsequent failure. Thus, for these individuals, performance at later items will not necessarily reflect their actual potential and ability levels as, due to their maladaptive motivational pattern, effort with-drawal will likely lead to failure. Thus, it would be very important to attempt to correct potential sources that confound actual ability levels. Such potential sources of systematic measurement error are motivation, fatigue, and emotionality during the testing situation, among others.
The purpose of the present paper is to suggest that situational factors during measurement likely affect our obtained estimates (item difficulties, person abilities, standard errors, etc.). More spe-cifically, the main hypothesis tested is that when fitting a Rasch model to an ability or achievement scale, results on item difficulties would be differ-ent if one accounts for individual differences on these systematic sources of error during adminis-tration. Thus, an objective of the present studies was to assess and compare the difficulty param-eters of a scale when the Rasch model was fitted to that scale in comparison to applying the same methodology while accounting for one source of systematic error (i.e., the presence of positive af-fectivity during testing). A secondary purpose of the present paper is to describe the methodology of accounting for systematic measurement error when estimating the psychometric properties of scales. This methodology of hierarchical gener-alized linear models (HGLM) has been recently presented in the literature (Beretvas, Meyers, and Rodriguez, 2005; Kamata, 2002; Robets and Herrington, 2005).
an attempt to lower SourceS of SyStematic meaSurement error 5
Predictions
It is predicted that emotions, fatigue and mo-tivation will affect the validity of item difficulties in a systematic way. The prediction of bias for poor motivation, fatigue and negative affectivity is the altering of item difficulties in the direction of increased difficulty (in other words, individuals would require higher levels of ability to correctly endorse these items in comparison to the absence of these sources). The opposite is predicted for individuals possessing positive affectivity and adaptive motivational patterns.
Description of Studies
In Study 1, 78 elementary school students were subjected to an experimental mood induction procedure in order to test the effects of emotional-ity on the validity of parameter estimates of an ability scale. In Study 2, 94 college students were subjected to 5 challenging geometric puzzle in a project examining emotions and motivation. In Study 3, 45 college students were experimentally subjected to a “fatigue” condition in order to test the effects of measurement error due to fatigue on the parameter estimates of an ability scale. Study 4 examined the effects of an experimental manipulation of motivation using 176 elementary school students whose achievement in reading comprehension was assessed under a success promotion versus failure avoidance condition. Last, in Study 5, 192 elementary school students were assessed on their spelling ability and their spelling scale was evaluated prior to and follow-ing a weighting of the items for the presence of self-efficacy.
Study 1
The purpose of Study 1 was to test the hy-pothesis that initial mood affects actual ability estimates during a testing situation. Specifically, it was predicted that positive affectivity would have a positive effect on parameter estimates and the opposite would be true for negative affectivity. In other words, it was expected that an ability test would be perceived as being easier if positive af-fectivity is high, compared to negative affectivity.
Method
Participants and Procedures
Participants were 78 elementary school stu-dents from urban public schools. There were 32 (41%) boys and 46 (59%) girls. The mean age was 11.51 years (S.D. 0.58). Thirty three (42.3%) were 5th graders and 45 (57.7%) were 6th graders.
Experimental Design
An experimental manipulation was imple-mented in order to induce positive and negative mood of the same participants on two different occasions. The positive mood condition involved the imagination and written description of a positive event that made a lasting impression and took place in the last month or so. The sad mood induction involved the same manipulation with a sad event.
Measures
Ability testing. The Children’s Colour Trail (CTT) test was used as a measure of skill. It as-sesses visual concentration with fine motor skills (Liorente, Williams, Satz and D΄Elia, 2003). It assesses the ability of young students to quickly connect consecutive numbers which are placed in various positions and in circles having differ-ent color. Thus, correct discrimination involves consecutive numbering but also color as well. Correct responses and error across two forms of difficulty along with near misses comprised the dependent variable.
Data Analysis
Rasch model description. The Rasch model for dichotomous items posits that an item can be evaluated for its quality based on two parameters: (a) the ability of the person (termed b) and, (b) the difficulty of the item (termed d). The mathemati-cal expressions which estimates the probability of person n solving item i correctly is as follows (Bond and Fox, 2001; Rasch, 1980; Wright and Stone, 1979):
( )( )
( )Probability 1 / , ,1
n i
b i
b d
ni ni n i b dex b d
e
-
-= =+
(1)
6 SideridiS, et al.
with Pni (xni = 1/Bn, Di) being the probability of person n getting item i correct given a person’s level of ability b, and an item’s difficulty level d. The term e = 2.71828. Thus, the probability of getting an item correct involves the natural logarithmic transformation of a person’s ability (bn) and an item’s level of difficulty (di). The way the Rasch model works, once we know the ability level of the participating person and the parameters of the item it is easy to estimate the probability of the correct response as if items are independent of each other (Wilson, 2005). This is also called the conditional independence assump-tion (Roberts and Herrington, 2005). Let’s try to understand how equation 1 works for an item of above average difficulty level (i.e., 1 on the logit scale) and a person of above average ability (i.e., also 1 on the logit scale, which is conceptually similar to the standard deviation metric). Equation 1 then becomes:
( )(1 1) (0)
(1 1) (0)
Probability 1 /1.0, 1.0
1 0.50,1 1 1 1
ni nix
e ee e
-
-
=
= = = =+ + +
and the probability for a person of above average ability (1) to solve an above average difficulty item (1) equals 50%. If we apply equation 1 to the same difficulty item but for a person of higher ability (i.e., 2.0 in the logit scale) then the prob-ability to solve that item equals 73%. Obviously, when the ability b of the person (e.g., 2 in the above case) exceeds that of the difficulty d of the item (e.g., 1) then the probability of getting the item correct would be above 50% and the opposite would be true with ability levels well below the difficulty of the item. In the studies that follow, evidence regarding the equivalence of the scale across the two occasions (due to the experimental manipulation) will be provided by use of the following estimates.
Presence of Differential Item Functioning (DIF). It was assessed as a means of evaluating bias due to the experimental manipulation. The formula applied in WINSTEPS is as following:
222
2 2 21 1 1
1/ ,L L L
j j
j j jj j j
D DSE SE SE= = =
æ öæ ö ÷ç ÷ç ÷ç ÷ ÷çc = -ç ÷ ÷çç ÷ ÷÷ççè ø ÷è øå å å (2)
Where a chi-square test evaluates the equivalence of all measures by estimating the difficulty esti-mates Di, with standard errors SEi, for measured items L of a test. The formula tests the hypothesis that the difficulty estimates of all measures L are statistically equivalent. Significant values for any of the measures L are suggestive of differential item functioning.
Comparison of Test characteristic curves (TCC). As Crocker and Algina (1986) stated, TCCs reflect regression curves for predicting observed scores (X) from latent trait scores (q). The difference between the two forms of the test will be evaluated in terms of location only (not on discrimination).
Comparison of test information functions (TIF) and item information functions (IIF). The test information function (TIF) provides informa-tion regarding the “precision” of a scale across levels of the latent trait (Morizot, Ainsworth, and Reise, 2007). Ideally a researcher would want to develop a scale that would have equal precision across the trait range, unless the purpose of the test is to identify subgroups of individuals with specific levels of performance on the latent trait. Thus the expected curve should resemble a uni-form distribution. The TIF involves the mean of the individual item’s information functions. The information function q of an item is estimated using a formula developed by Wilson (2005):
2
1( ) ,( )
Infsem
= (3)
where the information function of an item is es-timated by dividing one by the standard error of the ability estimate q. The mean of information functions for the whole scale is estimated using Lord’s (1980) formula:
1
( ) ( ),I
ii
Test Inf Infq q=
- =å (4)
which is estimated using the sum of the individual item information functions.
Comparison of standard errors of measure-ment (SEM). It represents the inverse square root of information at each and every point along the trait continuum (Robins, Fraley, and Krueger,
an attempt to lower SourceS of SyStematic meaSurement error 7
2007; Simms and Watson, 2007) and is estimated using the following formula:
1( ) ,( )
SE qI q
= (5)
where I(q) represents the test information func-tion and SE(q) representing the standard error of measurement.
Comparison of simple factor structures. Using a principal components analysis of the residuals, the factor loadings across the two so-lutions will be compared using Guadagnoli and Velicer’s (1991) congruence coefficient (RC) and software developed for that purpose (Hebbler, 1989). The congruence coefficient (RC) expresses factor similarity and requires that the comparisons involve “equivalent” studies. The coefficient ranges from −1 to 0 to +1 and as Jensen (1998) suggested values of .90 and above reflect a high degree of similarity. Additional guidelines on the interpretation of RC have been provided by Mac-Callum, Widaman, Zhang, and Hong, (1999) and are as follows: [.98 - 1.00 = excellent, .92 - .98 = good, .82 - .92 = borderline, .68 - .82 = poor, and below .68 = terrible.”
Results of Study 1
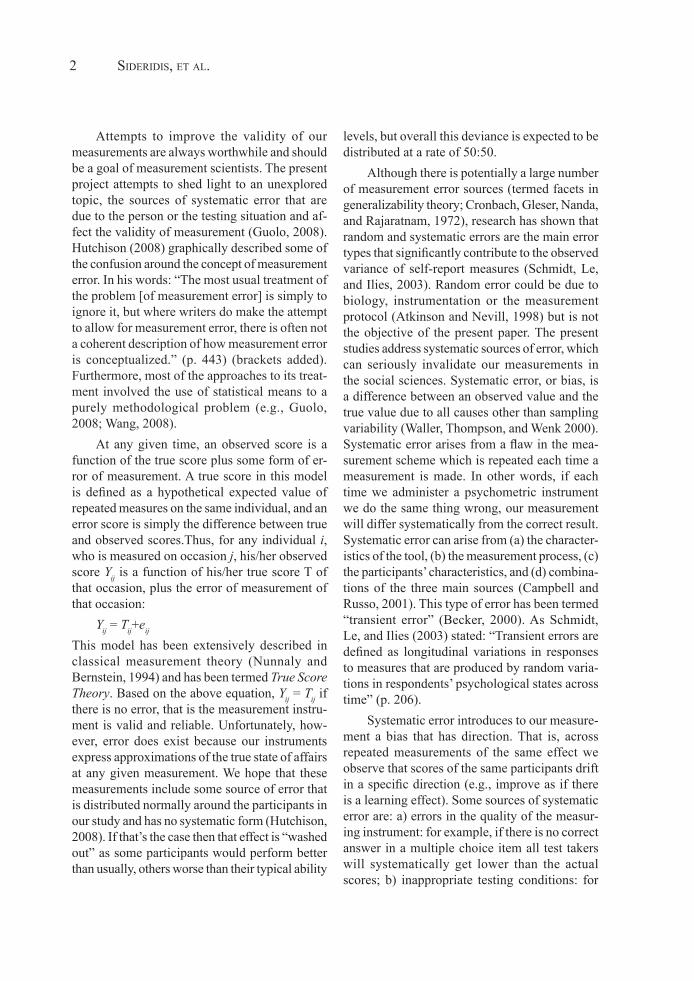
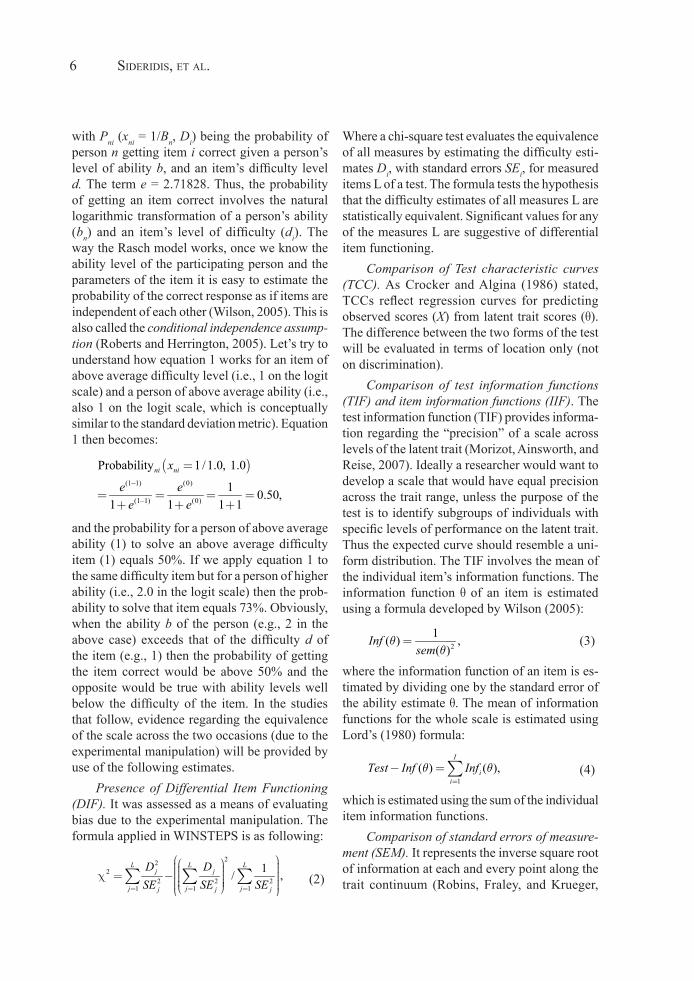
Figure 1 displays the test information func-tion (TIF) of the two forms of the test. It is obvious that the test is substantially different across the two conditions. In the happy mood condition that test was much more appropriate for individuals of low ability and the opposite was true for the sad condition, for which the test required substantially higher ability levels. When comparing the two
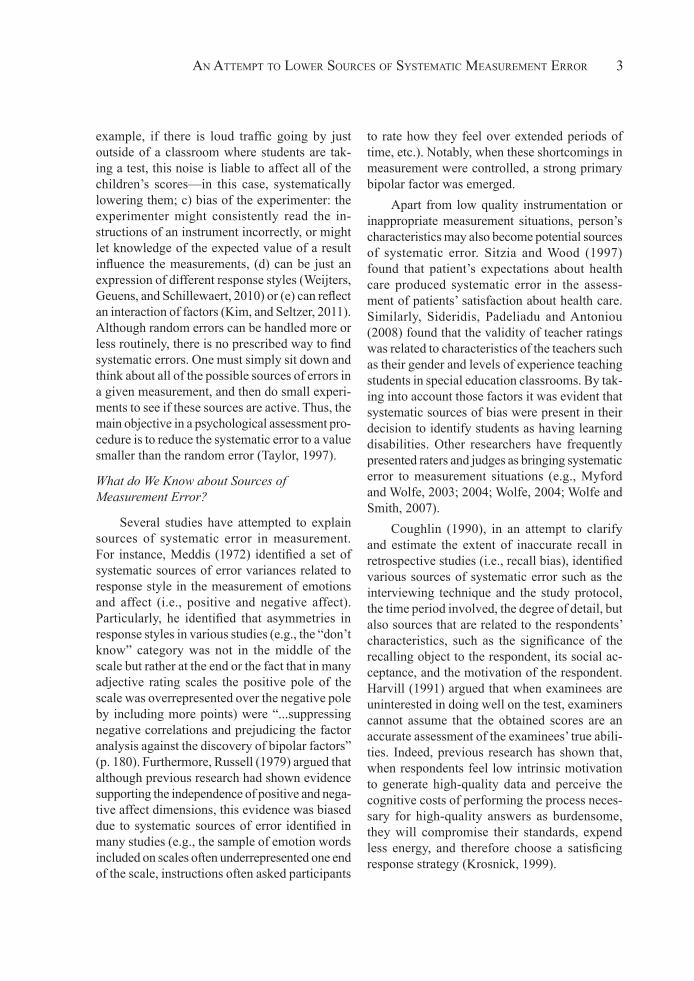
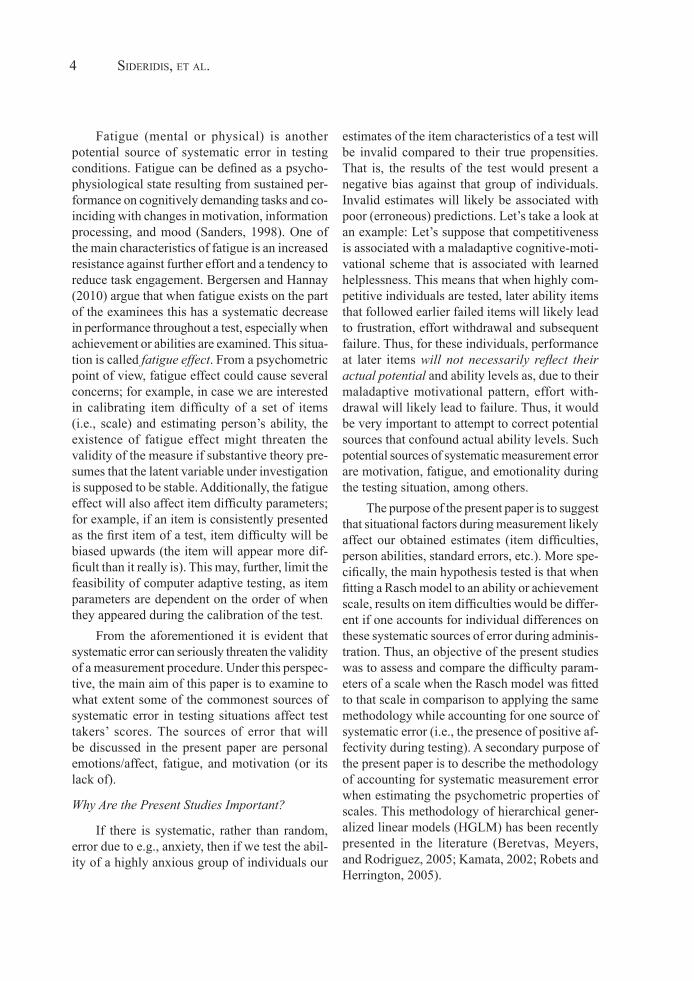
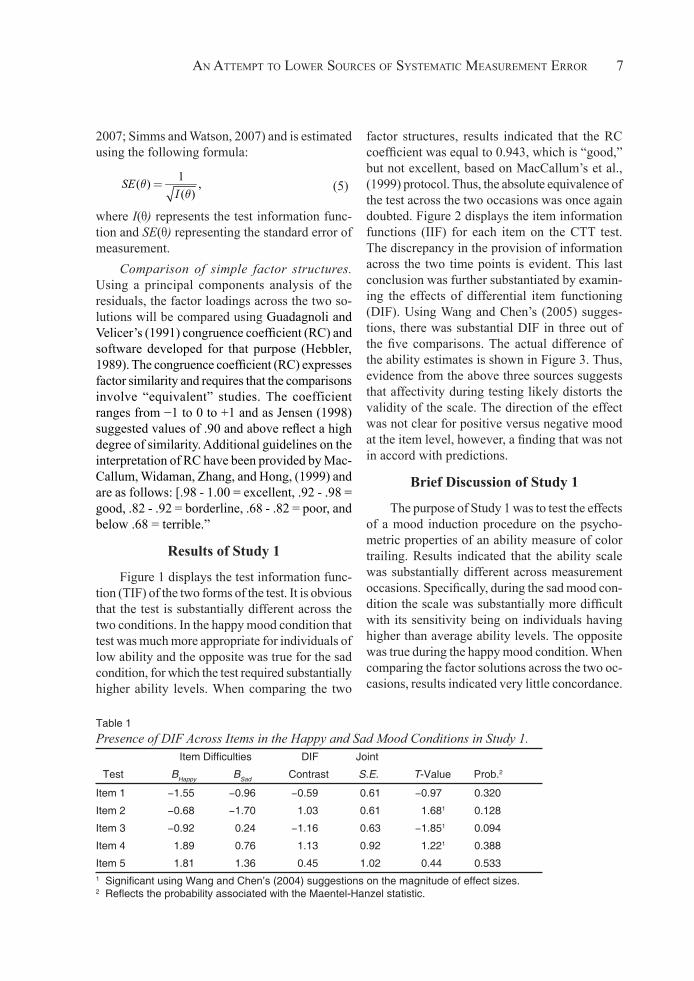
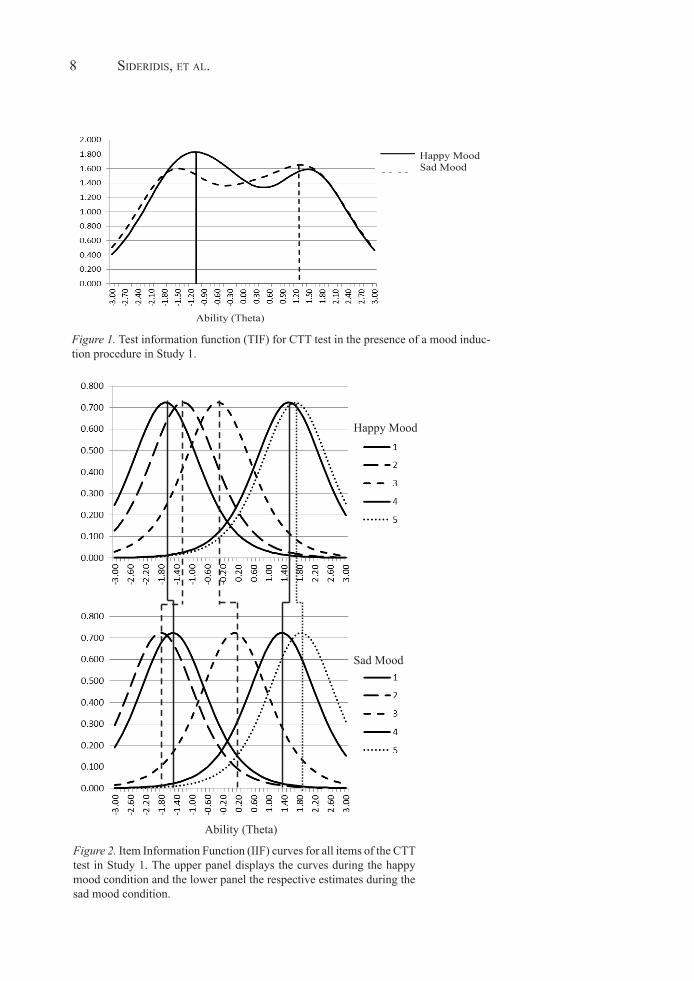
factor structures, results indicated that the RC coefficient was equal to 0.943, which is “good,” but not excellent, based on MacCallum’s et al., (1999) protocol. Thus, the absolute equivalence of the test across the two occasions was once again doubted. Figure 2 displays the item information functions (IIF) for each item on the CTT test. The discrepancy in the provision of information across the two time points is evident. This last conclusion was further substantiated by examin-ing the effects of differential item functioning (DIF). Using Wang and Chen’s (2005) sugges-tions, there was substantial DIF in three out of the five comparisons. The actual difference of the ability estimates is shown in Figure 3. Thus, evidence from the above three sources suggests that affectivity during testing likely distorts the validity of the scale. The direction of the effect was not clear for positive versus negative mood at the item level, however, a finding that was not in accord with predictions.
Brief Discussion of Study 1
The purpose of Study 1 was to test the effects of a mood induction procedure on the psycho-metric properties of an ability measure of color trailing. Results indicated that the ability scale was substantially different across measurement occasions. Specifically, during the sad mood con-dition the scale was substantially more difficult with its sensitivity being on individuals having higher than average ability levels. The opposite was true during the happy mood condition. When comparing the factor solutions across the two oc-casions, results indicated very little concordance.
Table 1Presence of DIF Across Items in the Happy and Sad Mood Conditions in Study 1. ItemDifficulties DIF Joint
Test BHappy BSad Contrast S.E. T-Value Prob.2
Item1 −1.55 −0.96 −0.59 0.61 −0.97 0.320
Item2 −0.68 −1.70 1.03 0.61 1.681 0.128
Item3 −0.92 0.24 −1.16 0.63 −1.851 0.094
Item4 1.89 0.76 1.13 0.92 1.221 0.388
Item5 1.81 1.36 0.45 1.02 0.44 0.5331SignificantusingWangandChen’s(2004)suggestionsonthemagnitudeofeffectsizes.2ReflectstheprobabilityassociatedwiththeMaentel-Hanzelstatistic.
8 SideridiS, et al.An Attempt to Lower Sources of Systematic Measurement Error 2
Ability (Theta)Figure 1. Test information function (TIF) for CTT test in the presence of a mood induction
procedure in Study 1.
Happy MoodSad Mood- - - -
Figure 1. Test information function (TIF) for CTT test in the presence of a mood induc-tion procedure in Study 1.
Figure 2. Item Information Function (IIF) curves for all items of the CTT test in Study 1. The upper panel displays the curves during the happy mood condition and the lower panel the respective estimates during the sad mood condition.
An Attempt to Lower Sources of Systematic Measurement Error 3
Ability (Theta)
Figure 2. Item Information Function (IIF) curves for all items of the CTT test in Study 1. The
upper panel displays the curves during the happy mood condition and the lower panel the respective
estimates during the sad mood condition.
Happy Mood
Sad Mood
an attempt to lower SourceS of SyStematic meaSurement error 9
It is concluded that the mood effects were sub-stantial across the two occasions. The results from this study provide further support to findings from previous studies, showing that positive affect as compared to negative or neutral affect has a posi-tive influence on a broad range of cognitive pro-cesses, increasing and enhancing verbal fluency (Philips, Bull, Adams, and Fraser, 2002), problem solving (Greene and Noice, 1988) and cognitive flexibility (Isen, Niedenthal, and Cantor, 1992). Study 2 was designed to replicate and extend the findings of Study 1 by testing the effects of sad mood on a measure of cognitive ability.
Study 2
The purpose of Study 2 was to estimate the effects of affectivity on the parameter estimates of the Rasch model using self-reported negative af-fect. Additionally, Study 2 presents a “treatment” to the problem of systematic measurement error by “correcting” the traditional Rasch estimates of ability using Hierarchical Generalized Linear Modeling (HGLM, Kamata, 2002).
Method of Study 2
Participants and Procedures
Participants were 94 college students who participated in the study in response for extra
credit. There were 36 males and 61 females. The mean age was 21.356 years with an S.D. equal to 2.565. The students were informed that their participation was voluntary and that they could withdraw their participation at any time during the process. Also, it was explicitly stated that responses and findings would by no means be linked (anonymity).
Measures
A series of 4 Chinese Tangram, almost in-solvable puzzle were used with the student college sample. They represented a very difficult task that was used to challenge the students in order to evaluate the effects of different motivational orientations. In the present study, the variables related to affectivity will be implemented. Specifi-cally, the negative affectivity scale included 10 adjectives such as anxious, stressed, frustrated, etc., from the Positive and Negative Affect Sched-ule (PANAS) of Watson and Clark (1998).
Data Analysis
A hierarchical generalized linear model (HGLM) was fit to the data by use of the Bernoulli function as shown below. This model is equivalent to the Rasch model (Beretvas and Kamata, 2007; Kamata, 2002). In equation format it is described below using level-1 (item) and level-2 (person)
Figure 3. Differential Item Functioning (DIF) of items of CTT in Study 1.
An Attempt to Lower Sources of Systematic Measurement Error 4
-2
-1.5
-1
-0.5
0
0.5
1
1.5
2
2.5
DIF
Mea
sure
(diff
.)
puzzle
1
2
Happy Mood
Sad Mood
Figur
e 3. Differential Item Functioning (DIF) of items of CTT in Study 1.
10 SideridiS, et al.
equations. For the specificities in setting up HGLM models using various software see Rob-erts and Herrington (2005) and Kamata (2002).
Specifically, level-1 describes the log odds of the probability pij that person j will obtain a score of one versus zero on item i (among a set of k items). Level-1 (Bernoulli) Model:
0 1 1 2 2 ( 1) ( 1)log( ) ,1
ijj j j j j k j k j
ij
pX X X
pb b b b - -= + + +
- (6)
where Xqij is the predictor of item q for person j responding with a value of one (compared to zero) on item i. The intercept item reflects the estimate of the reference item (that is actually not included in the estimation as in dummy regression) but also reflects the overall effect (Beretvas and Kamata, 2007). Due to dummy coding the log odds of a correct response for any item (and person j) is estimated as follows:
0log( ) .1
qjj qj
qj
pp
b b= +-
(7)
Level-2 model expresses person estimates, which in the context of the Rasch model are estimated as fixed across individuals, thus, reflecting item difficulties in Rasch modeling terms:1
0 00 0
1 10
( 1) ( 1)0
u
.
.
j j
j
jk k
b g
b g
b g- -
ì = +ïïïï =ïïïïíïïïïïï =ïïî .
Thus, pij is the probability that person j will answer item i correctly and Xij is the ith dummy variable for participant j. The term b0j reflects the intercept of the model and b1j the coefficient of variable X1. The random effect u0j of the intercept is expected to be normally distributed (with a mean of zero and variance equal to t). Last as Kamata (2002) pointed out, when this two-level model is applied to the data of person j for a
1 The fact that the intercept is modeled as random (inclu-sion of term u0j) suggests that the intercept term reflects Rasch based examinee ability levels bj.
specific item i, the probability of a participant j responding correctly is expressed using the fol-lowing equation:
{ }0 0 00
11 exp ( )ij
j
pu i
=é ù+ - - -g -gë û
. (8)
Ιtem difficulties involve the following esti-mation: (–gi0 –g00) whereas the term u0j reflects participants’ ability estimates. Subsequently, the following model was implemented in order to account for levels in negative affectivity dur-ing administration. The HGLM model, which is equivalent to the Rasch model, for the 4 puzzle measure was the following in mixed form:
hij = b0 + b1 * Item1ij + b2 * Item2ij + b3 * Item3ij + b4 * Item4ij + u0j, (9)
where
hij = log( )1
ij
ij
pp-
, (10)
and that model was modified, as shown below, in order to account for individual differences in negative affectivity during the testing situation.
hij = g00 + g01 * Negative Affectj + g10 * Item1ij + g20 * Item2ij + g30 * Item3ij + g40 * Item4ij + u0j , (11)
Thus, the term g01 * Negative Affect reflects the effects of motivation on the intercept (and subsequently the estimation of item difficulties.
Bias analysis. It involved comparisons of TCCs using the Signed Area Index (SAI, Raju, 1990; Wolfe and Smith, 2007) which is estimated as shown below:
2 2,Reference Focal
SAI
Reference Focal
ZSE SEd d
d d
- -
-=
+ (12)
Where the d values reflect a pair of item difficulty estimates to be compared and SE their respective standard errors.
an attempt to lower SourceS of SyStematic meaSurement error 11
Results
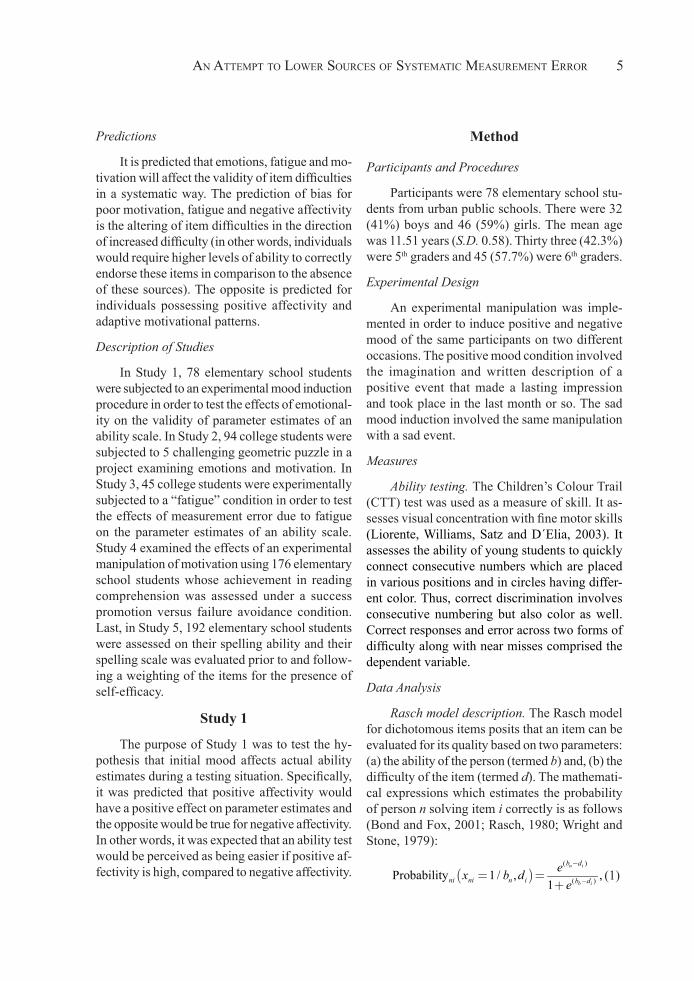
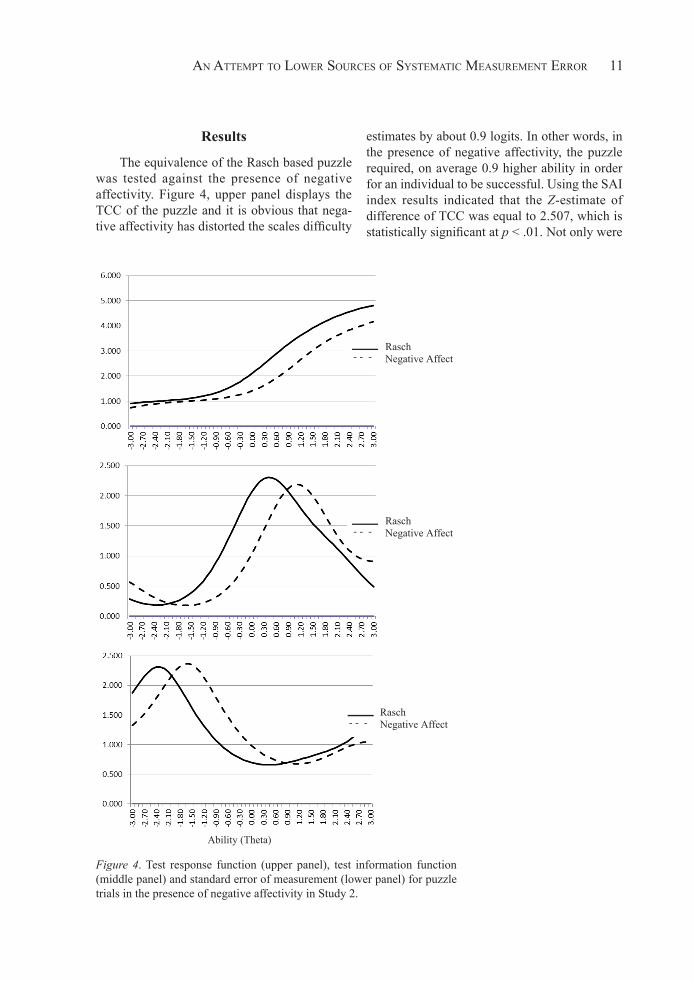
The equivalence of the Rasch based puzzle was tested against the presence of negative affectivity. Figure 4, upper panel displays the TCC of the puzzle and it is obvious that nega-tive affectivity has distorted the scales difficulty
estimates by about 0.9 logits. In other words, in the presence of negative affectivity, the puzzle required, on average 0.9 higher ability in order for an individual to be successful. Using the SAI index results indicated that the Z-estimate of difference of TCC was equal to 2.507, which is statistically significant at p < .01. Not only were
An Attempt to Lower Sources of Systematic Measurement Error 5
Ability (Theta)Figure 4. Test response function (upper panel), test information function (middle panel) and standard
error of measurement (lower panel) for puzzle trials in the presence of negative affectivity in Study 2.
- - -
- - -
- - -
RaschNegative Affect
RaschNegative Affect
RaschNegative Affect
Figure 4. Test response function (upper panel), test information function (middle panel) and standard error of measurement (lower panel) for puzzle trials in the presence of negative affectivity in Study 2.
12 SideridiS, et al.
the effects of negative affectivity substantial at the level of TCC but also the item level as the effect of negative affectivity on the intercept of ability was equal to 0.739 [t(92) = 2.330, p = .02]. This effect has been evident in both the TIF (Figure 4, middle panel) but also the scale’s standard error of measurement (SEM, see Figure 4, lower panel). All the information corroborate with the idea that when individuals enter the testing situation with one standardized unit above the mean in negative affectivity, the respective ability required to be successful increases by approximately 1 logit.
Brief Discussion of Study 2
The purpose of Study 2 was to estimate the effects of affectivity on the parameter estimates of the Rasch model using self-reported negative affect. Results suggested that the effects of nega-tive affectivity in ability testing were devastating and warrant further attention. The application of the HGLM procedure suggested that initial Rasch ability estimates need to be modified for the presence of systematic sources of error such as negative affectivity. The results from this analy-sis are consistent with previous research, which suggest that negative affectivity is negatively related to cognitive functioning. For example, Samuel (1980) provided evidence suggesting that IQ scores are negatively correlated with trait anxiety and sadness (i.e., typical NA measures). Furthermore, Moutafi, Furnham, and Tsaousis (2006) found that state anxiety (e.g., anxiety generated during an assessment procedure) medi-ates the relationship between neuroticism—a key component of negative affectivity—and intelli-gence. Study 3 attempted to evaluate the effects of fatigue on the psychometric characteristics of an ability scale using an experimental paradigm.
Study 3
Thus, the purpose of Study 3 was to extend the findings of Studies 1 and 2 by assessing the effects of fatigue on ability testing. Fatigue has long been suspected of distorting the estimates of scales (Hammer and Lindmark, 2003), although both the magnitude of the effect and “treatments” of the problem have not been discussed exten-
sively in the literature, with the exception being the fatigue of raters (see Wolfe and Smith, 2007).
Method of Study 3
Participants and Procedures
Participants were 75 university students majoring psychology who completed measures of ability (IQ) across two occasions. Students were unaware of the purposes of the study and participated voluntarily in response of extra credit. Completed data were available for 45 of them. There were 6 females and 39 males. The mean age was 19.42 years (S.D. = 2,251). At the end of the data collection students were thanked, debriefed and were released.
Experimental Design
Fatigue was tested experimentally by ad-ministering the Raven matrices across two dif-ferent occasions. In the non-fatigue condition the matrices were given first, in the absence of any interference with the students coming at a specified appointment during the morning hours (but not very early). In the fatigue condition the matrices were given following completion of (a) a brief personality scale, (b) two measures of anxiety, (c) a large measure of personality, (d) a test of perception and, last, (e) the Raven matrices. Completion of the matrices took place approxi-mately 3.5 hours following the first measurement. Anecdotal evidence suggested that the students were extremely tired at the end of the assessment procedure as no brake was possible during testing. In the current study, the effects of fatigue were tested for the 5th form of the Raven matrices, Form E, which is the most difficult one. Thus, we expected that the effects of fatigue would be more pronounced with the more difficult test of ability and the expectation was that fatigue would be detrimental to actual ability levels.
Measures
Raven matrices. The Standard Progressive Matrices (SPM) were implemented. The scales measure non-verbal intelligence and involve five 12-item scales (A through E). In the present study,
an attempt to lower SourceS of SyStematic meaSurement error 13
the last and most difficult subscale (Subscale E) was implemented as it was expected that the ef-fects of fatigue would be maximized on the most difficult subscale.
Data Analysis
The Rasch model was implemented as de-scribed above.
Results of Study 3
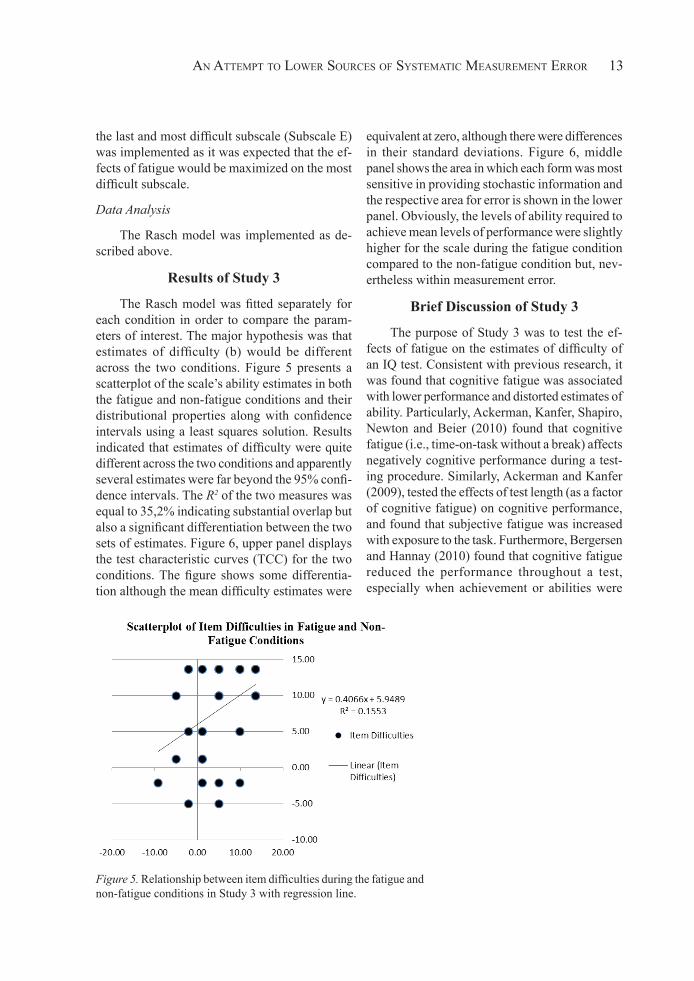
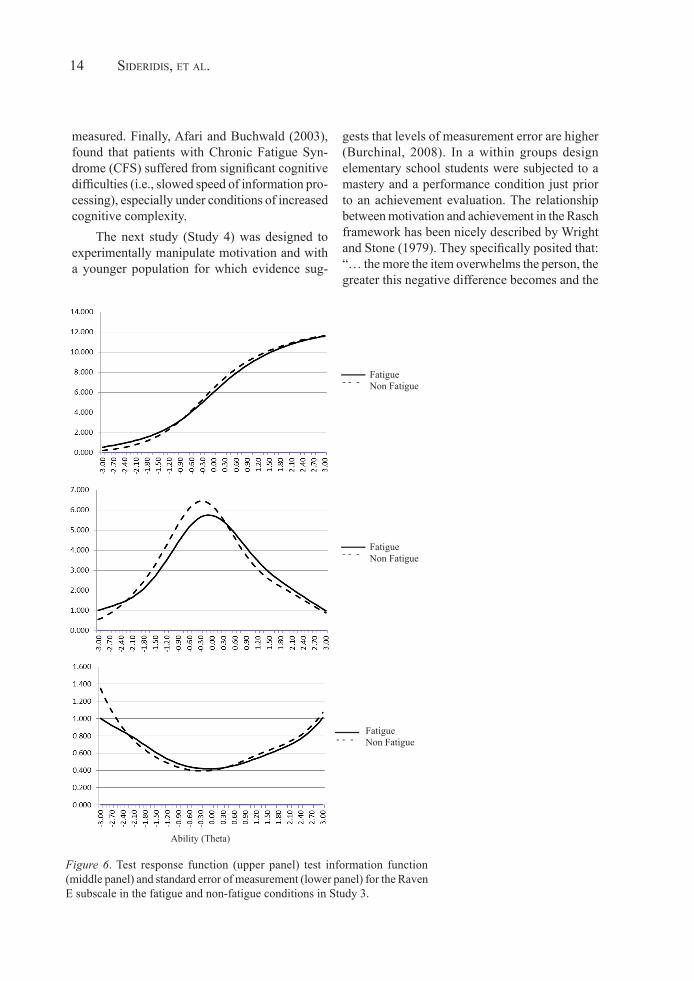
The Rasch model was fitted separately for each condition in order to compare the param-eters of interest. The major hypothesis was that estimates of difficulty (b) would be different across the two conditions. Figure 5 presents a scatterplot of the scale’s ability estimates in both the fatigue and non-fatigue conditions and their distributional properties along with confidence intervals using a least squares solution. Results indicated that estimates of difficulty were quite different across the two conditions and apparently several estimates were far beyond the 95% confi-dence intervals. The R2 of the two measures was equal to 35,2% indicating substantial overlap but also a significant differentiation between the two sets of estimates. Figure 6, upper panel displays the test characteristic curves (TCC) for the two conditions. The figure shows some differentia-tion although the mean difficulty estimates were
equivalent at zero, although there were differences in their standard deviations. Figure 6, middle panel shows the area in which each form was most sensitive in providing stochastic information and the respective area for error is shown in the lower panel. Obviously, the levels of ability required to achieve mean levels of performance were slightly higher for the scale during the fatigue condition compared to the non-fatigue condition but, nev-ertheless within measurement error.
Brief Discussion of Study 3
The purpose of Study 3 was to test the ef-fects of fatigue on the estimates of difficulty of an IQ test. Consistent with previous research, it was found that cognitive fatigue was associated with lower performance and distorted estimates of ability. Particularly, Ackerman, Kanfer, Shapiro, Newton and Beier (2010) found that cognitive fatigue (i.e., time-on-task without a break) affects negatively cognitive performance during a test-ing procedure. Similarly, Ackerman and Kanfer (2009), tested the effects of test length (as a factor of cognitive fatigue) on cognitive performance, and found that subjective fatigue was increased with exposure to the task. Furthermore, Bergersen and Hannay (2010) found that cognitive fatigue reduced the performance throughout a test, especially when achievement or abilities were An Attempt to Lower Sources of Systematic Measurement Error 6
Figure 5. Relationship between item difficulties during the fatigue and non-fatigue conditions in Study 3
with regression line.
Figure 5. Relationship between item difficulties during the fatigue and non-fatigue conditions in Study 3 with regression line.
14 SideridiS, et al.
measured. Finally, Afari and Buchwald (2003), found that patients with Chronic Fatigue Syn-drome (CFS) suffered from significant cognitive difficulties (i.e., slowed speed of information pro-cessing), especially under conditions of increased cognitive complexity.
The next study (Study 4) was designed to experimentally manipulate motivation and with a younger population for which evidence sug-
gests that levels of measurement error are higher (Burchinal, 2008). In a within groups design elementary school students were subjected to a mastery and a performance condition just prior to an achievement evaluation. The relationship between motivation and achievement in the Rasch framework has been nicely described by Wright and Stone (1979). They specifically posited that: “… the more the item overwhelms the person, the greater this negative difference becomes and the An Attempt to Lower Sources of Systematic Measurement Error 7
Ability (Theta)Figure 6. Test response function (upper panel) test information function (middle panel) and standard error of measurement (lower panel) for the Raven E subscale in the fatigue and non-fatigue conditions in Study 3.
- - -
- - -
- - -
FatigueNon Fatigue
FatigueNon Fatigue
FatigueNon Fatigue
Figure 6. Test response function (upper panel) test information function (middle panel) and standard error of measurement (lower panel) for the Raven E subscale in the fatigue and non-fatigue conditions in Study 3.
an attempt to lower SourceS of SyStematic meaSurement error 15
nearer the probability of success comes to zero” (p. 16). Thus, in their terms, failing an item is a function of both the ability of the person and the effect (motivational) that previous successes or failures bring. If a person has failed early items, then a subsequent, otherwise manageable item may be failed because of learned helplessness and motivational withdrawal. Thus, investigating the effects of motivation on the ability estimates of a scale is imperative.
Study 4
The theoretical framework of the study originated in achievement goal theory and the achievement goals of mastery and performance approach (Ames, 1992; Dweck, 1986; Dweck and Leggett, 1988). Briefly, mastery goals are adopted by individuals who target at learning and improv-ing whereas performance goals are adopted by individuals who target to prove their competence over others. Meta analyses on the topic suggested that mastery goals relate with intrinsic motivation but not directly with achievement whereas per-formance goals exert direct and positive effects with achievement, although through ambiguous emotional pathways (Elliot, McGregor, and Gable, 1999; Elliot and Moller, 2003; Pekrun, Elliot and Maier, 2005). The purpose of Study 4 was to evaluate the effects of motivation on a reading scale’s psychometric characteristics.
Method of Study 4
Participants and Procedures
Participants were 176 elementary school stu-dents from public elementary schools in an urban area. There were 86 boys and 90 girls all belonged to grades 4 through 6. Students were informed of the voluntary nature of their participation and the fact that they could withdraw their participation at any time. The whole process was presented as a game, as described below.
Experimental Design
Just prior to the reading comprehension test students were subjected to the experimental manipulation using a within groups design (i.e.,
all participants were subjected to all levels of the independent variable). The manipulation involved induction of a mastery goal or a performance goal just prior to a test on reading comprehen-sion. The same test was administered across the two occasions with a time span of one week. However, students were randomly assigned to the experimental conditions in order to avoid history effects (one important threat to internal validity). In the mastery goal condition students were informed that they were going to “play a game” with reading some stories. The goal of the activity was to attempt to understand the text and they could seek help at any time from the instruc-tor when answering the questions. There was no preset time limit and no pressure to perform. In the performance goal condition students were told that their goal was to perform better than other students, there was a time limit and public post-ing of performance evaluations along with posi-tive reinforcement for good performance. These descriptions of the two goal conditions were delivered just prior to the assessments of reading comprehension so students had knowledge of the specific consequences of their involvement with reading text.
Measures
A standardized measure of reading com-prehension was used (Padeliadu and Antoniou, 2008). It involved seven stories from which students had to answer a series of questions of increased difficulty. The stories were different for different grades and of increased difficulty for older students.
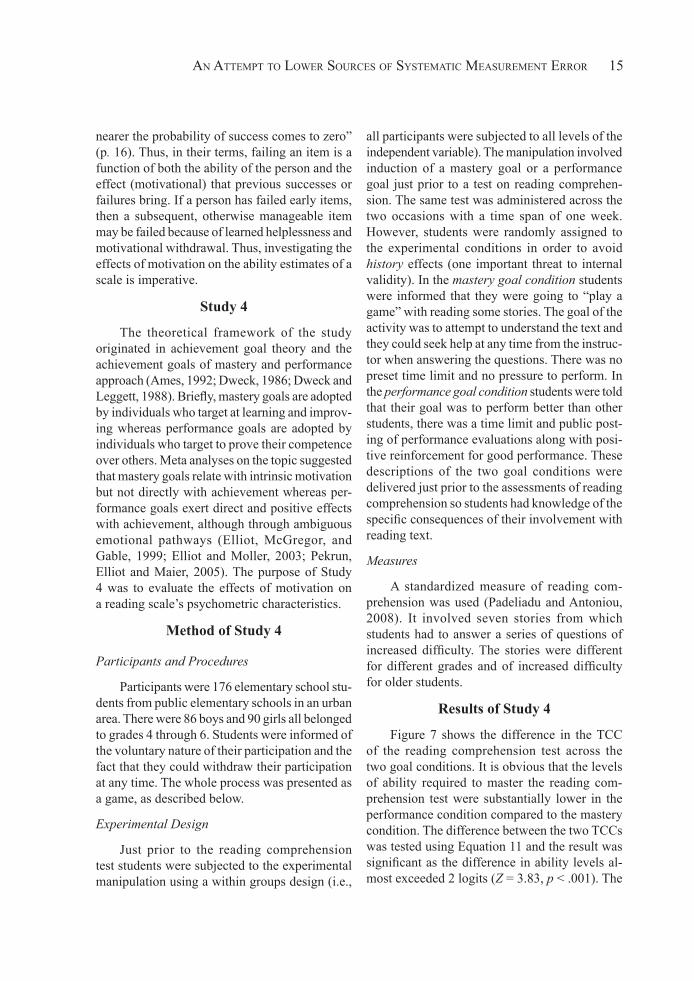
Results of Study 4
Figure 7 shows the difference in the TCC of the reading comprehension test across the two goal conditions. It is obvious that the levels of ability required to master the reading com-prehension test were substantially lower in the performance condition compared to the mastery condition. The difference between the two TCCs was tested using Equation 11 and the result was significant as the difference in ability levels al-most exceeded 2 logits (Z = 3.83, p < .001). The
16 SideridiS, et al.
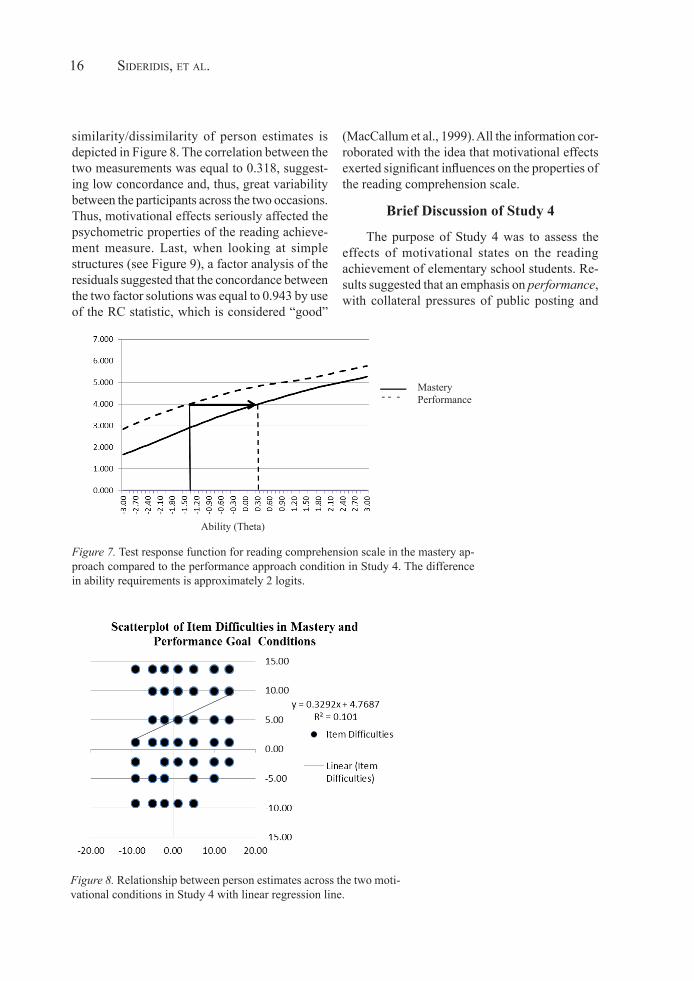
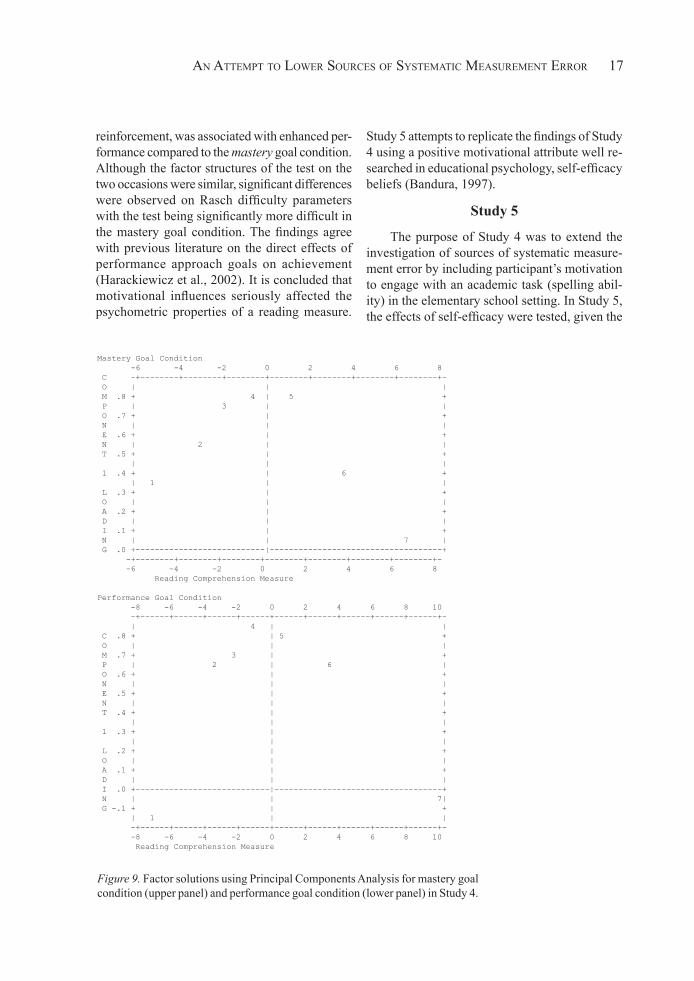
similarity/dissimilarity of person estimates is depicted in Figure 8. The correlation between the two measurements was equal to 0.318, suggest-ing low concordance and, thus, great variability between the participants across the two occasions. Thus, motivational effects seriously affected the psychometric properties of the reading achieve-ment measure. Last, when looking at simple structures (see Figure 9), a factor analysis of the residuals suggested that the concordance between the two factor solutions was equal to 0.943 by use of the RC statistic, which is considered “good”
(MacCallum et al., 1999). All the information cor-roborated with the idea that motivational effects exerted significant influences on the properties of the reading comprehension scale.
Brief Discussion of Study 4
The purpose of Study 4 was to assess the effects of motivational states on the reading achievement of elementary school students. Re-sults suggested that an emphasis on performance, with collateral pressures of public posting and An Attempt to Lower Sources of Systematic Measurement Error 8
Ability (Theta)
Figure 7. Test response function for reading comprehension scale in the mastery approach compared to
the performance approach condition in Study 4. The difference in ability requirements is approximately 2 logits.
- - -MasteryPerformance
Figure 7. Test response function for reading comprehension scale in the mastery ap-proach compared to the performance approach condition in Study 4. The difference in ability requirements is approximately 2 logits.
An Attempt to Lower Sources of Systematic Measurement Error 9
Figure 8. Relationship between person estimates across the two motivational conditions in Study 4 with
linear regression line.
Figure 8. Relationship between person estimates across the two moti-vational conditions in Study 4 with linear regression line.
an attempt to lower SourceS of SyStematic meaSurement error 17
reinforcement, was associated with enhanced per-formance compared to the mastery goal condition. Although the factor structures of the test on the two occasions were similar, significant differences were observed on Rasch difficulty parameters with the test being significantly more difficult in the mastery goal condition. The findings agree with previous literature on the direct effects of performance approach goals on achievement (Harackiewicz et al., 2002). It is concluded that motivational influences seriously affected the psychometric properties of a reading measure.
Study 5 attempts to replicate the findings of Study 4 using a positive motivational attribute well re-searched in educational psychology, self-efficacy beliefs (Bandura, 1997).
Study 5
The purpose of Study 4 was to extend the investigation of sources of systematic measure-ment error by including participant’s motivation to engage with an academic task (spelling abil-ity) in the elementary school setting. In Study 5, the effects of self-efficacy were tested, given the
Mastery Goal Condition -6 -4 -2 0 2 4 6 8 C -+--------+--------+--------+--------+--------+--------+--------+- O | | | M .8 + 4 | 5 + P | 3 | | O .7 + | + N | | | E .6 + | + N | 2 | | T .5 + | + | | | 1 .4 + | 6 + | 1 | | L .3 + | + O | | | A .2 + | + D | | | I .1 + | + N | | 7 | G .0 +---------------------------|------------------------------------+ -+--------+--------+--------+--------+--------+--------+--------+- -6 -4 -2 0 2 4 6 8 Reading Comprehension Measure
Performance Goal Condition -8 -6 -4 -2 0 2 4 6 8 10 -+------+------+------+------+------+------+------+------+------+- | 4 | | C .8 + | 5 + O | | | M .7 + 3 | + P | 2 | 6 | O .6 + | + N | | | E .5 + | + N | | | T .4 + | + | | | 1 .3 + | + | | | L .2 + | + O | | | A .1 + | + D | | | I .0 +----------------------------|-----------------------------------+ N | | 7| G -.1 + | + | 1 | | -+------+------+------+------+------+------+------+------+------+- -8 -6 -4 -2 0 2 4 6 8 10 Reading Comprehension Measure
Figure 9. Factor solutions using Principal Components Analysis for mastery goal condition (upper panel) and performance goal condition (lower panel) in Study 4.
18 SideridiS, et al.
effect that these self-perceptions have been very predictive of actual performance and achievement across domains (Bandura, 2001).
Method of Study 5
Participants and Procedures
Participants were 192 elementary school students who attended public elementary schools in an urban area. There were 93 boys and 99 girls, all attending grade 3. Students’ self-efficacy be-liefs were assessed at school using a whole-class administration paradigm. Assessments took place after ensuring students of their anonymity and the fact that they could withdraw participation at any time, in case they did not feel well.
Research Design
In a correlational design, prior to assessing spelling, students were assessed on their self-efficacy beliefs about spelling.
Measures
A 5-item spelling test was implemented, which was based on the curriculum for the respec-tive grade. It was a brief form of the Mouzaki et al. (2007) standardized instrument.
Data Analysis
The HGLM 2-level model described above was implemented in order to adjust item difficul-ties based on the effects of self-efficacy.
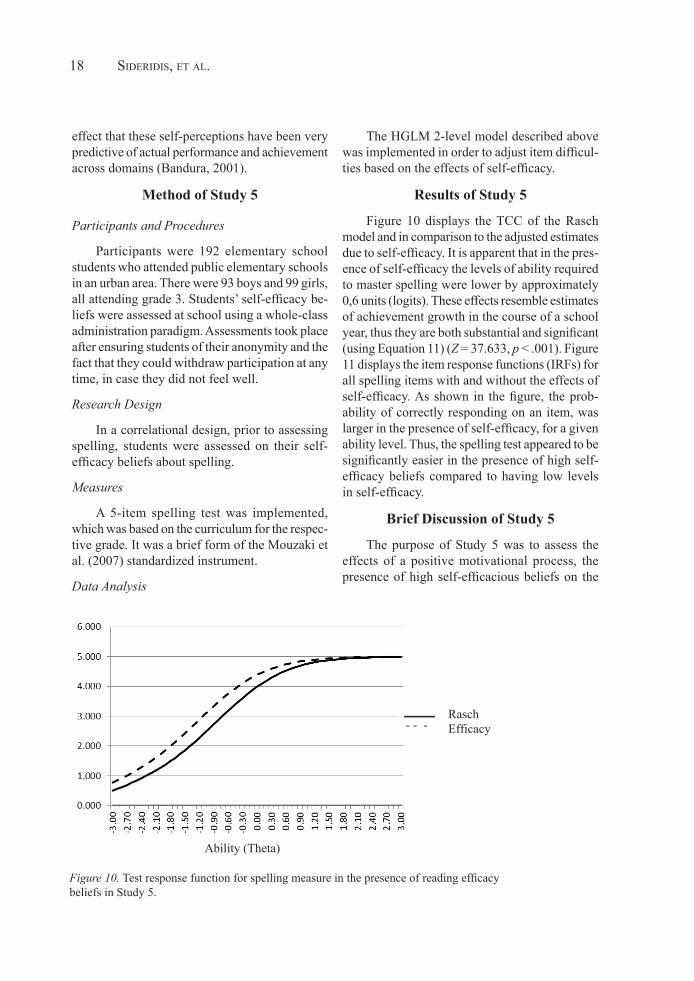
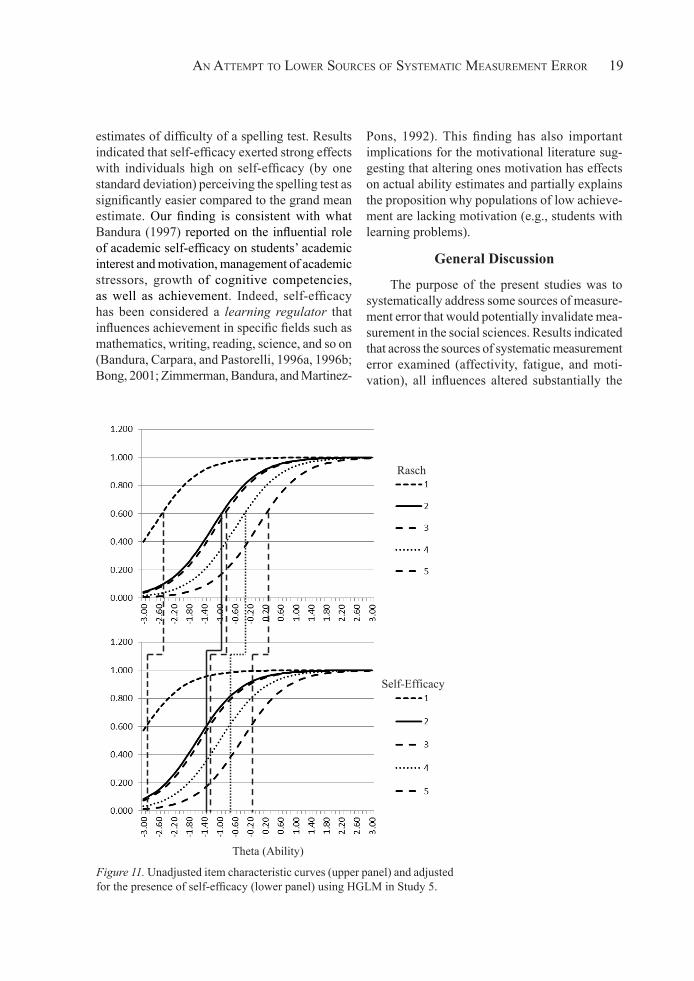
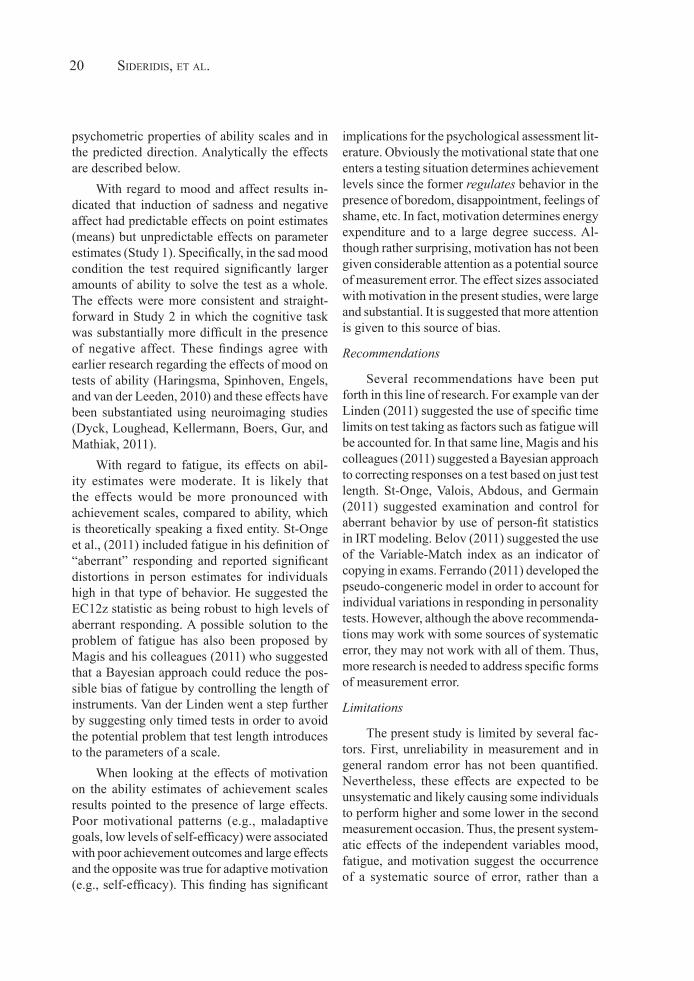
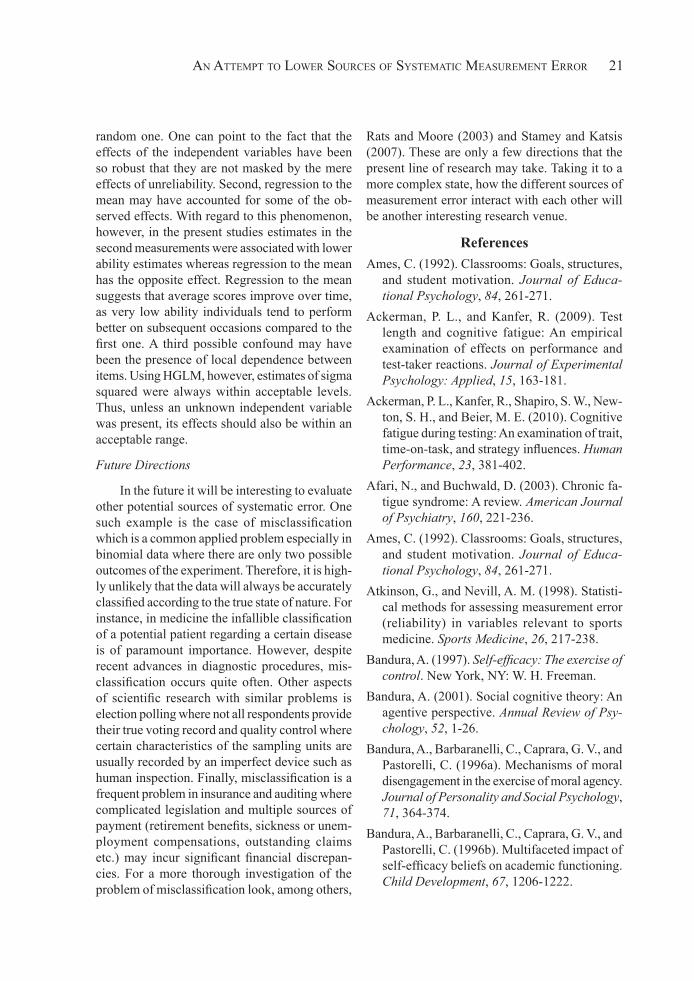
Results of Study 5
Figure 10 displays the TCC of the Rasch model and in comparison to the adjusted estimates due to self-efficacy. It is apparent that in the pres-ence of self-efficacy the levels of ability required to master spelling were lower by approximately 0,6 units (logits). These effects resemble estimates of achievement growth in the course of a school year, thus they are both substantial and significant (using Equation 11) (Z = 37.633, p < .001). Figure 11 displays the item response functions (IRFs) for all spelling items with and without the effects of self-efficacy. As shown in the figure, the prob-ability of correctly responding on an item, was larger in the presence of self-efficacy, for a given ability level. Thus, the spelling test appeared to be significantly easier in the presence of high self-efficacy beliefs compared to having low levels in self-efficacy.
Brief Discussion of Study 5
The purpose of Study 5 was to assess the effects of a positive motivational process, the presence of high self-efficacious beliefs on the
An Attempt to Lower Sources of Systematic Measurement Error 11
Ability (Theta)
Figure 10. Test response function for spelling measure in the presence of reading efficacy beliefs in
Study 5.
- - -RaschEfficacy
Figure 10. Test response function for spelling measure in the presence of reading efficacy beliefs in Study 5.
an attempt to lower SourceS of SyStematic meaSurement error 19
estimates of difficulty of a spelling test. Results indicated that self-efficacy exerted strong effects with individuals high on self-efficacy (by one standard deviation) perceiving the spelling test as significantly easier compared to the grand mean estimate. Our finding is consistent with what Bandura (1997) reported on the influential role of academic self-efficacy on students’ academic interest and motivation, management of academic stressors, growth of cognitive competencies, as well as achievement. Indeed, self-efficacy has been considered a learning regulator that influences achievement in specific fields such as mathematics, writing, reading, science, and so on (Bandura, Carpara, and Pastorelli, 1996a, 1996b; Bong, 2001; Zimmerman, Bandura, and Martinez-
Pons, 1992). This finding has also important implications for the motivational literature sug-gesting that altering ones motivation has effects on actual ability estimates and partially explains the proposition why populations of low achieve-ment are lacking motivation (e.g., students with learning problems).
General Discussion
The purpose of the present studies was to systematically address some sources of measure-ment error that would potentially invalidate mea-surement in the social sciences. Results indicated that across the sources of systematic measurement error examined (affectivity, fatigue, and moti-vation), all influences altered substantially the
An Attempt to Lower Sources of Systematic Measurement Error 12
Theta (Ability)Figure 11. Unadjusted item characteristic curves (upper panel) and adjusted for the presence of self-
efficacy (lower panel) using HGLM in Study 5.
Self-Efficacy
Rasch
Figure 11. Unadjusted item characteristic curves (upper panel) and adjusted for the presence of self-efficacy (lower panel) using HGLM in Study 5.
20 SideridiS, et al.
psychometric properties of ability scales and in the predicted direction. Analytically the effects are described below.
With regard to mood and affect results in-dicated that induction of sadness and negative affect had predictable effects on point estimates (means) but unpredictable effects on parameter estimates (Study 1). Specifically, in the sad mood condition the test required significantly larger amounts of ability to solve the test as a whole. The effects were more consistent and straight-forward in Study 2 in which the cognitive task was substantially more difficult in the presence of negative affect. These findings agree with earlier research regarding the effects of mood on tests of ability (Haringsma, Spinhoven, Engels, and van der Leeden, 2010) and these effects have been substantiated using neuroimaging studies (Dyck, Loughead, Kellermann, Boers, Gur, and Mathiak, 2011).
With regard to fatigue, its effects on abil-ity estimates were moderate. It is likely that the effects would be more pronounced with achievement scales, compared to ability, which is theoretically speaking a fixed entity. St-Onge et al., (2011) included fatigue in his definition of “aberrant” responding and reported significant distortions in person estimates for individuals high in that type of behavior. He suggested the EC12z statistic as being robust to high levels of aberrant responding. A possible solution to the problem of fatigue has also been proposed by Magis and his colleagues (2011) who suggested that a Bayesian approach could reduce the pos-sible bias of fatigue by controlling the length of instruments. Van der Linden went a step further by suggesting only timed tests in order to avoid the potential problem that test length introduces to the parameters of a scale.
When looking at the effects of motivation on the ability estimates of achievement scales results pointed to the presence of large effects. Poor motivational patterns (e.g., maladaptive goals, low levels of self-efficacy) were associated with poor achievement outcomes and large effects and the opposite was true for adaptive motivation (e.g., self-efficacy). This finding has significant
implications for the psychological assessment lit-erature. Obviously the motivational state that one enters a testing situation determines achievement levels since the former regulates behavior in the presence of boredom, disappointment, feelings of shame, etc. In fact, motivation determines energy expenditure and to a large degree success. Al-though rather surprising, motivation has not been given considerable attention as a potential source of measurement error. The effect sizes associated with motivation in the present studies, were large and substantial. It is suggested that more attention is given to this source of bias.
Recommendations
Several recommendations have been put forth in this line of research. For example van der Linden (2011) suggested the use of specific time limits on test taking as factors such as fatigue will be accounted for. In that same line, Magis and his colleagues (2011) suggested a Bayesian approach to correcting responses on a test based on just test length. St-Onge, Valois, Abdous, and Germain (2011) suggested examination and control for aberrant behavior by use of person-fit statistics in IRT modeling. Belov (2011) suggested the use of the Variable-Match index as an indicator of copying in exams. Ferrando (2011) developed the pseudo-congeneric model in order to account for individual variations in responding in personality tests. However, although the above recommenda-tions may work with some sources of systematic error, they may not work with all of them. Thus, more research is needed to address specific forms of measurement error.
Limitations
The present study is limited by several fac-tors. First, unreliability in measurement and in general random error has not been quantified. Nevertheless, these effects are expected to be unsystematic and likely causing some individuals to perform higher and some lower in the second measurement occasion. Thus, the present system-atic effects of the independent variables mood, fatigue, and motivation suggest the occurrence of a systematic source of error, rather than a
an attempt to lower SourceS of SyStematic meaSurement error 21
random one. One can point to the fact that the effects of the independent variables have been so robust that they are not masked by the mere effects of unreliability. Second, regression to the mean may have accounted for some of the ob-served effects. With regard to this phenomenon, however, in the present studies estimates in the second measurements were associated with lower ability estimates whereas regression to the mean has the opposite effect. Regression to the mean suggests that average scores improve over time, as very low ability individuals tend to perform better on subsequent occasions compared to the first one. A third possible confound may have been the presence of local dependence between items. Using HGLM, however, estimates of sigma squared were always within acceptable levels. Thus, unless an unknown independent variable was present, its effects should also be within an acceptable range.
Future Directions
In the future it will be interesting to evaluate other potential sources of systematic error. One such example is the case of misclassification which is a common applied problem especially in binomial data where there are only two possible outcomes of the experiment. Therefore, it is high-ly unlikely that the data will always be accurately classified according to the true state of nature. For instance, in medicine the infallible classification of a potential patient regarding a certain disease is of paramount importance. However, despite recent advances in diagnostic procedures, mis-classification occurs quite often. Other aspects of scientific research with similar problems is election polling where not all respondents provide their true voting record and quality control where certain characteristics of the sampling units are usually recorded by an imperfect device such as human inspection. Finally, misclassification is a frequent problem in insurance and auditing where complicated legislation and multiple sources of payment (retirement benefits, sickness or unem-ployment compensations, outstanding claims etc.) may incur significant financial discrepan-cies. For a more thorough investigation of the problem of misclassification look, among others,
Rats and Moore (2003) and Stamey and Katsis (2007). These are only a few directions that the present line of research may take. Taking it to a more complex state, how the different sources of measurement error interact with each other will be another interesting research venue.
ReferencesAmes, C. (1992). Classrooms: Goals, structures,
and student motivation. Journal of Educa-tional Psychology, 84, 261-271.
Ackerman, P. L., and Kanfer, R. (2009). Test length and cognitive fatigue: An empirical examination of effects on performance and test-taker reactions. Journal of Experimental Psychology: Applied, 15, 163-181.
Ackerman, P. L., Kanfer, R., Shapiro, S. W., New-ton, S. H., and Beier, M. E. (2010). Cognitive fatigue during testing: An examination of trait, time-on-task, and strategy influences. Human Performance, 23, 381-402.
Afari, N., and Buchwald, D. (2003). Chronic fa-tigue syndrome: A review. American Journal of Psychiatry, 160, 221-236.
Ames, C. (1992). Classrooms: Goals, structures, and student motivation. Journal of Educa-tional Psychology, 84, 261-271.
Atkinson, G., and Nevill, A. M. (1998). Statisti-cal methods for assessing measurement error (reliability) in variables relevant to sports medicine. Sports Medicine, 26, 217-238.
Bandura, A. (1997). Self-efficacy: The exercise of control. New York, NY: W. H. Freeman.
Bandura, A. (2001). Social cognitive theory: An agentive perspective. Annual Review of Psy-chology, 52, 1-26.
Bandura, A., Barbaranelli, C., Caprara, G. V., and Pastorelli, C. (1996a). Mechanisms of moral disengagement in the exercise of moral agency. Journal of Personality and Social Psychology, 71, 364-374.
Bandura, A., Barbaranelli, C., Caprara, G. V., and Pastorelli, C. (1996b). Multifaceted impact of self-efficacy beliefs on academic functioning. Child Development, 67, 1206-1222.
22 SideridiS, et al.
Belov, D. (2011). Detection of answer copying based on the structure of a high stakes test. Applied Psychological Measurement, 35, 495-517.
Beretvas, N., and Kamata, A. (2007). Introduc-tion to the special section on the multilevel measurement model for dichotomous items. In E. V. Smith and R. M. Smith (Eds.), Rasch measurement: Advanced and specialized ap-plications. Maple Grove, MN: JAM Press.
Beretvas, N., Meyers, J., and Rodriguez, R. (2005). The cross-classified multilevel mea-surement model: An explanation and demon-stration. Journal of Applied Measurement, 6, 322-341.
Becker, G. (2000). How important is transient error in estimating reliability? Going beyond simulation studies. Psychological Methods, 5, 370-379.
Bergersen, G., and Hannay. J. E. (2010). Detect-ing learning and fatigue effects by inspection of person-item residuals. In T. Nielsen, S. Kreiner, and J. Brodersen (Eds). Probabilistic models for measurement in education, psychol-ogy, social science and health (pp. 248-263). Copenhagen, Denmark: Business School and the University of Copenhagen.
Bong, M. (2001). Tests of the internal/external frames of reference model with subject-specific academic self-efficacy and frame-specific academic self-concepts. Journal of Educational Psychology, 90, 102-110.
Bryk, A. S., and Raudenbush, S. W. (1992). Hierarchical linear models. Newbury Park, CA: Sage.
Campbell, D. T., and Russo, M. J. (2001). Social measurement. Thousand Oaks, CA: Sage.
Crede, M. (2010). Random responding as a threat to the validity of effect size estimates in cor-relational research. Educational and Psycho-logical Measurement, 70, 596-612.
Burchinal, M. R. (2008). How measurement error affects the interpretation and understanding of effect size measures. Child Development Perspectives, 2, 178-180.
Coughlin, S. (1990). Recall bias in epidemiologic studies. Journal of Clinical Epidemiology, 43, 87-91.
Dorman, J. P. (2009). Partitioning the variance in scores on classroom environment instruments. Australian Journal of Educational and Devel-opmental Psychology, 9, 18-31.
Dweck, C. S. (1986). Motivational processes af-fecting learning. American Psychologist, 41, 1040-1048.
Dweck, C. S., and Leggett, E. L. (1988). A social-cognitive approach to motivation and personal-ity. Psychological Review, 95, 256-273.
Dyck, M., Loughead, J., Kellermann, T., Boers, F., Gur, R., and Mathiak, K., (2011). Cogni-tive versus automatic mechanisms of mood induction differentially activate right and left amygdala. NeuroImage, 54, 2503-2513.
Elliot, A. J., McGregor, J. A., and Gable, S. (1999). Achievement goals, study strategies, and exam performance: A mediational analy-sis. Journal of Educational Psychology, 91, 549-563.
Elliot, A. J., and Moller, A. (2003). Performance approach goals: Good or bad forms of regula-tion? International Journal of Educational Research, 39, 339-356.
Ferrando, P. (2011). A linear variable-q model for measuring individual differences in response precision. Applied Psychological Measure-ment, 35, 200-216.
Greene, T. R., and Noice, H. (1988). Influence of positive affect upon creative thinking and problem solving in children. Psychological Reports, 63, 895-898.
Guadagnoli, E., and Velicer, W. (1991). A com-parison of pattern matching indices. Multivari-ate Behavioral Research, 26, 323-343.
Guolo, A. (2007). Robust techniques for measure-ment error correction: A review. Statistical Methods in Medical Research, 17, 555-580.
Haringsma, R.,Spinhoven, P., Engels, G., and van der Leeden, R., (2010). Effects of sad mood on autobiographical memory in older adults
an attempt to lower SourceS of SyStematic meaSurement error 23
with and without lifetime depression. British Journal of Clinical Psychology, 49, 343-357.
Hammer, A., and Lindmark, B. (2003). Test-retest intra-rater reliability of grip force in patients with sroke. Journal of Rehabilitation Medi-cine, 35, 189-194.
Harvill, L. M. (1991), Standard error of measure-ment. Educational Measurement: Issues and Practice, 10, 33-41.
Hebbler, S. W. (1989). A BASIC program for computing the coefficient of concordance. Educational and Psychological Measurement, 49, 615-618.
Hohler, J., Hartig, J., and Goldhammer, F. (2010). Modeling the multidimensional structure of students’ foreign language competence within and between classrooms. Psychological Test and Assessment Modeling, 52, 323-340.
Hutchison, D. (2008). On the conceptualization of measurement error. Oxford Review of Educa-tion, 34, 443-460.
Isen, A. M., Niedenthal, P. M., and Cantor, N. (1992). An influence of positive affect on so-cial categorization. Motivation and Emotion, 16, 65-78.
Jensen, A. R. (1998). The G factor: The science of mental ability. Westport, CT: Praeger.
Kamata, A. (2002, April). Procedure to perform item response analysis by hierarchical gen-eralized linear model. Paper presented at the annual meeting of the American Educational Research Association, New Orleans, LA.
Kim, J., and Seltzer, M. (2011). Examining het-erogeneity in residual variance to detect dif-ferential response to treatments. Psychological Methods, 16, 192-208.
Linacre, J. M. (1994). Many-facet Rasch measure-ment. Chicago, IL: MESA Press.
Linacre, J. M. (1999). A user’s guide and manual to WINSTEPS. Chicago, IL: MESA Press.
Ludlow, L. H., and Haley, S. M. (1995). Rasch model logits: Interpretation, use, and trans-formation. Educational and Psychological Measurement, 55, 967-975.
MacCallum, R. C., Widaman, K. F., Zhang, S., and Hong, S. (1999). Sample size in factor analysis. Psychological Methods, 4, 84-99.
Magis, D., Beland, S., and Raiche, G. (2011). A test length correction to the estimation of extreme proficiency levels. Applied Psycho-logical Measurement, 35, 91-109.
Meddis, R. (1972). Bipolar factors in mood adjec-tive checklists. British Journal of Social and Clinical Psychology, 11, 178-184.
Mouzaki, A., Protopapas, A., Sideridis, G., and Simos, P. (2007). An investigation of the psy-chometric characteristics of a spelling test for students of grades 2 through 6. Educational Sciences (in Greek), 1, 129-146.
Moutafi, J., Furnham, A., and Tsaousis, I. (2006). Is the relationship between intelligence and trait Neuroticism mediated by test anxiety? Personality and Individual Differences, 40, 587-597.
Myford, C. M., and Wolfe, E. W. (2003). Detect-ing and measuring rater effects using many facets rasch measurement: Part I. Journal of Applied Measurement, 4, 386-422.
Myford, C. M., and Wolfe, E. W. (2004). Detect-ing and measuring rater effects using many facets rasch measurement: Part II. Journal of Applied Measurement, 5, 189-227.
Panteliadu S., and Antoniou, F. (2008). Develop-ment of the Test of Reading Ability (TERA) (in Greek). Patras: Poulimenos Press.
Pekrun, R., Elliot, A. J., and Maier, M. A. (2006). Achievement goals and discrete achievement emotions: A theoretical model and prospective test. Journal of Educational Psychology, 98, 583-597.
Phillips, L. H., Bull, R., Adams, E., and Fraser, L. (2002). Positive mood and executive func-tions: Evidence from stroop and fluency tasks. Emotion, 2, 12-22.
Raats, V. M., and Moors, J. A. (2003). Double-checking auditors: A Bayesian approach. Statistician, 52, 351-365.
Rasch, G. (1960). Probabilistic models for some intelligence and attainment tests. Copenhagen,
24 SideridiS, et al.
Denmark: Danish Institute for Educational Research. (Expanded edition, 1980. Chicago, IL: University of Chicago Press.)
Raudenbush, S. W., and Bryk, A. S. (2002). Hierarchical linear models. Newbury Park, CA: Sage.
Raju, N. S. (1990). Determining the significance of estimated signed and unsigned areas be-tween two item response functions. Applied Psychological Measurement, 14, 197-207.
Roberts, K., and Herrington, R. (2005). Demon-stration of software programs for estimating multilevel measurement model parameters. Journal of Applied Measurement, 6, 255-272.
Russell, J. A. (1979). Affective space is bipolar. Journal of Personality and Social Psychology, 37, 1161-1178.
Samuel W. (1980). Mood and personality corre-lates of IQ by race and sex of subject. Journal of Personality and Social Psychology, 38, 993-1004.
Sanders, A. F. (1998). Elements of human per-formance. Mahwah, NJ: Lawrence Erlbaum.
Sideridis, G. D., and Kaplan, A. (2011). Achieve-ment goals and persistence across tasks: The role of failure and success. Journal of Experi-mental Education, 79, 429-451.
Sitzia, J., and Wood, N. (1997). Patient satisfac-tion: A review of issues and concepts. Social Science and Medicine, 45, 1829-1843.
Schmidt, F. L., Le, H., and Ilies, R. (2003). Be-yond alpha: An empirical examination of the effects of different sources of measurement error on the reliability estimates for measures of individual differnet constructs. Psychologi-cal Methods, 8, 206-224.
Stamey, J., and Katsis, A. (2007). A sample size determination for comparing two Poisson rates with underreported counts. Communications in Statistics, Statistics and Simulation, 36, 483-492.
St-Onge, C., Valois, P., Abdous, B., and Germain, S. (2011). Accuracy of person-fit statistics: A
monte carlo study of the influence of aberrance rates. Applied Psychological Measurement, 35, 419-432.
Taylor, J. (1997). An introduction to error analy-sis. Sausalito, CA: University Press Books.
van der Linden, W. (2011). Setting time limits on tests. Applied Psychological Measurement, 35, 183-199.
Waller, N., Thompson, J., and Wenk, E. (2000). Using IRT to separate measurement bias from true group differences on homogeneous and heterogeneous scales: An illustration with the MMPI. Psychological Methods, 5, 125-146.
Wang, C. Y. (2008). Non-parametric maximum likelihood estimation for Cox regression with subject-specific measurement error. Scandina-vian Journal of Statistics, 35, 613-628.
Wang, W., and Chen, H. (2004). The standardized mean difference within the framework of item response theory. Educational and Psychologi-cal Measurement, 64, 201-223.
Weijters, B., Geuens, M., and Schillewaert, N. (2010). The stability of individual response styles. Psychological Methods, 15, 96-110.
Wolfe, E. W. (2004). Identifying rater effects us-ing latent trait models. Psychology Science, 46, 35-51.
Wolfe, E. W.,, and Smith, E. V., Jr. (2007). In-strument development tools and activities for measure validation using Rasch models. In E. V. Smith and R. M. Smith (Eds.), Rasch measurement: Advanced and specialized ap-plications (pp. 243-290). Maple Grove, MN: JAM Press.
Wright, B. D., and Stone, M. H. (1979). Best test design. Chicago, IL: MESA Press.
Wright, B. D., and Masters, G. N. (1982). Rating scale analysis. Chicago: MESA Press.
Zimmerman, B. J., Bandura, A., and Martinez-Pons, M. (1992). Self-motivation for academic attainment: The role of self- efficacy beliefs and personal goal-setting. American Educa-tional Research Journal, 29, 663-676.