Embed Size (px)
Citation preview

199
AN ATTEMPT TO QUANTIFY THE ECONOMIC AND FINANCIAL LOSSES IN ECOSYSTEMS
Valentin LUPŞAN94
Abstract Currently, the disturbances (mainly negatives), occurring in socio-economic systems, have fewer short-term solutions, and the medium-term and long term disregard greater sustainable development at the levels micro, meso and macro.
Economic and financial losses registered in such eco-systems, affected by disturbances in the stability and integrity of them, are leading, in most cases, to major climate changes, especially at regional level and local zones, with unexpected and diverse implications, sometimes irreversible over the enviromental environment. Quantifiable value such losses, both quantitative and qualitative, in a specific case (losses in Norway spruce, Picea abies, forests affected by biotic and abiotic factors of Bârgău Mountains) may provide new ways of approach.
This is the view in which we are interested in: the economic and financial losses may be quanitifiable in the effects of the disturbances cause, in a manner of the "rolling snowball", with larger damages (losses) in the adjacent zones, or in the downstream from Bârgau Mountains (situation that can be generalized).
Keywords: economic losses, eco-systems, disturbance, climate changes, "rolling snowball", cause, effects.
Jel cod: Q01, P51, Q15
1. Introduction 1.1. General Consideration
Currently, the issue of disturbances (mainly negative) that occur in socio-economic systems has fewer short-term solutions, and the medium-term and long disregard greater of sustainable development at the macro, meso and microeconomic.
Otherwise the entire universe, from the atom to the galaxies, is structured a unique model systemically. L.von Bertalanffy (1956) defines as a complex system “the items that are in constant interaction with each other” (Milescu, I., 1994, page 13). All forms of matter making up a multitude of systems.
The systems consist of a combination of elements that are in permanent interaction forming a whole whose properties are superior or others in terms of quality than the sum of the constituents, which are defined as subsystems.
Each system has its environment in the universe and hence L.von Bertalanffy, given the definition of Hall and Fagen (1956) “that the system is a set of objects with relationships between them and their attributes”, classifies embedded systems (a change in a component of the system lead to changes in all other constituents and the system as a whole) and summative systems, the change of a component of the system depends only on that component. We arrive in this regard, a continuous exchange of information within the system environment to a hierarchy of systems, the interaction by sharing their information and their embedding.
Another grading system would be, their interaction with the environment: isolated systems (without exchange of matter and energy with the environment), possible only in theory because they do not exist in nature, closed systems, they only exchange energy with the environment and systems open both the dead and the living in nature (ecosystems).
Economic systems in their attempt to reach the maximum of organization and technology, thanks to the laws of entropy, get to interact with biological systems with complex ecological structure and change them sometimes irreversible.
94 National Institute for Forestry Research and Development „Marin Drăcea”, Bucharest

200
The law of conservation of energy states that the total energy of an isolated physical system remains unchanged over time, regardless of the nature of internal processes occurring in the system. In other words, the various forms of energy of a system can turn each other, but the sum of the quantities of all forms of energy remains constant, it can not be created or destroyed. According to the concepts of modern physics, any amount of energy whilst expressing a table and each corresponds to energy of any mass.
Open biological systems have as main features: capacity, integrity, heterogeneity, self-regulation and dynamic balance.
Ecology has developed new meanings conceptually, can be defined as the science of ecosystem productivity biological synthesis of the elements and the extent to which factors abiotic and biotic actively participate in the process of permanent change in the original state, being in -a continuous dynamic.
The ecosystem is by definition “unity of the living community (biocoenosis) living in a given territory and the territory, defined in terms of homogeneity topographic, climatic and administrative criteria, biotope” (Al Ionescu, Săhleanu V and C bindiu ., 1989, page 73).
Forest “in a system for producing one ton of wood, the trees consume carbon dioxide, 1.8 tons and tons of oxygen eliberează1,3” (Milescu I 1997, p. 116).
As human society has evolved, developed, and social and economic systems, which culminated with technological massive, registering the countless errors sometimes true ecological disaster for humanity (desertification, species extinction through hunting irrational, flooding of areas, land degradation and the formation of torrents and areas of soil erosion, and chemical processing industry increased devoltarea agriculture, massive deforestation of forests for timber or for extending valuable farmland, grazing unreasonable, fires, invasion of insects, etc.
Important to note in economic systems theory it is that “maintaining the stationary state economic systems (more generally of the social) environment accelerates entropy increase” (Dinga, E., page 62).
Losses economic and financial made in such ecosystems affected by disturbances in the stability and integrity of their lead in most cases to major climate changes, particularly at regional and local level, with implications for various, sometimes irreversible environmental . Value quantified these losses, both quantitative and qualitative, on a specific case (losses in spruce stands affected by biotic and abiotic factors in Bargaului) may provide new ways of tackling the problem.
The link between hydrological and anti-erosion role of forests ,, based on research on the causes and effects of catastrophic floods, concluding that stands between composition and consistency and intensity of floods there is a clear correlation, specific maximum flow having the lowest values in basin and basins predominantly resins (1,35m3 / s / km2) and highest values in the basins in which resins and leaved entered in the composition stands roughly equal proportions (1.95 m3 / s / km2) "(Vlad I , Doniţă N, et al, 1997, page 267268).
Forestry systems have an important hydrological role, because the canopy can retain young molidişurilor lack of rainfall in the wind about 810G / m2 (Milescu I, 1997, page 114).
Disturbances that occur are a direct consequence “artificializării forests” (Giurgiu V 1978, page 265).
This is the view we are interested in: economic and financial losses that can be quantified, in effect determining the cause disturbances “rolled the snowball effect”, with greater damage (losses) in areas adjacent or downstream of Mountains Bârgăului (which could be generalized).
2. Research purposes
The project purpose is to identify optimal solutions in terms of trying to quantify the losses economic and financial ecosystems, referring Main detail on stands (forest ecosystems predominantly spruce Mountains Bârgăului) affected by disturbance abiotic and biotic, which causes major damage economic-financial and environmental and even social in adjacent and downstream, to shape these regularities and find possible correlations between certain types of structures and economic loss suffered in these ecosystems, to develop future the ecological

201
management of forest ecosystems, for FMUs in the area, according to the program sustainable management of natural resources and ecosystems adapt to climate change.
3. State of Knowledge For judicious management of forest ecosystems of conifers, especially spruce, affected by disturbance abiotic and biotic, were achieved over time, a series of research, both globally and nationally, resulting through a series of articles showing quantification quantitative and qualitative economic and financial losses in the mountainous area of natural stands of conifers, published in specialized journals.
Less was trying to quantify the value of these disturbances because they are hard quantifiable value, especially side effects occurring such ecosystems in their production area and adjacent areas occurrence of such phenomena.
Although "species of conifers presents a health condition better and more stable than hardwood, climate having a significant deficit fluid and excess heat is more common in regions where languages are species of deciduous" (Badea Ov., Neagu Del., 2007), they are more vulnerable to the action of destabilizing factors (particularly doborâturile produced by wind and snow) due to climatic conditions tighter and pulled rooting system more unstable. This imbalance occurs mainly spruce forest ecosystems as a result of works for one does not cover the care (cleaning and thinning), leading to the creation of a coefficient of slenderness stands above par, with full consistency. Injuries caused by tree trunks big game: stag (Cervus elaphus) and bear (Ursus arctos), are ways in spores of fungi that cause rot red resin, resulting in a decrease of wood.
Also, attacks Ipidae major causes disturbances in forest ecosystems, biotic and abiotic factors exposed as it appears on stands debility with fragile ecological balance.
These disturbances occur mainly in stands of conifers, particularly spruce around the age of 60 years and who have not previously been taken care works specific time.
The wood is of poor quality and low quantity harvested trees being done before the age exploitability established by forest planning that the Polity how forest management in the area.
Thus, if "the timber offered for sale comes from packaged accidental, then the slope demand increases because the residual value of each meter bought decreases more than in the case of an offer normal because operating costs per unit of product are higher" (Dragoi M, 2000, p 39).
The phenomena of increasing soil erosion by reducing the anti-erosion and hydrological role coniferous forest ecosystems affected by disruptive factors leading to losses adjacent very difficult to estimate and quantify value. For such stands must be given concrete technical solutions and suitable brush concerned by destabilizing factors involved.
4. Research Objectives In order to address the proposed theme were revealed following research:
- Negative interference problems arising in economic and social systems, with short and long-term solutions which do not take account largely sustainable development at the macro, meso and micro;
- Treatment of forest ecosystems in economic and financial terms as dissipative systems where entropy plays a fundamental role in organizing systems. We have the following paradox: the better organize economic and social system, the more disorganized biological systems (ecosystems);
- Economic losses recorded in such ecosystems affected by disturbances in the stability and integrity of their lead in most cases to major climate changes, especially at local and regional level, with implications for various direct local and areas surrounding sometimes irreversible environmental, so- called ,, efect.al snowball rolled ".
An attempt cuatificarea value of these losses quantitative and qualitative, was made specifically for the four stands with the same conditions stationary (habitat) and the conditions of vegetation (biocoenosis) affected by biotic and abiotic Mountains Bârgăului, the predominant spruce.

202
5. Description of the methodology used
In producing this study in order to achieve the objectives set by theme, they were adopted following research methods:
• observation; It necessarily implies the purpose of knowledge, planning, development long after the well-established rules and verified. • experiment; This was tried by biometric measurements, the main elements the meter (especially diameters and heights) to indicate that, in certain circumstances, if a certain phenomenon happens regularly, it can be generalized and is a regularity well defined. It will come from a number of well-defined experiments to extrapolate the results for the entire area. To achieve this goal, it is necessary that prediction is testable. •synthesis; Analysis determines the structure of forest ecosystems, the research scientifically well, silvicultural measures and decisions to be taken in the evaluation study, based on a shift from private to general, to reach generalization.
The methodology adopted has the advantage of low cost and effort performs in a relatively short time, obtaining very good results.
Research has assumed perform the following works:
- Analysis of trees affected by disturbance involving predominant spruce species described by consulting lots of forest planning area of forest districts Bârgăului Mountains and field observations: - By choosing specific investigation four arboreta (ecosystems) representative theme addressed and Enumeration affected by disturbance on diameter classes and graded; - Measurement of heights (10-15) for each species component of inventoried trees with diameters close to the diameter of the central base area for the species concerned, resulting from processing of Enumeration affected; - Data processing computer program for calculating the APV site for finding and quantifying value volume assortments volume matching; - Carrying out simulations statistical and biometric by calculating increases periodic table layout production, to highlight the final loss of timber, recorded during 10 years to date and losses economic and financial commercially available inhibitors of exploitation products accidental these stands that virtually no regular cumulated average growth since their extraction, the difference in years between the age stand in the draw and the current age; - By taking the difference between the amount estimated at the date of operation for each species component of the stand, in part, by class production, consistency (index density of the stand), the percentage of species in the structure of brushes, area farmed in based on the production table (Giurgiu V., I. Decei, Armăşescu S., 1972, pages 630-640 and page 661) and the age of the reference volume, the current increase is achieved periodically over a period of 10 years in the case of front; - Increase the current share periodic obtained for each species the period (10 years) and get regular average growth; - Is the difference between the estimated volume in the current age depending on the characteristics listed in conditions where it is considered that it would not have been executed works accidental products during the period (10 years) and wood volume remained stand for each species at the time inventaririi whole (final cut) to give the amount of timber extracted by accidental product works for that period; In this case, not all the wood extracted in the period represent losses increase because it harnessed and quantify value in the period, but the loss of growth are quantified by multiplying the number of years since extraction products incidental to the current age (a harvesting of wood), with periodic calculated average increase for that species; - Sets the amount of the loss is quantified value representing the estimated losses increase, multiplied by the average cost price of a cubic meter of wood species inventoried; Besides the loss of timber, there is a series of extra costs for forest regeneration in such stands, the ecological environment of the forest is also afectat.De hydrological role of forest ecosystems in flood prevention, more obvious lately is particularly eloquent. A forest decomposed and can not accomplish the optimum role in hydrological and anti-erosion. - Making interpretation of results and final conclusions are drawn.
203
Analysis entropy of these ecosystems, in line with socio-economic systems, economic and financial, which are dissipative systems, has a negative effect on ecosystems, including forests, because trying to organize better nature after precepts economic and financial lead the final major disturbance in biological systems. Here's how "better", expected in neglecting ecological perspective can be ,, enemy of the good "(.Ionescu, Al., Săhleanu V., and bindiu, C. 1989, page 159).
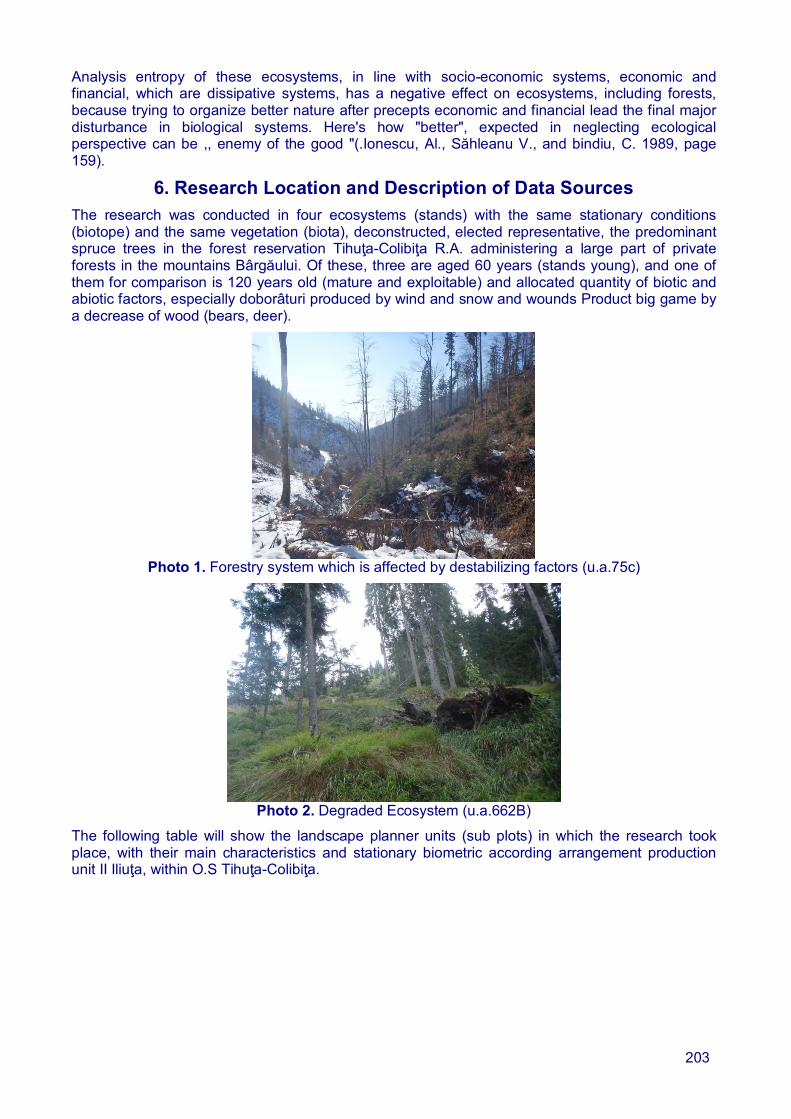
6. Research Location and Description of Data Sources The research was conducted in four ecosystems (stands) with the same stationary conditions (biotope) and the same vegetation (biota), deconstructed, elected representative, the predominant spruce trees in the forest reservation Tihuţa-Colibiţa R.A. administering a large part of private forests in the mountains Bârgăului. Of these, three are aged 60 years (stands young), and one of them for comparison is 120 years old (mature and exploitable) and allocated quantity of biotic and abiotic factors, especially doborâturi produced by wind and snow and wounds Product big game by a decrease of wood (bears, deer).
Photo 1. Forestry system which is affected by destabilizing factors (u.a.75c)
Photo 2. Degraded Ecosystem (u.a.662B)
The following table will show the landscape planner units (sub plots) in which the research took place, with their main characteristics and stationary biometric according arrangement production unit II Iliuţa, within O.S Tihuţa-Colibiţa.

204
Table 1 Experimental areas located in stands Bârgăului Representative Mountains,
the predominant spruce species affected by disturbance
Crt. No. Forest district
Production unit
(u.p.)
Landscape planners unit
(u.a.) Area u.a
(ha) Inventoried
area (ha) Current Age
(years) Class
production Type of station
Forest Type
Proposed treatment
1 II Iliuţa 75 C 3,00 3,00 60 2 3333* 1311** Progressive cuts
(connection) 2
II Iliuţa 75D 2,38 2,38 60 2 3333 1311 Rare cuts
3 II Iliuţa 363 D 2,09 1,00 120 1 3333 1311 Progressive cuts
(connection) 4
O.S Tihuţa-Colibiţa
R.A
II Iliuţa 662 B 13,59 1,40 60 1 3333 1311 Progressive cuts (connection))
* Mixing mountain type Ps (higher productivity), brown high edafic, with Asperula-Dentaria
** Mixed coniferous and beech normal flora mull (s)

205
In these stands were made full inventory (“markers"), and stands framed in terms of forestry regulations in force on the first emergency regeneration. The result of inventory full of stands to be exploited materializes through to strip books of land diameter classes and graded and heights representative for trees with a diameter close dg (average diameter central base area) for each species component of stand, calculating VPA's (document technical and economical which calculates volume by species and varieties of materialuiui wood after inventories), prices are fixed for each species and assortment in part and is the basic tendering of wood by operators of logging operations. Because I address an audience purely economic and not necessarily that of the forest economy have discouraged some technical terms explained. Calculation “diameter central base area (DGM) is a median calculated on the base area” (Giurgiu V, 1979, page 174)
, (1) where: dgM - is the diameter of the central base area; dM - the lower limit of the diameter category is G/2; C – class size diameters (2 cm); G- the total base area; SM - cumulated up to the base surface diameter range of the class in which the G/2 ; gn - the bottom surface of the class in which the diameter G/2.
The average height corrected (hgMc) is calculated with the following formula (Giurgiu V,1979, page 195):
, (2) where: d is the arithmetic average diameter of trees inventoried species; h - the average height of trees inventoried species. After calculating dgM diameters close to trees as worth it, measure 10 to 15 trees for each tree species inventoried. If spruce species were measured every 15 trees for each surface experimental basis, and for other species by 10 trees per species.
The base area of the stand is obtained by summing multiple of the base diameter classes (ni,gi):
(3)
The average tree volume calculation is obtained by the equation proposed by Giurgiu and implemented in the computer program APV, based on the relationship:
(4)
and the equation coefficients were determined by least squares for each species.
For determining the volume of the wood work and breakdown by primary and dimensional types, sorting tables apply for stands at the main forest species inventoried.
Applying these tables requires knowledge of the following data: the total volume of the stand, the average diameter of the base area (dg) and the proportion of working trees (first class quality).
Establish the number of working trees being recognized trees in grades II, III and IV is made by multiplying the number of trees in quality classes corresponding equivalence factors corresponding to these classes:
- resinous:
(5) - hardwood:
(6)

206
where: NI -NIV the number of trees in classes I-IV after inventory.
Estimate quality tree "is achieved by a careful visual analysis, monitoring the shape of the trunk and damages that may result in downgrading wood working or downgrading trees of a quality class to another, because of the size and position on the trunk portion defective "(Decei, 1986 citation Joseph Leahu 1994, page 269).
Next, apply sorting tables for average diameter stands by applying formula:
(7)
where: Vs - the volume assortment; V – total volume; Pi - sorting index expressed as a percentage, for assortment i P - Percentage of working trees. For crotch volume, formula is simplified, being:
(8) Firewood volume (Vf) will result subtracting the total volume (V) wood working volume (V1), plus the amount of peel (VCO) and CRAC (VCR), so:
Vf V-(V1+Vco+Vcr) (9) Also, before sortimentare should be considered if windfall application downgrade and loss indices representing 2% and 1% of total volume.
Because, if stands taken in the studio, ruptures due to the wind and snow are dispersed among trees and there are tears in mass in the calculation of APV sites were considered and clues for downgrading the wood work and loss volume indices trees broken by wind and snow inventoried.
The correct application of these indices, it is necessary with Enumeration to register data on the height where the rupture occurred. In this regard it was calculated an average height of the rupture as an average of the high places diameter classes. Imposed following phases of work:
- enumeration and quality classification. Broken trees will move call "broken", and rupture height;
- measuring heights (2-3) shaft diameters from each category for both whole trees, and those broken;
- calculation of total volume and kinds.
The following table shows hints of wood working downgrade and loss volume indices trees broken by wind and snow (“Technical regulations designed to assess timber exploitation”, 1986, pages 53,80,82).
Table 2 Indices of wood working downgrade and loss volume indices
trees broken by wind and snow
The height from the ground of rupture (m)
base 1 1-2 2-3 3-5 5-8 8-11 14-20 Specifications
Percentage of total l(%) Indices
downgrade 7,5 8,5 12,0 10,3 8,4 5,8 4,9 3,6 Crt. No.
Loss ratios 3,6 5,8 6,0 6,2 4,7 3,8 3,1 2,7
7. Intermediate Rezults Managing the huge natural resources of forest ecosystems, their management scientifically us through extensive research on mathematical modeling of legalities biological functioning, tracking state dynamics stands in their interaction with abiotic factors and biotic as well as anthropogenic

207
factors that may positively or negatively influence forest ecosystems, is a topical issue both nationally and in Europe and worldwide.
Management and accurate assessment of forest resources while reducing ongoing and alarming surfaces covered with forests, involves harmonizing the operation and exploiting produced wood ecological requirements of forest ecosystems without disturbing too much the biological activity thereof, which funcţiomează on dynamic equilibrium principle of self-preservation, ensuring the integrity and continuity for future generations in accordance with the principle of sustainable management of forests.
Table 3 The basic data for calculation of the volume of wood surfaces experimental
Diameter (cm)
Height (m) Crt.
No. u.a.no. Species dt dcg ht hc
Age (ani)
The average tree volume
(m3)
Number of trees Grow APV no.
1 662B Spruce 30,3 30,2 28,5 28,5 60 0,800 225 0 4161 Spruce 34,8 31,2 26,3 25,4 60 0,590 656 0
Fir 40,8 38,9 24,8 24,4 65 0,860 102 0 Beech 40,0 41,8 23,0 23,4 65 0,450 138 0
Sycamore
20,0 19,3 15,6 15,4 60 0,120 43 0 2 75C
elm 19,0 17,7 16,3 15,9 60 0,170 6 0
3765
Spruce 32,8 32,1 26,1 25,9 60 0,720 339 6 Fir 34,0 33,3 23,5 23,3 60 0,700 27 1
Beech 19,0 17,6 7,8 7,5 60 0,040 23 0 3 75D Sycamor
e 18,0 16,1 15,0 14,5 60 0,11O 9 0
3764
Spruce 43,5 43,3 30,6 30,5 120 1,370 57 0 Fir 48,3 48,2 30,7 30,6 120 2,000 31 0 4 363D
Beech 50,8 50,4 29,8 29,7 120 2,290 34 0 4177
The first three stands of units landscape planners: 662B, 75C, 75D are falling urgency 11 regeneration and includes vegetation aged over 20 years very heavily damaged by biotic and abiotic negative (fire, wind, snow, venison, rezinaj, etc. ) assigned to the highest degree of damage. The stand of u 363D is a stand past the age exploitability technical being included in the urgency of regeneration 21, comprising stands exploitable and past the age of exploitability, attacked by disruptive factors mentioned above, assigned to high levels of injury (usually Levels II and III).
Reducing consistency (density) stand is mainly due doborâturilor produced by wind and snow in 2011 (spread evenly over the entire surface), in stands of units landscape planners: 662B and 75C, where they proposed that ecological reconstruction work through recovery application of progressive cutting attachment, followed by reforestation and care spruce seedlings installed.
The trees in the landscape planner unit 75D was proposed works to be performed, the treatment of clear cutting, followed by reforestation with appropriate species biotope due to lack seedlings installed, as well as its strong Cervidae injury. Spruce specimens assigned mostly class IV quality of shows flaking bark and rot at the base, due to injuries to their big game (deer and bear).
U 363D of the forest ecosystem is a last stand to technical exploitability age, the products have been reported doborături wind and snow mass, clustered on a portion of the 13.59 hectares 1.4 hectares (ha) has subplot (ua) întreagă.Tratamentul stand proposed in this connection is progressive cutting, followed by reforestation work and care of seedlings installed, the current composition as follows: 6FA 2MO 2BR. Succession is a tendency to spruce species at the expense of phage.
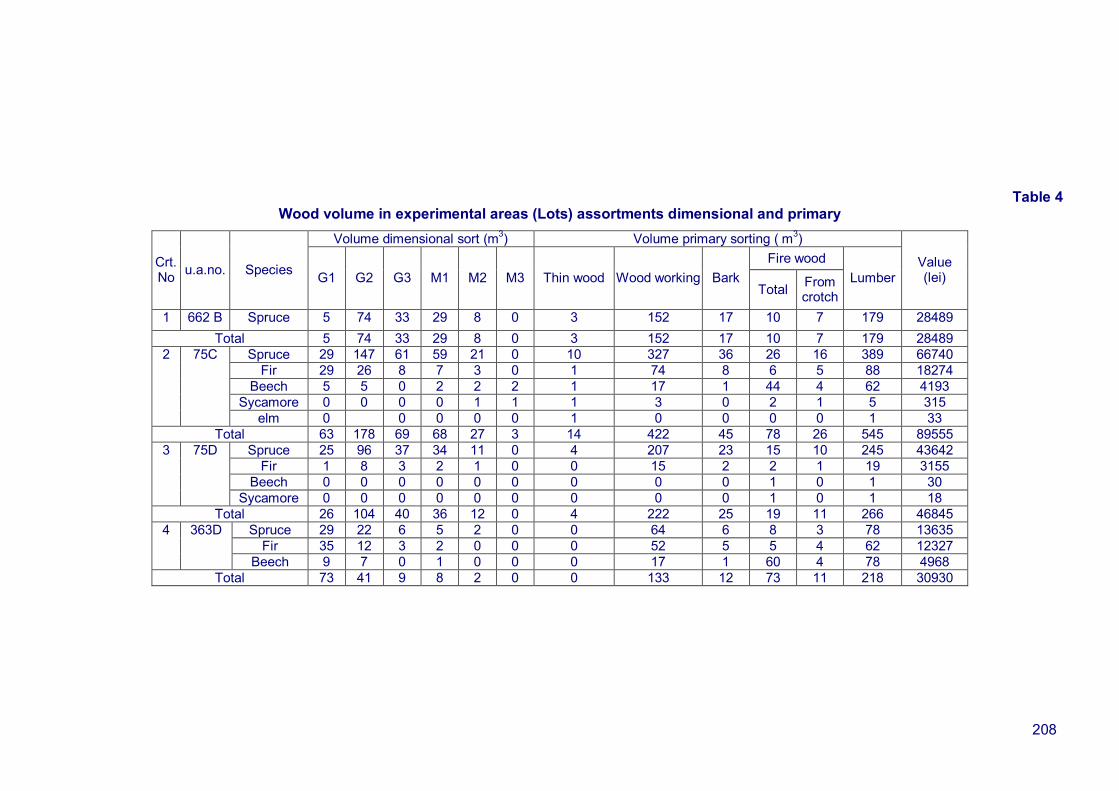
Through data processing calculation program APV was obtained volume of wood per surface experimentalul (match) and the results are quantified in the following table.
208
Table 4 Wood volume in experimental areas (Lots) assortments dimensional and primary
Volume dimensional sort (m3) Volume primary sorting ( m3) Fire wood Crt.
No u.a.no. Species G1 G2 G3 M1 M2 M3 Thin wood Wood working Bark Total From
crotch Lumber
Value (lei)
1 662 B Spruce 5 74 33 29 8 0 3 152 17 10 7 179 28489 Total 5 74 33 29 8 0 3 152 17 10 7 179 28489
Spruce 29 147 61 59 21 0 10 327 36 26 16 389 66740 Fir 29 26 8 7 3 0 1 74 8 6 5 88 18274
Beech 5 5 0 2 2 2 1 17 1 44 4 62 4193 Sycamore 0 0 0 0 1 1 1 3 0 2 1 5 315
2 75C
elm 0 0 0 0 0 1 0 0 0 0 1 33 Total 63 178 69 68 27 3 14 422 45 78 26 545 89555
Spruce 25 96 37 34 11 0 4 207 23 15 10 245 43642 Fir 1 8 3 2 1 0 0 15 2 2 1 19 3155
Beech 0 0 0 0 0 0 0 0 0 1 0 1 30
3 75D
Sycamore 0 0 0 0 0 0 0 0 0 1 0 1 18 Total 26 104 40 36 12 0 4 222 25 19 11 266 46845
Spruce 29 22 6 5 2 0 0 64 6 8 3 78 13635 Fir 35 12 3 2 0 0 0 52 5 5 4 62 12327
4 363D
Beech 9 7 0 1 0 0 0 17 1 60 4 78 4968 Total 73 41 9 8 2 0 0 133 12 73 11 218 30930

209
Knowing the algorithm then were processed data through the calculation APV and outcome data processing - document enhancement for all four surfaces experimental (Lots) in the study will highlight the following table input data to calculate volume each sort.
Altitude, landscape planners are situated between an altitude of 850 meters to 1050 meters 662B, 363D u.a upper limit of altitude.
Afforestation will be done preferably locally sourced saplings in forest nurseries in the area and in compliance with current regulations concerning the election compositions regeneration and planting schemes.
Economic losses are judged in relation to the reference state, ie the age of reference, where the predominant species, spruce, the natural range is technical operability and at the exploitability absolută.Nici outside the natural area is one of the two not exploitability economically justified.
The economic and financial logic, any income that occurs faster than originally planned is welcome, because the present value is higher. If you do not take into account the discount rate losses are only going to increase and they apply an average price of wood.
To stress losses economic and financial over a period of planning (10 years) were taken into account the volume of trees by species, production classes, consistency, at the age of 50 years stands in u.a. 662 B, 75C and 75D, and for u.a. 363D reference age was 110 years.
In these stands was taken from the tables of production volume by species and production classes at the age Current (60 years for the three surfaces experimental remembered and 120 years for surface experimental u 363D) of paper "Biometrics trees and stands in Romania "(1972) and considering that consistency stands remained the original, apart from accidental cutting of products made in the 10 years (which have significantly reduced the consistency to 0.2, 0.3, which has made the stands studied to be classified in one of urgency regeneration). The difference between the amount that would have to exist at the present time (the last cutting) and theoretically estimated initial volume existing 10 years ago, was established periodic current increase in volume. Regular dividing the current increase in the number of years in the period (10 years) gives regular average increase in volume per year. By dividing the periodic average, increase in volume resulting from the stand area average annual growth in volume.
Calculations for the loss of value due to losses increase was made for each surface experimental basis.
U.a. 662B to match the calculations were conducted in the following manner:
- Production of the tables to spruce stand aged 60 years, first-class production, full consistency (1.0) per hectare main production volume is 772 m3 and 50 years, the production volume principal under the same conditions would have to be 671 m3. ;
- The current composition of the stand is 10MB, consistency current stand is 0.2, and 10 years ago consistency in value was 0.8, lots of Arrangement as described above;
- Injuries are concentrated on an area of 1.4 hectares of the unit is 13.59 as landscape planners.
The volume of wood at the age of 50 years shall be calculated with the following formula:
(10) where:
Vsp - is the volume per species that age, participating in stand composition; P - the proportion of participation in species in stand composition; K - consistency (stand density); Spr - stand area.
Applying the formula for this case: VinitialSpo50 = 6710 * 1,0 * 0,8 * 1,4 = 751,52 m3
(For ease of calculation volumes will use rounded values). So, VSpo50 =752m3 and represent total volume spruce stand (initially) the stand at the age of 50 years.
Vestimate Spo60 = 772 * 1,0 * 0,8 * 1,4m3, VSpo60 = 865 m3

210
Estimated volume hypothetical while maintaining consistency of adding 0.8 and periodic increases the age of 60 years studied spruce stand (Vestimate Spo60) is the amount that would be obtained without interfering disturbance (caused by wind and falls snow and injury to the big game, insect attacks etc.).
Periodic current increase in volume (CCP) is obtained by the difference between the volume of spruce stand at the age of 60 years, ie the volume of spruce stand at the age of 50 years as follows:
CCP=VSpo60-VSpo50, (11) CCPSpo = 865-752 =113 m3
By dividing the periodic current to increase in volume at the number of years of time (10 years), to give the average growth regular (Cmp) one year following formula:
(12) where: N - represents the number of years of time.
For this case, Cmp Spo = 113/10 = 11,3m3 / year.
Distinguishing between volume stand of spruce estimated Vestimat Spo60 (865 m3) and the existing form of exploitation VexistingSpo60 the stand (179 m3 APV's) after extraction volume from accidental cuts (cuts unplanned arrangement, which occur due to the interaction of the stand with destabilizing factors) gives a theoretical volume extracted (Vextras) during the 10 years of 686 m3.
Because of cuts accidental products were produced in 2010, 4 years ago drawing this APV (document enhancement), the trees lose just regular average growth in 4 years (11.3 m3 / year * 4 years = 45 m3. the comparison with the game, the losses in volume per hectare is 45 m3 / 1.4ha = 32.14 m3 / ha-1 (m3 / year / ha)
The difference between theoretical extracted volume (Vextras) of stand by accidental cuts and Cmp 4 years, represents the actual volume of goods valued from accidental cuts in 2010.
Knowing the total amount in dollars, the volume of raw wood landscape planners unit (u.a.) 662B and volume harvested under the VPA's show the following values:
28489 lei /179 m3 =159,156 lei/m3 de lemn.
By multiplying the average price of a cubic meter of spruce with losses growing spruce stand during the accidental removal products until the inventory APV's stand and drawing, resulting in a loss of value:
45 m3x 159,156 lei/ m3 de lemn= 7162,02 lei.
Reporting the loss of value in surface area in hectares of experimental results 5115,73 lei/ha a loss of value.
Figure 1 graphically represents -financiare economic losses due to disturbances in u.a. 662 B
Fig.1. Quantifying the loss of value growth spruce species in u.a. 662B
211
In the experimental area U.a. 75C, the trees have the following characteristics:
- stage age is 60;
- stand 3.0 ha area;
- class II production is for all species of brush components;
- the current composition of the stand is 8 spruce, 1 fir, 1 beech
- consistency of the current 0,3, and 0.8 have a value of 10 years ago;
- injuries to biotic and abiotic factors are dispersed all over u.a.
By going through the same algorithm experimental economic area (match) of 75 C u.a. get:
- by applying the formula (10) to spruce species resulting values:
VinitialSpo50 = 536 * 0,8 * 0,8 * 3,0=1029 m3
VestimatSpo60 = 627 * 0,8 * 0,8 * 3,0 =1204 m3
- for fir species have values:
VinitialFir50 =430 * 0,1 * 0,8 * 3,0 = 103 m3
VestimatFir60= 532 * 0,1 * 0,8 * 3,0 m = 128 m3
- for beech species have values:
VinitialBeech50 =335 * 0,1 * 0,8 * 3,0 = 80 m3
VestimatBeech60= 401 * 0,1 * 0,8 * 3,0 m = 96 m3
By applying the formula (11) is obtained:
CCPSpo =1204-1029 =175m3
CCPFir =128-103=25m3
CCPBeech =96-80=16m3
By applying the formula(12) for each species component of u.a 75C is obtained:
CmpSpo =175/10 =17,5m3/an
CmpFir =25/10 =2,5m3/an
CmpBeech =16/10 =1,6m3/an
The difference between the volume of species spruce estimated VestimatSpo60 (1204 m3) and the existing form of exploitation VexistentSpo60 the stand (389 m3 APV's) after subtracting the volume of cuts accidental, results in a theoretical volume extracted (V extracted) in the 10 years 815 m3.
For tree species VestimatFir60 (128 m3) and the existing form of exploitation VexistentFir60 the stand (88 m3 APV's) after extraction volume from accidental cuts, resulting a theoretical volume extracted (Vextras) during the 10 years of 40 m3.
If the species beech VestimatBeech60 (96 m3) and the existing form of exploitation VexistentBeech60 the stand (68 m3 APV's) after extraction volume of cuts accidental, results in a theoretical volume extracted (Vextras) during the 10 years of 28 m3.
The difference between the volume extracted in theory (Vextracted) of stand by accidental cuts and Cmp 3 years for all three species represented in the stand and especially to spruce the main species, represent the real volume valorized cuts accidental products in 2011:
- for Spruce species: 815 - (17,5m3/year * 3 years) = 815 - 53 = 762 m3;
- for Fir species: 128 - (2,5m3/year * 3 years) = 128 – 8 = 120 m3;
- for Beech species: 96 – (1,6m3/year * 3 years) = 96 – 5 = 91m3
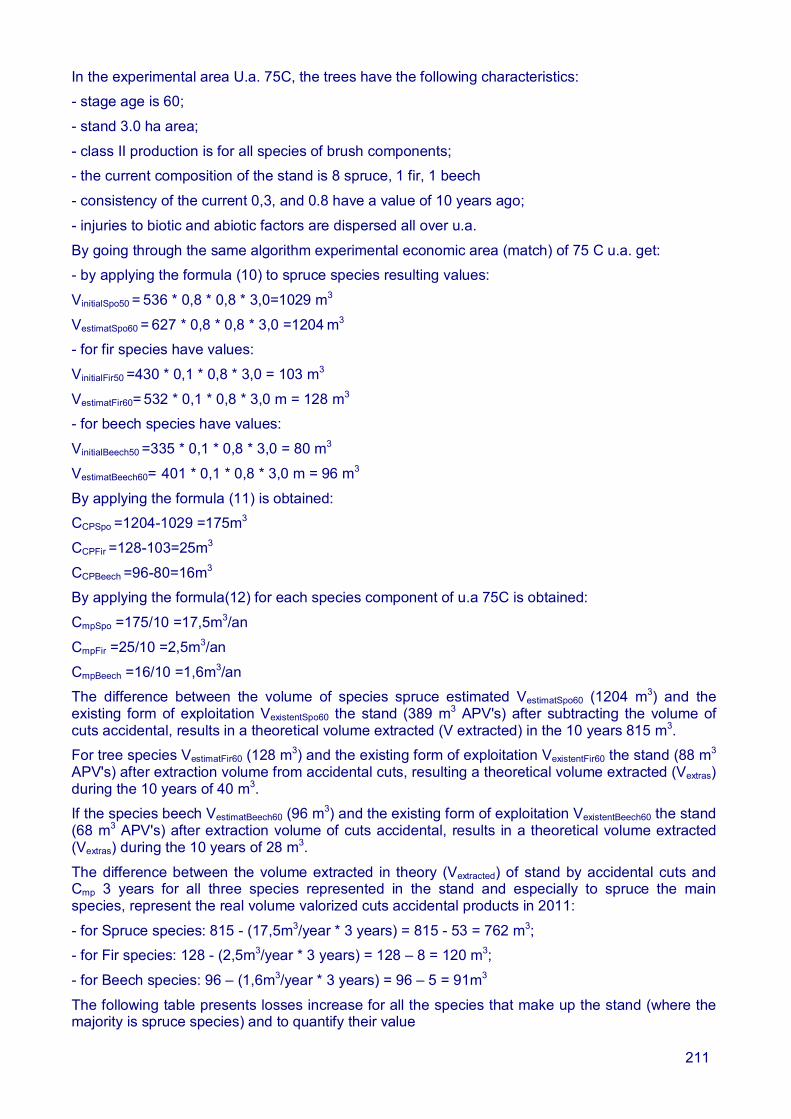
The following table presents losses increase for all the species that make up the stand (where the majority is spruce species) and to quantify their value
212
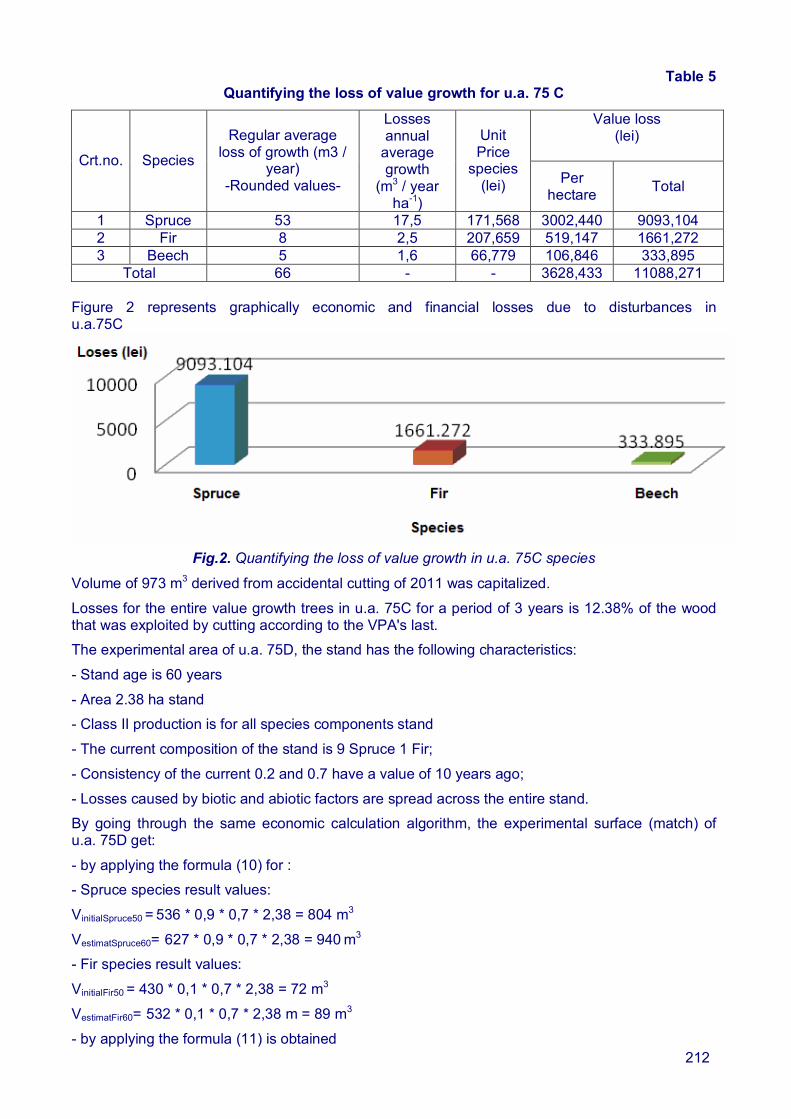
Table 5 Quantifying the loss of value growth for u.a. 75 C
Value loss (lei)
Crt.no. Species
Regular average loss of growth (m3 /
year) -Rounded values-
Losses annual
average growth
(m3 / year ha-1)
Unit Price
species (lei) Per
hectare Total
1 Spruce 53 17,5 171,568 3002,440 9093,104 2 Fir 8 2,5 207,659 519,147 1661,272 3 Beech 5 1,6 66,779 106,846 333,895
Total 66 - - 3628,433 11088,271 Figure 2 represents graphically economic and financial losses due to disturbances in u.a.75C
Fig.2. Quantifying the loss of value growth in u.a. 75C species
Volume of 973 m3 derived from accidental cutting of 2011 was capitalized.
Losses for the entire value growth trees in u.a. 75C for a period of 3 years is 12.38% of the wood that was exploited by cutting according to the VPA's last.
The experimental area of u.a. 75D, the stand has the following characteristics:
- Stand age is 60 years
- Area 2.38 ha stand
- Class II production is for all species components stand
- The current composition of the stand is 9 Spruce 1 Fir;
- Consistency of the current 0.2 and 0.7 have a value of 10 years ago;
- Losses caused by biotic and abiotic factors are spread across the entire stand.
By going through the same economic calculation algorithm, the experimental surface (match) of u.a. 75D get:
- by applying the formula (10) for :
- Spruce species result values:
VinitialSpruce50 = 536 * 0,9 * 0,7 * 2,38 = 804 m3
VestimatSpruce60= 627 * 0,9 * 0,7 * 2,38 = 940 m3
- Fir species result values:
VinitialFir50 = 430 * 0,1 * 0,7 * 2,38 = 72 m3
VestimatFir60= 532 * 0,1 * 0,7 * 2,38 m = 89 m3
- by applying the formula (11) is obtained

213
CCPSpruce = 940 - 804 = 136 m3
CCPFir = 89 - 72 =17 m3
- by applying the formula (12) for each species component of the u.a. 75D is obtineant:
CmpSpruce = 136/10 = 13,6m3/an
Cmp Fir = 17/10 = 1,7m3/an
The difference between the volume of species spruce estimated Vestimated Spruce 60 (940 m3) and the existing form of exploitation VexistingSpruce60 the stand (245m3 according APV's) after extraction volume of cuts accidental, results in a theoretical volume extracted (V extracted) during the 10 years, 695m3.
For species fir VestimatFir60 (89 m3) and the existing form of exploitation VexistingFir60 the stand (19 m3
APV's) after extraction volume from accidental cuts in 2011, it follows a theoretical volume extracted (V extracted) during the 10 years, 70 m3.
The difference between theoretical extracted volume (V extracted) from accidental cuts and stand by Cmp 3 years for the two species represented in the arboretum, especially spruce as main species represents the actual volume of goods valued from accidental cuts in 2011:
- for spruce species: 695 - (13,6m3/year * 3 years) = 695 – 41 = 654 m3 ;
- for fir species: 70 - (1,7m3/year * 3 years) = 70 – 5 = 65 m3 .
For the two 1 m3 of beeach and one m3 of spruce were not calculated loss amount is too small to record losses.
The following table presents losses increase for all the species that make up the stand (where the majority is spruce species) and to quantify their value.
Table 6 Quantifying the loss of value growth for u.a. 75 D
Value loss (lei)
Crt.No. Species
Regular average loss of growth
(m3 / year) Rounded values
Losses annual
average growth
(m3/year ha-
1)
Unit Price
species (lei)
Per hectare Total
1 Spruce 41 5,71 178,130 1017,122 7303,33 2 Fir 5 0,71 166,052 117,897 830,260
Total 46 - - 1135,019 8133,59 Figure 3 graphically represents the economic and financial losses due to disturbances in u.a. 75 D
Fig.3. Quantifying the value of losses in species growth u.a. 75D

214
Volume of 719 m3 derived from accidental cutting of 2011 was capitalized.
Losses for the entire value growth trees in u.a. 75D, for a period of 3 years, representing 17.36% of the wood that was exploited by cutting according to the VPA's last.
The experimental area of u.a. 363D, the trees the following characteristics:
- stand age is 120 years;
- experimental area has 1.0 hectares;
- class production is second all species components of the stand;
- the composition of the current stand is 5 Spruce 3 Fir 2 Beech;
- consistency of the current 0.3, and now 10 years have a value of 0.7;
- losses caused by wind and snow are concentrate to an area of 1.0 hectares of the 2.09 ha as has u.a.
By going through the same algorithm experimental economic area (match) of u.a. 363D get:
- by applying formula (10) for:
- spruce species resulting values:
VinitialSpruce50 = 859 * 0,5 * 0,7 * 1,0 = 301 m3
VestimatingSpruce60 = 877 * 0,5 * 0,7 * 1,0 = 307 m3
- fir species resulting values:
VinitialFir50 = 810 * 0,3 * 0,7 * 1,0 = 170 m3
VestimatingFir60= 833 * 0,3 * 0,7 * 1,0 = 175 m3
- beech species resulting values:
VinitialBeech50 = 625 * 0,2 * 0,7 * 1,0 = 87 m3
Vestimatingbeech60= 652 * 0,2 * 0,7 * 1,0 = 91 m3
- by applying formula (11) is obtained:
CCPSpruce =307 - 301 = 6m3
CCPFir = 175 – 170 = 5m3
CCPBeech =91-87=4m3
- by applying the formula (12) for each species component of u.a. 75C is obtineant:
Cmp Spruce = 6/10 = 0,6m3/year
Cmp Fir = 5/10 = 0,5 m3/year
Cmp Beech =4/10 = 0,4m3/year
The difference between the volume of species spruce estimated VestimatSpruce60 (307 m3) and the existing form of exploitation VexistingSpruce60 the stand (78m3 according APV's) after extraction volume of cuts accidental, results in a theoretical volume extracted (V extracted) during the 10 years of 229 m3.
For species fir VestimateFir60 (175 m3) and the existing form of exploitation VexistingFir60 the stand (62 m3 APV's) after extraction volume of cuts accidental, results in a theoretical volume extracted (V extracted) during the 10 years of 113 m3.
If the species beech VestimateBeech60 (91 m3) and the existing form of exploitation VexistingBeech60 the stand (78 m3 APV's) after extraction volume of cuts accidental, results in a theoretical volume extracted (V extracted) during the 10 years of 13 m3 . The difference between the volume extracted in theory (V extracted) of stand by accidental cuts and Cmp 3 years for all three species represented in the stand and especially to spruce the main species, represent the real volume valorized cuts accidental products in 2011:
- for spruce species: 307 - (0,6m3/year * 3 years) = 307-2 = 762 m3;

215
- for fir species: 175 - (0,5m3/year * 3 years) = 175 – 2 = 173 m3;
- for beech species: 91 – (0,4m3/year * 3years) = 91 – 1 = 90m3.
The following table presents losses increase for all the species that make up the stand (where the majority is spruce species) and to quantify their value
Table 7 Quantifying the loss of value growth for u.a. 363D
Value loss (lei) Crt.No. Species
Regular average loss of growth (m3 / year)
Rounded values
Losses annual average growth
(m3/year ha-1)
Unit Price species
(lei) Per hectare Total 1 Spruce 2 0,6 174,808 104,885 349,616 2 Fir 2 0,5 198,822 99,411 397,644 3 Beech 1 0,4 63,692 25,477 63,692
Total 4 - - 229,773 810,952
Volume of 973 m3 derived from accidental cutting of 2011 was capitalized.
Losses for the entire value growth trees in u.a. 363D for a period of 3 years is 2.62% of the wood that was exploited by cutting according to the VPA's last. This shows that with the aging of stands increases are smaller and losses due to default increases are lower, leading to a stand past the age to be almost nonexistent technical exploitability
Figure 4 represents graphically economic and financial losses due to disturbances in u.a. 363D.
Fig.4. Quantifying the value of losses in species growth u.a. 363D
Volume of 973 m3 derived from accidental cutting of 2011 was capitalized.
Losses for the entire value growth trees in u.a. 363D for a period of 3 years is 2.62% of the wood that was exploited by cutting according to the VPA's last. This shows that with the aging of stands increases are smaller and losses due to default increases are lower, leading to a technical exploitability stand past the age to be almost nonexistent.
8. Interpretation of Results and Final Conclusions
Interference between systems, economic and financial, socio-economic and biological systems has led in most cases to major changes in biological systems (ecosystems), quantified value in economic terms as a loss, ie as a deviation from the structure and productivity normal.
Economic systems in their attempt to reach the maximum of organization and technology, thanks to the laws of entropy, get to interact with biological systems with complex ecological structure and change them sometimes irreversible.
Living biological systems have their own laws of organization and functioning. The emergence of harmful factors, abiotic and biotic, resulting in damage created balance and cause major

216
disruptions, with serious consequences for the economic-financial and social environment that are interrelated with each other.
From the economic point of view everything does not correspond to the normal state of dynamic equilibrium between these triggers are recorded as losses.
Consequently their ecosystems and biodiversity is subject to permanent changes, which affect a lesser or greater extent their stability
Transposed situation where forest systems, increasing losses due to the action of negative factors, such as disruptive high-intensity wind action, snow, leading to disruptions in the chain specific forest systems. Such quantitative and qualitative depreciation timber has negative impact on local financial and social-economic systems in the area. Wood is a commodity that depreciates when under the influence of biotic and abiotic factors disturbing, can not be stored, as if unaffected systems. He must be built as soon as the greater impairment in quality of time, growing economic and environmental losses.
Impaired for forest environmental implications of local direct and indirectly, sometimes difficult or impossible to quantify the value of money. Degradation of forest systems has major impacts on the hydrological system and anti-erosion, leading to flood surrounding areas, but also to climate change because there are no natural balance created in biological systems where there is no disturbance. Once affected forestry systems, sometimes involving very high costs for their restoration that are replenished in a long time. Doborâturile sometimes produced under the combined action of wind and snow are produced precisely stands for superior productivity.
By analyzing the 4 stands under study shows that loss of growth are higher in young trees (commonly appear around the age of 60 years since and increases are more active in this period) and attenuates the stands past the age of exploitability (u.a. 363D).
Considering the forest as an ecosystem, fulfilling both production functions, as well as protection substantiation is based on the concept that biocoenosis and biotope (resort) are inter-linked and interconnected by continuous exchange of matter and energy.
Systems forestry influences evapotranspiration, reduce leakage and a forest ecosystem affected by disturbance no longer can accomplish the optimal role of hydrological, because some precipitation are no longer detained, snow no longer melted slowly and litter is driven by water precipitation, especially if viiturilorilor on slopes and hence appear erosion locally and in downstream areas, bordering appear floods covered with mud fields of culture and clogged reservoirs (in this case the lake from Colibiţa). Trees affected can not counteract the action of strong winds, they are exposed to permanent degradation, until the emergence of mass windfalls.
Loss hard to quantify economic and financial value are influencing climate zone: the ability of the forest to store carbon and produce oxygen to neutralize pollutants, to enrich the air with negative ions, antimicrobial (fitoncide).
Treatments applied studied stands (u.a 662B, 75C and 363D) are the progressive connection because there are natural seedlings already installed, requiring reforestation percentage of the surface u.a. and created new crop care.
Only unit equipped (u.a.) were proposed cuts 75D races followed by immediate reforestation due to a lack of natural seedlings installed. In this manner it is desired to recover the specific environment of the forest as quickly as possible.
Also, losses in such stands are not only the measurable and assessable in terms of economic and financial; they also ecological, much harder, sometimes impossible to quantify in terms of economic and financial, which lead to climate change major effect of the so-called "snowball rolled" in areas affected by distractions and thus adjacent areas downstream.
Biodiversity and ecosystems are also under pressure. The solution now is to invest in innovation to support a green economy - an economy in harmony with the natural environment to minimize possible effect of climate change.

217
As you can see, the greater frequency of disturbances due to negative action of biotic and abiotic factors are recorded resorts productivity upper stands that have been made in research productivity is high (grades I and II production).
As a conclusion, influence negative biotic and abiotic factors accentuated by artificiality more intense forest ecosystems due to the creation of monocultures of spruce in plantations, to the detriment of natural regenerations, more stable the proportion of natural species is much better directed the laws of nature. It stands on further creation of mixed genetic material of local origin, more stable ecologically and economically productive.
Notes “This work was supported by the project “Interdisciplinary excellence in doctoral scientific research in Romania - EXCELLENTIA” co-fundedfromthe European Social Fund through the Development of HumanResources Operational Programme 2007-2013,contract no.POSDRU/187/1.5/S/155425.”
Bibliography 1. Badea, Ov. şi Neagu S.(2007), Starea de sănătate a pădurilor din România la nivelul anului 2006, evaluată
prin reţeaua naţională de sondaje permanente(4x4), Revista Pădurilor nr.5/2007, p.16
2. Dinga, E.(2009), Studii de economie, Contribuţii de analiză logică, epistemiogică şi metodologică, Editura Economică, Bucureşti, p.62
3. Drăgoi ,M.(2000), Economie Forestieră,Editura Economică, p.39
4. Giurgiu,V.(1978), Conservarea pădurilor,Editura Ceres, Bucureşti, p.265
5. Giurgiu,V.(1979), Dendrometrie şi auxologie forestieră,Editura Ceres, Bucureşti,p.174,195
6. Giurgiu,V.,Decei I.,Armăşescu S.,(1972), Biometria arborilor şi arboretelor din România, Editura Ceres, Bucureşti, p.630-640,661
7. Ionescu Al.,Săhleanu,V.,Bîndiu,C.(1989), Protecţia ,mediului înconjurător şi educaţia ecologică, Editura Ceres, Bucureşti, p73, 159
8. Leahu,I.,(1994), Dendrometrie, Editura Didactică şi Pedagogică, Bucureşti, p.269
9. Milescu,I.,(1994), Ecologie Forestieră, Curs, Universitatrea “Ştefan cel Mare”, Suceava, p13
10. Milescu,I., (1997), Istoria Pădurilor. Introducere în silvicultură, Universitatrea “Ştefan cel Mare”, Suceava, p.114,116
11. Vlad,I.,Doniţă,N,şa.(1997), Silvicultură pe baze ecosistemice, Editura Academiei Române, Bucureşti
12. ***, Norme tehnice pentru evaluarea masei lemnoase destinată exploatării(1986), p.53,81,82