Embed Size (px)
Citation preview
Abstract—There has been considerable progress in
computer vision, artificial neural network and pattern
recognition in the last two decades, and there has also much
progress in medical imaging technology in recent years.
Although images in digital form can be processed by basic
image processing techniques, effective use of computer vision
can provide much useful information for diagnosis and
treatment. In this paper we integrate computer vision and
iridology practice for the detection of diabetes. Using iridology
iris image is evaluated by detecting the presence of broken
tissues and change in color pattern. According to iridology the
abnormality in an iris of the human eye represent the
abnormality of the corresponding organ conferred by the iris
chart. In this research we examine pancreas organ which is at
position 01:45 – 02:15 for the right eye and 07:15-7:45 for the
left eye according to Dr. Jensen iris chart. We applied two
methods to reach our conclusion, visual inspection method and
color coding method. The artificial neural network is used for
training and classification purpose. The entire process is
showing a high accuracy detection of abnormality of pancreas
organ which led to diabetes. The final result is compared with
the insulin normality test for verification.
Index Terms—Computer vision, diabetic, feature extraction,
iris, iridodiagnosis.
I. INTRODUCTION
Development of computer technology and services led to
an increased efficiency, highly reliable, fast and accurate
diagnosis and treatment of the most dangerous diseases. Most
of convectional diagnosis methods involve puncturing of
body tissue (skin) to get blood sample for examination.
However there are alternative diagnosis methods presented in
iridology. Iridology, also known as iridodiagnosis, is an
alternative medicine practice in which patterns, colors, and
other characteristics of the iris are examined for information
about a patient's systemic health [1].
The science of iridology is the science of analyzing the
fibers colors and signs in the eye to glean this information
about imbalances in the body, where they are and how severe
they are [1].
The iris is actually part of the nervous system and its
intricate highway of hundreds of thousands of nerve endings
and nerve impulses. The iris is a forward continuation of the
choroid coat [1]. The iris receives its name (iris, irides,-a
rainbow) from its varying color effects. The nerve fibers in
the iris of the eye receive their impulses from the rest of the
body through the optic nerve, optic thalami and spinal cord
[1].
Manuscript received June 12, 2014; revised January 9, 2015.
The authors are with Tianjin University, Tianjin, China (e-mail:
Iridology can be integrated with finest technology such as
computer vision for an accurate identification of abnormality
in different organs of a human body. The computer vision is
the contemporary technology which involves transformation
of data from a still or video camera into either a decision or a
new representation for the purpose of achieving some
particular goal [2]. One of the most prominent application
field of computer vision is medical imaging. This area is
characterized by the extraction of information from image
data for the purpose of making a medical diagnosis of a
patient.
In this research, Computer vision is linked with iridology
to examine patient's iris for tissue change, as well as features
such as specific pigment patterns and predict diabetes status
of a patient. With computer vision, a change in color pattern
or presence of broken tissue in the iris of the eye will be
examined and analyzed by image processing techniques to
diagnose diabetes.
II. RELATED WORK
Previously detecting diseases (diagnosis) using iridology
principles were done manually, this led to get an entirely
negative results and raised the claim that iridology is not a
useful diagnostic tool. For example in 1979 Dr. Bernard
Jensen, a leading American iridologist and two other
iridology proponents failed to establish the basis of their
practice when they examined photographs of the eyes of 143
patients in an attempt to determine which ones had kidney
impairments. Of the patients, forty-eight had been diagnosed
with kidney disease, and the rest had normal kidney function.
Based on their analysis of the patient's irises, the three
iridologists could not detect which patients had kidney
disease and which did not [1], [3].
This is one of the prevalent challenges facing iridology, the
reason for such mistake can only be explain by imperfect of
the human eye in observation as some iris features such as
broken tissues and color pattern cannot be easily observed by
a naked human eye. However these challenges can be
minimized by applying computer vision technology
implanted with specific algorithm for examining abnormality
of the tissues in the iris.
Computer can extract deep inside features of each pixel of
the iris image using image processing techniques such as
image quality assessment, segmentation of iris, iris
normalization, feature extraction and classification for
clinical diagnosis and suggest the result with a lot higher
accuracy.
The study of iridology to detect abnormality of human
organs by examining iris was much improved after the
inversion of computer technology which increased the
An Automated Tool for Non-contact, Real Time Early
Detection of Diabetes by Computer Vision
Jamal Firmat Banzi, Member, SCIEI and Zhaojun Xue
International Journal of Machine Learning and Computing, Vol. 5, No. 3, June 2015
225DOI: 10.7763/IJMLC.2015.V5.511
accuracy of diagnosis. For example Ma and Li (2008)
suggested texture feature extraction and classification for iris
diagnosis. They proposed an iridology model that consists of
the iris image pre-processing, texture feature analysis and
disease classification. Their experimental result shows that
the proposed iridology diagnosis model is quite effective and
promising for medical diagnosis and health surveillance for
both hospital and public use [3].
However and unlike the conventional method for
diagnosing diabetes which are not real time and which seems
to be inconvenient and discomfort to many people as it
involve fasting, puncturing of the body tissue (skin) to get
blood sample and which may in a way cause problems like
swelling or hardness under the skin, severe pain and
sometimes fever and other possible complications [4]. The
proposed tool for diabetes diagnosis is non-contact, real time,
portable and more convenient as it does not involve skin
puncturing and it can be used both in the hospital and at home
for self-diagnosis.
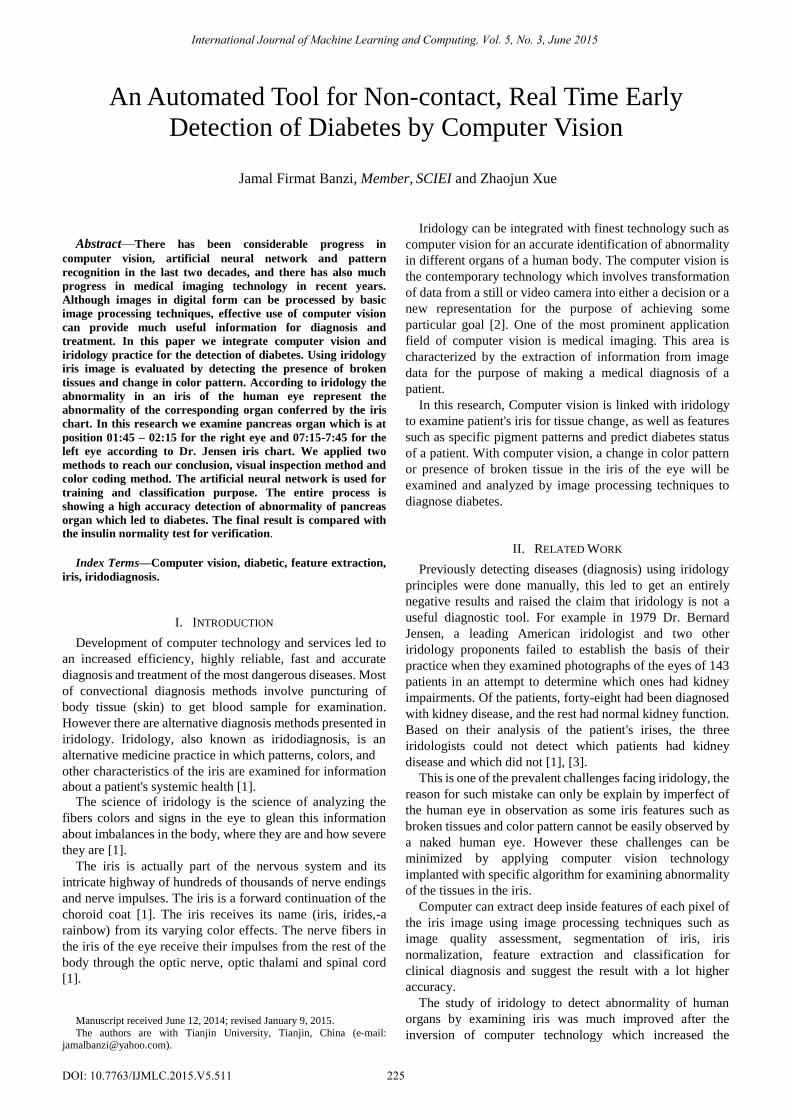
III. PROPOSED APPROACH
The main purpose of this research is to apply computer
vision technology in medical imaging and subsequently
design a diabetes diagnostic tool which is real time and
non-contact and therefore more convenient in diagnosing
diabetes. The designed tool transform an image of the iris of
the eye into new representation using image processing
algorithms and analyses some changes in pattern such as
color pattern and broken tissues in the region of iris
corresponding to pancreas organ according to iris chart and
make a diagnosis whether a patient has diabetes or not. The
block diagram for iris image processing algorithm is shown
in the Fig. 1 below. We divided the algorithm into three
stages which are;
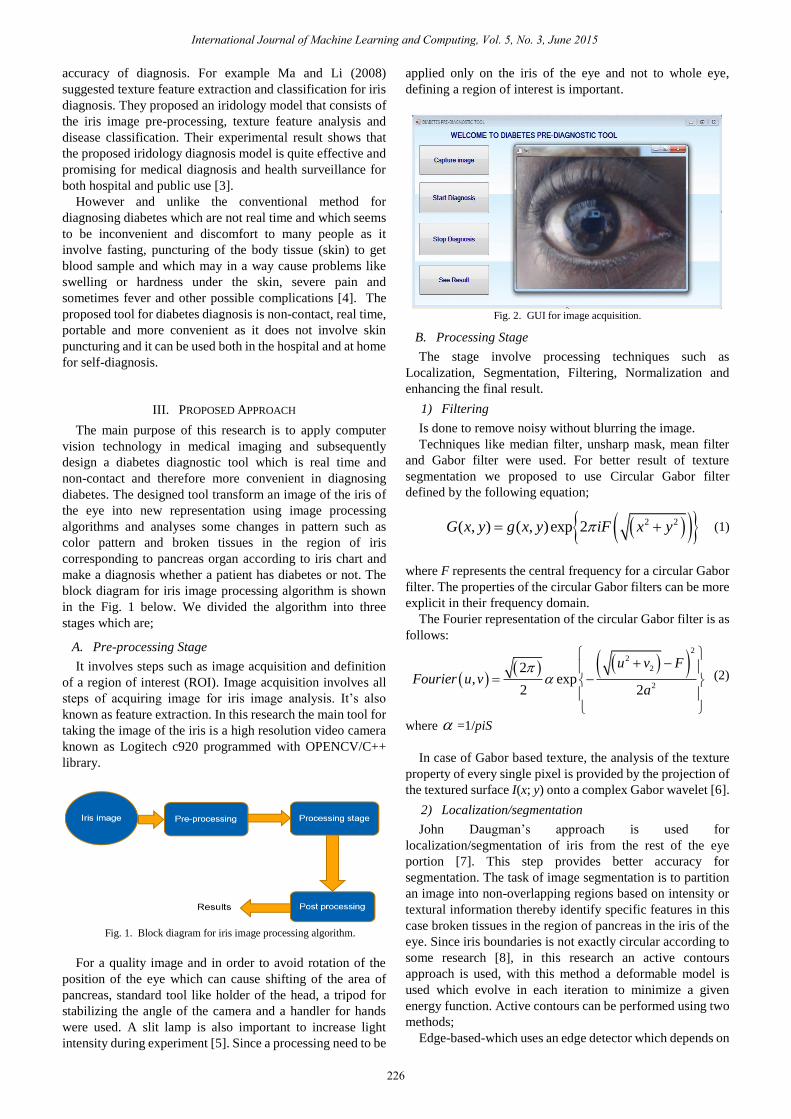
A. Pre-processing Stage
It involves steps such as image acquisition and definition
of a region of interest (ROI). Image acquisition involves all
steps of acquiring image for iris image analysis. It’s also
known as feature extraction. In this research the main tool for
taking the image of the iris is a high resolution video camera
known as Logitech c920 programmed with OPENCV/C++
library.
Fig. 1. Block diagram for iris image processing algorithm.
For a quality image and in order to avoid rotation of the
position of the eye which can cause shifting of the area of
pancreas, standard tool like holder of the head, a tripod for
stabilizing the angle of the camera and a handler for hands
were used. A slit lamp is also important to increase light
intensity during experiment [5]. Since a processing need to be
applied only on the iris of the eye and not to whole eye,
defining a region of interest is important.
Fig. 2. GUI for image acquisition.
B. Processing Stage
The stage involve processing techniques such as
Localization, Segmentation, Filtering, Normalization and
enhancing the final result.
1) Filtering
Is done to remove noisy without blurring the image.
Techniques like median filter, unsharp mask, mean filter
and Gabor filter were used. For better result of texture
segmentation we proposed to use Circular Gabor filter
defined by the following equation;
2 2( , ) ( , )exp 2G x y g x y iF x y (1)
where F represents the central frequency for a circular Gabor
filter. The properties of the circular Gabor filters can be more
explicit in their frequency domain.
The Fourier representation of the circular Gabor filter is as
follows:
22
2
2
2, exp
2 2
u v FFourier u v
a
(2)
where =1/piS
In case of Gabor based texture, the analysis of the texture
property of every single pixel is provided by the projection of
the textured surface I(x; y) onto a complex Gabor wavelet [6].
2) Localization/segmentation
John Daugman’s approach is used for
localization/segmentation of iris from the rest of the eye
portion [7]. This step provides better accuracy for
segmentation. The task of image segmentation is to partition
an image into non-overlapping regions based on intensity or
textural information thereby identify specific features in this
case broken tissues in the region of pancreas in the iris of the
eye. Since iris boundaries is not exactly circular according to
some research [8], in this research an active contours
approach is used, with this method a deformable model is
used which evolve in each iteration to minimize a given
energy function. Active contours can be performed using two
methods;
Edge-based-which uses an edge detector which depends on
International Journal of Machine Learning and Computing, Vol. 5, No. 3, June 2015
226
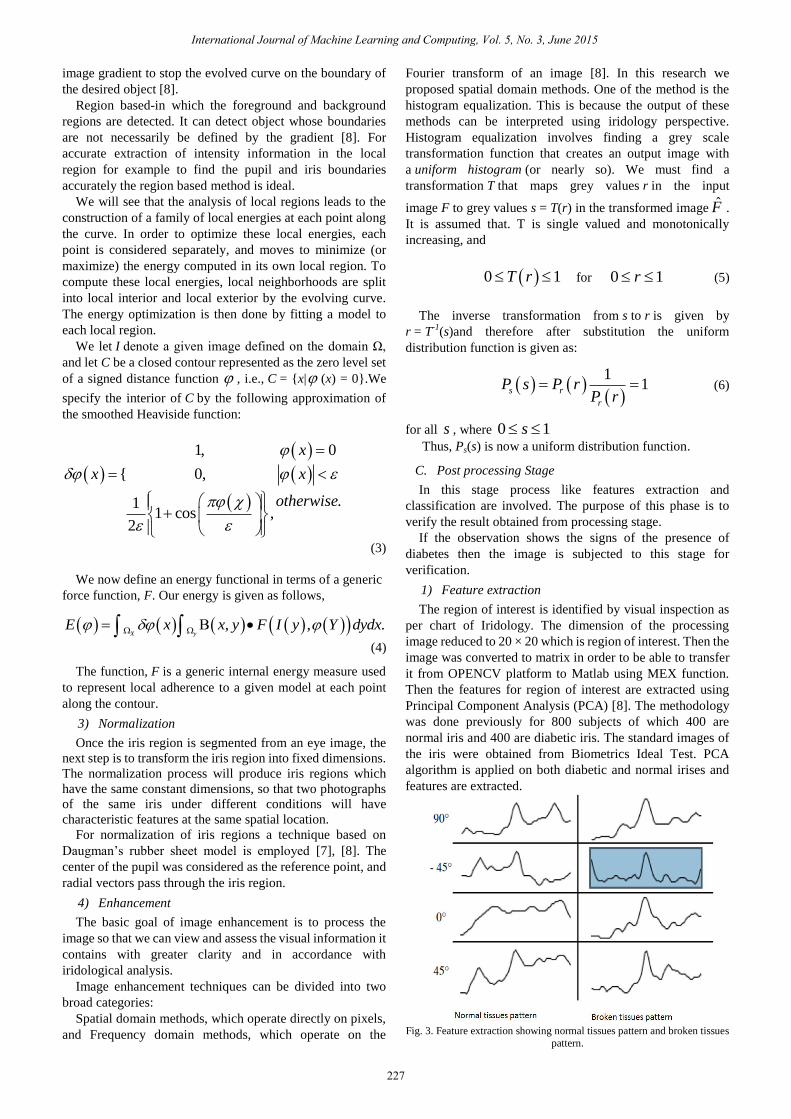
image gradient to stop the evolved curve on the boundary of
the desired object [8].
Region based-in which the foreground and background
regions are detected. It can detect object whose boundaries
are not necessarily be defined by the gradient [8]. For
accurate extraction of intensity information in the local
region for example to find the pupil and iris boundaries
accurately the region based method is ideal.
We will see that the analysis of local regions leads to the
construction of a family of local energies at each point along
the curve. In order to optimize these local energies, each
point is considered separately, and moves to minimize (or
maximize) the energy computed in its own local region. To
compute these local energies, local neighborhoods are split
into local interior and local exterior by the evolving curve.
The energy optimization is then done by fitting a model to
each local region.
We let I denote a given image defined on the domain Ω,
and let C be a closed contour represented as the zero level set
of a signed distance function , i.e., C = {x| (x) = 0}.We
specify the interior of C by the following approximation of
the smoothed Heaviside function:
1, 0
{ 0,
.11 cos ,
2
x
x x
otherwise
(3)
We now define an energy functional in terms of a generic
force function, F. Our energy is given as follows,
, , .X y
E x x y F I y Y dydx (4)
The function, F is a generic internal energy measure used
to represent local adherence to a given model at each point
along the contour.
3) Normalization
Once the iris region is segmented from an eye image, the
next step is to transform the iris region into fixed dimensions.
The normalization process will produce iris regions which
have the same constant dimensions, so that two photographs
of the same iris under different conditions will have
characteristic features at the same spatial location.
For normalization of iris regions a technique based on
Daugman’s rubber sheet model is employed [7], [8]. The
center of the pupil was considered as the reference point, and
radial vectors pass through the iris region.
4) Enhancement
The basic goal of image enhancement is to process the
image so that we can view and assess the visual information it
contains with greater clarity and in accordance with
iridological analysis.
Image enhancement techniques can be divided into two
broad categories:
Spatial domain methods, which operate directly on pixels,
and Frequency domain methods, which operate on the
Fourier transform of an image [8]. In this research we
proposed spatial domain methods. One of the method is the
histogram equalization. This is because the output of these
methods can be interpreted using iridology perspective. Histogram equalization involves finding a grey scale
transformation function that creates an output image with
a uniform histogram (or nearly so). We must find a
transformation T that maps grey values r in the input
image F to grey values s = T(r) in the transformed image F̂ .
It is assumed that. T is single valued and monotonically
increasing, and
0 1T r for 0 1r (5)
The inverse transformation from s to r is given by
r = T-1
(s)and therefore after substitution the uniform
distribution function is given as:
1
1s r
r
P s P rP r
(6)
for all s , where 0 1s
Thus, Ps(s) is now a uniform distribution function.
C. Post processing Stage
In this stage process like features extraction and
classification are involved. The purpose of this phase is to
verify the result obtained from processing stage.
If the observation shows the signs of the presence of
diabetes then the image is subjected to this stage for
verification.
1) Feature extraction
The region of interest is identified by visual inspection as
per chart of Iridology. The dimension of the processing
image reduced to 20 × 20 which is region of interest. Then the
image was converted to matrix in order to be able to transfer
it from OPENCV platform to Matlab using MEX function.
Then the features for region of interest are extracted using
Principal Component Analysis (PCA) [8]. The methodology
was done previously for 800 subjects of which 400 are
normal iris and 400 are diabetic iris. The standard images of
the iris were obtained from Biometrics Ideal Test. PCA
algorithm is applied on both diabetic and normal irises and
features are extracted.
Fig. 3. Feature extraction showing normal tissues pattern and broken tissues
pattern.
International Journal of Machine Learning and Computing, Vol. 5, No. 3, June 2015
227
2) Classification
For classification purpose Artificial Neural Network is
used because they have a unique set of characteristics [9].
They are not programmed, instead they are trained by
being repeatedly shown large numbers of examples for the
problem under consideration [9].
As a result of this, they can provide good results in
relatively short timescale. Fig. 3 shows feature classification
using Artificial Neural Network.
The Network used for classification is feed forward back
propagation and the training function that updates the weight
and bias of the network is Levenberg-Marquardt back
propagation [8], [9]. The initial values and different
parameters like Maximum number of epochs, Performance
goal and learning rate are defined by training algorithm used.
Inputs for the network are features extracted from PCA and
they are trained to classify among normal or diabetic subject.
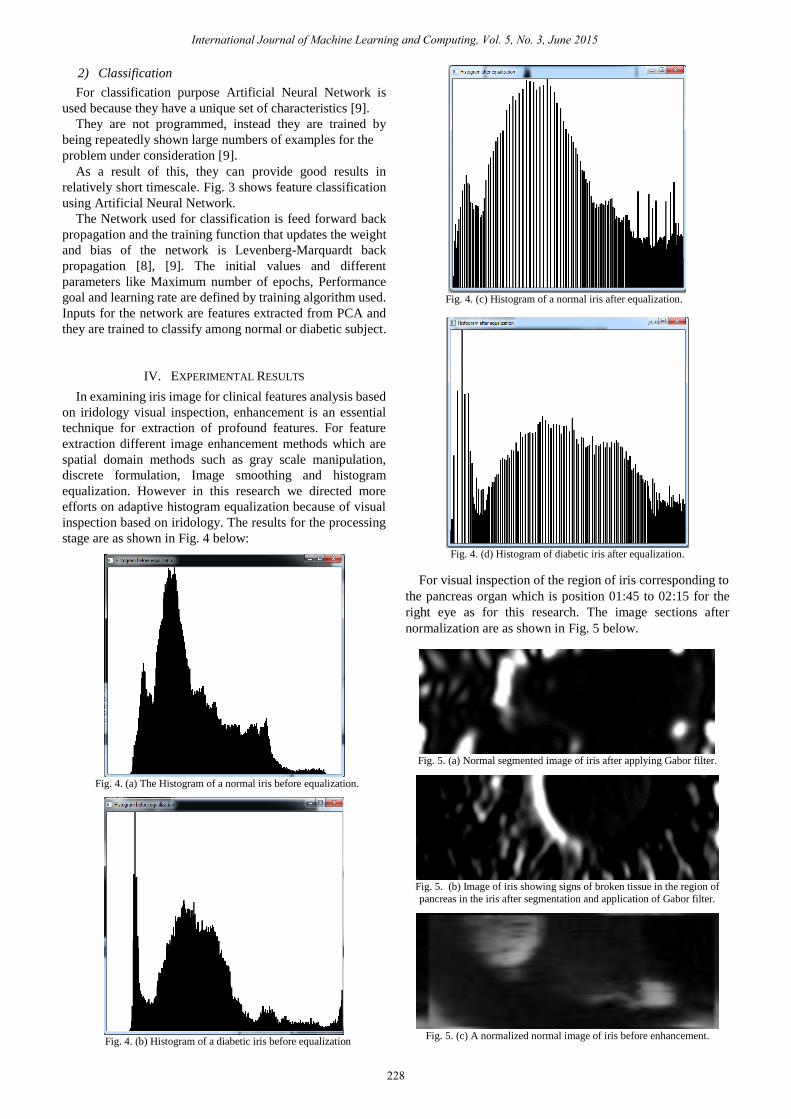
IV. EXPERIMENTAL RESULTS
In examining iris image for clinical features analysis based
on iridology visual inspection, enhancement is an essential
technique for extraction of profound features. For feature
extraction different image enhancement methods which are
spatial domain methods such as gray scale manipulation,
discrete formulation, Image smoothing and histogram
equalization. However in this research we directed more
efforts on adaptive histogram equalization because of visual
inspection based on iridology. The results for the processing
stage are as shown in Fig. 4 below:
Fig. 4. (a) The Histogram of a normal iris before equalization.
Fig. 4. (b) Histogram of a diabetic iris before equalization
Fig. 4. (c) Histogram of a normal iris after equalization.
Fig. 4. (d) Histogram of diabetic iris after equalization.
For visual inspection of the region of iris corresponding to
the pancreas organ which is position 01:45 to 02:15 for the
right eye as for this research. The image sections after
normalization are as shown in Fig. 5 below.
Fig. 5. (a) Normal segmented image of iris after applying Gabor filter.
Fig. 5. (b) Image of iris showing signs of broken tissue in the region of
pancreas in the iris after segmentation and application of Gabor filter.
Fig. 5. (c) A normalized normal image of iris before enhancement.
International Journal of Machine Learning and Computing, Vol. 5, No. 3, June 2015
228
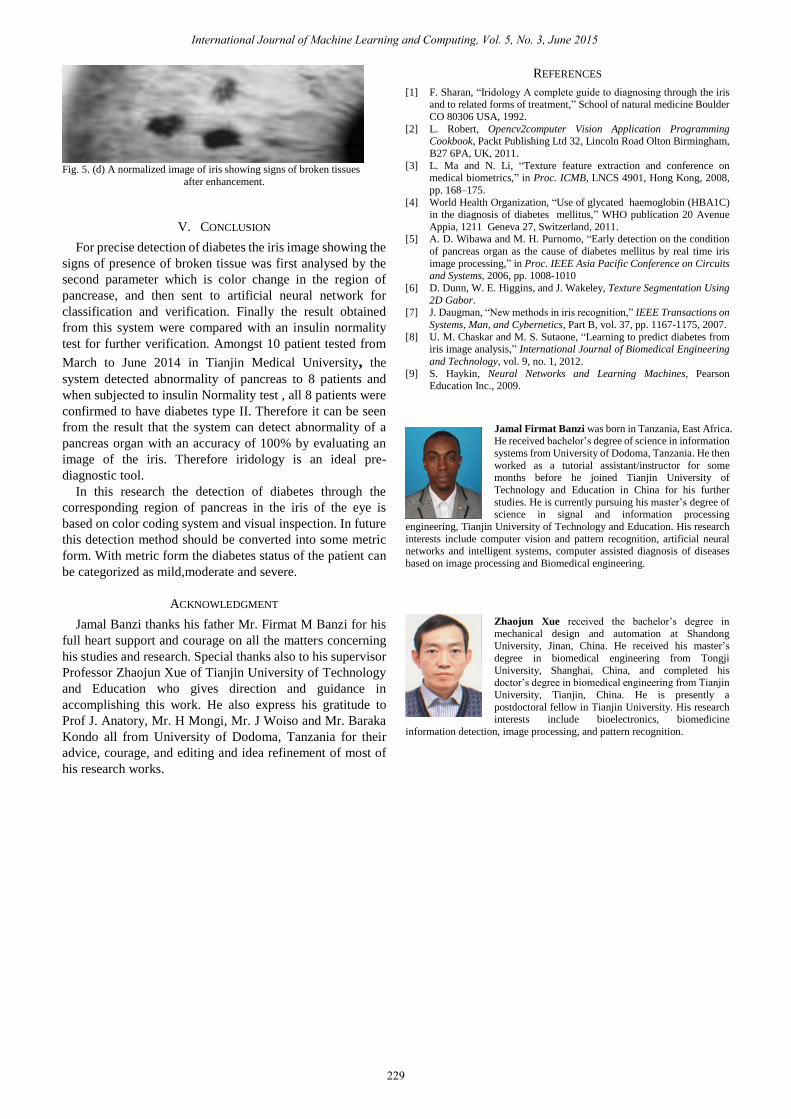
Fig. 5. (d) A normalized image of iris showing signs of broken tissues
after enhancement.
V. CONCLUSION
For precise detection of diabetes the iris image showing the
signs of presence of broken tissue was first analysed by the
second parameter which is color change in the region of
pancrease, and then sent to artificial neural network for
classification and verification. Finally the result obtained
from this system were compared with an insulin normality
test for further verification. Amongst 10 patient tested from
March to June 2014 in Tianjin Medical University, the
system detected abnormality of pancreas to 8 patients and
when subjected to insulin Normality test , all 8 patients were
confirmed to have diabetes type II. Therefore it can be seen
from the result that the system can detect abnormality of a
pancreas organ with an accuracy of 100% by evaluating an
image of the iris. Therefore iridology is an ideal pre-
diagnostic tool.
In this research the detection of diabetes through the
corresponding region of pancreas in the iris of the eye is
based on color coding system and visual inspection. In future
this detection method should be converted into some metric
form. With metric form the diabetes status of the patient can
be categorized as mild,moderate and severe.
ACKNOWLEDGMENT
Jamal Banzi thanks his father Mr. Firmat M Banzi for his
full heart support and courage on all the matters concerning
his studies and research. Special thanks also to his supervisor
Professor Zhaojun Xue of Tianjin University of Technology
and Education who gives direction and guidance in
accomplishing this work. He also express his gratitude to
Prof J. Anatory, Mr. H Mongi, Mr. J Woiso and Mr. Baraka
Kondo all from University of Dodoma, Tanzania for their
advice, courage, and editing and idea refinement of most of
his research works.
REFERENCES
[1] F. Sharan, “Iridology A complete guide to diagnosing through the iris and to related forms of treatment,” School of natural medicine Boulder
CO 80306 USA, 1992.
[2] L. Robert, Opencv2computer Vision Application Programming Cookbook, Packt Publishing Ltd 32, Lincoln Road Olton Birmingham,
B27 6PA, UK, 2011.
[3] L. Ma and N. Li, “Texture feature extraction and conference on medical biometrics,” in Proc. ICMB, LNCS 4901, Hong Kong, 2008,
pp. 168–175.
[4] World Health Organization, “Use of glycated haemoglobin (HBA1C) in the diagnosis of diabetes mellitus,” WHO publication 20 Avenue
Appia, 1211 Geneva 27, Switzerland, 2011. [5] A. D. Wibawa and M. H. Purnomo, “Early detection on the condition
of pancreas organ as the cause of diabetes mellitus by real time iris
image processing,” in Proc. IEEE Asia Pacific Conference on Circuits and Systems, 2006, pp. 1008-1010
[6] D. Dunn, W. E. Higgins, and J. Wakeley, Texture Segmentation Using
2D Gabor. [7] J. Daugman, “New methods in iris recognition,” IEEE Transactions on
Systems, Man, and Cybernetics, Part B, vol. 37, pp. 1167-1175, 2007.
[8] U. M. Chaskar and M. S. Sutaone, “Learning to predict diabetes from
iris image analysis,” International Journal of Biomedical Engineering
and Technology, vol. 9, no. 1, 2012.
[9] S. Haykin, Neural Networks and Learning Machines, Pearson Education Inc., 2009.
Jamal Firmat Banzi was born in Tanzania, East Africa. He received bachelor’s degree of science in information
systems from University of Dodoma, Tanzania. He then
worked as a tutorial assistant/instructor for some months before he joined Tianjin University of
Technology and Education in China for his further
studies. He is currently pursuing his master’s degree of science in signal and information processing
engineering, Tianjin University of Technology and Education. His research
interests include computer vision and pattern recognition, artificial neural networks and intelligent systems, computer assisted diagnosis of diseases
based on image processing and Biomedical engineering.
Zhaojun Xue received the bachelor’s degree in
mechanical design and automation at Shandong University, Jinan, China. He received his master’s
degree in biomedical engineering from Tongji
University, Shanghai, China, and completed his doctor’s degree in biomedical engineering from Tianjin
University, Tianjin, China. He is presently a
postdoctoral fellow in Tianjin University. His research interests include bioelectronics, biomedicine
information detection, image processing, and pattern recognition.
International Journal of Machine Learning and Computing, Vol. 5, No. 3, June 2015
229